Embed Size (px)
DESCRIPTION
Conference German-Italian Cooperation for the Development of Renewable Energies in the Mediterranean DESERTEC EU-MENA Cooperation for Clean Energies from Deserts. Gerhard Knies The Club of Rome and TREC, Trans-Mediterranean Renewable Energy Cooperation [email protected]. - PowerPoint PPT Presentation
Citation preview
CONFERENCEGERMAN-ITALIAN COOPERATION FOR THE
DEVELOPMENT OF RENEWABLE ENERGIES IN THE
MEDITERRANEAN
DESERTEC EU-MENA Cooperation for Clean Energies from
DesertsGerhard Knies
The Club of Rome and TREC, Trans-Mediterranean Renewable Energy Cooperation
1Gerhard Knies, Berlin 2007-11-19
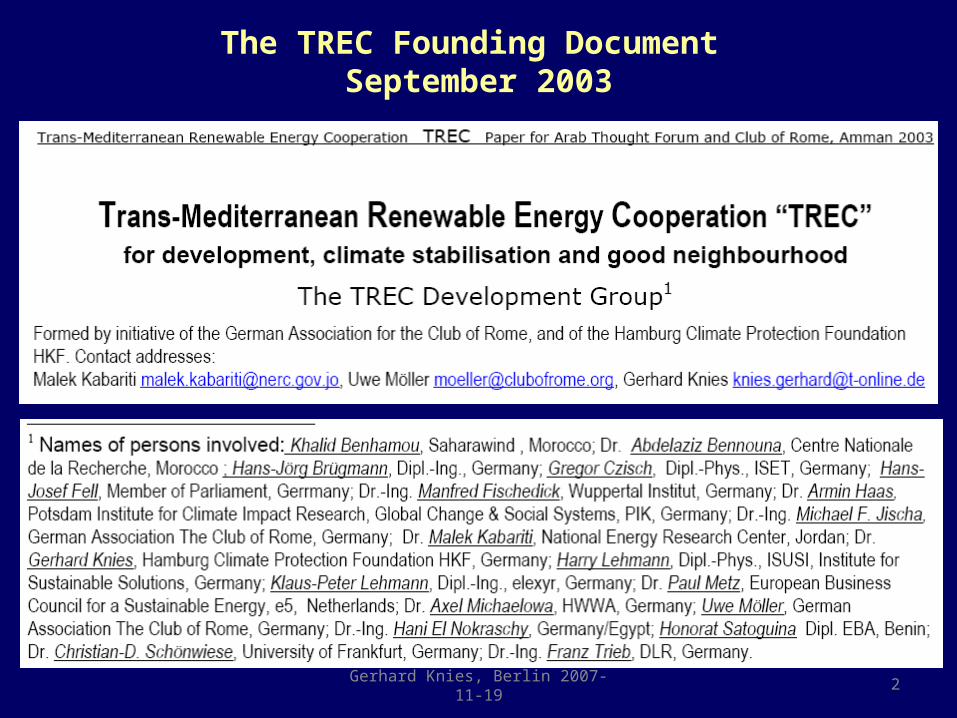
The TREC Founding Document September 2003
Gerhard Knies, Berlin 2007-11-19 2
Gerhard Knies, Berlin 2007-11-19 3
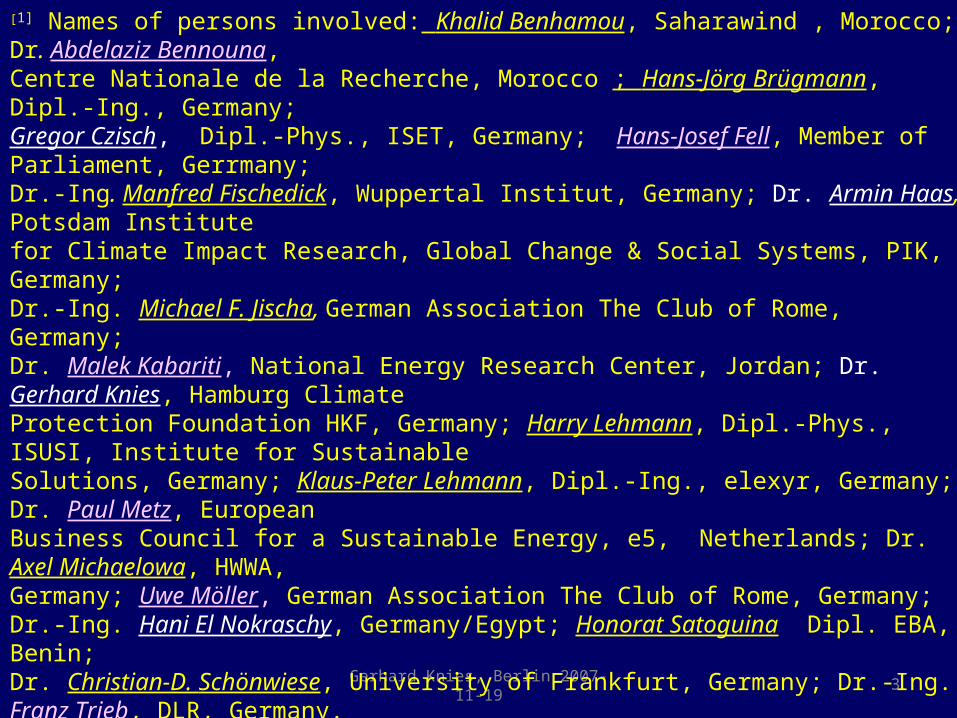
[1] Names of persons involved: Khalid Benhamou, Saharawind , Morocco; Dr. Abdelaziz Bennouna, Centre Nationale de la Recherche, Morocco ; Hans-Jörg Brügmann, Dipl.-Ing., Germany; Gregor Czisch, Dipl.-Phys., ISET, Germany; Hans-Josef Fell, Member of Parliament, Gerrmany; Dr.-Ing. Manfred Fischedick, Wuppertal Institut, Germany; Dr. Armin Haas, Potsdam Institute for Climate Impact Research, Global Change & Social Systems, PIK, Germany; Dr.-Ing. Michael F. Jischa, German Association The Club of Rome, Germany; Dr. Malek Kabariti, National Energy Research Center, Jordan; Dr. Gerhard Knies, Hamburg Climate Protection Foundation HKF, Germany; Harry Lehmann, Dipl.-Phys., ISUSI, Institute for Sustainable Solutions, Germany; Klaus-Peter Lehmann, Dipl.-Ing., elexyr, Germany; Dr. Paul Metz, European Business Council for a Sustainable Energy, e5, Netherlands; Dr. Axel Michaelowa, HWWA, Germany; Uwe Möller, German Association The Club of Rome, Germany; Dr.-Ing. Hani El Nokraschy, Germany/Egypt; Honorat Satoguina Dipl. EBA, Benin; Dr. Christian-D. Schönwiese, University of Frankfurt, Germany; Dr.-Ing. Franz Trieb, DLR, Germany.
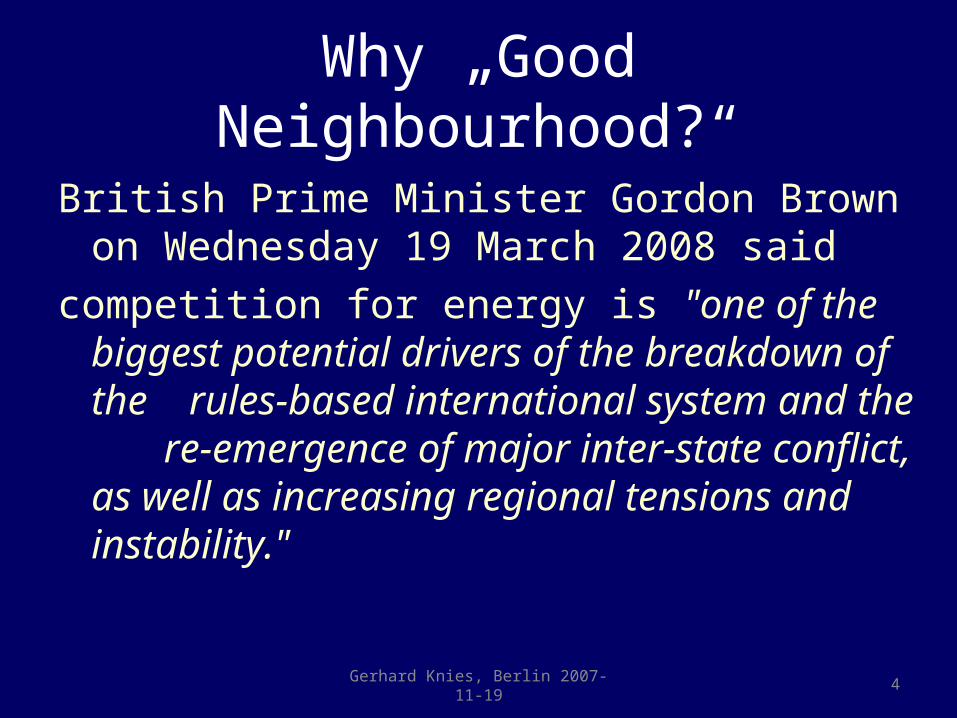
Why „Good Neighbourhood?“
British Prime Minister Gordon Brown on Wednesday 19 March 2008 said
competition for energy is "one of the biggest potential drivers of the breakdown of the rules-based international system and the re-emergence of major inter-state conflict, as well as increasing regional tensions and instability."
Gerhard Knies, Berlin 2007-11-19 4

Gerhard Knies, Berlin 2007-11-19 6

TRANS-CSPTRANS-CSP
3 “CSP” studies
Mediterranean PotentialsTrans-Mediterranean Interconnection
Sea Water Desalination -www.desertec.org-
7Gerhard Knies, Taipei e-parl. + WFC 2008-03-1/2
MED-CSPMED-CSP AQUA-CSPAQUA-CSP
Final Reports (2005,2006, 2007)by
German Aerospace Center (DLR)Institute of Technical Thermodynamics
Section Systems Analysis and Technology Assessment
Studies commissioned byFederal Ministry for the Environment,
Nature Conservation and Nuclear SafetyGermany
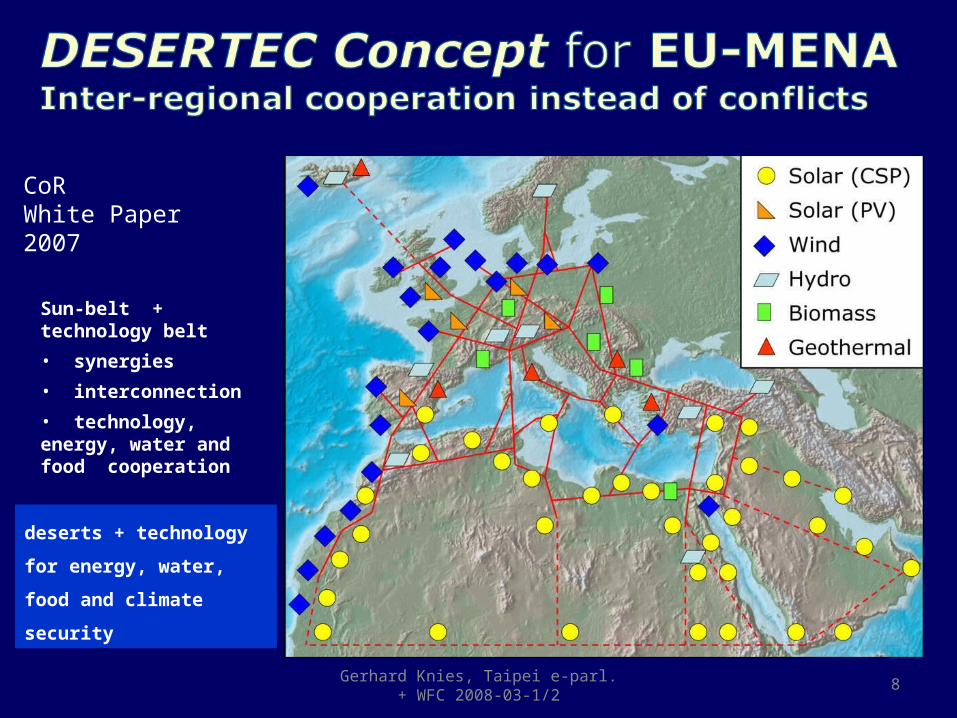
deserts + technology
for energy, water,
food and climate
security
Sun-belt + technology belt
• synergies
• interconnection
• technology, energy, water and food cooperation
8Gerhard Knies, Taipei e-parl. + WFC 2008-03-1/2
CoR White Paper 2007
Gerhard Knies, CSP 2008 Barcelona
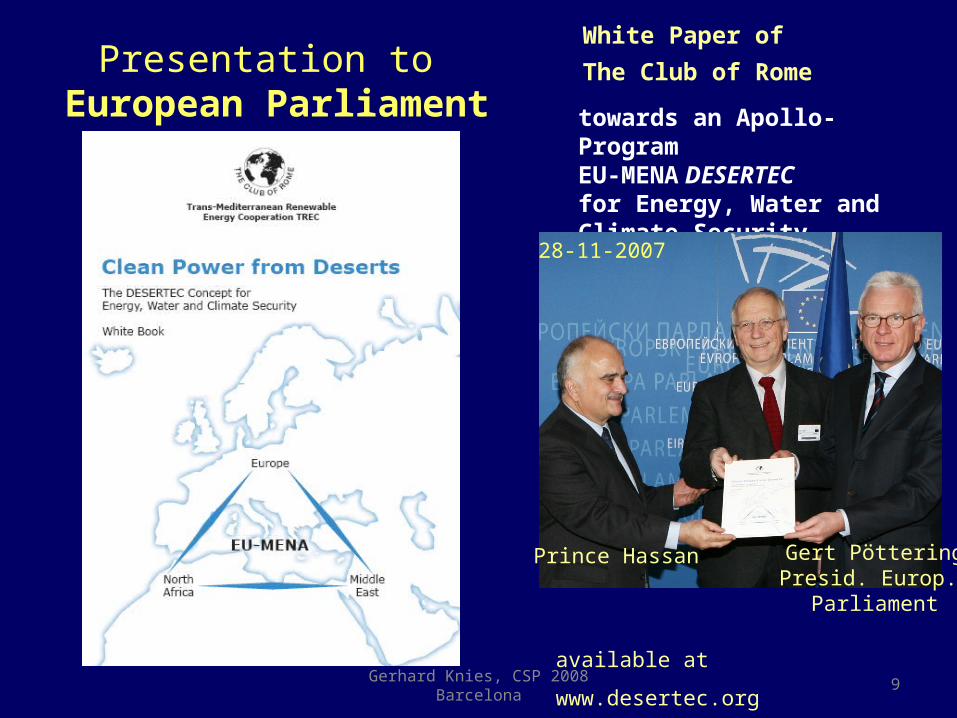
White Paper of
The Club of Rome
towards an Apollo-Program EU-MENA DESERTEC for Energy, Water and Climate Security
available at www.desertec.org9
Prince Hassan Gert PötteringPresid. Europ.
Parliament
Presentation to European Parliament
28-11-2007

Studies on potentials of renewable energies in EU-MENAInitiated by TREC, performed by DLR, financed by German gov’t, www.desertec.org
Biomass
Wind Energy
Geothermal Energy
Hydropower
(Typical Yield in GWhel/km²/y)
1700+ off
shore
1090
750
890
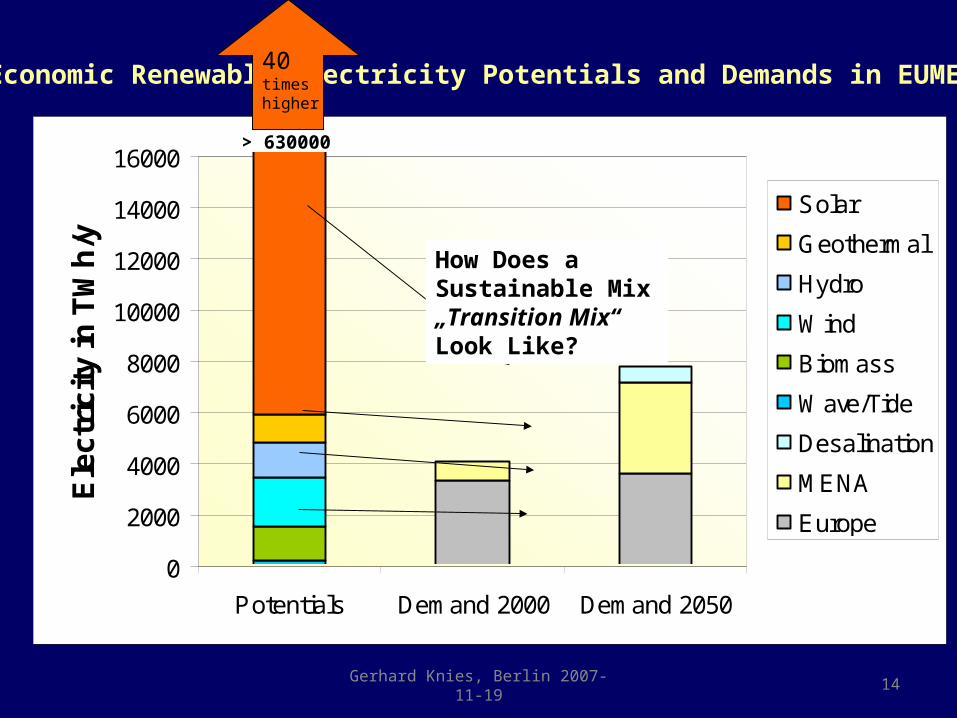
> 600 000
demand 7 500 TWh/y EU+MENA 2050 50 000 TWh/y world-wide 2050
Economic Potential TWhel/y.
(1)
(50)
(50)
Solar - CSP, PV
(1)
(250)
10Gerhard Knies, Taipei e-parl. + WFC 2008-03-1/2
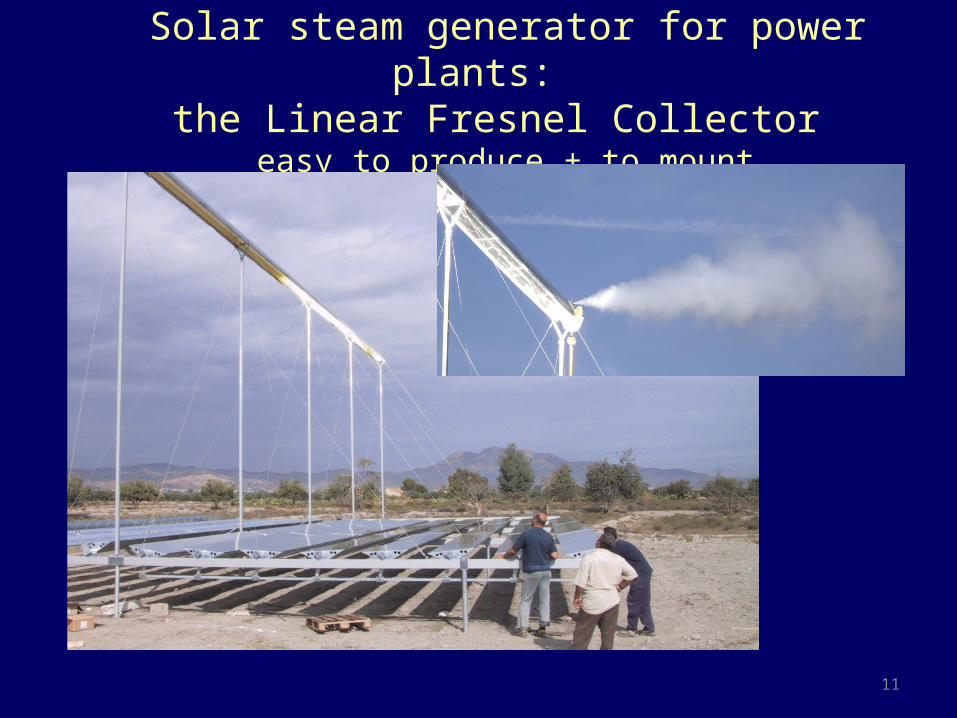
Solar steam generator for power plants: the Linear Fresnel Collector
easy to produce + to mount
11
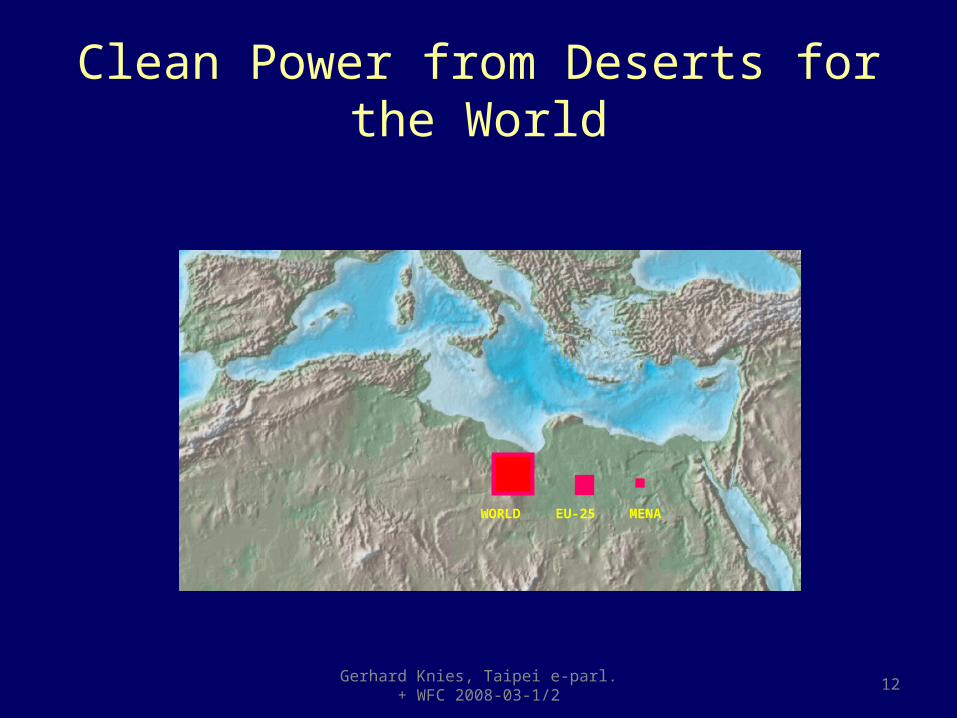
Clean Power from Deserts for the World
Gerhard Knies, Taipei e-parl. + WFC 2008-03-1/2 12
WORLD EU-25 MENA
0
2000
4000
6000
8000
10000
12000
14000
16000
Potentials Demand 2000 Demand 2050
Ele
ctr
icit
y in
TW
h/y
Solar
Geothermal
Hydro
Wind
Biomass
Wave/Tide
Desalination
MENA
Europe
Economic Renewable Electricity Potentials and Demands in EUMENA
> 630000
How Does a Sustainable Mix„Transition Mix“Look Like?
14Gerhard Knies, Berlin 2007-11-19
40timeshigher
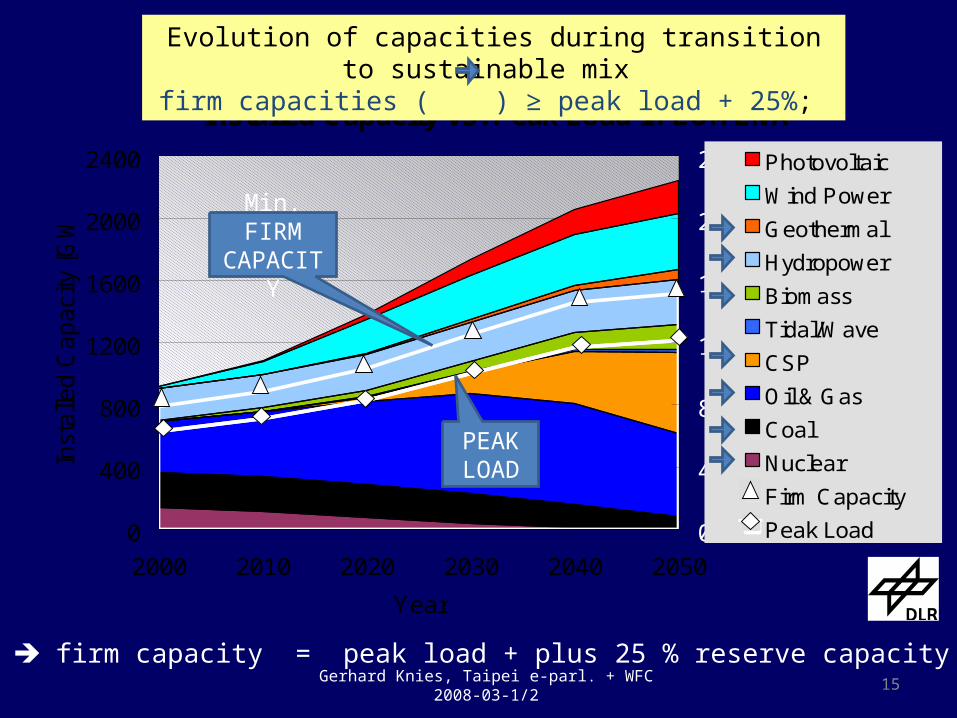
Installed Capacity vs. Peak Load in EUMENA
0
400
800
1200
1600
2000
2400
2000 2010 2020 2030 2040 2050
Year
Inst
alle
d C
ap
aci
ty [G
W]
0
400
800
1200
1600
2000
2400 Photovoltaic
Wind Power
Geothermal
Hydropower
Biomass
Tidal/Wave
CSP
Oil & Gas
Coal
Nuclear
Firm Capacity
Peak Load
Evolution of capacities during transition to sustainable mix firm capacities ( ) ≥ peak load + 25%;
firm capacity = peak load + plus 25 % reserve capacity
15Gerhard Knies, Taipei e-parl. + WFC 2008-03-1/2
Min. FIRM CAPACITY
PEAK LOAD
0
500
1000
1500
2000
2500
3000
3500
4000
4500
2000 2010 2020 2030 2040 2050
Year
Ele
ctric
ity [
TW
h/y]
DesalinationExport SolarPhotovoltaicsWindGeothermalHydropowerBiomassWave / TidalCSP PlantsOil / GasCoalNuclear
0
500
1000
1500
2000
2500
3000
3500
4000
4500
2000 2010 2020 2030 2040 2050
Year
Ele
ctric
ity [T
Wh/
y]
Import SolarPhotovoltaicsWindGeothermalHydropowerBiomassWave / TidalCSP PlantsOil GasCoalNuclear
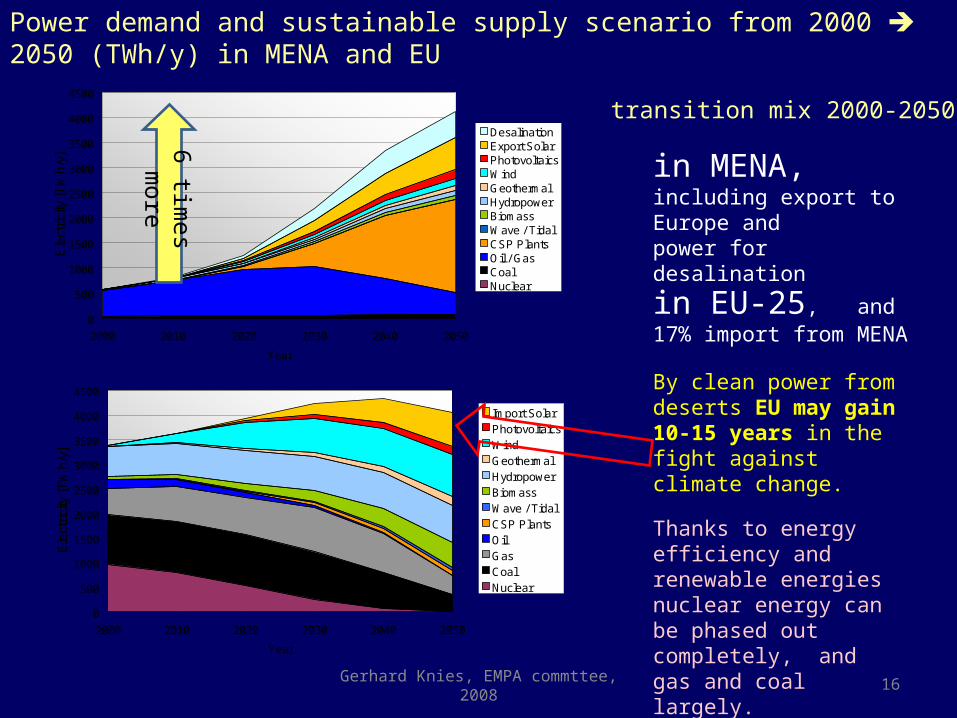
in MENA, including export to Europe and power for desalination
in EU-25, and17% import from MENA
By clean power from deserts EU may gain 10-15 years in the fight against climate change.
Thanks to energy efficiency and renewable energies nuclear energy can be phased out completely, andgas and coal largely.
Power demand and sustainable supply scenario from 2000 2050 (TWh/y) in MENA and EU
Gerhard Knies, EMPA commttee, 2008 16
transition mix 2000-2050
6 times m
ore
17
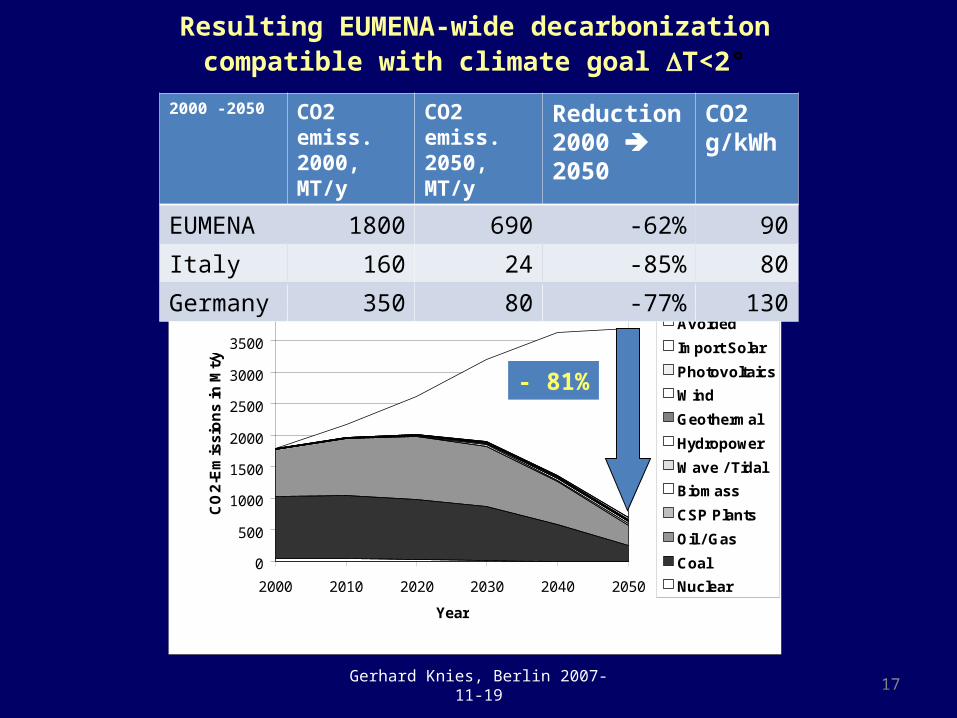
Resulting EUMENA-wide decarbonization compatible with climate goal T<2°
0
500
1000
1500
2000
2500
3000
3500
4000
2000 2010 2020 2030 2040 2050
Year
CO
2-E
mis
sio
ns
in
Mt/
y
Avoided
Import Solar
Photovoltaics
Wind
Geothermal
Hydropower
Wave / Tidal
Biomass
CSP Plants
Oil / Gas
Coal
Nuclear
- 81%
Gerhard Knies, Berlin 2007-11-19
2000 -2050 CO2 emiss.2000, MT/y
CO2 emiss.2050, MT/y
Reduction2000 2050
CO2 g/kWh
EUMENA 1800 690 -62% 90
Italy 160 24 -85% 80
Germany 350 80 -77% 130
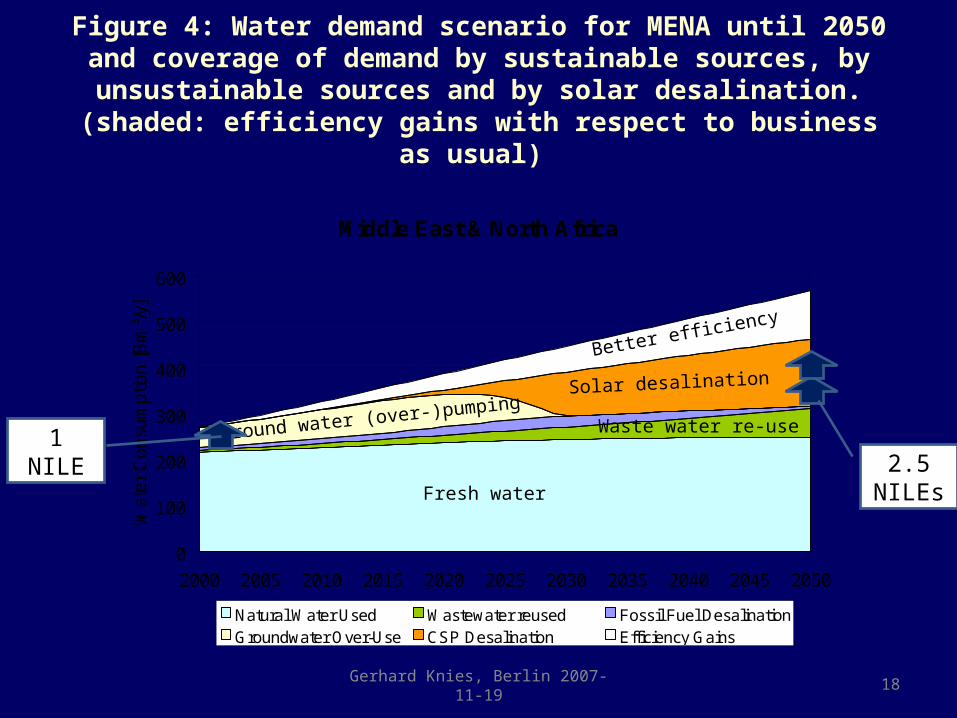
Figure 4: Water demand scenario for MENA until 2050 and coverage of demand by sustainable sources, by unsustainable sources and by solar
desalination. (shaded: efficiency gains with respect to business as usual)
Gerhard Knies, Berlin 2007-11-19 18
Middle East & North Africa
0
100
200
300
400
500
600
2000 2005 2010 2015 2020 2025 2030 2035 2040 2045 2050
Wat
er C
onsu
mpt
ion
[Bm
³/y]
Natural Water Used Wastewater reused Fossil Fuel DesalinationGroundwater Over-Use CSP Desalination Efficiency Gains
Ground water (over-)pumpingSolar desalination
Waste water re-use
Fresh water
Better efficiency
2.5 NILEs
1 NILE

Gerhard Knies, CSP 2008 Barcelona 20
EU-MENA food+power symbiosis:Clean power export for virtual water import
Source: International Water Management Institute IWMI, January 2000, http://iwmi.org
Water scarcity:
red : physical scarcity
brown: economic scarcity
blue: little or no scarcity
Food insecurity: Striped countries have to import >10% of cerealsexport
clean power
importfood
(virtual water)
Mediterranean
Partnership
for
Energy & Food
Security
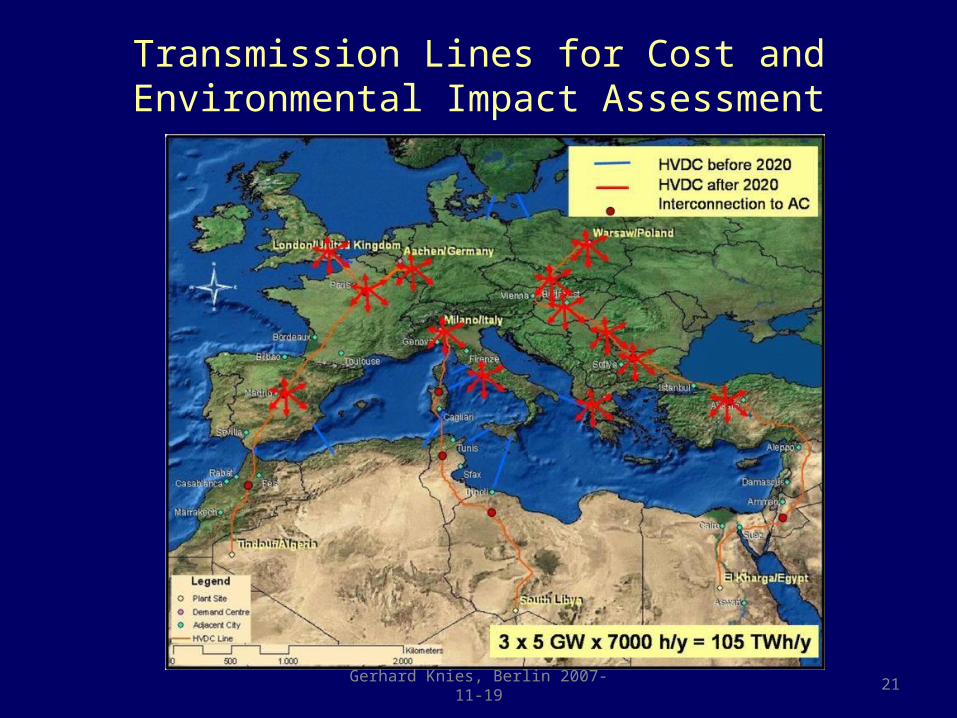
Transmission Lines for Cost and Environmental Impact Assessment
21Gerhard Knies, Berlin 2007-11-19
22
0.800.750.670.60Capacity Factor
350
45
245
31
143
20
42
5
Investment CSP
Billion € HVDC
0.040
0.010
0.040
0.010
0.045
0.010
0.050
0.014
Elec. Cost CSP
€/kWh HVDC
50 x 503600 x 1.0
40 x 403600 x 0.7
30 x 303600 x 0.4
15 x 153100 x 0.1
Land Area CSP
km x km HVDC
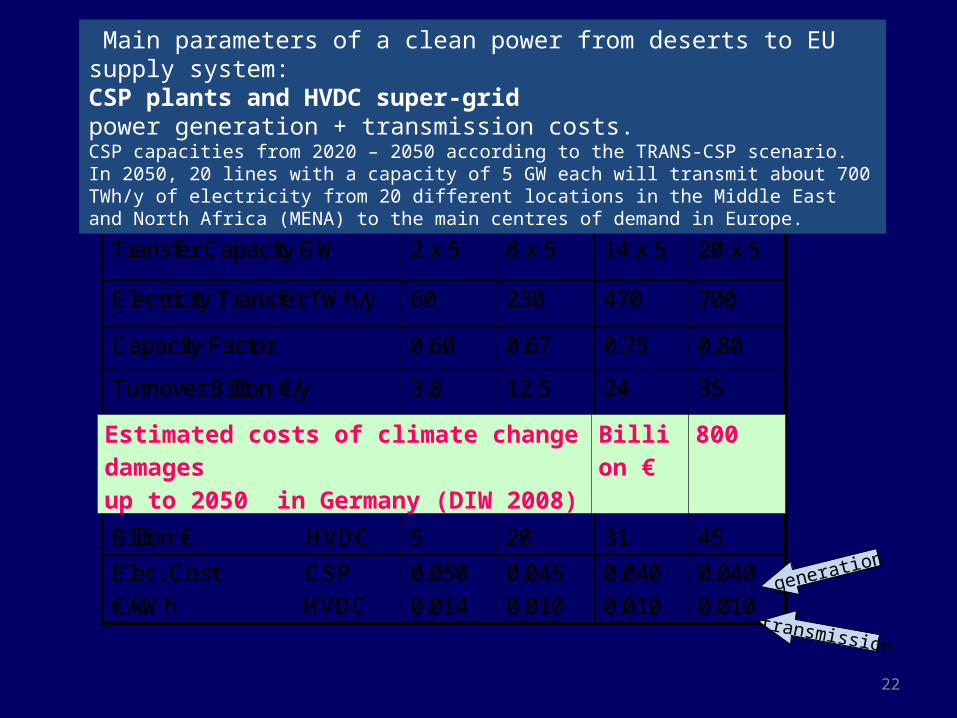
352412.53.8Turnover Billion €/y
70047023060Electricity Transfer TWh/y
20 x 514 x 58 x 52 x 5Transfer Capacity GW
2050204020302020Year
0.800.750.670.60Capacity Factor
350
45
245
31
143
20
42
5
Investment CSP
Billion € HVDC
0.040
0.010
0.040
0.010
0.045
0.010
0.050
0.014
Elec. Cost CSP
€/kWh HVDC
50 x 503600 x 1.0
40 x 403600 x 0.7
30 x 303600 x 0.4
15 x 153100 x 0.1
Land Area CSP
km x km HVDC
352412.53.8Turnover Billion €/y
70047023060Electricity Transfer TWh/y
20 x 514 x 58 x 52 x 5Transfer Capacity GW
2050204020302020Year
Main parameters of a clean power from deserts to EU supply system:CSP plants and HVDC super-grid power generation + transmission costs.CSP capacities from 2020 – 2050 according to the TRANS-CSP scenario. In 2050, 20 lines with a capacity of 5 GW each will transmit about 700 TWh/y of electricity from 20 different locations in the Middle East and North Africa (MENA) to the main centres of demand in Europe.
transmission
generation
Estimated costs of climate change damages up to 2050 in Germany (DIW 2008)
Billion € 800
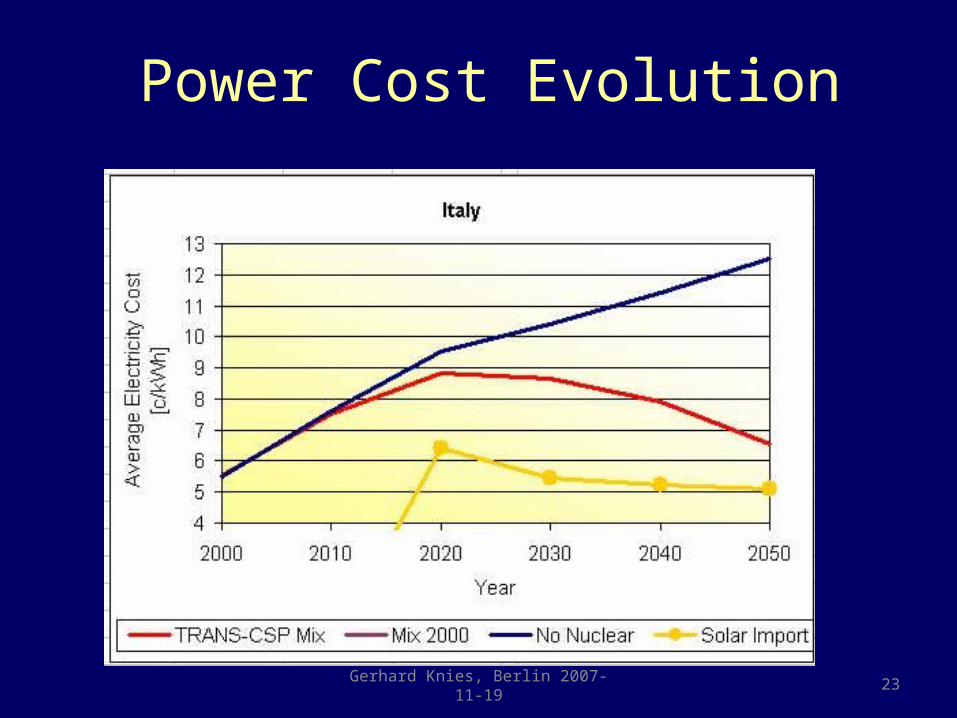
Power Cost Evolution
23Gerhard Knies, Berlin 2007-11-19

Gerhard Knies, EMPA commttee, 2008
Power Cost Development
24
Solar power from deserts can limit power cost escalation in Germany

Clean Power from Deserts for the World!
3000 km
Gerhard Knies, Taipei e-parl. + WFC 2008-03-1/2 25
More than 90% of world pop could be servedby clean power from deserts (DESERTEC) !
world electricity demand of
18,000 TWh/y (in 2005)
300 x 300 km²
=0.23% of all deserts
In 2050: ~50,000 TWh/y
500 x 500 km²

Gerhard Knies, CSP 2008 Barcelona
Forum1000 Solar Gigawatt
.
Forum10 000 Solar Gigawatt
At Hanover Industrial Fair,
23.-24. April 2008, Germany
Topics:
1.CSP Technology
2.DESERTEC: 10 000 Solar Gigawatt from deserts - how?
more: www.desertec.org 26

DESERTEC SUMMARY:• Deserts, with solar-thermal and wind power plants and with HVDC
transmission grids, can supply clean power to over 90% of world population.
• Up to 2050 the world’s power system can be largely decarbonized T < 2°) with the help of clean power from global deserts
• 2050: EU-MENA region with 1.5 bn people:
– Example for the global problem and how it can be solved
– Collectors for 1,500 Solar Gigawatts and 600 GW power capacity
– Power&water supply can be secured by “powerhouse desert”
• 2050: MENA supply to EU: – Union for the Mediterranean - the political facilitator for DESERTEC ?
– Solar: 100 GW and 700 TWh/y (17% of expected EU-consumption)– Investments: CSP=350 bn Euro, HVDC=45 bn Euro
– Wind : 120 GW and 360 TWh/y generation (coarse guess)– Investments: 100 bn Euro, HVDC=30 bn Euro (coarse guess)
• Cost of clean energy system ~ 1% of climate change damageGerhard Knies, Berlin 2007-11-19 27
Gerhard Knies, Berlin 2007-11-19 28
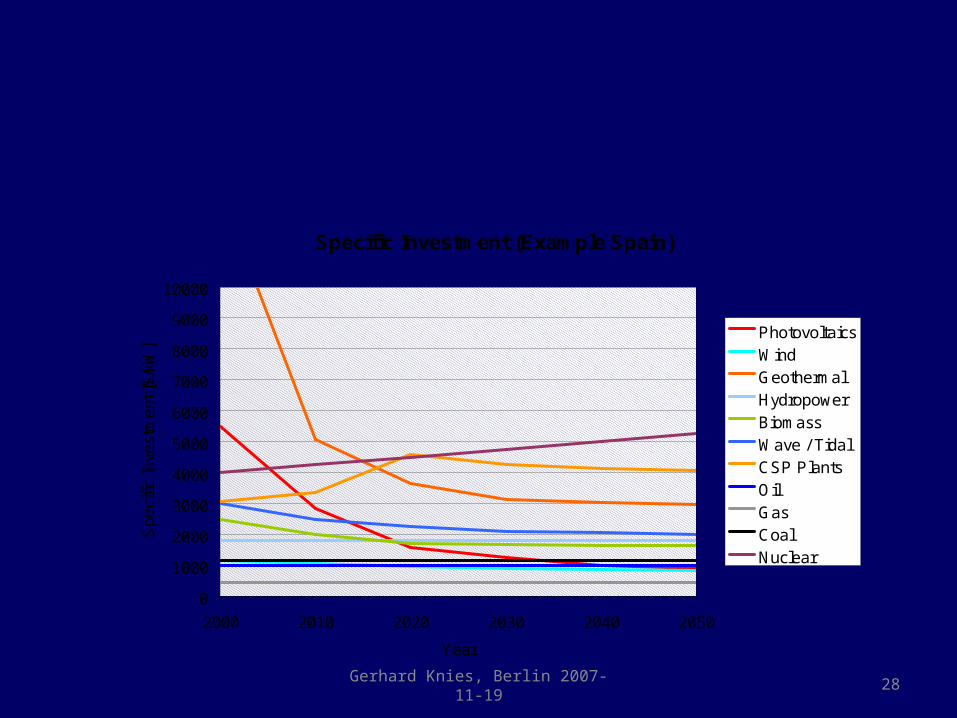
Specific Investment (Example Spain)
0
1000
2000
3000
4000
5000
6000
7000
8000
9000
10000
2000 2010 2020 2030 2040 2050
Year
Spe
cific
Inv
estm
ent [
$/kW
]
PhotovoltaicsWindGeothermalHydropowerBiomassWave / TidalCSP PlantsOil GasCoalNuclear
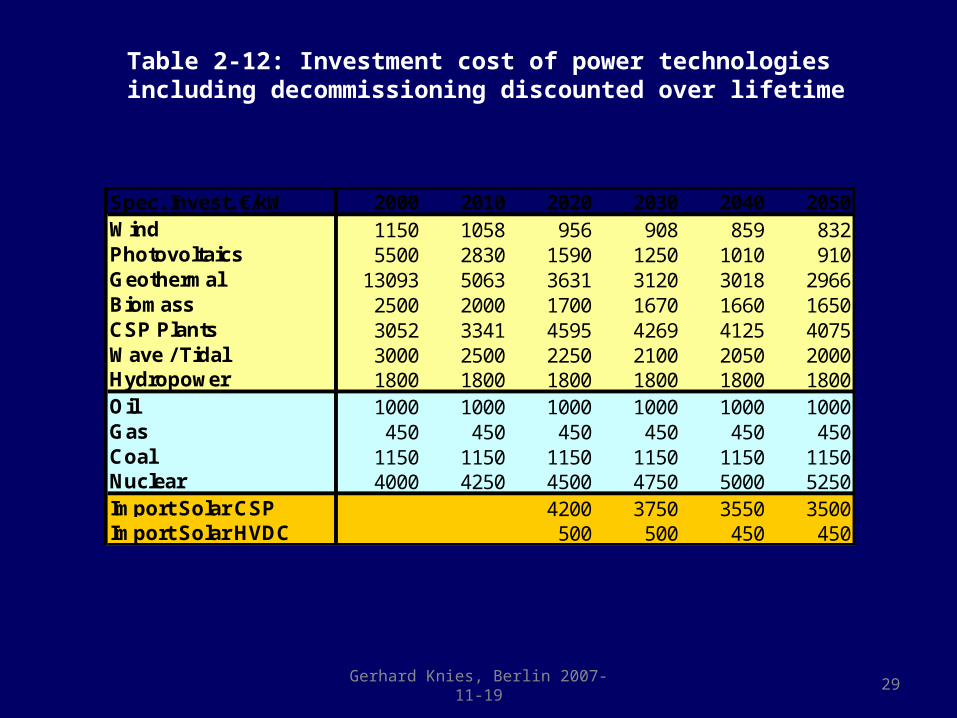
Table 2‑12: Investment cost of power technologies including decommissioning discounted over lifetime
Gerhard Knies, Berlin 2007-11-19 29
Spec. Invest. €/kW 2000 2010 2020 2030 2040 2050Wind 1150 1058 956 908 859 832Photovoltaics 5500 2830 1590 1250 1010 910Geothermal 13093 5063 3631 3120 3018 2966Biomass 2500 2000 1700 1670 1660 1650CSP Plants 3052 3341 4595 4269 4125 4075Wave / Tidal 3000 2500 2250 2100 2050 2000Hydropower 1800 1800 1800 1800 1800 1800Oil 1000 1000 1000 1000 1000 1000Gas 450 450 450 450 450 450Coal 1150 1150 1150 1150 1150 1150Nuclear 4000 4250 4500 4750 5000 5250Import Solar CSP 4200 3750 3550 3500Import Solar HVDC 500 500 450 450

Table 2‑13: Development of the electricity cost of new plants of different power technologies in the example of Spain on the basis of the investment cost development in Table 2‑12 and the different performance indicators representing each technology in each country following the TRANS-CSP scenario until 2050. From 2030 onwards, biomass, geothermal and CSP plants subsequently take over peaking duties, which is the reason for their cost elevation.
Gerhard Knies, Berlin 2007-11-19 30
Electricity Cost c/kWh 2000 2010 2020 2030 2040 2050Wind 7,7 6,8 6,1 5,8 5,4 5,2Photovoltaics 36,7 16,9 8,6 6,6 5,3 4,8Geothermal 17,5 6,8 4,8 4,8 5,5 5,9Biomass 6,1 4,9 4,3 4,2 4,7 5,2CSP Plants 17,6 12,2 7,5 6,7 6,2 6,6Wave / Tidal 8,3 6,9 6,2 5,8 5,6 5,5Hydropower 8,4 8,4 8,4 8,4 8,4 8,4Oil 8,1 12,2 15,0 16,4 17,8 19,6Gas 4,7 7,0 9,9 11,5 12,4 13,7Coal 3,3 4,0 5,6 5,7 5,8 6,0Nuclear 3,6 3,9 4,1 4,4 4,6 4,9Solar Import Electricity 5,4 4,8 4,6 4,9TRANS-CSP Average 4,8 5,9 6,9 6,7 6,8 6,6Electricity Mix 2000 4,8 5,7 6,8 7,2 7,6 8,0

Table 2 14: Technologies and range of required ‑revenues in the different electricity market segments
Gerhard Knies, Berlin 2007-11-19 31
Segment Source / Technology Min. Rev. Max. Rev.ct/kWh ct/kWh
Pump Hydro StorageFuel OilGas TurbineBiomassGeothermalCSPCoal Gas Combined CycleCSPBiomassGeothermalCoal LigniteNuclearRiver Run-OffGas Combined CycleCo-generationWindPhotovoltaicsCSPGeothermal
Base Load 3 6
10 25Peak Power
Intermediate Power
5 12