Embed Size (px)
Citation preview
Morgan Geothermal in the Piceance Basin, Colorado Page 1 of 13
Geothermal Gradients and Geothermal Opportunities in the Piceance Basin,
Colorado
Paul Morgan, Colorado Geological Survey, 1313 Sherman Street, Room 715, Denver, CO 80203:
1. Abstract
Bottom‐hole temperature (BHT) data have been compiled from 10,372 hydrocarbon
wells in the Piceance basin with an average depth of 2103 ± 685 (± standard deviation) m. For a
preliminary statistical analysis, the data were combined in 0.4 by 0.4 degree blocks by their
geographic coordinates and average geothermal gradients calculated for each block. Gradients
ranged from 22.7 to 41.8°C/km. Block gradients corrected for the disturbance caused by
drilling ranged from 27.3 to 51.5°C.km. Uncorrected BHTs indicate geothermal resources at
temperatures of 100 to 250°C at depths of 2.5 to 5 km. Corrected BHTs reduce these depths to
1.7 to 4.2 km. Generally permeability at these depths is low. The Leadville Limestone, a
Mississippian karst‐forming limestone is likely to underlie most of the basin, shallowing on the
southwest margin of the basin. Observations of this limestone at other locations indicate that it
is a very permeable aquifer. Production from similar fractured karst limestone aquifers in
Germany has generated ≥3.0 MWe from single wells. Alternatively, impermeable strata could
be hydrofractured to produce an enhanced/engineered geothermal system (EGS). In addition
to power production, geothermal systems are being investigated in northern Alberta, Canada,
as a source of thermal energy for in situ extraction of hydrocarbons from oil sands. The
Piceance Basin is one of the largest know reservoirs of oil shale in the world and geothermal
energy could be used to preheat the oil shale prior to extraction of hydrocarbons from this
resource. Geothermal energy is an environmentally clean source of energy for these processes.
There is very little produced water with hydrocarbon extraction in the Piceance Basin and
geothermal energy from co‐produced fluids in the basin is unlikely.
2. Introduction and Reduction of Data
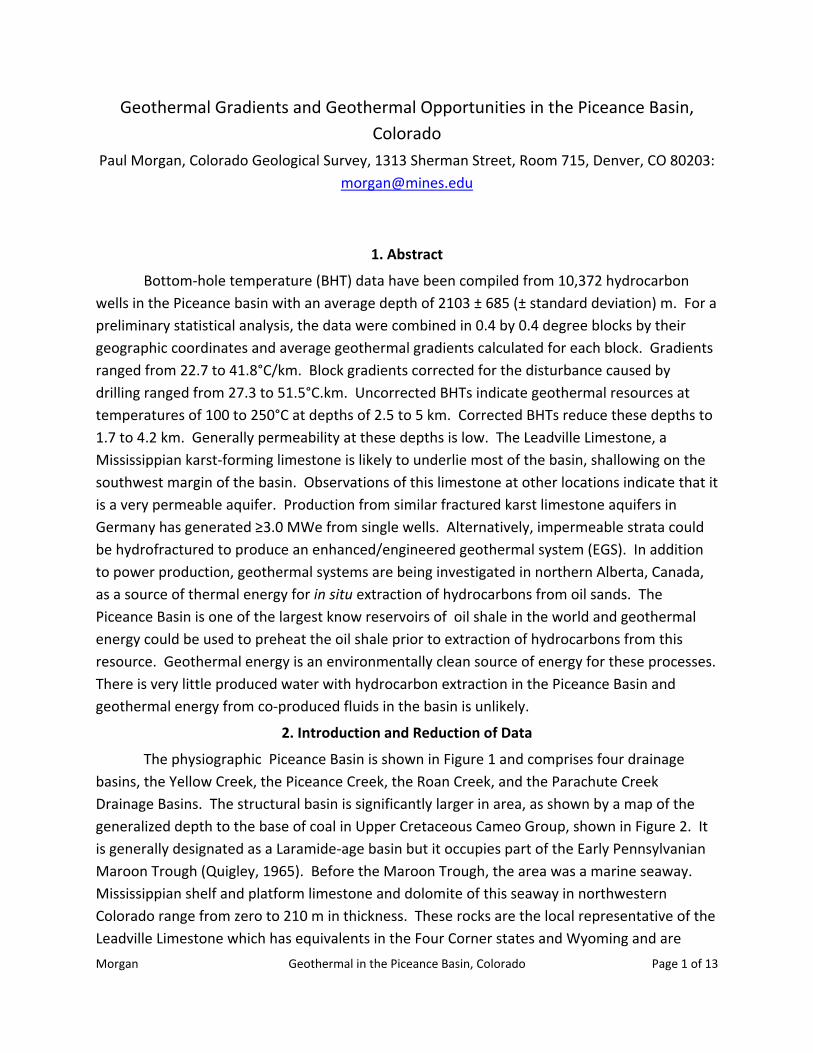
The physiographic Piceance Basin is shown in Figure 1 and comprises four drainage
basins, the Yellow Creek, the Piceance Creek, the Roan Creek, and the Parachute Creek
Drainage Basins. The structural basin is significantly larger in area, as shown by a map of the
generalized depth to the base of coal in Upper Cretaceous Cameo Group, shown in Figure 2. It
is generally designated as a Laramide‐age basin but it occupies part of the Early Pennsylvanian
Maroon Trough (Quigley, 1965). Before the Maroon Trough, the area was a marine seaway.
Mississippian shelf and platform limestone and dolomite of this seaway in northwestern
Colorado range from zero to 210 m in thickness. These rocks are the local representative of the
Leadville Limestone which has equivalents in the Four Corner states and Wyoming and are
Morgan Geothermal in the Piceance Basin, Colorado Page 2 of 13
Morgan Geothermal in the Piceance Basin, Colorado Page 3 of 13
typically karst‐forming limestones. Continued growth of the Ancestral Front Range and
Uncompahgre Uplift continued to act as sources for clastics, carbonates, and evaporites in the
trough from Late Permian through the Jurassic. A marine transgression in the Cretaceous
resulted in renewed sedimentation and the basin became a shallow sea with lagoonal and
swamp sediments. At the end of the Cretaceous the basin was folded and faulted during the
Laramide orogeny forming the present tectonic Piceance Basin (Quigley, op. cit.). A generalized
stratigraphic column for the Piceance basin is shown in Figure 3.
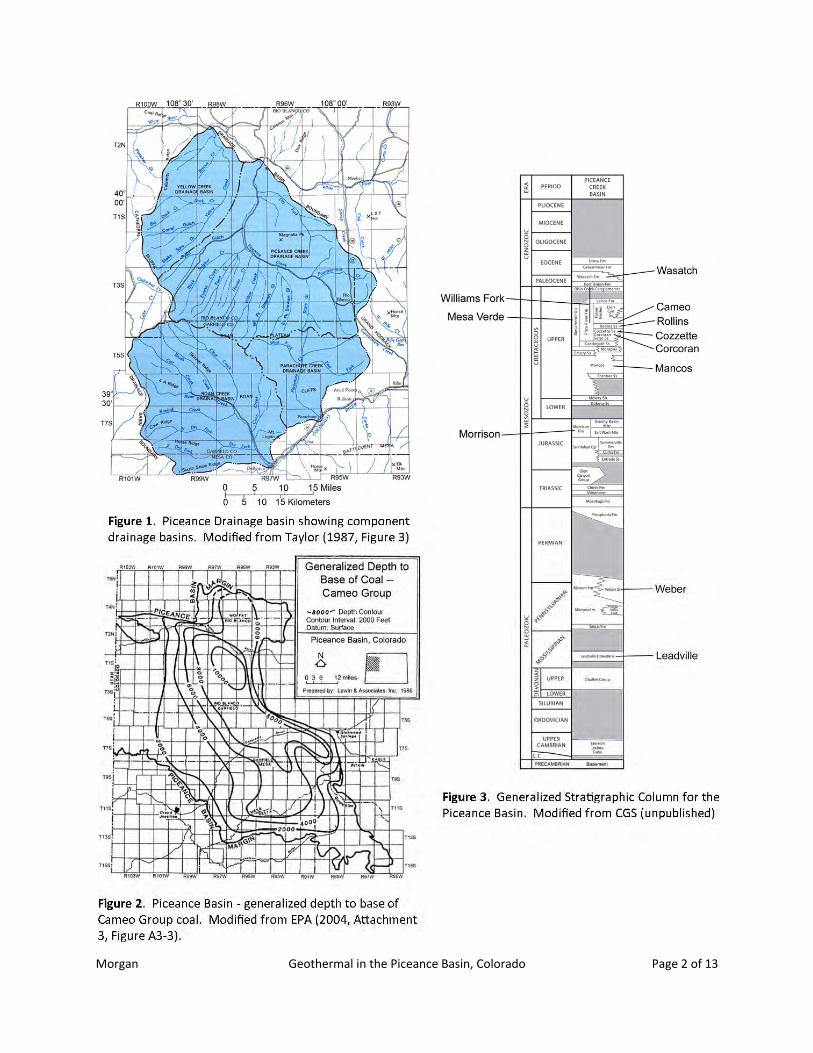
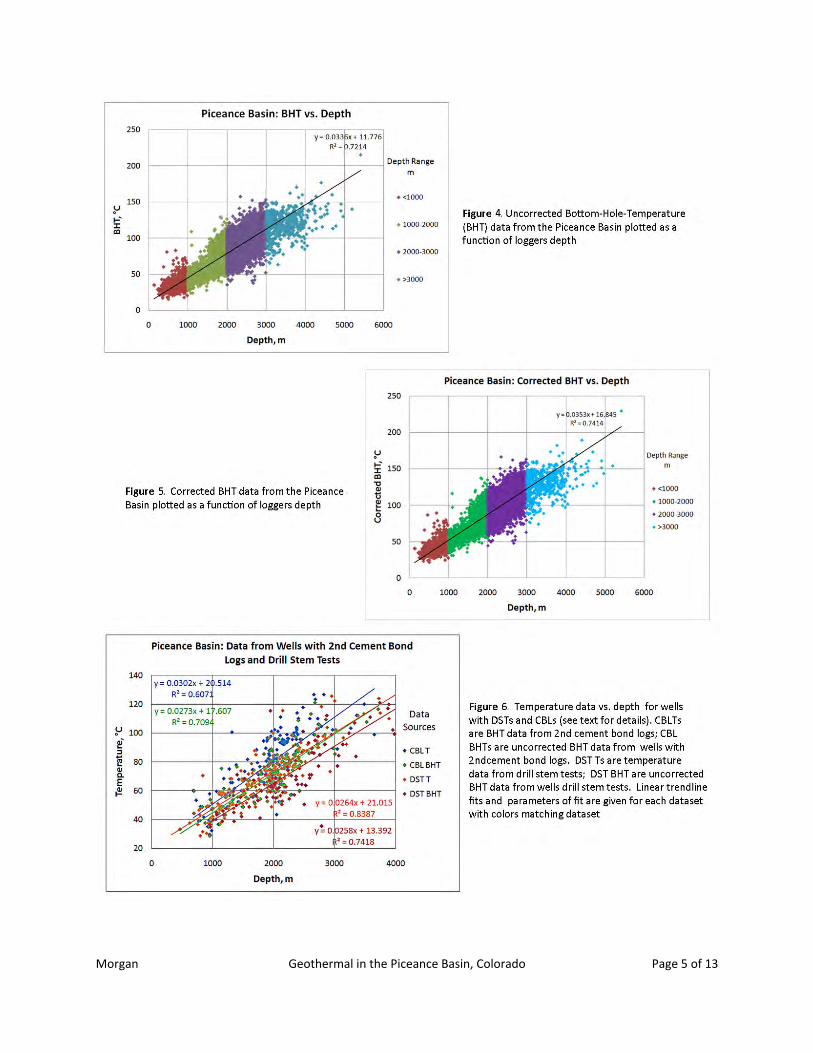
The complete BHT data set compiled from 10,372 oil and gas wells is plotted as a
function of depth in Figure 4. Table 1 lists average geothermal gradients from the surface for
wells terminating in different units: the only unit that has a gradient that is statistically
significant is the Lower Permian/Upper Pennsylvanian Weber unit. This unit has a greater
thickness of Upper Paleozoic sedimentary rocks than all other units in the table. These rocks
have a higher proportion of high thermal conductivity limestone, dolomite and evaporates and
shallower formations and the drop in thermal gradient is probably associated with a change in
thermal conductivity. These data are not corrected for the transient temperature disturbance
caused by the circulation of drilling fluid. Temperature data from drill‐stem tests (DST data) are
often taken to be a close approximation to the undisturbed, or virgin rock temperatures (VRTs).
DSTs pull fluid from a formation under test which is generally assumed to be outside the region
of thermal (and fluid) disturbance by drilling. In some wells, a second cement‐bond log (CBL) is
run days, weeks, or months (rare) after normal logging operations and a BHT may be measured
on this log. These second cement bond log temperatures may also be a close approximations
to the VRTs. In this study, data from DSTs and CBLs will be referred to as proxy VRTs.
Table 1. Depth, BHT and geothermal gradient data for different units.
Stratigraphic Age Name Average Depth, m
Average Temperature, °C
Geothermal Gradient, °C/km
n
Paleocene/Eocene WASATCH 917 ± 471 44 ± 15 39 ± 15 181
Upper Cretaceous WILLIAMS FORK 2183 ± 549 89 ± 24 36 ± 12 664
Upper Cretaceous MESA VERDE 1756 ± 772 65 ± 25 33 ± 11 238
Upper Cretaceous CAMEO 2320 ± 432 93 ± 19 35 ± 6 477
Upper Cretaceous ROLLINS 2367 ± 401 99 ± 19 37 ± 6 4605
Upper Cretaceous COZZETTE 2139 ± 568 89 ± 23 38 ± 7 68
Upper Cretaceous CORCORAN 2287 ± 745 88 ± 24 35 ± 6 956
Upper Cretaceous MANCOS 1353 ± 589 55 ± 25 34 ± 8 563
Upper Jurassic MORRISON 1622 ± 642 63 ± 20 34 ± 7 255
Lower Permian/Upper Pennsylvanian
WEBER 1985 ± 213 64 ± 9 26 ± 3 464
Morgan Geothermal in the Piceance Basin, Colorado Page 4 of 13
For the Piceance Basin, limited DST and CBL temperature data are available, and these
are plotted together with normal BHT data from the same wells in Figure 5. The wells sampled
by the DST and CBL data sets overlap geographically but cover different areas. They have
different average mean temperatures and average thermal gradients. Both data sets show that
the BHTs are cooler than the proxy VRTs but do not indicate a common correction. When the
averages from each data set are examined, however, there is remarkable agreement in the
disturbances indicated by the two data sets. For each data set the average temperatures and
depths were calculated and then the temperatures were corrected to 2000 m using the
temperature gradients calculated from the linear fits to the data shown in Figure 5. The
difference was then calculated between the proxy VRTs at 2000 m and the normal BHT
temperatures at 2000 m. For both the CBL and the DST data sets this difference was calculated
to be 8.7°C. This agreement is perhaps fortuitous, but the magnitude of the correction is
consistent with the BHT corrections for other basins (e.g., Harrison et al., 1983, Blackwell and
Richards, 2004). A BHT correction has therefore been calculated from the average of the
differences of the pairs of the CBL and DST lines, and this correction is:
Tcorr = 0.00175z + 5.0685 °C (1)
where Tcorr is the correction in °C, and z is depth in meters. As a rough check on this crude
estimate of the correction, the calculated correction at 2000 m is 8.6°C. All values calculated
using this correction are indicated as “corrected” values below. Corrected BHTs are plotted as a
function of depth in Figure 6.
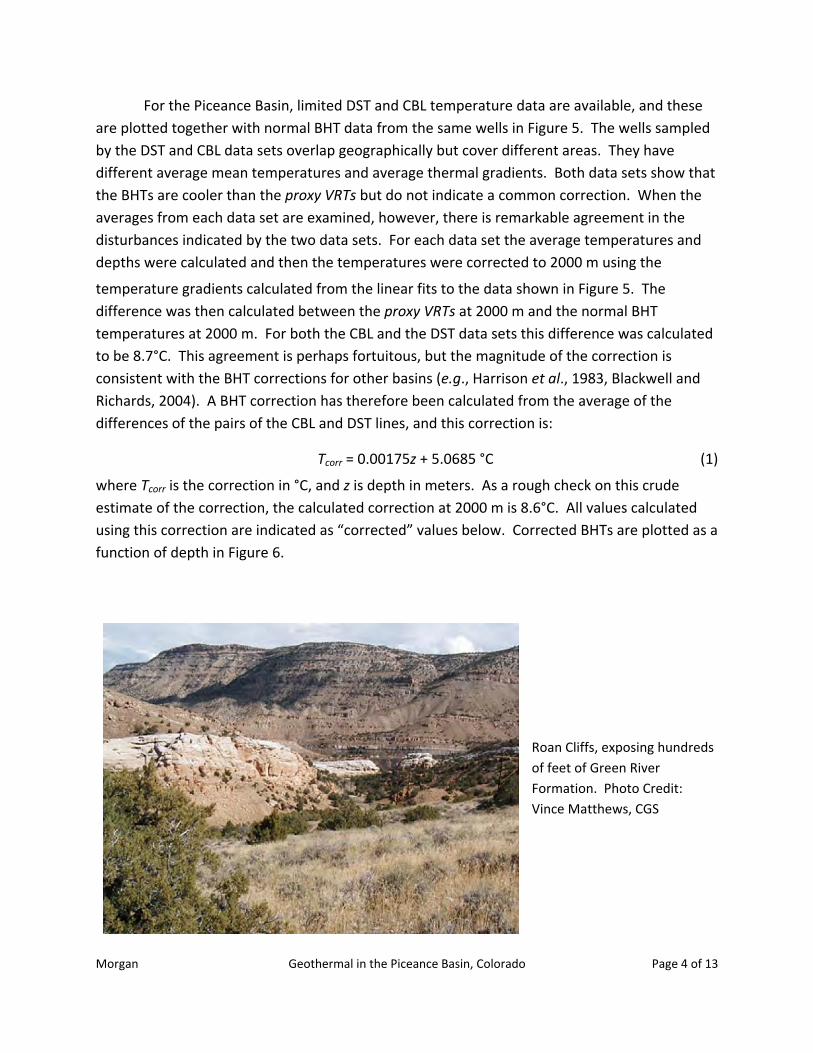
Roan Cliffs, exposing hundreds
of feet of Green River
Formation. Photo Credit:
Vince Matthews, CGS
Morgan Geothermal in the Piceance Basin, Colorado Page 5 of 13
Morgan Geothermal in the Piceance Basin, Colorado Page 6 of 13
3. Calculation of Geothermal Gradients
For calculation of temperature gradients, an estimate of the surface ground
temperature is required. For this study surface air temperature data were compiled from the
Western Regional Climate Center (URL: [email protected], last accessed 2011‐5‐11). Temperature
data were collected from twenty one climate stations in and around the Piceance Basin and a
linear fit was made to the temperature versus elevation data from these stations with the
following result:
Tsa = 20.085 – 0.007027e °C (2)
where Tsa is the surface air temperature in °C and e is elevation in m. The goodness of fit
parameter (R2) for this fit was 0.8. The data were also analyzed in terms of a dependence on
latitude and/or longitude, but no significant correlation with these parameters was found.
Previous studies have found that, on average, surface ground temperature are 3°C higher than
surface air temperature, and therefore the following formula was used to calculate surface
temperatures for each well:
Ts = 23.085 – 0.007027e °C (3)
where Ts is the surface ground temperature in °C.
Geothermal gradients were estimated by two methods. The first method used trendline
fits to plots of temperature vs. depth using Microsoft Excel®: gradients calculated by this
method are given in Figures 5 and 6. The second method calculated gradients for individual
wells as:
∂T/∂z = (T – Ts)/z (4)
where ∂T/∂z is the geothermal gradient and T is temperature at depth z: gradients calculated
by this method are displayed in Figure 7. With z in km, the units for geothermal gradient are
°C/km.
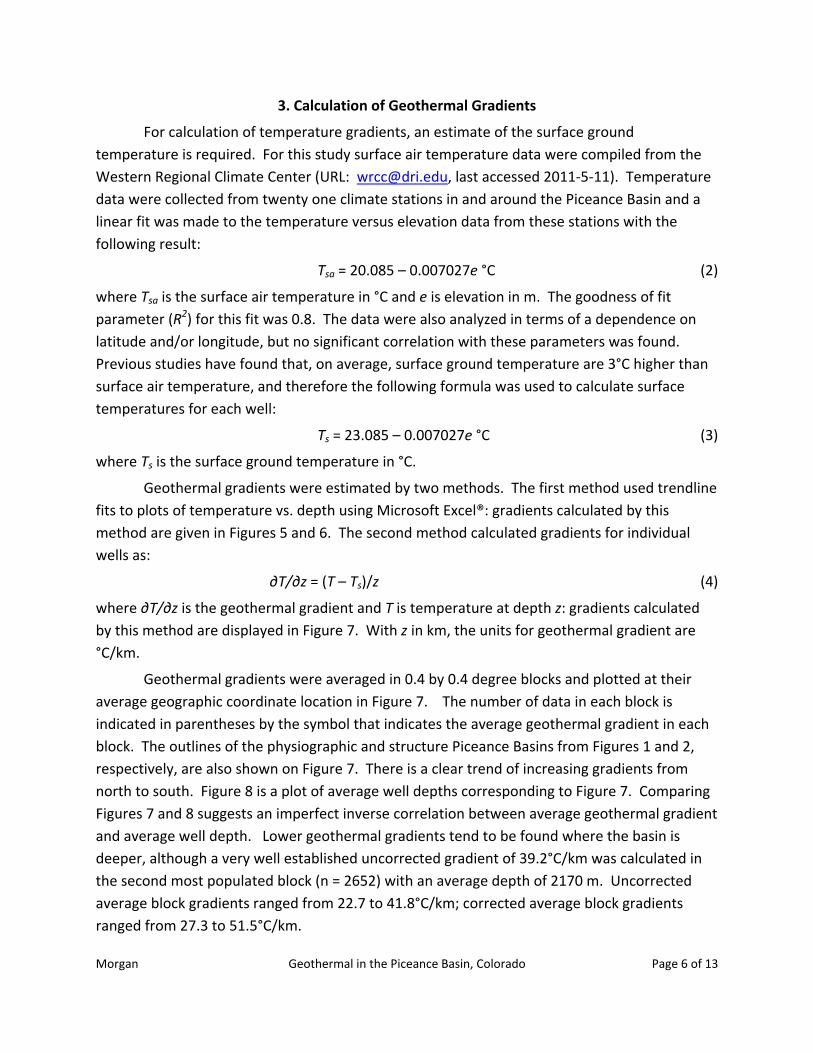
Geothermal gradients were averaged in 0.4 by 0.4 degree blocks and plotted at their
average geographic coordinate location in Figure 7. The number of data in each block is
indicated in parentheses by the symbol that indicates the average geothermal gradient in each
block. The outlines of the physiographic and structure Piceance Basins from Figures 1 and 2,
respectively, are also shown on Figure 7. There is a clear trend of increasing gradients from
north to south. Figure 8 is a plot of average well depths corresponding to Figure 7. Comparing
Figures 7 and 8 suggests an imperfect inverse correlation between average geothermal gradient
and average well depth. Lower geothermal gradients tend to be found where the basin is
deeper, although a very well established uncorrected gradient of 39.2°C/km was calculated in
the second most populated block (n = 2652) with an average depth of 2170 m. Uncorrected
average block gradients ranged from 22.7 to 41.8°C/km; corrected average block gradients
ranged from 27.3 to 51.5°C/km.
Morgan Geothermal in the Piceance Basin, Colorado Page 7 of 13
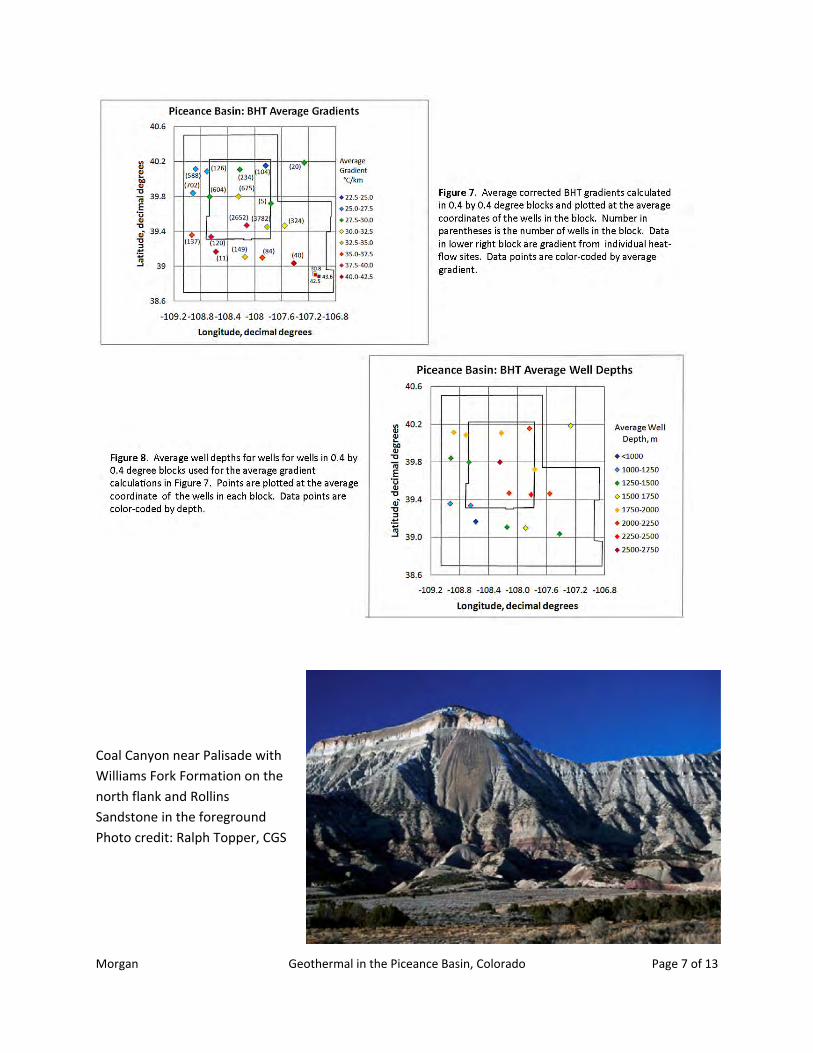
Coal Canyon near Palisade with
Williams Fork Formation on the
north flank and Rollins
Sandstone in the foreground
Photo credit: Ralph Topper, CGS
Morgan Geothermal in the Piceance Basin, Colorado Page 8 of 13
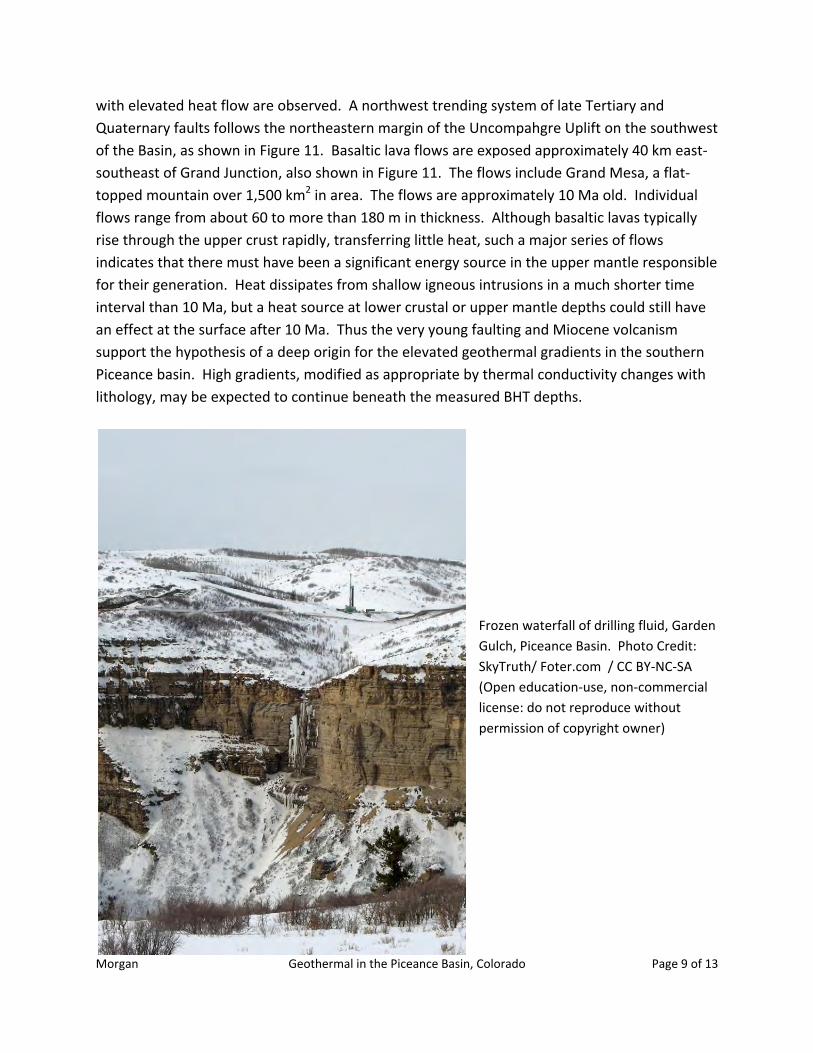
4. Interpretation of Results
There is a weak inverse correlation between average geothermal gradient and average
well depth (R2 = 0.11), as shown in Figure 9. The large scatter in this plot strongly suggests that
geothermal gradient is not controlled by changes in mean thermal conductivity associated with
lithologic changes, for which well depth is a proxy. Assuming that the main production horizons
are similar across the basin, average well depth is a function of the depths to the main
production layers. If thinning of sedimentary rocks overlying the main production horizons as
their depths change is partially by pinching out of some horizons, then the lithologic column
above the main producing horizons would be expected to change. Changes in the lithologic
column are likely to be accompanied by changes in the mean thermal conductivity of the
column resulting in changes in geothermal gradient even for uniform heat flow. However, as
there is no simple relation between average geothermal gradient and average well depth,
factors other than changes in mean thermal conductivity with depth may be assumed to
dominate.
Heat is redistributed by groundwater flow in many sedimentary basins (e.g., the Raton Basin,
Colorado; Morgan, 2009). An indication that groundwater thermal convection may be
occurring is that there is a general inverse correlation among geothermal gradients calculated
for individual wells and the collar elevations for the wells. A more accurate indicator is to plot
the elevation of the water table at each well, but well collar elevation is a useful proxy for water
table elevation if the number of wells is large. A plot of geothermal gradients versus collar
elevation for individual wells is shown in Figure 10. For the Piceance Basin the correlation is
weak (R2 = 0.16) but it is positive rather than negative. The plot of geothermal gradient versus
well collar elevation does not indicate large‐scale thermal convection driven by regional
groundwater recharge.
The general increase in geothermal gradient from north to south in the Piceance basin
cannot be explained by a general lithologic change associated with well depth or with
groundwater convection. The Upper Cretaceous depocenter of the basin is to the north. The
depocenter is relatively narrow to the north, and locally higher geothermal gradients are where
this depocenter is relatively deep north of latitude 39.4°N (Figure 7). However, south of
latitude 39.4°N the higher geothermal gradients do not spatially correlate with the depocenter.
High geothermal gradients from equilibrium heat flow measurements are in the southeast
corner of the study area at the extreme edge of the depocenter and indicate that the high
gradients are a regional anomaly, not a result of thermal refraction associated with basin
structure.
A conspicuous source of the regional, high geothermal gradients at the southern end of
the Piceance basin is not obvious. However, other geological features commonly associated
Morgan Geothermal in the Piceance Basin, Colorado Page 9 of 13
with elevated heat flow are observed. A northwest trending system of late Tertiary and
Quaternary faults follows the northeastern margin of the Uncompahgre Uplift on the southwest
of the Basin, as shown in Figure 11. Basaltic lava flows are exposed approximately 40 km east‐
southeast of Grand Junction, also shown in Figure 11. The flows include Grand Mesa, a flat‐
topped mountain over 1,500 km2 in area. The flows are approximately 10 Ma old. Individual
flows range from about 60 to more than 180 m in thickness. Although basaltic lavas typically
rise through the upper crust rapidly, transferring little heat, such a major series of flows
indicates that there must have been a significant energy source in the upper mantle responsible
for their generation. Heat dissipates from shallow igneous intrusions in a much shorter time
interval than 10 Ma, but a heat source at lower crustal or upper mantle depths could still have
an effect at the surface after 10 Ma. Thus the very young faulting and Miocene volcanism
support the hypothesis of a deep origin for the elevated geothermal gradients in the southern
Piceance basin. High gradients, modified as appropriate by thermal conductivity changes with
lithology, may be expected to continue beneath the measured BHT depths.
Frozen waterfall of drilling fluid, Garden
Gulch, Piceance Basin. Photo Credit:
SkyTruth/ Foter.com / CC BY‐NC‐SA
(Open education‐use, non‐commercial
license: do not reproduce without
permission of copyright owner)
Morgan Geothermal in the Piceance Basin, Colorado Page 10 of 13
Morgan Geothermal in the Piceance Basin, Colorado Page 11 of 13
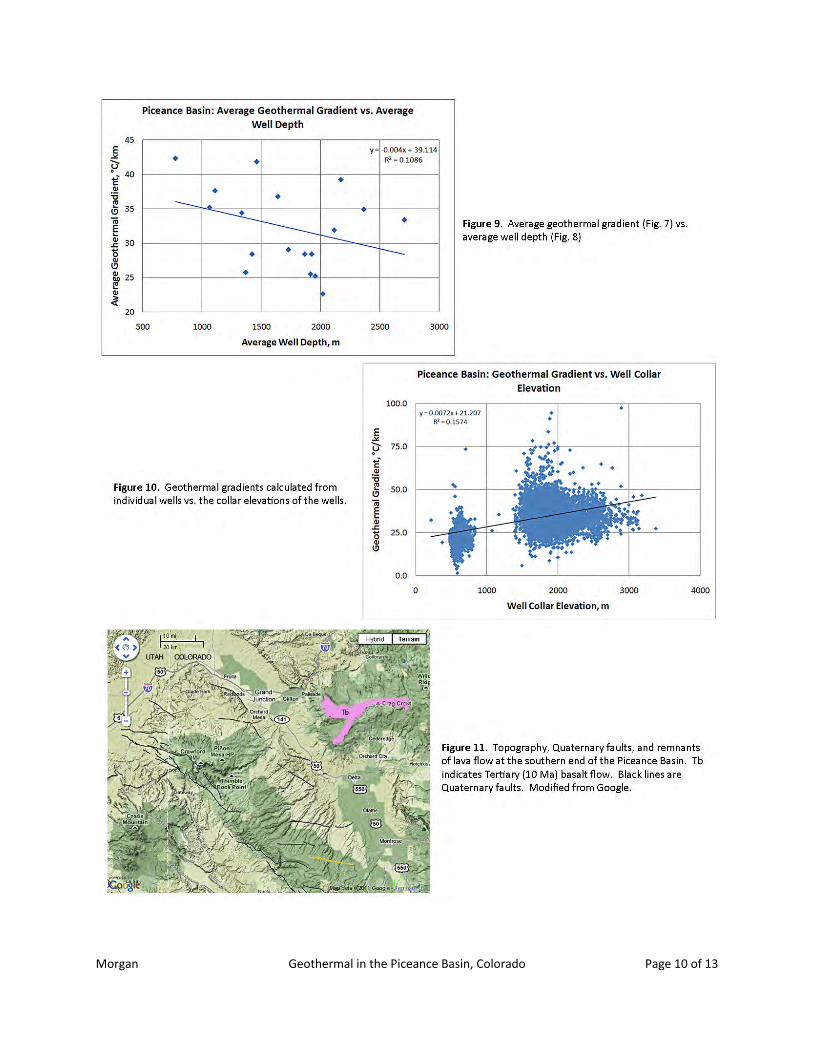
5. Geothermal Resources in the Piceance Basin
There are two options for producing high volumes of geothermal fluid from depth in the
Piceance Basin, 1. find a naturally permeable aquifer or 2. stimulate permeability. Two ≥3 MWe
geothermal power plants in Germany use natural permeability in a fractured limestone that has
significant karst (cave) permeability. A shallow‐water limestone was deposited across most of
the Four Corner states and into Wyoming during the Mississippian period, and wherever this
limestone is exposed today it is observed to have karst permeability. It has different names in
different states: the Redwall Limestone in Arizona, the Redwall or Leadville Limestone in Utah,
the Leadville Limestone in Colorado and northwestern New Mexico, and the Madison
Limestone in Wyoming. Large caves are observed where the Redwall Limestone crops out as a
steep cliff‐forming formation in Arizona’s Grand Canyon, but its cave‐forming properties may
be observed in the neighboring Colorado Plateau by depressions as the overlying strata have
collapsed into voids in the buried Redwall to form sedimentary breccia pipes. From these
indications of subsurface caves in the Redwall, we may assume that the Mississippian limestone
is likely to have karst structure throughout the region. Regional structural contours on the top
of the Mississippian by Casillas (2004, Figure 50), based on the modeling of gravity and seismic
data, indicate that this surface shallows from a maximum depth of about 3,000 m below sea
level in the Piceance Basin to about 300 m below sea level on the southwestern margin of the
basin. The Leadville Limestone is seen to have major karst properties wherever it outcrops in
the Piceance Basin, such as around Glenwood Springs (Figures 12 and 13).
Morgan Geothermal in the Piceance Basin, Colorado Page 12 of 13
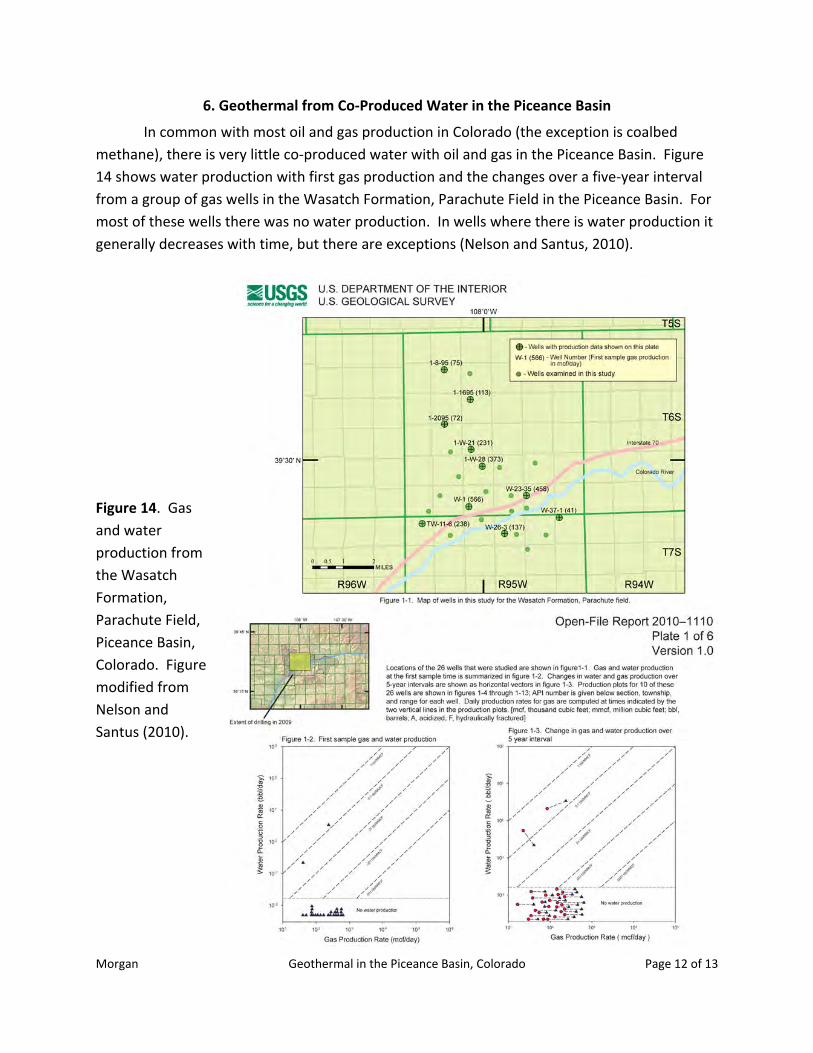
6. Geothermal from Co‐Produced Water in the Piceance Basin
In common with most oil and gas production in Colorado (the exception is coalbed
methane), there is very little co‐produced water with oil and gas in the Piceance Basin. Figure
14 shows water production with first gas production and the changes over a five‐year interval
from a group of gas wells in the Wasatch Formation, Parachute Field in the Piceance Basin. For
most of these wells there was no water production. In wells where there is water production it
generally decreases with time, but there are exceptions (Nelson and Santus, 2010).
Figure 14. Gas
and water
production from
the Wasatch
Formation,
Parachute Field,
Piceance Basin,
Colorado. Figure
modified from
Nelson and
Santus (2010).
Morgan Geothermal in the Piceance Basin, Colorado Page 13 of 13
7. References Cited
Blackwell, D. D. and M. Richards, 2004. “Calibration of the AAPG geothermal survey of North America BHT data base.” American Association of Petroleum Geologists Meeting, Dallas Texas, April 2004, Southern Methodist University Geothermal Lab Poster on BHT Calibration, URL: http://smu.edu/geothermal/BHT/BHT.htm, last accessed 2011‐5‐10.
Casillas, H. A., 2004, An Integrated Geophysical Study of the Uncompahgre Uplift, Colorado and Utah, M. S. Thesis,
Harrison, W. E., M. L. Prater, and P. K. Cheung, 1983. “Geothermal resource assessment in Oklahoma.” Oklahoma Geological Survey, Norman, OK, Special Publication 83‐1, 42 pp., 3 plates.
Morgan, P., 2009. “A preliminary analysis of geothermal resources in the central Raton Basin, Colorado, from bottom‐hole temperature data.” Geothermal Resources Council, Transactions, v. 33, p. 509‐513.
Nelson, P. H., and S. L. Santus, 2010, "Gas, oil, and water production form Grand Valley,
Parachute, Ruleson, and Mamm Creek Fields in the Piceance Basin, Colorado," U. S.
Geological Survey Open File Report 2010‐1110, Reston, VA, 28 pp., 6 plates, 3 tables, 6
digital appendices.
Quigley, M. D., 1965, Geologic history of Piceance Creek‐Eagle Basins, Bull. Am. Assoc. Petrol.
Geol., 49, 1974‐1996.