Embed Size (px)
Citation preview

Research ArticleVolume 3 Issue 1 - July 2019DOI: 10.19080/ETOAJ.2019.03.555603
Eng Technol Open AccCopyright © All rights are reserved by J Shehu
Geotechnical Investigation on Road Failure of Part of London Road Minna, Nigeria
Ndanusa HH, AA Rafiu, KA Salako, UD Alhassan, AA Adetona and J Shehu*Department of Geophysics, Federal University of Technology, Nigeria
Submission: June 17, 2019; Published: July 24, 2019*Corresponding author: J Shehu, Department of Geophysics, Federal University of Technology, Nigeria
Eng Technol Open Acc 3(1): ETOAJ.MS.ID.555603 (2019) 0013
Abstract
Geotechnical investigation involving Atterberg limit, CBR, Compaction and Sieve analysis were conducted at part of London Road Minna, Niger State. The aim of the study was to investigate the causes of road failure. The CBR range between 54.1% to 64.2%, the liquid limit of the soil ranged from 16% to 17.90%, the plastic limit is zero. The CBR, the percentage passing sieve range from 29.4% - 99.5%. Based on the 80% minimum CBR, 35%maximum percentage passing sieve 0.075mm, 12% maximum plasticity index and 35% maximum liquid limit required for material to be used as a base course material for road construction as specified by Nigeria general specification for road and bridge work. All the samples tested do not meet the requirement highlighted above. Therefore, the samples cannot be used as base course material for the studied location.
Keywords: Geotechnical; Compaction; Sieve analysis; Liquid, Soil; Water and Road failure
Introduction
Road network system has sewed Nigeria together than any form of integration scheme and has contributed to her economic growth. However, it has been observed that over the years her road often deteriorates few months after they are reconstructed and maintained. These road failures are often seen as cracks, ruts, depression, potholes and bulges on our roads which have adverse effect on both vehicles and passengers [1].
Geological factors are rarely considered as precipitators of road failure even though the highway pavement is founded on the geology. This is due to non-appreciation of the fact that proper design of highway requires adequate knowledge of subsurface conditions beneath the highway route. The non-recognition of this fact has led to loss of integrity of many highway routes and other engineering structures across the country. Other previous studies have shown that the integrity of the highway pavement can be undermined by the existence of geological features and/or engineering characteristics of the underlying geologic/geoelectric. It is therefore vital for engineers to carry out predesign investigations of engineering sites Klimis [2].
Information related to the local soil conditions is vital for risk assessment and mitigation [3]. The procedure for obtaining subsurface information is divided into two broad categories: indirect and direct methods. Indirect methods include aerial photography, topographic map interpretation and the study of existing geological reports, maps, and soil surveys. Direct methods comprise of the following modules:
a) geologic field reconnaissance, including the examination of in situ materials, man-made structures, groundwater level and exploration of shafts
b) application of modern geophysical techniques for mapping subsurface structures,
c) borings, test pits, trenches and shafts from which representative disturbed and/or undisturbed samples of the in-situ materials may be obtained and analysed
d) simple geotechnical field tests, such as the standard penetration test (SPT), which can be correlated with other engineering parameters [3].
Location of the study areaThe study area is located at London Street extending to Bosso
Low-cost Road, Bosso Local Government Area of Niger State. The area is a less density in population. The people of the area comprise of the students of Federal University of Technology Minna and original settler of the area, the Nupe’s and the Gwari’s. The study area is basically a residential area.
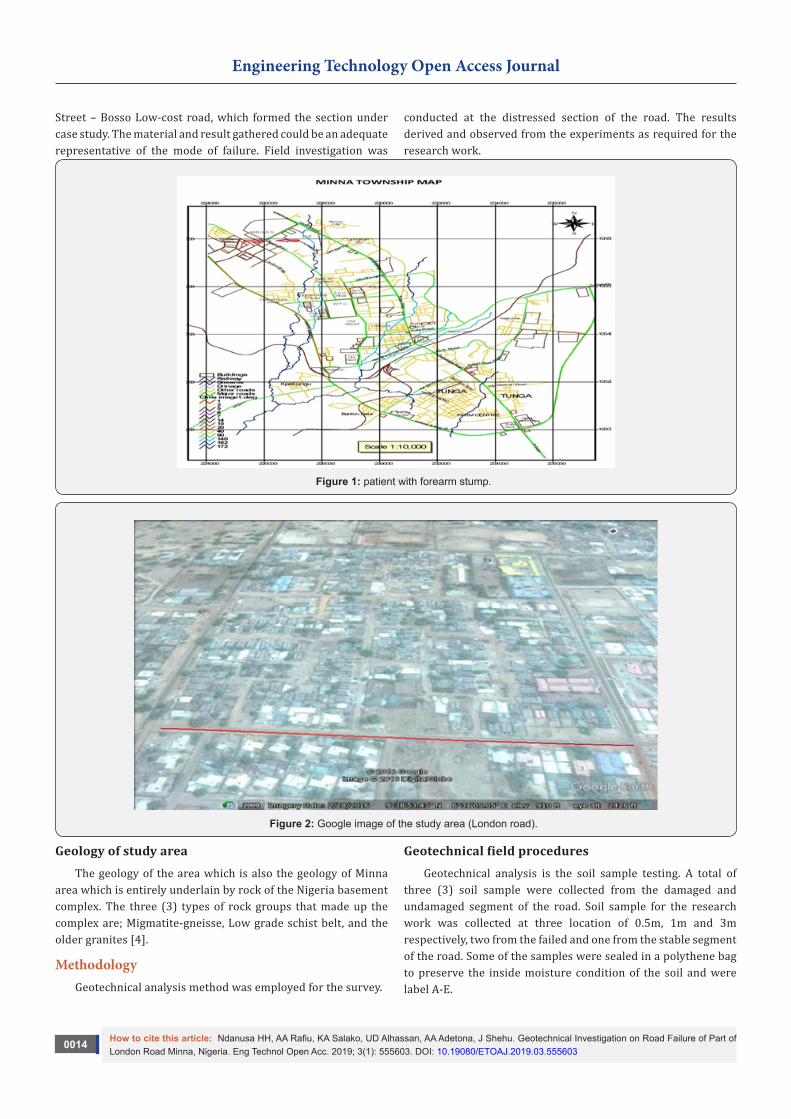
Figure 1 shows the digitalized map of the study area, while Figure 2 is the Google map of the area the location lies between latitude 9˚38’907’N and 9˚38’903’N and longitude 006˚30.952’E and 006˚30.946’E. The map has the scale of 1:100,000 (Bosso LGA).
Hence, in view of the specific area covered by the failure, investigations were carried out at different area along London
How to cite this article: Ndanusa HH, AA Rafiu, KA Salako, UD Alhassan, AA Adetona, J Shehu. Geotechnical Investigation on Road Failure of Part of London Road Minna, Nigeria. Eng Technol Open Acc. 2019; 3(1): 555603. DOI: 10.19080/ETOAJ.2019.03.555603
0014
Engineering Technology Open Access Journal
Street – Bosso Low-cost road, which formed the section under case study. The material and result gathered could be an adequate representative of the mode of failure. Field investigation was
conducted at the distressed section of the road. The results derived and observed from the experiments as required for the research work.
Figure 1: patient with forearm stump.
Figure 2: Google image of the study area (London road).
Geology of study areaThe geology of the area which is also the geology of Minna
area which is entirely underlain by rock of the Nigeria basement complex. The three (3) types of rock groups that made up the complex are; Migmatite-gneisse, Low grade schist belt, and the older granites [4].
MethodologyGeotechnical analysis method was employed for the survey.
Geotechnical field proceduresGeotechnical analysis is the soil sample testing. A total of
three (3) soil sample were collected from the damaged and undamaged segment of the road. Soil sample for the research work was collected at three location of 0.5m, 1m and 3m respectively, two from the failed and one from the stable segment of the road. Some of the samples were sealed in a polythene bag to preserve the inside moisture condition of the soil and were label A-E.
How to cite this article: Ndanusa HH, AA Rafiu, KA Salako, UD Alhassan, AA Adetona, J Shehu. Geotechnical Investigation on Road Failure of Part of London Road Minna, Nigeria. Eng Technol Open Acc. 2019; 3(1): 555603. DOI: 10.19080/ETOAJ.2019.03.555603
0015
Engineering Technology Open Access Journal
The natural moisture content of the samples that was collected from the field was determined in the laboratory within a period of 24 hours after collection. This was followed by air-drying of the samples by spreading them out on trays in a warm room for four days. Large soil particles (clods) in the samples were broken with a wooden mallet. Care was taken not to crush the individual particles.
Methods of testing soils for engineering purposes was conducted in accordance with B.S. 1377 for all the soil samples and the soils would be compacted at the West African standard. The tests include Natural Moisture Content, Particle Size Analysis, Atterberg limit, Maximum Dry Density, Optimum Moisture Content, Compaction Test and California Bearing Ratio (CBR).
Natural moisture contentMoisture content is defined as the ratio of the weight of
the water in a soil specimen to the dry weight of the specimen. The moisture content of lateritic soil can be influenced by the mineralogy and formation environment.
The maximum dry density for the soil samples varied between 1.81mg/m3 and 2.35mg/m3 while that of optimum moisture content ranged between 7.81% and 14.4%. According Luna & Jadi [5]. the range of values that may be anticipated when using the standard proctor test methods are: for clay, maximum dry density (MDD) may fall before 1.44mg/m3 and 1.685mg/m3 and optimum moisture content (OMC) may fall between 20-30%. For silty clay MDD is usually between 1.6mg/m3 and 1.845mg/m3 and OMC ranged between 15-25%. For sandy clay, MDD usually ranged between 1.76mg/m3 and 2.165mg/m3 and OMC between 8 and 15%.
Dry clean cans of weight (M1) was filled each with a crumbled soil sample and then weighed to give weight (M2). The cans with its content were oven dried at a temperature range between 1050C and 1100C. After drying, the cans were removed from the oven and weighed (M3) as soon as it is cooled enough to handle.
Compaction testThe densification of soil with mechanical equipment thereby
rearranging the soil particles which makes them more closely packed resulting in an increase of the ratio horizontal effective size to the vertical effective stress. The degree of compaction is measured in term of its dry weight and it increases the bearing capacity of road foundation, stability slopes, controls undesirable volume changes and curb undesirable settlement of structures. The mould is filled and compacted with soil in five layers via 25 blows of a 4.5 rammer.
California bearing ratio (CBR)The California bearing ratio (CBR) test is a penetration test
carried out to evaluate the mechanical strength of a sub-base or base course material. It measures the shearing resistance, controlled density and moisture content. Both the soaked and
unsoaked method of CBR was conducted to characterize the lateritic soil for use as a base or sub-base material. A portion of air-dried soil sample was mixed with about 5% of its weight of water. This was put in CBR mould in 3 layers with each layer compacted with 55 blows using 2.5kg hammer at drop of 450mm (standard proctor test). The moisture content of the compacted soil was determined.
Particle size analysisRepresentative sample of approximately 500g was used for
the test after washing and oven dried. The oven dried sample would be put into a set of sieves and base pan with mesh sizes of 2.00, 1.18, 0.850, 0.425, 0.300, 0.150 and 0.075mm; which would be arranged serially with 2.00mm mesh size at the top with the base pan at the bottom. These arranged set of sieves with the dry sample would be put on the automatic sieve shaker pre-set to run for 10 minutes. On the expiration of the time, the individual sieves content would be collected and weighed, and the data obtained would be plotted on the grading curve.
Atterberg limits (liquid limit and plastic limit)
This test determines the clay content in terms of liquid limit, plastic limit, plasticity index and shrinkage potential in order to estimate plasticity, strength and settlement characteristics of the soil sample. For the determination of liquid limit, the soil sample passing through 425μm sieve, weighing 200g was mixed with water to form a thick homogeneous paste. The paste was collected inside the Casangrade’s apparatus cup with a grove created and the number of blows to close it was recorded. Similarly, for plastic limit determination, the soil sample weighing 200g was taken from the material passing the 425μm test sieve and then mixed with water till it became homogenous and plastic to be shaped to ball. The ball of soil would be rolled on a glass plate until the thread cracks at approximately 3 mm diameter. The 3mm diameter sample would be placed in the oven at 105°C to determine the plastic limit.
Results and Discussion
Geotechnical soil analysisThe result of the Atterberg consistency limits are presented
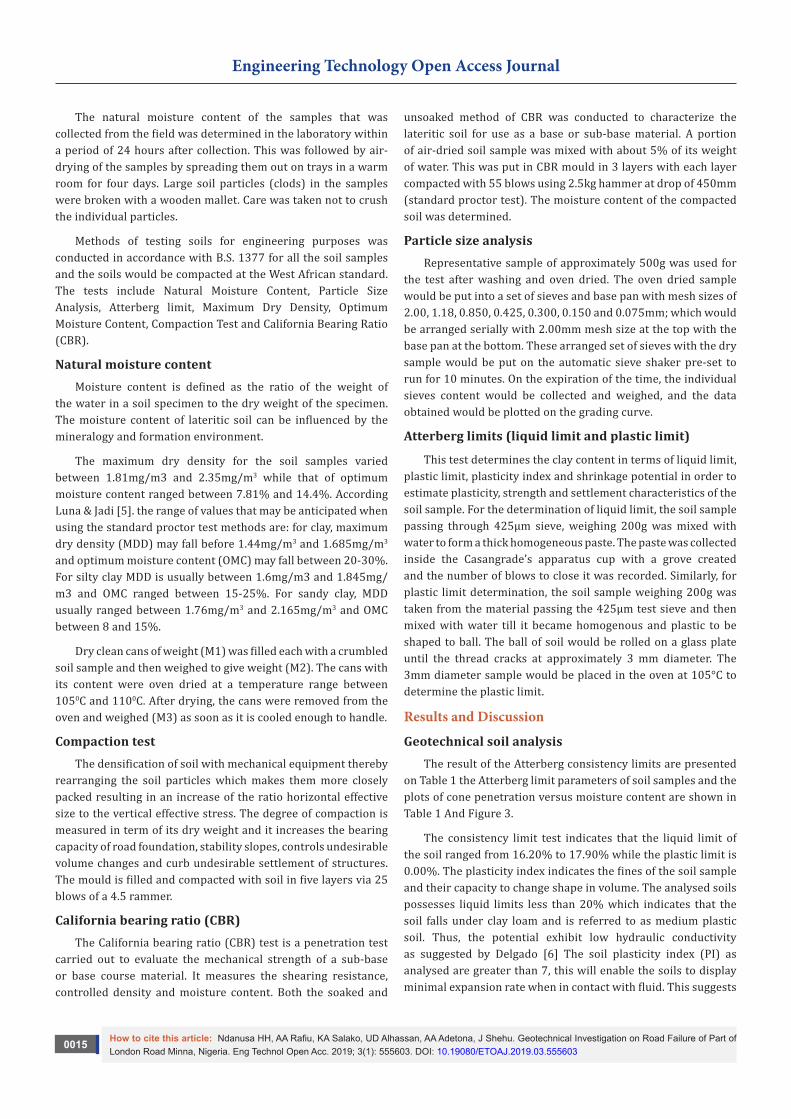
on Table 1 the Atterberg limit parameters of soil samples and the plots of cone penetration versus moisture content are shown in Table 1 And Figure 3.
The consistency limit test indicates that the liquid limit of the soil ranged from 16.20% to 17.90% while the plastic limit is 0.00%. The plasticity index indicates the fines of the soil sample and their capacity to change shape in volume. The analysed soils possesses liquid limits less than 20% which indicates that the soil falls under clay loam and is referred to as medium plastic soil. Thus, the potential exhibit low hydraulic conductivity as suggested by Delgado [6] The soil plasticity index (PI) as analysed are greater than 7, this will enable the soils to display minimal expansion rate when in contact with fluid. This suggests
How to cite this article: Ndanusa HH, AA Rafiu, KA Salako, UD Alhassan, AA Adetona, J Shehu. Geotechnical Investigation on Road Failure of Part of London Road Minna, Nigeria. Eng Technol Open Acc. 2019; 3(1): 555603. DOI: 10.19080/ETOAJ.2019.03.555603
0016
Engineering Technology Open Access Journal
that the possibility of the soil developing strain in response to expansion related stress is minimal. Thus, potential for developing secondary pathway is very low. Furthermore, the PI
of the soil did not exceed 35, which indicates that the soils have low tendencies to display excessive shrinkage Ibitomi [1] (Table 2).
Figure 3: Graph of penetration (mm) against moisture content.
Table 1: Atterberg A1.
Liquid Limit Determination
Liquid Limit Plastic Limit
Trial No. 1 2 3 4 5 1 2
Penetration 9.8 11.6 12.9 18.8 20.4
Wt. Of wet soil + cont. 33 36.5 29.7 32.7 32.9 0 0
Wt. Of dry soil + cont. 32.3 35.8 28.9 31.7 31.4 0 0
Wt. Of cont. 25.7 27.8 23.2 22.2 22.5 0 0
Wt. Of dry soil 6.6 8 5.7 9.5 8.9 0 0
Wt. Of water 0.7 0.7 0.8 1 1.5 0 0
Water content% 10.61 8.75 14.04 10.53 16.85 0 0
Liquid limit 16.2 Average Plastic Limit 0
Table 2: Atterberg A3.
Liquid Limit Determination
Liquid Limit Plastic Limit
Cont. No. 1 2 3 4 5 1 2
Penetration 8.5 10.1 16.1 18.1 20.8
Wt. Of wet soil + cont. 29.6 34.4 33.7 39.5 38.4 0 0
Wt. Of dry soil + cont. 29.2 33.2 31.9 37.4 36.3 0 0
Wt. Of cont. 22.8 22.6 20.4 23.9 23.8 0 0
Wt. Of dry soil 6.4 10.6 11.5 13.5 12.5 0 0
Wt. Of water 0.4 1.2 1.8 2.1 2.1 0 0
Water content% 6.25 11.32 15.65 15.56 16.8 0 0
Liquid limit 16.5 Average Plastic Limit 0
Compaction testThis test method was use find the MDD and OMC of the
soil sample. The standard and modified compaction curves are shown in appendices. The derived curves indicate that the
compaction moisture content and the various compactive efforts give rise to the dry density of the compacted soil. The results summary of the MDD and OMC are contained in Table 3-6 shows a typical compaction parameters and plot of dry density verses
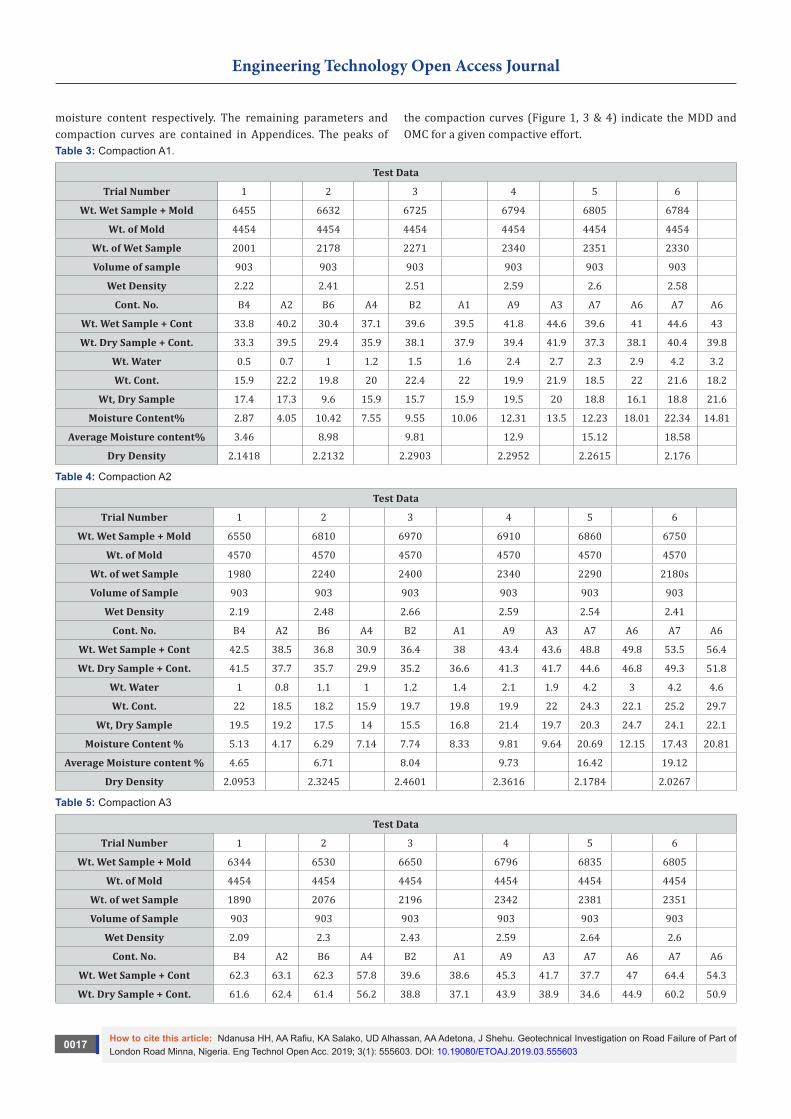
How to cite this article: Ndanusa HH, AA Rafiu, KA Salako, UD Alhassan, AA Adetona, J Shehu. Geotechnical Investigation on Road Failure of Part of London Road Minna, Nigeria. Eng Technol Open Acc. 2019; 3(1): 555603. DOI: 10.19080/ETOAJ.2019.03.555603
0017
Engineering Technology Open Access Journal
moisture content respectively. The remaining parameters and compaction curves are contained in Appendices. The peaks of
the compaction curves (Figure 1, 3 & 4) indicate the MDD and OMC for a given compactive effort.
Table 3: Compaction A1.
Test Data
Trial Number 1 2 3 4 5 6
Wt. Wet Sample + Mold 6455 6632 6725 6794 6805 6784
Wt. of Mold 4454 4454 4454 4454 4454 4454
Wt. of Wet Sample 2001 2178 2271 2340 2351 2330
Volume of sample 903 903 903 903 903 903
Wet Density 2.22 2.41 2.51 2.59 2.6 2.58
Cont. No. B4 A2 B6 A4 B2 A1 A9 A3 A7 A6 A7 A6
Wt. Wet Sample + Cont 33.8 40.2 30.4 37.1 39.6 39.5 41.8 44.6 39.6 41 44.6 43
Wt. Dry Sample + Cont. 33.3 39.5 29.4 35.9 38.1 37.9 39.4 41.9 37.3 38.1 40.4 39.8
Wt. Water 0.5 0.7 1 1.2 1.5 1.6 2.4 2.7 2.3 2.9 4.2 3.2
Wt. Cont. 15.9 22.2 19.8 20 22.4 22 19.9 21.9 18.5 22 21.6 18.2
Wt, Dry Sample 17.4 17.3 9.6 15.9 15.7 15.9 19.5 20 18.8 16.1 18.8 21.6
Moisture Content% 2.87 4.05 10.42 7.55 9.55 10.06 12.31 13.5 12.23 18.01 22.34 14.81
Average Moisture content% 3.46 8.98 9.81 12.9 15.12 18.58
Dry Density 2.1418 2.2132 2.2903 2.2952 2.2615 2.176
Table 4: Compaction A2
Test Data
Trial Number 1 2 3 4 5 6
Wt. Wet Sample + Mold 6550 6810 6970 6910 6860 6750
Wt. of Mold 4570 4570 4570 4570 4570 4570
Wt. of wet Sample 1980 2240 2400 2340 2290 2180s
Volume of Sample 903 903 903 903 903 903
Wet Density 2.19 2.48 2.66 2.59 2.54 2.41
Cont. No. B4 A2 B6 A4 B2 A1 A9 A3 A7 A6 A7 A6
Wt. Wet Sample + Cont 42.5 38.5 36.8 30.9 36.4 38 43.4 43.6 48.8 49.8 53.5 56.4
Wt. Dry Sample + Cont. 41.5 37.7 35.7 29.9 35.2 36.6 41.3 41.7 44.6 46.8 49.3 51.8
Wt. Water 1 0.8 1.1 1 1.2 1.4 2.1 1.9 4.2 3 4.2 4.6
Wt. Cont. 22 18.5 18.2 15.9 19.7 19.8 19.9 22 24.3 22.1 25.2 29.7
Wt, Dry Sample 19.5 19.2 17.5 14 15.5 16.8 21.4 19.7 20.3 24.7 24.1 22.1
Moisture Content % 5.13 4.17 6.29 7.14 7.74 8.33 9.81 9.64 20.69 12.15 17.43 20.81
Average Moisture content % 4.65 6.71 8.04 9.73 16.42 19.12
Dry Density 2.0953 2.3245 2.4601 2.3616 2.1784 2.0267
Table 5: Compaction A3
Test Data
Trial Number 1 2 3 4 5 6
Wt. Wet Sample + Mold 6344 6530 6650 6796 6835 6805
Wt. of Mold 4454 4454 4454 4454 4454 4454
Wt. of wet Sample 1890 2076 2196 2342 2381 2351
Volume of Sample 903 903 903 903 903 903
Wet Density 2.09 2.3 2.43 2.59 2.64 2.6
Cont. No. B4 A2 B6 A4 B2 A1 A9 A3 A7 A6 A7 A6
Wt. Wet Sample + Cont 62.3 63.1 62.3 57.8 39.6 38.6 45.3 41.7 37.7 47 64.4 54.3
Wt. Dry Sample + Cont. 61.6 62.4 61.4 56.2 38.8 37.1 43.9 38.9 34.6 44.9 60.2 50.9
How to cite this article: Ndanusa HH, AA Rafiu, KA Salako, UD Alhassan, AA Adetona, J Shehu. Geotechnical Investigation on Road Failure of Part of London Road Minna, Nigeria. Eng Technol Open Acc. 2019; 3(1): 555603. DOI: 10.19080/ETOAJ.2019.03.555603
0018
Engineering Technology Open Access Journal
Wt. Water 0.7 0.7 0.9 1.6 0.8 1.5 1.4 2.8 3.1 2.1 4.2 3.4
Wt. Cont. 38.2 38 38 37.7 24.6 23.3 24.7 23.3 24.7 24.6 30.6 24
Wt, Dry Sample 23.4 24.4 23.4 18.5 14.2 13.8 19.2 15.6 9.9 20.3 29.6 26.9
Moisture Content % 2.99 2.87 3.85 8.65 5.63 10.87 7.29 17.95 31.31 10.34 14.19 12.64
Average Moisture Content % 2.93 6.25 8.25 12.62 20.83 13.41
Dry Density 2.0334 2.1638 2.2465 2.3029 2.1822 2.2956
Table 6: Sieve A1 Percent by Weigh.
Sieve
Designation CUM. RET % RET.CUM. % Passing
5 1.4 0.47 99.5
3.35 1.9 0.63 98.9
2.36 6.9 2.3 96.6
2 5.1 1.7 94.9
1.18 26.7 8.9 86
0.85 23 7.67 78.3
0.6 39.6 13.2 65.1
0.425 40.9 13.63 51.5
0.3 29.9 9.97 41.5
0.15 36.4 12.13 29.4
0.075 4.7 1.57 27.8
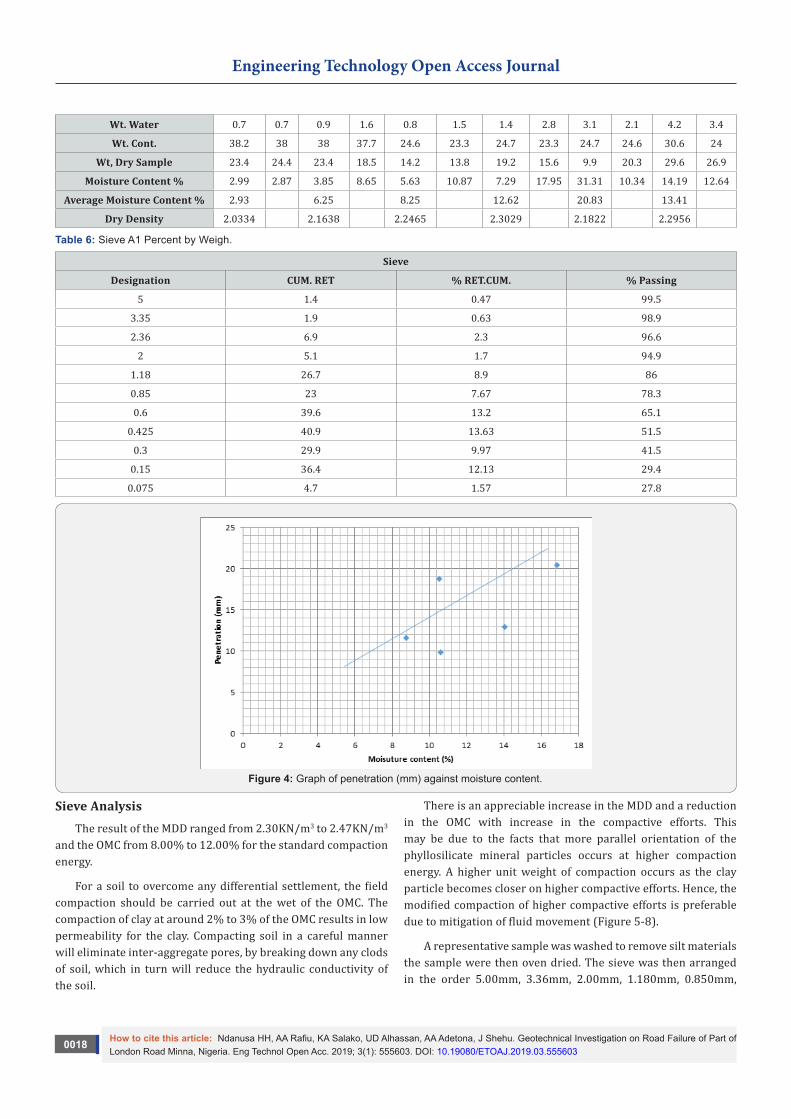
Figure 4: Graph of penetration (mm) against moisture content.
Sieve AnalysisThe result of the MDD ranged from 2.30KN/m3 to 2.47KN/m3
and the OMC from 8.00% to 12.00% for the standard compaction energy.
For a soil to overcome any differential settlement, the field compaction should be carried out at the wet of the OMC. The compaction of clay at around 2% to 3% of the OMC results in low permeability for the clay. Compacting soil in a careful manner will eliminate inter-aggregate pores, by breaking down any clods of soil, which in turn will reduce the hydraulic conductivity of the soil.
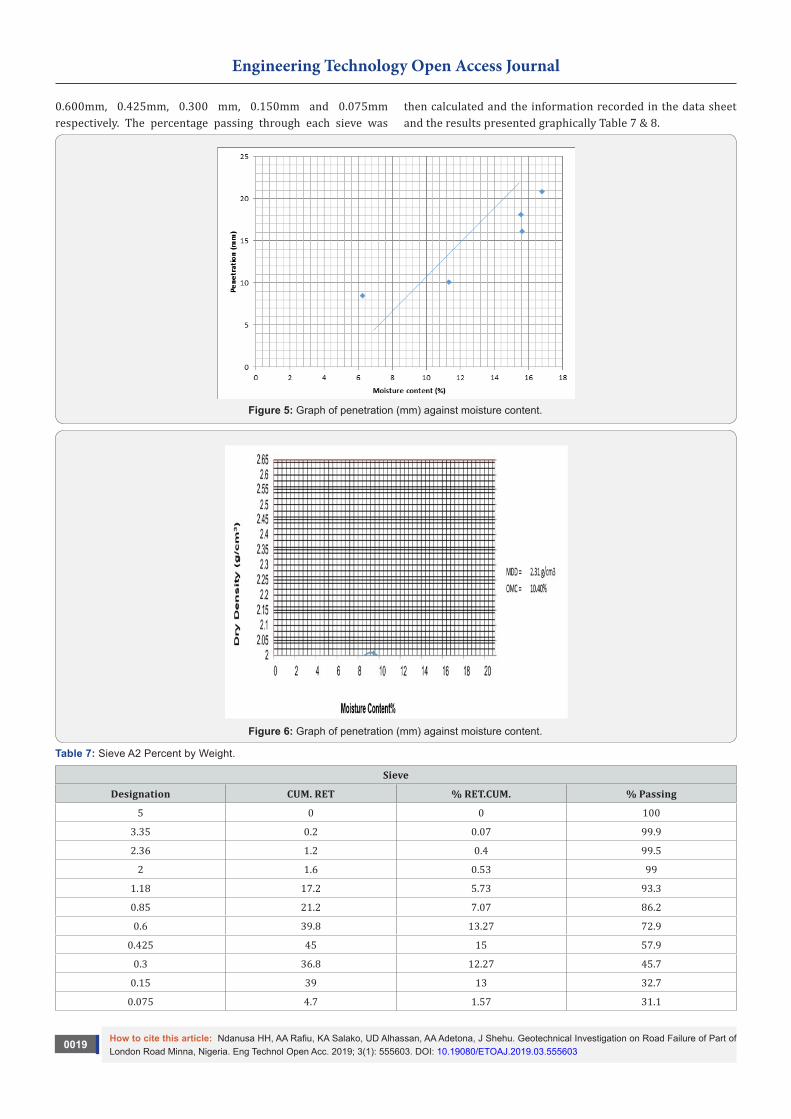
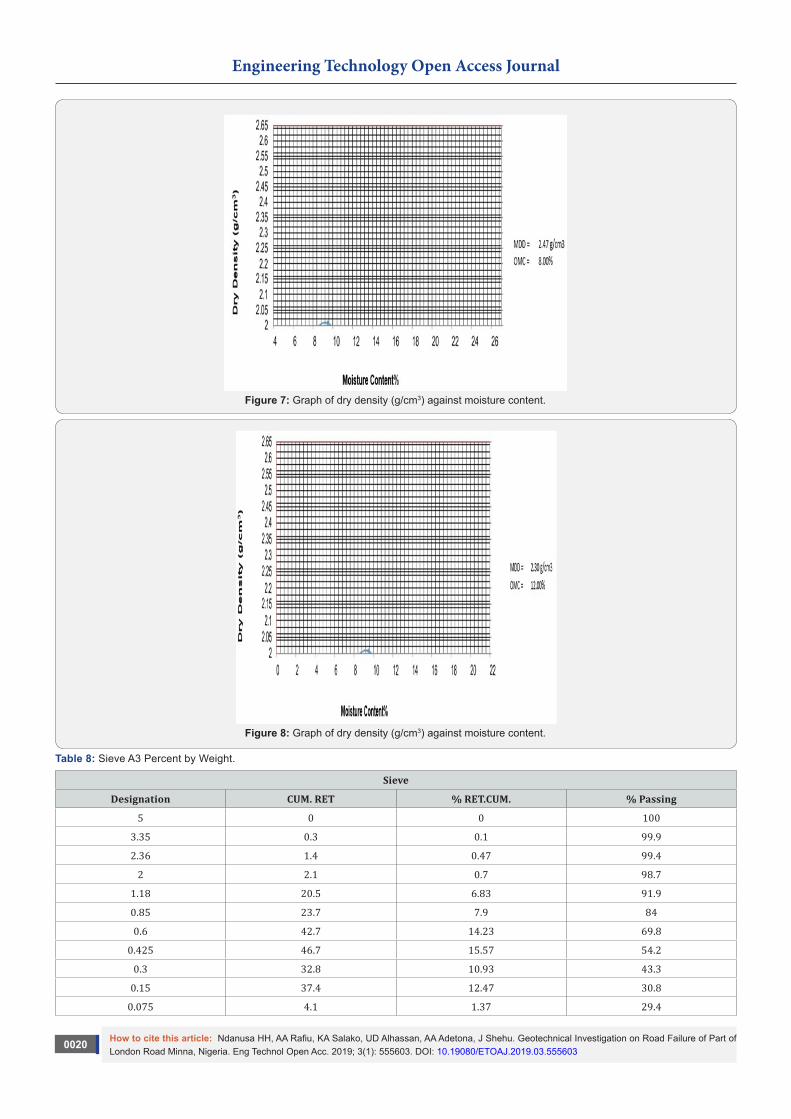
There is an appreciable increase in the MDD and a reduction in the OMC with increase in the compactive efforts. This may be due to the facts that more parallel orientation of the phyllosilicate mineral particles occurs at higher compaction energy. A higher unit weight of compaction occurs as the clay particle becomes closer on higher compactive efforts. Hence, the modified compaction of higher compactive efforts is preferable due to mitigation of fluid movement (Figure 5-8).
A representative sample was washed to remove silt materials the sample were then oven dried. The sieve was then arranged in the order 5.00mm, 3.36mm, 2.00mm, 1.180mm, 0.850mm,
How to cite this article: Ndanusa HH, AA Rafiu, KA Salako, UD Alhassan, AA Adetona, J Shehu. Geotechnical Investigation on Road Failure of Part of London Road Minna, Nigeria. Eng Technol Open Acc. 2019; 3(1): 555603. DOI: 10.19080/ETOAJ.2019.03.555603
0019
Engineering Technology Open Access Journal
0.600mm, 0.425mm, 0.300 mm, 0.150mm and 0.075mm respectively. The percentage passing through each sieve was
then calculated and the information recorded in the data sheet and the results presented graphically Table 7 & 8.
Figure 5: Graph of penetration (mm) against moisture content.
Figure 6: Graph of penetration (mm) against moisture content.
Table 7: Sieve A2 Percent by Weight.
Sieve
Designation CUM. RET % RET.CUM. % Passing
5 0 0 100
3.35 0.2 0.07 99.9
2.36 1.2 0.4 99.5
2 1.6 0.53 99
1.18 17.2 5.73 93.3
0.85 21.2 7.07 86.2
0.6 39.8 13.27 72.9
0.425 45 15 57.9
0.3 36.8 12.27 45.7
0.15 39 13 32.7
0.075 4.7 1.57 31.1
How to cite this article: Ndanusa HH, AA Rafiu, KA Salako, UD Alhassan, AA Adetona, J Shehu. Geotechnical Investigation on Road Failure of Part of London Road Minna, Nigeria. Eng Technol Open Acc. 2019; 3(1): 555603. DOI: 10.19080/ETOAJ.2019.03.555603
0020
Engineering Technology Open Access Journal
Figure 7: Graph of dry density (g/cm3) against moisture content.
Figure 8: Graph of dry density (g/cm3) against moisture content.
Table 8: Sieve A3 Percent by Weight.
Sieve
Designation CUM. RET % RET.CUM. % Passing
5 0 0 100
3.35 0.3 0.1 99.9
2.36 1.4 0.47 99.4
2 2.1 0.7 98.7
1.18 20.5 6.83 91.9
0.85 23.7 7.9 84
0.6 42.7 14.23 69.8
0.425 46.7 15.57 54.2
0.3 32.8 10.93 43.3
0.15 37.4 12.47 30.8
0.075 4.1 1.37 29.4
How to cite this article: Ndanusa HH, AA Rafiu, KA Salako, UD Alhassan, AA Adetona, J Shehu. Geotechnical Investigation on Road Failure of Part of London Road Minna, Nigeria. Eng Technol Open Acc. 2019; 3(1): 555603. DOI: 10.19080/ETOAJ.2019.03.555603
0021
Engineering Technology Open Access Journal
Conclusion
Figure 9: Graph of percentage passing (%) by sieve sizes (mm).
Figure 10: Graph of percentage passing (%) by sieve sizes (mm).
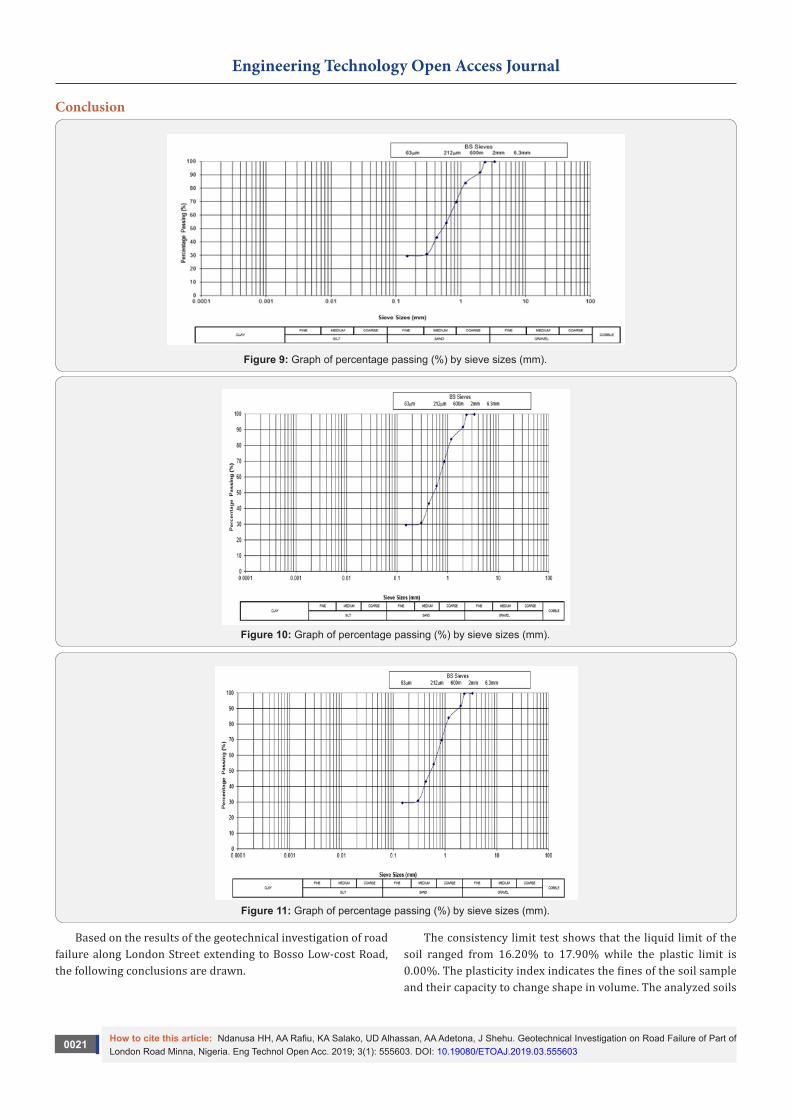
Figure 11: Graph of percentage passing (%) by sieve sizes (mm).
Based on the results of the geotechnical investigation of road failure along London Street extending to Bosso Low-cost Road, the following conclusions are drawn.
The consistency limit test shows that the liquid limit of the soil ranged from 16.20% to 17.90% while the plastic limit is 0.00%. The plasticity index indicates the fines of the soil sample and their capacity to change shape in volume. The analyzed soils

How to cite this article: Ndanusa HH, AA Rafiu, KA Salako, UD Alhassan, AA Adetona, J Shehu. Geotechnical Investigation on Road Failure of Part of London Road Minna, Nigeria. Eng Technol Open Acc. 2019; 3(1): 555603. DOI: 10.19080/ETOAJ.2019.03.555603
0022
Engineering Technology Open Access Journal
possess liquid limits less than 20% which indicates that the soil falls under clay loam. Also, the PI of the soil did not exceed 35, which indicates that the soils have low tendencies to display excessive shrinkage (Figure 8-11).
Based on the 80% minimum CBR, 35% maximum percentage passing sieve 0.075mm, 12% maximum plasticity index and 35% maximum liquid limit required for material to be used as base course material for road as specified by Nigeria General Specification for Road and Bridge Work (1990). In the light of the above it can be concluded that the samples tested do not met all requirements highlighted above. However, the samples cannot be used as base course material for road.
References1. Ibitomi MA, Fatoye FB, Onsachi JM (2014) Geophysical Investigation of
Pavement Failure on a portion of Okene-Lokoja Highway, North Central Nigeria. Journal of Environment and Earth Science 4(13): 44-50.
2. Klimis NS, Margaris BN, Koliopoulos PK (1999) Site-dependent am-plification functions and response spectra in Greece. Journal of Earth-quake Engineering 3(2): 237-270.
3. Soupios PM (2007) Estimation of aquifer hydraulic parameters from surficial geophysical methods: A case study of Keritis Basin in Chania (Crete-Greece). Journal of Hydrology 338(1):122-131.
4. Razzell WE, Trussell PC (1963) Isolation and properties of an iron oxi-dizing Thiobacillus. Journal of bacteriology 85(3): 595-603.
5. Luna R, Jadi H (2000) Determination of dynamic soil properties using geophysical methods. Proceedings of the first international conference on the application of geophysical and methodologies to transportation facilities and infrastructure geophysics.
6. Delgado J, Lopez CC, Giner J, Estevez A, Cuenca A, et al. (2000) Micro-tremors as a geophysical exploration tool: applications and limitations. Pure and applied geophysics 157(9): 1445-1462.
Your next submission with Juniper Publishers will reach you the below assets
• Quality Editorial service• Swift Peer Review• Reprints availability• E-prints Service• Manuscript Podcast for convenient understanding• Global attainment for your research• Manuscript accessibility in different formats
( Pdf, E-pub, Full Text, Audio) • Unceasing customer service
Track the below URL for one-step submission https://juniperpublishers.com/online-submission.php
This work is licensed under Creative
Commons Attribution 4.0 LicenseDOI: 10.19080/ETOAJ.2019.03.555603