Embed Size (px)
Citation preview

28 Geotechnical News March 2011
GEOTECHNICAL INSTRUMENTATION NEWS
The University of Florida
GeotechnicalInstrumentation
for Field Measurements
April 3-5, 2011Doubletree Hotel • Cocoa Beach, Florida
Course Director: John Dunnicliff Lectures by Users of Instrumentation
Lectures and Displays by Manufacturers of Instrumentation
COURSE EMPHASIS: The emphasis is on why and how, and will be updated to include web-based monitoring, wireless monitoring, emerging technologies and online sources of information. Prior to the course, registrants may submit questions and requested discussion topics, and a half day has been assigned for responding to these requests.
WHO: Engineers, geologists, and technicians who are involved with performance monitoring of geotechnical features of civil engineering projects. Project managers and other decision-makers who are concerned with management of RISK during construction.
WHY: To learn the who, why, and how of successful geotechnical monitoring. To meet and discuss with others in the geotechnical instrumentation community.
WHAT: Practical information by leaders of the geotechnical instrumentation community, respresenting both users and manufacturers:
• John Dunnicliff , Consulting Engineer• Martin Beth, Sol Data• Aaron Grosser, Barr Engineering• Daniele Inaudi, Roctest/Smartec• Allen Marr, Geocomp• Justin Nett le, Federal Energy Regulatory Commission• Tony Simmonds, Geokon• Robert Taylor, RST Instruments
For full details visit:www.conferences.dce.ufl .edu/geotech
Geotechnical News March 2011 29
GEOTECHNICAL INSTRUMENTATION NEWS
Geotechnical Instrumentation News
John Dunnicliff
Introduction This is the sixty-fifth episode of GIN. One full article and six one-pagers this time.
Converting Strain Measured in Concrete to Stress This is a topic that has fascinated and puzzled me for a long time. Unlike for steel, the relationship between strain and stress in concrete is by no means straightforward because so many factors, other than stress change, cause strain. I struggled with guidelines when writing the red book (Sections13.3.9 and 13.4.7) but have never felt that they were adequate. Here’s an article by Roberto Acerbis and his colleagues in Italy and Australia, which does a far better job than I did.
Web-based Data Management SoftwareDavid Cook’s article “Fundamentals of Instrumentation Geotechnical Database
Management – Things to Consider” was in the previous GIN (December 2010). As said in my previous column, I sent the article to several firms who supply web-based data management software, inviting each to respond with a one-page “Ours will do this” article. Here are those one-pagers, without any editing by me.
I thought that I’d invited all firms who supply web-based data manage-ment software, but I goofed—others have pointed that out. There’s an ad on page 33 by SolData, whose “GEO-SCOPE” is a fullweb and GIS software hub for geotechnical, structural and en-vironmental real-time data.
Next Instrumentation Course in FloridaDates are now April 3-5, 2011 at Cocoa Beach. Details are on page 28 and on http://conferences.dce.ufl.edu/geotech.
Next International Symposium on Field Measurements in Geomechanics (FMGM)As many of you will know, FMGM symposia are organized every four years, the previous one being in Boston in September 2007. They are “the places to be” for folks in our club. The next FMGM will be in Berlin, Germany on September 12-16, 2011. Information is on www.fmgm2011.org.
ClosurePlease send contributions to this column, or an article for GIN, to me as an e-mail attachment in MSWord, to [email protected], or by mail: Little Leat, Whisselwell, Bovey Tracey, Devon TQ13 9LA, England. Tel. +44-1626-832919.
Wen Lie! (China).
Recommendations for Converting Strain Measured in Concrete to Stress
Roberto Acerbis Harry Asche Guido Barbieri Tiziano Collotta
IntroductionGeotechnical engineering involves uncertainties, arising from simplifications which are necessary
during the design phase, primarily due to limited information about the soil properties and behaviour. It is important to monitor the performance
of structures during the construction phase, to compare the actual loads and stresses with those anticipated during design. For concrete structures,
30 Geotechnical News March 2011
GEOTECHNICAL INSTRUMENTATION NEWS
strain gauges can be installed inside the structure during casting in order to directly record the strain state during different construction phases. From these measurements, stresses and internal forces can then be derived. To obtain reliable estimates of the forces and stresses, one must use correct assumptions about concrete behaviour as well as a proper conversion procedure. The creep behaviour of concrete, shrinkage and hardening should all be considered to avoid macroscopic errors. This is particularly true with regard to concrete structures which undergo loads only a few days after casting, such as temporary supports, tunnel linings or pier foundations. In the following, a conversion procedure aimed to properly simulate concrete behaviour is described and its application to real monitoring cases is presented. We show the effect of each strain contribution and the errors which could result as a consequence of following too simplified a conversion procedure.
General Description of Strain Gauges and Their Installation ProcedureStrain gauges are the most commonly used instruments for measuring strains, and consequently for determination of stresses in concrete structures. As a possible alternative, fibre optic systems have been developing during the last decade. These are able to provide extensive information, but are considerably more expensive than other methods, and hence are usually only used for special applications. A strain gauge measures, by means of a vibrating wire or resistive sensor, the relative displacement between two supports that are fixed to the
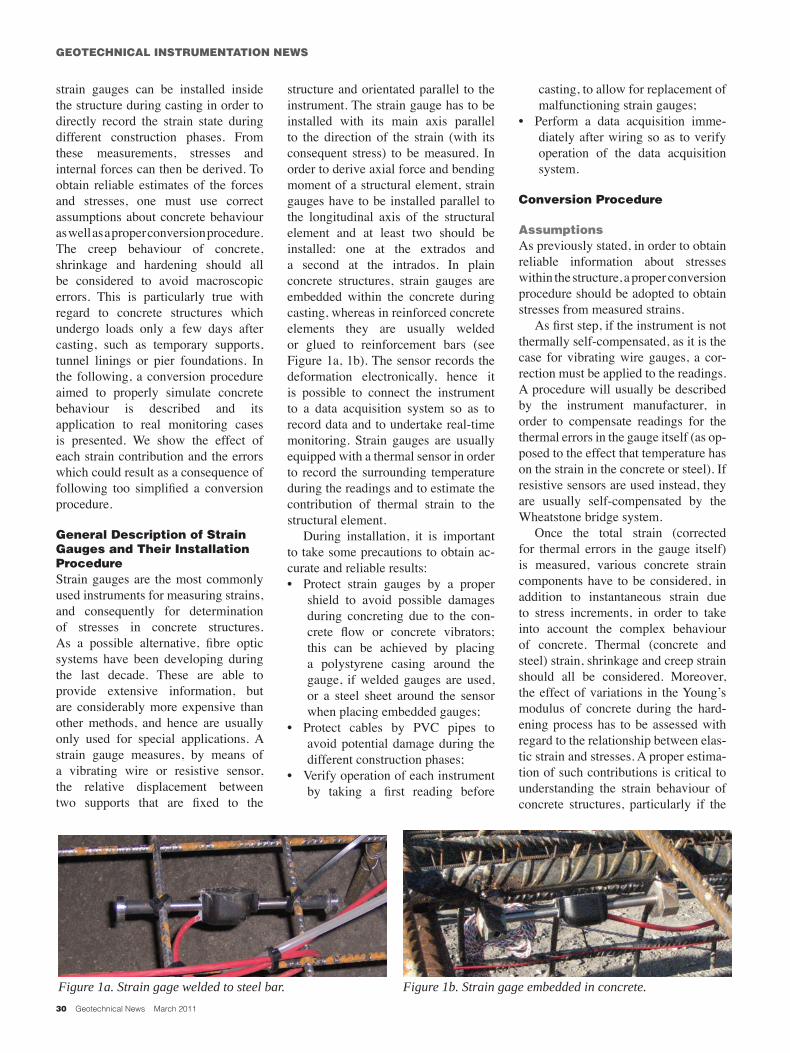
structure and orientated parallel to the instrument. The strain gauge has to be installed with its main axis parallel to the direction of the strain (with its consequent stress) to be measured. In order to derive axial force and bending moment of a structural element, strain gauges have to be installed parallel to the longitudinal axis of the structural element and at least two should be installed: one at the extrados and a second at the intrados. In plain concrete structures, strain gauges are embedded within the concrete during casting, whereas in reinforced concrete elements they are usually welded or glued to reinforcement bars (see Figure 1a, 1b). The sensor records the deformation electronically, hence it is possible to connect the instrument to a data acquisition system so as to record data and to undertake real-time monitoring. Strain gauges are usually equipped with a thermal sensor in order to record the surrounding temperature during the readings and to estimate the contribution of thermal strain to the structural element.
During installation, it is important to take some precautions to obtain ac-curate and reliable results:• Protect strain gauges by a proper
shield to avoid possible damages during concreting due to the con-crete flow or concrete vibrators; this can be achieved by placing a polystyrene casing around the gauge, if welded gauges are used, or a steel sheet around the sensor when placing embedded gauges;
• Protect cables by PVC pipes to avoid potential damage during the different construction phases;
• Verify operation of each instrument by taking a first reading before
casting, to allow for replacement of malfunctioning strain gauges;
• Perform a data acquisition imme-diately after wiring so as to verify operation of the data acquisition system.
Conversion Procedure
AssumptionsAs previously stated, in order to obtain reliable information about stresses within the structure, a proper conversion procedure should be adopted to obtain stresses from measured strains.
As first step, if the instrument is not thermally self-compensated, as it is the case for vibrating wire gauges, a cor-rection must be applied to the readings. A procedure will usually be described by the instrument manufacturer, in order to compensate readings for the thermal errors in the gauge itself (as op-posed to the effect that temperature has on the strain in the concrete or steel). If resistive sensors are used instead, they are usually self-compensated by the Wheatstone bridge system.
Once the total strain (corrected for thermal errors in the gauge itself) is measured, various concrete strain components have to be considered, in addition to instantaneous strain due to stress increments, in order to take into account the complex behaviour of concrete. Thermal (concrete and steel) strain, shrinkage and creep strain should all be considered. Moreover, the effect of variations in the Young’s modulus of concrete during the hard-ening process has to be assessed with regard to the relationship between elas-tic strain and stresses. A proper estima-tion of such contributions is critical to understanding the strain behaviour of concrete structures, particularly if the
Figure 1a. Strain gage welded to steel bar. Figure 1b. Strain gage embedded in concrete.
Geotechnical News March 2011 31
GEOTECHNICAL INSTRUMENTATION NEWS
structure undergoes loading immedi-ately after casting (see Collotta et al [2010]).
In the following, the proposed con-version procedure is described, based on the following assumptions:• There is perfect bonding of the steel
bars to surrounding concrete;• The strain distribution is linear
within the monitored section (ac-cording to traditional beam theory);
• The concrete is linear elastic, but with a tension cut-off (at the aver-age concrete tensile strength);
• The variation of Young’s modulus with time, the creep coefficients and the development of shrinkage strain follows the rules proposed in the CEB-FIB Model Code 1990 (Comité Euro-International du Bé-ton [CEB], 1991);
• The monitored cross-section under-goes axial force and bending mo-ment around an axis orthogonal to the virtual line passing through the two strain gauges.
ProcedureIn the following formulas, subscript “i” means that the quantity is computed at the time of measurement ti. At all times, correcting for the gauge thermal error, the total strain at time ti is εtot,i, being the difference between the measured strain at the gauge and the initial measurement. On the basis of the assumption of a linear strain distribution, the total strain at any given point along the cross-section is derived from the total strain at the two measuring points within the monitored cross-section. Thus the strain can be computed at the extreme fibres of the concrete section as well as at the positions of the reinforcing bars. Assuming perfect bonding, the corrected measured strain is assumed to apply both to the concrete and the steel.
The stress in the steel bars can then be easily derived in each measuring instant by the computed total strain (εs
tot,i), taking into account the thermal contribution:
where Ti and T0 are respectively the measured temperature at instant t0
and instant ti, Es is the steel Young’s modulus (210 GPa) and αs is the steel thermal coefficient.
As for the computation of concrete stress in any given point in the cross-section, a step-by-step procedure has been adopted (see Ghali A. et al [2002]), so as to properly take into ac-count the contribution of shrinkage and creep strains and the effects of Young’s modulus variations over time. Know-ing the corrected total strain at a cer-tain point on the section, from t0 to ti, the concrete stress at the same point in each interval between consecutive measurements is obtained using the following formula, as a function of the total strain at all the previous measur-ing instants:
where εcs,i is the shrinkage strain at instant ti, ϕi,j is the creep coefficient between instants tj and ti and Ec,i is the concrete Young’s modulus at instant ti and Ai-1 is a function of the previous load steps as follows:
The curves of such quantities versus time can be obtained from National codes, Eurocodes or other relevant codes. In this case, we have adopted the suggestions given by CEB-FIP Model Code 1990 (Comité Euro-International du Béton [CEB], 1991).
Having derived the stresses in the reinforcement and in the concrete sec-tion borders for each time of measure-ment, it is possible to verify whether the concrete section cracks. If it does not, i.e. if it is completely compressed or if the maximum computed stress in the concrete is lower than its tensile resistance, the whole concrete section has to be considered in the calcula-tions. Otherwise, the effective concrete section has to be calculated at each in-stant by computing at what height the concrete stress reaches its mean tensile resistance. Then, by integrating the
forces over the effective section, in-ternal actions (axial force and bending moment), can be derived.
Application to Real StructuresThe proposed procedure is applicable in every case where performance monitoring of concrete structures is required. In the following section, the results obtained from two different applications are presented: first, a concrete ring beam support for a shaft excavation; second, the permanent lining of a highway tunnel. Both examples are derived from a large construction site for the development of a new highway route between Bologna and Florence in the central part of Italy.
In the first case, the reinforced con-crete ring beam was cast after excavat-ing down to the ring beam location. Further excavation of the shaft transfers the force to the ring beam. To counter-balance the radial thrust acting all over its circumference, a compressive axial force develops; gauges have been in-stalled to compare the actual values of the axial force to the design assump-tions and to check for unexpected bending moments due to unsymmetri-cal thrusts or geometric imperfections. The ring beam is thus loaded just one or two days after casting, when harden-ing is still taking place.
In the second case (the Buttoli tun-nel), the permanent lining is cast all around the tunnel boundary, usually in two or more pours (first, the invert and, then, the crown) in order to sustain part of the soil pressure in the short-term and all of it in the long-term. Moreover it is designed to protect the tunnel inner space from humidity and possible wa-ter ingress. The gauges have been in-stalled to measure the actual values of axial force and bending moments act-ing on the lining both in the short and in the long term. During tunnelling, the excavation continues immediately after the casting of the concrete and there-fore the initial loading of the concrete occurs just after the casting.
In order to estimate the axial force and possible bending moments in the annular beam, four instrumented sec-tions are provided, each formed by a two strain gauges, located one at the
32 Geotechnical News March 2011
GEOTECHNICAL INSTRUMENTATION NEWS
intrados and one at the extrados in cir-cumferential direction. The four sec-tions are equally spaced around the ring circumference. In order to esti-mate axial force and bending moment in the permanent lining of the Buttoli tunnel, a cross section was provided with five pairs of strain gauges, equally distributed along the lining: a pair for each side, one at the crown and other two intermediate points. The invert was not instrumented. In both the example cases, the strain gauges were welded to steel bars.
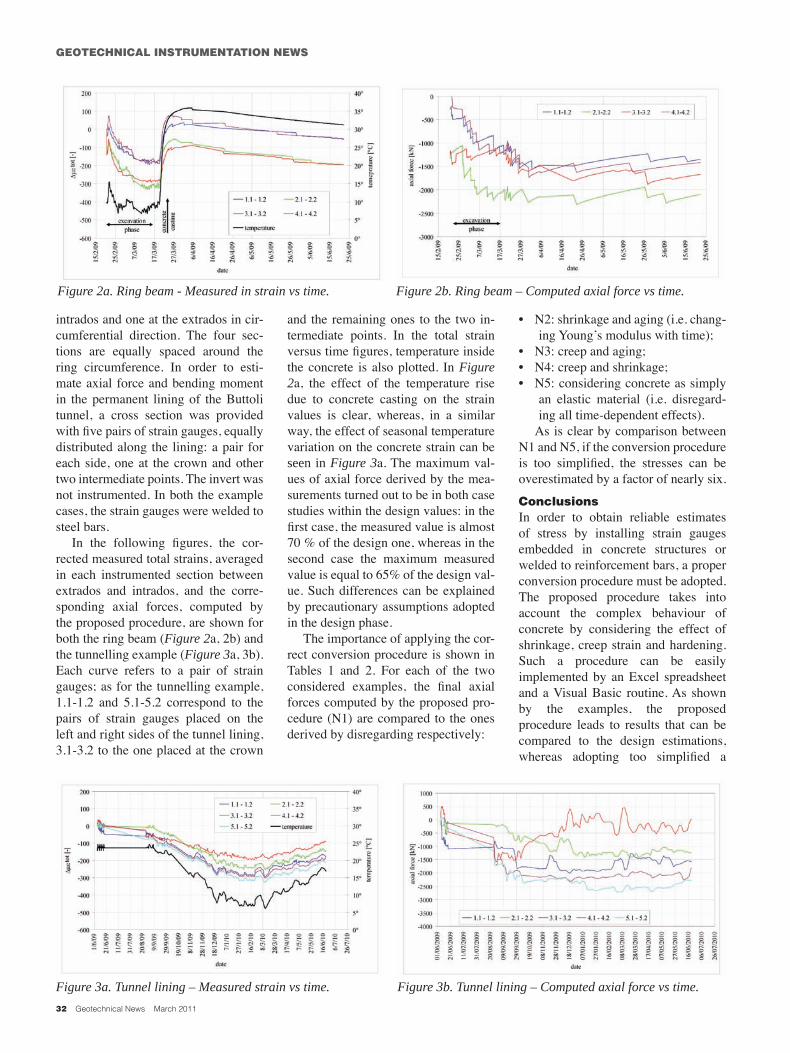
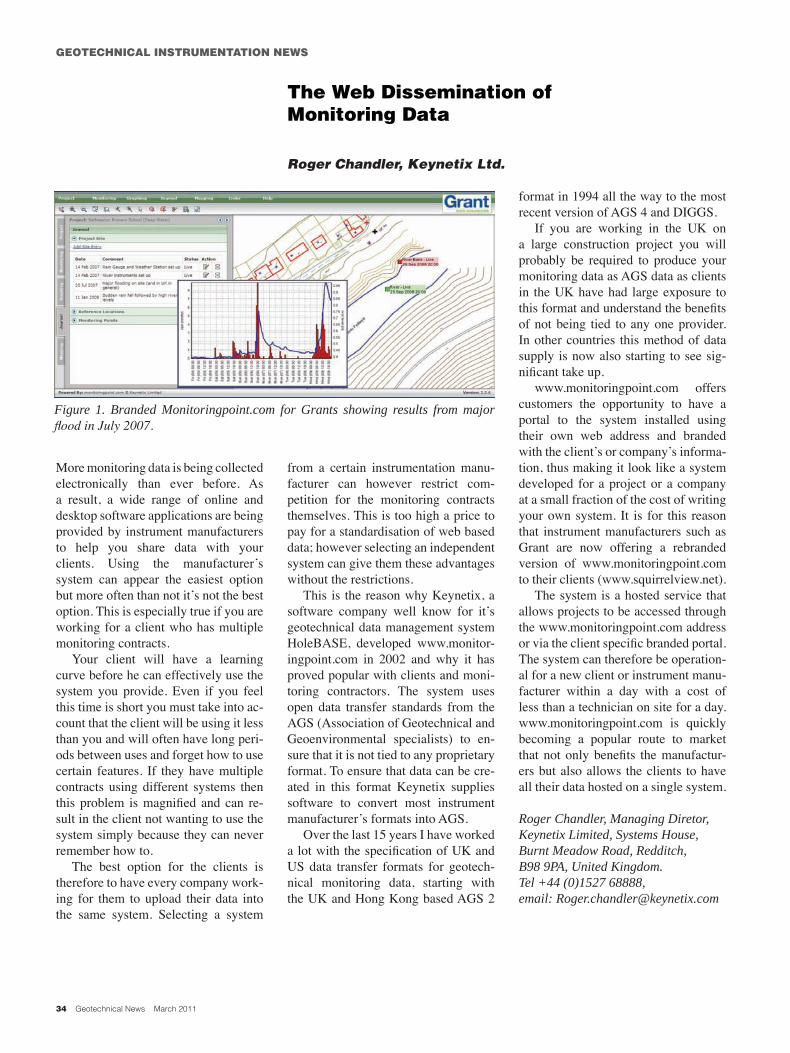
In the following figures, the cor-rected measured total strains, averaged in each instrumented section between extrados and intrados, and the corre-sponding axial forces, computed by the proposed procedure, are shown for both the ring beam (Figure 2a, 2b) and the tunnelling example (Figure 3a, 3b). Each curve refers to a pair of strain gauges; as for the tunnelling example, 1.1-1.2 and 5.1-5.2 correspond to the pairs of strain gauges placed on the left and right sides of the tunnel lining, 3.1-3.2 to the one placed at the crown
and the remaining ones to the two in-termediate points. In the total strain versus time figures, temperature inside the concrete is also plotted. In Figure 2a, the effect of the temperature rise due to concrete casting on the strain values is clear, whereas, in a similar way, the effect of seasonal temperature variation on the concrete strain can be seen in Figure 3a. The maximum val-ues of axial force derived by the mea-surements turned out to be in both case studies within the design values: in the first case, the measured value is almost 70 % of the design one, whereas in the second case the maximum measured value is equal to 65% of the design val-ue. Such differences can be explained by precautionary assumptions adopted in the design phase.
The importance of applying the cor-rect conversion procedure is shown in Tables 1 and 2. For each of the two considered examples, the final axial forces computed by the proposed pro-cedure (N1) are compared to the ones derived by disregarding respectively:
• N2: shrinkage and aging (i.e. chang-ing Young’s modulus with time);
• N3: creep and aging;• N4: creep and shrinkage;• N5: considering concrete as simply
an elastic material (i.e. disregard-ing all time-dependent effects).
As is clear by comparison between N1 and N5, if the conversion procedure is too simplified, the stresses can be overestimated by a factor of nearly six.
ConclusionsIn order to obtain reliable estimates of stress by installing strain gauges embedded in concrete structures or welded to reinforcement bars, a proper conversion procedure must be adopted. The proposed procedure takes into account the complex behaviour of concrete by considering the effect of shrinkage, creep strain and hardening. Such a procedure can be easily implemented by an Excel spreadsheet and a Visual Basic routine. As shown by the examples, the proposed procedure leads to results that can be compared to the design estimations, whereas adopting too simplified a
Figure 2a. Ring beam - Measured in strain vs time. Figure 2b. Ring beam – Computed axial force vs time.
Figure 3a. Tunnel lining – Measured strain vs time. Figure 3b. Tunnel lining – Computed axial force vs time.

Geotechnical News March 2011 33
GEOTECHNICAL INSTRUMENTATION NEWS
procedure which disregards all the effects previously listed can lead to significant overestimation of stresses.
ReferencesT. Collotta, G. Barbieri, M. Mapelli
(2010) “Shotcrete Tunnel Linings with Steel Ribs: Stress Redistribu-tion due to Creep and Shrinkage”, Proc. 3rd Intern. Conf. on Engineer-ing Developments in Shotcrete, New Zealand.
Comité Euro-International du Béton (CEB), 1991. CEB-FIP Model Code 1990. Final Draft, CEB Bul-letin d’Information, N. 203, July 1991, Lausanne.
Ghali, A., Favre, R. & Elbadry, M., 2002. Concrete Structures. Stresses and Deformations, 3rd ed., Spon Press, London & New York.
Roberto Acerbis, Geotechnical Engineer, SPEA SpA, Via G. Vida 11 Milan (Italy), tel. (+39) 02 28007268, [email protected]
Harry Asche. Technical Leader Tunnels, Aurecon, 32 Turbot Street (Locked Bag 331) Brisbane Queensland 4001 Australia, tel. (+61) 7 3173 8808, [email protected]
Guido Barbieri, Head of Geotechnical Monitoring and Engineering Analyses Office, SPEA SpA, Via G. Vida 11 Milan (Italy), tel. (+39) 02 28007466, [email protected]
Tiziano Collotta, Head of Geoengi-neering Department, SPEA SpA, Via G. Vida 11 Milan (Italy), tel. (+39) 02 28007475, email: [email protected]
Table 1. Ring beam - computed axial forcesRing N1
[kN]N2 [kN]
N3 [kN]
N4 [kN]
N5 [kN]
N5/N1 [-]
III 1415 1600 2425 2740 3950 2.8
Table 2. Tunnel lining - computed axial forcesSez.. N1
[kN]N2 [kN]
N3 [kN]
N4 [kN]
N5 [kN]
N5/N1 [-]
1.1-1.2 1650 1985 3290 3645 3645 2.2
2.1-2.2 1240 1580 2170 2585 2585 2.1
3.1-3.2 190 515 580 1095 1095 5.7
4.1-4.2 2100 2440 3830 4155 4155 2.0
5.1-5.2 2530 2865 4634 4925 4925 2.0
DataAcquisitionReal-timemulti-sensoralarms
Open interfaceCompatible with global information management systems
Data managementOpen database, tags & logbook,flexible access
Intuitive interfaceWeb, GIS, 3D, smartphone
Data ImportAny source
Innovation by:
For more information, contact [email protected] visit our website: www.soldatagroup.com
system
Single hub for all your data
Open information
34 Geotechnical News March 2011
GEOTECHNICAL INSTRUMENTATION NEWS
The Web Dissemination of Monitoring Data
Roger Chandler, Keynetix Ltd.
More monitoring data is being collected electronically than ever before. As a result, a wide range of online and desktop software applications are being provided by instrument manufacturers to help you share data with your clients. Using the manufacturer’s system can appear the easiest option but more often than not it’s not the best option. This is especially true if you are working for a client who has multiple monitoring contracts.
Your client will have a learning curve before he can effectively use the system you provide. Even if you feel this time is short you must take into ac-count that the client will be using it less than you and will often have long peri-ods between uses and forget how to use certain features. If they have multiple contracts using different systems then this problem is magnified and can re-sult in the client not wanting to use the system simply because they can never remember how to.
The best option for the clients is therefore to have every company work-ing for them to upload their data into the same system. Selecting a system
from a certain instrumentation manu-facturer can however restrict com-petition for the monitoring contracts themselves. This is too high a price to pay for a standardisation of web based data; however selecting an independent system can give them these advantages without the restrictions.
This is the reason why Keynetix, a software company well know for it’s geotechnical data management system HoleBASE, developed www.monitor-ingpoint.com in 2002 and why it has proved popular with clients and moni-toring contractors. The system uses open data transfer standards from the AGS (Association of Geotechnical and Geoenvironmental specialists) to en-sure that it is not tied to any proprietary format. To ensure that data can be cre-ated in this format Keynetix supplies software to convert most instrument manufacturer’s formats into AGS.
Over the last 15 years I have worked a lot with the specification of UK and US data transfer formats for geotech-nical monitoring data, starting with the UK and Hong Kong based AGS 2
format in 1994 all the way to the most recent version of AGS 4 and DIGGS.
If you are working in the UK on a large construction project you will probably be required to produce your monitoring data as AGS data as clients in the UK have had large exposure to this format and understand the benefits of not being tied to any one provider. In other countries this method of data supply is now also starting to see sig-nificant take up.
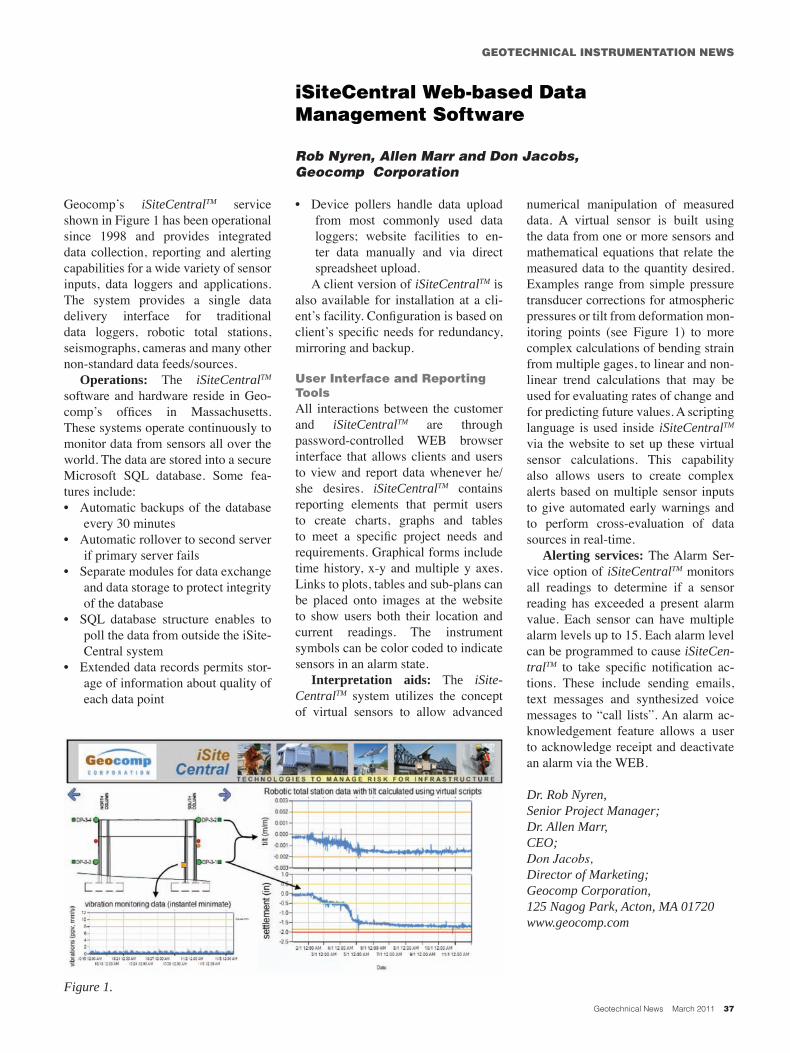
www.monitoringpoint.com offers customers the opportunity to have a portal to the system installed using their own web address and branded with the client’s or company’s informa-tion, thus making it look like a system developed for a project or a company at a small fraction of the cost of writing your own system. It is for this reason that instrument manufacturers such as Grant are now offering a rebranded version of www.monitoringpoint.com to their clients (www.squirrelview.net).
The system is a hosted service that allows projects to be accessed through the www.monitoringpoint.com address or via the client specific branded portal. The system can therefore be operation-al for a new client or instrument manu-facturer within a day with a cost of less than a technician on site for a day. www.monitoringpoint.com is quickly becoming a popular route to market that not only benefits the manufactur-ers but also allows the clients to have all their data hosted on a single system.
Roger Chandler, Managing Diretor, Keynetix Limited, Systems House, Burnt Meadow Road, Redditch, B98 9PA, United Kingdom. Tel +44 (0)1527 68888, email: [email protected]
Figure 1. Branded Monitoringpoint.com for Grants showing results from major flood in July 2007.

Geotechnical News March 2011 35
GEOTECHNICAL INSTRUMENTATION NEWS
INSITE Web Based Data Management Software
Angus Maxwell, Maxwell Geosystems Ltd
Maxwell Geosystems have promoted the wider use of Observational Engineering within construction. Our INSITE systems have enabled projects to shorten the processing time from a few hours down to a few minutes and have encouraged engineers to specify more instrumentation and to rely on the results to give feedback on design. This has enabled them to refine designs and to rely on what the constructions are telling them rather than solely of the factor of safety assumed. These methods have improved safety on site and have lead to real savings in time and money.
Speed and Flexibility
INSITE is designed as a dual layer system to optimize web speed. Raw data is held on local servers and is processed on the fly. Processed data is held on the web in simplified forms to enable superfast download and display. This redundancy means the web data can be recreated at any time. Local INSITE SERVER systems pull data from a variety of sources and check the data for integrity and credibility. Local administrators can use built in procedures to audit the data and quarantine any that may require further review. All changes to the data are time and user stamped. Back ups are automatic and in some situations continuous archiving is required where data volumes are large. The current
record for one project is 25 million records.
Over 30 instrument types are cur-rently supported and new types are added as required. INSITE can be cus-tomized to read structured data from any source visible to the program on lo-cal or wide area networks. This means that if you have a format that you like and it is consistent INSITE can be cus-tomized to read it. INSITE has over 70 pre-defined file based data input for-mats. All major data logger types are supported including most ADMS and vibration systems.
Observational EngineeringInstrumentation data is of limited use if the causes of movement are not clear. INSITE integrates setting out details for construction elements and tracks their progress along with other parameters Figure 1. These may be manually entered or drawn from construction logger such as tunnel boring machines. With our optional INSITE TDMS a full suite of construction progress and programme data is fully integrated into the software.
All data is displayed in our own custom GIS environment in both map (XY) and sectional (Chainage, level) views. All views allow full dynamic zooming and easy addition of new layers. The data can also be displayed in Google Earth and displayed as 3D views (contours surfaces) and even animated.
To aid the preparation of reports we have included binders both on the local side and web side to enable automatic production of reports to Excel and PDF.
INSITE Servers send alarms as emails and SMS messages. These are handled by our portal AAA blog which tracks responses. All our web portals are accessible by smart phones to en-able responses to alarms to be made on the fly.
Powerful Analysis OptionsINSITE is the first monitoring package to offer a dynamic alarm facility in which alarms can be linked to progress, proximity and prediction. This scheme enables actions to be taken ahead of time so that rather than requiring movements to be reversed they can be slowed to bring the construction back into the target zone. INSITE also includes the facility to group instruments into combinations so that a secondary parameter can be defined.
Tested on the Largest ProjectsINSITE has been used in Hong Kong, Australia and Singapore. Projects have included embankments on soft clay, deep excavations, soft rock NATM tunnels and on a variety of TBM and Drill and Blast tunnels. INSITE is currently monitoring SE Asia’s two largest projects: the Express Rail Link in Hong Kong (HK$67 billion) and the Airport Link in Brisbane (A$5.6 billion).
Dr Angus Maxwell, Director, Maxwell Geosystems Ltd. 1701-1702 Bonham Strand Trade Centre, 135 Bonham Strand, Sheung Wan, Hong Kong Tel +(852) 2581-2288, Direct +(852) 2987-6101, Fax +(852) 2987-2700 [email protected],
Figure 2. Animation helps bring out re-lationships in data.
Figure 1. Construction and instrument data in one environment.

36 Geotechnical News March 2011
GEOTECHNICAL INSTRUMENTATION NEWS
MultiLogger Suite Web-based Data Management
Alex Neuwirt, Canary Systems, Inc.
MultiLogger SoftwareWe've been hard at work for over 13 years now to develop software tools to help our customers in the Geotechnical Engineering discipline manage their collection systems and data. Our software can be described as a “hybrid” system, it consists of Windows® based workstation tools for automatically collecting data, populating a SQL database, configuring the project interface including notifications and outputs, and a web component for viewing the project including alarm status, creating any of the numerous outputs or data presentations, and entering data from the field.
Data ImportData can be imported automatically or manually from virtually any source, either through the built-in automation (which includes automated program generation) for Campbell Scientific controllers, use of “import folders” for data from other data collectors or manual data entry. Data are validated based on tolerance criteria, this helps avoid alarms based on incorrectly collected or entered data.
AlarmsFour basic types of alarms are supported, calculations to include one or more data or calculated elements can also be configured with alarms for virtually unlimited alarm configuration. For example, the calculation engine includes aggregate and historical functions to reduce data and alarm based on time periods or other criteria.
NotificationsFive types of notifications are supported, alarms being just one type. Other notifications include scheduling electronic delivery of outputs, when new data are available, when specific data elements miss their update interval and when a specific group of data elements miss their update interval.
OutputsEight types of data outputs for data or calculations are supported including; Quick Report (columnar reports), Quick Chart (time series charting), Spreadsheet (Excel® worksheets), Instrument Report (statistical reporting), Element Chart (series of multiple elements, e.g. in-place inclinometer), Wind Rose (wind speed and direction), Event Chart (event data captures, e.g. seismic data) and Inclinometer (standard inclinometer surveys). Each output can be extensively configured.
Integrated Web InterfaceAll of these features are integrated into an intuitive password-protected user interface built on the idea of graphic views of your project and interactive icon placement based on location of instruments. Documents can even be saved into the database and associated with instrument icons to provide for storing information such as calibrations, installation photos or other reference materials associated with the instrumentation. This interface has proven to be an efficient and easy-
to-use interface for experts and novices alike.
SummaryWe’ve worked hard to integrate all aspects of geotechnical data collection (whether automated or manual systems) and management into a single, easy-to-use, yet powerful software system with Web interface. This allows personnel responsible for data management and reporting of their projects to focus their time and energy on the information that the instrumentation is intended to provide, not on managing the hardware and software systems. Ultimately this provides for maximizing the value of the instrumentation program and hopefully providing a safer and more meaningful work environment, and thanks to the Internet, one that is always close at hand!
Alex Neuwirt, President, Canary Systems, Inc., 75 Newport Road, Suite 201, New London, NH 03257 USA, Phone: (603) 526-9800, email: [email protected]
Figure 1. Sample project view with event and inclinometer outputs shown.
Geotechnical News March 2011 37
GEOTECHNICAL INSTRUMENTATION NEWS
iSiteCentral Web-based Data Management Software
Rob Nyren, Allen Marr and Don Jacobs, Geocomp Corporation
Geocomp’s iSiteCentralTM service shown in Figure 1 has been operational since 1998 and provides integrated data collection, reporting and alerting capabilities for a wide variety of sensor inputs, data loggers and applications. The system provides a single data delivery interface for traditional data loggers, robotic total stations, seismographs, cameras and many other non-standard data feeds/sources.
Operations: The iSiteCentralTM software and hardware reside in Geo-comp’s offices in Massachusetts. These systems operate continuously to monitor data from sensors all over the world. The data are stored into a secure Microsoft SQL database. Some fea-tures include:• Automatic backups of the database
every 30 minutes• Automatic rollover to second server
if primary server fails• Separate modules for data exchange
and data storage to protect integrity of the database
• SQL database structure enables to poll the data from outside the iSite-Central system
• Extended data records permits stor-age of information about quality of each data point
• Device pollers handle data upload from most commonly used data loggers; website facilities to en-ter data manually and via direct spreadsheet upload.
A client version of iSiteCentralTM is also available for installation at a cli-ent’s facility. Configuration is based on client’s specific needs for redundancy, mirroring and backup.
User Interface and Reporting ToolsAll interactions between the customer and iSiteCentralTM are through password-controlled WEB browser interface that allows clients and users to view and report data whenever he/she desires. iSiteCentralTM contains reporting elements that permit users to create charts, graphs and tables to meet a specific project needs and requirements. Graphical forms include time history, x-y and multiple y axes. Links to plots, tables and sub-plans can be placed onto images at the website to show users both their location and current readings. The instrument symbols can be color coded to indicate sensors in an alarm state.
Interpretation aids: The iSite-CentralTM system utilizes the concept of virtual sensors to allow advanced
numerical manipulation of measured data. A virtual sensor is built using the data from one or more sensors and mathematical equations that relate the measured data to the quantity desired. Examples range from simple pressure transducer corrections for atmospheric pressures or tilt from deformation mon-itoring points (see Figure 1) to more complex calculations of bending strain from multiple gages, to linear and non-linear trend calculations that may be used for evaluating rates of change and for predicting future values. A scripting language is used inside iSiteCentralTM via the website to set up these virtual sensor calculations. This capability also allows users to create complex alerts based on multiple sensor inputs to give automated early warnings and to perform cross-evaluation of data sources in real-time.
Alerting services: The Alarm Ser-vice option of iSiteCentralTM monitors all readings to determine if a sensor reading has exceeded a present alarm value. Each sensor can have multiple alarm levels up to 15. Each alarm level can be programmed to cause iSiteCen-tralTM to take specific notification ac-tions. These include sending emails, text messages and synthesized voice messages to “call lists”. An alarm ac-knowledgement feature allows a user to acknowledge receipt and deactivate an alarm via the WEB.
Dr. Rob Nyren, Senior Project Manager; Dr. Allen Marr, CEO; Don Jacobs, Director of Marketing; Geocomp Corporation, 125 Nagog Park, Acton, MA 01720 www.geocomp.com
Figure 1.
38 Geotechnical News March 2011
GEOTECHNICAL INSTRUMENTATION NEWS
Web-based Data Management Software
Andres Thorarinsson, Vista Data Vision (VDV)
VDV is a comprehensive data handling software for geotechnical projects of any size. Includes data visualization, alarming, real-time displaying, reporting and web access to all data. Run VDV on your own PC for Internal Data Service, and as a Web Service for your staff and clients. VDV has been developed and used since 1991. New VDV version 2011 in Q2.
Data loggers supported: Camp-bell’s Scientific Data Loggers, Geo-kon’s Data Loggers (both via Logger-Net or MultiLogger), other data logger
via VDV’s File Converter and vendor’s Call Engine. Supports Total Stations. Largest system known: 250 data log-gers and 5k tags. Response time: 1-2 second average response time to PC Query or Web Query.
Data Interface: Display data as Time series, Displacement graphs, Rate-of-Change, XY-Graphs, Intensity Plots, Histogram, Data Table, “Wind” Rose for any data. Combine data from several locations into single overview. Easy-to-use interface, choose pen colors, thickness, background color,
auto and manual Y-scales, linear or log time axis.
Data Handling: Built-in fully li-censed MySQL data base capable of storing years of data from hundreds of projects. Alarms in 4 levels with sound/color/email. Validation. Virtual Variables for calculated results. Ex-port of data for Excel. Run your own SQL queries. Reports with tables and graphs. Very fast response time unaf-fected by size of Data Base.
Web Service: VDV is ready to run Web Service right out of the box, no programming, only needs fixed IP number from a Service Provider. Use VDV as SCADA monitoring and/or as a research tool. Customize web lay-out. Navigate all graphs. Acknowledge Alarms. Write Notes about sensors and locations. Add Web Cams and Photos to any Project. Manual Input of data. Modify data. Support to Smart phones. Choose language of web service.
Real-time Handling: See latest data on maps in layers with navigation buttons and any picture or artwork as background. Display data as number, cluster of numbers or graphs. Show alarm status by background color. Sup-port Google maps. Easy-to-use inter-face.
Download fully working version of VDV or participate in web-seminar to learn more.
References: Seattle Department of Transportation, USA; Tsankov Kamak Dam, Bulgaria; Linha 4 Metro, Brazil; US Army Corps of Engineers, USA, Ingula Pump Station/Dam project, South Africa; Desert Research Insti-tute, USA.
Andres Thorarinsson, CEO of Vista Engineering and Vista Data Vision, [email protected], www.vistadatavision.com, http://demo.vistadatavision.com
Geotechnical News March 2011 39
GEOTECHNICAL INSTRUMENTATION NEWS
ARGUS Web-based Data Management Software
Hai-Tien Yu, ITM-Soil
Product Overview ARGUS is named after ‘Argus Panoptes’ a giant in Greek mythology. He was famous in legend for having 100 eyes that made him a perfect watchman. ARGUS was originally developed in 2004 by Interfels in Germany, becoming an ITM-Soil product when ITM-Soil acquired Interfels in 2007.
ARGUS has been developed for the open-source LAMP system (Linux, Apache, MySQL & PHP). It is 100% web-based software. Users interact with ARGUS using industry standard web-browsers, there is no need to in-stall any software or plug-ins on their PC. Working with ARGUS is platform-independent and can be accomplished in a local network or over the Internet from any location in the world. Multi-ple users can access the system simul-taneously. There is no license to pay for each user.
Since its introduction, ARGUS has been used in many small as well as major projects around the world with a well proven track record including a number of underground projects in-cluding the Crossrail project in London and several Subway projects in New York.
ARGUS is under constant develop-ment to satisfy new user requirements
including GIS (Geographical Informa-tion System) functionalities, construc-tion progress information management and is compliant to AGS (The Associa-tion of Geotechnical and Geoenviron-mental Specialists) data format.
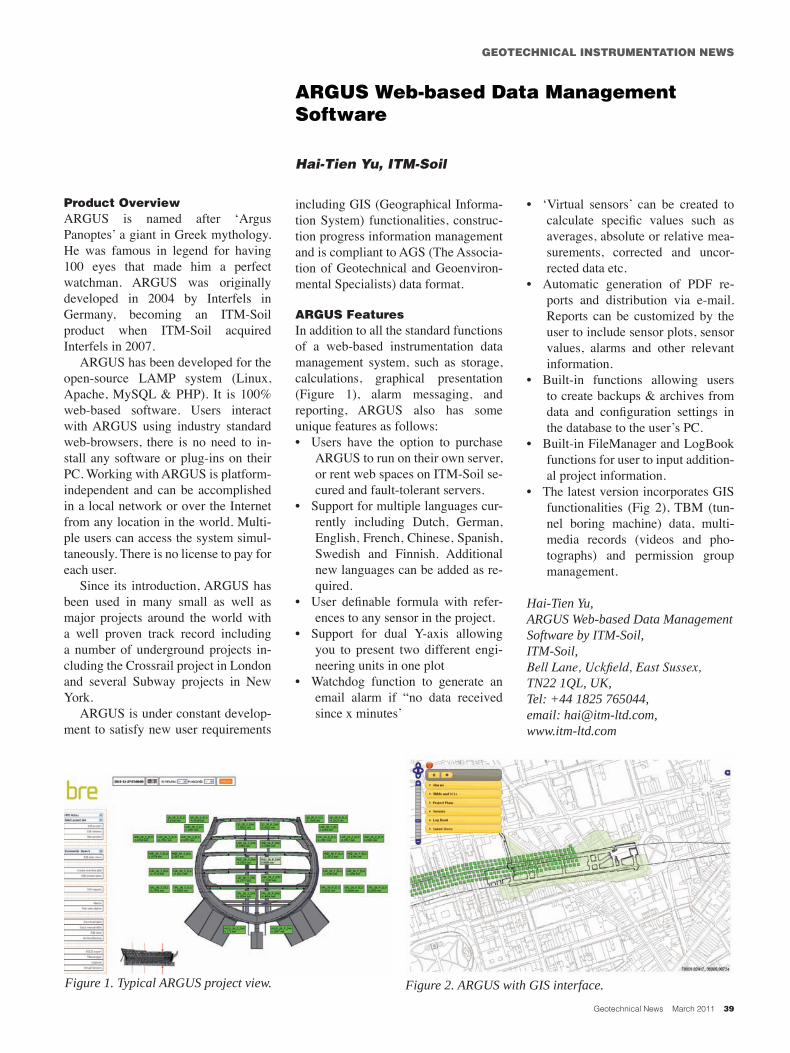
ARGUS FeaturesIn addition to all the standard functions of a web-based instrumentation data management system, such as storage, calculations, graphical presentation (Figure 1), alarm messaging, and reporting, ARGUS also has some unique features as follows:• Users have the option to purchase
ARGUS to run on their own server, or rent web spaces on ITM-Soil se-cured and fault-tolerant servers.
• Support for multiple languages cur-rently including Dutch, German, English, French, Chinese, Spanish, Swedish and Finnish. Additional new languages can be added as re-quired.
• User definable formula with refer-ences to any sensor in the project.
• Support for dual Y-axis allowing you to present two different engi-neering units in one plot
• Watchdog function to generate an email alarm if “no data received since x minutes’
• ‘Virtual sensors’ can be created to calculate specific values such as averages, absolute or relative mea-surements, corrected and uncor-rected data etc.
• Automatic generation of PDF re-ports and distribution via e-mail. Reports can be customized by the user to include sensor plots, sensor values, alarms and other relevant information.
• Built-in functions allowing users to create backups & archives from data and configuration settings in the database to the user’s PC.
• Built-in FileManager and LogBook functions for user to input addition-al project information.
• The latest version incorporates GIS functionalities (Fig 2), TBM (tun-nel boring machine) data, multi-media records (videos and pho-tographs) and permission group management.
Hai-Tien Yu, ARGUS Web-based Data Management Software by ITM-Soil, ITM-Soil, Bell Lane, Uckfield, East Sussex, TN22 1QL, UK, Tel: +44 1825 765044, email: [email protected], www.itm-ltd.com
Figure 1. Typical ARGUS project view. Figure 2. ARGUS with GIS interface.

40 Geotechnical News March 2011
GEOTECHNICAL INSTRUMENTATION NEWS
GeoViewer™ Web-based Data Management Software
Rob Taylor, RST Instruments Ltd
Introduction GeoViewer is a data viewer originally developed in 2000 to provide flexible console viewing of large data sets from ADAS (automatic data acquisition systems). The program runs on Windows™.
Data SourceMuch GeoViewer data originates in data loggers which transmit their data by various logger-specific means to files which are locally or remotely accessible to the GeoViewer server. Because of this file model, any file with a public format which contains time-stamped data may be presented in GeoViewer: spreadsheets, databases, comma-separated text files, GPS and total station data, public weather data etc.
Data StorageRST suggests that all stored data be as raw as possible, e.g. vibrating wire sensors should be stored in “B units”, and that data from multiple sources should be kept separately in original, maximally readable format. In the case of logger data which is constantly appended to a file this is by far the simplest and most reliable approach. Standard file server backup strategies are used.
Historically, such an approach might have strained the resources of avail-able computers, but as time passes, the power of reasonably-priced servers has increased to the point that a server with 200 loggers communicating by dozens of paths, 6,000 sensors, years of hourly data, and dozens of simultaneous web access users gives excellent perfor-mance. At the same time, all data is in a format that can be checked against manual readout data and sample cali-brated with text file and spreadsheet tools.
Calibration and ComputationWith all data storage in raw format, calibration is typically performed on-the-fly using a calibration database. Numerous functions are available: linear, polynomial, transcendental, relational across the entire system (not just within a logger).
Deferred calibration is a powerful maintenance tool: if the calibration of a sensor is found to be incorrect, the appropriate calibration page is edited, and the entire record is automatically updated from the first reading.
Data PresentationData presentation is typically as views which are designed for efficient use. They may be:• mimic views with stoplight (green/
yellow/red/blue/grey for ok/warn-ing/alarm/alarm-off/stale data) but-tons which “drill down” into other views
• lists with stoplight coloured numer-ic fields
• time series plots with one or more channels with alarm levels, differ-ent sampling rates
• exaggerated profiles for inclinom-eters, tilt beam etc
• linked files: installation photos, log-ger programs, calibrations, notes, all one mouse click away from the data
Alarm FunctionsFull featured alarms are available for all channels, calculations from channels, communication status etc. The alarms include high/low warn and alarm levels, hysteresis, event triggers, alarm levels computed from data, device outputs, privilege alarm mask. It is suggested that not every channel be alarmed and alarms be implemented incrementally to minimize nuisance alarms.
Data ArchiveWith the low cost of data storage, archiving may be at job end only, even for the largest construction projects. For permanent installations where data goes on indefinitely, relocating (but retaining) older data may be useful to keep records manageable. Resampling older data may be used to decimate the size of on-line records, e.g. weekly min/max instead of hourly data divides quantity by 84, but permits historical context to be on-screen.
Web FunctionalityGeoViewer utilizes Internet communications in numerous ways. Data acquisition may use wired or wireless web communication as a link in a communications chain, local and wide area networks may be used to access data files outside the GeoViewer server, back-up may use offsite resources.
End users may view data securely by remote computer or mobile device, and receive alarms by e-mail, text mes-sages etc. Privileged users can maintain the system from offsite, typically by VPN (virtual private network) remote access. Because of the limited screen size of mobile devices, mobile-friendly views are typically required, with large buttons and reduced clutter.
Business ModelGeoViewer is typically sold as a purchase/annual maintenance product; i.e. the customer owns the product and runs it on his or her server. The purchase cost is based on number of servers running (typically one), and the number of simultaneous advanced viewers. On-and off-site training and assistance are available.
Rob Taylor, President, RST Instruments Ltd., 200-2050 Hartley Drive, Coquitlam, BC, V3K 6W5 Canada, 604-540-1100, [email protected].

Geotechnical News March 2011 41
GEOTECHNICAL INSTRUMENTATION NEWS

42 Geotechnical News March 2011
GEOTECHNICAL INSTRUMENTATION NEWS
Vista Data VisionDownload a Free Evaluation Versionvisit our website www.vistadatavision.com
New VDV version 2011Offering Web Service and Access Control out of the box. Loaded with important features to run Automatic Data Management System for Field Measurements including comprehensive Visualization, Displacement Graphs, Web Maps, Alarms and Reports. Rock Solid and Proven software application for Geotechnical Projects.
Since 1991 · www.vistadatavision.com,
Vista Engineering · Hofdabakki 9c · 110 Reykjavik · Iceland · Tel: +354 587 8889 · Fax: +354 567 3995 · Email: [email protected]