Embed Size (px)
Citation preview

Offices Covering all USA
GEOTECHNICAL ENGINEERING LIBRARY
GEOTILL
USA
Phone 317-449-0033 Fax 317- 285-0609
Toll Free: 844-GEOTILL
Geotechnical, Environmental and Construction Materials Testing Professionals
www.geotill.com
GEOTILL Inc. Geotechnical Engineering• Subsurface Exploration• Environmental Services• Construction Testing and Material Engineering

Final Report
Cone Penetration Testing for Evaluating Bridge Pile Response
Submitted to
Georgia Department of Transportation
Geotechnical Bureau Office of Materials & Research
Forest Park, GA
GDOT Research Project 2021 GTRC No. E-20-H71
Prepared by In-Situ Research Group
Geosystems Engineering Georgia Tech Research Corporation
Civil & Environmental Engineering Georgia Institute of Technology
May 12, 2003

Page 1 - Final Report - In-Situ Cone Penetration Testing for Evaluating Bridge Pile Response
May 12, 2003 Tom Scruggs Office of Materials & Research Geotechnical Bureau Georgia Department of Transportation 15 Kennedy Drive Forest Park, GA 30297-2599 Re: Final Report for GDOT Research Project 2021 Georgia Tech Research Corporation Project No. E20-H71 Evaluating Axial Pile Response of Highway Bridges by Cone Penetration Tests Dear Mr. Scruggs,
Per the Task Order No. 97-34 between GDOT and GTRC issued on May 15, 2002, we have prepared this draft report for our CPT project on axial pile performance. Thank you for this opportunity to work with yourself, Steve Pahno, and Gene Burden on this project.
Sincerely
Paul W. Mayne, PhD, P.E. Professor - Geosystems Program School of Civil & Environmental Engineering Georgia Institute of Technology 790 Atlantic Drive, Room 241 Atlanta, GA 30332-0355 Email: [email protected] Phone: 404-894-6226 and fax-2281 http://www.ce.gatech.edu/~geosys cc: Rick Deaver, GDOT Research Supriya Kamatkar, GDOT Research Thelma Woods, GT ReACTT 0420 Steve Valdez-Pahno, GDOT Materials

Page 2 - Final Report - In-Situ Cone Penetration Testing for Evaluating Bridge Pile Response
PURPOSE OF STUDY
The objectives of this study were to explore the prospects of using cone penetration tests (CPT) for evaluating the axial response of driven and drilled pile foundations at bridge sites in Georgia. Test sites were selected either where the results of full-scale pile foundation load tests either had already been conducted or were originally planned by GDOT as part of their normal construction & design process. In general, at these test locations, a field testing crew from GT visited these locations and obtained CPT data for use in analyses of the load tests. The sites were located either within the residual soil/rock formations of the Piedmont Geologic Province or the sedimentary soil deposits of the Atlantic Coastal Plain of Georgia
Figure 1. Primary Geologic Units in Georgia: http://www.gly.uga.edu/GAGeology.html#PM
INTRODUCTION
A proper geotechnical characterization of soil formations is necessary in order to select the appropriate foundation system for highway bridges on interstates and state roads in Georgia. The analysis of pile foundation systems general addresses the following: (1) ultimate (and factored) capacities; (2) static axial, lateral, and moment loading; (3) deflection analysis of movements; (4) group interaction effects; (5) cyclic and transient dynamic loading cases, (6) material & installation costs, as well as considerations of scour, ship impact, pile freeze, driveability, and other facets. Soils are very complex natural materials which exhibit anisotropic and preconsolidated states of stress and nonlinear stress-strain-strength-flow characteristics. Therefore, a suite of geotechnical parameters should be assessed to provide sufficient information for the proper numerical or analytical modeling of drilled shafts and/or driven piles in groups under loading. Cone penetration testing is performed using an instrumented electronic steel probe to collect detailed data on the subsurface environment. The tests are conducted per ASTM D 5778 procedures whereby the penetrometer is hydraulically pushed vertically at a constant rate of 20 mm/s using a drill rig or cone truck. The penetrometer is outfitted with load cells, transducers, and other sensors to automatically record the soil response. Of particular value, the seismic piezocone penetration test (SCPTu) can provide five independent measurements with depth within a single sounding only 1.4-inches in diameter, including: tip stress (qt), sleeve friction (fs), penetration porewater pressure (ub) and

Page 3 - Final Report - In-Situ Cone Penetration Testing for Evaluating Bridge Pile Response
their decay with time (t50), and shear wave velocity (Vs). A SCPTu can be completed to depths of 100 feet in about 2 hours time, compared with 8 to 12 hours by conventional rotary drilling methods with standard penetration testing (SPT), thereby saving field testing time over routine drilling & sampling methods. No spoil, cuttings, or soils are removed or extracted from the ground, thus minimizing environmental damage and cleanup. The SCPTu readings are recorded continuously and directly by a field notebook computer, therefore facilitating data processing by the office engineer. From a technical standpoint, the SCPTu results can be used to evaluate the geostratigraphy, layering, groundwater conditions, and soil parameters and properties for analytical and/or numerical analyses, as well as a direct assessment of pile stiffness, end bearing, and skin friction.
Figure 2. Schematic of Seismic Piezocone Testing (SCPTu) for Geotechnical Data Collection
Research Plan
The research plan was developed to explore the feasibility and capabilities of cone penetration testing (CPT) to improve predictions of pile foundation response by the Georgia Department of Transportation (GDOT). Specifically, the seismic piezocone penetration test (SCPTu) is an optimized version of the CPT technologies, as it provides up to five separate readings in the same sounding. Currently, methods based on the SPT from soil boring data provide assessments of capacity only. The reliability of SPT measurements has been questioned since it is affected by large energy inefficiencies and provides only a single number (N) for analysis. With the CPT implemented at a number of key documented sites in Georgia, the intent of the new methodology is to derive entire load-displacement-capacity curves under axial compression loading for driven piles and drilled shaft foundations.

Page 4 - Final Report - In-Situ Cone Penetration Testing for Evaluating Bridge Pile Response
The CPT data may be used in three formats: (1) a rational approach of soil parameters for bearing capacity ("indirect" method), (2) scaling relationship of unit side and end bearing resistances ("direct" method), or (3) conversion to familiar N-values for implementation of SPT methods. For the rational method, the selection of these parameters depends in part on the type of analysis methods, the soil types encountered, and the deep foundation systems that are used. For many geotechnical analyses, the following soil engineering parameters are needed: total unit weight ((), relative density of sands (DR), preconsolidation stress (Φpρ), geostatic lateral stress coefficient (K0), overconsolidation ratio (OCR), undrained shear strength (su) in clays, effective stress friction angle (Νρ), equivalent elastic soil moduli (Eρ and/or Eu), permeability (k), coefficient of consolidation (ch), and shear modulus (G). The interpretations and evaluations of these parameters from CPT data are documented in various recent works, such as Lunne, et al. (1997), Mayne (2001), Sabatini, et al. (2002), and Mayne, et al. (2002).
Figure 3. Use of CPT data to obtain geostratigraphy and soil properties for foundation design.
In some circles, the cone penetrometer is considered as a miniature pile, therefore an alternate approach is to use the CPT-measured tip resistance (qc) and sleeve friction (fs) in a "direct approach", whereby these stresses are scaled up to the full-size pilings to obtain the unit end bearing (qb) and pile side friction (fp). Such methods are described by Robertson, et al. (1988), Eslami & Fellenius (1996), and Takesue, et al. (1998). Another direct approach involves the conversion of CPT resistances to equivalent SPT resistance and use of N-value based methods (e.g., Lunne, et al. 1997).

Page 5 - Final Report - In-Situ Cone Penetration Testing for Evaluating Bridge Pile Response
The rational calculations of pile capacities and displacements under axial loading using geotechnical engineering parameters are well appreciated (e.g., Poulos & Davis, 1980; Poulos, 1989; O'Neill & Reese, 1999). Generally, theorems of plasticity are utilized for the determination of end-bearing components and taken for two extreme cases: (1) undrained loading, using an appropriate undrained shear strength (su) beneath the pile tip (toe, or base), and (2) drained loading whereby the bearing factor depends on the effective friction angle (φ'). The side capacities are evaluated from limit equilibrium analysis using either total stress ("alpha" method based on su) or effective stress ("beta" method dependent upon φ' and Ko).
Figure 4. Calculation Parameters for Indirect and Direct Axial Pile Capacities.
The calculation of axial pile deflections can be formulated in terms of elastic solutions. These are available from commercial software (e.g., DEFPIG, PIGLET, PIES). The case of a simple one- or two-layer system that accommodates "friction" type piles in elastic soil medium or "end-bearing" type piles with base resting on a stiffer strata is depicted in Figure 5. Here the equivalent elastic modulus of the soil can be homogeneous (Es constant with depth) or Gibson-type (linearly-increasing Es with depth). The deflections of piles are conveniently handled via elastic continuum solutions to obtain the relevant displacement influence factors (Iρ) based on finite elements or boundary elements (e.g., Poulos & Davis, 1980; Poulos, 1989), or closed-form analytical methods (e.g., Randolph & Wroth, 1978; 1979; Fleming, et al. 1992). The latter is attractive in that it can be easily implemented on a spreadsheet and gives results in close agreement with the more rigorous FEM solutions.

Page 6 - Final Report - In-Situ Cone Penetration Testing for Evaluating Bridge Pile Response
Figure 5. Elastic Moduli Definitions for Axial Pile Deflection Calculations.
For the simple case of homogeneous soil (E' constant with depth), the displacement influence factor is:
)]1()/(5ln[)/(
)1(11
1
2 υυπ
υ
ρ
−⋅⋅⋅
++
−
=
dLdL
I
and the percentage of load transferred to the base (or pile toe or tip) is: Qb/Qt = Iρ/(1-ν2).
FIELD TESTING PROGRAM
A field testing program of CPTs was conducted to provide data relevant to the calculation of axial pile foundation performance in Georgia. These included a number of GDOT bridge sites where either full-scale load tests had been completed previously, or in the planning stage and would be conducted. In general, the CPTs were performed by GT forces using our mobile 6-tonne cone rig that is mounted on a Ford F350 truck. In two cases, because dense materials were anticipated, soundings were conducted using a large 25-tonne track rig provided by Southern Earth Sciences of Mobile AL. In one case (Satilla River), CPT results had been obtained already by Morris-Shea Bridge Company. In addition, results of a community-driven load test program on drilled shafts conducted on the GT west campus were reviewed, as the GDOT had provided drilling & lab testing support for this project that was orchestrated by a joint ADSC-ASCE-FHWA agreement and involved the participation of many geotechnical firms in the Atlanta area. Thus, a total of 10 GDOT test sites were considered for this study. The CPT soundings for these locations are listed in Table 1.

Page 7 - Final Report - In-Situ Cone Penetration Testing for Evaluating Bridge Pile Response
Summary of CPT Soundings Civil and Environmental EngineeringIn-Situ Research Division/Geosystems Georgia Institute of Technology
Test Sites: Georgia DOT Load Test Sites Location: State of Georgia
Sounding Date Site County Latitude Longitude DepthN° W° (m)
stmr01 9-Sep-02 I-95 St Mary's River Bridge Camden County, GA 30.74525 81.65394 9.90stmr02 9-Sep-02 I-95 St Mary's River Bridge Camden County, GA 30.74525 81.65394 9.60alts01 10-Sep-02 I-95 South Altamaha River Bridge McIntosh County, GA 31.33836 81.46584 18.00alts02 10-Sep-02 I-95 South Altamaha River Bridge McIntosh County, GA 31.33836 81.46584 17.93sldn01 11-Sep-02 Sidney Lanier Bridge Glynn County, GA 31.10846 81.48951 14.95sldn02 11-Sep-02 Sidney Lanier Bridge Glynn County, GA 31.10846 81.48951 14.85altn01 12-Sep-02 US 25/84 Altamaha River Bridge Long County, GA 31.66718 81.83751 22.45altn02 12-Sep-02 US 25/84 Altamaha River Bridge Long County, GA 31.66711 81.83746 13.75cnn01 22-Jan-03 International Boulevard Fulton County, GA *33.758 *84.396 7.83cnn02 22-Jan-03 International Boulevard Fulton County, GA *33.758 *84.396 20.68
Cow10a 21-Jun-99 I-85 overpass Coweta County, GA 33.43351 84.71332 17.75Cow10b 21-Jun-99 I-85 overpass Coweta County, GA 33.43351 84.71332 18.00066-001 31-Mar-99 I-95 Satilla River Bridge, Brunswick, GA Camden County, GA *30.95 *81.68 38.10066-002 7-Apr-99 I-95 Satilla River Bridge, Brunswick, GA Camden County, GA *30.95 *81.68 21.34
1-Jun-93 GT West Campus Fulton County, GA *33.778 *84.405 19.20talmadge1 4-Feb-03 Talmadge Bridge Chatham County, GA 32.08302 81.1037 12.85talmadge2 5-Mar-03 Talmadge Bridge Chatham County, GA 32.08302 81.1037 12.20sonewport1 4-Feb-03 I-95 South Newport Bridge McIntosh County, GA 31.64404 81.39945 25.83sonewport2 5-Mar-03 I-95 South Newport Bridge McIntosh County, GA 31.64404 81.39945 26.60
flnt01 26-Mar-03 SR127 over Toteover creek Macon County, GA 32.43305 84.03678 8.70* Approximate location
Date Site Bent Diam Tip elev Top elev Length GW elev(inches) (ft) (ft) (ft) (ft)
26-Sep-02 South Newport 6 72, 78 -135 -3.33 131.67 0.0030-Dec-96 South Altamaha, LT1 12 48 -91.5 -35 56.5 0.0019-Jul-96 St Mary LT1 12 60 -64.6 -33.6 31 3.03-Aug-96 St Mary LT2 9 102 -102.3 -47.5 54.8 0+-318-Aug-99 Satilla River LT1 10 102, 107 -174.1 -34.4 139.7 0.0019-Nov-99 Satilla River LT2 6-N-RT 102, 107 -175.6 -30.8 144.8 1.002-Feb-93 GT West Campus N/A 30 -70 0 70 50.002-Feb-93 GT West Campus N/A 30 -55 0 55 50.00
23-Nov-92 I-85 Coweta County N/A 36 -65 0 65 3.0016-Apr-88 Talmadge Bridge 2S 36 -92.07 7.4 99.47 13.0011-Mar-03 International Boulevard 8WB 56.5 955 1023 67.8 983.20
Table 1. List of CPTs at GDOT Test Sites with Full-Scale Load Tests on Deep Foundations.
The locations of the ten CPT test sites are shown on Figure 6 and include several bridges for the recent upgrading of Interstate I-95 along the Georgia coast. Nine load test results from 6 test bridge sites were made available for use in this research program, as summarized in Table 2. Additional details on the installation, steel casings, groundwater and mudline depths, and individual soil boring records and load test results are given in the Appendix of this report.
Table 2. List of GDOT Load Tests on Pilings and Drilled Shafts Under Axial Compression.

Page 8 - Final Report - In-Situ Cone Penetration Testing for Evaluating Bridge Pile Response
Figure 6a. Locations of CPTs and GDOT Deep Foundations Load Tests near Atlanta and Macon.
Figure 6b. Locations of CPTs and GDOT Deep Foundations Load Tests along Georgia Coast.

Page 9 - Final Report - In-Situ Cone Penetration Testing for Evaluating Bridge Pile Response
FOUNDATION ANALYSES
The elastic continuum method is modified to provide an approximate nonlinear load-displacement-capacity response by adopting a hyperbolic expression described by Fahey & Carter (1993) and Fahey (1998). The formulation is discussed elsewhere (Mayne & Dumas, 1997; Mayne & Schneider, 2001; Mayne & Elhakim, 2002). The general form is given by:
])/(1[maxg
ult
tt QQfEd
IQ−⋅⋅
⋅= ρρ
where ρt = pile top deflection, Qt = total pile loading, Qult = axial pile capacity, d = pile diameter, Iρ = pile displacement influence factor (chart solutions in Poulos & Davis, 1980; closed form solution by Randolph & Wroth, 1978, 1979), Emax = 2Gmax(1+ν) = initial small-strain elastic modulus, ν = Poisson's ratio (νu = 0.5 for undrained and ν' = 0.2 for drained loading), and f and g are hyperbola fitting parameters (generally, for noncemented sands and nonstructured clays, f = 1 and g = 0.3). The general closed form expression for Iρ can account for floating and friction piles, homogeneous and Gibson soils, Poisson's ratio, compressibility of the pile material, straight or belled shafts, and other features (Fleming et al. 1992; Poulos, 1987; and O'Neill & Reese, 1999). The solution also provides an assessment of the proportions of load carried by side friction and transmitted to the foundation base (or pile toe).
The initial stiffness is obtained from the downhole shear wave velocity measurement (Vs) taken during the SCPTu sounding:
Emax = 2Gmax(1+ν) = 2(1+ν) (γt /g)Vs)2
where γt = total unit weight of the soil and g = 9.8 m/s2 = gravitational constant.
The foundation analyses can be divided into two groups based on their geologic settings: (a) residual soils and partially-weathered rock of the Piedmont; and (2) sediments and cemented marls of the Atlantic Coastal Plain Province. In both cases, direct and indirect (rational) methods can be used to evaluate the side and base capacity components.
Deep Foundations in Piedmont Geology
Three cases involved drilled shaft foundations within the Piedmont geology (Coweta, GT Campus, and International Boulevard near CNN). The Piedmont is comprised of residuum (residual soils) that have weathered inplace from the underlying parent metamorphic & igneous rocks (Sowers, 1994). The soils are generally fine sandy silts (ML) to silty fine sands (SM) with mica that grade with depth to saprolitic geomaterials that are termed partially-weathered rock (PWR) to bedrock. Common bedrock types are schist, gneiss, and granites. While rock outcrops occur throughout the Atlanta metro area, the residuum overburden can also vary greatly in the region, with depths to PWR and bedrock refusal ranging commonly from 10 to 40 meters below grade.
Geotechnical soil parameters and properties can be evaluated for these nontextbook geomaterials using a combination of in-situ tests (SPT, CPT, DMT, PMT, CHT) and a rational approach adopted to assess the side resistance and unit end bearing values (e.g., Mayne & Brown, 2000; 2003). Alternatively, a CPT direct method for unit side friction (fp) of deep foundations has been proposed by Takesue, et al. (1998) which scales the measured CPT sleeve friction (fs) as a function of the measured excess porewater pressures (∆ub), as shown in Figure 7.

Page 10 - Final Report - In-Situ Cone Penetration Testing for Evaluating Bridge Pile Response
0
1
2
3
4
5
6
-300 0 300 600 900 1200
Excess Pore Pressure, ∆ub (kPa)
Pile
-CPT
Fric
tion
Rat
io, f
p/fs
Clay
Mix
Sand
Clay
Mix
Sand
Bored cast-in-situ piles
Driven steel piles
76.01250
+∆
≈ b
s
p uff
5.0200
−∆
≈ b
s
p uff
(Takesue, et al., 1998)
ub
Figure 7. Direct CPTu Method for Evaluating Unit Side Resistance (after Takesue, et al. 1998).
The unit end-bearing resistance of drilled shaft foundations (qb) in the Piedmont can be obtained from the strain compatibility relationship of Lee & Salgado (1999) for sandy soils using CPT tip stress measurements (qT) and assuming the displacement mobilized is approximately 10 percent of the diameter (s/d = 0.10). For clay soils, the effective cone resistance has been recommended by Eslaami & Fellenius (1997). In summary, these direct CPT method are:
Sands: qb = 0.10 qt
Clays: qb = qt - ub
As the Piedmont is silt-like, both procedures should be used and the lesser value for unit end bearing applied to the particular problem.
I-85 Bridge, Coweta County
A 3-foot diameter drilled shaft was constructed 65 feet deep for a widening expansion of the I-85 interstate north of Newnan, GA. The shaft was instrumented with load cells to measure axial load distribution with depth during the axial load test per ASTM D 1143. Details on the load testing program are given by O'Neill (1992). At a later date, two cone soundings (CPTu and SCPTu) were completed at the site in June of 1999, with the latter presented as Figure 8.

Page 11 - Final Report - In-Situ Cone Penetration Testing for Evaluating Bridge Pile Response
0
2
4
6
8
10
12
14
16
18
0 2 4 6 8qT (MPa)
Dep
th (m
)0
2
4
6
8
10
12
14
16
18
0 100 200 300
fs (kPa) Ub (kPa)
0
2
4
6
8
10
12
14
16
18
-100 0 100 2000
2
4
6
8
10
12
14
16
18
0 100 200 300 400
Vs (m/s)
0
10
20
30
40
50
0 2000 4000 6000 8000Axial Load, Q (kN)
Top
Def
lect
ion,
wt (m
m) Qtotal = Qs + Qb
Pred. Qs
Pred. Qb
Meas. Total
Meas. Shaft
Meas. Base
Figure 8. Seismic piezocone test in Piedmont residuum at I-85 bridge in Coweta County, GA.
The sounding presents five separate measurements on the behavior of the residuum at the site: qt = cone tip stress, fs = sleeve friction, ub = penetration porewater pressure, t50 = dissipation rate, and Vs = shear wave velocity. The tip stress provides an evaluation of the unit end bearing of the drilled shaft and the negative ∆u readings scale the measured sleeve friction to a unit pile side friction. Groundwater is about 4 m deep. The shear wave data are utilized for the initial soil-pile stiffness to provide an approximate nonlinear load-deflection-capacity curve, as shown together with the measured load test data in Figure 9. The correct proportions of load in side and base resistance are also evident.
Figure 9. Predicted and Measured Axial Load Response at I-85 Bridge in Coweta County, GA.

Page 12 - Final Report - In-Situ Cone Penetration Testing for Evaluating Bridge Pile Response
Georgia Tech Campus
A community research program on drilled shaft performance and load transfer distributions in the Piedmont geology was initiated by ADSC-ASCE-FHWA in 1993 together with local geotechnical groups in the Atlanta metro area (Harris & Mayne 1994). GDOT participated in this test program that was held on the west side of the GT Campus and involved construction & load testing of a 30-inch diameter end-bearing drilled shaft (L = 70 feet), 30-inch diameter floating shaft (L = 55 feet), and deep plate load test. A total of ten soil borings with standard penetration testing (SPT), 3 flat plate dilatometers (DMT), 2 CPTs, spectral analysis of surface waves (SASW), and pressuremeter testing (PMT) were completed. In addition, extensive grain size distributions, water contents, and index tests were obtained from the drive samples and more extensive testing performed on undisturbed thin-walled tube samples taken from the site, including triaxial shear and consolidation.
A composite profile of qt, fs, and Vs are shown in Figure 10 based on the CPT and SASW data. In contrast to the Coweta site, the GT west campus location has a deep groundwater table about 16 m deep. Borings at the test site met refusal at depths of about 22 m with rock coring in 5 locations giving RQDs of between 38 and 45 %.
0
2
4
6
8
10
12
14
16
18
20
0 2 4 6 8
qT (MPa)
Dep
th (m
)
0
2
4
6
8
10
12
14
16
18
20
0 100 200 300
fS (kPa)
Dep
th (m
)
0
2
4
6
8
10
12
14
16
18
20
0 100 200 300 400 500
VS (m/s)
Dep
th (m
)
Figure 10. Composite SCPT at GT West Campus Site for Drilled Shaft Load Test Program.

Page 13 - Final Report - In-Situ Cone Penetration Testing for Evaluating Bridge Pile Response
0
10
20
30
40
50
60
0 1000 2000 3000 4000Axial Load, Q (MN)
Top
Def
lect
ion,
wt (m
m)
Qtotal = Qs + Qb
Pred. Qs
Pred. Qb
Meas. Total
Meas. Shaft
Meas. Base
For the friction shaft at Georgia Tech, the results of the applied CPT direct analysis are illustrated in Figure 11 in comparison with the measured loading using a large reaction beam and tie-down anchor shafts. The proportions of side and base loads are correctly matched using the approximate elasticity approach. For the end-bearing shaft, an approximate linear response is sufficient until the full side resistance is mobilized and then the additional capacity is due to the mobilization of end-bearing resistance, as shown in Figure 12.
Figure 11. Interpreted & Measured Friction Shaft Response at GT West Campus Site.
0
10
20
30
0 2000 4000 6000 8000 10000
Axial Load, Q (kN)
Top
Def
lect
ion,
wt (m
m)
Qtotal = Qs + QbPred. QsPred. QbMeas. TotalMeas. ShaftMeas. Base
Figure 12. Interpreted & Measured End-Bearing Shaft Response at GT West Campus Site.

Page 14 - Final Report - In-Situ Cone Penetration Testing for Evaluating Bridge Pile Response
0
5
10
15
20
25
0 5 10 15 20qT (MPa)
Dep
th (m
)
0 200 400 600 800fs (kPa)
-100 0 100 200U2, (kPa)
0 200 400 600Vs (m/s)
0 5 10FR(%)
GDOT Bridge at CNN
Construction of a new bridge structure near CNN in Atlanta necessitated a full-scale load testing of a representative drilled shaft foundation using two levels of Osterberg load cells. Using the GT rig, a seismic cone sounding was conducted in January 2003 with the results shown below in Figure 13. The sleeve friction readings appeared somewhat higher than expected, thus the rational (indirect) method was employed to assess the unit side and end bearing resistances for the foundation. The completed foundation was 54 inches in diameter with an embedded length of 68.5 feet. A dual-stage O-cell system was used to apply the loading to the base and sides on March 11, 2003. Results of this test are not yet available. Figure 13 shows the estimated axial load-displacement response based on the CPT data, thus offering a Class "A" prediction for scrutiny.
Figure 12. Results of SCPTu at GDOT Bridge Site next to CNN, Atlanta, GA.
Figure 13. Predicted Axial Load-Displacement Response of GDOT Shaft at CNN before O-cell test.
0
10
20
30
40
50
0 2000 4000 6000 8000 10000
Axial Load, Q (kN)
Top
Def
lect
ion,
wt (m
m)
Qtotal = Qs + Qb
Pred. Qs
Pred. Qb

Page 15 - Final Report - In-Situ Cone Penetration Testing for Evaluating Bridge Pile Response
In this analysis, the CPT tip resistances (qT in bars) were converted to equivalent SPT resistances (N-values) using an equivalent conversion factor of qT/N = 3.5. Presumably, the N-value corresponds to 60 percent energy efficiency, or N60. The conversion ratio is known from data obtained at the GT campus test site (Harris & Mayne, 1994) and the Opelika national geotechnical test site (Mayne, et al. 2000) and fits within the prior relationships that relate the ratio qT/N to mean grain size (D50 in mm). Figure 14 shows the correlation with superimposed data from the Piedmont test sites where extensive lab testing has been done. The equivalent N-values were used in the rational method detailed for Piedmont soils that is detailed elsewhere (Mayne & Harris, 1993; O’Neill & Reese, 1999).
Figure 14. Trend of qt/N ratio with mean grain size (after Kulhway & Mayne, 1990).
The Class “A” prediction was issued during our draft report in March 12, 2003 and subsequently we have received the O-Cell Report dated March 17, 2003 with the measured shaft response (Ahrens, 2003). The test was conducted in two stages and an equivalent top down load-displacement response was derived from the results. Figure 15 shows reasonable agreement between the the measured and predicted behavior. The predicted curve bends more sharply as the interpreted “creep limit” is neared. Notably, the predicted curve was based on the provided geometry of the shaft as d = 1.37 m and L = 20.88 m. Since the dry method with temporary casing was used during construction, however, the upper sections of the shaft were actually larger, as seen in Figure 16. Here, the levels of the O-cells are also shown. When the analysis is adjusted for the slightly larger diameters in the upper sections, the predicted and measured responses are in better agreement (Figure 17).

Page 16 - Final Report - In-Situ Cone Penetration Testing for Evaluating Bridge Pile Response
0
10
20
30
40
50
0 1 2 3 4 5 6 7 8 9 10 11 12
Axial Load, Q (kN)
Top
Def
lect
ion,
wt (m
m)
Qt Predicted
O-cell top down
O-cell Creep Limit
Figure 15. Class “A” Prediction with Measured Response of Shaft at International Blvd.
Figure 16. As-Built Drilled Shaft for O-Cell Load Tests at International Blvd.

Page 17 - Final Report - In-Situ Cone Penetration Testing for Evaluating Bridge Pile Response
GDOT International Blvd. at CNN
0
10
20
30
40
50
0 1 2 3 4 5 6 7 8 9 10 11 12
Axial Load, Q (kN)
Top
Def
lect
ion,
wt (m
m)
Qt Predicted
O-cell top down
O-cell Creep Limit
Figure 17. Adjusted Analysis Based on Actual Shaft Geometry at International Boulevard.
Deep Foundations in Georgia Coastal Plain Geology
The Atlantic Coastal Plain of Georgia exhibits a wide and diverse collection of sediments, ranging from very soft young Holocene clays and loose alluvial sands in Savannah to very hard and old Cretaceous kaolinitic clays that are extensively mined south of the Fall Line. Along the Atlantic coast, the younger soft & loose sediments are underlain by cemented sandy to calcareous marls of Miocene Age. These marl formations often serve as foundation support for the very large bridges that the GDOT has constructed during the recent upgrading along the I-95 corridor and large bridges in downtown Savannah and Brunswick. The use of CPT to delineate the geostratigraphy of the upper soft to loose sediments along the Georgia Coast has been recognized for several decades (e.g., Vesic, 1970). At the bridge sites investigated for this study, in all cases, our small cone rig was able to explore the upper younger deposits which are soft to firm to compact. However, the rig was unable to penetrate into the deeper dense cemented marls. After unsuccessful attempts to fully penetrate to great depths with our own rig, we solicited help from Southern Earth Sciences (SES) of Mobile AL to utilize their 25-tonne track rig at two sites: (1) Talmadge Bridge load test area in Savannah; and (2) the nearby South Newport Bridge, currently under construction south of Savannah. On two separate visits to both sites, SES also met refusal at the top of the cemented Miocene marl, thus unable to fully collect data along the full depths of certain deep foundation locations. In their second visit, they utilized outer casing in an attempt to stabilize the cone rods from buckling, albeit unsuccessful to penetrate the dense marl. At the Satilla River Bridge, the A.P. vanden Berg track rig operated by Morris-Shea Bridge Company of Birmingham, Alabama successfully penetrated into the Miocene Marl with CPT equipment and apparently prebored the upper few feet of the marl to allow CPT penetration in another sounding.

Page 18 - Final Report - In-Situ Cone Penetration Testing for Evaluating Bridge Pile Response
Tip Resistance
0
5
10
15
20
25
30
35
40
45
0 10 20 30 40 50 60qT (MPa)
Dep
th (m
)
Sleeve Friction
0 200 400 600fs (kPa)
Pore Pressure
-500 0 500 1000 1500 2000 2500U2, U0 (kPa)
Friction Ratio
0 5 10FR (%)
I-95 Satilla River Bridge Site
At the Satilla River Bridge, Morris-Shea successfully penetrated into the Miocene marls using CPT technology and a 25-tonne track rig. We are therefore able to fully utilize the results of the analysis with this data set. At the Satilla River Bridge, very large drilled shafts with 8-foot diameters and 160-foot embedment lengths were constructed. The piezocone sounding (No. 0660) from the site is shown in Figure 18.
Figure 18. Results of CPTu at I-95 Satilla River Bridge Site, Woodbine, GA.
Since shear wave data were not collected during those CPT tests at Satilla River, the results of downhole Vs from the Cooper Marl were utilized to provide an assessment of the initial elastic moduli profile for the deep foundation analysis. As note earlier, the Cooper Marl is a highly calcareous marine deposit with general similar cemented characteristics to the Miocene Marl of the Georgia coast. Figure 19 shows the derived profile of Emax from SCPTu 27 performed by ConeTec Investigations for the SCDOT in conjunction with the new Cooper River Bridge. It is evident that the profile can be represented by a pure Gibson soil (ρE = 0.5) whereby the initial modulus increases linearly from 0 at the ground surface at a rate of Emax = 25z with depth where z is in m. Thus, the value of EsL along the shaft at the base elevation for the elastic continuum solution is 1220 MPa at z = 48.8 meters.

Page 19 - Final Report - In-Situ Cone Penetration Testing for Evaluating Bridge Pile Response
0
10
20
30
40
50
60
0 500 1000 1500 2000
Initial Elastic Modulus, Emax (MPa)D
epth
(met
ers)
O-cell
Figure 19. Adopted Profile of Small-Strain Modulus for Elastic Continuum Analysis of the I-95 Satilla River Bridge Load Tests on Large Drilled Shaft Foundations (d = 2.44 m; L = 48.8 m).
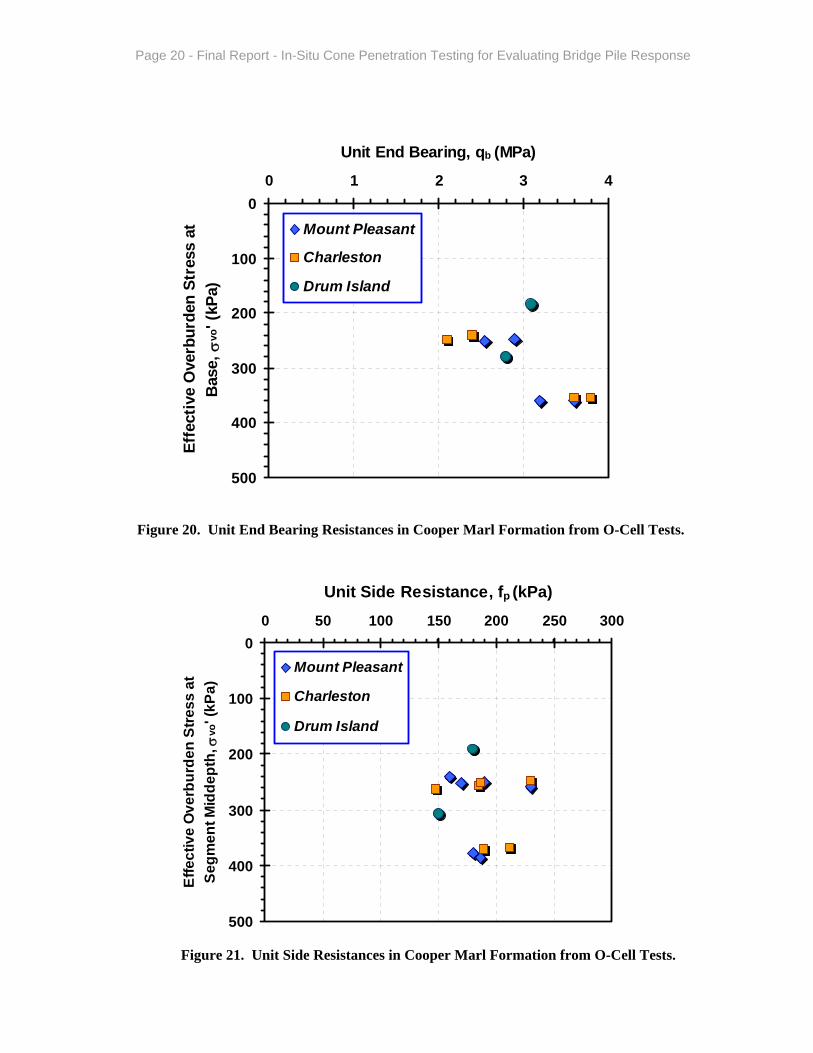
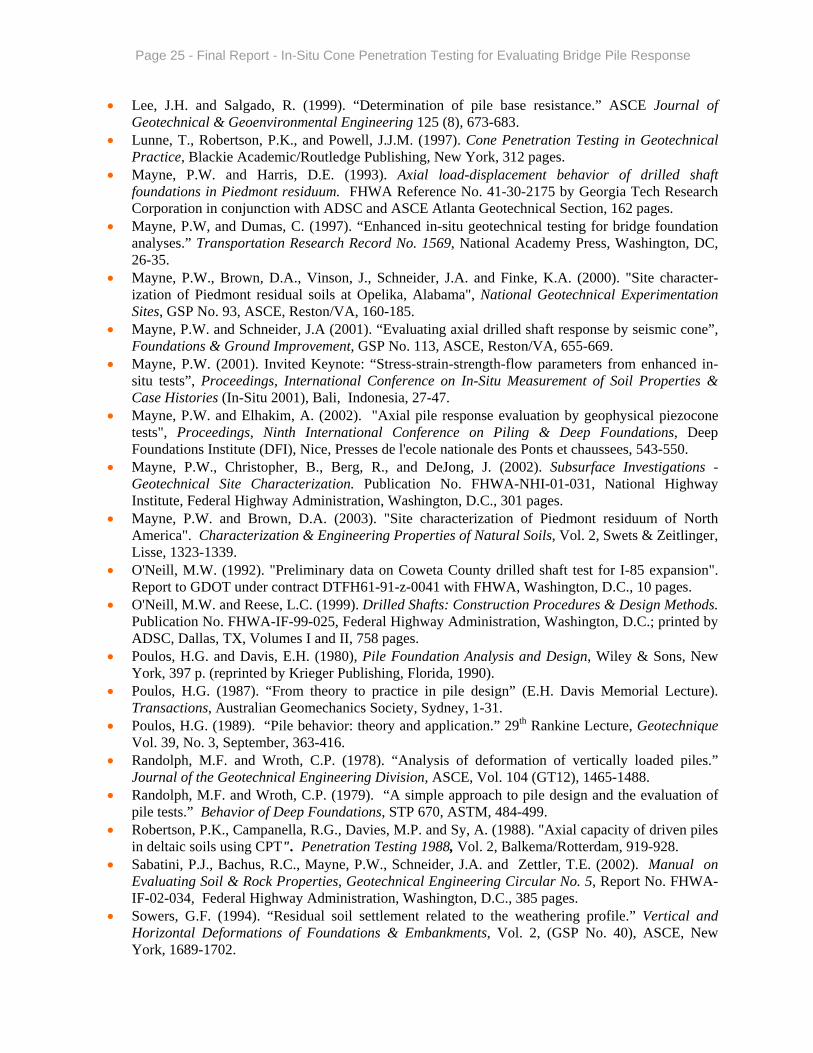
As the Miocene Marl is a "nontextbook" geomaterial (Lunne, et al. 1997), the direct use of CPT readings to ascertain the unit side resistance and unit end bearing resistances would warrant backcalculations from many load tests on foundations across the region. The researchers elected to use the results of recent O-cell tests (Camp, et al. 2002a, 2002b) that were performed for the new Cooper River Bridge, again assuming similarities between the calcareous deposits of the Cooper Marl and the Miocene Marl. Both marine formations appear cemented and structured, with the Cooper Marl more clay-like and the Miocene Marl more sand-like. The uppermost part of the Miocene Marl is apparently highly cemented in many locations, thus preventing penetration by CPT equipment at the selected test locations. Also, according to Georgia Geologic Maps, portions of the Cooper Marl extends over into northeastern portions of Georgia. Interpreted results from the O-cell load tests from Cooper Marl are presented in Figure 20 for unit side friction and Figure 21 for unit end bearing, respectively, in terms of corresponding effective overburden stress levels. Overall, the tests indicate unit end bearing resistances on the order of 2 to 4 MPa (20 to 40 tsf) in these materials that can be represented by qb = 10 σvo'. The average unit side friction of fp = 2 tsf (200 kPa) appears relatively constant with depth. Additional details on the interpretation of unit end bearing and unit side friction in this formation are discussed by Camp et al. (2002a, 2000b).
Page 20 - Final Report - In-Situ Cone Penetration Testing for Evaluating Bridge Pile Response
0
100
200
300
400
500
0 1 2 3 4
Unit End Bearing, qb (MPa)
Effe
ctiv
e O
verb
urde
n St
ress
at
Bas
e, σ
vo' (
kPa)
Mount Pleasant
Charleston
Drum Island
0
100
200
300
400
500
0 50 100 150 200 250 300
Unit Side Resistance, fp (kPa)
Effe
ctiv
e O
verb
urde
n St
ress
at
Segm
ent M
idde
pth,
σvo
' (kP
a)
Mount Pleasant
Charleston
Drum Island
Figure 20. Unit End Bearing Resistances in Cooper Marl Formation from O-Cell Tests.
Figure 21. Unit Side Resistances in Cooper Marl Formation from O-Cell Tests.

Page 21 - Final Report - In-Situ Cone Penetration Testing for Evaluating Bridge Pile Response
Based on Figure 18, the upper 8-m soft soils were assigned a unit fp = 0.3 tsf (30 kPa) and the remaining 40 m length given the characteristic marl value of fp = 2.0 tsf (200 kPa). This obtains a total side capacity Qs = 6973 tons (62 MN). For the base resistance at an effective overburden stress σvo' = 4.88 tsf (466 kPa), an extrapolated unit end bearing stress of 50 tsf (5 MPa) was assigned. For an 8-foot diameter (2.44 m) drilled shaft, this gives a base capacity of Qb = 2510 tons (22.3 MN). The results of the O-cell report provide an equivalent top-down load-movement response for Bent 10, although values beyond 28 MN appear to be extrapolated curves. The elastic continuum solution is given in Figure 22.
0
10
20
30
40
50
60
70
80
90
100
0 20000 40000 60000 80000 100000
Axial Load, Q (kN)
Def
lect
ion,
wt (m
m)
Qtotal = Qs + Qb
Pred. Qs
Pred. Qb
O-Cell Bent 10
Figure 22. Approximate Elastic Continuum Results for I-95 Satilla River O-Cell Tests.
Drilled Shaft, South Newport Bridge The estimated load-displacement behavior of the drilled shaft at the South Newport Bridge site was handled similarly to that detailed above for the Satilla River Bridge. The shaft is stepped in geometry with d = 1.98 m in the upper 25.2 m and then d = 1.83 m for the remaining lower depths to a final base at L = 40 m. Calculated side friction used the CPT data until refusal was met, then the unit values given by Figure 21. A total side capacity of Qs = 23 MN was obtained. Unit end bearing was calculated per Figure 20. An end bearing capacity of Qb = 8.9 MN was calculated by this procedure. The total calculated capacity is Qt = 32.5 MN. The predicted load-displacement response is conservative when compared with the equivalent interpreted top down results from the O-cell measurements, as seen in Figure 23.

Page 22 - Final Report - In-Situ Cone Penetration Testing for Evaluating Bridge Pile Response
0
10
20
30
40
50
60
0 10000 20000 30000 40000 50000 60000
Axial Load, Q (kN)
Def
lect
ion,
wt (m
m)
Qtotal
Pred. Qs
Pred. QbSite 2S
0
5
10
15
20
0 2000 4000 6000 8000 10000 12000
Axial Load, Q (kN)
Def
lect
ion,
wt (m
m) Qtotal
Pred. Qs
Pred. QbSite 2S
Figure 23. Measured and Predicted Curves for Bent 6, I-95 over South Newport River.
Talmadge Bridge, Savannah
The results for the estimated response of the drilled shaft load test for Talmadge Bridge in downtown Savannah have been obtained similarly to Satilla River and South Newport. A conventional static load test by frame was conducted here on a drilled shaft with d = 0.86 m and L = 28 m. Using the aforementioned procedures, Qs = 9.5 MN, Qb = 1.58 MN, and Qt = 11.1 MN. Figure 24 shows the comparison, again on the conservative side.
Figure 24. Measured and Predicted Results at Talmadge Bridge Site, Savannah.

Page 23 - Final Report - In-Situ Cone Penetration Testing for Evaluating Bridge Pile Response
0
5
10
15
20
25
30
0 1000 2000 3000 4000Axial Load, Q (kN)
Def
lect
ion,
wt (m
m)
Qtotal
Pred. Qs
Pred. Qb
Route 127 Macon County Bridge
The Route 127 Bridge in Macon County is founded on 14 HP 73 steel piles driven into hard and dense materials. The load test results were not provided but it has been indicated that the pile has a total length of 55 feet. (d = 0.36 m and L = 16.76 m). In order to gain access to the site with the cone truck, a special ramp was built by GDOT. However, during two subsequent visits to the site in January and March, the site was flooded at the bridge pier locations. A SCPTu sounding was conducted away from the bridge pier location. No driving records or load test results were provided for the test H-pile. Thus, for analysis, based on the SPT boring data, it was assumed that the pile extended through 10 m of alluvial overburden and another 6 m into the underlying hard/dense layer for which the CPT met refusal. The calculated capacities are Qs = 2547 kN and Qb = 180 kN. Figure 25 shows the completed curves.
Figure 25. Predicted Axial Response for H-Pile at Route 127 in Macon County.
SUMMARY
The use of cone penetration tests (CPT) provide continuous profiling on the geostratigraphy and soil parameters and may be used to complement, supplement, and/or replace standard soil borings in some instances. For axial capacity, both direct methods (scaled CPT resistances) and indirect (rational) methods can be used. The rational methods use the CPT results to interpret geotechnical parameters (e.g., Ko, su, φ', E', OCR) for input into bearing capacity theory and limit equilibrium analyses, thus amenable to shallow and deep foundations. Elastic continuum solutions are convenient for representing an approximate nonlinear load-displacement-capacity curve for piles, as well as providing an evaluation of the axial load distribution with depth and relative percentages of side and base components.
For bridges located with the Piedmont geology, CPT technology has been shown to be feasible for implementation. Four case studies with full-scale load testing of drilled shaft foundations in the Piedmont that involved GDOT participation were reviewed in this framework. The CPT data were used to provide site-specific data that compared well with measured responses from instrumented shafts.

Page 24 - Final Report - In-Situ Cone Penetration Testing for Evaluating Bridge Pile Response
Within the Atlantic Coastal Plain of Georgia, CPT technology can be viable for small bridge structures where driven piles or drilled shafts are to be installed to depths of up to 20 meters deep. For very large bridges requiring very deep embedded foundations that extend well into the cemented sandy and calcareous marls of Miocene Age, the use of CPT technology may encounter refusal. At the I-95 Satilla River Bridge, results from a successful CPT program were reviewed. The utilization of elastic continuum solutions for axial shaft analysis was applied with good results. At CPT refusal locations, it may be feasible to use a drill rig to pre-bore into the upper highly-cemented zone and continue with CPT penetration. Alternatively, special methods may be sought by GDOT to facilitate CPTs in the Miocene Marl geology including: (1) double casing (outer casing pushed to restrain bucking problem); (2) an outer coring system (e.g., Rotap) similar to a Pitcher or Denison sampler; or (3) sonic CPT using a vibratory actuator. Additional research would be required to determine the feasibility of these methods.
REFERENCES
Published Documents:
• Ahrens, M.D. (2003). “Load Test Report: Bent 8 W.B. Test Shaft – International Boulevard Viaduct, Atlanta, Georgia”. Submitted to Brayman Construction Corp. by LoadTest Inc., Gainesville, Florida, March 17, 2003.
• Burns, S.E. and Mayne, P.W. (2002). "Analytical cavity expansion-critical state model for piezocone dissipation in fine-grained soils". Soils & Foundations, Vol. 42 (2), 131-137.
• Burns, S.E. and Mayne, P.W. (2002). "Interpretation of seismic piezocone results for the evaluation of hydraulic conductivity in clays", ASTM Geotechnical Testing Journal, Vol. 25 (3), 333-340.
• Bustamante, M. and Gianeselli, L. (1982). "Pile bearing capacity prediction by means of static penetrometer CPT". Penetration Testing, Vol. 2 (Proc. 2nd ESOPT, Amsterdam), Balkema, Rotterdam, 493-500.
• Camp, W., Mayne, P.W., and Brown, D.A. (2002). "Drilled shaft axial design values: Predicted vs. measured response in a calcareous clay". Deep Foundations 2002, Vol. 2, GSP No. 116, ASCE, Reston/VA, 1518-1532.
• Camp, W., Brown, D.A., and Mayne, P.W. (2002). "Construction method effects on axial drilled shaft performance", Deep Foundations 2002, Vol. 1, GSP No. 116, ASCE, Reston/VA, 193-208.
• Eslami, A. and Fellenius, B.H. (1997). “Pile capacity by direct CPT and CPTu methods applied to 102 case histories”. Canadian Geotechnical Journal 34 (6), 886-904.
• Fahey, M. and Carter, J. (1993). “A finite element study of the pressuremeter using a nonlinear elastic plastic model.” Canadian Geotechnical Journal 30 (2), 348-362.
• Fahey, M. (1998). "Deformation and in-situ stress measurement". Geotechnical Site Character-ization, Vol. 1 (Proceedings, ISC-1, Atlanta), Balkema, Rotterdam, 49-68.
• Finke, K.A. and Mayne, P.W. (2002). "Piezocone penetration testing in Atlantic Piedmont residuum". Journal of Geotechnical & Geoenvironmental Engineering 128 (5), 443-446.
• Fleming, W.G.K., Weltman, A.J., Randolph, M.F., and Elson, W.K. (1985). Piling Engineering, Surrey University Press, Wiley & Sons, New York, 380 p.
• Harris, D.E. and Mayne, P.W. (1994). "Axial compression behavior of two drilled shafts in Piedmont residual soils". Proceedings, International Conference on Design & Construction of Deep Foundations, Volume II, FHWA, Orlando, 352-367.
• Kulhawy, F.H. and Mayne, P.W. (1990). Estimating Soil Properties for Foundation Design. Report EL-6800, Electric Power Research Institute, Palo Alto, 306 pages.
Page 25 - Final Report - In-Situ Cone Penetration Testing for Evaluating Bridge Pile Response
• Lee, J.H. and Salgado, R. (1999). “Determination of pile base resistance.” ASCE Journal of Geotechnical & Geoenvironmental Engineering 125 (8), 673-683.
• Lunne, T., Robertson, P.K., and Powell, J.J.M. (1997). Cone Penetration Testing in Geotechnical Practice, Blackie Academic/Routledge Publishing, New York, 312 pages.
• Mayne, P.W. and Harris, D.E. (1993). Axial load-displacement behavior of drilled shaft foundations in Piedmont residuum. FHWA Reference No. 41-30-2175 by Georgia Tech Research Corporation in conjunction with ADSC and ASCE Atlanta Geotechnical Section, 162 pages.
• Mayne, P.W, and Dumas, C. (1997). “Enhanced in-situ geotechnical testing for bridge foundation analyses.” Transportation Research Record No. 1569, National Academy Press, Washington, DC, 26-35.
• Mayne, P.W., Brown, D.A., Vinson, J., Schneider, J.A. and Finke, K.A. (2000). "Site character-ization of Piedmont residual soils at Opelika, Alabama", National Geotechnical Experimentation Sites, GSP No. 93, ASCE, Reston/VA, 160-185.
• Mayne, P.W. and Schneider, J.A (2001). “Evaluating axial drilled shaft response by seismic cone”, Foundations & Ground Improvement, GSP No. 113, ASCE, Reston/VA, 655-669.
• Mayne, P.W. (2001). Invited Keynote: “Stress-strain-strength-flow parameters from enhanced in-situ tests”, Proceedings, International Conference on In-Situ Measurement of Soil Properties & Case Histories (In-Situ 2001), Bali, Indonesia, 27-47.
• Mayne, P.W. and Elhakim, A. (2002). "Axial pile response evaluation by geophysical piezocone tests", Proceedings, Ninth International Conference on Piling & Deep Foundations, Deep Foundations Institute (DFI), Nice, Presses de l'ecole nationale des Ponts et chaussees, 543-550.
• Mayne, P.W., Christopher, B., Berg, R., and DeJong, J. (2002). Subsurface Investigations -Geotechnical Site Characterization. Publication No. FHWA-NHI-01-031, National Highway Institute, Federal Highway Administration, Washington, D.C., 301 pages.
• Mayne, P.W. and Brown, D.A. (2003). "Site characterization of Piedmont residuum of North America". Characterization & Engineering Properties of Natural Soils, Vol. 2, Swets & Zeitlinger, Lisse, 1323-1339.
• O'Neill, M.W. (1992). "Preliminary data on Coweta County drilled shaft test for I-85 expansion". Report to GDOT under contract DTFH61-91-z-0041 with FHWA, Washington, D.C., 10 pages.
• O'Neill, M.W. and Reese, L.C. (1999). Drilled Shafts: Construction Procedures & Design Methods. Publication No. FHWA-IF-99-025, Federal Highway Administration, Washington, D.C.; printed by ADSC, Dallas, TX, Volumes I and II, 758 pages.
• Poulos, H.G. and Davis, E.H. (1980), Pile Foundation Analysis and Design, Wiley & Sons, New York, 397 p. (reprinted by Krieger Publishing, Florida, 1990).
• Poulos, H.G. (1987). “From theory to practice in pile design” (E.H. Davis Memorial Lecture). Transactions, Australian Geomechanics Society, Sydney, 1-31.
• Poulos, H.G. (1989). “Pile behavior: theory and application.” 29th Rankine Lecture, Geotechnique Vol. 39, No. 3, September, 363-416.
• Randolph, M.F. and Wroth, C.P. (1978). “Analysis of deformation of vertically loaded piles.” Journal of the Geotechnical Engineering Division, ASCE, Vol. 104 (GT12), 1465-1488.
• Randolph, M.F. and Wroth, C.P. (1979). “A simple approach to pile design and the evaluation of pile tests.” Behavior of Deep Foundations, STP 670, ASTM, 484-499.
• Robertson, P.K., Campanella, R.G., Davies, M.P. and Sy, A. (1988). "Axial capacity of driven piles in deltaic soils using CPT". Penetration Testing 1988, Vol. 2, Balkema/Rotterdam, 919-928.
• Sabatini, P.J., Bachus, R.C., Mayne, P.W., Schneider, J.A. and Zettler, T.E. (2002). Manual on Evaluating Soil & Rock Properties, Geotechnical Engineering Circular No. 5, Report No. FHWA-IF-02-034, Federal Highway Administration, Washington, D.C., 385 pages.
• Sowers, G.F. (1994). “Residual soil settlement related to the weathering profile.” Vertical and Horizontal Deformations of Foundations & Embankments, Vol. 2, (GSP No. 40), ASCE, New York, 1689-1702.

Page 26 - Final Report - In-Situ Cone Penetration Testing for Evaluating Bridge Pile Response
• Takesue, K., Sasao, H., and Matsumoto, T. (1998). “Correlation between ultimate pile skin friction and CPT data.” Geotechnical Site Characterization (2), Balkema, Rotterdam, 1177-1182.
• Vesic, A. (1970). “Tests on instrumented piles, Ogeechee River Site, Georgia”. Journal of Soil Mechanics & Foundations Division, ASCE, 96 (SM2), 561-584.
Websites for Reference:
Geology of Georgia:
http://home.att.net/~cochrans/gageol01.htm
http://www.gly.uga.edu/GAGeology.html#PM
Cone Penetration Testing:
Georgia Tech In-Situ Group:
http://www.ce.gatech.edu/~geosys/misc/links.htm
The CPT Site:
http://www.liquefaction.com/
Technical Committee TC 16: Ground Property Characterization by In-Situ Tests (ISSMGE):
http://www.geoforum.com/tc16
Interpretation of In-Situ Test Data
NHI Manual on Subsurface Investigations: Geotechnical Site Characterization:
http://geotech.ecs.umass.edu/images/simanual/NHI_SIManual_2001.pdf
Constitutive Relationships for Soils:
http://www.ejge.com/1996/Ppr9609/Ppr9609.htm