Embed Size (px)
Citation preview

Prepared for
California High-Speed Train Project
Agreement No.: HSR 13-06 Book 3, Part E, Subpart 5
Geotechnical Baseline Report West Clinton Avenue to East American
Avenue
HSR
13-
06 -
EXEC
UTI
ON
VER
SIO
N

THIS PAGE INTENTIONALLY LEFT BLANK
HSR
13-
06 -
EXEC
UTI
ON
VER
SIO
N

Sacramento
Stockton
Modesto
Merced
Transbay Transit Center
Fresno
Kings/Tulare (Potential Station)
Gilroy
San Jose Redwood City/Palo Alto
(Potential Station)
Millbrae-SFO
Bakersfield
Palmdale
San Fernando/Burbank Ontario Airport
Norwalk Riverside/Corona
Murrieta
Escondido
San Diego \
East San Gabriel
Valley Los Angeles
Anaheim
DRAFT
Fresno to Bakersfield
Geotechnical Baseline Report
for Bid
Contract Package 1
October 2012
Engineering Report
RECORD SET PRELIMINARY ENGINEERING FOR PROCUREMENT
Fresno to Bakersfield
Sierra Subdivision
Procurement Package 1
Geotechnical Baseline
Report for Bid
November 2012
Engineering Report
Sacramento
Stockton
Modesto
Merced
Transbay Transit Center
Fresno
Kings/Tulare (Potential Station)
Gilroy
San Jose Redwood City or Palo Alto
(Potential Station)
Millbrae-SFO
Bakersfield
Palmdale
San Fernando/Burbank Ontario Airport
Norwalk Riverside/Corona
Murrieta
Escondido
San Diego \
East San Gabriel
Valley Los Angeles
Anaheim
HSR
13-
06 -
EXEC
UTI
ON
VER
SIO
N

HSR
13-
06 -
EXEC
UTI
ON
VER
SIO
N

California High-Speed Train Project Engineering
RECORD SET
SIERRA SUBDIVISION
CONTRACT PACKAGE 1
GEOTECHNICAL BASELINE REPORT
FOR BID
Prepared by:
URS/HMM/Arup Joint Venture
November 2012
HSR
13-
06 -
EXEC
UTI
ON
VER
SIO
N

HSR
13-
06 -
EXEC
UTI
ON
VER
SIO
N

California High-Speed Train Engineering
Record Set Preliminary Engineering for Procurement
Sierra Subdivision Procurement Package 1 Geotechnical Baseline
Report for Bid
Prepared by:
URS/HMM/Arup Joint Venture
November 2012 This report has been prepared under the direction of the following registered Geotechnical Engineer. November 1, 2012 Martin Walker, PE, GE Date
HSR
13-
06 -
EXEC
UTI
ON
VER
SIO
N

HSR
13-
06 -
EXEC
UTI
ON
VER
SIO
N

CALIFORNIA HIGH-SPEED TRAIN PROJECT ENGINEERING GEOTECHNICAL BASELINE REPORT FOR BID
FRESNO TO BAKERSFIELD SECTION CONTRACT PACKAGE 1
Page i
Table of Contents
Page
1.0 Introduction..................................................................................................... 1-1 Geotechnical Contract Documents ..................................................................... 1-3 1.1
Purpose ........................................................................................................... 1-3 1.2
Report Structure .............................................................................................. 1-3 1.3 Basis of Report ................................................................................................ 1-4 1.4
Project Constraints and Restrictions .................................................................. 1-4 1.52.0 Project Description .......................................................................................... 2-1 3.0 Sources of Geologic and Geotechnical Information ........................................ 3-1
Project Sources ................................................................................................ 3-1 3.1 Site Investigations ........................................................................................... 3-1 3.2
Historical Investigations ................................................................................... 3-1 3.34.0 Physiography & Geology Overview ................................................................. 4-1
Physiography ................................................................................................... 4-1 4.1 Geologic Setting............................................................................................... 4-1 4.2
4.2.1 Regional Geology ................................................................................ 4-1 4.2.2 Local Geology ..................................................................................... 4-1
Seismic Setting ................................................................................................ 4-2 4.3
4.3.1 Faults & Seismicity .............................................................................. 4-2 4.3.2 Design Earthquake and Design Ground Motion...................................... 4-5 4.3.3 Liquefaction ........................................................................................ 4-5
Hydrologic Setting............................................................................................ 4-5 4.44.4.1 Regional ............................................................................................. 4-5 4.4.2 Major Aquifers .................................................................................... 4-6 4.4.3 Current Groundwater Conditions .......................................................... 4-6 4.4.4 Land Subsidence ................................................................................. 4-6
5.0 Related Construction ....................................................................................... 5-1 6.0 Ground Characterization ................................................................................. 6-1
Baseline Description of Subsurface Conditions ................................................... 6-1 6.16.1.1 Existing Fill ......................................................................................... 6-1 6.1.2 Alluvial Fan ......................................................................................... 6-2 6.1.3 Groundwater Level .............................................................................. 6-7 6.1.4 Contaminated Soil ............................................................................... 6-7 6.1.5 Corrosive Soil ...................................................................................... 6-8 6.1.6 Groundwater Chemistry ....................................................................... 6-8
Engineering Properties of the Subsurface Materials ............................................ 6-9 6.26.2.1 Existing Fill ......................................................................................... 6-9 6.2.2 Alluvial Fan ....................................................................................... 6-10
Baseline Soil Behavior .................................................................................... 6-20 6.36.3.1 Existing Fill ....................................................................................... 6-20 6.3.2 Alluvial Fan ....................................................................................... 6-20
7.0 Design Considerations ..................................................................................... 7-1 Grade Separations ........................................................................................... 7-1 7.1
7.1.1 Support of Excavation ......................................................................... 7-1 7.1.2 Lateral Earth Pressures ........................................................................ 7-2 7.1.3 Ground Improvement .......................................................................... 7-2 7.1.4 Groundwater ...................................................................................... 7-2 7.1.5 Lateral Deflection ................................................................................ 7-2
Deep Foundations ............................................................................................ 7-3 7.2
7.2.1 Cast-in-Drilled-Hole Piles ..................................................................... 7-3 7.2.2 Axial and Lateral Resistance ................................................................ 7-3
HSR
13-
06 -
EXEC
UTI
ON
VER
SIO
N
CALIFORNIA HIGH-SPEED TRAIN PROJECT ENGINEERING GEOTECHNICAL BASELINE REPORT FOR BID
FRESNO TO BAKERSFIELD SECTION CONTRACT PACKAGE 1
Page ii
7.2.3 Groundwater ...................................................................................... 7-3 7.2.4 Downdrag and Uplift Loads .................................................................. 7-3
Retaining Walls ................................................................................................ 7-3 7.3
7.3.1 Wall Type Selection ............................................................................. 7-3 7.3.2 Structural Fill ...................................................................................... 7-4 7.3.3 Lateral Deflections .............................................................................. 7-4 7.3.4 Drainage and Scour............................................................................. 7-4
Embankments and At-Grade ............................................................................. 7-5 7.4
7.4.1 Material Selection ................................................................................ 7-5 7.4.2 Subgrade Compressibility .................................................................... 7-5 7.4.3 Compaction Control ............................................................................. 7-5 7.4.4 Subgrade Preparation .......................................................................... 7-5 7.4.5 Drainage, Scour and Erosion ................................................................ 7-5
Jacked Box Tunnel ........................................................................................... 7-6 7.57.5.1 Ground Conditions .............................................................................. 7-6 7.5.2 Jacking Pit and Base Slab .................................................................... 7-6 7.5.3 Anti-Drag System ................................................................................ 7-7 7.5.4 Jacking Equipment .............................................................................. 7-7 7.5.5 Face Support ...................................................................................... 7-7 7.5.6 Protection of Existing Structures .......................................................... 7-7
8.0 Construction Considerations ........................................................................... 8-1 Regulatory Agencies ........................................................................................ 8-1 8.1
Site Constraints ............................................................................................... 8-1 8.2 Corrosive Soils ................................................................................................. 8-1 8.3
Contaminated Soils .......................................................................................... 8-1 8.4
Difficult Excavation .......................................................................................... 8-1 8.5 Groundwater Inflows........................................................................................ 8-2 8.6
Track Subgrade Improvement .......................................................................... 8-2 8.7 Utilities and Other Obstructions ........................................................................ 8-2 8.8
Deep Foundations ............................................................................................ 8-2 8.9
8.9.1 Driven Piles ........................................................................................ 8-2 8.9.2 Cast-in-Drilled-Hole Piles ..................................................................... 8-3
Excavations ..................................................................................................... 8-3 8.10 Existing Structures ........................................................................................... 8-3 8.11
Environmental Concerns ................................................................................... 8-4 8.12
Archeological Resources ................................................................................... 8-4 8.13 Construction Consideration Matrix ..................................................................... 8-4 8.14
9.0 Instrumentation and Monitoring ..................................................................... 9-1 10.0 References ..................................................................................................... 10-1 11.0 Glossary ......................................................................................................... 11-1
HSR
13-
06 -
EXEC
UTI
ON
VER
SIO
N

CALIFORNIA HIGH-SPEED TRAIN PROJECT ENGINEERING GEOTECHNICAL BASELINE REPORT FOR BID
FRESNO TO BAKERSFIELD SECTION CONTRACT PACKAGE 1
Page iii
Tables
Table 2.0-1 Significant Structures – CP1 ................................................................................ 2-2
Table 4.3-1 Caltrans Faults, Fault Characteristics, and Distance within 100 Miles of F-B CP1 ..... 4-3 Table 4.3-2 30% Design Seismic Parameters ......................................................................... 4-5 Table 6.1-1 USCS Distribution for Alluvial Fan by Percentage of Depth Explored....................... 6-2 Table 6.1-2 Baseline Corrosion Parameters ............................................................................ 6-8 Table 6.1-3 Baseline Groundwater Chemistry Parameters ....................................................... 6-9 Table 6.2-1 Baseline Engineering Properties for Existing Fill .................................................. 6-10 Table 6.2-2 In Situ Tests by Structure Type ......................................................................... 6-10 Table 6.2-3 Baseline Engineering Properties for Alluvial Fan ................................................. 6-11 Table 6.2-4 Published Soil Modulus (AASHTO 2010) ............................................................. 6-16 Table 6.2-5 Static Modulus of Horizontal Subgrade Reaction, kh (API 1987) ........................... 6-19 Table 6.3-1 Cementation Criteria (Caltrans 2010) ................................................................. 6-20 Table 7.1-1 Earth Pressure Coefficients ................................................................................. 7-2 Table 8.14-1 Construction Considerations Matrix .................................................................... 8-5
Figures
Figure 1.1-1 Site Vicinity Map ............................................................................................... 1-2 Figure 4.3-1 Fault and Proximity to F-B CP1 ........................................................................... 4-4 Figure 6.1-1 Unified Soil Classification System (USCS) Distribution for Alluvial Fan .................. 6-3 Figure 6.1-2 Normalized CPT Soil Behavior Type (SBTN) Distribution for Alluvial Fan ................. 6-3 Figure 6.1-3 Representative Grain Size Distribution of Alluvial Fan .......................................... 6-4 Figure 6.1-4 Probability Distribution and Frequency of Grain Size Analysis with Depth .............. 6-5 Figure 6.1-5 Representative Distribution of Plasticity Characteristics ........................................ 6-6 Figure 6.1-6 Probability Distribution and Frequency of Atterberg Limits Tests with Depth ......... 6-6 Figure 6.2-1 Results of SPT (N1)60 for CP1 Showing Likely Hardpan Depth ............................. 6-13 Figure 6.2-2 Results of Remolded Direct Shear Tests ........................................................... 6-15 Figure 6.2-3 Soil Modulus Correlations from SPT Data .......................................................... 6-16 Figure 6.2-4 Vs30 Measurements .......................................................................................... 6-18 Figure 6.2-5 Modulus of Vertical Subgrade Reaction ............................................................. 6-19 Figure 6.3-1 Guide to Collapsibility, Compressibility, and Expansion (Mitchell and Gardner
1975, and Gibbs 1969) ............................................................................... 6-22 Figure 7.3-1 Fines Content Histogram ................................................................................... 7-4
Appendices
Appendix A Soil Parameter Interpretations
HSR
13-
06 -
EXEC
UTI
ON
VER
SIO
N

CALIFORNIA HIGH-SPEED TRAIN PROJECT ENGINEERING GEOTECHNICAL BASELINE REPORT FOR BID
FRESNO TO BAKERSFIELD SECTION CONTRACT PACKAGE 1
Page iv
ABBREVIATIONS
AASHTO American Association of State Highway Transportation Officials
ADS Anti-Drag System API American Petroleum Institute
ASTM ASTM International (formerly American Society for Testing and Materials) Authority California High-Speed Rail Authority
BGL Below Ground Level
Caltrans California Department of Transportation CIDH Cast-in-Drilled-Hole
cm Centimeter CP1 Contract Package 1
CPT Cone Penetration Test EIS/EIR Environmental Impact Statement/Report
Es Soil Modulus
F-B Fresno to Bakersfield ft Feet
g Gravity GBR-B Geotechnical Baseline Report for Bid
GBR-C Geotechnical Baseline Report for Construction
GDR Geotechnical Data Report HMM Hatch Mott MacDonald
HST California High-Speed Train Project JV HMM/URS/Arup Joint Venture
kh Modulus of Horizontal Subgrade Reaction
k’v Modulus of Vertical Subgrade Reaction kN Kilonewton
MCE Maximum Considered Earthquake mi Miles
mm Millimeters MW Moment Magnitude
(N1)60 Standard Penetration Test N-Value Corrected for Overburden and Field Procedures
N60 Standard Penetration Test N-Value Corrected for Hammer Energy NA Not Available
NAVD88 1988 North American Vertical Datum NPDES National Pollutant Discharge Elimination System
NRCS National Resources Conservation Service
OBE Operating Basis Earthquake OSHA Occupational Safety and Health Administration
ppm Parts Per Million PEP Preliminary Engineering for Procurement
qc CPT Cone Resistance qt CPT Cone Resistance Corrected for Pore Water Effects
SBTN Normalized CPT Soil Behavior Type
sec second SJV San Joaquin Valley
SJVRR San Joaquin Valley Railroad SPT Standard Penetration Test
SR State Route
SWPPP Storm Water Pollution Prevention Plan T Period
TM Technical Memorandum umhos Micromhos
HSR
13-
06 -
EXEC
UTI
ON
VER
SIO
N

CALIFORNIA HIGH-SPEED TRAIN PROJECT ENGINEERING GEOTECHNICAL BASELINE REPORT FOR BID
FRESNO TO BAKERSFIELD SECTION CONTRACT PACKAGE 1
Page v
UPRR Union Pacific Railroad
USCS Unified Soil Classification System USDA United States Department of Agriculture
USGS United States Geological Survey Vs30 Average Shear Wave Velocity in the Upper 30 Meters
WEAP Wave Equation Analysis of Piles
HSR
13-
06 -
EXEC
UTI
ON
VER
SIO
N
CALIFORNIA HIGH-SPEED TRAIN PROJECT ENGINEERING GEOTECHNICAL BASELINE REPORT FOR BID
FRESNO TO BAKERSFIELD SECTION CONTRACT PACKAGE 1
Page 1-1
1.0 Introduction
The California High-Speed Train (HST) Project will provide intercity, high-speed train service throughout
California’s major population centers. A joint venture (JV) between URS, Hatch Mott MacDonald (HMM), and Arup has been contracted by the California High-Speed Rail Authority (Authority) to perform
preliminary engineering for procurement (PEP) engineering services for the portion of the project that extends between Fresno and Bakersfield.
Contract Package 1 (CP1) of the California HST Project extends from Avenue 17 in Madera to E American
Avenue in Fresno. The northern section of CP1, from Avenue 17 to W Clinton Avenue is within the
Merced to Fresno segment of the HST. The southern segment of CP1, from W Clinton Avenue to about E American Avenue, is within the Fresno to Bakersfield (F-B) segment of the HST. The JV is responsible
for this segment.
F-B CP1 corridor spans approximately 9 miles from W Clinton Avenue to about E American Avenue in Fresno County, as shown in Figure 1.1-1. For brevity, where CP1 is referred to in this report, it shall be
construed to mean only the F-B section of the corridor contracted to the JV.
HSR
13-
06 -
EXEC
UTI
ON
VER
SIO
N

CALIFORNIA HIGH-SPEED TRAIN PROJECT ENGINEERING GEOTECHNICAL BASELINE REPORT FOR BID
FRESNO TO BAKERSFIELD SECTION CONTRACT PACKAGE 1
Page 1-2
Figure 1.1-1
Site Vicinity Map
HSR
13-
06 -
EXEC
UTI
ON
VER
SIO
N

HSR
13-
06 -
EXEC
UTI
ON
VER
SIO
N

CALIFORNIA HIGH-SPEED TRAIN PROJECT ENGINEERING GEOTECHNICAL BASELINE REPORT FOR BID
FRESNO TO BAKERSFIELD SECTION CONTRACT PACKAGE 1
Page 1-3
Geotechnical Contract Documents 1.1
The geotechnical Contract Documents include this Fresno to Bakersfield Geotechnical Baseline Report for
Bid (GBR-B) and the Fresno to Bakersfield Geotechnical Data Report (GDR) CP1 (URS/HMM/Arup 2012).
The GDR provides details of the geotechnical investigation such as drilling procedures, soil sampling, in situ testing, hydrogeologic testing, and historical geotechnical information gathered prior to the
exploration phase. The GDR also includes exploration logs, details pertaining to laboratory testing, procedures used to conduct various index tests, strength and deformation tests, test results and a limited
environmental assessment. Definitions for terms used in both the GBR-B and GDR are contained in the Glossary.
Contractually, this GBR-B and the referenced GDR cover only the F-B CP1 corridor.
Purpose 1.2
The principal purpose of this GBR-B is to set baselines for conditions to facilitate the bidding process such
that all bidders can rely on a single contractual interpretation of the geotechnical conditions when
preparing their bids. This report summarizes the geotechnical basis for PEP and anticipated conditions for construction of the CP1 alignment, which extends between W Clinton Avenue and about E American
Avenue.
This GBR-B is a representation of the conditions upon which the Contractor may rely for bidding. Geotechnical investigations conducted in preparation of the GDR are considered preliminary and should
not be solely relied on for final design. It is incumbent upon the Contractor to conduct supplemental investigations adequate to complete final design and prepare a Geotechnical Baseline Report for
Construction (GBR-C). The GBR-C will serve as the basis of resolution for differing site conditions during
construction. The GBR-B has been prepared such that it will be superseded by the GBR-C, and the GBR-C will incorporate additional geotechnical exploration data and analyses. The GBR-C will become the basis
of final design and construction conditions.
The engineering judgment applied in the interpolations and extrapolations of information contained in the GDR reflect the view of the Authority in establishing the baseline conditions. The baseline conditions
presented in this report will (1) serve as a baseline for geotechnical conditions anticipated to be encountered and (2) assist the contractor in evaluating the requirements for excavating and supporting
the ground.
Report Structure 1.3
This report has been prepared in general accordance with Technical Memorandum (TM) 2.9.2
Geotechnical Reports Preparations Guidelines and the latest edition of the American Society of Civil Engineers’ publication Geotechnical Baseline Reports for Construction – Suggested Guidelines (Essex
2007). Sections 1 through 5 provide background information while Sections 6 through 9 provide specific recommendations related to ground characterization and behavior. Sections 10 and 11 provide reference
information.
Section 1 provides an introduction to the project including project location, report purpose and organization. Section 2 provides a project description including key project features and existing man-
made structures of significance to the project. Section 3 describes sources of geotechnical information
including prior geotechnical reports, TMs, data from desk studies and data from the PEP Geotechnical Investigation for CP1. Section 4 describes the project setting through physiography, geology, seismicity,
and hydrogeology; Section 5 describes previous construction experience in the project vicinity.
HSR
13-
06 -
EXEC
UTI
ON
VER
SIO
N

CALIFORNIA HIGH-SPEED TRAIN PROJECT ENGINEERING GEOTECHNICAL BASELINE REPORT FOR BID
FRESNO TO BAKERSFIELD SECTION CONTRACT PACKAGE 1
Page 1-4
Section 6 presents ground characterization and geotechnical baselines; Section 7 describes design
considerations for the various proposed structures; Section 8 describes construction considerations; Section 9 describes recommended instrumentation and monitoring during construction.
Section 10 is a list of documents referenced in this report; Section 11 is a glossary of terms used in this
report.
Basis of Report 1.4
The baseline values in this report have been developed from geotechnical information and data gathered through desk studies and the PEP Geotechnical Investigation, which included widely spaced exploratory
boreholes, cone penetration tests (CPTs), and laboratory and field tests. The results from this investigation are summarized in the GDR.
Project Constraints and Restrictions 1.5
The baseline recommendations in this report have been derived from the available data. Limited site
access, limited historical data, and wide spacing of explorations constrain the recommendations to a level
appropriate for PEP, not final design. For the portion of the F-B CP1 between W. Clinton Avenue and Golden State Boulevard, preliminary engineering for procurement (PEP) for structures was advanced
using geotechnical parameters from historical data only. When the GDR and this GBR-B became available, design assumptions were checked against the baselines herein for applicability of the parameters
developed with historical data. The design of structures south of Golden State Boulevard was advanced using the baseline geotechnical parameters presented herein.
During construction, ground behavior will be influenced by the Contractor’s selected design, equipment,
means, methods, and level of workmanship. The Contractor must assess how these factors will influence
ground behavior and baseline values provided in this report in consideration of the project as a whole.
The baseline configuration for CP1 is shown in the Contract Plans and Specifications (Contract
Documents). Certain construction elements in the Contract Documents are mandatory, while others are
the Contractor’s responsibility to develop. The mandatory requirements are defined in the Contract Documents. The site conditions described herein are intended to apply to the reference design in the
Contract Documents.
HSR
13-
06 -
EXEC
UTI
ON
VER
SIO
N

CALIFORNIA HIGH-SPEED TRAIN PROJECT ENGINEERING GEOTECHNICAL BASELINE REPORT FOR BID
FRESNO TO BAKERSFIELD SECTION CONTRACT PACKAGE 1
Page 2-1
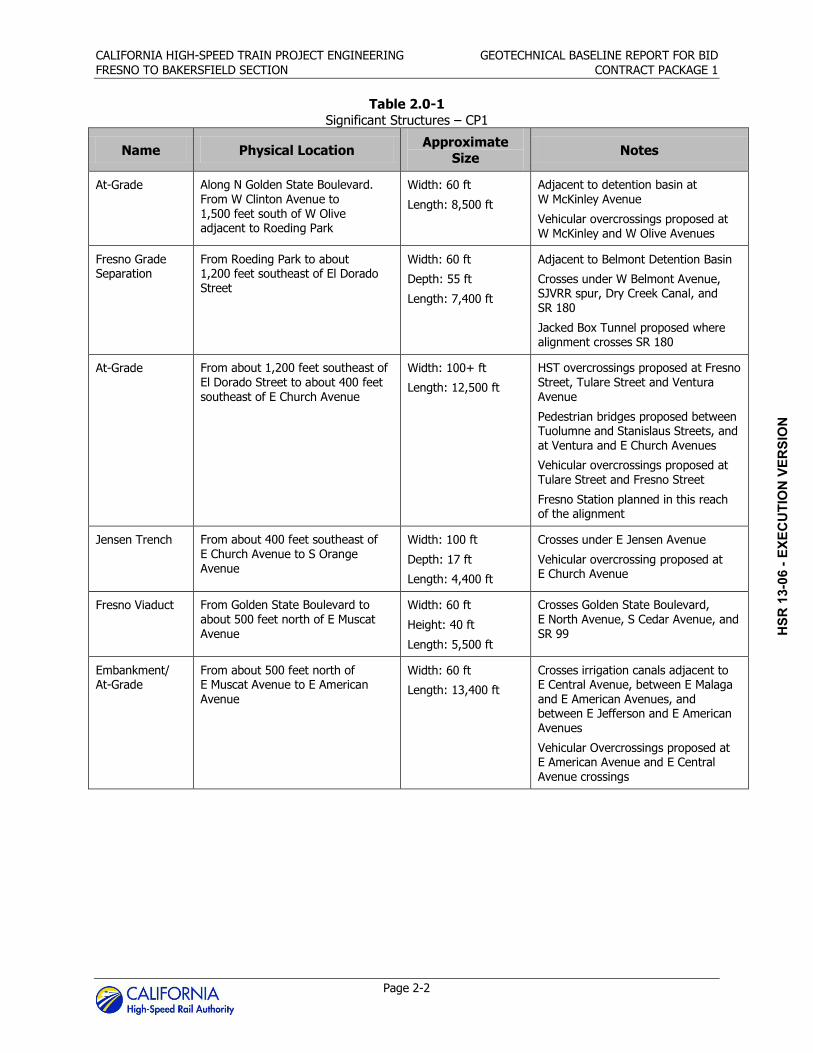
2.0 Project Description
The F-B CP1 project alignment starts at the intersection of W Clinton Avenue and N Golden State
Boulevard in Fresno, California. The alignment continues southeast along Golden State Boulevard for about 2 miles to W Belmont Avenue. South of W Belmont Avenue, the alignment continues southeast
between an existing rail right-of-way and G Street for about 2.8 miles where G Street terminates at Golden State Boulevard. At this point, the alignment continues southeast about 1.1 miles between the
existing rail right-of-way and Golden State Boulevard until its intersection with E Jensen Avenue, where it
veers south crossing Golden State Boulevard, E North Avenue, Golden State Freeway, and E Central Avenue. South of E Central Avenue, the alignment is adjacent to an existing rail right-of-way and
continues south for about 2 miles until the end of CP1 just north of E American Avenue.
The alignment is adjacent to Roeding Park north of Belmont Avenue; crosses the Sequoia Kings Canyon Freeway (SR 180), Yosemite Freeway (SR 41), and Golden State Highway (SR 99); crosses irrigation
canals north of SR 180 and south of E Central Avenue; and is adjacent to a detention basin at the
intersection of E McKinley Avenue and N Golden State Boulevard, and at W Belmont Avenue.
Baseline configuration for CP1 includes at-grade and embankments rail sections, two trenches, a viaduct,
and a jacked box tunnel. CP1 work also includes numerous secondary transverse vehicular and
pedestrian bridges at select local street intersections. Shallow and deep foundations, retaining walls, and earthwork embankments will be required for the proposed improvements. The key project features are
described in Table 2.0-1 from north to south.
HSR
13-
06 -
EXEC
UTI
ON
VER
SIO
N
CALIFORNIA HIGH-SPEED TRAIN PROJECT ENGINEERING GEOTECHNICAL BASELINE REPORT FOR BID
FRESNO TO BAKERSFIELD SECTION CONTRACT PACKAGE 1
Page 2-2
Table 2.0-1
Significant Structures – CP1
Name Physical Location Approximate
Size Notes
At-Grade Along N Golden State Boulevard. From W Clinton Avenue to 1,500 feet south of W Olive adjacent to Roeding Park
Width: 60 ft
Length: 8,500 ft
Adjacent to detention basin at W McKinley Avenue
Vehicular overcrossings proposed at W McKinley and W Olive Avenues
Fresno Grade Separation
From Roeding Park to about 1,200 feet southeast of El Dorado Street
Width: 60 ft
Depth: 55 ft
Length: 7,400 ft
Adjacent to Belmont Detention Basin
Crosses under W Belmont Avenue, SJVRR spur, Dry Creek Canal, and SR 180
Jacked Box Tunnel proposed where alignment crosses SR 180
At-Grade From about 1,200 feet southeast of El Dorado Street to about 400 feet southeast of E Church Avenue
Width: 100+ ft
Length: 12,500 ft
HST overcrossings proposed at Fresno Street, Tulare Street and Ventura Avenue
Pedestrian bridges proposed between Tuolumne and Stanislaus Streets, and at Ventura and E Church Avenues
Vehicular overcrossings proposed at Tulare Street and Fresno Street
Fresno Station planned in this reach of the alignment
Jensen Trench From about 400 feet southeast of E Church Avenue to S Orange Avenue
Width: 100 ft
Depth: 17 ft
Length: 4,400 ft
Crosses under E Jensen Avenue
Vehicular overcrossing proposed at E Church Avenue
Fresno Viaduct From Golden State Boulevard to about 500 feet north of E Muscat Avenue
Width: 60 ft
Height: 40 ft
Length: 5,500 ft
Crosses Golden State Boulevard, E North Avenue, S Cedar Avenue, and SR 99
Embankment/ At-Grade
From about 500 feet north of E Muscat Avenue to E American Avenue
Width: 60 ft
Length: 13,400 ft
Crosses irrigation canals adjacent to E Central Avenue, between E Malaga and E American Avenues, and between E Jefferson and E American Avenues
Vehicular Overcrossings proposed at E American Avenue and E Central Avenue crossings
HSR
13-
06 -
EXEC
UTI
ON
VER
SIO
N
CALIFORNIA HIGH-SPEED TRAIN PROJECT ENGINEERING GEOTECHNICAL BASELINE REPORT FOR BID
FRESNO TO BAKERSFIELD SECTION CONTRACT PACKAGE 1
Page 3-1
3.0 Sources of Geologic and Geotechnical Information
Project Sources 3.1
Data and information for this report were primarily obtained from publically available reports and results
of the 30% Geotechnical Investigation. Additional information was obtained from the following reference documents:
F-B Draft EIS/EIR (URS/HMM/Arup 2012a)
F-B Geology, Soils and Seismicity Technical Report (URS/HMM/Arup 2012b)
F-B Geologic and Seismic Hazards Report (URS/HMM/Arup 2012c)
F-B Water Hydrology, Hydraulics and Drainage Report (URS/HMM/Arup 2012d)
F-B 15% Draft Utility Impact Report (URS/HMM/Arup 2012e)
F-B Archeological Survey (URS/HMM/Arup 2011)
Site Investigations 3.2
The 30% Geotechnical Investigation for CP1 was conducted between October 10 and 28, 2011 and consisted of drilling 17 rotary-wash boreholes and performing 44 CPTs. Soil samples were collected from
boreholes at 5-foot intervals using Standard Penetration Test (SPT) samplers driven with automatic hammers. Energy calibration tests were performed on the automatic hammers used during the
exploration program.
In situ testing performed during the investigation included shear wave velocity profiles in 4 boreholes using the suspension velocity logging method, shear wave velocity profiles in 6 CPTs, and pore water
pressure dissipation tests in 19 CPTs. Seven boreholes were converted to standpipe piezometers to
monitor groundwater level fluctuations.
Laboratory testing was performed on representative soil samples to obtain index and engineering properties. Geotechnical index property testing included moisture content, grain-size analyses, Atterberg
limits (plasticity), and organic content tests. Engineering property tests included direct shear strength, Modified Proctor compaction, California Bearing Ratio, and corrosion tests. Groundwater chemistry testing
was also performed on water samples obtained from standpipe piezometers.
Historical Investigations 3.3
The primary source of publicly available historical geotechnical data collected during 15% design was from the California Department of Transportation (Caltrans) database of as-built construction records.
Caltrans data are mainly concentrated along Routes 41, 43, and 99, from projects dating between 1953
and 1997. For each project, several boreholes were drilled, logged, and plotted on a cross section. None
of the Caltrans records contain laboratory test data. Borehole records collected from Caltrans extend to a maximum depth of 122 feet below ground level (BGL), with an average borehole depth of 42 feet BGL.
Historical Caltrans data are included in Appendix A of the GDR. H
SR 1
3-06
- EX
ECU
TIO
N V
ERSI
ON

HSR
13-
06 -
EXEC
UTI
ON
VER
SIO
N

CALIFORNIA HIGH-SPEED TRAIN PROJECT ENGINEERING GEOTECHNICAL BASELINE REPORT FOR BID
FRESNO TO BAKERSFIELD SECTION CONTRACT PACKAGE 1
Page 4-1
4.0 Physiography & Geology Overview
The section provides a brief description of physiography, geology, and seismicity within the CP1 corridor.
Detailed discussion of physiography, geology, and seismicity along the entire F-B alignment is presented in the Geologic and Seismic Hazards Report (URS/HMM/Arup 2012c).
Physiography 4.1
The CP1 alignment is located within the southern portion of the 450-mile-long Great Valley Geomorphic
Valley (Bartow 1991). The topography of the Great Valley (commonly referred to as the San Joaquin Valley [SJV]) is relatively flat; it is bordered by the Pacific Coast Range to the west, the Klamath
Mountains and Cascade Range to the north, the Sierra Nevada to the east, and San Emigdio and
Tehachapi mountains to the south.
Superimposed upon this large-scale, relatively flat topography is a localized topography caused by recent incisions of river systems. This localized topography is comprised of short, steep river/stream banks with
channels at lower elevations relative to the surrounding areas. These channel bottoms range between wide, relatively flat-bottomed (with occasional rounded natural levees) or narrow gully-type valleys,
depending on their age and the amount of flow; however, along the CP1 alignment these features appear to have been either channelized or redirected along more convenient routes to accommodate the present
urbanization.
The natural topography along the CP1 alignment is generally flat and varies between 285 and 295 feet
(1988 North American Vertical Datum, NAVD88). The elevations of exploratory holes performed during the 30% Geotechnical Investigation varied between 283 and 306 feet (NAVD88). Localized variations in
the ground surface elevation generally occur at existing road embankments, detention basins, and other man-made features such as irrigation canals and road crossings.
Geologic Setting 4.2
4.2.1 Regional Geology
In his discussion of geology in the southern SJV, Bartow (1991) writes that the SJV is an “asymmetric
structural trough that is filled with prism sediments up to 30,000 feet thick. It formed the southern part of an extensive fore-arc basin that evolved during the Cenozoic into today’s hybrid intermontane basin”.
Bartow continues discussing the sedimentation infill of the SJV, stating that it
evolved through the gradual restriction of the marine basin due to uplift and emergence
of the northern Great Valley in the late Paleogene, the closing off of the western outlets in the Neogene, and finally the sedimentary infilling in the Neogene and Quaternary.
These sediments rest on crystalline basement rocks of the southwestward-tilted Sierran
block (1991).
4.2.2 Local Geology
According to the City of Kerman General Plan (2007), the local geology of the Kerman and Fresno area
is created by the low alluvial fans of the perennial San Joaquin River and four ephemeral
streams that form the Alluvial Fan sequence. The Pleistocene formations that make up the Fresno fan sequence are the Modesto, Riverbank, and Turlock formations.
In this report, the Modesto, Riverbank, and Turlock formations have been identified as Qf, Qc, and Qp,
respectively. These deposits make up the major surface and subsurface units and originate from stream
HSR
13-
06 -
EXEC
UTI
ON
VER
SIO
N

CALIFORNIA HIGH-SPEED TRAIN PROJECT ENGINEERING GEOTECHNICAL BASELINE REPORT FOR BID
FRESNO TO BAKERSFIELD SECTION CONTRACT PACKAGE 1
Page 4-2
channels emanating from the foothills east of Fresno. They are similar in mineralogy, deposition, and
source.
The Modesto foundation is often referred to as a terrace deposit and
occupies the highest stratigraphic position. Sediments within the Modesto formation
range in grain size from clay to gravel and seldom exhibit well-developed sedimentary
structures. The Riverbank formation underlies the Modesto formation, but does not differ greatly in lithology or texture. It is also characterized by the occurrence of a laterally
extensive, but not pervasive, caliché hardpan member (Cehrs et al 1980).
Cehrs et al continue, “The Turlock formation is the oldest unit exposed in the Fresno alluvial fan sequence and forms extensive subsurface deposits throughout the SJV. It contains the majority of the
hydrologically important subsurface deposits in the Fresno area” (1980).
Because of the depth of the Turlock formation, it is unlikely this unit will be encountered during construction.
South of E North Avenue there is a possibility of encountering sand dunes overlying the Modesto
Formation. Aeolian sand dunes appear on some geologic maps but not others. The sand dunes have been described to have a relief of about 5 to 20 feet and are associated with a group of surface expressions
that trend southeast. These dune deposits are well sorted and moderately permeable.
Additional information, including geologic cross sections, local geologic map, and hydrogeologic cross
sections are presented in the GDR.
Seismic Setting 4.3
According to Jennings, the Fresno area is located “within a relatively seismically quiescent region between two areas of documented tectonic activity, the Coast Ranges-Sierran Block boundary zone to the east and
the Pacific Coast Ranges boundary zone to the west” (1994).
Jennings colleagues, Unruh and Moores continue,
The Coast Ranges-Sierran Block, which follows the physiographic boundary between the Coast Ranges and Great Valley geomorphic provinces, contains potentially active blind
thrust faults. Based on the size of historical events and on the inferred subsection of the boundary zone, these blind thrust faults are capable of producing moderate to large
earthquakes. (1992)
Jennings identifies the predominant source of seismic shaking in the SJV as the Pacific Coast Ranges, which contain “many active faults that are associated with the northwest-trending San Andreas Fault
System” (1994). The San Andreas Fault System is the principal tectonic element of the North American-
Pacific plate boundary in California.
4.3.1 Faults & Seismicity
There are no known active faults crossing or within close proximity to the alignment within the study
area. Consequently, there are also no restrictions to development in the way of Alquist-Priolo earthquake
fault zones as defined under the as defined by the California Division of Mines and Geology. The San Andreas Fault, located approximately 65 miles from the site, has the highest slip rate and is the most
seismically active of any fault near the F-B alignment.
Caltrans used the USGS fault database to develop seismic hazard contours in 2007. The Caltrans map and Caltrans fault database were used to develop Table 4.3-1, which lists the faults within 100 miles of the
HSR
13-
06 -
EXEC
UTI
ON
VER
SIO
N

CALIFORNIA HIGH-SPEED TRAIN PROJECT ENGINEERING GEOTECHNICAL BASELINE REPORT FOR BID
FRESNO TO BAKERSFIELD SECTION CONTRACT PACKAGE 1
Page 4-3
F-B CP1 alignment. Figure 4.3-1 shows the F-B CP1 alignment located approximately on the Caltrans fault
map with fault identification numbers.
Table 4.3-1 Caltrans Faults, Fault Characteristics, and Distance within 100 Miles of F-B CP1
Fault Name
Caltrans
Fault
ID
Fault
Mechanism
Maximum
Moment Magnitude
(Mmax)
Approximate
Distance from F-B CP1
(miles)
Great Valley fault 7 through 14 25, 26, 32, 33, 34, 35, 36, 37
R 6.3-6.7 42-91
O'Neill fault 51 R 6.7 48
Ortigalita fault zone
(Piedra Azul section) (Los Banos section) (Ortigalita-Cottonwood Arm section)
389 387 388
RLSS 7.1 61 69 67
San Andreas fault zone (Creeping section)
311 RLSS 7.9 65
Melones fault zone 50 N 6.5 86
Bear Mountains fault zone (Bowie Flat fault section) (Green Springs Run fault) (Negro Jack fault section)
251 198 159 N 6.5 86
Kern Gorge 359 N 6.6 98
Southern Sierra Nevada fault zone
(Independence section) 185 N 7.1 79
Owens Valley fault zone (1872 Rupture section) 391 RLSS 7.6 88
White Mountains fault zone (Inyo section) 419 RLSS 7.4 91
Round Valley fault 174 N 7 73
Hilton Creek fault 173 N 6.7 73
Hartley Springs fault zone 172 N 6.6 78
Silver Lake fault 171 N 6.9 78
Rinconada fault zone (San Marcos section) 400 RLSS 7.5 89
Calaveras fault zone (Southern Calaveras section) (Paicines section)
323 324
RLSS 7.4 80
Sargent fault (Southeastern section) 405 RLSS 6.8 96
HSR
13-
06 -
EXEC
UTI
ON
VER
SIO
N

HSR
13-
06 -
EXEC
UTI
ON
VER
SIO
N

CALIFORNIA HIGH-SPEED TRAIN PROJECT ENGINEERING GEOTECHNICAL BASELINE REPORT FOR BID
FRESNO TO BAKERSFIELD SECTION CONTRACT PACKAGE 1
Page 4-4
Note: PGA contours shown are not for use in design or baseline.
Figure 4.3-1 Fault and Proximity to F-B CP1
HSR
13-
06 -
EXEC
UTI
ON
VER
SIO
N

HSR
13-
06 -
EXEC
UTI
ON
VER
SIO
N

CALIFORNIA HIGH-SPEED TRAIN PROJECT ENGINEERING GEOTECHNICAL BASELINE REPORT FOR BID
FRESNO TO BAKERSFIELD SECTION CONTRACT PACKAGE 1
Page 4-5
4.3.2 Design Earthquake and Design Ground Motion
For the CP1 alignment, two design level earthquakes have been defined for final design per the Design
Criteria Manual:
Maximum Considered Earthquake (MCE): ground motions corresponding to greater of (1) a probabilistic spectrum based upon a 10% probability of exceedance in 100 years (i.e., a return
period of 950 years) and (2) a deterministic spectrum based upon the largest median response
resulting from the maximum rupture (corresponding to maximum moment magnitude [Mw]) of any fault in the vicinity of the structure.
Operating Basis Earthquake (OBE): ground motions corresponding to a probabilistic
spectrum based upon an 86% probability of exceedance in 100 years (i.e., a return period of 50 years).
Site-specific spectrally matched response spectra and peak ground accelerations for the Central Valley
alignment between Merced and Bakersfield were developed for PEP. Peak ground accelerations and moment magnitudes used for preliminary liquefaction evaluations discussed in Section 4.3.3 are shown
on Table 4.3-2. Acceleration response spectra are provided in the Design Criteria Manual.
Table 4.3-2 30% Design Seismic Parameters
Seismic Parameter OBE MCE
Peak ground acceleration (g) 0.08 0.25
Moment magnitude (Mw) 6.6 – 8.0 6.6 – 8.0
For each geological site and over river crossings, creeks, channels where highly compressible and loose
soils may be present, site-specific subsurface data including shear wave velocity, groundwater table, soil consistency shall be obtained by the contractor and submitted to the Authority for updating final ground
motion analyses, the results of which will be provided to the contractor for final design.
4.3.3 Liquefaction
Liquefaction assessments for the CP1 alignment were performed for both the OBE and MCE events using the subsurface data presented in the GDR. Based on an assumed groundwater level at 40 feet BGL, it has
been concluded that soil liquefaction on a global basis is unlikely to occur following a strong earthquake
on one of the nearby faults; however, localized liquefaction in discrete layers is possible.
For bidding purposes, assume liquefaction will not occur; however, the Contractor is required to perform an independent liquefaction hazard analyses for final design.
Hydrologic Setting 4.4
4.4.1 Regional
The HST alignment is located within the Kings Sub Basin. A hydrogeologic cross-section of the basin is
included in the GDR. Groundwater within the northeastern quadrant of the basin is managed under the Fresno Regional Area Groundwater Management Plan. Groundwater is the sole source of drinking water
in the region. The current and potential uses of groundwater in the basin are municipal and domestic supply, industrial process supply, industrial service water supply, and agricultural water supply.
HSR
13-
06 -
EXEC
UTI
ON
VER
SIO
N

CALIFORNIA HIGH-SPEED TRAIN PROJECT ENGINEERING GEOTECHNICAL BASELINE REPORT FOR BID
FRESNO TO BAKERSFIELD SECTION CONTRACT PACKAGE 1
Page 4-6
Prior to urbanization and agricultural pumping, the groundwater table was within 20 or 30 feet of the
ground surface. Urbanization and the pumping demand on the groundwater table have caused a cone of depression within the city of Fresno.
Groundwater well measurements by the City of Fresno indicate the groundwater table has experienced a
depletion of about 60 feet since 1960 and about 100 feet since 1930. Historical groundwater levels are discussed in the GDR.
The regional groundwater flow direction in this area is from east to west. There are some localized
influences as a result of both pumping, surface water treatment and groundwater recharge appurtenances.
4.4.2 Major Aquifers
The depositional environment has formed a sequence of aquifers and aquitards that vary in thickness and
lateral continuity. Aquifers are generally composed of granular water-bearing sediments and aquitards are composed of finer-grained sediments that retard water flow. Three aquitards A, B, and C have been
reported to exist in the vicinity of the project (CH2M Hill 2005. Most of the aquifers underlying the study
area are unconfined but can be semi-confined in isolated locations. The primary aquifer in the study area is Fresno Sole Source Aquifer.
Generally, there are no extensive, low-permeability soils that isolate the upper aquifers from the lower
aquifers. The Corcoran Clay (E-Clay) and correlative layers underlie the city of Fresno at a depth of about 300 feet BGL (Brown & Caldwell 2006).
4.4.3 Current Groundwater Conditions
Groundwater levels were monitoring as part of the 30% Geotechnical Investigation. Currently, the
groundwater level is at about 90 feet BGL throughout the Fresno city limits and gently rises to about 60 feet BGL toward the southern reaches of the CP1 alignment. Perched groundwater was encountered
during the investigation and can be encountered during construction.
Baseline groundwater levels are presented in Section 6.
4.4.4 Land Subsidence
Many areas within the SJV have experienced significant subsidence due to groundwater extraction. However, there is no documented historic land subsidence within the study area. The area may have
experienced land subsidence in the early 1930s when it was prevalent in the SJV; however, no significant land subsidence is known to have occurred in the last 50 years as a result of land development, water
resources development, groundwater pumping, or oil drilling.
The GDR includes the results of a cursory assessment of land subsidence made within the limits of CP1 relative to existing topography. The assessment confirmed that there has been no detectible land
subsidence in the Fresno Area.H
SR 1
3-06
- EX
ECU
TIO
N V
ERSI
ON
CALIFORNIA HIGH-SPEED TRAIN PROJECT ENGINEERING GEOTECHNICAL BASELINE REPORT FOR BID
FRESNO TO BAKERSFIELD SECTION CONTRACT PACKAGE 1
Page 5-1
5.0 Related Construction
The following is a brief description of several large, transportation related infrastructure improvements in
the vicinity of the proposed CP1 alignment. Three freeways of the California State Highway System either traverse or are adjacent to the proposed alignment, including SR 99, SR 41, and SR 180.
SR 99 in Fresno runs parallel to the proposed alignment and is generally located 0 to 0.6 miles to the
west of the CP1 alignment. SR 99 was upgraded to a six-lane freeway in the 1950s with construction lasting from 1947 to 1960. The historic US-99 route followed Golden State Boulevard along surface
streets through the City of Fresno. The six-lane freeway structure completed in 1960 bypassed Golden
State Boulevard and is now also called the Golden State Highway. The section of the current SR 99 south of Ventura Avenue was constructed at a later date.
The following provide project background on the construction of SR 99 through Fresno. These articles do
not contain technical and engineering information:
California Highways and Public Works, 1955 “Fresno Freeway: Will Provide Many Benefits to
Through and Local Traffic,” September-October, pp. 27-29.
California Highways and Public Works, 1957. “Fresno Freeway: 11-year Study Brings $11,000,000
Bypass,” November-December, pp. 22-24.
California Highways and Public Works, 1957. “The New Look: Fresno Working on Pattern of
Highways,” July-August, pp. 10-13.
California Highways and Public Works, 1960. “Fresno Freeway: Northern Extension Eliminates last
Three-lane Section on Highway 99,” July-August, pp. 7-9.
The SR 41 freeway structure runs north-south and was constructed in the 1980s. The SR 180 freeway
structure run east-west traversing the HST alignment and was constructed between 1992 and 1995.
Geotechnical logs of test borings for several structures along these freeways were collected from Caltrans database of as-built construction records. These logs of test borings are presented in Appendix A of the
GDR.
Additional information regarding construction methods, ground behavior, groundwater conditions, ground support methods, and problems during construction were not described in any of the as-built construction
records obtained.
HSR
13-
06 -
EXEC
UTI
ON
VER
SIO
N
HSR
13-
06 -
EXEC
UTI
ON
VER
SIO
N

CALIFORNIA HIGH-SPEED TRAIN PROJECT ENGINEERING GEOTECHNICAL BASELINE REPORT FOR BID
FRESNO TO BAKERSFIELD SECTION CONTRACT PACKAGE 1
Page 6-1
6.0 Ground Characterization
Baseline Description of Subsurface Conditions 6.1
Subsurface soils have been characterized into two separate strata: (1) Existing Fill and (2) Alluvial Fan.
The Alluvial Fan stratum is assumed to include the Modesto (Qf) and Riverbank (Qc) formations and Sand Dunes (Qs). The Turlock (Qp) formation was not encountered during the 30% Geotechnical Investigation
and is not anticipated to be encountered during construction.
A distinction was not made between the Modesto, Riverbank, and Sand Dunes for bidding purposes because a discernible difference between their composition and engineering properties was not identified
during the investigation.
Baseline descriptions for Existing Fill and Alluvial Fan are presented in Sections 6.1.1 and 6.1.2. Baseline
engineering properties for Existing Fill and Alluvial Fan are described in Sections 6.2.1 and 6.2.2, respectively. General baseline descriptions for behavioral response are presented in Section 6.3.
6.1.1 Existing Fill
Existing Fill encountered during the geotechnical investigation varied from 1 to 7 feet in thickness. The
depth of Existing Fill was identified chiefly from hand augering during utility clearance prior to each point of exploration. Existing Fill consists of Silty Sand (SM), Sand with Silt (SP-SM), Sandy Silt (ML), Silt (ML),
and contains varying amounts of fine gravel. Ceramic and glass debris were present in Existing Fill encountered in borehole S0001R.
Existing Fill also includes surface pavements consisting of asphalt concrete (AC), concrete, and aggregate
base. Where encountered, existing AC varied from 4 to 8 inches in thickness, aggregate base from zero to 9 inches; concrete for road gutter measured about 12 inches at borehole S0004R.
No historical records describing how Existing Fill was placed and compacted were located during
preliminary desk studies.
On average, boreholes and CPTs from the field exploration were spaced 1 and 1/3 miles apart, respectively. Areas with deeper Existing Fill or with Existing Fill containing debris and garbage are likely
present between exploratory holes. In the Fresno Area, it is not uncommon to encounter debris of
unknown origin during construction excavations.
For bidding purposes, assume Existing Fill blankets the ground surface from W Clinton Avenue to E North Avenue and is present to a depth of 5 feet BGL. South of E North Avenue, assume Existing Fill blankets
the ground surface and is present to a depth of 2 feet BGL.
It should be noted that in the immediate vicinity of the SR 180 overcrossing and planned Fresno Grade Separation, Caltrans as-built construction records indicate 12 to 13 feet of fill was initially placed to raise
the surface elevation from 284 feet to 296 feet (NGVD29) to support the overcrossing foundations. After these foundations were constructed, approximately 20 feet of additional fill was added to raise the grade
to its existing elevation of about 317 feet (NAVD88). In total, over 30 feet of fill has been added in the
area where SR 180 intersects the CP1 alignment.
The nature of drilling and sampling methods used and borehole spacing makes it difficult to quantify the
maximum size of fragments in Existing Fill. For bidding purposes, assume debris up to 1 foot in greatest
dimension is present in Existing Fill. In addition, assume existing asphalt and concrete pavements and aggregate base rock are 9 inches thick.
According to published maps and reports from United States Department of Agriculture (USDA), Natural
Resources Conservation Service (NRCS) San Joaquin, Greenfield, and Lorena soil series have hardpan
HSR
13-
06 -
EXEC
UTI
ON
VER
SIO
N

CALIFORNIA HIGH-SPEED TRAIN PROJECT ENGINEERING GEOTECHNICAL BASELINE REPORT FOR BID FRESNO TO BAKERSFIELD SECTION CONTRACT PACKAGE 1
Page 6-2
layers that are similar in composition and thickness. They are described as varying between 12 and 48 inches below the surface and between 4 and 17 inches thick. The USDA and NRCS maps indicate the hardpan is common along the CP1 alignment between W Clinton Avenue and E Church Avenue. Although this surficial layer is described in the agricultural literature, it was not encountered when hand auguring exploration locations during the 30% Geotechnical Investigation. Therefore, it is assumed that this surficial hardpan layer was either removed during urbanization in the Fresno Area or blanketed with fill such that it is currently deeper than 5 feet.
6.1.2 Alluvial Fan
The Alluvial Fan strata (Qc, Qf, and Qs) is present beneath Existing Fill to the maximum depth explored. Alluvial Fan consists of interbedded layers of poorly graded sand and silt, with varying amounts of coarse and fine grained particles. Interlayers of this unit are classified as Sand (SP), Sand with Silt (SP-SM), Silty Sand (SM), Clay (CL), Silty Clay (CL-ML), Sandy Silt (ML), Silt with Sand (ML), and Silt (ML) according to the Unified Soil Classification System (USCS).
USCS distributions are shown in Table 6.1-1 and Figure 6.1-1. The USCS identification with the largest distribution is Silty Sand, followed by Sandy Silt, Silt with Sand, Silt, Sand with Silt, and Sand. Interlayers of the Alluvial Fan strata include normalized Soil Behavior Type (SBTN) zones 3 through 9 as classified by CPTs (Robertson 1990). The distribution of SBTN zones according to stratum depth interval is provided in Figure 6.1-2; each test result shown corresponds to a soil layer thickness of about 0.165 feet. As shown, SBTN zone 6 (sands – clean sand to silty sand) is mostly frequently encountered in the Alluvial Fan strata. Figure 6.1-2 shows that SBTN zones 6 and 7 (sands and gravelly sand to dense sand) is more pronounced above 50 feet and zones 4 and 5 (silt mixtures and clay mixtures) is more pronounced below 50 feet.
Table 6.1-1 USCS Distribution for Alluvial Fan by Percentage of Depth Explored
Borehole ID SP SP-SM SM SC SW ML CL CL-ML
S0001R 18 6 40 0 0 13 10 13
S0002R 30 2 35 0 0 27 0 6
S0003R 6 25 15 0 0 26 2 26
S0004R 8 8 16 0 0 48 1 19
S0005R 6 36 12 0 0 33 0 13
S0006R 4 25 42 0 0 29 0 0
S0007R 0 19 43 0 0 33 5 0
S0010R 6 9 38 3 0 20 19 5
S0012R 5 12 45 0 0 38 0 0
S0013AR 59 20 18 0 0 3 0 0
S0014R 6 7 51 0 0 20 8 8
S0014AR 0 6 57 0 0 21 16 0
S0015R 9 5 41 0 0 33 0 12
S0016R 3 32 40 0 0 18 6 1
S0017R 19 10 30 3 0 28 7 3
S0018R 3 21 52 0 0 17 0 7
S0019R 14 37 32 0 0 17 0 0
HSR
13-
06 -
EXEC
UTI
ON
VER
SIO
N

CALIFORNIA HIGH-SPEED TRAIN PROJECT ENGINEERING GEOTECHNICAL BASELINE REPORT FOR BID FRESNO TO BAKERSFIELD SECTION CONTRACT PACKAGE 1
Page 6-3
Figure 6.1-1 Unified Soil Classification System (USCS) Distribution for Alluvial Fan
Figure 6.1-2 Normalized CPT Soil Behavior Type (SBTN) Distribution for Alluvial Fan
SP SW SP-SM SM SC ML CL-ML CLSP SW SP-SM SM SC ML CL-ML CL
Unified Soil Classification Symbol, USCS
0
10
20
30
40
Tota
l Bor
ehol
e Fo
otag
e (%
)
Soils in Upper 50 ft
Soils Below 50 ft
Note: Soils in upper 5 ft excluded.
1 2 3 4 5 6 7 8 9
Normalized CPT Soil Behavior Type, SBTN
0
1,000
2,000
3,000
4,000
Num
ber o
f Tes
t Res
ults Soils in Upper 50 ft
Soils Below 50 ft
Note: Soils in upper 5 ft excluded.
8,389 Tests
HSR
13-
06 -
EXEC
UTI
ON
VER
SIO
N

CALIFORNIA HIGH-SPEED TRAIN PROJECT ENGINEERING GEOTECHNICAL BASELINE REPORT FOR BID
FRESNO TO BAKERSFIELD SECTION CONTRACT PACKAGE 1
Page 6-4
Grain size distribution for Alluvial Fan is presented in Figure 6.1-3. These curves are based on the results
of laboratory sieve and hydrometer analyses performed on samples from boreholes drilled during the 30% Geotechnical Investigation. The frequency of gradation tests with depth are shown in Figure 6.1-4.
Figures 6.1-3 shows that Alluvial Fan is a mixture of fine and coarse-grained soil with varying amounts of clay and few (5 to 10 percent) to trace (less than 5 percent) gravel.
For bidding purposes, assume 50 percent of Alluvial Fan encountered during construction consists of fine
grained soil (finer than 0.075 mm sieve) and 50 percent consists of coarse-grained soil (coarser than 0.075 mm sieve).
According to data from the 30% Geotechnical Investigation, the coarse-grained soil is poorly graded and
contains between 5 and 45 percent fine-grained soil and between zero and 5 percent fine gravel by
weight. The fine-grained soil contains between 2 and 44 percent coarse grained soil. Hydrometer tests on fine-grained soils indicated clay content ranging from zero to 34 percent (percent finer than 0.002 mm)
and silt content ranging from 28 to 87 percent (percent finer than 0.075 but coarser than 0.002 mm).
Figure 6.1-3 Representative Grain Size Distribution of Alluvial Fan
1,000 100 10 1 0.1 0.01 0.001
Grain Size, mm
0
20
40
60
80
100
Perc
ent P
assi
ng, %
Envelope of 62 tests
#200#10 #40 #200U.S. Standard Sieve #4 #10 #40 #200
silt clay
U.S. Standard Sieve #4 #10 #40 #200
fine
Fines
silt clay
U.S. Standard Sieve #4 #10 #40 #200
coarse medium fine
Fines
silt clay
U.S. Standard Sieve #4 #10 #40 #200
coarse fine
Sand
coarse medium fine
Fines
silt clay
U.S. Standard Sieve #4 #10 #40 #200
Cobbles
Gravel
Cobbles
Gravel
Boulders
HSR
13-
06 -
EXEC
UTI
ON
VER
SIO
N

CALIFORNIA HIGH-SPEED TRAIN PROJECT ENGINEERING GEOTECHNICAL BASELINE REPORT FOR BID
FRESNO TO BAKERSFIELD SECTION CONTRACT PACKAGE 1
Page 6-5
Figure 6.1-4 Probability Distribution and Frequency of Grain Size Analysis with Depth
Atterberg Limits tests were carried out on 71 samples. The results of one test indicated the soil samples were non-plastic (plastic limit could not be determined). The results of the remaining 70 tests are plotted
on the Casagrande Plasticity Chart shown in Figure 6.1-5. The frequency of Atterberg Limits tests with
depth is shown in Figure 6.1-6. All fine-grained soils tested were inorganic and plotted within the USCS identifications of CL, CL-ML, and ML.
The distribution of plasticity characteristics and associated USCS classification for fine grained soils within
the Alluvial Fan strata are shown on Figure 6.1-5. As a baseline, coarse-grained Alluvial Fan soils should be assumed as non-plastic.
The baseline Plasticity Index for fine-grained Alluvial Fan soils is 8 and the Liquid Limit baseline is 27.
These values represent the median Plasticity Index and Liquid Limit results from the available data.
0 50 100 150 200
Depth, ft
0
25
50
75
100
Perc
ent L
ess
Than
Indi
cate
d Va
lue
0 50 100 150 200
Depth, ft
0
2
4
6
8
Num
ber o
f Tes
t Res
ults
Grain Size Analysis
All Tests
HSR
13-
06 -
EXEC
UTI
ON
VER
SIO
N

CALIFORNIA HIGH-SPEED TRAIN PROJECT ENGINEERING GEOTECHNICAL BASELINE REPORT FOR BID
FRESNO TO BAKERSFIELD SECTION CONTRACT PACKAGE 1
Page 6-6
Figure 6.1-5
Representative Distribution of Plasticity Characteristics
Figure 6.1-6 Probability Distribution and Frequency of Atterberg Limits Tests with Depth
0 10 20 30 40 50 60 70 80 90 100
Liquid Limit, wL , %
0
10
20
30
40
50
60Pl
astic
ity In
dex,
I p ,
%
ML
CL
CL-ML
A-Line
CH
CL
ML or OL
OH or MH
CL-ML
ML
U-Line
0 50 100 150 200
Depth, ft
0
25
50
75
100
Perc
ent L
ess
Than
Indi
cate
d Va
lue
0 50 100 150 200
Depth, ft
0
5
10
15
20
Num
ber o
f Tes
t Res
ults
Atterberg Limits
All Tests
HSR
13-
06 -
EXEC
UTI
ON
VER
SIO
N

CALIFORNIA HIGH-SPEED TRAIN PROJECT ENGINEERING GEOTECHNICAL BASELINE REPORT FOR BID
FRESNO TO BAKERSFIELD SECTION CONTRACT PACKAGE 1
Page 6-7
Dense, cemented soil (hardpan) is present within Alluvial Fan sequence at variable depths. In general,
results from the 30% Geotechnical Investigation indicate hardpan layer varying from 1 to 12 feet in thickness are present between 5 and 50 feet BGL as evidenced by SPT blowcounts, CPT cone resistance,
and pre-drilling depths for some CPTs.
Where sampled, hardpan is hard and very dense and consists of Sandy Silt, Silt, Silt with Sand, Silty Clay, Silty Sand, Sand with Silt, and Sandy Clay. SPT (N60) blow count on hardpan is greater than 50 blows per
foot in ML, CL, CL-ML and greater than 100 blows per foot in SM and SP-SM. Hardpan includes SBTN zones 6 through 9 and exhibits corrected CPT cone resistance (qt) greater than 500 tons per square foot.
Gravel is present in trace (less than 5 percent) amounts and consists primarily of granitic, metamorphic,
and occasional volcanic origin. Cobbles and boulders were not encountered during our exploration.
6.1.3 Groundwater Level
In general, groundwater-levels were not measured during the 30% Geotechnical Investigation because they were obscured by the borehole drilling fluid. In the CPTs, groundwater measurements were
recorded if the presence of free groundwater was suspected when CPTs were advanced or retrieved.
Porewater pressure dissipation tests were performed in some CPTs to estimate groundwater levels along the alignment. Groundwater measurements and results of pore pressure dissipation tests are presented
in the GDR.
Prior to urbanization and agricultural pumping, the groundwater table was within 20 to 30 feet BGL. Since about the 1960s, the groundwater table has experienced a depletion of about 50 feet. Current
groundwater table measurements from standpipe piezometers and CPT pore pressure dissipation tests indicate the groundwater table is below 80 feet BGL in boreholes S0003R and S0005R and between
70 and 99 feet in boreholes S0010R, S0013AR, S0016R, S0017R, and S0018R. Groundwater
measurements from CPTs indicate it is between 61 and 95 feet in CPTs S0023ACPT, S0035CPT, S0036CPT, and S0041CPT. Regional groundwater levels from the California Department of Water
Resources indicate the depth to groundwater varies from about 65 to 110 feet along the project alignment.
For bidding purposes, assume the groundwater table during construction is at a depth of 90 feet BGL
between W Clinton and E Church Avenues and 60 feet between E Church and E American Avenue with an allowance of plus-or-minus 5 feet for seasonal fluctuations. These numbers are based on the minimum
depths measured in these sections of the alignment.
For design of permanent structures, assume a baseline groundwater table depth of 40 feet BGL during the project design life.
6.1.4 Contaminated Soil
Current and historical land use in the vicinity indicates man-made hazardous materials are likely to exist
throughout the areas in and around the CP1 alignment. Hazardous materials associated with man-made
contamination can include petroleum hydrocarbons, volatile organic compounds, semi-volatile organic compounds, pesticides, PCBs, and metals. These contaminants are usually associated with former
agricultural, industrial, and/or commercial land uses. Aerially deposited lead is common in soil along shoulders of major thoroughfares from past leaded fuel vehicle emissions.
Railroads have historically used lead arsenate or other arsenic compounds as pesticide and herbicide, as
well as using chlorinated pesticides. Lead may also be present as lead-based paint debris, or as aerially-deposited lead. PCBs were historically used in railroad electrical equipment likely up until the time they
were banned in 1979. The ground investigation did not include sampling or analysis for PCBs.
HSR
13-
06 -
EXEC
UTI
ON
VER
SIO
N

CALIFORNIA HIGH-SPEED TRAIN PROJECT ENGINEERING GEOTECHNICAL BASELINE REPORT FOR BID
FRESNO TO BAKERSFIELD SECTION CONTRACT PACKAGE 1
Page 6-8
Evidence of contamination was noted by strong hydrocarbon odors in two samples taken from borehole
S0012R. The contaminated SPT samples were taken at depths of 25 and 30 feet BGL. A strong hydrocarbon odor was also noted in the upper 20 feet from CPT S0019CPT and a pinkish-red
contaminant was observed in a soil sample from S0014AR taken between 11 and 12.5 feet. No other evidence of soil contamination was noted in any of the other samples collected during the investigation.
However, uninvestigated contaminated soil could exist at other locations along the alignment.
Performing a Phase I or Phase II Environmental Site Assessment or performing analytical testing on soil and groundwater samples was beyond the scope of the investigation. Refer to the project EIR/EIS for
programmatic evaluation of the potential for hazardous materials contamination of the soils.
The greatest percentage of soil to be excavated is from construction of the Fresno Grade Separation,
Jensen Trench, and foundations for the proposed Fresno Viaduct and vehicular overcrossings. A smaller percentage of excavation will be from earthwork for at-grade alignment and for construction of
underground utilities. For bidding purposes, assume 5 percent of all excavated soil will be considered hazardous waste and will require disposal at a Class I facility and 10 percent of all excavated soil will
require disposal at a Class II facility. The remaining soil excavated is anticipated to be reused on site as Structural Fill, Embankment Fill, or backfill along other portions of HST alignment provided the gradation
requirements described in the Contract Documents are satisfied.
6.1.5 Corrosive Soil
Corrosion tests were performed on 37 representative soil samples to evaluate the corrosion potential for buried iron, steel, mortar-coated steel, and reinforced concrete structures. Baseline values of soil
corrosion parameters for Existing Fill and Alluvial Fan are presented in Table 6.1-2.
Table 6.1-2
Baseline Corrosion Parameters
Test Test
Reference
No. of
Tests
Range of
Values
Mean
Value
Standard
Deviation
Assumed
Baseline
Minimum Resistivity (ohm-cm)
ASTM G 57 37 1,130 to 20,900
6,526 4,457 2,000
pH ASTM D 4327 37 6.9 to 8.4 7.6 0.3 6.9
Chloride (ppm) ASTM D 4327 37 6.2 to 124.0 15.0 20.5 124
Sulfate (ppm) ASTM D4327 37 0.8 to 273.1 28.8 47.5 273
6.1.6 Groundwater Chemistry
Groundwater quality parameters are based on the results of 3 samples collected from the existing ground
water monitoring wells. The mean value of parameters tested represents baseline condition and are shown on Table 6.1-3.
HSR
13-
06 -
EXEC
UTI
ON
VER
SIO
N

CALIFORNIA HIGH-SPEED TRAIN PROJECT ENGINEERING GEOTECHNICAL BASELINE REPORT FOR BID
FRESNO TO BAKERSFIELD SECTION CONTRACT PACKAGE 1
Page 6-9
Table 6.1-3
Baseline Groundwater Chemistry Parameters
Test Test
Reference
Borehole ID Assumed
Baseline
(mean) S0016R S0017R S0018R
pH SM 4500-H+B 7.51 7.24 7.51 7.4
Calcium (mg/L) EPA 200.7 88 78 47 70
Bicarbonate Alkalinity as CaCO3 (mg/L)
SM 2320B 280 260 220 250
Specific Conductance (umhos/cm)
SM 2510B 1,100 860 570 840
Total Dissolved Solids
(mg/L) SM 2320B 740 580 380 570
Chloride (mg/L) EPA 300.0 83 49 23 50
Sulfate as SO4 (mg/L) EPA 300.0 53 110 21 61
Engineering Properties of the Subsurface Materials 6.2
6.2.1 Existing Fill
Few laboratory tests were performed on Existing Fill because the bulk samples collected were highly disturbed and were taken from drilling cuttings. Laboratory tests performed included Modified Proctor
Compaction, California Bearing Ratio (CBR), moisture content, and fines content. These tests were
performed to evaluate pavement design and earthwork considerations.
Baseline engineering properties of the Existing Fill are described in Table 6.2-1. The mean value from the Modified Proctor Tests was selected as the baseline for Maximum Dry Density and Optimum Moisture
Content. However, the baseline values cannot be assumed without verification of similar soil conditions during earthwork inspection services. For pavement design, the minimum California Bearing Ratio test
result is assumed as the baseline value. The CBR baseline represents a pavement subgrade condition that
has been prepared in accordance with the Contract Documents.
Laboratory and in situ tests were not performed to measure unit weight or strength; therefore, these
assumed baseline parameters are based on previous experience and engineering judgment.
HSR
13-
06 -
EXEC
UTI
ON
VER
SIO
N

CALIFORNIA HIGH-SPEED TRAIN PROJECT ENGINEERING GEOTECHNICAL BASELINE REPORT FOR BID
FRESNO TO BAKERSFIELD SECTION CONTRACT PACKAGE 1
Page 6-10
Table 6.2-1
Baseline Engineering Properties for Existing Fill
Depth
Total
Unit
Weight
(t)
Dry
Unit
Weight
(d)
Water
Content
(wc)
Fines
Content
Maximum
Dry Density
(d,max)
Optimum
Moisture Content
(wo)
California
Bearing Ratio
Effective
Friction
Angle
(Ф’)
(ft) (pcf) (pcf) (%) (%) (pcf) (%) (deg)
No. of Tests
-- * -- * 2 17 9 9 9 -- *
Range -- 104-143 100-125 4-15 13-68 121-137 6-12 13-50 -- *
Assumed Baseline
0 to 5 120 112 7 13-68 130 8 13 28
Note: --* indicates laboratory tests were not performed.
Bulking/swell factors used to estimate earthwork volumes typically range between 10 percent for sand
and gravel to about 30 percent for clay. Shrinkage factors range from about 10 percent for sand to about 30 percent for clay. For bidding purposes, assume Existing Fill has a bulking/swell factor of 20 percent
and a shrinkage factor of 10 percent.
6.2.2 Alluvial Fan
Baseline parameters for the Alluvial Fan are sorted by structure. The boreholes and CPTs contributing to
the statistical evaluation of the soils at each structure are shown on Table 6.2-2
Table 6.2-2
In Situ Tests by Structure Type
Structure Name Boreholes CPTs
Fresno Grade Separation and Jacked-Box Tunnel
S0002R, S0003R, S0004R, S0005R, S0006R
S0006ACPT, S0007CPT, S00008CPT, S00009CPT, S0010CPT, S0011CPT, S0012CPT,
S0013CPT, S0014CPT, S0015CPT
Jensen Trench S0014AR, S0014R, S0015R S00027CPT, S0028CPT, S0029CPT
Fresno Viaduct S0016R, S0017R, S0018R S0030CPT, S0031CPT, S0032CPT, S0033CPT, S0034CPT, S0034ACPT, S0035CPT, S0036CPT
At-grade, embankment, and other ancillary structures
S0001R, S0007R, S0010R, S0012R, S0013AR, S0019R,
S0001CPT, S0002CPT, S0003CPT, S0004CPT, C0005CPT, S0006CPT, S0016CPT, S0017CPT, S0018CPT, S0019CPT, S0020CPT, S0021CPT, S0022CPT, S0023CPT, S0024CPT, S0025CPT, S0026CPT, S0037CPT, S0038CPT, S0039CPT,
S0040CPT, S0041CPT, S0042CPT
The baseline engineering properties of Alluvial Fan are shown on Table 6.2-3. The range of conditions and uncertainties for the parameters in Table 6.2-3 are described in Appendix A.
HSR
13-
06 -
EXEC
UTI
ON
VER
SIO
N

CALIFORNIA HIGH-SPEED TRAIN PROJECT ENGINEERING GEOTECHNICAL BASELINE REPORT FOR BID
FRESNO TO BAKERSFIELD SECTION CONTRACT PACKAGE 1
Page 6-11
Table 6.2-3
Baseline Engineering Properties for Alluvial Fan
Structure Name Depth
(ft)
Total Unit
Weight,
t
(pcf)
Water Content,
wc
(%)
Soil Modulus,
Es
(tsf)
Corrected Blow
Count, SPT N60
(bpf)
CPT Tip Resistance,
qc
(tsf)
Effective Friction Angle, Ф’
(deg)
Effective Cohesion Intercept,
c’
(psf)
Shear Wave
Velocity, Vs30
(ft/sec)
Modulus of Vertical
Subgrade Reaction,
kv
(tons/ft3)
Fresno Grade Separation and Jacked Box Tunnel
Range <50
95-137 4-33 96-1,565 5-94 34-937 20-50 7-1042 1,414-1,625 60 - 300
Baseline 129 15 500 42 190 41 250 1,500 250
Range >50
91-137 13-36 186-505 44-95 17-998 34-50 NA 1,414-1,625 175 - 300
Baseline 131 20 500 65 280 41 250 1,500 300
Jensen Trench
Range <20
95-137 7-22 177-1,178 4-99 42-657 31-50 24-269 1,027-1,197 60 - 300
Baseline 122 10 409 24 170 37 30 1,120 150
Range >20
91-137 8-34 161-884 13-99 14-657 35-50 NA 1,027-1,625 175 - 300
Baseline 133 15 511 58 200 42 120 1,120 300
Fresno Viaduct
Range <60
90-137 10-25 184-1,829 3-98 11-1,630 31-50 75-532 1,027-1,179 60 - 300
Baseline 126 10 500 35 140 37 220 1,090 225
Range >60
94-137 12-34 154-653 24-99 50-978 26-50 83-954 1,027-1,179 175 - 300
Baseline 132 15 500 55 150 37 250 1,090 300
At-Grade, Embankment, and Other Ancillary Structures
Range
<20
90-137 5-33 80-1,807 3-100 8-1,630 20-51 30-312 1,027-1,625 60 - 300
Baseline 121 5 373 22 150 37 90 1,300 150
HSR
13-
06 -
EXEC
UTI
ON
VER
SIO
N

CALIFORNIA HIGH-SPEED TRAIN PROJECT ENGINEERING GEOTECHNICAL BASELINE REPORT FOR BID
FRESNO TO BAKERSFIELD SECTION CONTRACT PACKAGE 1
Page 6-12
Maximum dry density, optimum moisture content, bulking/swell factor, and shrinkage factor previously
assumed for Existing Fill are also applicable for Alluvial Fan. Grain size and plasticity baseline statements were presented in Section 6.2.1.
A. Standard Penetration Test Blow Count
The baseline SPT N60 blow count shown in Table 6.2-3 is selected as the median from the SPT data set
for each structure.
SPT blow counts were recorded during soil sampling in boreholes and corrected to SPT N60 values using the results of hammer efficiency measurements recorded during the site exploration. For comparison,
CPT tip resistance data was correlated to equivalent SPT N60 values as described in Appendix A.
Histograms and statistical data of SPT N60 for each structure and depth interval shown in Table 6.2-3 are presented in Appendix A. Histogram plots were capped at a maximum value of 99 blows per foot.
Hardpan soils can be identified from the N60 values corrected for overburden (referred to as (N1)60).
Figure 6.2-1 shows the variation of (N1)60 with depth for all SPT data. The overburden was calculated using a correlation to unit weight from Robertson (2009) and the results from S0009CPT. Figure 6.2-1
shows that hardpan soils are identifiable by high blow counts predominantly in the uppermost 20 feet.
HSR
13-
06 -
EXEC
UTI
ON
VER
SIO
N
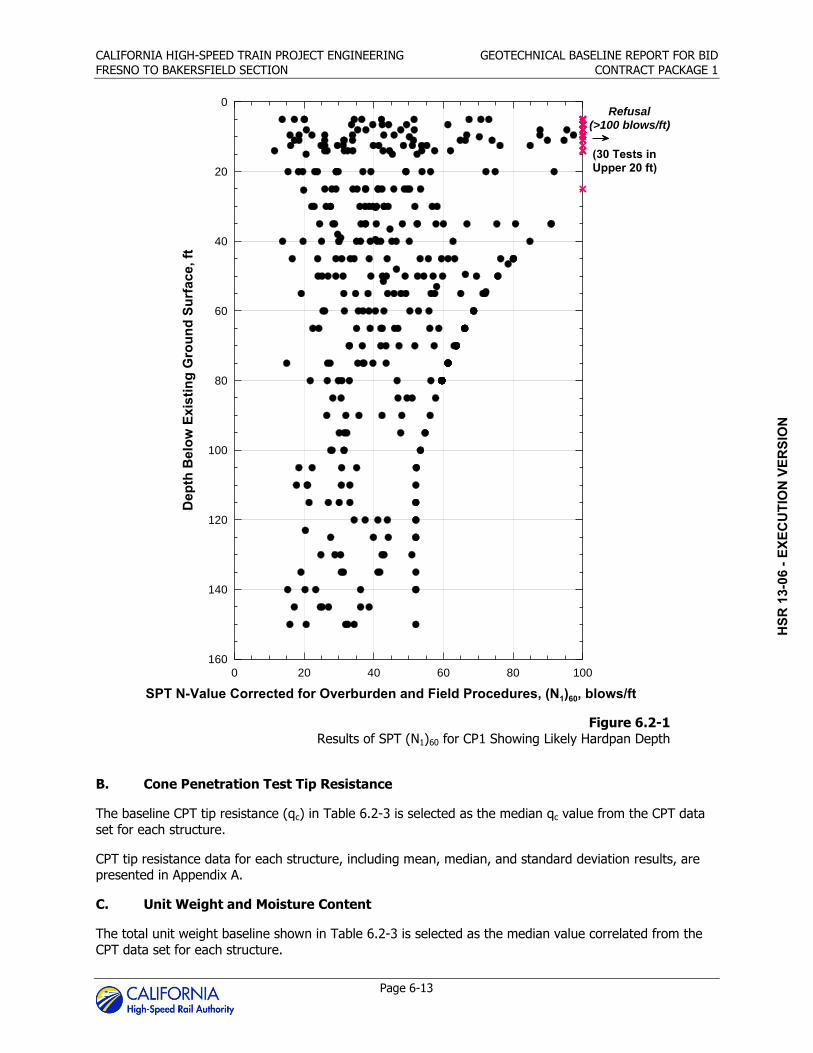
CALIFORNIA HIGH-SPEED TRAIN PROJECT ENGINEERING GEOTECHNICAL BASELINE REPORT FOR BID
FRESNO TO BAKERSFIELD SECTION CONTRACT PACKAGE 1
Page 6-13
Figure 6.2-1
Results of SPT (N1)60 for CP1 Showing Likely Hardpan Depth
B. Cone Penetration Test Tip Resistance
The baseline CPT tip resistance (qc) in Table 6.2-3 is selected as the median qc value from the CPT data
set for each structure.
CPT tip resistance data for each structure, including mean, median, and standard deviation results, are presented in Appendix A.
C. Unit Weight and Moisture Content
The total unit weight baseline shown in Table 6.2-3 is selected as the median value correlated from the
CPT data set for each structure.
0 20 40 60 80 100
SPT N-Value Corrected for Overburden and Field Procedures, (N1)60, blows/ft
0
20
40
60
80
100
120
140
160
Dep
th B
elow
Exi
stin
g G
roun
d Su
rfac
e, ft
Refusal
(>100 blows/ft)
(30 Tests in Upper 20 ft)
HSR
13-
06 -
EXEC
UTI
ON
VER
SIO
N

CALIFORNIA HIGH-SPEED TRAIN PROJECT ENGINEERING GEOTECHNICAL BASELINE REPORT FOR BID
FRESNO TO BAKERSFIELD SECTION CONTRACT PACKAGE 1
Page 6-14
Total unit weight (t) was correlated to CPT data and plotted as histograms, as shown in Appendix A. The
correlated unit weights were converted to pounds per cubic foot and capped at 137 pounds per cubic
foot.
A total of 67 moisture content tests were performed on samples from boreholes S0001R through S0019R. Moisture content results ranged from 3.9 to 43.5 percent. The moisture content results from some
laboratory tests could be wetter than in situ as a result of the influence from rotary wash drilling on the sample water content. Conversely, the laboratory results could be drier than in situ conditions because
the SPT sampler was not equipped with liners and samples were stored in jars. Therefore, the baseline
moisture content shown on Table 6.2-3 is determined on engineering judgment and our understanding of conditions at the site.
D. Shear Strength
Shear strength parameters include effective friction angle (Ф’ ) and effective cohesion (c’). The effective
friction angle for predominantly coarse grained soil (SP, SP-SM, SM, and SC) was determined from CPT and SPT blow count correlations and, also, from the results of direct shears tests on reconstituted
samples. The statistical results of the CPT and SPT correlations and laboratory test data are presented in Appendix A.
Strength parameters were estimated from the results of 45 direct shear tests on remolded soil samples
collected during the field exploration. The direct shear test results from S0006R at 38 feet, S0016R at 150 feet, S0018R at 65 feet, and S0018R at 130 feet were not used in developing the strength baseline
because the cohesion intercept results were unusually high and assumed to misrepresent in situ
conditions.
The baseline effective cohesion shown in Table 6.2-3 is selected as the median value from remolded
direct shear tests results, but is capped at 250 psf.
Figure 6.2-2 shows the stress envelopes from all direct shear tests performed for references purposes.
HSR
13-
06 -
EXEC
UTI
ON
VER
SIO
N

CALIFORNIA HIGH-SPEED TRAIN PROJECT ENGINEERING GEOTECHNICAL BASELINE REPORT FOR BID
FRESNO TO BAKERSFIELD SECTION CONTRACT PACKAGE 1
Page 6-15
Figure 6.2-2 Results of Remolded Direct Shear Tests
E. Soil Modulus
Typical values of Soil Modulus are described in the American Association of State Highway Transportation Officials’ (AASHTO) LRFD Bridge Design Specifications, Fifth Edition (AASHTO 2010) for different soil
types as shown in Table 6.2-4.
The baseline Soil Modulus (Es) shown on Table 6.2-3 is selected as the lesser of the following:
1. Median value from SPT correlation
2. Minimum value presented in Table 6.2-4 for sand with density determined from the baseline blowcount.
Histograms and other statistical data used to determine Soil Modulus from SPT and CPT correlations are
presented in Appendix A.
0 1,000 2,000 3,000 4,000 5,000 6,000 7,000
Normal Stress, n , psf
0
1,000
2,000
3,000
4,000
5,000
6,000
7,000
Failu
re S
tres
s,
f , p
sf'
= 45°
' = 40°
' = 35°
c' = 150 psf
HSR
13-
06 -
EXEC
UTI
ON
VER
SIO
N

CALIFORNIA HIGH-SPEED TRAIN PROJECT ENGINEERING GEOTECHNICAL BASELINE REPORT FOR BID
FRESNO TO BAKERSFIELD SECTION CONTRACT PACKAGE 1
Page 6-16
Table 6.2-4
Published Soil Modulus (AASHTO 2010)
Soil Modulus, Es (tsf) Silt
20 to 200
Sand
Loose 100 to 300
Medium Dense 300 to 500
Dense 500 to 800
Figure 6.2-3 shows the estimated Soil Modulus using an SPT correlation for clean sands and slightly silty
sands, published by AASHTO (2010).
Figure 6.2-3
Soil Modulus Correlations from SPT Data
No. Tests 399
Mean, tsf 278
Median, tsf 234
Standard Deviation, tsf 179
Maximum, tsf 1,233
Minimum, tsf 57
Soil Modulus Estimated from SPT
HSR
13-
06 -
EXEC
UTI
ON
VER
SIO
N

CALIFORNIA HIGH-SPEED TRAIN PROJECT ENGINEERING GEOTECHNICAL BASELINE REPORT FOR BID
FRESNO TO BAKERSFIELD SECTION CONTRACT PACKAGE 1
Page 6-17
F. Shear Wave Velocity
Shear wave velocities averaged over the upper 100 feet (~30 meters) of soil, Vs30, are presented in the
GDR. Baseline shear wave velocities are shown on Table 6.2-3.
For the Fresno Grade Separation, the baseline Vs30 shown on Table 6.2-3 is the mean from the results of
seismic CPTs and PS Logging from S009CPT, S0012CPT, and S0005R. For the Fresno Viaduct, the
baseline Vs30 is the mean from the results of seismic CPTs and PS Logging at S0030CPT, S0033CPT, and R0018R. For the Jensen Grade separation, the baseline Vs30 is the mean from shear wave measurements
south of SR41 (S0024CPT, S0030CPT, S0033CPT, and S0018R). For at-grade, embankment, and ancillary structures, the baseline value shown is the mean from all measurements recorded.
Figure 6.2-4 shows shear wave velocity profiles measured during the 30% Geotechnical Investigation.
The seismic Site Class boundary between Class C and Class D soil is shown for reference only.
HSR
13-
06 -
EXEC
UTI
ON
VER
SIO
N

CALIFORNIA HIGH-SPEED TRAIN PROJECT ENGINEERING GEOTECHNICAL BASELINE REPORT FOR BID
FRESNO TO BAKERSFIELD SECTION CONTRACT PACKAGE 1
Page 6-18
Figure 6.2-4
Vs30 Measurements
0 1,000 2,000 3,000 4,000 5,000
Shear Wave Velocity, vs, ft/sec
0
20
40
60
80
100
120
140
160
Dep
th B
elow
Exi
stin
g G
roun
d Su
rfac
e, ft
PS Logging
SCPT
vs30 Site ClassC/D Border
HSR
13-
06 -
EXEC
UTI
ON
VER
SIO
N

CALIFORNIA HIGH-SPEED TRAIN PROJECT ENGINEERING GEOTECHNICAL BASELINE REPORT FOR BID
FRESNO TO BAKERSFIELD SECTION CONTRACT PACKAGE 1
Page 6-19
G. Modulus of Vertical Subgrade Reaction
Figure 6.2-4 shows the range of Modulus of Vertical Subgrade Reaction (k’v). The baseline subgrade
modulus shown on Table 6.2-3 is determined from the baseline SPT N60 blow count correlated to the typical vertical subgrade reaction modulus values shown in Figure 6.2-5. A bi-linear relationship between
subgrade modulus and relative density was utilized.
Figure 6.2-5 Modulus of Vertical Subgrade Reaction
H. Modulus of Horizontal Subgrade Reaction
Typical values of Modulus of Horizontal Subgrade Reaction (kh) for granular soil range from 20 to 225 pounds per cubic inch based on an assessment of the relative density of the sand and the effect of a
submerged or dry condition (FHWA-NHI-10-16). Typical values of kh published by the American Petroleum Institute (API 1987) are shown on Table 6.2-5.
Table 6.2-5
Static Modulus of Horizontal Subgrade Reaction, kh (API 1987)
Subgrade Reaction kh by Relative Density (pci)
Loose Medium Dense
Dense
Sand Below Water Table 20 60 125
Sand Above Water Table 25 90 225
HSR
13-
06 -
EXEC
UTI
ON
VER
SIO
N

CALIFORNIA HIGH-SPEED TRAIN PROJECT ENGINEERING GEOTECHNICAL BASELINE REPORT FOR BID
FRESNO TO BAKERSFIELD SECTION CONTRACT PACKAGE 1
Page 6-20
For bidding purposes, assume a modulus of horizontal subgrade reaction (kh) of 80 pci for Alluvial Fan
under static loading, and 40 pounds per cubic inch under cyclic loading.
Baseline Soil Behavior 6.3
Behavioral baselines for the preliminary design will be a function of the equipment and means and methods selected by the Contractor.
6.3.1 Existing Fill
For bidding purposes, assume Existing Fill is loose to medium dense and soft to stiff and can be
excavated with conventional grading equipment such as dozers, scrapers, and track mounted excavators. Where excavated vertically, Existing Fill will not remain stable. Excavations in Existing Fill will be prone to
raveling within a few minutes where it is dry, and will flow where it is wet. It is anticipated that sloped cuts or temporary shoring will be required to maintain stability of excavation in Existing Fill.
Existing Fill will require moisture conditioning prior to reuse and recompaction to achieve desired density.
This will require adding water to soil that is dry of the optimum moisture content and air drying soil that is wet of the optimum moisture content. Air drying during periods of rain (November through March) is
assumed to be impractical. Stabilization through lime treatment should not be considered as the fine
grained soil is predominantly silty and will not have a strong reaction with lime. Cement treatment would be appropriate, but for bidding purposes assume it will not be necessary.
6.3.2 Alluvial Fan
A. Hardpan
Hardpan will be encountered during excavations for the proposed Fresno Grade Separation, Jacked Box,
Jensen Trench, and during excavation for new foundations for the proposed Fresno Viaduct and other ancillary structures. Where encountered, it is difficult to excavate with conventional equipment such as
track mounted excavators, and scrapers. Hardpan is also difficult to excavate with conventional solid flight augers.
Hardpan is difficult to excavate when dry but may lose its strength and become easily remolded when
saturated leading to reduced bearing and lateral capacity. For this reason, hardpan within 5 feet of the ground surface should not be relied upon for support of permanent structures.
B. Cementation (Rippability)
The predominantly coarse grained soil encountered exhibits no cementation to moderate cementation
according to the Soil and Rock Logging Classification and Presentation Manual (Caltrans 2010) and shown on Table 6.3-1.
Table 6.3-1
Cementation Criteria (Caltrans 2010)
Description Criteria
Weak Crumbles or breaks with handling or little finger pressure
Moderate Crumbles or breaks with considerable finger pressure
Strong Will not crumble or break with finger pressure
HSR
13-
06 -
EXEC
UTI
ON
VER
SIO
N

CALIFORNIA HIGH-SPEED TRAIN PROJECT ENGINEERING GEOTECHNICAL BASELINE REPORT FOR BID
FRESNO TO BAKERSFIELD SECTION CONTRACT PACKAGE 1
Page 6-21
For bidding purposes, assume the Existing Fill and Alluvial Fan strata exhibit weak cementation.
C. Stability
For bidding purposes, Alluvial Fan above the groundwater table is assumed to be firm and to remain stable for sufficient time to allow for temporary shoring installation. Alluvial fan below the groundwater
table will experience sloughing or running conditions. Therefore, where deep foundations extend below
the groundwater level for construction, temporary casing and/or drilling slurry will be required.
For bidding purposes, assume Existing Fill is classified as Cal/Occupational Safety and Health Association (Cal/OSHA) Type B soil and Alluvial Fan is Classified as Type C soil.
D. Shrink/Swell Potential
Results of Atterberg limits tests indicate Alluvial Fan and Existing Fill have a low degree of shrink and
swell potential associated with a mean Plasticity Index of less than 18 percent (Holtz 1959 and USBR 1974).
The shrink/swell potential can also be estimated using soil dry density correlated from CPT data and
laboratory moisture content tests, and liquid limit results from laboratory tests. The results are shown in Figure 6.3-2.
HSR
13-
06 -
EXEC
UTI
ON
VER
SIO
N

CALIFORNIA HIGH-SPEED TRAIN PROJECT ENGINEERING GEOTECHNICAL BASELINE REPORT FOR BID
FRESNO TO BAKERSFIELD SECTION CONTRACT PACKAGE 1
Page 6-22
Figure 6.3-1
Guide to Collapsibility, Compressibility, and Expansion
(Mitchell and Gardner 1975, and Gibbs 1969)
E. Collapse
The soils encountered during the geotechnical investigation were not identified as collapsible based on
the results shown on Figure 6.3-2. For bidding purposes, assume Existing Fill and Alluvial Fan will not be susceptible to collapse when saturated and no remediation of collapsible soil will be required.
F. Land Subsidence
The results of a preliminary assessment of land subsidence within the limits of CP1 indicates there has
been no detectable land subsidence in the Fresno Area. For bidding purposes assume that subsidence from groundwater pumping is not an impact to the project area.
0 10 20 30 40 50 60 70 80 90 100
LL
0.8
1.0
1.2
1.4
1.6
1.8
2.0In
Situ
Dry
Den
sity
(Mg/
m3 )
Low Med. High Very High
Collapse Expansion
HSR
13-
06 -
EXEC
UTI
ON
VER
SIO
N

CALIFORNIA HIGH-SPEED TRAIN PROJECT ENGINEERING GEOTECHNICAL BASELINE REPORT FOR BID
FRESNO TO BAKERSFIELD SECTION CONTRACT PACKAGE 1
Page 6-23
G. Corrosion
For buried concrete and steel elements, Caltrans Corrosion Guidelines (2003) consider a site to be
corrosive if one or more of the following conditions exist for the representative soil and/or water samples taken at the site:
Resistivity is 1,000 ohm-cm or less
Chloride concentration is 500 parts per million or greater
Sulfate concentration is 2,000 parts per million or greater
pH is 5.5 or less
For bidding purposes, assume the Existing Fill and Alluvial Fan strata are considered non-corrosive to
steel and concrete elements.
HSR
13-
06 -
EXEC
UTI
ON
VER
SIO
N

HSR
13-
06 -
EXEC
UTI
ON
VER
SIO
N

CALIFORNIA HIGH-SPEED TRAIN PROJECT ENGINEERING GEOTECHNICAL BASELINE REPORT FOR BID
FRESNO TO BAKERSFIELD SECTION CONTRACT PACKAGE 1
Page 7-1
7.0 Design Considerations
Grade Separations 7.1
The CP1 alignment includes two below-grade track structures, the Fresno Grade Separation and the
Jensen Trench. The Fresno Grade Separation is planned to be about 7,400 feet long with a maximum depth of about 55 feet to bottom-of-slab. The Jensen Trench is planned to be about 4,400 feet long with
a maximum depth of about 17 feet to bottom-of-slab. Both below-grade track structures will require mass
excavation in an urban environment.
This section discusses the considerations and design values that contributed to the choice of excavation
support system, lateral loads, options for ground improvement, and lateral deflection requirements.
Design criteria and other requirements for grade separations are covered in Section 03 30 01, Design and Installation of Grade Separations. A discussion of the assumptions and design criteria for the preliminary
design is included in the U-Troughs, Bridges and Elevated Structures Report (URS/HMM/Arup 2011).
7.1.1 Support of Excavation
Widened and sloped excavations are not feasible at the Fresno Grade Separation because of right-of way and temporary easement restrictions. The preliminary design of the Fresno Grade Separation assumes
internal bracing will be required. Sufficient right-of-way is available at the Jensen Grade Separation to preclude the need for shoring.
For preliminary design of the Fresno Grade Separation, a secant pile wall system was selected for
temporary support in consideration of the sandy nature of the soils and the potential for a high groundwater table. At the time the excavation support system was selected, the groundwater conditions
had not been verified by the 30% Geotechnical Investigation. A conservative groundwater table elevation
of 10 feet below grade was assumed for the preliminary design. Sheet pile walls were not considered due to the indurated, cemented, or hardpan layers discussed in this report. Secant pile walls were also
considered preferable over tangent pile walls and soldier-pile-and-lagging systems due to their stiffness and ability to limit lateral deflections and ground movements under the adjacent railroad and other
nearby structures.
Results from the 30% Geotechnical Investigation suggest that soldier pile and lagging systems are
appropriate for temporary excavation support based on the inferred strength of the ground and the current depth to groundwater. For design of temporary shoring, the baseline groundwater table can be
assumed to be below the base of excavation.
For preliminary design, permanent shoring was selected in the vicinity of the Belmont Detention Basin, as shown on the Plans. The design groundwater table for permanent shoring walls along the CP1 alignment
is 40 feet below grade.
The assumed sequence for construction of the Fresno Grade Separation is shown on the Plans. Design of the shoring system will need to consider staged bottom-up construction of the permanent walls while
internal bracing is removed and the final permanent internal brace is installed at the top of the structure. Temporary support of the Dry Creek Canal and the north and south spurs of the SJVRR will also be
required.
Selection and design of temporary excavation support systems is the responsibility of the Contractor. The
design of such systems shall include all applicable surcharges including those imposed by construction equipment. Design and construction shall conform to the requirements of the Design Criteria Manual,
Specification Section 31 15 13: Temporary Excavation Support and Protection, the Caltrans Trenching and Shoring Manual (2011), and the UPRR Guidelines Design and Construction of Shoring Adjacent to Active
Railroads (2010).
HSR
13-
06 -
EXEC
UTI
ON
VER
SIO
N

CALIFORNIA HIGH-SPEED TRAIN PROJECT ENGINEERING GEOTECHNICAL BASELINE REPORT FOR BID
FRESNO TO BAKERSFIELD SECTION CONTRACT PACKAGE 1
Page 7-2
7.1.2 Lateral Earth Pressures
Design lateral earth pressures for permanent structures are provided in the HST Design Criteria Manual.
Lateral earth pressure coefficients for restrained and unrestrained permanent walls are provided in Table 7.1-1. Lateral earth pressure coefficients for the Existing Fill and Alluvium layers should be
determined using the baseline effective friction angle (Ф’). Lateral earth pressure coefficients for on-site materials used as backfill should be determined using effective friction angle for the Alluvial Fan layer.
Lateral earth pressure coefficients for off-site materials used as backfill can be determined using φ’ =34 degrees. Lateral earth pressure coefficients for temporary shoring may consider the effective
cohesive strength of the Alluvial Fan layer, at the Contractor’s option.
Table 7.1-1
Earth Pressure Coefficients
Type of Wall Lateral Earth Pressure
Coefficients
Unrestrained Permanent Trench Wall Active condition,
ka = tan2(45- Ф’/2)
Restrained Permanent Trench Wall At-rest condition ka = 1 – sin(Ф’)
Peak ground accelerations are sufficiently low that seismic loads need not be considered. Surcharges
from adjacent structures or facilities as well as impact/collision loads and UPRR railroad surcharge are to be considered per the HST Design Criteria Manual and Specification Section 03 01 30.
7.1.3 Ground Improvement
The subsurface soils encountered during the geotechnical investigation were predominately silts, sandy
silts, and silty sands with SPT N60 blow counts above 25 and CPT cone tip resistances above 200 tons per square foot.
Due to the generally dense and stiff subsurface conditions, extensive deep ground improvement is not
anticipated, except at river crossings or creek and channel locations where compressible soils are encountered. Ground improvement for track subgrades may be required where Existing Fill is
encountered as described in Section 7.4.
7.1.4 Groundwater
The baseline design groundwater table depth for below-grade track structures is 40 feet BGL for the permanent structures. For construction, assume the baseline groundwater table is below the base of the
excavation with the possibility of intermittent perched water conditions 10 feet BGL and deeper.
7.1.5 Lateral Deflection
Improvements adjacent to below-grade track structures, in some case, are likely to be sensitive to lateral deflections of shoring systems. Response values that trigger actions should deflections become excessive
will vary per structure and stakeholder requirements.
The Contractor is responsible for evaluating each structure and utility which could be influenced by project construction and setting the response values. Allowable settlement or distortion of a building or
utility varies depending on construction, age, materials, use, etc. These facilities must be evaluated on a
case by case basis.
HSR
13-
06 -
EXEC
UTI
ON
VER
SIO
N

CALIFORNIA HIGH-SPEED TRAIN PROJECT ENGINEERING GEOTECHNICAL BASELINE REPORT FOR BID
FRESNO TO BAKERSFIELD SECTION CONTRACT PACKAGE 1
Page 7-3
Temporary shoring and permanent U-trough walls should be designed to limit lateral deflections in
accordance with the requirements of local jurisdictions, the Contract Documents, and AASHTO requirements.
Deep Foundations 7.2
7.2.1 Cast-in-Drilled-Hole Piles
The preliminary design includes deep foundations consisting of cast-in-drilled hole (CIDH) mono-piles and
pile groups to support elevated structures and roadway overcrossings. The selection of CIDH piles was driven by large foundation loads and stringent deflection criteria. Right-of-way constraints and proximity
of existing surface structures influenced the preliminary pile type and size selection to those with manageable pile cap footprints.
Driven piles were considered for roadway overcrossing bridge abutments.
7.2.2 Axial and Lateral Resistance
Axial resistances of CIDH piles are determined based on SPT N60 values. Baseline SPT N60 values provide
the basis for estimating nominal skin friction, end bearing resistance, and p-y curves. Nominal resistances should be determined in accordance with Caltrans amendments to AASHTO requirements as per the HST
Design Criteria Manual.
A significant consideration in the design of deep foundations must be given to lateral load resistance. This resistance is likely to be limited by the stringent deflection criteria necessary to maintain the track-
structure interaction criteria. Typical spans and long-span elevated structures will exert large lateral
demands on foundations potentially requiring additional piles for lateral resistance, enlarged pile caps, or post-tensioned CIDH piles.
7.2.3 Groundwater
Design of CIDH piles must consider the long-term possibility of groundwater fluctuations. The baseline
design groundwater table depth for design of deep foundations is 40 feet.
7.2.4 Downdrag and Uplift Loads
Settlement adjacent to deep foundations can impose downdrag loads. However, soils along the alignment
are generally of a consistency and type that is not conducive to time dependent behavior such as long-
term consolidation settlements.
Downdrag loads can also be imposed by collapsible soils and settlements induced by seismic activity. However, the 30% Geotechnical Investigation did not identify soils or conditions that are susceptible to
collapse or seismic deformations. For bidding purposes assume that any settlement of ground adjacent to deep foundations will occur during construction and that downdrag loads will be negligible.
Soils along the CP1 alignment are not considered sufficiently expansive to impose uplift loads that require
consideration in the design of deep foundations. For the purposes of bidding assume uplift loads due to expansive soils do not need to be considered in the foundation design.
Retaining Walls 7.3
7.3.1 Wall Type Selection
The permanent retaining wall structures for the Fresno Grade Separation and Jensen Trench have been
designed as cantilever and braced U-trough shaped structures. Permanent retaining walls for approaches to HST viaducts include conventional cast-in-place concrete walls and Mechanically Stabilized Earth (MSE)
HSR
13-
06 -
EXEC
UTI
ON
VER
SIO
N

CALIFORNIA HIGH-SPEED TRAIN PROJECT ENGINEERING GEOTECHNICAL BASELINE REPORT FOR BID
FRESNO TO BAKERSFIELD SECTION CONTRACT PACKAGE 1
Page 7-4
walls. MSE walls are also anticipated at bridge abutments for roadway and pedestrian bridge
overcrossings. MSE walls shall meet the requirements of Specification Section 31 38 13 Reinforced Slopes and Earth Structures.
Walls for roadway undercrossings (HST overcrossings) at Fresno Street, Tulare Street and other HST
overcrossings shown on the Contract Documents are anticipated to be embedded walls and shall meet the requirements of Specification Section 31 66 16 on special foundation walls. Similar walls are
anticipated for permanent shoring at the Fresno Grade Separation within 200 feet of the Belmont Detention Basin.
7.3.2 Structural Fill
Section 31 05 00 Common Work Results for Earthwork requires that Structural Fill have less than
15 percent fines. Figure 7.3-1 indicates approximately 15 percent of the soil sampled from the uppermost 50 feet in the vicinity of the Fresno Grade Separation will meet the specified fines content.
For bidding purposes assume 15 percent of the excavated materials exclusive of Existing Fill will meet
Structural Fill requirements where adequate means and methods of separation are employed.
Figure 7.3-1 Fines Content Histogram
7.3.3 Lateral Deflections
Existing improvements and structures adjacent to special foundation walls, in some cases, are likely to be
sensitive to lateral deflections. Threshold deflection values and response plans associated with excessive deflections will vary by structure and stakeholder requirements.
7.3.4 Drainage and Scour
The alignment between W Clinton Avenue and E Jensen Avenue crosses a floodplain. Adequate drainage
is essential to the performance of retaining walls that are not designed for hydrostatic loads. Where walls
0 25 50 75 100
Percent Passing No. 200 Sieve, %
0
25
50
75
100
Perc
ent L
ess
Than
Indi
cate
d Va
lue
0 25 50 75 100
Percent Passing No. 200 Sieve, %
0
1
2
3
4
5
6
Num
ber o
f Tes
t Res
ults
SP SP-SM SM, SC, SC-SM CL, MLSP SP-
SM SM, SC, SC-SM CL, ML
Grade Separation
Soils in Upper 50 ft
HSR
13-
06 -
EXEC
UTI
ON
VER
SIO
N

CALIFORNIA HIGH-SPEED TRAIN PROJECT ENGINEERING GEOTECHNICAL BASELINE REPORT FOR BID
FRESNO TO BAKERSFIELD SECTION CONTRACT PACKAGE 1
Page 7-5
are backfilled with structural backfill, the backfill shall be considered free draining and additional drainage
requirements (apart from the conventional weep holes and toe drains) are not required.
Special foundation walls and soil nail walls require geocomposite drainage strips to be placed in a manner that provides adequate drainage to relieve hydrostatic pressure. Special foundation walls required at the
Belmont Detention Basin shall be designed for the full hydrostatic pressure of the baseline groundwater level in this area.
There are no significant bodies of water along the CP1 alignment that require special consideration for
scour protection. For bidding purposes, assume that conventional embedment for frost protection will be adequate to protect against scour.
Embankments and At-Grade 7.4
7.4.1 Material Selection
Embankment materials consist of embankment fill, transition zone fills, structural fill, drainage layers, and
geosynthetics. Embankment materials shall meet the suitability, gradation, and plasticity requirements of Specification Section 31 05 00 Common Work Results for Earthwork. Transition Zone materials are
required where embankments support trackway approach structures. Transition Zone materials shall
consist of structural fill mixed with cement to meet the strength requirements in Specification Section 31 05 00.
7.4.2 Subgrade Compressibility
Embankment foundation design should consider the potential for post construction settlement in the
near-surface Existing Fill soils. Requirements for over-excavation or other remediation of soft or loose soils should be determined based on characterization of the subgrade and Existing Fill from future
geotechnical investigations to be carried out the Contractor. Typical construction practice for embankment construction in areas of known Existing Fill is to excavate to firm or native conditions and
backfill with material meeting fill and compaction requirements.
For bidding purposes, assume all Existing Fill is to be removed and replaced with suitable materials in accordance with the Contract Documents unless otherwise directed in the Design Criteria Manual.
7.4.3 Compaction Control
The Contractor shall provide quality control measures to ensure compliance with specified requirements.
Embankment foundation and subgrade preparation and the placement and compaction of fills shall be performed under the surveillance of a California registered Geotechnical Engineer employed by the
Contractor, as required by the Contract Documents.
7.4.4 Subgrade Preparation
Subgrade preparation shall meet the requirements of Specification Section 31 05 00. Subgrade preparation includes fine grading, reworking as necessary, and preparation of cut, fill, or embankment
upon which the structure and equipment foundations, pipe, sub-ballast, sub-base, base, and pavement
will be placed. Unsuitable subgrade material, such as weak or compressible soils, shall be removed. The entire surface of subgrade shall be scarified, moisture conditioned, and recompacted in accordance with
the Contract Documents. Subgrade stabilization material shall be incorporated if required.
7.4.5 Drainage, Scour and Erosion
Where an embankment is located in a flood plain, the embankment design shall include slope protection consisting of a drainage layer and protection riprap. The drainage material shall be designed to comply
HSR
13-
06 -
EXEC
UTI
ON
VER
SIO
N

CALIFORNIA HIGH-SPEED TRAIN PROJECT ENGINEERING GEOTECHNICAL BASELINE REPORT FOR BID
FRESNO TO BAKERSFIELD SECTION CONTRACT PACKAGE 1
Page 7-6
with Terzaghi’s filter criteria as defined in the Specification Section 31 05 00. This layer should extend up
to the highest flood water level plus additional freeboard as required by the Design Criteria Manual and be underlain by a layer of geosynthetic membrane.
In accordance with the Design Criteria Manual, the highest flood water level is the 100-year flood level.
The predominance of the alignment between W Clinton Avenue and E Jensen Avenue is within the 100-year floodplain. For bidding purposes, a geosynthetic membrane, drainage layer, and rip-rap
protection is required for all embankments over 5 feet high north of E Jensen Avenue.
Jacked Box Tunnel 7.5
The preliminary design has assumed the following key dimensions for the Jacked Box beneath SR 180:
Total Length: 360 feet
Jacked Length (excluding shield): 240 feet
Thickness of the walls, roof, and base: 5 feet
External width of the box: 53 feet
External height of the box: 42 feet
The proposed right-of-way has been increased to 80 feet in the construction area of the Jacked Box.
This allows a wider separation of the excavation shoring walls and allows sufficient working space for construction of the Jacked Box. As the excavation must be unbraced to allow space for constructing the
Box, it is likely that the shoring walls will also be more substantial in this area than in other parts of the U-Trough. Due to the topography of the area and the slope of the alignment, the top of the Jacked Box
projects above the ground level in the launch pit. It is expected that the Contractor will extend the
shoring above the adjacent grade to permit the construction of overhead braces that clear the top of the box.
7.5.1 Ground Conditions
The Jacked Box Tunnel will be constructed in predominantly in Alluvial Fan deposits. The upper 4 to
5 feet of the tunnel excavation will likely encounter Existing Fill. Up to 11 to 12 feet of Existing Fill were placed below the existing SR 180 Caltrans bridge footings (see section 6.1.1). The nature of this fill is
unknown but anticipated to have been placed in a controlled environment. Therefore, the Existing Fill over the Jacked Box Tunnel is anticipated to be more competent.
The ground must have sufficient strength to arch safely across the open cells and must accept the
incremental advance of the shield into it without distress. Sometimes it is necessary to improve the ground in advance of tunneling. However, neither the Alluvial Fan nor the Existing Fill is anticipated to be
susceptible to most conventional grouting techniques including permeation and chemical grouting.
For bidding purposes assume grouting ahead of the excavation is not possible.
7.5.2 Jacking Pit and Base Slab
The Jacked Box should be constructed on a base slab that is used to provide the reaction force against the jacks. This “jacking base slab” could be dowelled to the shoring wall to further distribute the jacking
forces. Depending on the method used by the Contractor, the jacking base slab will be extended part way up the sides of the Jacked Box to provide lateral guidance and ensure it stays properly aligned in the
early (critical) stages of the jacking operation.
The Jacked Box has been assumed to be a monolithic reinforced concrete section, though it is also
possible that the Contractor may choose to divide the box into segments with “interstage” jacking between segments.
HSR
13-
06 -
EXEC
UTI
ON
VER
SIO
N

CALIFORNIA HIGH-SPEED TRAIN PROJECT ENGINEERING GEOTECHNICAL BASELINE REPORT FOR BID
FRESNO TO BAKERSFIELD SECTION CONTRACT PACKAGE 1
Page 7-7
7.5.3 Anti-Drag System
An essential component of the box jacking system is the method by which drag from the structure is
reduced. The anti-drag system (ADS) is designed to prevent this. The ADS prevents the overlying ground from being dragged along with box as it is jacked forward. In large embankments, there is some
resistance to the drag force from the shear resistance of the embankment itself. However, this resistance may be insufficient to restrain the effect in the case of a wide box with low cover. If unrestrained, the
ground on top of the box would be dragged forward, causing major disturbance and possible disruption to the overlying infrastructure.
The ADS wires do not isolate the sides of the box from the jacking force, so it is necessary to provide a
method of reducing the frictional resistance of the sides to ensure that the force transmitted to the
ground at the sides is minimized. Ground drag on the sides of the box is usually reduced by arranging the cutting edge so that a slightly larger hole is excavated than the box dimensions. Typically, the excavation
is oversized by about 1 inch. However, the amount of over excavation has an effect on the amount of settlement that is seen at the surface, so overdig should be kept to the minimum necessary. Ground drag
can also be reduced by lubricating the ground/structure interface with bentonite slurry. Usually both these methods are used together.
For bidding purposes, assume an ADS in conjunction with lubricating the ground/structure interface with
bentonite slurry will be required.
7.5.4 Jacking Equipment
The jacking load will consist of the following:
Reaction on shield structure
Friction due to the dead load of the concrete structure on the ground/concrete launch portal
Friction on the top and side of the concrete box against the soil
The total load, including all the components defined above, is estimated to be 18,500 kips. The maximum
design single jack load is assumed to be 500 tons (1,000 kips), and the number of jacks is expected to be less than 20 units. For baseline purposes assume the jacking equipment should be designed for
18,500 kips.
7.5.5 Face Support
The excavation size proposed for this box is approximately 53 feet wide by 42 feet high. This would present a large excavation face that may be difficult to control. It is common practice to subdivide the
excavation face into several compartments that can be excavated by mini-excavator or by hand. This method gives the ability to control the excavation by selectively excavating certain compartments at
different rates in order to steer the box and maintain directional control. Some contractors also use doors
that retain the face when not being excavated. These may be hydraulically controlled and linked to the main jacks to ensure a constant pressure is exerted on the face.
Adequate face support will be crucial to maintaining excavation stability in the event the Jacked Box
encounters perched groundwater conditions.
7.5.6 Protection of Existing Structures
The jacked box tunneling operation must be carefully monitored and controlled to ensure the required
performance and safety. Throughout the tunneling operation, movements at the ground surface over the
area affected by the tunneling operation, jacking forces, and vertical and horizontal box alignment should be regularly monitored and compared to predicted or specified values.
HSR
13-
06 -
EXEC
UTI
ON
VER
SIO
N

CALIFORNIA HIGH-SPEED TRAIN PROJECT ENGINEERING GEOTECHNICAL BASELINE REPORT FOR BID
FRESNO TO BAKERSFIELD SECTION CONTRACT PACKAGE 1
Page 7-8
Caltrans requirements for protection of their abutment and bridge are as follows:
The abutment movements must not exceed ¼ inches horizontally ½ inches vertically
The vertical deck movement must not exceed 1 inch for continuous superstructures and 2 inches
for simple spans
All proposals relating to crossing of the SR 180 will be subject to Caltrans review and approval
before work is permitted to commence
The schedule assumed in bidding should consider sufficient time to complete the Caltrans design review
process.
To meet these movement limitations, the Contractor shall assume that some form of compensation grouting of the ground under the abutment will be required and that compensation-grouting equipment
will need to be linked to a settlement monitoring system to adjust the foundation of the bridge as jacking proceeds.
HSR
13-
06 -
EXEC
UTI
ON
VER
SIO
N

CALIFORNIA HIGH-SPEED TRAIN PROJECT ENGINEERING GEOTECHNICAL BASELINE REPORT FOR BID
FRESNO TO BAKERSFIELD SECTION CONTRACT PACKAGE 1
Page 8-1
8.0 Construction Considerations
Regulatory Agencies 8.1
If temporary construction dewatering is utilized, a National Pollutant Discharge Elimination System
(NPDES) permit from the Central Valley Regional Water Quality Control Board is required. In general, there is a long lead time required to obtain a NPDES permit. Refer to the Contract Documents for Storm
Water Pollution Prevention Plan (SWPPP) requirements.
Gas detection and monitoring was not in the scope of the preliminary geotechnical investigation. It is the responsibility of the Contractor to investigate potentially gassy conditions that are likely present during
construction of the Jacked Box Tunnel. Tunnel air monitoring and ventilation shall comply with OSHA 29
CFR 1926.800 regulations.
Trench excavations, shoring systems, sloped cuts, and other temporary structures shall comply with OSHA 29 CFR 1926.650 regulations.
Site Constraints 8.2
The Contractor shall conduct a site review to identify site specific-constraints which will impact the
selection of construction sequence, equipment, and methods. Items affecting the selection of construction means and methods include, but are not limited to: (1) site accessibility and space
restrictions; (2) restrictions on traffic disruption; (3) environmental concerns, including local restrictions on construction noise, vibration, and dust; (4) easement and right-of-way restrictions; and (5) location(s)
of overhead and underground utilities and nearby structures.
Corrosive Soils 8.3
Laboratory soil corrosion and water chemistry testing conducted for 30% design did not indicate the
presence of a corrosive subsurface environment.
Contaminated Soils 8.4
The ground investigation conducted for PEP indicated the presence of contaminated soils. The type, source, concentration, spatial extent, and variability of contaminants that may be encountered during
excavation remains uninvestigated. However, because the project alignment follows existing freeway and railroad corridors portions of which are heavily industrialized, the Contractor shall expect to encounter
contaminated soils during excavation pursuant to the baseline values presented in section 6.1.4.
A soil management plan and site-specific health and safety plan must be implemented prior to initiation of construction activities. If evidence of contaminated soil is found during excavation activities (e.g.,
stained soil, odors), soil sampling and testing will be required prior to any disposal or reuse. Refer to the
Contract Documents for more information.
Difficult Excavation 8.5
CPTs performed for the PEP Geotechnical Investigation occasionally required pre-drilling at depths where
cone penetrometers could not penetrate through hardpan layers. Specific CPT locations and depths
where pre-drilling was required are indicated in the GDR. Pre-drilling extended between 5 and 15 feet in thickness, starting at depths ranging from 9 to 29 feet.
The Contractor shall expect that excavations will penetrate hardpan layers of variable thickness,
hardness, and degree of cementation. Relatively thin, moderately hard, and moderately cemented hardpan layers may be excavated using heavy-duty equipment. However, thicker, harder, and/or more
HSR
13-
06 -
EXEC
UTI
ON
VER
SIO
N
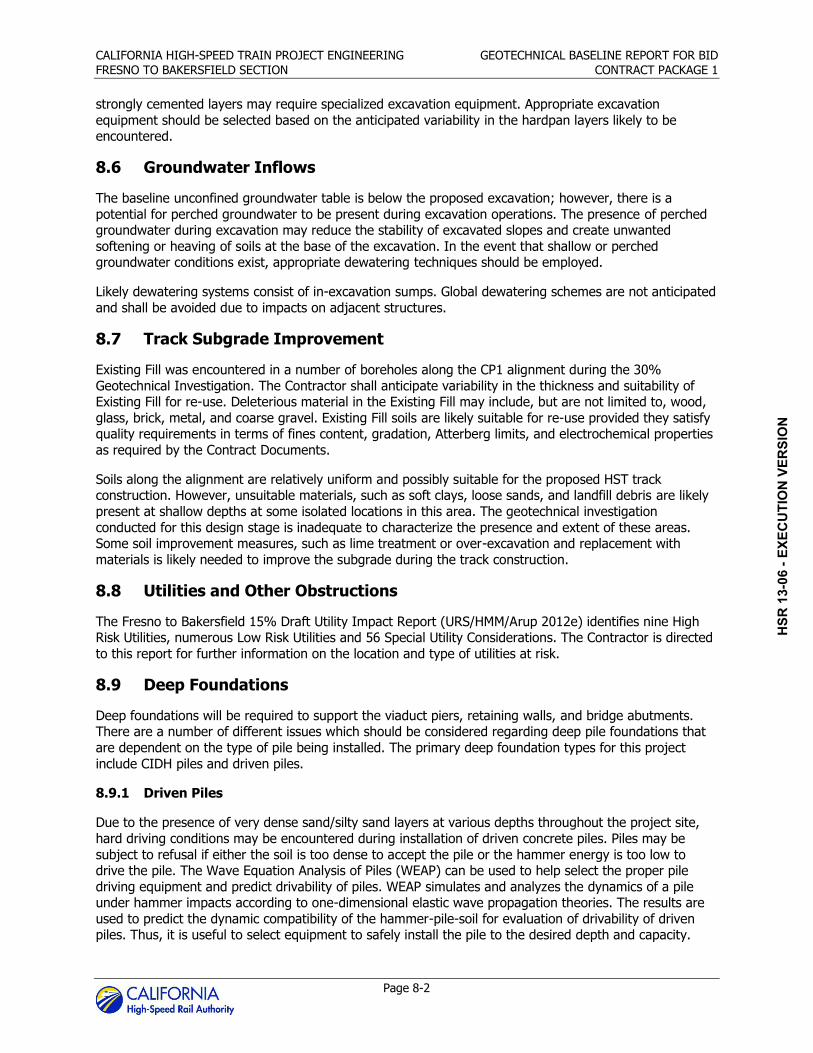
CALIFORNIA HIGH-SPEED TRAIN PROJECT ENGINEERING GEOTECHNICAL BASELINE REPORT FOR BID
FRESNO TO BAKERSFIELD SECTION CONTRACT PACKAGE 1
Page 8-2
strongly cemented layers may require specialized excavation equipment. Appropriate excavation
equipment should be selected based on the anticipated variability in the hardpan layers likely to be encountered.
Groundwater Inflows 8.6
The baseline unconfined groundwater table is below the proposed excavation; however, there is a
potential for perched groundwater to be present during excavation operations. The presence of perched groundwater during excavation may reduce the stability of excavated slopes and create unwanted
softening or heaving of soils at the base of the excavation. In the event that shallow or perched groundwater conditions exist, appropriate dewatering techniques should be employed.
Likely dewatering systems consist of in-excavation sumps. Global dewatering schemes are not anticipated
and shall be avoided due to impacts on adjacent structures.
Track Subgrade Improvement 8.7
Existing Fill was encountered in a number of boreholes along the CP1 alignment during the 30%
Geotechnical Investigation. The Contractor shall anticipate variability in the thickness and suitability of Existing Fill for re-use. Deleterious material in the Existing Fill may include, but are not limited to, wood,
glass, brick, metal, and coarse gravel. Existing Fill soils are likely suitable for re-use provided they satisfy quality requirements in terms of fines content, gradation, Atterberg limits, and electrochemical properties
as required by the Contract Documents.
Soils along the alignment are relatively uniform and possibly suitable for the proposed HST track construction. However, unsuitable materials, such as soft clays, loose sands, and landfill debris are likely
present at shallow depths at some isolated locations in this area. The geotechnical investigation
conducted for this design stage is inadequate to characterize the presence and extent of these areas. Some soil improvement measures, such as lime treatment or over-excavation and replacement with
materials is likely needed to improve the subgrade during the track construction.
Utilities and Other Obstructions 8.8
The Fresno to Bakersfield 15% Draft Utility Impact Report (URS/HMM/Arup 2012e) identifies nine High Risk Utilities, numerous Low Risk Utilities and 56 Special Utility Considerations. The Contractor is directed
to this report for further information on the location and type of utilities at risk.
Deep Foundations 8.9
Deep foundations will be required to support the viaduct piers, retaining walls, and bridge abutments. There are a number of different issues which should be considered regarding deep pile foundations that
are dependent on the type of pile being installed. The primary deep foundation types for this project
include CIDH piles and driven piles.
8.9.1 Driven Piles
Due to the presence of very dense sand/silty sand layers at various depths throughout the project site,
hard driving conditions may be encountered during installation of driven concrete piles. Piles may be
subject to refusal if either the soil is too dense to accept the pile or the hammer energy is too low to drive the pile. The Wave Equation Analysis of Piles (WEAP) can be used to help select the proper pile
driving equipment and predict drivability of piles. WEAP simulates and analyzes the dynamics of a pile under hammer impacts according to one-dimensional elastic wave propagation theories. The results are
used to predict the dynamic compatibility of the hammer-pile-soil for evaluation of drivability of driven piles. Thus, it is useful to select equipment to safely install the pile to the desired depth and capacity.
HSR
13-
06 -
EXEC
UTI
ON
VER
SIO
N

CALIFORNIA HIGH-SPEED TRAIN PROJECT ENGINEERING GEOTECHNICAL BASELINE REPORT FOR BID
FRESNO TO BAKERSFIELD SECTION CONTRACT PACKAGE 1
Page 8-3
As per Section 49-1.05 of the Caltrans Standard Specifications, undersize pre-drilling can be used to
facilitate the pile driving in thick and dense sand layers. Pre-drilling holes shall not be greater than the least dimension of the piles. In addition, driven steel pile (open-ended pipe pile or H pile) can also be
considered to penetrate layers with difficult driving conditions.
8.9.2 Cast-in-Drilled-Hole Piles
CIDH piles can be achieved in this region by a number of techniques which include drilling an open dry hole, drilling the hole with water, drilling the hole with a bentonite slurry, and drilling a temporarily cased
hole. Each of these methods has their advantages and disadvantages. For baseline purposes assume CIDH piles will require temporary support to prevent caving given the granular nature of the soils.
Cobbles and boulders can impede drilling operations. Cobbles and boulders were not encountered during
our exploration and are not anticipated as a baseline condition for construction of CIDH piles. Hardpan can also impede drilling operations and shall be considered in accordance with the baselines established
herein.
Excavations 8.10
Shallow excavations will be required for the pile caps. Trenching may also be required for utility
installation. For the shallow depth of these excavations, excavations may be cut vertically if the soils will “stand-up” without shoring.
In some areas the soils may be too loose or granular to achieve a 5-foot excavation and a sloped cut or
bracing must be used in conjunction with falsework and engineered backfill. Backfill at sloped pile cap excavations must be compacted to provide sufficient lateral resistance.
Deep excavations will require shoring. Soils along the grade separation structures are generally strong
but are prone to raveling and sloughing if left unsupported and exposed to the elements.
All slope design, bracing, and trench work shall meet the requirements of Federal and State OSHA Regulations. For bidding purposes assume the baseline behavior of Alluvial Fan will classify as OSHA
Type B soils and the Existing Fill will classify as OSHA Type C soils.
Surface runoff on the site should be controlled so that it does not flow into open excavations. Surface runoff shall conform to standard SWPPP requirements.
Existing Structures 8.11
Existing structures include the following:
McKinley Detention Basin
Belmont Detention Basin
96-in diameter Belmont Storm Drain
Union Pacific/BNSF Railroad
North San Joaquin Valley Railroad Spur
South San Joaquin Railroad Spur
Dry Creek Canal
SR 180
SR 41
SR 99
Several irrigation canals south of E North Avenue.
HSR
13-
06 -
EXEC
UTI
ON
VER
SIO
N

CALIFORNIA HIGH-SPEED TRAIN PROJECT ENGINEERING GEOTECHNICAL BASELINE REPORT FOR BID
FRESNO TO BAKERSFIELD SECTION CONTRACT PACKAGE 1
Page 8-4
Environmental Concerns 8.12
Noise and vibrations produced through the construction of the project structures should adhere to the
project environmental management plan and comply with state and federal health and safety regulations.
Construction schedules shall consider earthwork to take advantage of dry season (April through October). Earthwork in the dry season must include provisions for dust mitigation in accordance with local and
regional air quality regulations.
Requirements for erosion control are found in Specification Section 31 05 00.
Archeological Resources 8.13
Based on review of the F-B Archeological Survey (URS/HMM/Arup 2011) there are no historic properties or archeological resources within CP1.
Construction Consideration Matrix 8.14
Table 8.14-1 below has been prepared to capture, from an engineer’s perspective, the site conditions
that would be of concern to a bidding contractor. The list is not exhaustive, but identifies some conditions at each of the planned structures that could have cost implications when considered as part of the bid
preparation.
HSR
13-
06 -
EXEC
UTI
ON
VER
SIO
N

CALIFORNIA HIGH-SPEED TRAIN PROJECT ENGINEERING GEOTECHNICAL BASELINE REPORT FOR BID
FRESNO TO BAKERSFIELD SECTION CONTRACT PACKAGE 1
Page 8-5
Table 8.14-1
Construction Considerations Matrix
Location
Tra
ck
Su
bg
rad
e
Imp
rove
me
nt
Pe
rch
ed
Gro
un
dw
ate
r
Co
ntr
ol
Gro
un
dw
ate
r In
flo
w
Dif
ficu
lt e
xca
va
tio
n -
Ha
rd P
an
Bu
rie
d U
tili
tie
s a
nd
Oth
er
Ob
str
ucti
on
s
Co
nta
min
ate
d S
oil
Co
mp
ressib
le S
oil
Co
lla
psib
le S
oil
Ex
pa
nsiv
e S
oil
Co
rro
siv
e S
oil
Re
gu
lato
ry A
ge
ncie
s
De
ep
Fo
un
da
tio
ns
Te
mp
ora
ry S
ho
rin
g
Pro
tecti
on
of
Ex
isti
ng
Str
uctu
res
En
vir
on
me
nta
l
Co
nce
rns
Arc
he
olo
gic
al
Re
so
urc
es
At-Grade X
X
X
X
X
McKinley Avenue Roadway Overcrossing and Pedestrian Bridge
X
X X X
X X X X
Olive Avenue Roadway Overcrossing and Pedestrian Bridge
X
X X X
X X X X
Fresno Grade Separation X X X X X X
X
X X X
Jack-Box Tunnel X X
X X X
X
X X
At-Grade X
X
X
X
X
Stanislaus Roadway Overcrossing
X X X X X
X X X X
Tuolumne Roadway Overcrossing
X X X X X
X X X X
Fresno Street HST Overcrossing X X X
X
X X X X
Tulare Street HST Overcrossing
X
Ventura Avenue Roadway Overcrossing and Pedestrian Bridge
X X
X
X X X X
Church Avenue Roadway Overcrossing and Pedestrian Bridge
X X
X
X X X X
Jensen Trench X X X X X X
X
X X
At-Grade X
X
X
X
X
Fresno (SR 99) Viaduct
X X
X
X X X X
At-Grade X
X
X
X
X
Central Avenue Overcrossing X X
X X X
X X X X
E American Avenue Overcrossing X X
X X X
X X X X
HSR
13-
06 -
EXEC
UTI
ON
VER
SIO
N

HSR
13-
06 -
EXEC
UTI
ON
VER
SIO
N

CALIFORNIA HIGH-SPEED TRAIN PROJECT ENGINEERING GEOTECHNICAL BASELINE REPORT FOR BID
FRESNO TO BAKERSFIELD SECTION CONTRACT PACKAGE 1
Page 9-1
9.0 Instrumentation and Monitoring
Monitoring during underground construction is indispensable to verify assessments of ground behavior
and make changes if necessary, and protect the Authority and the Contractor from any unsubstantiated claims by third parties who perceive that damage has occurred.
It is the Contractor’s responsibility to survey and document the existing pre-construction conditions of
adjacent structures and features – including railway structures, bridge structures, road embankments, and private roads and structures – and to monitor noise, vibration, and movements of these adjacent
structures and features during construction in accordance with the Contract Documents and all applicable
regional and local regulations.
The purposes of the instrumentation and monitoring program on this project are (a) to detect and monitor the vertical and horizontal movement of adjacent railway structures, bridge structures, road
embankments, and private roads, and; (b) to comply with the requirements of major stakeholders (such as Caltrans in the case of the Jacked Box Tunnel below SR 180). The Contractor is responsible for
developing a program that satisfies project objectives and meets contract requirements including monitoring, reporting, and implementing approved action plans should response (ground movement)
values be exceeded.
Response Values consist of Threshold Values and Limiting Values. Threshold Values are set lower than
Limiting Values and provide advance notification of ground movements that are trending towards damaging levels, such that mitigation measures can be employed prior to movements reaching critical
levels. When a Limiting Value is approached or reached, an immediate suspension of excavation activities will be implemented until movements can be controlled and corrective measures put into place to prevent
future damage. Response values will be determined based on the nature of work and are subject to the requirements of third parties including Caltrans and the adjacent railroads.
The instrumentation and monitoring plan shall ensure surface settlements are maintained within the
allowable movements to prevent damage to existing structures, utilities and other facilities. At minimum,
instrumentation shall include the following:
Surface settlement points
Inclinometers
Tiltmeters
Extensometers
Crack Gauges
Shoring monitoring points
Utility monitoring points
Building monitoring points
Of particular importance are the abutment foundations supporting SR 180 over the proposed Jacked Box Tunnel. The Contractor will need to satisfy all Caltrans requirements for monitoring of the abutment
foundations and SR 180 during construction of the Jacked Box Tunnel. A “high-sensitivity” monitoring
system possibly consisting of settlement sensor liquid tube fixed to the abutment, foundations and/or girders, capable of a continuous monitoring readout with real-time movement data shall be anticipated.
Provisions for access to the abutment will need to be made throughout tunneling operations for instrumentation monitoring and maintenance purposes.
HSR
13-
06 -
EXEC
UTI
ON
VER
SIO
N

HSR
13-
06 -
EXEC
UTI
ON
VER
SIO
N

CALIFORNIA HIGH-SPEED TRAIN PROJECT ENGINEERING GEOTECHNICAL BASELINE REPORT FOR BID
FRESNO TO BAKERSFIELD SECTION CONTRACT PACKAGE 1
Page 10-1
10.0 References
American Association of State Highway and Transportation Officials, 2010. LRFD Bridge Design
Specifications. 5th Edition.
American Water Works Association (AWWA), 2011. RTW Corrosivity Index Calculator. http://www.awwa.org/Resources/RTWCorrosivityCalc.cfm?navItemNumber=1576
American Petroleum Institute (API), 1987. Recommended Practice for Planning, Designing and
Constructing Fixed Offshore Platforms. API Recommended Practice 2A(RP-2A), Washington D.C, 17th edition.
Brown and Caldwell, 2006. Technical Memorandum – Kings Basin Integrated Hydrogeologic Modeling,
Hydrogeologic Investigation.
California Department of Transportation (Caltrans), 1996. Caltrans Seismic Hazards Map and A Technical Report to Accompany the Caltrans California Seismic Hazards Map (Based on Maximum Credible
Earthquakes).
______, 2007. ARS Online v1.0.4 tool and documentation. http://dap3.dot.ca.gov/shake_stable/index.php. Accessed October 17, 2012.
______, 2007 Caltrans Deterministic PGA Map Fault Identification Numbers (FID) Shown. Online.
http://www.dot.ca.gov/hq/esc/earthquake_engineering/SDC_site/2007%20Caltrans%20Determin
istic%20PGA%20Map.pdf.
_______,2010. Soil and Rock Logging, Classification, and Presentation Manual. Division of Engineering
Services, Geotechnical Services.
California Department of Water Resources (CDWR), 2011. Water Data Library. http://www.water.ca.gov/waterdatalibrary/.
_________,2011. Groundwater Data & Monitoring. South Central Region.
http://www.water.ca.gov/groundwater/data_and_monitoring/south_central_region/GroundwaterLevel/gw_level_monitoring.cfm.
California Geological Survey (CGS), 2010. Geologic Map of California. Original compilation by Charles
Jennings (1977). Updated version by Carlos Guiterrez, William Bryant, George Saucedo, and Chris Wills.
_______, 2010. Fault Activity Map of California. Geologic Data Map No. 6.
http://www.quake.ca.gov/gmaps/FAM/faultactivitymap.html
Cehrs, D., S. Soenke and W.C. Bianchi. 1980. A Geologic Approach to Artificial Recharge Site Selection in the Fresno-Clovis Area, California. United States Department of Agriculture (USDA) Technical
Bulletin 1604.
CH2MHill, 2005. First Five-Year Review Report for Fresno Sanitary Landfill Superfund Site Fresno County, California.
City of Fresno, 2010. Water Quality Annual Report 2010.
City of Kerman, 2007. 2007 Kerman General Plan Update. Online.
http://www.codepublishing.com/CA/Kerman/generalplan/ Accessed February 25, 2012.
HSR
13-
06 -
EXEC
UTI
ON
VER
SIO
N

CALIFORNIA HIGH-SPEED TRAIN PROJECT ENGINEERING GEOTECHNICAL BASELINE REPORT FOR BID
FRESNO TO BAKERSFIELD SECTION CONTRACT PACKAGE 1
Page 10-2
Essex. R.J., 2007. Geotechnical Baseline Reports for Construction – Suggested Guidelines. Technical
Committee on Geotechnical Reports of the Underground Technology Research Council of the Construction Institute of ASCE
Fresno Irrigation District et al., 2006. Fresno Area Regional Groundwater Management Plan.
Gibbs, H.J., 1969. Discussion, Proceedings of the Speciality Session No. 3 on Expansive Soils and
Moisture Movement in Partly Saturated Soils, Seventh International Conference on Soil Mechanics and Foundation Engineering, Mexico City.
Gregg Drilling & Testing, Inc., 2011. Seismic Cone Penetrometer Testing (SCPTu).
http://www.greggdrilling.com/PDF_files/TechnicalMethodologyPDF/SeismicCPT.pdf
Holtz, W.G., 1959. Expansive Clays – Properties and Problems , Quarterly of the Colorado School of Mines, Vol. 54, No. 4, pp. 79-86.
International Code Council, 2006. 2006 International Building Code.
Jenkins, O.P., 1966. Geological Map of California Fresno Sheet, Division of Mines and Geology.
Jennings, C.W., 1994. Fault activity map of California and adjacent areas with locations and ages of
recent volcanic eruptions: California Department of Conservation, Division of Mines and Geology
Data Map Series No. 6, 92 p., 2 plates, map scale 1:750,000
Mitchell and Gardner Page, R.W., 1986. Geology of the fresh ground-water basin of the Central Valley, California, with texture
maps and sections: United States Geological Survey, Professional Paper 1401-C.
_______, 2011b. TM 2.9.2 Geotechnical Report Preparation Guidelines. Fresno to Bakersfield Section. California High-Speed Train Project.
_______, 2011e. TM 2.10.4 Seismic Design Criteria. Fresno to Bakersfield Section. California High-Speed
Train Project.
_______, 2011g. Notice to Designers No. 03 – Preliminary Engineering (30% Design) Scope Revisions, R0. Fresno to Bakersfield Section. California High-Speed Train Project.
_______, 2011i. Interim 30% Design Spectra for F-B. Fresno to Bakersfield Section. California High-
Speed Train Project.
Robertson. P.K., Campanella, R.G., Gillespie, D., and Greig, J., 1986. Use of Piezometer Cone Data. In-Situ ‘86 Use of In-Situ Testing in Geotechnical Engineering, GSP 6 , ASCE, Reston, VA, Specialty
Publication, SM 92, pp 1263-1280.SC Solutions, 2011. California High-Speed Train Project – 30% Design Ground Motions.
Robertson, P.K., 2009. Interpretation of Cone Penetration Tests – A Unified Approach. Canadian
Geotechnical Journal. Vol. 46(11) 1337-1355.
Terzaghi, K. V.,1955 .Evaluation of Coefficient of Subgrade Reaction. Geotechnique,5(4): 297-326.
U. S. Department of Agriculture (USDA) and Natural Resources Conservation Service (NRCS), 2008. Soil Survey Geographic (SSURGO) database for Eastern Fresno Area County, California. Fort Worth,
Texas. http://SoilDataMart.nrcs.usda.gov. Accessed March 2010.
Unruh, J.R. and Moores, E.M., 1992. Quaternary blind thrusting in the southwestern Sacramento Valley
HSR
13-
06 -
EXEC
UTI
ON
VER
SIO
N

CALIFORNIA HIGH-SPEED TRAIN PROJECT ENGINEERING GEOTECHNICAL BASELINE REPORT FOR BID
FRESNO TO BAKERSFIELD SECTION CONTRACT PACKAGE 1
Page 10-3
URS/HMM/Arup Joint Venture, 2012 F-P Geotechnical Data Report – Historical Borehole Data. Fresno to
Bakersfield Section. California High-Speed Train Project.
_______, 2012a F-B Draft Environmental Impact Report/Environmental Impact Statement. Fresno to Bakersfield Section. California High-Speed Train Project.
_______, 2012b F-B Geology, Soils and Seismicity Report. Fresno to Bakersfield Section. California High-
Speed Train Project.
_______, 2012c F-B Geologic and Seismic Hazards Report. Fresno to Bakersfield Section. California High-Speed Train Project.
_______, 2012d F-B Water Quality/Hydrology Report. Fresno to Bakersfield Section. California High-
Speed Train Project.
_______, 2012e F-B 15% Draft Utility Impact Report. Fresno to Bakersfield Section. California High-Speed Train Project.
_______, 2011f F-B Archeological Survey. Fresno to Bakersfield Section. California High-Speed Train
Project.
U.S. Bureau of Reclamation (USBR)
U.S. Federal Highway Administration, 2010. Drilled Shafts: Construction Procedures and LRFD Design
Methods. FHWA-NHI-10-016.
U.S. Geological Survey (USGS), 2006. Quaternary Fault and Fold Database for the United States,
Electronic document, available at: http//earthquakes.usgs.gov/regional/qfaults/
HSR
13-
06 -
EXEC
UTI
ON
VER
SIO
N

HSR
13-
06 -
EXEC
UTI
ON
VER
SIO
N

CALIFORNIA HIGH-SPEED TRAIN PROJECT ENGINEERING GEOTECHNICAL BASELINE REPORT FOR BID
FRESNO TO BAKERSFIELD SECTION CONTRACT PACKAGE 1
Page 11-1
11.0 Glossary
Artesian: A condition that exists when the water table piezometric surface lies above the ground level
Atterberg Limits: The water contents of a soil mass corresponding to the transition between a solid,
semi-solid, plastic solid or liquid. Laboratory test used to distinguish the plasticity of clay and silt particles.
Boulder: A boulder is defined as a rock fragment that will not pass through a 12-inch (305mm) square opening, no matter how it is oriented in the opening. Boulder sizes are defined by the smallest size
opening that the boulder can be oriented to pass through.
Bulk Unit Weight: The total weight of water and soil particles contained in a unit volume of soil.
Bulking/Swell factor: (volume of soil after excavation) / (volume of soil in-situ)
Cobbles: Soil particles between 3 inches (76 millimeters) and 12 inches (305 millimeters) in size.
Cohesion: The force that holds together molecules or like particles within a substance.
Cohesionless soils, Non-cohesive soils: Granular soils (silt, sand, and gravel type) with no shear
strength unless confined.
Cohesive running: See Running.
Cohesive soils: Contains clay minerals and possesses plasticity.
Confined aquifer: An aquifer which groundwater is confined under pressure which is significantly greater than atmospheric pressure.
Consolidation: Reduction in soil volume due to squeezing out of water from the pores as the soil comes
to equilibrium with the applied loads.
Deep wells: Wells with pumps installed at depth.
Depressurization: Reduction of water pressure by dewatering or other means.
Dewatering: The removal of groundwater to reduce the flow rate or diminish water pressure. Dewatering is usually done to improve conditions in surface excavations and to facilitate construction
work.
Dry Unit Weight: The weight of solids (soil grains) to the total unit volume of soil. Units lb/ft³, kN/m³.
Structural Fill: Soils used as fill, such as retaining wall backfill, foundation support, dams, slopes, etc., that are to be placed in accordance to engineered specifications. These specifications may delineate soil
grain-size, plasticity, moisture, compaction, angularity, and many other index properties depending on the application.
Firm, firm ground: Soil that remains stable in walls and face of an opening without initial support for
sufficient time to permit installation of final support.
Flowing, flow, flowing ground: Soil that moves like a viscous liquid into an excavation.
Grain Size Distribution, Particle Size Distribution: Soil particle sizes that are determined from a representative sample of soil that is passed through a set of sieves of consecutively smaller openings.
HSR
13-
06 -
EXEC
UTI
ON
VER
SIO
N

CALIFORNIA HIGH-SPEED TRAIN PROJECT ENGINEERING GEOTECHNICAL BASELINE REPORT FOR BID
FRESNO TO BAKERSFIELD SECTION CONTRACT PACKAGE 1
Page 11-2
Groundwater: Water that infiltrates into the earth and is stored in the soil and bedrock within the zone
of saturation below the earth’s surface.
Grout: A fluid mixture of water, cement, and/or sand, or of various additive chemicals that is injected directly into soil or voids. The fluid solidifies and hardens to fill voids and provide a water barrier and
some reinforcement.
Hydraulic conductivity: See Permeability. The hydraulic conductivity is the volume flow rate of water through a unit cross-sectional area of a porous medium under the influence of a hydraulic gradient of
unity, at a specified temperature. It is measured in units of cm/s, m/s or m/day and varies with temperature.
Hydraulic gradient: The difference in total head (piezometric levels), between two points in a hydraulic
flow, divided by the length of the flow path (distance between the two points).
Hydrostatic head, hydrostatic pressure, pressure head: The height of a column of water required to develop a given pressure at a given point. Head may be measured in either height (feet or meters) or
pressure (pounds per square inch, kilograms per square centimeter, or bars).
Jet grouting: Ground modification system utilizing injection under pressure of a cement-fluid grout mixture to mix grout with soil to develop an in situ material of enhanced strength.
K0: The Coefficient of Earth Pressure at Rest (K0) of a soil is the ratio of horizontal to vertical effective
stress.
K0 = σh’/σv’
Moist Unit Weight: Ratio between the total weight of soil including water, and the total volume of the
soil.
Natural Water Content: The ratio between the mass of water and the mass of soil solids. w = (wet weight - dry weight) / dry weight.
Normalized Cone Resistance (Qt): CPT tip resistance in a non-dimensional form and taking account
of the in-situ vertical stresses.
Qt= (qt-v0)/v0’
Normalized Friction Ratio (Fr): ratio, expressed as a percentage, of the sleeve friction (fs) to the cone resistance (qt) taking account of the in-situ vertical stresses.
Fr= [fs/(qt-σvo)]100%
Normalized CPT Soil Behavior Type (SBTN): soil behavior type based on normalized cone resistance
(Qt) and normalized friction ratio (Fr).
Normally consolidated: A soil where the current effective overburden pressure is equal to the maximum overburden pressure.
Perched groundwater: An unconfined groundwater body in a generally limited area above the regional
water table and is separated from it by a low permeability, unsaturated zone of bedrock or soil.
Permeability: The capacity of bedrock or soil to permit fluids to flow through it. See Hydraulic Conductivity.
Permeation grouting: Injection of cementitious or solution grouts into the pore space of granular soils.
HSR
13-
06 -
EXEC
UTI
ON
VER
SIO
N

CALIFORNIA HIGH-SPEED TRAIN PROJECT ENGINEERING GEOTECHNICAL BASELINE REPORT FOR BID
FRESNO TO BAKERSFIELD SECTION CONTRACT PACKAGE 1
Page 11-3
Progressive failure: See Raveling.
qc: CPT cone resistance
qt: CPT cone resistance corrected for pore water effects, where An is the cone tip area ratio
qt=qc+u2(1-An)
Raveling, Slow raveling, Fast raveling: Chunks or flakes of material drop out of the excavated surface due to loosening or to overstress and “brittle” fracture. In fast raveling ground, the process starts
within a few minutes; otherwise, the ground is slow raveling.
Running, Cohesive Running ground: Granular soils that move freely into the excavated area. Granular materials without cohesion are unstable at a slope greater than their angle of repose (+ 30°-
35°). When exposed at steeper slopes, they run like granulated sugar or dune sand until the slope
flattens to the angle of repose. Cohesive running ground exhibits some apparent cohesion that exists from moisture content, weak cementation, and overconsolidation.
Shear Strength: The maximum shear stress which a soil can sustain under a given set of conditions.
For clay, shear strength = cohesion. For sand, shear strength = the product of effective stress and the tangent of the angle of internal friction.
Shrinkage factor: (volume of soil after compaction) / (volume of excavated soil before compaction)
Spalling: See Raveling.
Specific Gravity: The ratio of the density of a body or a substance to the mass of an equal volume of
water.
Spoil: The soil or rock materials generated during excavations. Included with these materials are drilling
fluid, grout, waste cement or other construction related residue.
Squeezing ground: Soil that undergoes a time-dependent deformation near a tunnel as the result of
load intensities which exceed the soils in situ strength. Ground squeezes or extrudes plastically into tunnel, without visible fracturing or loss of continuity, and without perceptible increase in water content.
Ductile, plastic yield and flow due to overstress.
Standard Penetration Test, N-Value: Field test performed in general accordance with ASTM D 1586, Test Method for Penetration Test and Split – Barrel Sampling of soils. Test involves driving a 2-inch OD,
1.375 inch ID, split spoon sampler with a 140-lb hammer, falling freely from a height of 30 inches. The number of blows required to achieve each of three 6 inch increments of sampler penetration is recorded.
The density of cohesionless or coarse-grained soils, and relative consistency of cohesive or fine-grained
soils is defined as below:
Cohesionless Soils Cohesive Soils
N, SPT Blows/ft Relative Density N, SPT Blows/ft Relative Consistency
0-4 Very loose Under 2 Very soft
4-10 Loose 2-4 Soft
10-30 Medium dense 4-8 Medium Stiff
30-50 Dense 8-15 Stiff
Over 50 Very Dense 15-30 Very Stiff
Over 30 Hard
HSR
13-
06 -
EXEC
UTI
ON
VER
SIO
N

CALIFORNIA HIGH-SPEED TRAIN PROJECT ENGINEERING GEOTECHNICAL BASELINE REPORT FOR BID
FRESNO TO BAKERSFIELD SECTION CONTRACT PACKAGE 1
Page 11-4
Swelling, Swelling ground: Soil that undergoes a volumetric expansion resulting from the addition of
water. Swelling ground may appear to be stable when exposed, with the swelling developing later. Ground absorbs water, increases in volume, and expands slowly into the tunnel. Increase in soil volume;
volumetric expansion of particular soils due to changes in water content.
u2: pore pressure generated during cone penetration and measured by a pore pressure sensor just behind the cone.
Unconfined aquifer: An aquifer containing water that is not under pressure.
Unconsolidated: Loose sediment; lacking cohesion or cement.
Unified Soil Classification System (USCS): A system of soil classification based on grain size, liquid
limit and plasticity of soils.
HSR
13-
06 -
EXEC
UTI
ON
VER
SIO
N

Appendix A Soil Parameter Interpretations
HSR
13-
06 -
EXEC
UTI
ON
VER
SIO
N

HSR
13-
06 -
EXEC
UTI
ON
VER
SIO
N

CALIFORNIA HIGH-SPEED TRAIN ENGINEERING GEOTECHNICAL BASELINE REPORT FOR BID FRESNO TO BAKERSFIELD SECTION CONTRACT PACKAGE 1
Page Ai
Table of Contents
Page
A1.0 Introduction..................................................................................................... 1-1 A2.0 CPT and SPT Correlations ................................................................................ 2-1
A2.1 Total Unit Weight .......................................................................................... 2-1 2.1.1 CPT Correlation ................................................................................ 2-1
A2.2 Effective Friction Angle .................................................................................. 2-1 2.2.1 CPT Correlation ................................................................................ 2-1 2.2.2 SPT Correlation ................................................................................ 2-1
A2.3 Standard Penetration Test Blow Count ............................................................ 2-2 2.3.1 CPT Correlation ................................................................................ 2-2 2.3.2 SPT Correction ................................................................................. 2-2
A2.4 Cone Tip Resistance ...................................................................................... 2-3 A2.5 Soil Modulus ................................................................................................. 2-3
2.5.1 CPT Correlation ................................................................................ 2-3 2.5.2 SPT Correlation ................................................................................ 2-3
A3.0 Grade Separation ............................................................................................. 3-1 A3.1 Total Unit Weight .......................................................................................... 3-1 A3.2 SPT N60 ........................................................................................................ 3-2 A3.3 Effective Friction Angle .................................................................................. 3-5 A3.4 Cone Tip Resistance ...................................................................................... 3-7 A3.5 Soil Modulus ................................................................................................. 3-8
A4.0 Jensen Trench .................................................................................................. 4-1 A4.1 Total Unit Weight .......................................................................................... 4-1 A4.2 SPT N60 ........................................................................................................ 4-3 A4.3 Effective Friction Angle .................................................................................. 4-5 A4.4 Cone Tip Resistance ...................................................................................... 4-7 A4.5 Soil Modulus ................................................................................................. 4-8
A5.0 Fresno Viaduct ................................................................................................. 5-1 A5.1 Total Unit Weight .......................................................................................... 5-1 A5.2 SPT N60 ....................................................................................................... 5-3 A5.3 Effective Friction Angle .................................................................................. 5-5 A5.4 Cone Tip Resistance ...................................................................................... 5-7 A5.5 Soil Modulus ................................................................................................. 5-8
A6.0 At-Grade, Embankment, and Other Ancillary Structures ................................ 6-1 A6.1 Total Unit Weight .......................................................................................... 6-1 A6.2 SPT N60 ........................................................................................................ 6-2 A6.3 Effective Friction Angle .................................................................................. 6-3 A6.4 Cone Tip Resistance ...................................................................................... 6-4 A6.5 Soil Modulus ................................................................................................. 6-5
A7.0 References ....................................................................................................... 7-1 Tables
Table A2.5-1 SPT Correlation to Soil Modulus by Soil Type ..................................................................... 2-3
Table A3.1-1 Statistical Summary of Total Unit Weight – Grade Separation ............................................. 3-1
Table A3.2-1 Statistical Summary of SPT N60 – Grade Separation ............................................................ 3-2
Table A3.3-1 Statistical Summary of Effective Friction Angle – Grade Separation ..................................... 3-5
Table A3.4-1 Statistical Summary of Cone Tip Resistance – Grade Separation ......................................... 3-7
Table A3.5-1 Statistical Summary of Soil Modulus Estimated from SPT– Grade Separation ....................... 3-8
HSR
13-
06 -
EXEC
UTI
ON
VER
SIO
N

CALIFORNIA HIGH-SPEED TRAIN ENGINEERING GEOTECHNICAL BASELINE REPORT FOR BID FRESNO TO BAKERSFIELD SECTION CONTRACT PACKAGE 1
Page Aii
Table A3.5-2 Statistical Summary of Soil Modulus Estimated from CPT– Grade Separation ....................... 3-9
Table A4.1-1 Statistical Summary of Total Unit Weight – Jensen Trench ................................................. 4-1
Table A4.2-1 Statistical Summary of SPT N60 – Jensen Trench ................................................................ 4-3
Table A4.3-1 Statistical Summary of Effective Friction Angle – Jensen Trench .......................................... 4-5
Table A4.4-1 Statistical Summary of Cone Tip Resistance – Jensen Trench .............................................. 4-7
Table A4.5-1 Statistical Summary of Soil Modulus Estimated from SPT– Jensen Trench ............................ 4-8
Table A4.5-2 Statistical Summary of Soil Modulus Estimated from CPT– Jensen Trench ............................ 4-9
Table A5.1-1 Statistical Summary of Total Unit Weight – Fresno Viaduct ................................................. 5-1
Table A5.2-1 Statistical Summary of SPT N60 – Fresno Viaduct ............................................................... 5-3
Table A5.3-1 Statistical Summary of Effective Friction Angle – Fresno Viaduct ......................................... 5-5
Table A5.4-1 Statistical Summary of Cone Tip Resistance – Fresno Viaduct ............................................. 5-7
Table A5.5-1 Statistical Summary of Soil Modulus Estimated from SPT– Fresno Viaduct ........................... 5-8
Table A5.5-2 Statistical Summary of Soil Modulus Estimated from CPT– Fresno Viaduct ........................... 5-9
Table A6.1-1 Statistical Summary of Total Unit Weight – Ancillary Structures .......................................... 6-1
Table A6.2-1 Statistical Summary of SPT N60 – Ancillary Structures ......................................................... 6-2
Table A6.3-1 Statistical Summary of Effective Friction Angle – Ancillary Structures ................................... 6-3
Table A6.4-1 Statistical Summary of Cone Tip Resistance – Ancillary Structures ....................................... 6-4
Table A6.5-1 Statistical Summary of Soil Modulus Estimated from SPT– Ancillary Structures ..................... 6-5
Table A6.5-2 Statistical Summary of Soil Modulus Estimated from CPT– Ancillary Structures ..................... 6-6 Figures
Figure A3.1-1 Statistical Summary of Total Unit Weight Estimated from CPT – Grade Separation .............. 3-2
Figure A3.2-1 Statistical Summary of N60 Estimated from CPT – Grade Separation ................................... 3-3
Figure A3.2-2 Statistical Summary of SPT N60– Grade Separation ........................................................... 3-4
Figure A3.3-1 Statistical Summary of Effective Friction Angle Estimated from CPT– Grade Separation ....... 3-5
Figure A3.3-2 Statistical Summary of Effective Friction Angle Estimated from SPT– Grade Separation ....... 3-6
Figure A3.4-1 Statistical Summary of Cone Tip Resistance from CPT – Grade Separation ......................... 3-7
Figure A3.5-1 Statistical Summary of Soil Modulus Estimated from SPT – Grade Separation ..................... 3-8
Figure A3.5-2 Statistical Summary of Soil Modulus Estimated from CPT – Grade Separation ..................... 3-9
Figure A4.1-1 Statistical Summary of Total Unit Weight Estimated from CPT – Jensen Trench .................. 4-2
Figure A4.2-1 Statistical Summary of SPT N60 Estimated from CPT – Jensen Trench ................................ 4-3
Figure A4.2-2 Statistical Summary of SPT N60 – Jensen Trench ............................................................... 4-4
Figure A4.3-1 Statistical Summary of Effective Friction Angle Estimated from CPT – Jensen Trench .......... 4-5
Figure A4.3-2 Statistical Summary of Effective Friction Angle Estimated from SPT – Jensen Trench .......... 4-6
Figure A4.4-1 Statistical Summary of Cone Tip Resistance from CPT – Jensen Trench ............................. 4-7
Figure A4.5-1 Statistical Summary of Soil Modulus Estimated from SPT – Jensen Trench ......................... 4-8
Figure A4.5-2 Statistical Summary of Soil Modulus Estimated from CPT – Jensen Trench ......................... 4-9
Figure A5.1-1 Statistical Summary of Total Unit Weight Estimated from CPT – Fresno Viaduct ................. 5-2
Figure A5.2-1 Statistical Summary of SPT N60 Estimated from CPT – Fresno Viaduct ................................ 5-3
HSR
13-
06 -
EXEC
UTI
ON
VER
SIO
N

CALIFORNIA HIGH-SPEED TRAIN ENGINEERING GEOTECHNICAL BASELINE REPORT FOR BID FRESNO TO BAKERSFIELD SECTION CONTRACT PACKAGE 1
Page Aiii
Figure A5.2-2 Statistical Summary of SPT N60 – Fresno Viaduct .............................................................. 5-4
Figure A5.3-1 Statistical Summary of Effective Friction Angle Estimated from CPT – Fresno Viaduct ......... 5-5
Figure A5.3-2 Statistical Summary of Effective Friction Angle Estimated from SPT – Fresno Viaduct .......... 5-6
Figure A5.4-1 Statistical Summary of Cone Tip Resistance from CPT – Fresno Viaduct ............................. 5-7
Figure A5.5-1 Statistical Summary of Soil Modulus Estimated from SPT – Fresno Viaduct ......................... 5-8
Figure A5.5-2 Statistical Summary of Soil Modulus Estimated from CPT – Fresno Viaduct ......................... 5-9
Figure A6.1-1 Statistical Summary of Total Unit Weight Estimated from CPT – Ancillary Structures ........... 6-1
Figure A6.2-1 Statistical Summary of SPT N60 Estimated from CPT – Ancillary Structures ......................... 6-2
Figure A6.2-2 Statistical Summary of SPT N60 – Ancillary Structures ....................................................... 6-2
Figure A6.3-1 Statistical Summary of Effective Friction Angle Estimated from CPT – Ancillary Structures ... 6-3
Figure A6.3-2 Statistical Summary of Effective Friction Angle Estimated from SPT – Ancillary Structures ... 6-3
Figure A6.4-1 Statistical Summary of Cone Tip Resistance from CPT – Ancillary Structures ...................... 6-4
Figure A6.5-1 Statistical Summary of Soil Modulus Estimated from SPT – Ancillary Structures .................. 6-5
Figure A6.5-2 Statistical Summary of Soil Modulus Estimated from CPT – Ancillary Structures .................. 6-6
HSR
13-
06 -
EXEC
UTI
ON
VER
SIO
N

HSR
13-
06 -
EXEC
UTI
ON
VER
SIO
N

CALIFORNIA HIGH-SPEED TRAIN ENGINEERING GEOTECHNICAL BASELINE REPORT FOR BID FRESNO TO BAKERSFIELD SECTION CONTRACT PACKAGE 1
Page A1-1
A1.0 Introduction
This appendix presents the results of statistical analyses used to develop the baseline soil parameters presented in Section 6.2 of the main report.
The purpose of this appendix is to enable bidders to evaluate the variability in ground conditions that may be anticipated during construction. Histograms and cumulative distributions have been prepared to present the range, mean, median, and standard deviation of data collected during this ground investigation. These interpretations are provided to illustrate the uncertainty associated with the estimates of baseline soil parameters.
The validity and reliability of the data presented herein have been reviewed, and in some cases, questionable data was excluded from the interpretations. Correlations used to derive soil parameters have been restricted to maximum reasonable values, based on engineering judgment.
Soil parameters have been measured and interpreted following TM 2.9.10 Geotechnical Analysis and Design Guidelines, in general accordance with Geotechnical Engineering Circular No. 5 (FHWA 2002) and AASHTO LRFD Bridge Design (2010) recommendations.
Cone penetration test (CPT) interpretations were based primarily on correlations published by Robertson (2009). All CPT data collected during the investigations was analyzed using the commercially available software CPeT-IT v1.7.3.35, developed by Geologismiki.
HSR
13-
06 -
EXEC
UTI
ON
VER
SIO
N

HSR
13-
06 -
EXEC
UTI
ON
VER
SIO
N

CALIFORNIA HIGH-SPEED TRAIN ENGINEERING GEOTECHNICAL BASELINE REPORT FOR BID FRESNO TO BAKERSFIELD SECTION CONTRACT PACKAGE 1
Page A2-1
A2.0 CPT and SPT Correlations
A2.1 Total Unit Weight
2.1.1 CPT Correlation
Total unit weight was estimated from CPT results using the following correlation proposed by Robertson (2009):
)236.1log36.0)log(27.0(
a
tfwt p
qR
Where:
w = Unit weight of water
fR = Friction ratio
tq = Cone resistance corrected for pore water effects
ap = Atmospheric pressure
A2.2 Effective Friction Angle
2.2.1 CPT Correlation
Effective fiction angle was estimated from CPT results using the following correlation proposed by Robertson (2009):
)log336.0256.0(5.29' 121.02tqq QBB
(Applicable for 10010.0 qB )
Where:
qB = Pore pressure ratio
tQ = Normalized cone resistance
2.2.2 SPT Correlation
Effective fiction angle was estimated from SPT results using the following correlation proposed by Hatanaka and Uchida (1996) for sands:
20)(4.15' 601N
Where:
601)(N = SPT N-value corrected for overburden and field procedures
HSR
13-
06 -
EXEC
UTI
ON
VER
SIO
N

CALIFORNIA HIGH-SPEED TRAIN ENGINEERING GEOTECHNICAL BASELINE REPORT FOR BID FRESNO TO BAKERSFIELD SECTION CONTRACT PACKAGE 1
Page A2-2
A2.3 Standard Penetration Test Blow Count
2.3.1 CPT Correlation
SPT N60 was estimated from CPT results using the following correlation proposed by Robertson (2009):
cItQN 2917.01268.160 101
Where:
tQ = Normalized cone penetration resistance
cI = Soil Behavior Type Index
Given By:
5.022 ])22.1(log)log47.3[( rtc FQI
Where:
rF = Normalized Friction Ratio
2.3.2 SPT Correction
The SPT correction for field procedures was applied as follows:
SPTE NCN 60
Where:
SPTN = Uncorrected field SPT N-value
EC = Correction factor for Energy Ratio (ER) as measured in the field = ER/60
The SPT correction for overburden was applied as follows:
60601)( NCN N
Where:
60N = SPT N-value corrected for hammer energy
NC = Stress normalization parameter calculated as ′
'vo = In situ vertical effective stress
n = Stress exponent (assumed to be 0.5 for sands)
HSR
13-
06 -
EXEC
UTI
ON
VER
SIO
N

CALIFORNIA HIGH-SPEED TRAIN ENGINEERING GEOTECHNICAL BASELINE REPORT FOR BID FRESNO TO BAKERSFIELD SECTION CONTRACT PACKAGE 1
Page A2-3
A2.4 Cone Tip Resistance
The cone tip resistance used for the statistical analyses refers to the static cone resistance qc measured from cone penetration tests, as follows:
c
cc A
Where:
cQ = Force acting on the cone
cA = Projected area of the cone
A2.5 Soil Modulus
2.5.1 CPT Correlation
Soil Modulus was estimated from CPT results using the following correlation (after AASHTO 2010):
cs qE 2 (Expressed in tons per square foot)
2.5.2 SPT Correlation
The SPT correlation for Soil Modulus was applied using the elastic constants provided in Table A5.2-1 (after AASHTO 2010). For the purposes of interpretations, all soils were considered to be Category 2 soils.
Table A2.5-1 SPT Correlation to Soil Modulus by Soil Type
Category Soil Type Soil Modulus (tsf)
1 Silty, sandy silts, slightly cohesive mixtures 4(N1)60
2 Clean fine to medium sands and slightly silty sands 7(N1)60
3 Coarse sands and sands with little gravel 10(N1)60
4 Sandy gravels and gravels 12(N1)60
HSR
13-
06 -
EXEC
UTI
ON
VER
SIO
N

HSR
13-
06 -
EXEC
UTI
ON
VER
SIO
N

CALIFORNIA HIGH-SPEED TRAIN ENGINEERING GEOTECHNICAL BASELINE REPORT FOR BID FRESNO TO BAKERSFIELD SECTION CONTRACT PACKAGE 1
Page A3-1
A3.0 Grade Separation
The following sections present the results of statistical analysis performed on data obtained from boreholes and CPTs at the location of the proposed Fresno grade separation.
For the purposes of interpreting soil parameters at this location, the soil profile was analyzed in two layers: (1) upper 50 feet of soils (excluding Existing Fill) and (2) soils below 50 feet.
For each soil parameter, a supporting table has been provided to summarize the mean, median, standard deviation, and range of values obtained by soil layer and test type (e.g. CPT, SPT, or laboratory test).
In some cases, soil parameters have been capped at a maximum value. Test results exceeding the maximum value are indicated in red on the histograms.
A3.1 Total Unit Weight
Table A3.1-1 Statistical Summary of Total Unit Weight – Grade Separation
Total Unit Weight CPT
Upper 50 ft Below 50 ft
No. Tests 2,172 1,525
Mean, pcf 127 130
Median, pcf 129 131
Standard Deviation, pcf 7 6
Maximum, pcf 137 137
Minimum, pcf 95 91
80 100 120 140 160
Total Unit Weight Estimated from CPT, t, pcf
0
25
50
75
100
Per
cen
t L
ess
Th
an In
dic
ated
Val
ue
80 100 120 140 160
Total Unit Weight Estimated from CPT, t, pcf
0
200
400
600
800
Nu
mb
er o
f T
est
Res
ult
sSoils in Upper 50 ft
Grade Separation Note:Values capped at 137 pcf.Tests exceeding this valueare indicated in red.
HSR
13-
06 -
EXEC
UTI
ON
VER
SIO
N
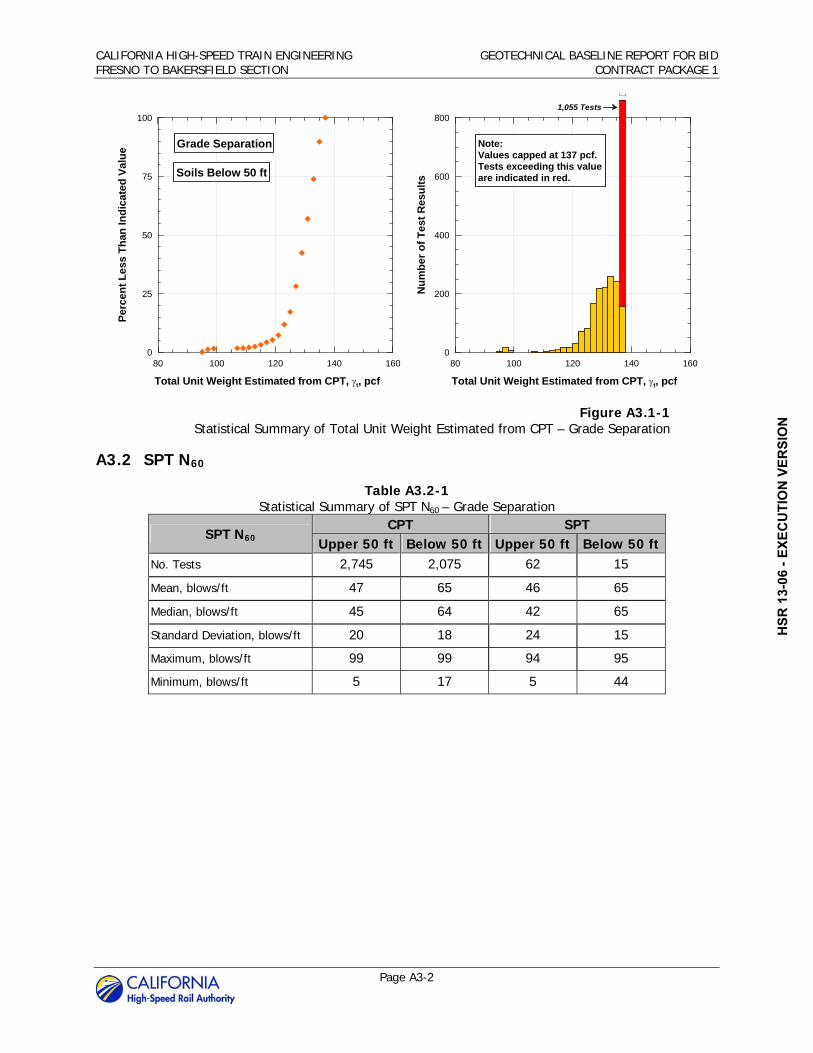
CALIFORNIA HIGH-SPEED TRAIN ENGINEERING GEOTECHNICAL BASELINE REPORT FOR BID FRESNO TO BAKERSFIELD SECTION CONTRACT PACKAGE 1
Page A3-2
Figure A3.1-1 Statistical Summary of Total Unit Weight Estimated from CPT – Grade Separation
A3.2 SPT N60
Table A3.2-1 Statistical Summary of SPT N60 – Grade Separation
SPT N60 CPT SPT
Upper 50 ft Below 50 ft Upper 50 ft Below 50 ftNo. Tests 2,745 2,075 62 15
Mean, blows/ft 47 65 46 65
Median, blows/ft 45 64 42 65
Standard Deviation, blows/ft 20 18 24 15
Maximum, blows/ft 99 99 94 95
Minimum, blows/ft 5 17 5 44
80 100 120 140 160
Total Unit Weight Estimated from CPT, t, pcf
0
25
50
75
100P
erce
nt
Le
ss T
han
Ind
icat
ed V
alu
e
80 100 120 140 160
Total Unit Weight Estimated from CPT, t, pcf
0
200
400
600
800
Nu
mb
er o
f T
est
Res
ult
sSoils Below 50 ft
Grade Separation Note:Values capped at 137 pcf.Tests exceeding this valueare indicated in red.
1,055 Tests
HSR
13-
06 -
EXEC
UTI
ON
VER
SIO
N

CALIFORNIA HIGH-SPEED TRAIN ENGINEERING GEOTECHNICAL BASELINE REPORT FOR BID FRESNO TO BAKERSFIELD SECTION CONTRACT PACKAGE 1
Page A3-3
Figure A3.2-1 Statistical Summary of N60 Estimated from CPT – Grade Separation
0 25 50 75 100
N60 Estimated from CPT, N60, blows/ft
0
25
50
75
100
Per
cen
t L
ess
Th
an
Ind
icat
ed V
alu
e
0 25 50 75 100
N60 Estimated from CPT, N60, blows/ft
0
100
200
300
400
Nu
mb
er o
f T
est
Res
ult
s
Grade Separation
Soils in Upper 50 ft
Note:Values capped at 99 blows/ft.Tests exceeding this valueare indicated in red.
0 25 50 75 100
N60 Estimated from CPT, N60, blows/ft
0
25
50
75
100
Per
cen
t L
ess
Th
an In
dic
ated
Val
ue
0 25 50 75 100
N60 Estimated from CPT, N60, blows/ft
0
100
200
300
400
Nu
mb
er o
f T
est
Res
ult
sGrade Separation
Soils Below 50 ft
Note:Values capped at 99 blows/ft.Tests exceeding this valueare indicated in red.
433 Tests
HSR
13-
06 -
EXEC
UTI
ON
VER
SIO
N

CALIFORNIA HIGH-SPEED TRAIN ENGINEERING GEOTECHNICAL BASELINE REPORT FOR BID FRESNO TO BAKERSFIELD SECTION CONTRACT PACKAGE 1
Page A3-4
Figure A3.2-2 Statistical Summary of SPT N60– Grade Separation
0 25 50 75 100
SPT N-Value, N60, blows/ft
0
25
50
75
100
Per
cen
t L
ess
Th
an In
dic
ated
Va
lue
0 25 50 75 100
SPT N-Value, N60, blows/ft
0
3
6
9
12
Nu
mb
er o
f T
est
Res
ult
sSoils in Upper 50 ft
Grade SeparationNote:Values capped at 99 blows/ft.Tests exceeding this valueare indicated in red.
20 40 60 80 100
SPT N-Value, N60, blows/ft
0
25
50
75
100
Per
cen
t L
ess
Th
an In
dic
ated
Val
ue
20 40 60 80 100
SPT N-Value, N60, blows/ft
0
2
4
6
8
Nu
mb
er o
f T
est
Res
ult
sGrade Separation
Soils Below 50 ft
17 Tests
Note:Values capped at 99 blows/ft.Tests exceeding this valueare indicated in red.
HSR
13-
06 -
EXEC
UTI
ON
VER
SIO
N

CALIFORNIA HIGH-SPEED TRAIN ENGINEERING GEOTECHNICAL BASELINE REPORT FOR BID FRESNO TO BAKERSFIELD SECTION CONTRACT PACKAGE 1
Page A3-5
A3.3 Effective Friction Angle
Table A3.3-1 Statistical Summary of Effective Friction Angle – Grade Separation
Effective Friction Angle
CPT SPT Laboratory Upper 50 ft
Below 50 ft
Upper 50 ft
Below 50 ft
Upper 50 ft
Below 50 ft
No. Tests 2,683 1,935 176 15 11 1
Mean, deg 43 41 40 46 39 42
Median, deg 43 41 41 46 41 -
Standard Deviation, deg 2 2 6 4 3 -
Maximum, deg 51 49 50 50 43 -
Minimum, deg 34 34 20 40 32 -
Figure A3.3-1 Statistical Summary of Effective Friction Angle Estimated from CPT– Grade Separation
30 35 40 45 50
Effective Friction Angle Estimated from CPT, ', deg
0
25
50
75
100
Per
cen
t L
ess
Th
an In
dic
ated
Va
lue
30 35 40 45 50
Effective Friction Angle Estimated from CPT, ', deg
0
200
400
600
800
Nu
mb
er o
f T
est
Res
ult
s
Grade Separation
Soils in Upper 50 ft
30 35 40 45 50
Effective Friction Angle Estimated from CPT, ', deg
0
25
50
75
100
Per
cen
t L
ess
Th
an
In
dic
ate
d V
alu
e
30 35 40 45 50
Effective Friction Angle Estimated from CPT, ', deg
0
100
200
300
400
Nu
mb
er o
f T
est
Res
ult
s
Grade Separation
Soils Below 50 ft
432 Tests HSR
13-
06 -
EXEC
UTI
ON
VER
SIO
N
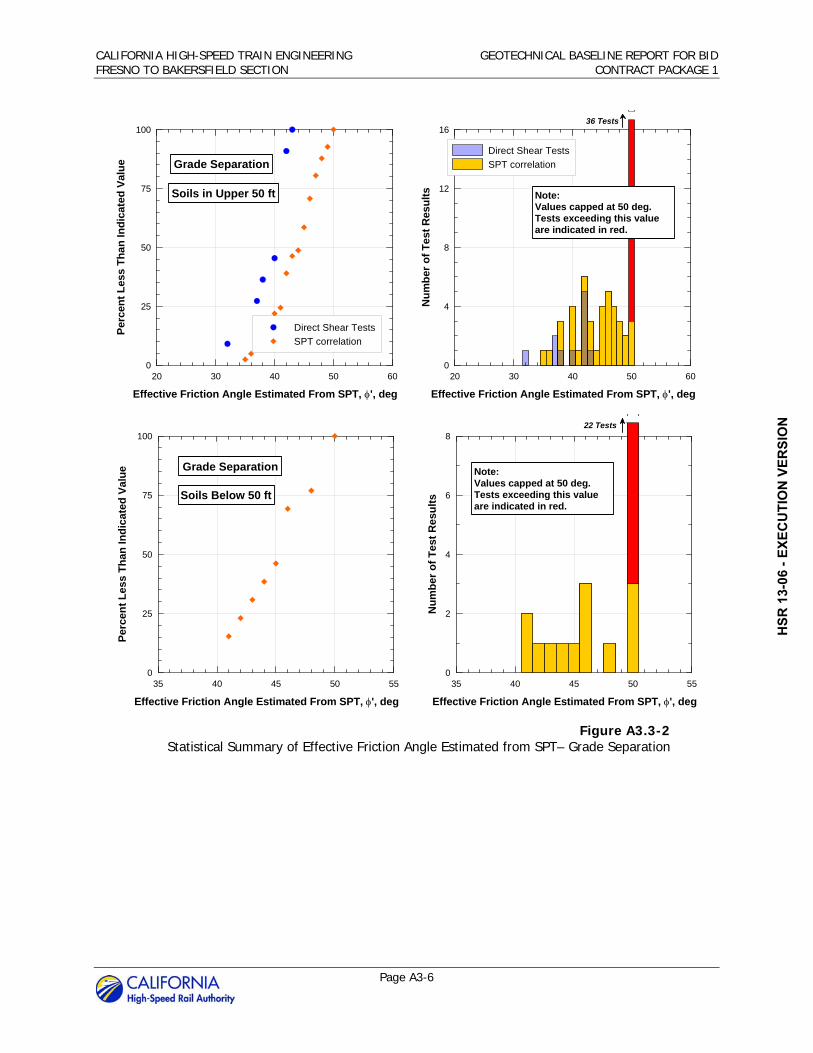
CALIFORNIA HIGH-SPEED TRAIN ENGINEERING GEOTECHNICAL BASELINE REPORT FOR BID FRESNO TO BAKERSFIELD SECTION CONTRACT PACKAGE 1
Page A3-6
Figure A3.3-2 Statistical Summary of Effective Friction Angle Estimated from SPT– Grade Separation
20 30 40 50 60
Effective Friction Angle Estimated From SPT, ', deg
0
25
50
75
100P
erce
nt
Le
ss T
ha
n In
dic
ated
Val
ue
Direct Shear Tests
SPT correlation
20 30 40 50 60
Effective Friction Angle Estimated From SPT, ', deg
0
4
8
12
16
Nu
mb
er o
f T
est
Res
ult
s
Direct Shear Tests
SPT correlation
Soils in Upper 50 ft
Grade Separation
Note:Values capped at 50 deg.Tests exceeding this valueare indicated in red.
36 Tests
35 40 45 50 55
Effective Friction Angle Estimated From SPT, ', deg
0
25
50
75
100
Per
cen
t L
ess
Th
an In
dic
ated
Val
ue
35 40 45 50 55
Effective Friction Angle Estimated From SPT, ', deg
0
2
4
6
8N
um
ber
of
Tes
t R
esu
lts
Grade Separation
Soils Below 50 ft
22 Tests
Note:Values capped at 50 deg.Tests exceeding this valueare indicated in red.
HSR
13-
06 -
EXEC
UTI
ON
VER
SIO
N
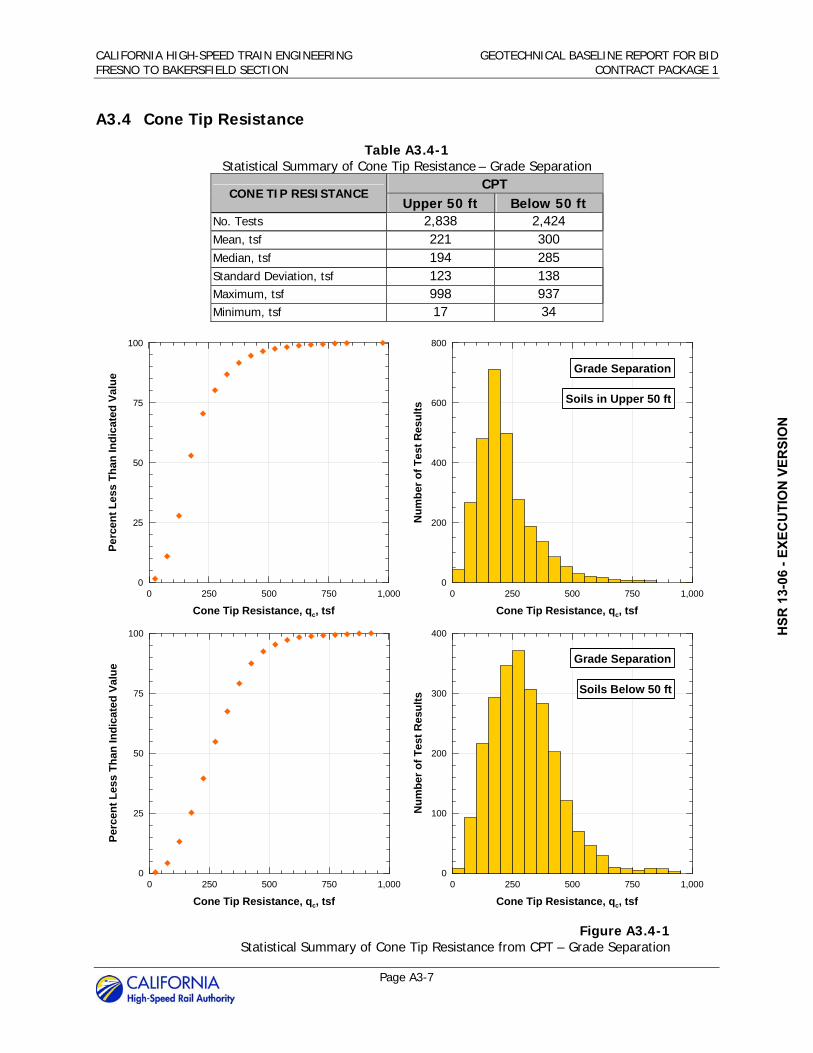
CALIFORNIA HIGH-SPEED TRAIN ENGINEERING GEOTECHNICAL BASELINE REPORT FOR BID FRESNO TO BAKERSFIELD SECTION CONTRACT PACKAGE 1
Page A3-7
A3.4 Cone Tip Resistance
Table A3.4-1 Statistical Summary of Cone Tip Resistance – Grade Separation
CONE TIP RESISTANCE CPT
Upper 50 ft Below 50 ft No. Tests 2,838 2,424Mean, tsf 221 300Median, tsf 194 285Standard Deviation, tsf 123 138Maximum, tsf 998 937Minimum, tsf 17 34
Figure A3.4-1 Statistical Summary of Cone Tip Resistance from CPT – Grade Separation
0 250 500 750 1,000
Cone Tip Resistance, qc, tsf
0
25
50
75
100
Pe
rcen
t L
ess
Th
an
Ind
icat
ed V
alu
e
0 250 500 750 1,000
Cone Tip Resistance, qc, tsf
0
200
400
600
800
Nu
mb
er o
f T
est
Re
sult
s
Grade Separation
Soils in Upper 50 ft
0 250 500 750 1,000
Cone Tip Resistance, qc, tsf
0
25
50
75
100
Per
cen
t L
ess
Th
an In
dic
ated
Val
ue
0 250 500 750 1,000
Cone Tip Resistance, qc, tsf
0
100
200
300
400
Nu
mb
er o
f T
est
Res
ult
s
Grade Separation
Soils Below 50 ft
HSR
13-
06 -
EXEC
UTI
ON
VER
SIO
N

CALIFORNIA HIGH-SPEED TRAIN ENGINEERING GEOTECHNICAL BASELINE REPORT FOR BID FRESNO TO BAKERSFIELD SECTION CONTRACT PACKAGE 1
Page A3-8
A3.5 Soil Modulus
Table A3.5-1 Statistical Summary of Soil Modulus Estimated from SPT– Grade Separation
Soil Modulus SPT
Upper 50 ft Below 50 ft No. Tests 57 32
Mean, tsf 339 386 Median, tsf 305 417 Standard Deviation, tsf 155 97 Maximum, tsf 681 505 Minimum, tsf 96 186
Figure A3.5-1 Statistical Summary of Soil Modulus Estimated from SPT – Grade Separation
0 200 400 600 800
Soil Modulus Estimated From SPT, Es, tsf
0
25
50
75
100
0 200 400 600 800
Soil Modulus Estimated From SPT, Es, tsf
0
5
10
15
20
Soils in Upper 50 ft
Grade Separation
Note:Values capped below 700 tsf.Tests exceeding this valueare indicated in red.
0 200 400 600 800
Soil Modulus Estimated From SPT, Es, tsf
0
25
50
75
100
Per
cen
t L
ess
Th
an
Ind
icat
ed V
alu
e
0 200 400 600 800
Soil Modulus Estimated From SPT, Es, tsf
0
3
6
9
12
Nu
mb
er o
f T
est
Res
ult
s
Grade Separation
Soils Below 50 ft
HSR
13-
06 -
EXEC
UTI
ON
VER
SIO
N
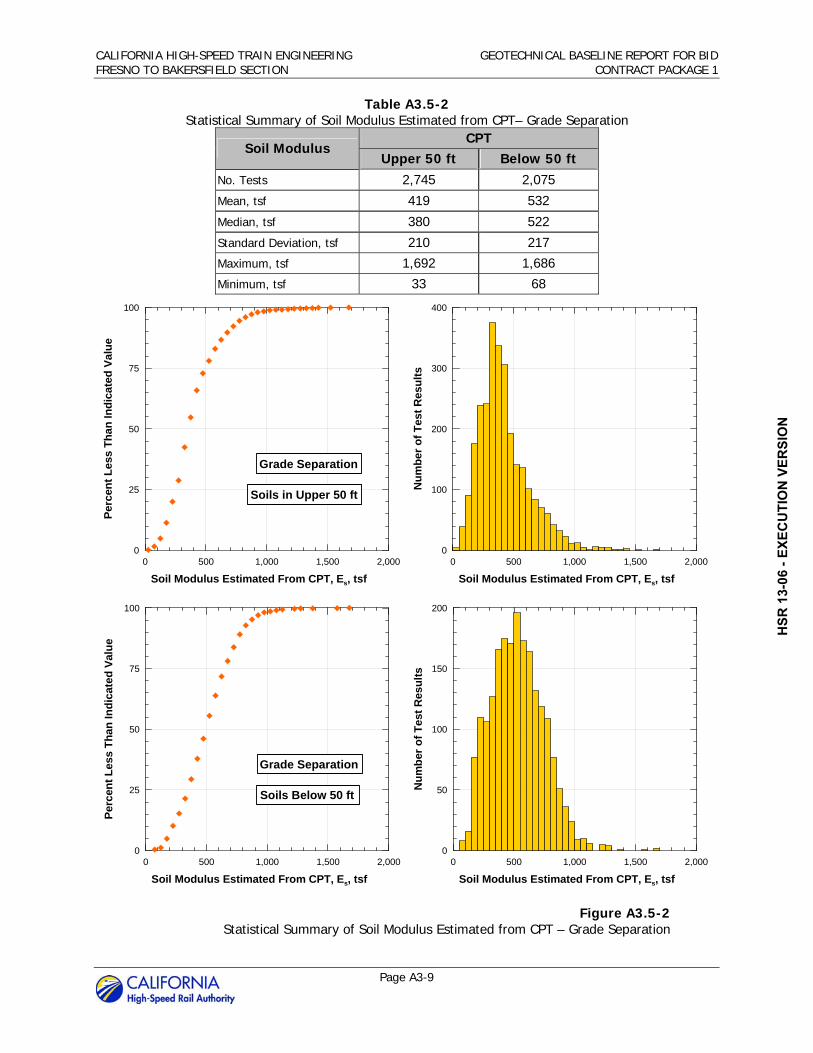
CALIFORNIA HIGH-SPEED TRAIN ENGINEERING GEOTECHNICAL BASELINE REPORT FOR BID FRESNO TO BAKERSFIELD SECTION CONTRACT PACKAGE 1
Page A3-9
Table A3.5-2 Statistical Summary of Soil Modulus Estimated from CPT– Grade Separation
Soil Modulus CPT
Upper 50 ft Below 50 ft No. Tests 2,745 2,075
Mean, tsf 419 532
Median, tsf 380 522
Standard Deviation, tsf 210 217 Maximum, tsf 1,692 1,686 Minimum, tsf 33 68
Figure A3.5-2 Statistical Summary of Soil Modulus Estimated from CPT – Grade Separation
0 500 1,000 1,500 2,000
Soil Modulus Estimated From CPT, Es, tsf
0
25
50
75
100
Per
cen
t L
ess
Th
an
Ind
ica
ted
Va
lue
0 500 1,000 1,500 2,000
Soil Modulus Estimated From CPT, Es, tsf
0
100
200
300
400
Nu
mb
er o
f T
est
Res
ult
s
Soils in Upper 50 ft
Grade Separation
0 500 1,000 1,500 2,000
Soil Modulus Estimated From CPT, Es, tsf
0
25
50
75
100
Per
cen
t L
ess
Th
an In
dic
ated
Va
lue
0 500 1,000 1,500 2,000
Soil Modulus Estimated From CPT, Es, tsf
0
50
100
150
200
Nu
mb
er o
f T
est
Res
ult
s
Soils Below 50 ft
Grade Separation
HSR
13-
06 -
EXEC
UTI
ON
VER
SIO
N

HSR
13-
06 -
EXEC
UTI
ON
VER
SIO
N

CALIFORNIA HIGH-SPEED TRAIN ENGINEERING GEOTECHNICAL BASELINE REPORT FOR BID FRESNO TO BAKERSFIELD SECTION CONTRACT PACKAGE 1
Page A4-1
A4.0 Jensen Trench
The following sections present the results of statistical analyses performed on data obtained from boreholes and CPTs at the location of the proposed Jensen Street Trench.
For the purposes of interpreting soil parameters at this location, the soil profile was analyzed in two layers: (1) upper 20 feet of soils (excluding Existing Fill) and (2) soils below 20 feet.
For each soil parameter, a supporting table has been provided to summarize the mean, median, standard deviation, and range of values obtained by soil layer and test type (e.g. CPT, SPT, or laboratory test).
In some cases, soil parameters have been capped at a maximum value. Test results exceeding the maximum value are indicated in red on the histograms.
A4.1 Total Unit Weight
Table A4.1-1 Statistical Summary of Total Unit Weight – Jensen Trench
Total Unit Weight CPT
Upper 20 ft Below 20 ft
No. Tests 288 646
Mean, pcf 122 130
Median, pcf 122 133
Standard Deviation, pcf 11 9
Maximum, pcf 137 137
Minimum, pcf 95 91
HSR
13-
06 -
EXEC
UTI
ON
VER
SIO
N

CALIFORNIA HIGH-SPEED TRAIN ENGINEERING GEOTECHNICAL BASELINE REPORT FOR BID FRESNO TO BAKERSFIELD SECTION CONTRACT PACKAGE 1
Page A4-2
Figure A4.1-1 Statistical Summary of Total Unit Weight Estimated from CPT – Jensen Trench
80 100 120 140 160
Total Unit Weight Estimated from CPT, t, pcf
0
25
50
75
100
Per
cen
t L
ess
Th
an In
dic
ate
d V
alu
e
80 100 120 140 160
Total Unit Weight Estimated from CPT, t, pcf
0
25
50
75
100
Nu
mb
er o
f T
est
Res
ult
sSoils in Upper 20 ft
Jensen Trench Note:Values capped at 137 pcf.Tests exceeding this valueare indicated in red.
80 100 120 140 160
Total Unit Weight Estimated from CPT, t, pcf
0
25
50
75
100
Per
cen
t L
ess
Th
an In
dic
ated
Va
lue
80 100 120 140 160
Total Unit Weight Estimated from CPT, t, pcf
0
100
200
300
400
Nu
mb
er o
f T
est
Res
ult
sSoils Below 20 ft
Jensen Trench Note:Values capped at 137 pcf.Tests exceeding this valueare indicated in red.
HSR
13-
06 -
EXEC
UTI
ON
VER
SIO
N

CALIFORNIA HIGH-SPEED TRAIN ENGINEERING GEOTECHNICAL BASELINE REPORT FOR BID FRESNO TO BAKERSFIELD SECTION CONTRACT PACKAGE 1
Page A4-3
A4.2 SPT N60
Table A4.2-1 Statistical Summary of SPT N60 – Jensen Trench
SPT N60 CPT SPT
Upper 20 ft Below 20 ft Upper 20 ft Below 20 ft No. Tests 359 813 24 27 Mean, blows/ft 38 52 27 59 Median, blows/ft 36 51 24 58 Standard Deviation, blows/ft 20 17 13 24 Maximum, blows/ft 99 99 50 99 Minimum, blows/ft 4 13 7 16
Figure A4.2-1 Statistical Summary of SPT N60 Estimated from CPT – Jensen Trench
0 25 50 75 100
N60 Estimated from CPT, N60, blows/ft
0
25
50
75
100
Per
cen
t L
ess
Th
an In
dic
ated
Va
lue
0 25 50 75 100
N60 Estimated from CPT, N60, blows/ft
0
25
50
75
100
Nu
mb
er o
f T
est
Res
ult
s
Soils in Upper 20 ft
Jensen Trench
Note:Values capped at 99 blows/ft.Tests exceeding this valueare indicated in red.
0 25 50 75 100
N60 Estimated from CPT, N60, blows/ft
0
25
50
75
100
Per
cen
t L
ess
Th
an In
dic
ated
Val
ue
0 25 50 75 100
N60 Estimated from CPT, N60, blows/ft
0
50
100
150
200
Nu
mb
er o
f T
est
Res
ult
sSoils Below 20 ft
Jensen Trench Note:Values capped at 99 blows/ft.Tests exceeding this valueare indicated in red.
HSR
13-
06 -
EXEC
UTI
ON
VER
SIO
N
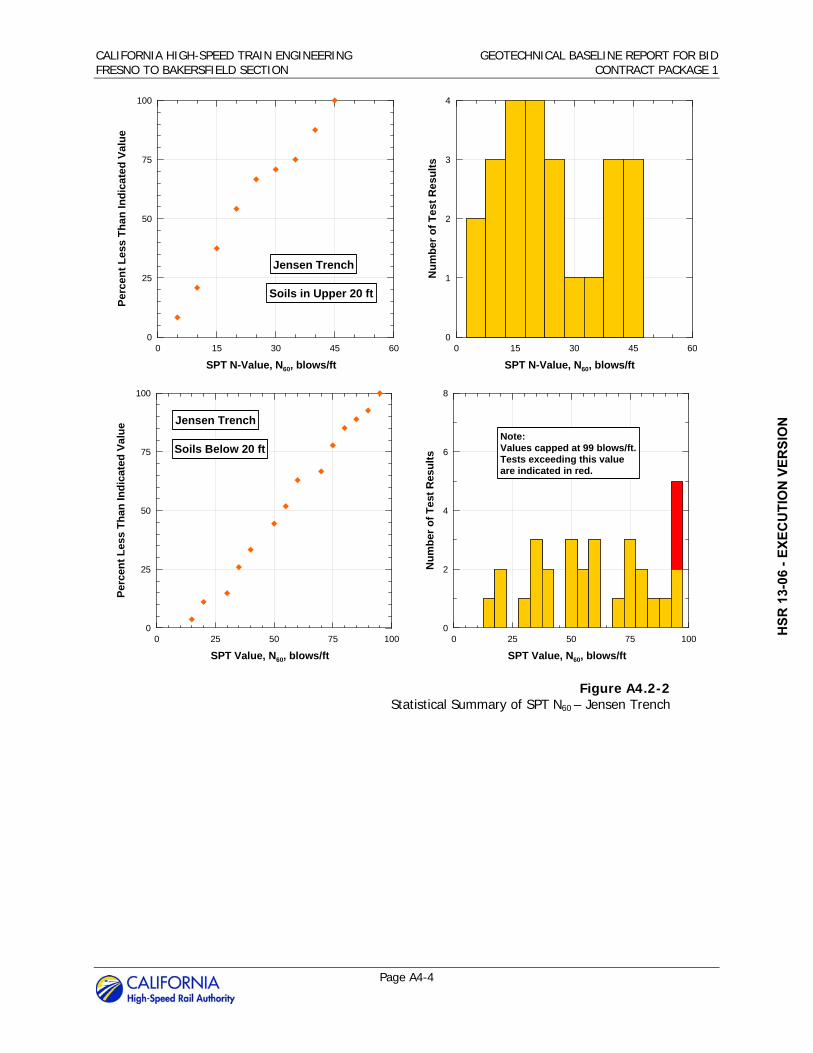
CALIFORNIA HIGH-SPEED TRAIN ENGINEERING GEOTECHNICAL BASELINE REPORT FOR BID FRESNO TO BAKERSFIELD SECTION CONTRACT PACKAGE 1
Page A4-4
Figure A4.2-2 Statistical Summary of SPT N60 – Jensen Trench
0 15 30 45 60
SPT N-Value, N60, blows/ft
0
25
50
75
100
Per
cen
t L
ess
Th
an
Ind
ica
ted
Va
lue
0 15 30 45 60
SPT N-Value, N60, blows/ft
0
1
2
3
4
Nu
mb
er o
f T
es
t R
esu
lts
Jensen Trench
Soils in Upper 20 ft
0 25 50 75 100
SPT Value, N60, blows/ft
0
25
50
75
100
Per
cen
t L
ess
Th
an In
dic
ated
Va
lue
0 25 50 75 100
SPT Value, N60, blows/ft
0
2
4
6
8
Nu
mb
er o
f T
est
Res
ult
sJensen Trench
Soils Below 20 ftNote:Values capped at 99 blows/ft.Tests exceeding this valueare indicated in red.
HSR
13-
06 -
EXEC
UTI
ON
VER
SIO
N

CALIFORNIA HIGH-SPEED TRAIN ENGINEERING GEOTECHNICAL BASELINE REPORT FOR BID FRESNO TO BAKERSFIELD SECTION CONTRACT PACKAGE 1
Page A4-5
A4.3 Effective Friction Angle
Table A4.3-1 Statistical Summary of Effective Friction Angle – Jensen Trench
Effective Friction Angle
CPT SPT Laboratory
Upper 20 ft Below 20 ft Upper 20 ft Below 20 ft Upper 20 ft Below 20 ft
No. Tests 362 807 9 5 4 1
Mean, deg 44 42 45 44 37 41
Median, deg 44 42 46 44 37 -
Standard Deviation, deg 3 2 4 5 5 - Maximum, deg 50 48 48 50 43 -
Minimum, deg 33 35 40 39 31 -
Figure A4.3-1 Statistical Summary of Effective Friction Angle Estimated from CPT – Jensen Trench
30 35 40 45 50
Effective Friction Angle Estimated from CPT, ', deg
0
25
50
75
100
Pe
rcen
t L
ess
Th
an
Ind
ica
ted
Va
lue
30 35 40 45 50
Effective Friction Angle Estimated from CPT, ', deg
0
25
50
75
100
Nu
mb
er o
f T
es
t R
esu
ltsSoils in Upper 20 ft
Jensen Trench
30 35 40 45 50
Effective Friction Angle Estimated from CPT, ', deg
0
25
50
75
100
Per
cen
t L
ess
Th
an In
dic
ate
d V
alu
e
30 35 40 45 50
Effective Friction Angle Estimated from CPT, ', deg
0
50
100
150
200
Nu
mb
er o
f T
est
Res
ult
s
Jensen Trench
Soils Below 20 ft
HSR
13-
06 -
EXEC
UTI
ON
VER
SIO
N

CALIFORNIA HIGH-SPEED TRAIN ENGINEERING GEOTECHNICAL BASELINE REPORT FOR BID FRESNO TO BAKERSFIELD SECTION CONTRACT PACKAGE 1
Page A4-6
Figure A4.3-2 Statistical Summary of Effective Friction Angle Estimated from SPT – Jensen Trench
30 35 40 45 50
Effective Friction Angle Estimated From SPT, ', deg
0
25
50
75
100P
erce
nt
Les
s T
han
Ind
icat
ed V
alu
e
Direct Shear Tests
SPT Correlation
30 35 40 45 50
Effective Friction Angle Estimated From SPT, ', deg
0
1
2
3
4
Nu
mb
er o
f T
est
Res
ult
s
Direct Shear Tests
SPT Correlation
Jensen Trench
Soils in Upper 20 ft
Note:Values capped at 50 deg.Tests exceeding this valueare indicated in red.
15 Tests
35 40 45 50 55
Effective Friction Angle Estimated From SPT, ', deg
0
25
50
75
100
Per
cen
t L
ess
Th
an In
dic
ate
d V
alu
e
35 40 45 50 55
Effective Friction Angle Estimated From SPT, ', deg
0
1
2
3
4N
um
ber
of
Tes
t R
esu
lts
Jensen Trench
Soils Below 20 ft
26 Tests
Note:Values capped at 50 deg.Tests exceeding this valueare indicated in red.
HSR
13-
06 -
EXEC
UTI
ON
VER
SIO
N

CALIFORNIA HIGH-SPEED TRAIN ENGINEERING GEOTECHNICAL BASELINE REPORT FOR BID FRESNO TO BAKERSFIELD SECTION CONTRACT PACKAGE 1
Page A4-7
A4.4 Cone Tip Resistance
Table A4.4-1 Statistical Summary of Cone Tip Resistance – Jensen Trench
Cone Tip Resistance CPT
Upper 20 ft Below 20 ft No. Tests 364 846Mean, tsf 178 209Median, tsf 171 202Standard Deviation, tsf 93 97Maximum, tsf 538 657Minimum, tsf 14 45
Figure A4.4-1 Statistical Summary of Cone Tip Resistance from CPT – Jensen Trench
0 250 500 750 1,000
Cone Tip Resistance, qc, tsf
0
25
50
75
100
Per
cen
t L
ess
Th
an In
dic
ate
d V
alu
e
0 250 500 750 1,000
Cone Tip Resistance, qc, tsf
0
50
100
150
200
Nu
mb
er o
f T
est
Re
sult
s Soils in Upper 20 ft
Jensen Trench
0 250 500 750 1,000
Cone Tip Resistance, qc, tsf
0
25
50
75
100
Per
cen
t L
ess
Th
an In
dic
ated
Val
ue
0 250 500 750 1,000
Cone Tip Resistance, qc, tsf
0
50
100
150
200
Nu
mb
er o
f T
est
Res
ult
s Soils Below 20 ft
Jensen Trench
HSR
13-
06 -
EXEC
UTI
ON
VER
SIO
N

CALIFORNIA HIGH-SPEED TRAIN ENGINEERING GEOTECHNICAL BASELINE REPORT FOR BID FRESNO TO BAKERSFIELD SECTION CONTRACT PACKAGE 1
Page A4-8
A4.5 Soil Modulus
Table A4.5-1 Statistical Summary of Soil Modulus Estimated from SPT– Jensen Trench
Soil Modulus SPT
Upper 20 ft Below 20 ft No. Tests 18 24 Mean, tsf 382 493 Median, tsf 409 511 Standard Deviation, tsf 120 145 Maximum, tsf 611 677 Minimum, tsf 177 161
Figure A4.5-1 Statistical Summary of Soil Modulus Estimated from SPT – Jensen Trench
0 200 400 600 800
Soil Modulus Estimated From SPT, Es, tsf
0
25
50
75
100
0 200 400 600 800
Soil Modulus Estimated From SPT, Es, tsf
0
2
4
6
8
Jensen Trench
Soils in Upper 20 ft
Note:Values capped below 700 tsf.Tests exceeding this valueare indicated in red.
0 200 400 600 800
Soil Modulus Estimated From SPT, Es, tsf
0
25
50
75
100
0 200 400 600 800
Soil Modulus Estimated From SPT, Es, tsf
0
3
6
9
12
Jensen Trench
Soils Below 20 ft
Note:Values capped below 700 tsf.Tests exceeding this valueare indicated in red.
HSR
13-
06 -
EXEC
UTI
ON
VER
SIO
N

CALIFORNIA HIGH-SPEED TRAIN ENGINEERING GEOTECHNICAL BASELINE REPORT FOR BID FRESNO TO BAKERSFIELD SECTION CONTRACT PACKAGE 1
Page A4-9
Table A4.5-2 Statistical Summary of Soil Modulus Estimated from CPT– Jensen Trench
Soil Modulus CPT
Upper 20 ft Below 20 ft No. Tests 364 846 Mean, tsf 356 417 Median, tsf 343 404 Standard Deviation, tsf 186 193 Maximum, tsf 1,076 1,315 Minimum, tsf 29 90
Figure A4.5-2 Statistical Summary of Soil Modulus Estimated from CPT – Jensen Trench
0 300 600 900 1,200
Soil Modulus Estimated From CPT, Es, tsf
0
25
50
75
100
Per
cen
t L
ess
Th
an I
nd
icat
ed V
alu
e
0 300 600 900 1,200
Soil Modulus Estimated From CPT, Es, tsf
0
20
40
60
80
Nu
mb
er o
f T
est
Res
ult
s
Soils in Upper 20 ft
Jensen Trench
0 400 800 1,200 1,600
Soil Modulus Estimated From CPT, Es, tsf
0
25
50
75
100
Per
cen
t L
ess
Th
an In
dic
ated
Val
ue
0 400 800 1,200 1,600
Soil Modulus Estimated From CPT, Es, tsf
0
40
80
120
160
Nu
mb
er o
f T
est
Res
ult
s
Soils Below 20 ft
Jensen TrenchH
SR 1
3-06
- EX
ECU
TIO
N V
ERSI
ON

HSR
13-
06 -
EXEC
UTI
ON
VER
SIO
N

CALIFORNIA HIGH-SPEED TRAIN ENGINEERING GEOTECHNICAL BASELINE REPORT FOR BID FRESNO TO BAKERSFIELD SECTION CONTRACT PACKAGE 1
Page A5-1
A5.0 Fresno Viaduct
The following sections present the results of statistical analyses performed on data obtained from boreholes and CPTs at the location of the proposed SR 99 (Fresno) viaduct.
For the purposes of interpreting soil parameters at this location, the soil profile was analyzed in two layers: (1) upper 60 feet of soils (excluding Existing Fill) and (2) soils below 60 feet.
For each soil parameter, a supporting table has been provided to summarize the mean, median, standard deviation, and range of values obtained by soil layer and test type (e.g. CPT, SPT, or laboratory test).
In some cases, soil parameters have been capped at a maximum value. Test results exceeding the maximum value are indicated in red on the histograms.
A5.1 Total Unit Weight
Table A5.1-1 Statistical Summary of Total Unit Weight – Fresno Viaduct
Total Unit Weight CPT
Upper 60 ft Below 60 ft
No. Tests 1,950 295
Mean, pcf 122 128
Median, pcf 126 132
Standard Deviation, pcf 12 9
Maximum, pcf 137 137
Minimum, pcf 90 94
HSR
13-
06 -
EXEC
UTI
ON
VER
SIO
N

CALIFORNIA HIGH-SPEED TRAIN ENGINEERING GEOTECHNICAL BASELINE REPORT FOR BID FRESNO TO BAKERSFIELD SECTION CONTRACT PACKAGE 1
Page A5-2
Figure A5.1-1 Statistical Summary of Total Unit Weight Estimated from CPT – Fresno Viaduct
80 100 120 140 160
Total Unit Weight Estimated from CPT, t, pcf
0
25
50
75
100
Per
cen
t L
ess
Th
an In
dic
ate
d V
alu
e
80 100 120 140 160
Total Unit Weight Estimated from CPT, t, pcf
0
100
200
300
400
Nu
mb
er o
f T
est
Res
ult
sSoils in Upper 60 ft
Fresno Viaduct Note:Values capped at 137 pcf.Tests exceeding this valueare indicated in red.
80 100 120 140 160
Total Unit Weight Estimated from CPT, t, pcf
0
25
50
75
100
Per
cen
t L
ess
Th
an
Ind
icat
ed V
alu
e
80 100 120 140 160
Total Unit Weight Estimated from CPT, t, pcf
0
25
50
75
100N
um
ber
of
Tes
t R
esu
ltsSoils Below 60 ft
Fresno Viaduct
383 Tests
Note:Values capped at 137 pcf.Tests exceeding this valueare indicated in red.
HSR
13-
06 -
EXEC
UTI
ON
VER
SIO
N

CALIFORNIA HIGH-SPEED TRAIN ENGINEERING GEOTECHNICAL BASELINE REPORT FOR BID FRESNO TO BAKERSFIELD SECTION CONTRACT PACKAGE 1
Page A5-3
A5.2 SPT N60
Table A5.2-1 Statistical Summary of SPT N60 – Fresno Viaduct
SPT N60 CPT SPT
Upper 60 ft Below 60 ft Upper 60 ft Below 60 ft No. Tests 2,112 1,009 33 47 Mean, blows/ft 43 60 40 55 Median, blows/ft 41 58 35 55 Standard Deviation, blows/ft 19 17 18 17 Maximum, blows/ft 98 99 95 87 Minimum, blows/ft 3 23 14 24
Figure A5.2-1 Statistical Summary of SPT N60 Estimated from CPT – Fresno Viaduct
0 25 50 75 100
N60 Estimated from CPT, N60, blows/ft
0
25
50
75
100
Perc
ent
Les
s T
han
Ind
icat
ed V
alu
e
0 25 50 75 100
N60 Estimated from CPT, N60, blows/ft
0
100
200
300
400
Nu
mb
er o
f T
est
Resu
lts
Soils in Upper 60 ft
Fresno Viaduct
Note:Values capped at 99 blows/ft.Tests exceeding this valueare indicated in red.
0 25 50 75 100
N60 Estimated from CPT, N60, blows/ft
0
25
50
75
100
Per
cen
t L
ess
Th
an In
dic
ate
d V
alu
e
0 25 50 75 100
N60 Estimated from CPT, N60, blows/ft
0
50
100
150
200
Nu
mb
er o
f T
est
Res
ult
sSoils Below 60 ft
Fresno Viaduct
242 Tests
Note:Values capped at 99 blows/ft.Tests exceeding this valueare indicated in red.
HSR
13-
06 -
EXEC
UTI
ON
VER
SIO
N

CALIFORNIA HIGH-SPEED TRAIN ENGINEERING GEOTECHNICAL BASELINE REPORT FOR BID FRESNO TO BAKERSFIELD SECTION CONTRACT PACKAGE 1
Page A5-4
Figure A5.2-2 Statistical Summary of SPT N60 – Fresno Viaduct
0 25 50 75 100
SPT N-Value, N60, blows/ft
0
25
50
75
100
Per
cen
t L
ess
Th
an In
dic
ated
Val
ue
0 25 50 75 100
SPT N-Value, N60, blows/ft
0
2
4
6
8
Nu
mb
er o
f T
est
Res
ult
s
Soils in Upper 60 ft
Fresno Viaduct
Note:Values capped at 99 blows/ft.Tests exceeding this valueare indicated in red.
0 25 50 75 100
SPT Value, N60, blows/ft
0
25
50
75
100
Per
cen
t L
ess
Th
an
Ind
ica
ted
Va
lue
0 25 50 75 100
SPT Value, N60, blows/ft
0
3
6
9
12
Nu
mb
er o
f T
est
Res
ult
sSoils Below 60 ft
Fresno Viaduct Note:Values capped at 99 blows/ft.Tests exceeding this valueare indicated in red.
HSR
13-
06 -
EXEC
UTI
ON
VER
SIO
N

CALIFORNIA HIGH-SPEED TRAIN ENGINEERING GEOTECHNICAL BASELINE REPORT FOR BID FRESNO TO BAKERSFIELD SECTION CONTRACT PACKAGE 1
Page A5-5
A5.3 Effective Friction Angle
Table A5.3-1 Statistical Summary of Effective Friction Angle – Fresno Viaduct
Effective Friction Angle
CPT SPT Laboratory Upper 60 ft Below 60 ft Upper 60 ft Below 60 ft Upper 60 ft Below 60 ft
No. Tests 2,110 884 19 38 10 13 Mean, deg 43 40 45 44 38 35 Median, deg 43 41 45 45 37 37 Standard Deviation, deg 3 3 3 3 4 4 Maximum, deg 50 49 49 50 43 41 Minimum, deg 32 32 40 38 31 26
Figure A5.3-1 Statistical Summary of Effective Friction Angle Estimated from CPT – Fresno Viaduct
30 35 40 45 50
Effective Friction Angle Estimated from CPT, ', deg
0
25
50
75
100
Per
cen
t L
ess
Th
an
Ind
icat
ed V
alu
e
30 35 40 45 50
Effective Friction Angle Estimated from CPT, ', deg
0
100
200
300
400
Nu
mb
er o
f T
est
Res
ult
s Soils in Upper 60 ft
Fresno Viaduct
460 Tests
30 35 40 45 50
Effective Friction Angle Estimated from CPT, ', deg
0
25
50
75
100
Per
cen
t L
ess
Th
an In
dic
ated
Va
lue
30 35 40 45 50
Effective Friction Angle Estimated from CPT, ', deg
0
50
100
150
200
Nu
mb
er o
f T
est
Res
ult
s Soils Below 60 ft
Fresno Viaduct
HSR
13-
06 -
EXEC
UTI
ON
VER
SIO
N

CALIFORNIA HIGH-SPEED TRAIN ENGINEERING GEOTECHNICAL BASELINE REPORT FOR BID FRESNO TO BAKERSFIELD SECTION CONTRACT PACKAGE 1
Page A5-6
Figure A5.3-2 Statistical Summary of Effective Friction Angle Estimated from SPT – Fresno Viaduct
30 35 40 45 50
Effective Friction Angle Estimated From SPT, ', deg
0
25
50
75
100P
erc
ent
Les
s T
ha
n In
dic
ated
Val
ue
Direct Shear Tests
SPT correlation
30 35 40 45 50
Effective Friction Angle Estimated From SPT, ', deg
0
1
2
3
4
Nu
mb
er o
f T
est
Res
ult
s
Direct Shear Tests
SPT correlationSoils in Upper 60 ft
Fresno Viaduct
18 Tests
Note:Values capped at 50 deg.Tests exceeding this valueare indicated in red.
20 30 40 50 60
Effective Friction Angle Estimated From SPT, ', deg
0
25
50
75
100
Per
cen
t L
ess
Th
an In
dic
ated
Val
ue
Direct Shear Tests
SPT correlation
20 30 40 50 60
Effective Friction Angle Estimated From SPT, ', deg
0
2
4
6
8N
um
ber
of
Tes
t R
esu
lts
Direct Shear Tests
SPT correlationSoils Below 60 ft
Fresno Viaduct
18 Tests
Note:Values capped at 50 deg.Tests exceeding this valueare indicated in red.
HSR
13-
06 -
EXEC
UTI
ON
VER
SIO
N

CALIFORNIA HIGH-SPEED TRAIN ENGINEERING GEOTECHNICAL BASELINE REPORT FOR BID FRESNO TO BAKERSFIELD SECTION CONTRACT PACKAGE 1
Page A5-7
A5.4 Cone Tip Resistance
Table A5.4-1 Statistical Summary of Cone Tip Resistance – Fresno Viaduct
CONE TIP RESISTANCE CPT
Upper 60 ft Below 60 ft No. Tests 2,329 647Mean, tsf 234 268Median, tsf 209 239Standard Deviation, tsf 136 151Maximum, tsf 1,630 978Minimum, tsf 11 50
Figure A5.4-1 Statistical Summary of Cone Tip Resistance from CPT – Fresno Viaduct
0 450 900 1,350 1,800
Cone Tip Resistance, qc, tsf
0
25
50
75
100
Per
cen
t L
ess
Th
an In
dic
ated
Val
ue
0 450 900 1,350 1,800
Cone Tip Resistance, qc, tsf
0
150
300
450
600
Nu
mb
er o
f T
est
Res
ult
s Soils in Upper 60 ft
Fresno Viaduct
0 250 500 750 1,000
Cone Tip Resistance, qc, tsf
0
25
50
75
100
Per
cen
t L
ess
Th
an
Ind
icat
ed V
alu
e
0 250 500 750 1,000
Cone Tip Resistance, qc, tsf
0
50
100
150
200
Nu
mb
er o
f T
est
Res
ult
s Soils Below 60 ft
Fresno Viaduct
HSR
13-
06 -
EXEC
UTI
ON
VER
SIO
N
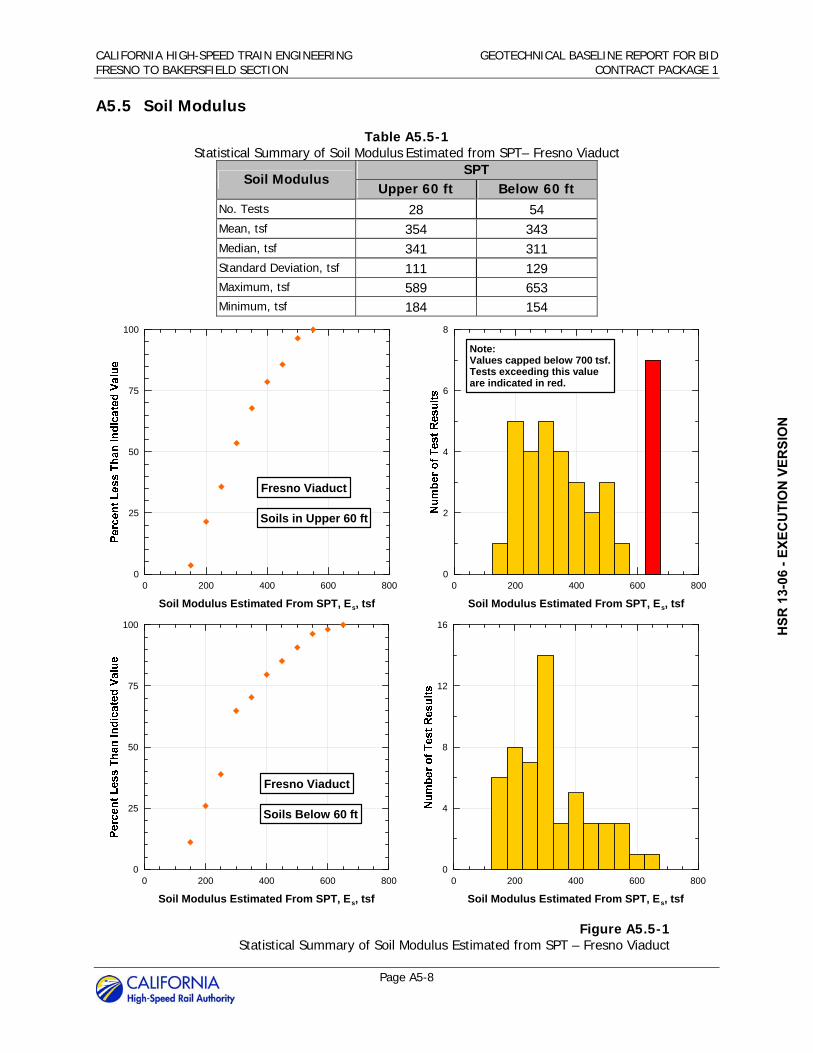
CALIFORNIA HIGH-SPEED TRAIN ENGINEERING GEOTECHNICAL BASELINE REPORT FOR BID FRESNO TO BAKERSFIELD SECTION CONTRACT PACKAGE 1
Page A5-8
A5.5 Soil Modulus
Table A5.5-1 Statistical Summary of Soil Modulus Estimated from SPT– Fresno Viaduct
Soil Modulus SPT
Upper 60 ft Below 60 ft No. Tests 28 54 Mean, tsf 354 343 Median, tsf 341 311 Standard Deviation, tsf 111 129 Maximum, tsf 589 653 Minimum, tsf 184 154
Figure A5.5-1 Statistical Summary of Soil Modulus Estimated from SPT – Fresno Viaduct
0 200 400 600 800
Soil Modulus Estimated From SPT, Es, tsf
0
25
50
75
100
0 200 400 600 800
Soil Modulus Estimated From SPT, Es, tsf
0
2
4
6
8
Soils in Upper 60 ft
Fresno Viaduct
Note:Values capped below 700 tsf.Tests exceeding this valueare indicated in red.
0 200 400 600 800
Soil Modulus Estimated From SPT, Es, tsf
0
25
50
75
100
0 200 400 600 800
Soil Modulus Estimated From SPT, Es, tsf
0
4
8
12
16
Soils Below 60 ft
Fresno ViaductH
SR 1
3-06
- EX
ECU
TIO
N V
ERSI
ON

CALIFORNIA HIGH-SPEED TRAIN ENGINEERING GEOTECHNICAL BASELINE REPORT FOR BID FRESNO TO BAKERSFIELD SECTION CONTRACT PACKAGE 1
Page A5-9
Table A5.5-2 Statistical Summary of Soil Modulus Estimated from CPT– Fresno Viaduct
Soil Modulus CPT
Upper 60 ft Below 60 ft No. Tests 2,177 1,221 Mean, tsf 464 547 Median, tsf 415 494 Standard Deviation, tsf 274 283 Maximum, tsf 3,260 2,288 Minimum, tsf 22 100
Figure A5.5-2 Statistical Summary of Soil Modulus Estimated from CPT – Fresno Viaduct
0 1,000 2,000 3,000 4,000
Soil Modulus Estimated From CPT, Es, tsf
0
25
50
75
100
Per
cen
t L
ess
Th
an In
dic
ated
Val
ue
0 1,000 2,000 3,000 4,000
Soil Modulus Estimated From CPT, Es, tsf
0
150
300
450
600
Nu
mb
er o
f T
est
Res
ult
s
Soils in Upper 60 ft
Fresno Viaduct
0 1,000 2,000 3,000 4,000
Soil Modulus Estimated From CPT, Es, tsf
0
25
50
75
100
Per
cen
t L
ess
Th
an
Ind
ica
ted
Va
lue
0 1,000 2,000 3,000 4,000
Soil Modulus Estimated From CPT, Es, tsf
0
100
200
300
400
Nu
mb
er o
f T
est
Res
ult
s
Soils Below 60 ft
Fresno Viaduct
HSR
13-
06 -
EXEC
UTI
ON
VER
SIO
N

HSR
13-
06 -
EXEC
UTI
ON
VER
SIO
N

CALIFORNIA HIGH-SPEED TRAIN ENGINEERING GEOTECHNICAL BASELINE REPORT FOR BID FRESNO TO BAKERSFIELD SECTION CONTRACT PACKAGE 1
Page A6-1
A6.0 At-Grade, Embankment, and Other Ancillary Structures
The following sections present the results of statistical analyses performed on all data obtained from this investigation in the upper 20 feet of soils (excluding Existing Fill). This section is provided as an interpretation of the soil properties that are anticipated for the design and construction of at-grade, embankments, road crossings, pedestrian bridges, and other ancillary structures.
For each soil parameter, a supporting table has been provided to summarize the mean, median, standard deviation, and range of values obtained by soil layer and test type (e.g. CPT, SPT, or laboratory test).
In some cases, soil parameters have been capped at a maximum value. Test results exceeding the maximum value are indicated in red on the histograms.
A6.1 Total Unit Weight
Table A6.1-1 Statistical Summary of Total Unit Weight – Ancillary Structures
Total Unit Weight CPT No. Tests 3,383 Mean, pcf 121 Median, pcf 121 Standard Deviation, pcf 10 Maximum, pcf 137 Minimum, pcf 90
Figure A6.1-1 Statistical Summary of Total Unit Weight Estimated from CPT – Ancillary Structures
80 100 120 140 160
Total Unit Weight Estimated from CPT, t, pcf
0
25
50
75
100
Per
cen
t L
ess
Th
an
Ind
icat
ed V
alu
e
80 100 120 140 160
Total Unit Weight Estimated from CPT, t, pcf
0
150
300
450
600
Nu
mb
er o
f T
est
Res
ult
s
Note:Values capped at 137 pcf.Tests exceeding this valueare indicated in red.
At-Grade, Embankment, and Ancillary Structures
HSR
13-
06 -
EXEC
UTI
ON
VER
SIO
N

CALIFORNIA HIGH-SPEED TRAIN ENGINEERING GEOTECHNICAL BASELINE REPORT FOR BID FRESNO TO BAKERSFIELD SECTION CONTRACT PACKAGE 1
Page A6-2
A6.2 SPT N60
Table A6.2-1 Statistical Summary of SPT N60 – Ancillary Structures
SPT N60 CPT SPTNo. Tests 3,753 115Mean, blows/ft 34 35Median, blows/ft 29 22Standard Deviation, blows/ft 20 94Maximum, blows/ft 99 115Minimum, blows/ft 3 5
Figure A6.2-1 Statistical Summary of SPT N60 Estimated from CPT – Ancillary Structures
Figure A6.2-2 Statistical Summary of SPT N60 – Ancillary Structures
0 25 50 75 100
N60 Estimated from CPT, N60, blows/ft
0
25
50
75
100
Pe
rcen
t L
ess
Th
an
In
dic
ated
Va
lue
0 25 50 75 100
N60 Estimated from CPT, N60, blows/ft
0
150
300
450
600
Nu
mb
er o
f T
est
Res
ult
s
Note:Values capped at 99 blows/ft.Tests exceeding this valueare indicated in red.
At-Grade, Embankment,and Ancillary Structures
0 25 50 75 100
SPT N-Value, N60, blows/ft
0
25
50
75
100
Per
cen
t L
ess
Th
an In
dic
ated
Val
ue
0 25 50 75 100
SPT N-Value, N60, blows/ft
0
6
12
18
24
Nu
mb
er o
f T
est
Res
ult
s
Note:Values capped at 99 blows/ft.Tests exceeding this valueare indicated in red.
At-Grade, Embankment, and Ancillary Structures
HSR
13-
06 -
EXEC
UTI
ON
VER
SIO
N

CALIFORNIA HIGH-SPEED TRAIN ENGINEERING GEOTECHNICAL BASELINE REPORT FOR BID FRESNO TO BAKERSFIELD SECTION CONTRACT PACKAGE 1
Page A6-3
A6.3 Effective Friction Angle
Table A6.3-1 Statistical Summary of Effective Friction Angle – Ancillary Structures Effective Friction Angle CPT SPT Laboratory
No. Tests 3,742 20 22 Mean, deg 43 42 37 Median, deg 43 4 37 Standard Deviation, deg 3 49 5 Maximum, deg 51 35 43 Minimum, deg 30 20 24
Figure A6.3-1 Statistical Summary of Effective Friction Angle Estimated from CPT – Ancillary Structures
Figure A6.3-2 Statistical Summary of Effective Friction Angle Estimated from SPT – Ancillary Structures
30 35 40 45 50
Effective Friction Angle Estimated from CPT, ', deg
0
25
50
75
100
Pe
rcen
t L
ess
Th
an
Ind
ica
ted
Va
lue
30 35 40 45 50
Effective Friction Angle Estimated from CPT, ', deg
0
150
300
450
600
Nu
mb
er
of
Te
st R
esu
lts
At-Grade, Embankment,and Ancillary Structures
20 30 40 50 60
Effective Friction Angle Estimated From SPT, ', deg
0
25
50
75
100
Per
cen
t L
ess
Th
an
Ind
icat
ed V
alu
e
Direct Shear Tests
SPT correlation
20 30 40 50 60
Effective Friction Angle Estimated From SPT, ', deg
0
4
8
12
16
Nu
mb
er o
f T
est
Res
ult
s
Direct Shear Tests
SPT correlation
At-Grade, Embankment, and Ancillary Structures
Note:Values capped at 50 deg.Tests exceeding this valueare indicated in red.
55 Tests
HSR
13-
06 -
EXEC
UTI
ON
VER
SIO
N

CALIFORNIA HIGH-SPEED TRAIN ENGINEERING GEOTECHNICAL BASELINE REPORT FOR BID FRESNO TO BAKERSFIELD SECTION CONTRACT PACKAGE 1
Page A6-4
A6.4 Cone Tip Resistance
Table A6.4-1 Statistical Summary of Cone Tip Resistance – Ancillary Structures
Cone Tip Resistance CPT No. Tests 3,846 Mean, tsf 178 Median, tsf 146 Standard Deviation, tsf 134 Maximum, tsf 1,630 Minimum, tsf 8
Figure A6.4-1 Statistical Summary of Cone Tip Resistance from CPT – Ancillary Structures
0 450 900 1,350 1,800
Cone Tip Resistance, qc, tsf
0
25
50
75
100
Per
cen
t L
ess
Th
an
Ind
icat
ed V
alu
e
0 450 900 1,350 1,800
Cone Tip Resistance, qc, tsf
0
200
400
600
800
Nu
mb
er o
f T
est
Res
ult
s Soils in Upper 20 ft
877 Tests 836 Tests
At-Grade, Embankment, and Ancillary Structures
HSR
13-
06 -
EXEC
UTI
ON
VER
SIO
N

CALIFORNIA HIGH-SPEED TRAIN ENGINEERING GEOTECHNICAL BASELINE REPORT FOR BID FRESNO TO BAKERSFIELD SECTION CONTRACT PACKAGE 1
Page A6-5
A6.5 Soil Modulus
Table A6.5-1 Statistical Summary of Soil Modulus Estimated from SPT– Ancillary Structures
Soil Modulus SPT No. Tests 75 Mean, tsf 373 Median, tsf 362 Standard Deviation, tsf 145 Maximum, tsf 684 Minimum, tsf 117
Figure A6.5-1 Statistical Summary of Soil Modulus Estimated from SPT – Ancillary Structures
0 200 400 600 800
Soil Modulus Estimated From SPT, Es, tsf
0
25
50
75
100
0 200 400 600 800
Soil Modulus Estimated From SPT, Es, tsf
0
4
8
12
16
At-Grade, Embankment,and Ancillary Structures
Note:Values capped below 700 tsf.Tests exceeding this valueare indicated in red.
48 Tests
HSR
13-
06 -
EXEC
UTI
ON
VER
SIO
N

CALIFORNIA HIGH-SPEED TRAIN ENGINEERING GEOTECHNICAL BASELINE REPORT FOR BID FRESNO TO BAKERSFIELD SECTION CONTRACT PACKAGE 1
Page A6-6
Table A6.5-2 Statistical Summary of Soil Modulus Estimated from CPT– Ancillary Structures
Soil Modulus CPT No. Tests 725 Mean, tsf 338 Median, tsf 304 Standard Deviation, tsf 225 Maximum, tsf 1,515 Minimum, tsf 33
Figure A6.5-2 Statistical Summary of Soil Modulus Estimated from CPT – Ancillary Structures
0 400 800 1,200 1,600
Soil Modulus Estimated From CPT, Es, tsf
0
25
50
75
100
Per
cen
t L
ess
Th
an In
dic
ated
Val
ue
0 400 800 1,200 1,600
Soil Modulus Estimated From CPT, Es, tsf
0
25
50
75
100
Nu
mb
er o
f T
est
Res
ult
s
Soils in Upper 20 ft
At-Grade, Embankment, and Ancillary Structures
HSR
13-
06 -
EXEC
UTI
ON
VER
SIO
N

CALIFORNIA HIGH-SPEED TRAIN ENGINEERING GEOTECHNICAL BASELINE REPORT FOR BID FRESNO TO BAKERSFIELD SECTION CONTRACT PACKAGE 1
Page A7-1
A7.0 References
American Association of State Highway and Transportation Officials, 2010. LRFD Bridge Design Specifications. 5th Edition.
Hatanaka, M., and Uchida, A., 1996. Empirical Correlation Between Penetration Resistance and Internal Friction Angle of Sandy Soils. Soils and Foundations, Vol. 36, No. 4, pp. 1-9.
Robertson, P.K., 2009. Interpretation of Cone Penetration Tests – A Unified Approach. Canadian Geotechnical Journal. Vol. 46(11) 1337-1355.
U.S. Federal Highway Administration, 2002. Geotechnical Engineering Circular No. 5 – Evaluation of Soil and Rock Properties. FHWA-IF-02-034.
HSR
13-
06 -
EXEC
UTI
ON
VER
SIO
N