Embed Size (px)
Citation preview

GEOSTATISTICAL MODELING OF THE TEN-DAYRAINFALL IN MATO GROSSO STATE
Vanessa Rakel de Moraes DIAS1
Fernando da Silva SALLO2
Luciana SANCHES3
Rivanildo DALLACORT4
Abstract
Mapping the spatial-temporal distribution of rainfall allows the analysis of tendenciesand changes on local and regional scale, which is crucial for the development ofenvironmental and agricultural projects. The objective of this paper is to adjust andchoose semivariographic mathematical models to analyze the spatial variability of the75 percentile rainfall in Mato Grosso State, covering October to March, to subsequentlyrepresent it on maps using Kriging techniques. Data from 155 weather stations in MatoGrosso S and around were used, with data for over ten years provided by the NationalWater Agency. The semivariograms were adjusted using the least squares method andchosen among spherical, exponential, and Gaussian models. The exponential modeladjusted best to the experimental semivariograms using the criterion of standard deviationin reduced errors obtained from cross validation and level of dependence. The spatialvariability of the rainfall was then mapped using Kriging techniques.
Key words: Spatial variability. Geostatistics. Least squares. Semivariogram.
1 State University of Mato Grosso, CPEDA, Rod. MT 358, km 7, Jardim Aeroporto, 78300-000,Tangará da Serra-MT, Brazil. E-mail: [email protected]
2 Federal University of Mato Grosso, Physics and Environmental Research Group, Av. FernandoCorrea da Costa, n. 2367, Boa Esperança, 78060-900, Cuiabá-MT, Brazil.E-mail: [email protected]
3 Federal University of Mato Grosso, Department of Sanitary and Environmental Engineering, Av.Fernando Correa da Costa, n. 2367, Boa Esperança, 78060-900, Cuiabá-MT, Brazil.E-mail: [email protected]
4 State University of Mato Grosso, Department of Agronomy, CPEDA, Rod. MT 358, km 7, JardimAeroporto, 78300-000, Tangará da Serra-MT, Brazil, E-mail: [email protected]
GEOGRAFIA, Rio Claro, v. 42, n. 3, Especial - GeoPantanal 6, p. 99-112, set./dez. 2017

100 GEOGRAFIAGeostatistical modeling of the ten-day rainfall in Mato Grosso State
ResumoModelagem geoestatística da precipitação pluvial
decendial no estado de Mato Grosso
O mapeamento da distribuição espaço-temporal da precipitação pluvial possibilitaa análise de tendências e alterações em escalas locais e regionais, imprescindíveis nodesenvolvimento de projetos ambientais e agrícolas. Assim, o objetivo do presentetrabalho foi ajustar e selecionar modelos matemáticos semivariográficos para a análiseda variabilidade espacial dos percentis 75 da precipitação pluvial no estado de MatoGrosso, referente aos meses de outubro a março para, posteriormente, representá-lapor meio de mapas por técnicas de krigagem. Dados de 155 estações pluviométricas noestado de Mato Grosso e no entorno, com dados acima de 10 anos, da Agência Nacionalde Águas foram utilizados. Os semivariogramas foram ajustados pelo método dosmínimos quadrados e selecionados entre os modelos esférico, exponencial e gaussiano.O modelo que melhor se ajustou aos semivariogramas experimentais pelo critério dodesvio padrão dos erros reduzidos obtido pela validação cruzada e grau de dependênciaespacial foi o exponencial. Assim, a variabilidade espacial da precipitação pluvial foimapeada por técnicas de krigagem.
Palavras-chave: Variabilidade espacial. Geoestatistica. Mínimos quadrados.Semivariograma.
INTRODUCTION
Among the climatic variables, rainfall is of key importance and should be monitoredfor environmental planning, agricultural projects, civil construction, and civil defense,among others. To characterize regional rainfall patterns, arithmetical averages andaverages determined by the Thiessen method, whether they are daily, monthly,seasonal, or annual, are not always sufficient for its application in agriculture becausethere are fluctuations in monthly and annual totals, as well as variations from onelocation to another.
Therefore, for agricultural planning, expected or probable precipitation valuesassociated with a level of probability are used. The 75 percentile of rainfall mappedusing interpolators can provide more reliable information which serves as a basis foragricultural planning. The spatial representation of the phenomenon in terms offrequency or probabilities is important because it provides information on rainfall inlocations where there are no weather stations (GOMES et al., 2002).
Marcuzo et al.,(2011a) studied the total rainfall on Mato Grosso State, analyzingthe spatial, temporal, and seasonal variation with data from 75 weather stations from1977 to 2006 and created isohyetal maps using the Topo to Raster Interpolation method.
In an analysis of rainfall in the Central West portion of Mato Grosso State,covering 17 municipalities between 1985 and 1995, data from 14 weather stationswere used to create isohyetal maps via interpolation techniques in the Surfer programversion 8 (ROSA et al., 2007).
Another study in Mato Grosso State, but covering only the Pantanal, mappedthe distribution of rainfall using data from 5 weather stations covering the 30 yearsfrom 1977 to 2006, and isohyetal maps were elaborated via the Topo to Raster method,which uses the simple multi-grid method to minimize the equation for better resolutions(MARCUZZO et al., 2011b).
Using a GIS (Geographic Information System) for the spatial representation ofclimatic variables has been crucial as it represents an approximation to the reality of
101Dias, V. R. de M. / Sallo, F. da S. /
Sanches, L. / Dallacort, R.v. 42, n. 3, set./dez. 2017
particular variables in areas of interest (Marcuzzo et al., 2011b). As rainfall is monitoredat collection points which provide specific information, spatial interpolation methodsare necessary to create maps (MELLO et al., 2005).
Geostatistics stand out among the interpolators and requires samples correlatedin space, which differs from statistical techniques that do not consider the spatialdependency of collection points and use the average and standard deviation, whichare based on the hypothesis that the sampled values have a normal distribution andthat local variations are random (GOMES et al., 2002).
The geostatistical interpolator is considered to be better in comparison with theother interpolation methods. However, the best possible semivariogram must bemodeled before interpolation (MELLO et al., 2005; RIBEIRO JUNIOR; DIGGLE, 2016).
The process of choosing the variographic methods and models that best representthe variable in question is the main stage in the geostatistical method. The statisticalmethods include: Ordinary least squares, Weighted least squares, Maximum likelihood,Restricted maximum likelihood, as well as various models available in computerprograms for semivariogram adjustments, including: Spherical, Exponential, Gaussian,and Wave, among others (R CORE TEAM, 2015). After the choice of a mathematicalmodel it is possible to carry out interpolation with a Kriging, which requires a spatialdependency between neighboring samples, represented by the semivariogram. Thenit is possible to estimate values in other locations in the study area without sampling(CRESSIE, 1993).
Similarly to this study, in São Paulo State the spatial distribution of the 75percentile from a ten-day rainfall was also evaluated, but only in the spring period,using data from 136 weather stations and creating isohyetal maps via geostatisticalinterpolation, enabling the authors to verify the spatial variability reflecting the behaviorof atmospheric circulation in the State (GOMES et al., 2002).
OBJECTIVE
In this frame, the objective of this research is to adjust and choosesemivariographic mathematical models for a spatial variability analysis of the 75percentile of ten-day rainfall in Mato Grosso State, from October to March, to representit via maps using Kriging techniques.
MATERIAL AND METHODS
Rainfall data
The daily rainfall data were obtained by 155 weather stations installed in andaround Mato Grosso State (Figure 1) available at the National Water Agency - ANAinternet portal (HIDROWEB, 2012), with historical records for at least 10 years. Datafrom October to March were chosen because these months involve the highest rainfallin this region. The 75 percentile was used because it increases the reliability degree ofrainfall occurrence (HANN, 2002).

102 GEOGRAFIAGeostatistical modeling of the ten-day rainfall in Mato Grosso State
Geostatistics
The Regionalized Variable Theory was developed by Matherson based on theobservations from Krige and in his honor Matherson called his method �kriging�(geostatistical interpolation). A regionalized variable is a numerical function with spatialdistribution, with variation from one location to another, apparently continuous; howeverthese variations cannot be represented by a simple mathematical function (BURROUGH;MCDONNELL, 1998).
A variable dependent on geographical coordinates is considered as regionalizedand can vary continuously in the geographical space. Each observed value z(xi) inlocations xi, i = 1, 2, ..., n, wherein xi denotes the geographical coordinates in twodimensions. It is considered a realization of the random variables z(x). The set ofrandom variables constitutes a random function or stochastic process (McBratney &Webster, 1986). Half of the expected variance between the pairs of points separatedby a distance �h� is defined as semivariance and is represented by the classical model(Eq. 1):
(1)
where is the estimated semivariance for each distance (lag) between pairs ofpoints, N(h) is the number of pairs of measured values z(xi), z(xi + h), separated bydistance h (BURROUGH; MCDONNELL, 1998).
Using the adjusted semivariographic model, spatial patterns can be describedand values predicted for non-sampled locations by Kriging, the best non-biased linearestimator, whose estimates are weighted by linear combinations of the existing data,with an average of null errors and minimum variance for the estimation errors. The
Figure 1 - Location of weather stations in Mato Grossoand neighbor States
103Dias, V. R. de M. / Sallo, F. da S. /
Sanches, L. / Dallacort, R.v. 42, n. 3, set./dez. 2017
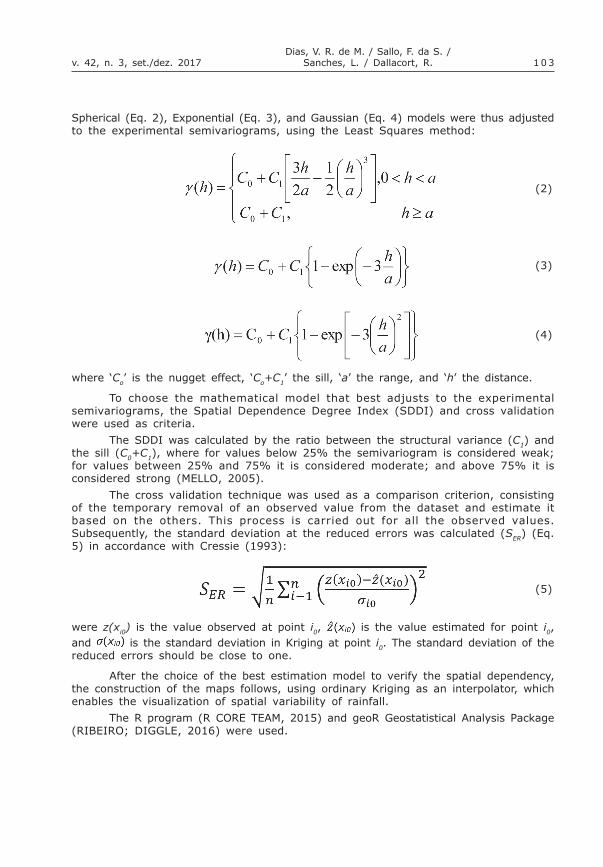
Spherical (Eq. 2), Exponential (Eq. 3), and Gaussian (Eq. 4) models were thus adjustedto the experimental semivariograms, using the Least Squares method:
(2)
(3)
(4)
where �Co� is the nugget effect, �Co+C1� the sill, �a� the range, and �h� the distance.
To choose the mathematical model that best adjusts to the experimentalsemivariograms, the Spatial Dependence Degree Index (SDDI) and cross validationwere used as criteria.
The SDDI was calculated by the ratio between the structural variance (C1) andthe sill (C0+C1), where for values below 25% the semivariogram is considered weak;for values between 25% and 75% it is considered moderate; and above 75% it isconsidered strong (MELLO, 2005).
The cross validation technique was used as a comparison criterion, consistingof the temporary removal of an observed value from the dataset and estimate itbased on the others. This process is carried out for all the observed values.Subsequently, the standard deviation at the reduced errors was calculated (SER) (Eq.5) in accordance with Cressie (1993):
(5)
were z(xi0) is the value observed at point i0, is the value estimated for point i0,and is the standard deviation in Kriging at point i0. The standard deviation of thereduced errors should be close to one.
After the choice of the best estimation model to verify the spatial dependency,the construction of the maps follows, using ordinary Kriging as an interpolator, whichenables the visualization of spatial variability of rainfall.
The R program (R CORE TEAM, 2015) and geoR Geostatistical Analysis Package(RIBEIRO; DIGGLE, 2016) were used.

104 GEOGRAFIAGeostatistical modeling of the ten-day rainfall in Mato Grosso State
RESULTS AND DISCUSSION
The highest rainfall in Mato Grosso State corresponds to the period betweenOctober and March, the so-called �Rainy season� (MARCUZZO et al., 2011a). In general,the 75% probability of higher rainfall occurrence was in the North of the State andover the ten-day periods the value of the 75 percentile of rainfall, increased fromOctober to January, with a peak in average value of 57.45 mm occurring in the firstten days of January. As for the south of the State, the rainfall probability was lower,with the Pantanal as the biome with the lowest rainfall rates. The months with thehighest rainfall probability are December, January, and February (Figure 2).
The main atmospheric mechanisms that act in the Brazil Central West region,and specifically in Mato Grosso State, are the Atlantic Polar Mass, with more frequencyin the winter, and the Continental Equatorial Air Mass derived from the thermal effectand high humidity that occurs specially during the rainy period, displacing to the interiorof the country in a NE to SW direction and causing rains (MARCUZZO et al., 2011a),which explains the higher rainfall volumes in this period.
Figure 2 - Average of the 75 percentile of ten-day rainfall (mm)from October to March in Mato Grosso State
Classical statistics using average values give only an idea of the 75 percentileof rainfall for each ten-day period; that is, the average for each location, or in thiscase, an average for Mato Grosso State (Figure 2). It does not provide information onthe spatial variability of the phenomenon. Hence the decision to represent the variableon maps.
105Dias, V. R. de M. / Sallo, F. da S. /
Sanches, L. / Dallacort, R.v. 42, n. 3, set./dez. 2017
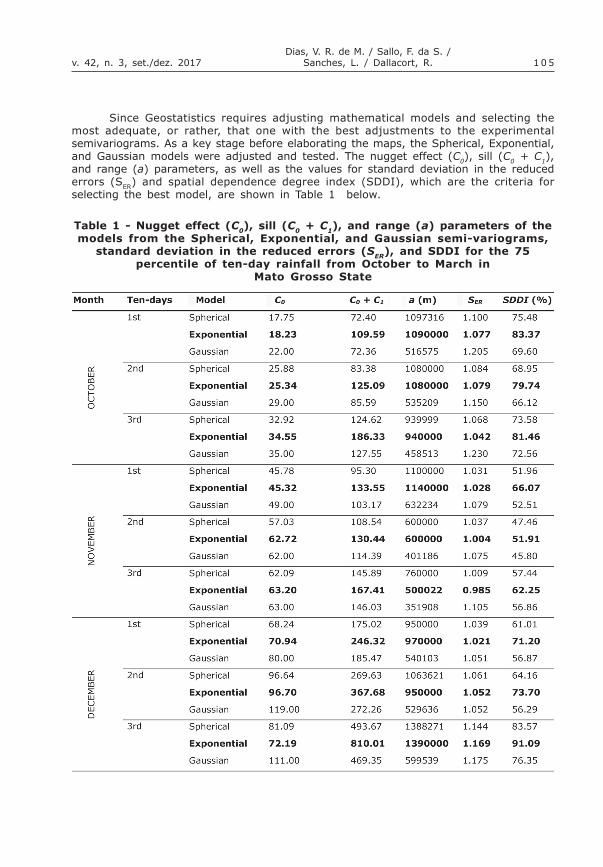
Since Geostatistics requires adjusting mathematical models and selecting themost adequate, or rather, that one with the best adjustments to the experimentalsemivariograms. As a key stage before elaborating the maps, the Spherical, Exponential,and Gaussian models were adjusted and tested. The nugget effect (C0), sill (C0 + C1),and range (a) parameters, as well as the values for standard deviation in the reducederrors (SER) and spatial dependence degree index (SDDI), which are the criteria forselecting the best model, are shown in Table 1 below.
Table 1 - Nugget effect (C0), sill (C0 + C1), and range (a) parameters of themodels from the Spherical, Exponential, and Gaussian semi-variograms,
standard deviation in the reduced errors (SER), and SDDI for the 75percentile of ten-day rainfall from October to March in
Mato Grosso State
106 GEOGRAFIAGeostatistical modeling of the ten-day rainfall in Mato Grosso State
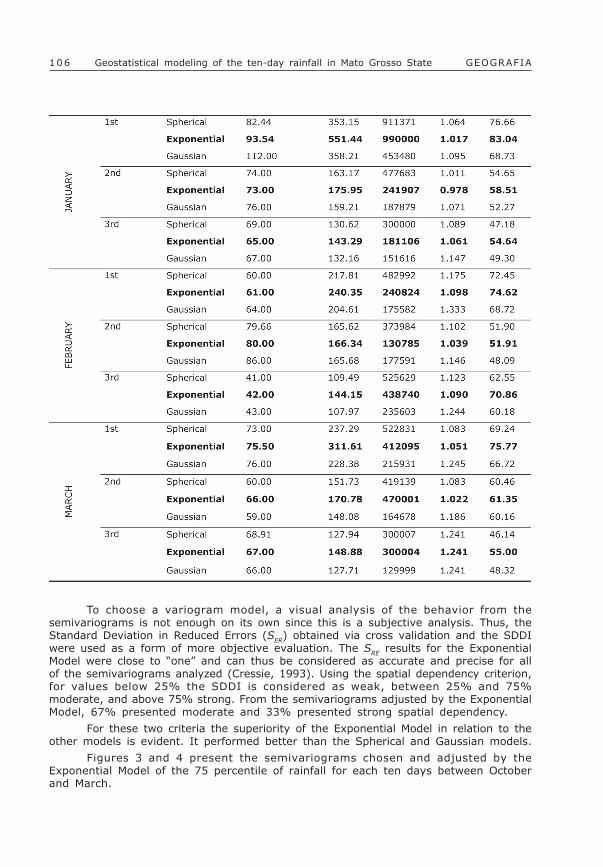
To choose a variogram model, a visual analysis of the behavior from thesemivariograms is not enough on its own since this is a subjective analysis. Thus, theStandard Deviation in Reduced Errors (SER) obtained via cross validation and the SDDIwere used as a form of more objective evaluation. The SRE results for the ExponentialModel were close to �one� and can thus be considered as accurate and precise for allof the semivariograms analyzed (Cressie, 1993). Using the spatial dependency criterion,for values below 25% the SDDI is considered as weak, between 25% and 75%moderate, and above 75% strong. From the semivariograms adjusted by the ExponentialModel, 67% presented moderate and 33% presented strong spatial dependency.
For these two criteria the superiority of the Exponential Model in relation to theother models is evident. It performed better than the Spherical and Gaussian models.
Figures 3 and 4 present the semivariograms chosen and adjusted by theExponential Model of the 75 percentile of rainfall for each ten days between Octoberand March.

107Dias, V. R. de M. / Sallo, F. da S. /
Sanches, L. / Dallacort, R.v. 42, n. 3, set./dez. 2017
In general, the semivariograms presented rising semivariances until a certaindistance �a� when they stabilize, coinciding with the sill and indicating that a stationarystate is guaranteed and the parameters generated can be used to estimate rainfallvalues in non-collected locations. However, models such as the Exponential one, amongothers, only reach the sill in an asymptotic way (CRESSIE, 1993).
The behavior of the range is associated with the existence of a structure withspatial dependence; that is: it is a distance at which there is a spatial correlationbetween the locations of the variable in question. As the model chosen was exponential,the range related to this model varied from 130 to 1390 km in the second ten-dayperiod of February and in the third ten-day period of December, respectively. Thesevalues represent the extension of the spatial dependence structure of the 75 percentileof rainfall in and around Mato Grosso State, with December practically covering theentire State.
The nugget effect, sill, and range related to the chosen semivariograms wereused to carry out the Kriging and generate the maps.
Figure 3 - Experimental semivariograms related to the 75 percentile often-day rainfall in Mato Grosso State, adjusted by the exponential model,
for the 1st, 2nd, and 3rd ten days of October (a, b, c), November (d, e, f),and December (g, h, i), respectively

108 GEOGRAFIAGeostatistical modeling of the ten-day rainfall in Mato Grosso State
Results from other Brazilian States support the choice for the exponential modelin this study. These include the case study of rainfall in Minas Gerais State, wherevariogram models were adjusted and the Exponential Model chosen was the best inperformance, compared to the others (MELLO et al., 2008).
For intensive rainfall in São Paulo State, two different interpolators wereevaluated, with the geostatistical method being superior to the other method, and theExponential Model was adjusted using the trial and error method, generating precisemaps by Kriging. The authors concluded that the results were precise and that themethod should be applied always when possible (MELLO et al., 2003).
Another study on the spatial behavior of rainfall in São Paulo State using annualprecipitation data from 379 weather stations compared different semivariogramadjustment models and the Exponential one was superior to the other ones (CARVALHOet al., 2004).
Figure 4 - Experimental semivariograms related to the 75 percentile often-day rainfall in Mato Grosso State, adjusted by the exponential model,
for the 1st, 2nd, and 3rd ten days of January (a, b, c), February (d, e, f)and March (g, h, i), respectively

109Dias, V. R. de M. / Sallo, F. da S. /
Sanches, L. / Dallacort, R.v. 42, n. 3, set./dez. 2017
To estimate and analyze the standard behavior of the 75 percentile of ten-dayrainfall in São Paulo State, mathematical models were also compared and the bestperformance presented the Exponential Model followed by the Spherical one (GOMESet al., 2002).
After selecting the mathematical model that best adjusts to the experimentalsemivariograms, the next geostatistical stage was the interpolation by Ordinary Kriging,generating maps on the probability of rainfall occurrence.
The distribution of the values of the 75 percentile of rainfall, modeled and mappedfor each ten days from October to March correspond to the rain period in Mato GrossoState, presenting a spatial variation from one extreme of the State to the other (Figures5 and 6).
Figure 5 - Maps of spatial variability of the 75 percentile of ten-dayrainfall (mm) in Mato Grosso State, involving the 1st (a), 2nd (b), and 3rd (c)ten days of October, 1st (d), 2nd (e), and 3rd (f) of November, and 1st (g), 2nd
(h), and 3rd (i) of December
110 GEOGRAFIAGeostatistical modeling of the ten-day rainfall in Mato Grosso State
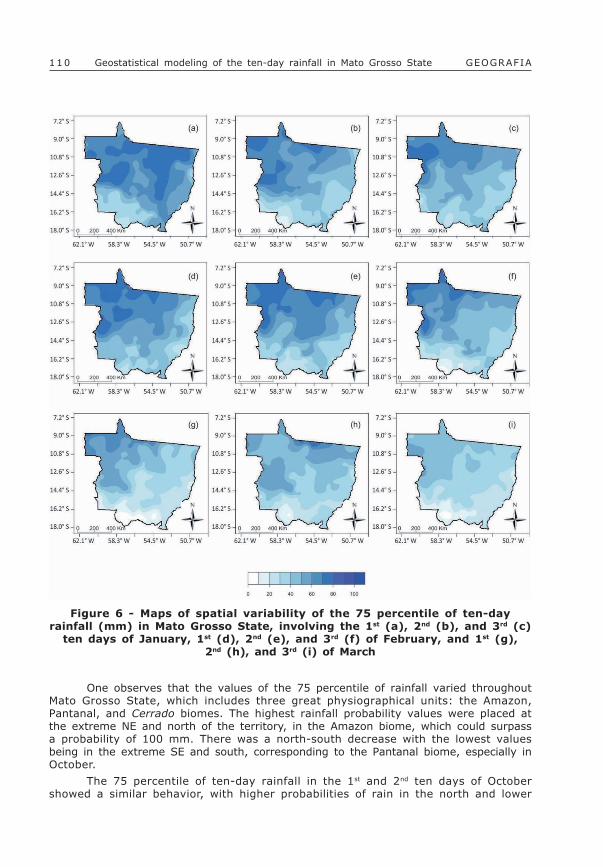
One observes that the values of the 75 percentile of rainfall varied throughoutMato Grosso State, which includes three great physiographical units: the Amazon,Pantanal, and Cerrado biomes. The highest rainfall probability values were placed atthe extreme NE and north of the territory, in the Amazon biome, which could surpassa probability of 100 mm. There was a north-south decrease with the lowest valuesbeing in the extreme SE and south, corresponding to the Pantanal biome, especially inOctober.
The 75 percentile of ten-day rainfall in the 1st and 2nd ten days of Octobershowed a similar behavior, with higher probabilities of rain in the north and lower
Figure 6 - Maps of spatial variability of the 75 percentile of ten-dayrainfall (mm) in Mato Grosso State, involving the 1st (a), 2nd (b), and 3rd (c)
ten days of January, 1st (d), 2nd (e), and 3rd (f) of February, and 1st (g),2nd (h), and 3rd (i) of March

111Dias, V. R. de M. / Sallo, F. da S. /
Sanches, L. / Dallacort, R.v. 42, n. 3, set./dez. 2017
probabilities in the south, but with a lower average (Figure 1) and the probability ofincreasing over the ten-day periods until the 1st ten days of January and decreasingagain until March.
Mato Grosso State presents physical peculiarities such as a terrain and avegetation that directly influence the spatial variability of precipitation, as well as thegeographical positioning, since Mato Grosso is under the influence of three climaticunits of the region: Wet Equatorial Continental Climate, Wet Sub-Equatorial ContinentalClimate, and alternating Wet and Dry Tropical Continental Climate (COUTINHO, 2005).The influence of the Parecis and Guimarães uplands, located in the mid-west and mid-east, respectively, is perceived in the spatial distribution of rainfall in Mato Grosso.Relief-induced rains can potentially occur in these regions making them more rainy ifcompared to localities at the same latitudes without the influence of altitude.
The study on rainfall distribution in Mato Grosso State by Marcuzzo et al. (2011a)presented a big variation in precipitation rates, where the localities with the highestrainfall values were also identified in the extreme NE and north and the localities in thesouth of the State had the lowest rainfall amounts.
Rosa et al. (2007), in an analysis of the spatial distribution and annual rainfallvariability in the Central-West portion of Mato Grosso State, observed that themunicipalities with the highest recorded rainfalls were Nobres and Diamantino, thelatter being approximately 10 km from the source of the Paraguay river in themunicipality of Alto Paraguay, a coherent result with the maps generated in this study.These authors also observed that the rains were irregular, thus supporting this result.
CONCLUSIONS
It is concluded that from the semivariographic models analyzed, the one thatadjusted best to the experimental semivariograms for the 75 percentile of ten-dayrainfall in Mato Grosso, from October to March, was the Exponential one. It was chosenby cross validation and the SDDI to describe the spatial dependence structure of theprecipitation.
The maps allowed to identify that the behavior of the spatial distribution of the75 percentile of rainfall was variable with higher values in the north and NE and lowerones in the south and SE.
Therefore, the study of the spatial rainfall variability in Mato Grosso State enabledthe generation of maps to analyze the behavior of the rainfall probability occurrence,at a level of 75%, thus providing crucial information for agricultural planning anddecision making. Geostatistics was therefore a fundamental tool for this study, permittinga semivariographic analysis resulting in parameters used in the Kriging stage and thegeneration of maps.
ACKNOWLEDGEMENTS
The authors acknowledge the National Water Agency (ANA) for providing thedata on the website (<http://hidroweb.ana.gov.br>) used in this paper.

112 GEOGRAFIAGeostatistical modeling of the ten-day rainfall in Mato Grosso State
REFERENCES
BURROUGH, P. A.; MCDONNELL, R. A. Principles of geographical informationsystems. Oxford: Oxford University Press, 1998. 333p.
CARVALHO, J. R. P. de; VIEIRA, S. R.; VENDRUSCULO, L. G. Uso da técnica demínimos quadrados ponderados para ajuste de modelos as semivariograma.Campinas: Embrapa Informática Agropecuária, 2004.
COUTINHO, A. C. Dinâmica das queimadas no Estado do Mato Grosso e suasrelações com as atividades antrópicas e a economia local. 2005. 308f. Tese(Doutorado em Ciência Ambiental) - Procam, Universidade de São Paulo, USP, 2005.
CRESSIE, N. Statistics for spatial data. New York: Wiley. 1993.
GOMES, B. M.; CRUZ, R. L. Comportamento especial dos percentis 75 da precipitaçãodecendial para o Estado de São Paulo, na primavera. Irriga, v. 7, n. 2, p. 142-153,2002.
HANN, C. T. Statistical Methods in Hydrology. 2. ed. Ames: The Iowa State UniversityPress, 2002. 377p.
HIDROWEB. Sistema de Informações Hidrológicas. Available at: <http://hidroweb.ana.gov.br>. Access in June 25th 2012.
MARCUZZO, F. F. N.; MELO, D. C. R.; ROCHA, H. M. Distribuição Espaço-temporal eSazonalidade das Chuvas no Estado de Mato Grosso. Revista Brasileira de RecursosHídricos, v. 16, n. 4, p. 157-167, 2011a.
MARCUZZO, F. F. N.; ROCHA, H. M.; MELO, D. C. R. Mapeamento da precipitaçãopluviométrica no Bioma Pantanal do Estado do Mato Grosso. Geoambiente On-line,n. 16, p. 66-84, 2011b.
McBRATNEY, A. G.; WEBSTER, A. G. Choosing functions for semivariograms and fittingthem to sampling estimates. Journal of Soil Science, v. 37, p. 617-639, 1986.
MELLO, C. R. de; LIMA, J. M.; SILVA, A. M.; MELLO, J. M.; OLIVEIRA, M. S. Krigageme inverso do quadrado da distância para interpolação dos parâmetros da equação dechuvas intensas. Revista Brasileira de Ciência do Solo, v. 27, n. 5, p. 925-933,2003.
MELLO, C. R. DE; VIOLA, M. R.; MELLO, J. M.; SILVA, A. M. Continuidade espacial dechuvas intensas no Estado de Minas Gerais. Ciência e Agrotecnologia, v.32, n.2, p.532-539, 2008.
MELLO, J. M.; BATISTA, J. L. F.; RIBEIRO JUNIOR, P. J.; OLIVEIRA, M. S. Ajuste eseleção de modelos espaciais de semivariograma visando a estimativa volumétricade Eucaliptus grandis. Scientia Forestalis, v. 1, n. 1, p. 25-37, 2005.
RIBEIRO, P. J.; DIGGLE, P. J. (2016). geoR: Analysis of Geostatistical Data. R packageversion 1.7-5.2. https://CRAN.R-project.org/package=geoR
R Core Team (2015). R: A language and environment for statistical computing.R Foundation for Statistical computing, Vienna, Austria. URL https://www.R-project.org.
ROSA, D. B.; SOUSA, R. R.; NASCIMENTO, L. A.; TOLEDO, L. G.; TOPANOTTI, D. Q.;NASCIMENTO, J. A. A distribuição especial das chuvas na porção Centro-Oeste doEstado de Mato Grosso-Brasil. Revista Eletrônica da Associação dos GeógrafosBrasileiros, Seção Três Lagoas, v. 1, n. 5, 2007.