Embed Size (px)
Citation preview

Submit Manuscript | http://medcraveonline.com
IntroductionJharkhand state is characterized by plateau terrain and facing
sever water scarcity largely on account of high runoff generated by adequate annual rainfall of about 1400mm per year. The run-off is one of the important hydrologic variables used for assessment of potential water yield of a watershed and appropriate measures for ground water recharging. The quantity and rate of runoff is influenced by rainfall parameters and conjointly by many alternative watershed factors viz., kind of construction of catchment, physical nature of the soil, distribution and type of vegetative cover, degree and length of slope, shape form and size of watershed. When the speed of precipitation exceeds the speed at that water infiltrates into the soil considered as runoff. Run-off volume and also the run-off rate will increase as watershed size will increase.1 SCN based rainfall-runoff model are mostly used for computation of runoff 2 as compared to conventional techniques i.e expensive and need hydrological and meteorological data measurement. The rainfall-runoff studies by conventional techniques enhance to large extent because of remote sensing tools and technologies. Interpretation of satellite data help us to demarcate thematic information on land use, soil, vegetation, drainage, hydrogeomorphology etc that combined with rainfall parameter and topographic parameters (slope, contour and height) provide the crucial inputs data during rainfall-runoff models computation. Geo-referenced database is prepaired in Geographical data system (GIS) based on information extracted from remote sensing and different sources .Therefore, the utilization of a GIS is most popular over the conventional techniques for deduce surface run-off and analyzing the factors accountable for run-off. The runoff information in Jharkhand is very scarce because of dominantly forest covered regions and only available at few limited sites. Also, the majority of the agricultural watersheds in India are ungauged, having nil historical records of the rainfall-run-off
processes.3 In the Jharkhand with dominantly forest lined regions the correct info on run-off is scarce and present at very limited sites. There are various models used for runoff estimation some of them are SWAT model i.e soil and water assessment tools, autoregressive integrated moving average(ARIMA), Seasonal autoregressive integrated moving (SARIMA) model, artificial neural network, fuzzy model and SCS-CN model etc was used for long term runoff forecasting. Among the various methods used for rainfall-run-off estimation, the soil conservation service curve number4 (renamed as natural resources conservation services curve number (NRCS-CN)) (USDA 1994) technique has been mostly applied to ungauged watershed systems to establish the rainfall-run-off relations5,6 and proved to be accurate and fast for surface runoff estimation.7 This approach is cheap, simple to use through minimum information and provides adequate results.4−10 The NRCS-CN technique is largely accepted by scientists, forester’s hydrologists, water resources planners and engineers meant for the estimation of surface run-off. Bhuyan et al.11 used the modified curve number (CN) technique designed for predicting surface run-off by adjusting the CNs based on expected Antecedent moisture Condition (AMC) ratio. Daily storm events data was used to estimate run-off using NRCS-CN technique 12 in the Damodar Barakar catchment in Jharkhand, India. Many regions in Jharkhand are drought prone with unpredictable rainfall pattern, rendering kharif crops mostly susceptible to agricultural drought during the rainfall period.13 Because of hard rock undulating terrain most of the rainfall water goes as runoff and therefore, rainwater move down slope and inadequately recharge the aquifers. It is necessary that the most water accessible as the run-off be utilized for maintaining crop development and recharge of groundwater. By considering these views, the present study was performed to estimate the run-off due to rainfall for select watershed of upper South Koel basin located in Ranchi and Lohardagga districts of Jharkhand state. Shallow unconfined aquifers are refilled by rainwater during monsoon
Int J Hydro. 2017;1(7):213‒220 213© 2017 Pandey et al. This is an open access article distributed under the terms of the Creative Commons Attribution License, which permits unrestricted use, distribution, and build upon your work non-commercially.
Geospatial technique for runoff estimation based on scs-cn method in upper south koel river basin of Jharkhand (India)
Volume 1 Issue 7 - 2017
Arvind Chandra Pandey, StutiSchool of Natural Resource Management, Centre for Land Resource Management, Central University of Jharkhand, India
Correspondence: Arvind Chandra Pandey, School of Natural Resource Management, Centre for Land Resource Management, Central University of Jharkhand, India, Email [email protected]
Received: October 09, 2017 | Published: December 22, 2017
Abstract
The present research uses SCS-CN technique for run-off computation using geoinformatics. The major part of the south Koel river basin located in Jharkhand state is drought prone with recurrent drought conditions during monsoon season. The watershed is characterized by high run-off discharge volume with 59 percent of total water of rainfall moved as runoff (i.e 2880 mm of runoff from 4855 mm of rainfall) during the monsoon season (June-October) and high runoff volume is observed mainly in the month of August (881.34 mm of runoff from 1388.4 mm of rainfall) for entire basin using monthly rainfall data of 5 years (2009-2013).The entire basin is divided into six sub-watersheds as I,II,III,IV,V and VI in which sub-watersheds II and IV exhibits high runoff (59%).The study recommend the sub-watersheds having high runoff value needs hydrological harvesting structure construction such as farm ponds, check dams and nala bunds etc in future for proper ground water management. The study demonstrated the use of geoinformatics for watershed management to combat drought.
Keywords: runoff estimation, scs-cn, upper south koel river basin
International Journal of Hydrology
Research Article Open Access

Geospatial technique for runoff estimation based on scs-cn method in upper south koel river basin of Jharkhand (India)
214Copyright:
©2017 Pandey et al.
Citation: Pandey AC, Stuti. Geospatial technique for runoff estimation based on scs-cn method in upper south koel river basin of Jharkhand (India). Int J Hydro. 2017;1(7):213‒220. DOI: 10.15406/ijh.2017.01.00037
season which temporally fulfill the need of people in these areas for limited periods till February end. Thus quantification of run-off water that can be available from these watersheds can help in implementing water preservation through development of surface water harvesting structures.
Study areaThe study area is (a part of South Koel basin) with an area of
772 sq km is bounded by latitude 23˚17’16’’ N -23˚32’16’’N and longitude 84˚14’15’’E - 85˚46’51’’E (Figure 1)( Figure 2). It lies in SOI toposheet no 73 A/14, 73 A/15, 73 E/2, 73 E/3 covering Ranchi as well as Lohardaga district of Jharkhand. South Koel is the main river in the area with Kandani river and Saphi rivers as its major tributaries. The drainage pattern is mostly dendritic. The climate of the region is subtropical with average annual rainfall of 1400mm, 82% of which generally received during the monsoon periods from June to September. Temperature is lowest in the months of December and January with mean minimum temperature of 9°C and highest in April and May with mean maximum temperature of 37.2°C.
Figure 1 Satellite image of study area of LISS-III.
Figure 2 Location map of upper South Koel river basin.
Data used and methodologyThe study area comprising parts of upper South Koel river basin,
delineated on the Survey of India topographical (SOI) map of scale 1:50000 were updated using LISS III satellite data having resolution
23.5meter (Table 1) IRS-P6 LISS-III satellite data interpretated to demarcate various land use/land cover map and geology map of study area and digitized using Arc-GIS 10.2 software to compute the area under each class. Soil map of the watershed obtained from the National Bureau of Soil Survey (NBSS) was used to create database on the hydrological soil group (HSG). Slope and relief map is prepaired by using cartosat DEM data using Arc-GIS tool box option. Curve numbers (CN) for each soil type required to be assigned for the assessment of run-off. As CN depends on soil type, therefore, on the basis of drainage condition, water transmission capacity ,infiltration rate, texture, depth and the soil was categorized into different HSGs: A, B, C and D. The criteria adopted for such classification of HSGs is based on the USDA-SCS4 method. The SCS model computes run-off through an empirical equation and to require rainfall (antecedent soil moisture condition), land cover, soil and the curve number (CN), which represents the run-off prospective of the land cover soil complex.8 To calculate the run-off available from the selected watershed using the NRCS soil conservation services (SCS) curve number method, the monthly rainfall data for five years (2009-2013) of monsoon season was acquired from the Indian Meteorological department. The model involves the relationship among land cover, hydrologic soil class and antecedent soil moisture to assign curve number.14 Physical characteristics (LU/LC and soil) of the watershed AMC and recharge capacity of the watershed are basic requirement for determination of curve number method.15 The indication of moisture used in run-off estimation is selected as AMC-I, AMC-II and AMC-III which represent dry, normal and wet conditions, respectively. In the present study, HSG and the thematic maps of land use/land cover were prepared in Arc-GIS software for different sub six watersheds and then spatially intersected to calculate the watershed area under the different hydrological similar units (HSU) for assigning CN values to compute total discharge for different sub watersheds. In upper South Koel river watersheds, mainly two hydrological soil group (HSGs) was classified i.e HSG‘B’, and HSG ‘C’, and the area under each HSG was calculated. The type of soil in HSG‘B’ was coarse loamy and the HSG‘C’ are fine and it covers the maximum portion of the watershed. Same process was applied for sub Watershed I, II, III, IV, V and VI to compute curve number values for individual sub watershed. Once the Curve Number was recognized for different land classes, the weighted curve number for watershed was calculated using equation (1).
1 1 2 2.
n nCN a CN a CN a
weighted curve numbera
× + × + …∑=
∑ (1)
Where 1CN = curve number for particular land unit 1
1a = area for that particular land unit 1
nCN = curve number for nth land unit of watershed, na = area of nth land unit of watershed
a∑ = sum of total area.
Potential maximum soil retention (S) was estimated for the watershed based on weighted curve number using Equation (2)
25, 400254S
CN= − (2)
The SCS curve number is based on basic statements i.e for a single storm event, maximum potential of soil retention is equivalent to the

Geospatial technique for runoff estimation based on scs-cn method in upper south koel river basin of Jharkhand (India)
215Copyright:
©2017 Pandey et al.
Citation: Pandey AC, Stuti. Geospatial technique for runoff estimation based on scs-cn method in upper south koel river basin of Jharkhand (India). Int J Hydro. 2017;1(7):213‒220. DOI: 10.15406/ijh.2017.01.00037
ratio of direct run-off and available rainfall. Subsequent to calculation of potential highest soil retention, the initial abstractions (Ia) were calculated. The initial abstractions (Ia) were considered as water losses. Thus, equation (3) is obtained.
a
a
P I Q Q
S P I
− −=
− (3)
Thus, value of Q is calculated by using equation (2)
( )( )
2
a
a
P IQ
P I S
−=
− + (4)
To simplify the equation (4), ( aI ) initial abstraction is related to potential maximum retention and P> Ia. It was considered that if the storm event is less than the initial abstraction value then there is no run-off available for that rainfall event, and only the storm events higher than the initial abstraction value are considered for the run-off estimation.16 Hence, for storm events is considered for runoff estimation as compare to initial abstraction because of most advancement for the period of five years. The curve number is different for different antecedent field condition. The initial abstraction (Ia) was taken as 0.2S (AMC-II) in the present study. The initial abstractions (Ia) were calculated for 5 years (2009-2013) on monthly basis (June-October) using Equation (6) for the watershed .Weighted curve number and the potential maximum soil retention (S) were calculated by using Ia values shown in Table 6.The whole process was done for six sub-watersheds of upper South Koel basin along with the composite basin area.
Thus, 0.2 aI S= (5)
The same weighted curve number (WCN) was used for run-off estimation accordingly given by Anbazhagan et al.16 by using AMC-II condition as shown in Equation (6):
2( 0.2 )
0.8
P SQ
P S
−=
+ (6)
Where Q, Actual direct run-off (mm); P, Total Rainfall (mm); S, Maximum soil retention potential mm, CN, Curve Number
By using Equation (6), run-off was calculated in the upper South koel river basin on a monthly (June to October) basis for the period of 5 years (2009-2013, and then observed run-off was estimated using linear regression equation (equation 7) and by computing all runoff value observed the specific month identify which having high runoff volume of discharge during these monsoon season. The correlation between rainfall and runoff can be estimated by obtaining a linear regression line between these two variables.17 provided the equation (7) used for regression analysis between run-off (R) and rainfall (P).
R aP b= + (7)
Where P, Rainfall (mm); R, Run-off (mm); N, No of sets of Rand P
] [22 2 2
( )( )
[ ( ]
N PR P Rr
N P P N R R
∑ ∑ ∑−=
∑ ∑ ∑− × −
Where P, Rainfall (mm); R, Run-off (mm); N, No. of sets of R and P
Table 1 Details of satellite data used in study
Data used (Satellite Image)
Sensor name Resolutions Path /row Detail of acquisition Sources
LISS III Spatial Spectral 94/37 Year Month
Band 2 to 4 4 band 2016 August BHUVAN
-23.5
ResultsBased on visual interpretation elements viz. color, size, shape,
texture and association with standard false color composite of multispectral satellite data of LISS-III nine LULC classes has been identified. The classes and their areal extent obtained as intense agriculture (143.65 2km ), sparse agriculture (148.72 2km ), Open
forest (39.59 2km ), degraded forest (46.54 2km ), Reservoir/water bodies (9.24 2km ), Fallow land (131.47 2km ), Barren land (91 2km
), Barren land rocky (80.37 2km ) and Built up urban /rural areas (81.68 2km ) as shown Figure 3 & Table 2. Soil map has been taken from NBSS mainly showing three types of soil for an area of 772
2km i.e Fine loamy, Coarse loamy and Fine soil these three classes further divided into nine classes i.e Fine loamy (Aeric Haplaquents 309.52 2km ), Coarse loamy (Haplaquents 230.02 2km ), Fine loamy (Typic Ustochrepts 91.01 2km ), Fine (Ustrochrepts 11.92 2km ), Fine
loamy(Aeric 11.09 2km sq), Fine loamy (Haplaustalfs 45.83 2km ), Fine (Vertic Ustochrepts 53.62 2km ) shown in Table 3 & Figure 4. Geology map has been also prepaired based on visual interpretation elements of LISS-III satellite data major six types of geological features has been identified in the area as Alluvium (414( 2km ), Granite Gneiss (303.4 2km ), Hornblende Schist & Amphibolite (24
2km ), Schist (26.70 2km ), metabasic Dykes (1.23 2km ) and Laterite
(3.36 2km ) (Figure 5). The entire watershed has been divided into six sub-watersheds based on drainage map prepaired by using toposheet of scale 1:50,000 (SOI) (Figure 8) i.e sub-watersheds I, II, III, IV, V and VI each sub-watershed having nine LULC classes the different classes and their areal extent shown in Table 4 & Figure 8. As curve number values lies between 0-100, the highest curve number obtained 82 for intense agriculture and minimum curve number value is 0 for water bodies and 61 for fallow land 68 for built-up area as shown
Geospatial technique for runoff estimation based on scs-cn method in upper south koel river basin of Jharkhand (India)
216Copyright:
©2017 Pandey et al.
Citation: Pandey AC, Stuti. Geospatial technique for runoff estimation based on scs-cn method in upper south koel river basin of Jharkhand (India). Int J Hydro. 2017;1(7):213‒220. DOI: 10.15406/ijh.2017.01.00037
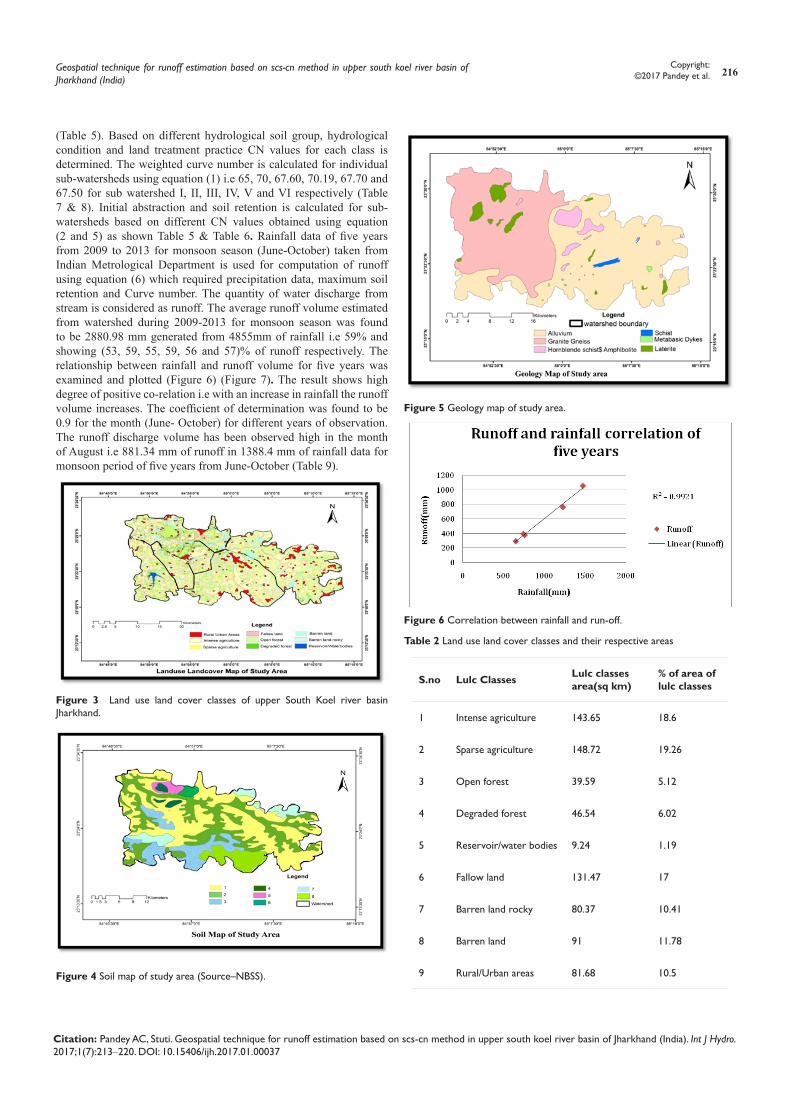
(Table 5). Based on different hydrological soil group, hydrological condition and land treatment practice CN values for each class is determined. The weighted curve number is calculated for individual sub-watersheds using equation (1) i.e 65, 70, 67.60, 70.19, 67.70 and 67.50 for sub watershed I, II, III, IV, V and VI respectively (Table 7 & 8). Initial abstraction and soil retention is calculated for sub-watersheds based on different CN values obtained using equation (2 and 5) as shown Table 5 & Table 6. Rainfall data of five years from 2009 to 2013 for monsoon season (June-October) taken from Indian Metrological Department is used for computation of runoff using equation (6) which required precipitation data, maximum soil retention and Curve number. The quantity of water discharge from stream is considered as runoff. The average runoff volume estimated from watershed during 2009-2013 for monsoon season was found to be 2880.98 mm generated from 4855mm of rainfall i.e 59% and showing (53, 59, 55, 59, 56 and 57)% of runoff respectively. The relationship between rainfall and runoff volume for five years was examined and plotted (Figure 6) (Figure 7). The result shows high degree of positive co-relation i.e with an increase in rainfall the runoff volume increases. The coefficient of determination was found to be 0.9 for the month (June- October) for different years of observation. The runoff discharge volume has been observed high in the month of August i.e 881.34 mm of runoff in 1388.4 mm of rainfall data for monsoon period of five years from June-October (Table 9).
Figure 3 Land use land cover classes of upper South Koel river basin Jharkhand.
Figure 4 Soil map of study area (Source–NBSS).
Figure 5 Geology map of study area.
Figure 6 Correlation between rainfall and run-off.
Table 2 Land use land cover classes and their respective areas
S.no Lulc Classes Lulc classes area(sq km)
% of area of lulc classes
1 Intense agriculture 143.65 18.6
2 Sparse agriculture 148.72 19.26
3 Open forest 39.59 5.12
4 Degraded forest 46.54 6.02
5 Reservoir/water bodies 9.24 1.19
6 Fallow land 131.47 17
7 Barren land rocky 80.37 10.41
8 Barren land 91 11.78
9 Rural/Urban areas 81.68 10.5

Geospatial technique for runoff estimation based on scs-cn method in upper south koel river basin of Jharkhand (India)
217Copyright:
©2017 Pandey et al.
Citation: Pandey AC, Stuti. Geospatial technique for runoff estimation based on scs-cn method in upper south koel river basin of Jharkhand (India). Int J Hydro. 2017;1(7):213‒220. DOI: 10.15406/ijh.2017.01.00037
Figure 7 Graphs showing correlation between run-off and rainfall for the monsoon months (June, July, August, September and October) calculated for a period of 5 years (2009‒2013).
Figure 8 Sub watershed map of upper South Koel river basin.
Table 3 Classes of fine loamy and coarser loamy soil and their respective areas
Soil map area statistics
S. no Classes of soil Area(sq km)
1 Fine loamy(Aeric Haplaquents) 309.52
2 Coarse loamy(Haplaquents) 230.02
3 Fine loamy(Typic Ustochrepts) 91.01
4 Fine(Ustochrepts) 11.92
5 Fine loamy(Ustrochrepts) 18.94
6 Fine loamy(Aeric) 11.09
7 Fine loamy(Haplaustalfs) 45.89
8 Fine(Vertic Ustochrepts) 53.62

Geospatial technique for runoff estimation based on scs-cn method in upper south koel river basin of Jharkhand (India)
218Copyright:
©2017 Pandey et al.
Citation: Pandey AC, Stuti. Geospatial technique for runoff estimation based on scs-cn method in upper south koel river basin of Jharkhand (India). Int J Hydro. 2017;1(7):213‒220. DOI: 10.15406/ijh.2017.01.00037
Table 4 Land use land cover classes and their respective areas of sub watersheds
Lulc Sub-watershed I
Sub-watershed II
Sub-watershed III
Sub-watershed IV
Sub-watershed V
Sub-watershed VI
Intense agriculture 20.15 7.09 8.4 50.02 60.05 10.52
Sparse agriculture 6 9.28 2 17.04 27 19
Open forest 10.28 2 2.25 8.69 10.2 6
Degraded forest 2 4.06 5.5 7 4.02 23.4
Reservoir/Water bodies 3.26 0.23 0.54 1.04 1.22 2.9
Fallow land 19.36 10.29 7.79 39.6 23.57 29.96
Barren land rocky 3.05 3.59 2.04 12 15 20.04
Barren land 15.4 7 6.1 30.69 45.7 6
Built-up(Urban/Rural) 14.4 7.07 5.51 24.68 28.91 15.94
Weighted Curve number 65 70.4 67.6 70.19 67.7 67.5
Initial abstraction(Ia) 27.32 21.35 24.34 21.57 24.22 24.96
Soil retention parameter(S),mm
136.6 106.79 121.7 107.5 121.1 124.82
Table 5 Showing land use land cover, hydrological soil group, hydrological condition, treatment practices and their estimated curve number
Land use land cover Hydrological soil group Hydrological condition Treatment practices Curve number
Intense agriculture B Good Contoured 75
Sparse agriculture C Good Contoured 82
Open forest B Good Contoured 55
Degraded forest C Fair Contoured 70
Reservoir/water bodies B Good - 0
Fallow land B Poor Straight row 61
Barren land rocky C Poor Straight row 79
Barren land B Poor - 69
Built-up (Urban/Rural) B Poor - 68
Table 6 Weighted curve number, retention parameter and initial abstraction of the upper South Koel watershed
Parameters Computed values
Weighted curve number 70
Soil retention parameter (S), mm 108
Initial abstraction (Ia), mm 21.7
Table 7 Cumulative annual rainfall and runoff of five years
Year Cumulative annual rainfall (mm)
Cumulative annual runoff (mm)
2009 760 377.51
2010 650 291.08
2011 1474.1 1057.09
2012 742.5 391.81
2013 1228.3 763.19
Table 8 Cumulative annual rainfall and runoff of sub-watersheds
Upper south koel basin Rainfall (mm) Runoff (mm) Runoff (%)
Sub watershed I 4855 2574.95 53
Sub watershed II 4855 2896.2 59
Sub watershed III 4855 2685.62 55
Sub watershed IV 4855 2887.32 59
Sub watershed V 4855 2731.39 56
Sub watershed VI 4855 2811.85 57

Geospatial technique for runoff estimation based on scs-cn method in upper south koel river basin of Jharkhand (India)
219Copyright:
©2017 Pandey et al.
Citation: Pandey AC, Stuti. Geospatial technique for runoff estimation based on scs-cn method in upper south koel river basin of Jharkhand (India). Int J Hydro. 2017;1(7):213‒220. DOI: 10.15406/ijh.2017.01.00037
Table 9 Monthly rainfall and runoff values for the duration of five years of Monsoon season of entire Watershed
2009−2013 Rainfall (mm) Runoff (mm)
June 948 598.43
July 956.3 496.12
August 1388.4 881.34
September 1141.7 725.53
October 420.6 178.97
DiscussionThe average run-off volume estimated from the watershed was
found to be 2880.98 mm generated from 4855 mm of rainfall in the upper South Koel basin i.e 59 percent of water is goes as runoff and only 41percent is infiltrate and recharge ground water. The agriculture area covers most part of the watershed (143.65 2km intense agriculture
and 148.72 2km sparse agriculture) having undulating slope and topography which results in the maximum portion of rainwater to escape as run-off and reduces water percolation and infiltration capacity which affect agricultural growth and cause drought condition. The less infiltration and more run-off is also because maximum portion of the watershed is underlain by fine (Aeric Haplaquents) soil (309.52
2km ) which has a slow water transmission and infiltration rate. Slope distribution is essential parameter as it plays a significant role in determining infiltration vs. runoff relation. Infiltration is inversely related to slope i.e. gentler is the slope, higher is infiltration and less is run- off and vice-versa. Geologic structures have great control as they influence the nature of flow, erosion and sediment transportation. Hard granitic rocks in the basement under shallow soil cover and weathered zone in the study area allows less water to percolate down to the aquifers and therefore major component of rainwater escapes as run-off, thus a large amount of rainwater is vanished as run-off resultant into higher total run-off volume per year causing ground water level depletion in the region of the order of 2.5m per year (CGWB). The geology, extent and type of vegetation cover determines to a large extent the infiltration capacity of the soil and hence the run-off volume.1 Watershed is divided into major six sub- watersheds i.e sub-watersheds (I,II,III,IV,V and VI) having runoff (53,59,55,59,56,57)% respectively in which sub-watersheds II and IV having high runoff i.e 59% covered with fallow land as the major class (10.29 and 29.96 respectively) and comprised of fine loamy (Typic Ustochrepts) soil and relief is in between 615-650 m because of high runoff in these areas agricultural land may be converted into fallow land. These sub-watersheds must required proper implementation plan to reduce runoff and increase ground water prospect as hydrological harvesting structure construction such as farm ponds, check dams and nala bunds etc in future to combat drought. Coefficient of determination was found to be 0.9 for the months (June-October) for different years of observation which shows high degree of positive correlation i.e with an increase in rainfall, the total runoff volume increases. The resulted observed run-off estimation using SCS-CN is validated with the observed run-off in different studies. Tejram et al.18 estimated good correlation between rainfall and run-off of the Uri river watershed in the lower Narmada basin of Central India using SCS-CN model. The present study also shows similar type of result and exhibit a good correlation between observed rainfall and run-off.19 Also estimated
total runoff of Jharkhand covering Ranchi and Lohardagga district having rainfall of 1400mm per year and remarked that 60% goes as runoff and only 40% infiltrate and recharge ground source of water. Our study also shows that in Lohardagga district comprising a part of watershed covering an area of about 772 sq km having 2880.98mm of runoff out of 4855 mm of monsoon rainfall i.e 59% of water goes as runoff and about 41% infiltrate and recharge ground water, validating present runoff computation for study area.20‒23
ConclusionThe present study accurately estimated the total run-off generated
in the upper South Koel watershed. Estimation over six sub watersheds helped to quantify the total amount of run-off expected from the individual watershed annually so that runoff could be stored in the suitable recharge structures. The rainfall-run-off modeling using the SCS-CN method showed that the run-off generated in the basin is high over the past 5 years with 2880 mm of runoff generated from 4855 mm of rainfall recorded during the monsoon season (June-October) in which sub watershed II and IV showing high runoff. This entails setting up of various water harvesting structures as per prioritization based on high runoff area, ground water deficit zone considering various drainage morphometric parameters. Less availability of water for domestic and drinking purposes entails building recharge structures to store the run-off water and to provide life saving irrigation facility during agricultural drought as well recharging of aquifers in the watershed.
AcknowledgmentNone.
Conflict of interestAuthors declare there is no conflict of interest in publishing the
article.
References1. Tripathi RP, Singh HP. Soil erosion and conservation. New Age
International Limited Publication, India; 2001. p. 1‒210.
2. Gupta PK, Panigrahy S, Parihar JS. Impact of Climate Change on Runoff of the Major River Basins of India Using Global Circulation Model (HadCM3) Projected Data. Journal of the Indian Society of Remote Sensing. 2011;39:337−339.
3. Sarangi A, Madramootoo CA, Enright P, et al. Performance evaluation of ANN and geomorphology based models for runoff and sediment yield prediction for a Canadian watershed. Current Science. 2005;89(12):2022‒2033.
4. Soil Conservation Service. Hydrology. National Engineering Handbook, USA; 1985.
5. Srinivas D, Sivaprasad V, Narsimham ML, Ranganna G. Velocity of modified US, SCS method for forested catchments in Sitamadi basin, Karnataka India. Journal of Applied Hydrology.1996.
6. Hariprasad V, Chakraborti AK. Management of small watersheds using hydrologic modeling and GIS. International Conference on Remote Sensing and GIS/GPS. 1997;16−19.
7. Nayak TR, Jaiswal RK. Rainfall-runoff modelling using satellite data and GIS for Bebas River in Madhya Pradesh. IE (I) Journal 2003;84:47‒50.
8. Soil Conservation Service. Hydrology. National Engineering Handbook, USA; 1972. p. 1−127.

Geospatial technique for runoff estimation based on scs-cn method in upper south koel river basin of Jharkhand (India)
220Copyright:
©2017 Pandey et al.
Citation: Pandey AC, Stuti. Geospatial technique for runoff estimation based on scs-cn method in upper south koel river basin of Jharkhand (India). Int J Hydro. 2017;1(7):213‒220. DOI: 10.15406/ijh.2017.01.00037
9. Chatterjee C, Jha R, Lohani AK, et al. Runoff curve number estimation for a basin using remote sensing and GIS. Asian Pacific Remote Sensing and GIS Journal. 2001;14:1‒7.
10. Bhuyan SJ, Mankin KR, Koelliker JK. Watershed scale AMC selection for hydrologic modeling. Transactions of ASAE. 2003;46(2):303−310.
11. Bhuyan SJ, Koelliker JK, Barnes PL. Modification of curve number adjustment technique for prediction of runoff. In: Ascough IIJC & Flanagan DC, editors. Presented in Soil Erosion Research for the 21st Century, Proceedings of the International Symposium, USA; 2001. p. 1‒290.
12. Pandey A, Sahu AK. Generation of curve number using remote sensing and geographic information system. Water Resources. India; 2002.
13. Pandey A, Pandey S, Nathawat MS. Drought hazard assessment using geoinformatics over parts of Chotanagpur plateau region, Jharkhand, India. Natural Hazards. 2012;63(2):279−303.
14. Gupta PK, Panigrahy S. Geo-spatial modeling of runoff of large land mass: analysis, Approach and results for major river basins of India. The International Archives of the Photogrammetry, Remote Sensing and Spatial Information Science. 2008;37:1‒6.
15. Jasrotia AS, Dhiman SD, Aggarwal SP. Rainfall-Runoff and Soil Erosion Modeling using Remote Sensing and GIS Technique- A Case Study of Tons Watershed. Journal of the Indian Society of Remote Sensing. 2002;30(3):167−180.
16. Anbazhagan S, Ramasamy SM, Das GS. Remote sensing and GIS for artificial recharge study, runoff estimation and planning in Ayyar basin, Tamil Nadu, India. Environmental Geology. 2005;48(2):158‒170.
17. Subramanya S. Engineering Hydrology, Tata McGraw-Hill Publishing Company Limited, India; 2006. p. 1−148.
18. Tejram N, Verma MK, Hema BS. SCS curve number method in Narmada basin. International Journal of Geomatics and Geosciences. 2012;3(1):219‒228.
19. Hazra M, Avishek K. Water resources evaluation through water accounting. A means to achieve sustainable development .J Life science. 2010;1:43−50.
20. Jacobs JH, Srinivasan R. Effects of curve number modification on runoff estimation using WSR-88D rainfall data in Texas watersheds. Journal of Soil and Water Conservation. 2005;60(5):274‒279.
21. Pravin R, Kumar U. Geomorphometric Characterization of Upper South Koel Basin, Jharkhand: A Remote Sensing & GIS Approach. Journal of Water Resource and Protection. 2012;4(12):1042−1050.
22. Patil JP, Sarangi A, Singh AK, et al. Evaluation of modified CN methods for watershed runoff estimation using a GIS-based interface. Biosystems Engineering. 2008;100(1):137‒146.
23. Tripathy MP, Panda RK, Pradhan S, et al. Runoff Modelling of a Small Watershed Using Satellite Data and GIS. Journal of the Indian Society of Remote Sensing. 2002;30(1−2):39−52.
![lewg ‘x’ ,oa - KopyKitab€¦ · lewg ‘x’ ,oa ‘? ... œ`ksu # 0522–4109080 ... v˙;fFkZ;kÍ d`k p;u Ldz`hfuax ijh{kk] f¥f[r ijh{kk] O;kogkfjd` ijh{kk ,oa](https://img.pdfslide.us/doc/110x75/5ae654387f8b9a3d3b8d0f63/lewg-x-oa-kopykitab-lewg-x-oa-oeksu-05224109080.jpg)


![Unit Hydrograph (UNIT-HG) Model · RUNOFF#0 – RUNOFF#N Where N= RUNOFF_UNIT Units for RUNOFF State Variables [mm or in] Sample States File: RUNOFF#0=0.0 RUNOFF#1=0.0 RUNOFF#2=9.0](https://img.pdfslide.us/doc/110x75/5ece307d6bbfcd2591178fc8/unit-hydrograph-unit-hg-model-runoff0-a-runoffn-where-n-runoffunit-units.jpg)


![Comparison of rainfall runoff simulation by SCS- CN and NAM model in Shipra …2019. 8. 26. · (Das, 2012) [4]. Important need of rainfall runoff modelling for practical problem in](https://img.pdfslide.us/doc/110x75/6149d24f12c9616cbc6902f5/comparison-of-rainfall-runoff-simulation-by-scs-cn-and-nam-model-in-shipra-2019.jpg)


![Ijh]jZffZ ijZdlbdb](https://img.pdfslide.us/doc/110x75/6196e6399e4f683d7e750a00/ijhjzffz-ijzdlbdb.jpg)


![ijh dlZo Mfguc]hjh^](https://img.pdfslide.us/doc/110x75/6178408b2d304375647d2cf7/ijh-dlzo-mfguchjh.jpg)