Embed Size (px)
Citation preview
i
Geospatial Data Analysis and
Mapping for Financial
Inclusion Report FINANCIAL SECTOR DEVELOPMENT PLAN SUPPORT
PROJECT (Grant No. 662)
Joseph Kandeh, Ph.D.
Consultant, Geospatial Technical Analyst
30th November 2017

ii
for International Development under Contract No. 497-M-00-05-00005-00. Project Location Sierra Leone
Contract Number: BSL/FSDPSP/2016/0016
Project start date: 12 September 2017
Project end date: 30 November 2017
Consultant: Joseph Kandeh, Ph.D.
Postal address: 12 Sam Sumana Drive, IMATT, Freetown
Telephone +232 79 627 956 / +232 30 748 040
Email: [email protected]
iii
Table of Contents
FIGURES VI
TABLES VIII
ACRONYMS 1
EXECUTIVE SUMMARY 2
1. BACKGROUND 4
1.1 SCOPE OF WORK 5
2. METHODOLOGY 6
2.1 TRAINING. 6
2.2 FIELD SURVEY. 6
2.3 DATABASE DEVELOPMENT 9
2.4 ANALYSIS AND ANALYTICS 10
2.4.1 DATA PROCESSING 10
2.4.3.3 DISSEMINATION 12
2.5 ACCESS POINTS (AP) MAPPING SYSTEM DEVELOPMENT 13
3 RESULTS 14
3.1 KEY FINDINGS 14
3.2 NATIONAL OVERVIEW OF FINANCIAL SERVICES 16
3.3 ANALYSIS OF ACCESS POINTS BY TYPE 19
3.4 MAPPING ACCESS POINTS WITH KEY SECONDARY DATA 21
3.4.1 ACCESS POINTS AND POPULATION DENSITY 21
3.4.2 ACCESS POINTS AND EMPLOYED POPULATION 23
3.4.3 ACCESS POINTS AND LITERATE POPULATION 24

iv
3.4.5 ACCESS POINTS AND TELEPHONE COVERAGE 25
3.4.6 ACCESS POINTS AND ROAD NETWORK 27
3.5 UNDERSERVED AREAS 28
3.6 ANALYSIS OF FINANCIAL INCLUSION INDICATORS 29
3.6.1 ACCESS DIMENSION 29
3.5.2 USAGE DIMENSION 30
3.7 CHIEFDOM ANALYSIS OF ACCESS POINTS 31
3.6 INTERACTIVE WEB MAP 31
4 CHALLENGES AND LESSONS LEARNED 33
4.1 KEY CHALLENGES 33
4.1.1 CHALLENGES BEFORE THE SURVEY 33
4.1.2 CHALLENGES DURING THE SURVEY 33
4.2 OVERALL CHALLENGES 34
4.2.1 ACCESS TO SUPPLY-SIDE DATA, TIMELINESS AND OVERALL DATA CHARACTERISTICS 34
4.2.2 OVERLAPS AND GAPS IN ADMINISTRATIVE BOUNDARIES 34
4.2.3 MISMATCH BETWEEN DATASETS (ATTRIBUTE AND SPATIAL DATASETS) 35
4.3 LESSONS LEARNED 35
5 CONCLUSIONS AND RECOMMENDATIONS 36
5.1 CONCLUSIONS 36
ANNEXES 39
ANNEX 1: TERMS OF REFERENCE 39
ANNEX 2: FINANCIAL INCLUSION INDICATOR CALCULATION 42
ANNEX 3: NATIONAL OVERVIEW 43
ANNEX 4 DATA COLLECTION TOOL 46

v
ANNEX 5: AREA THAT NEED EXPANSION 50
ANNEX 6 SCREEN SHOOT OF THE WEB MAP 51

vi
Figures
Figure 1: Geospatial data analysis and mapping methodology ........................................ 6
Figure 2: Distribution of Enumerators and Supervisors, and an Enumerator using the data
collection tool ............................................................................................................... 9
Figure 3: Access Points to economically active population ............................................ 15
Figure 4: Access Points to economically active population ............................................ 15
Figure 5: Distribution of Access Points per district .......................................................... 16
Figure 6: Spatial distribution of Access Points at district level ........................................ 17
Figure 7: Percent contribution of Access Points per district ............................................ 17
Figure 8: Points: Chiefdom with and without Access ...................................................... 18
Figure 9: Chiefdom without access points ....................................................................... 19
Figure 10:Breakdown by access points ........................................................................... 19
Figure 11: Distribution of Access Points by type and district .......................................... 20
Figure 12: Per capital information for Commercial Banks ............................................... 21
Figure 13: Access Points and population density............................................................ 22
Figure 14: Access Points and Adult Population .............................................................. 23
Figure 15: Access Points and Adult population employed .............................................. 24
Figure 16: Access Points and literate population ............................................................ 24
Figure 17: Access Points and Mobile Phone subscription .............................................. 25
Figure 18: Access Points and Mobile Phone subscription .............................................. 26
Figure 19: Access Points and Mobile Phone coverage................................................... 26
Figure 20: Access Points and Road Network .................................................................. 27
Figure 21: Areas for possible future expansion ............................................................... 28
Figure 22: Supply-Demand Ratio Map ............................................................................ 29

vii
Figure 23: Supply-Demand chart ..................................................................................... 30
Figure 24: Chiefdom assessment of access to financial services .................................. 31

viii
Tables
Table 1: Commercial Banks Worksheet 10
Table 2: Breakdown of Access Points 14
1
ACRONYMS
AP Access Point
FAP Financial Access Point
AFI Alliance for Financial Inclusion
ATM Automatic Teller Machine
BSL Bank of Sierra Leone
FSA Financial Services Association
GIS Geographic Information System
SSL Statistics Sierra Leone
WB World Bank
2
EXECUTIVE SUMMARY
Geospatial mapping of financial access point is critical but important in the identification
of areas that are under and over served. It is considered important because it provide the
bases for financial expansion. The Geospatial Data Analysis and Mapping for Financial
Inclusion Project (BSL/FSDPSP/2016/0016) aimed at mapping existing financial access
points and identifying areas that are underserved. Forty data collectors were deployed
across the sixteen political districts to collect geographic coordinates and attribute data
from each identified financial access points including Banks, Automatic Teller Machine,
Financial Services Association, Community Banks, Microfinance Institutions, Foreign
Exchange Bureaus, Point of Sales, and Mobile Money Agents.
One thousand eight hundred and eleven (1,811) access points were mapped
during the five weeks field work. Seventy-five (75%) are Mobile Money Agents (Orange
Money making up 74% of the total) followed by Microfinance Institutions (7%),
Commercial Banks (6%), and Foreign Exchange Bureaus (6%). Financial Services
Association, ATMs, and Community Banks account for the remaining 6%. Aggregate
figures show that Western Urban has the highest number of FAP (475, 26%), followed by
Bo District (276, 15%). Sixty-seven (67%) percent of financial access points are
concentrated in Western Urban, Bo, Kenema, and Bombali districts, making these the
main hub for financial services in Sierra Leone. Falaba, Karene, Koinadugu, Pujehun,
and Kambia make up the bottom five of the financial services accounting for about 6
percent.
More than half of the chiefdoms in Tonkolili, Falaba, Karene, Kambia, and Port
Loko districts (combined) do not have APs. Out of 207 chiefdoms, 86 (42%) are without
APs. The 86 chiefdoms without are found in all the districts except Western Urban and
Western Rural. Tonkolili district has the highest number chiefdoms without an access
point. Of the 82 chiefdoms, 62 percent of them are in Tonkolili, Falaba, Karene, Bo, Port
Loko, and Pujehun. The chiefdoms without access points reveal an interesting pattern;
they tend to be clustered together. In Falaba, Karene, and Kambia, they are more at the
border between Sierra Leone and Guinea suggesting that the population in those location
access financial access points or travel to the nearest chiefdom with the required access

3
point. The analysis revealed that in Bo, Pujehun, and Port Loko, chiefdoms without
access points are small in area size.
In addition, an interactive map has been developed that displays a comprehensive visual
representation of the landscape of financial access points in Sierra Leone.
4
1. BACKGROUND
Existing research recognises that approximately 4 billion people living in developing
countries and emerging economies do not have access to financial services including
savings, insurance and credits.1 In Sierra Leone, less than 15 percent of Sierra Leoneans
have an account at a financial institution (See TOR in Annex 2). The low financial access
could in part be explained by the refusal of formal financial intermediaries including
commercial banks to serve poor households and micro-enterprises. The refusal of
financial institutions to serve certain areas suggest that they are ignoring the enormous
potential of entrepreneurships of that stratum of society. Evidence suggest that access to
financial services will stimulates self-development through entrepreneurship and
independence of households.2 Moreover, access to financial services is a critical and
important step in connecting the rural poor to economic life. Access to financial services
help build the confidence of the poor to play a role in the national economy.
Given that access to financial services particularly for the rural poor could play an
important role in alleviating poverty, the identification of underserved areas is critical for
financial inclusion. Identification of underserved areas for the most part is informed by
geospatial mapping of financial services. Unlike Sierra Leone, geospatial mapping of
financial access points (AP) for financial inclusion landscape has been carried out in
several countries in Asia, Americas and Africa including Nigeria, Ghana, Senegal, Ivory
Coast, and Benin. In mapping financial access points for financial inclusion, data from the
supply and demand side are important. Whilst these two data streams are for the most
part available in other developing countries, the situation is quite different in Sierra Leone.
Given the growing demand for financial expansion in Sierra Leone, with support from the
World Bank, the Geospatial Data Analysis and Mapping for Financial Inclusion Project
(BSL/FSDPSP/2016/0016) was design to address the gap.
1 Sjauw-Koen-Fa, A., & Vereijken, I. (2005). Access to financial services in developing countries. Rabobank Nederland,
September, 1-32. 2 Karmakar, K., Banerjee, G., & Mohapatra, N. (2011). Towards financial inclusion in India: SAGE Publications India.
5
1.1 Scope of Work
1. To map out current and potential access points
2. To overlay Access Points with population, economic activity, financial behaviors,
telephone networks, postal offices, and other parameters.
3. To identify underserved areas and areas ready for financial service expansion and
optimum/maximized opportunities.
4. Provide information that will help assess the strategic placement of current and
potential financial products and access channels and, potentially build a business
case for reforms and the expansion of products and services in new areas.
6
2. METHODOLOGY
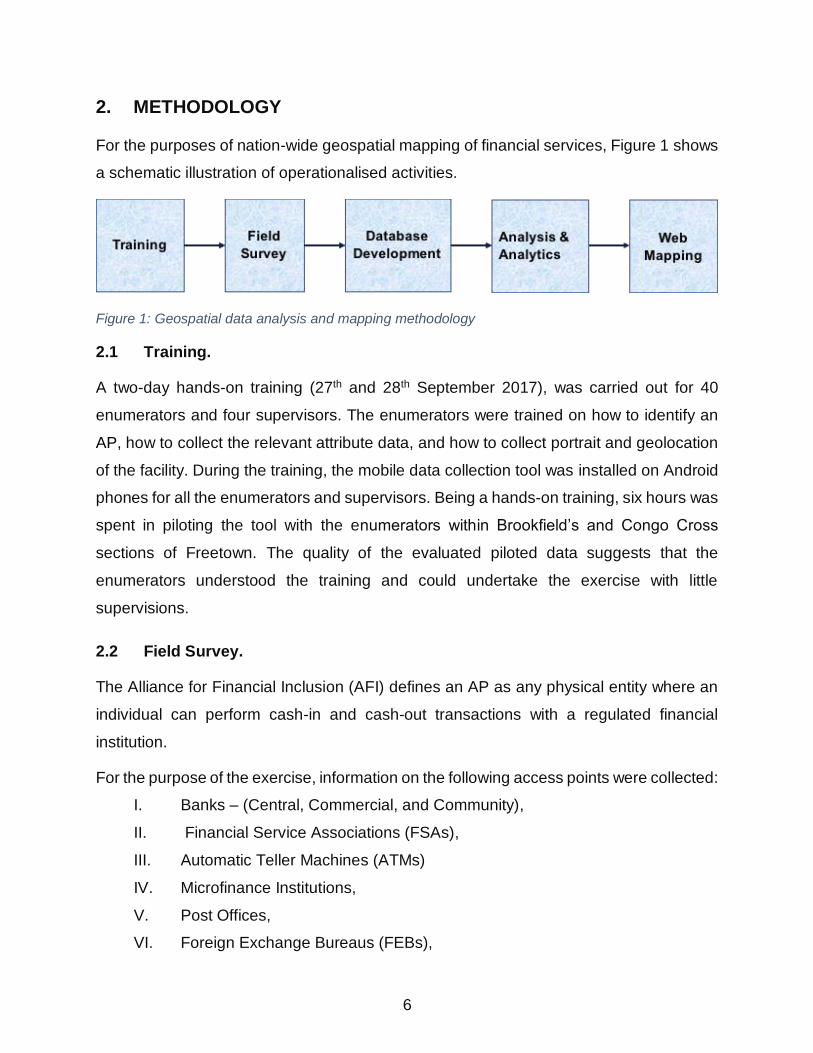
For the purposes of nation-wide geospatial mapping of financial services, Figure 1 shows
a schematic illustration of operationalised activities.
Figure 1: Geospatial data analysis and mapping methodology
2.1 Training.
A two-day hands-on training (27th and 28th September 2017), was carried out for 40
enumerators and four supervisors. The enumerators were trained on how to identify an
AP, how to collect the relevant attribute data, and how to collect portrait and geolocation
of the facility. During the training, the mobile data collection tool was installed on Android
phones for all the enumerators and supervisors. Being a hands-on training, six hours was
spent in piloting the tool with the enumerators within Brookfield’s and Congo Cross
sections of Freetown. The quality of the evaluated piloted data suggests that the
enumerators understood the training and could undertake the exercise with little
supervisions.
2.2 Field Survey.
The Alliance for Financial Inclusion (AFI) defines an AP as any physical entity where an
individual can perform cash-in and cash-out transactions with a regulated financial
institution.
For the purpose of the exercise, information on the following access points were collected:
I. Banks – (Central, Commercial, and Community),
II. Financial Service Associations (FSAs),
III. Automatic Teller Machines (ATMs)
IV. Microfinance Institutions,
V. Post Offices,
VI. Foreign Exchange Bureaus (FEBs),
7
VII. Discount & Home Mortgage Houses,
VIII. Capital Markets,
IX. Point of Sales,
X. Leasing Companies, and
XI. Mobile Money Agents.
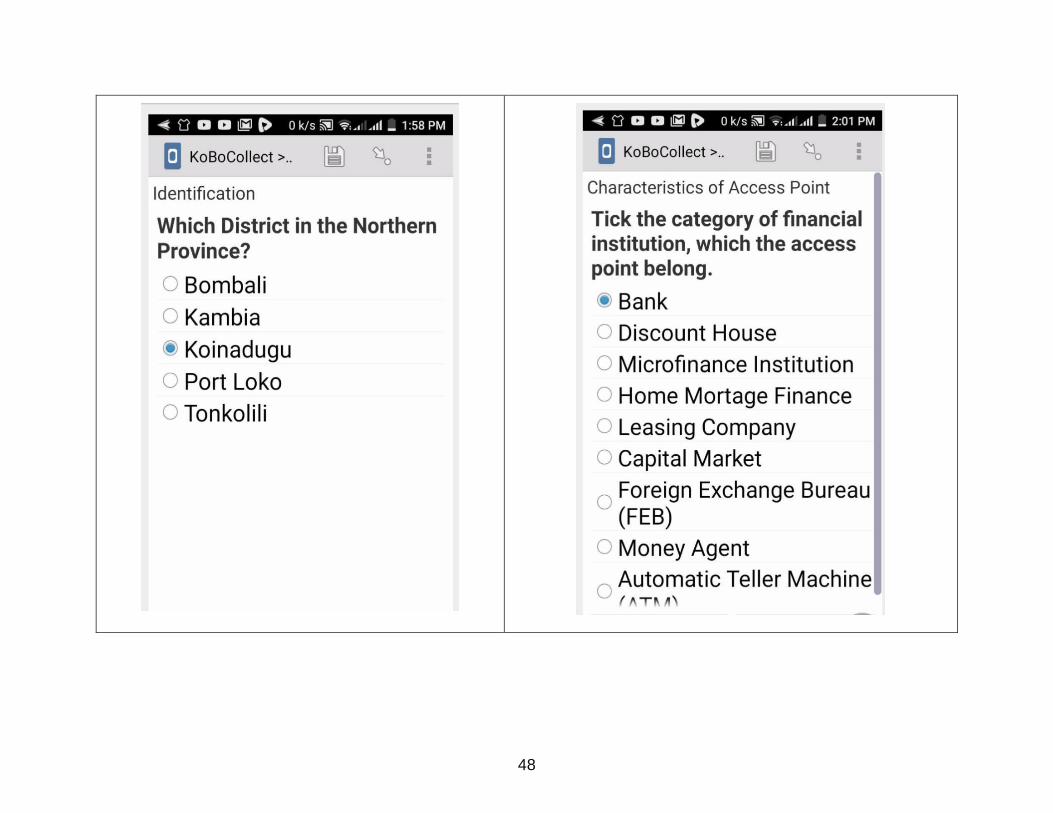
For each of the access points, the following attribute information were collected:
I. Location, this include the region, district and town/village
II. Category of AP (whether a bank, foreign exchange bureau money agent, etc.)
III. AP type; e.g. Head Office or Branch,
IV. If Commercial Bank, the name of the commercial bank. e.g. Sierra Leone
Commercial Bank, Rokel Commercial Bank, etc.,
V. For ATMs, whether off-site or attached to either head office or branch office
VI. Date & time of data collection,
VII. Picture of the AP,
VIII. GPS Coordinate of the AP
The Field Survey commenced on October 2nd, 2017 and lasted for five weeks. The
enumerators and supervisors were deployed as shown in Figure 2. Within each region,
each enumerator was assigned to a district. However, in the case of urban areas like
Freetown, Bo, Kenema, and Makeni, a number of enumerators were assigned. Within
each urban setting, enumerators were assigned to specific areas bounded by principal
streets that could be easily identified.
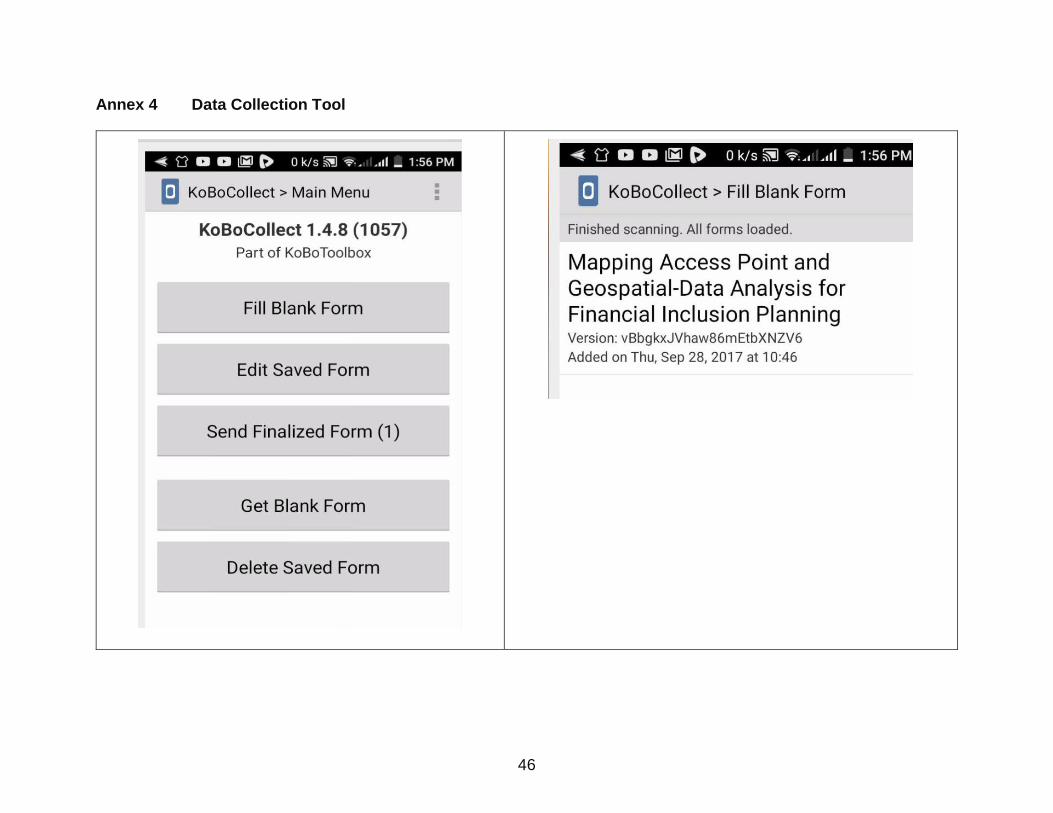
Each access point was assigned a unique ID. Given that KoboCollect provides an
opportunity to collect data offline, data collected on each AP were saved and later sent to
the KoboCollect server. On a daily basis, data on the server were checked by the
database administrator for consistency, omission and missing data. For accuracy
purposes, GPS readings above 10 meters threshold were rejected. In such situation, the
enumerator was asked to redo the AP in question.
In addition to the primary data, the following secondary data were acquired;
a) Statistics Sierra Leone (SSL):
• 2015 population at district and chiefdom level,

8
• Registered businesses at chiefdom level,
• 2015 Socio-economic data; Literacy, Employment rate, rural population, and
poverty data at chiefdom level,
• GIS Map layers;
o Administrative boundaries; Admin 1, 2, 3, 4, and 5
o Settlements, and
o Roads
b) Humanitarian Data Exchange - a number of other datasets on Sierra Leone such as
telephone coverage were sourced.
c) Bank of Sierra Leone - the following supply-side data was requested from Banking
Supervision:
• Number of bank accounts by bank by district
• Number of loans by bank by district
• Number of SMEs accounts by district
• Number of loans by SMEs by district

9
Figure 2: Distribution of Enumerators and Supervisors, and an Enumerator using the data collection tool
2.3 Database development
With the approval of the Data Administrator, data was downloaded from the KoboCollect
server into Microsoft Excel and Comma-separated values (CSV) file format and further
cleaned. The GPS coordinates of the Access Points allow it to be aggregated at both
district and at chiefdom levels representing the two units of analysis of the study.
A database of the Access Points was developed in Microsoft Excel. The Excel is
composed of several worksheets with each category of Access Point placed in separate
worksheet as shown below. The “Introductory” worksheet provides the Metadata.
Table 1 is a screenshot of the “Commercial Banks” worksheet. As new commercial banks
or other APs are established, the details will be added to the Excel database in addition
to updating the interactive map.

10
Table 1: Commercial Banks Worksheet
2.4 Analysis and Analytics
Bearing in mind the limited period of the study and data paucity particularly with regards
to supply-side data, the analytical framework focused on four components;
• Data Processing,
• Desktop Mapping,
• Financial Inclusion Indicator Analysis, and
• Interactive Web Mapping
2.4.1 Data Processing
Within this phase, data on the key secondary data, and supply-side data at district and
chiefdom level are processed to ensure that there is a value for each district and
chiefdom. In addition, the following socio-economic indicators were selected from the
2015 Sierra Leone Integrated Household Survey Census data: educational attainment,
rural population, and poverty. The purpose of the socio-economic analysis was to find out
if there is a relationship between socio-economic characteristics of a population and
locality with or without an AP. The attributes of the Access Points are then combined with
those of the secondary (including socio-economic data) and supply-side data through the
use of either the district code or the chiefdom code. With this approach, each record in
the Excel file had data on the attribute information of each Access Points combined with
the following secondary data; 2015 total population, adult population, number of
businesses registered, literate population, mobile subscribers, population employed, and

11
poverty. Using the total number Access Points and adult population for each
administrative unit, indicators of Financial Inclusion were generated.
2.4.2 Desktop Mapping and analysis
The processed Access Point data combined with secondary data and the generated
indicators at district and chiefdom level were taken into ArcGIS 10.4 for Desktop and
converted into Shapefile, the data format for mapping. District and a chiefdom Shapefiles
were created. The two units of analysis are used here because some of the data are only
represented at district and not at chiefdom level. In ArcGIS 10.4, the point data on AP
are overlaid with the various secondary data and derived indicators to create several
maps showing the distribution of Access Points at the two geographies (district and
chiefdom).
The overarching goal was:
I. To map current access points in Sierra Leone,
II. Identify underserved areas, and areas for financial service expansion
III. Provide several map overlays with key secondary data
The maps and analytics developed are shown in the result section of this report.
2.4.3 Financial Inclusion Indicator Analysis
The study also looked at two dimensions of financial inclusion: access and usage of
financial services3. Equation used to calculate these indicators are shown in Annex 2
2.4.3.1 Access Dimension
The Alliance for Financial Inclusion refers to “access” as the ability to use the services
and products offered by formal financial institutions. Under here, we identify and analyze
potential barriers to opening, using and accessing a financial access point such as a bank
account, such as cost or physical proximity of bank service points (branches, ATMs, etc.).
3 Measuring Financial Inclusion – Core Set of Financial Inclusion Indicators, Financial Inclusion Data Working Group (FIDWG), Guideline Note No.4, March 2013.
12
The following access indicators were used:
• Number of access points per 10,000 adults at a national level segmented by type
and administrative unit
• Percentage of administrative units with at least one access point
• Percentage of total population living in administrative units with at least one access
point
An adult here refers to anyone aged 15 years and above. Based on data availability, the
administrative unit of analysis selected are district and chiefdom. Most of the data are at
chiefdom level.
2.4.3.2 Usage dimension
The AFI refers to “usage” as the depth or extent of financial services and products use.
Unlike Access dimension, usage indicators are derived from Supply-side data. However,
data on the following indicators were not available to inform the analysis.
Indicator 2.1: Number of deposit accounts per 10,000 adults, and by administrative unit
Indicator 2.2: Number of loans per 10,000 adults, and by administrative unit
Indicator 2.3: Number of SME accounts per 10,000 adults, and by administrative unit
Indicator 2.3: Number of SME loans per 10,000 adults, and by administrative unit
Data on accounts and loans were either not disaggregated at district level or not
comprehensive enough. Due to the data paucity, the number of registered businesses
was used as a proxy indicator in assessing usage.
2.4.3.3 Dissemination
Using Tableau software10.4, and Adobe Illustrator CS6, the results of the analysis and
analytics are visualized. A number of interactive dashboards have been created in
Tableau 10.4 and published in Tableau Public with the links to be embedded in the
website of Bank of Sierra Leone. As the underlying data change, the published interactive
dashboards will automatically change.
In addition to static maps produced using ArcGIS 10.4 Desktop, a number of static
analytics describing the landscape of the financial access points have been produced

13
using Adobe Illustrator CS6. The analytics will also be published on the website of Bank
of Sierra Leone. In this report, only static analytics and maps are embedded.
2.5 Access Points (AP) Mapping System development
Using ArcGIS online, an interactive Web Map has been developed. ArcGIS Online is a
cloud base server that supports collaborative mapping. A cloud based server was chosen
due to lack of the requisite infrastructure and technical capacity to host and maintain the
system at BSL.
With the data on Access Points as Shapefiles within ArcGIS Desktop, these were
exported in zipped format into the map viewer of ArcGIS Online and symbolized. The
ArcGIS Online is an interactive map platform to visualize the geography of financial
Access Points in Sierra Leone. Clicking on an Access Point in the platform, will pop-up a
window on the screen revealing summary information on that Access Point in terms of
where it is located; district, and chiefdom, and the services it renders.
14
3 RESULTS
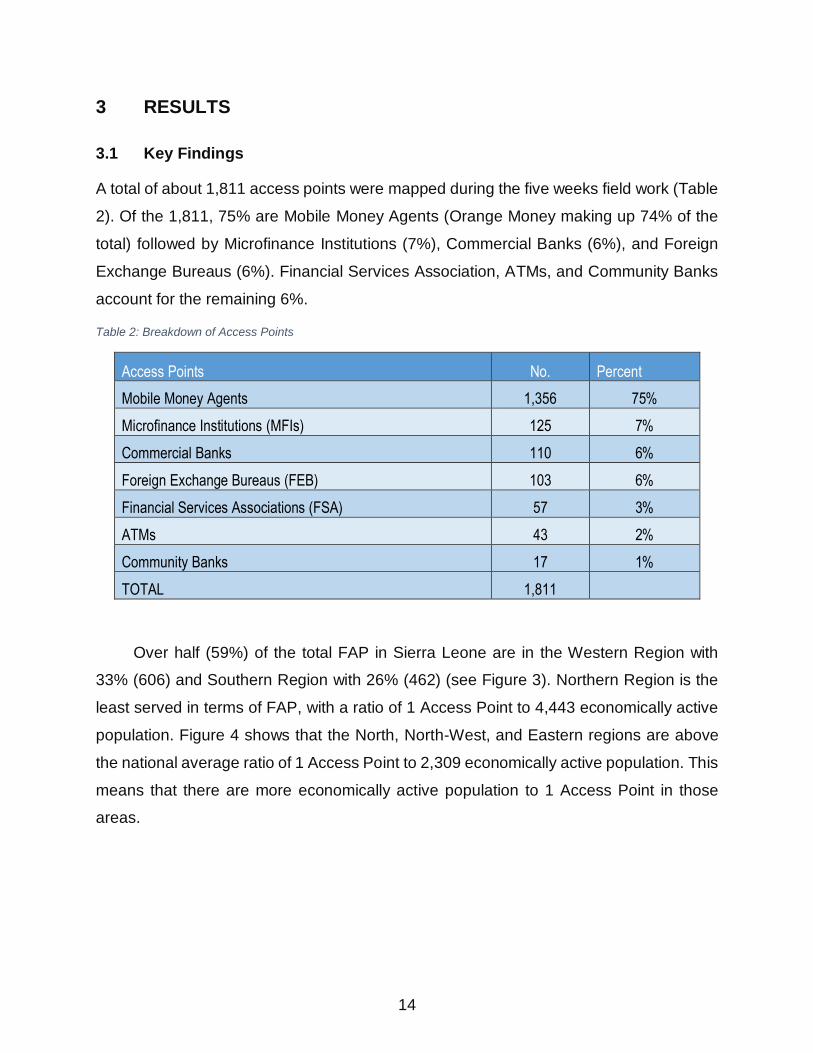
3.1 Key Findings
A total of about 1,811 access points were mapped during the five weeks field work (Table
2). Of the 1,811, 75% are Mobile Money Agents (Orange Money making up 74% of the
total) followed by Microfinance Institutions (7%), Commercial Banks (6%), and Foreign
Exchange Bureaus (6%). Financial Services Association, ATMs, and Community Banks
account for the remaining 6%.
Table 2: Breakdown of Access Points
Access Points No. Percent
Mobile Money Agents 1,356 75%
Microfinance Institutions (MFIs) 125 7%
Commercial Banks 110 6%
Foreign Exchange Bureaus (FEB) 103 6%
Financial Services Associations (FSA) 57 3%
ATMs 43 2%
Community Banks 17 1%
TOTAL 1,811
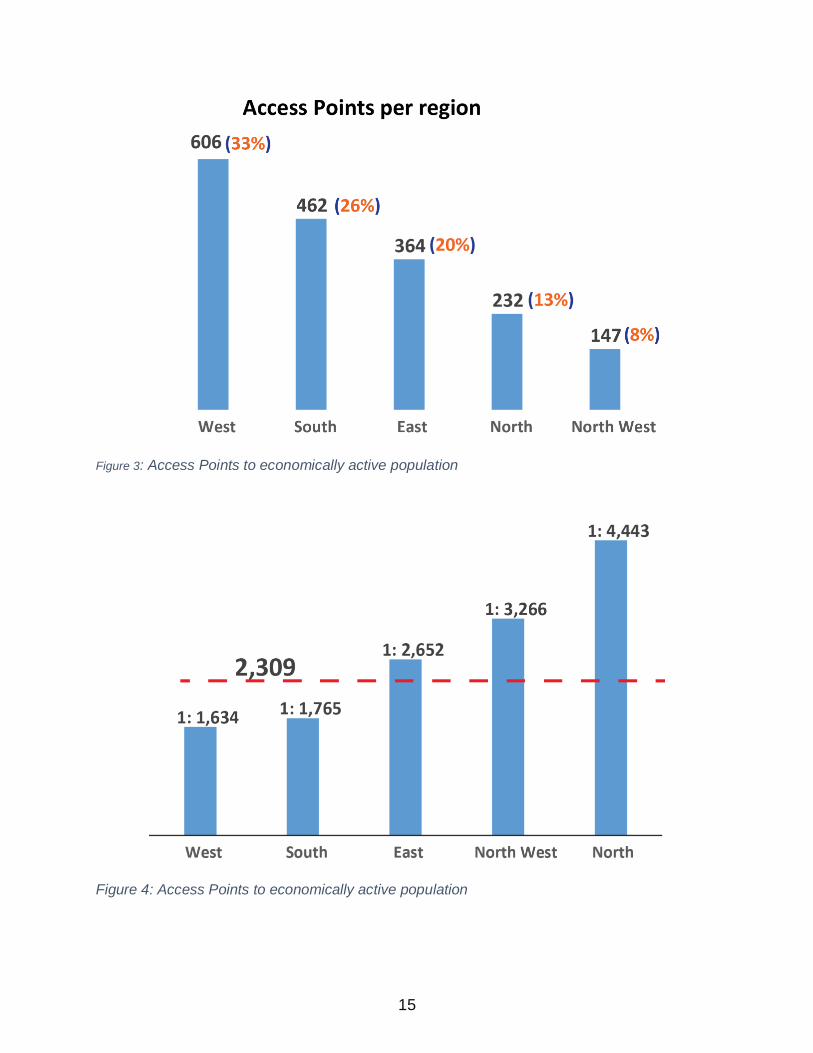
Over half (59%) of the total FAP in Sierra Leone are in the Western Region with
33% (606) and Southern Region with 26% (462) (see Figure 3). Northern Region is the
least served in terms of FAP, with a ratio of 1 Access Point to 4,443 economically active
population. Figure 4 shows that the North, North-West, and Eastern regions are above
the national average ratio of 1 Access Point to 2,309 economically active population. This
means that there are more economically active population to 1 Access Point in those
areas.
15
Figure 3: Access Points to economically active population
Figure 4: Access Points to economically active population
16
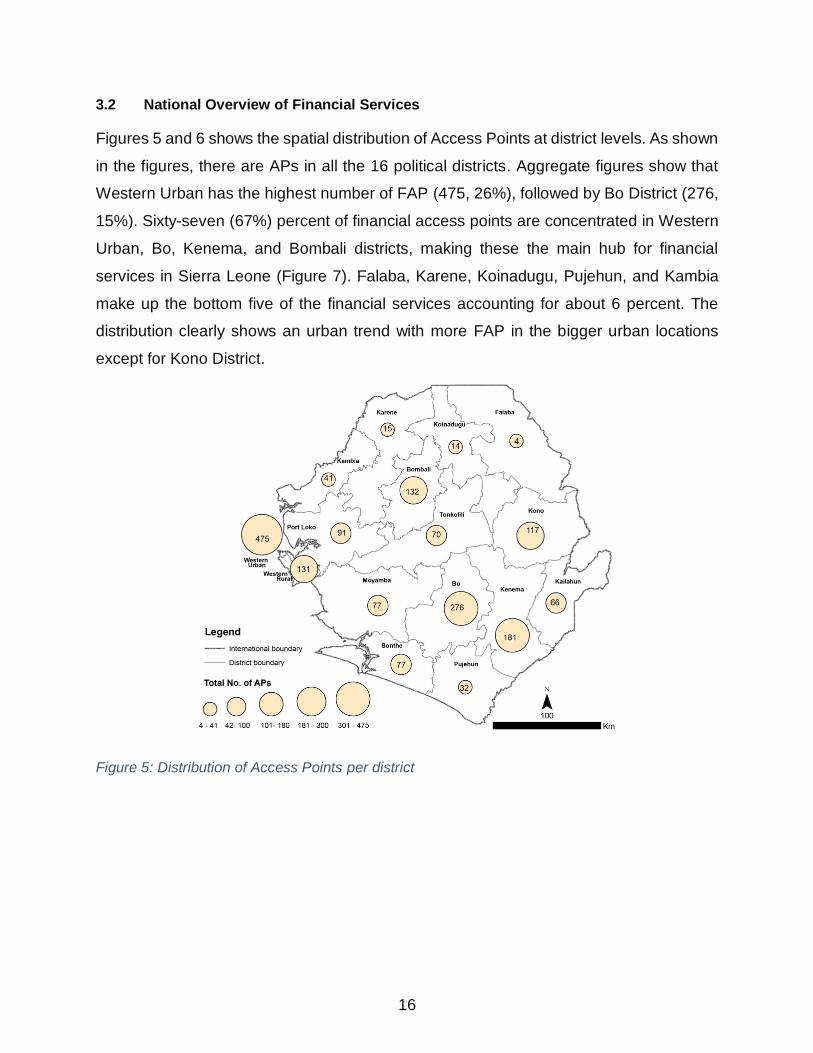
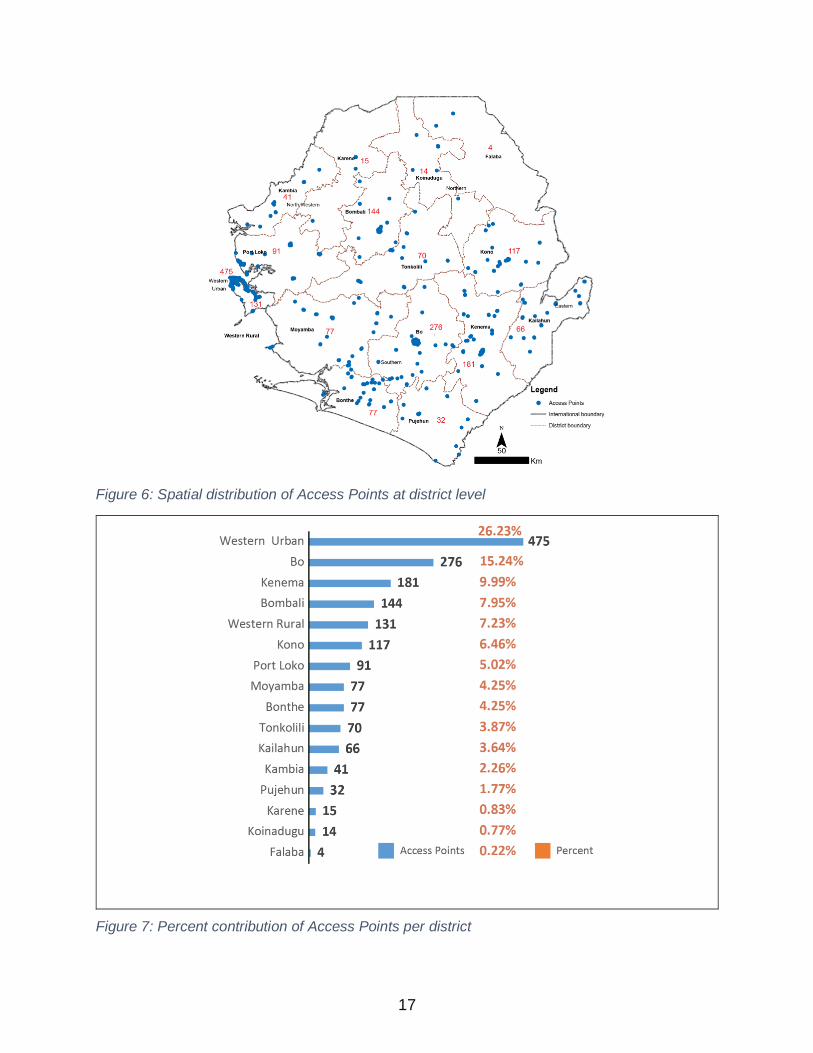
3.2 National Overview of Financial Services
Figures 5 and 6 shows the spatial distribution of Access Points at district levels. As shown
in the figures, there are APs in all the 16 political districts. Aggregate figures show that
Western Urban has the highest number of FAP (475, 26%), followed by Bo District (276,
15%). Sixty-seven (67%) percent of financial access points are concentrated in Western
Urban, Bo, Kenema, and Bombali districts, making these the main hub for financial
services in Sierra Leone (Figure 7). Falaba, Karene, Koinadugu, Pujehun, and Kambia
make up the bottom five of the financial services accounting for about 6 percent. The
distribution clearly shows an urban trend with more FAP in the bigger urban locations
except for Kono District.
Figure 5: Distribution of Access Points per district
17
Figure 6: Spatial distribution of Access Points at district level
Figure 7: Percent contribution of Access Points per district
18
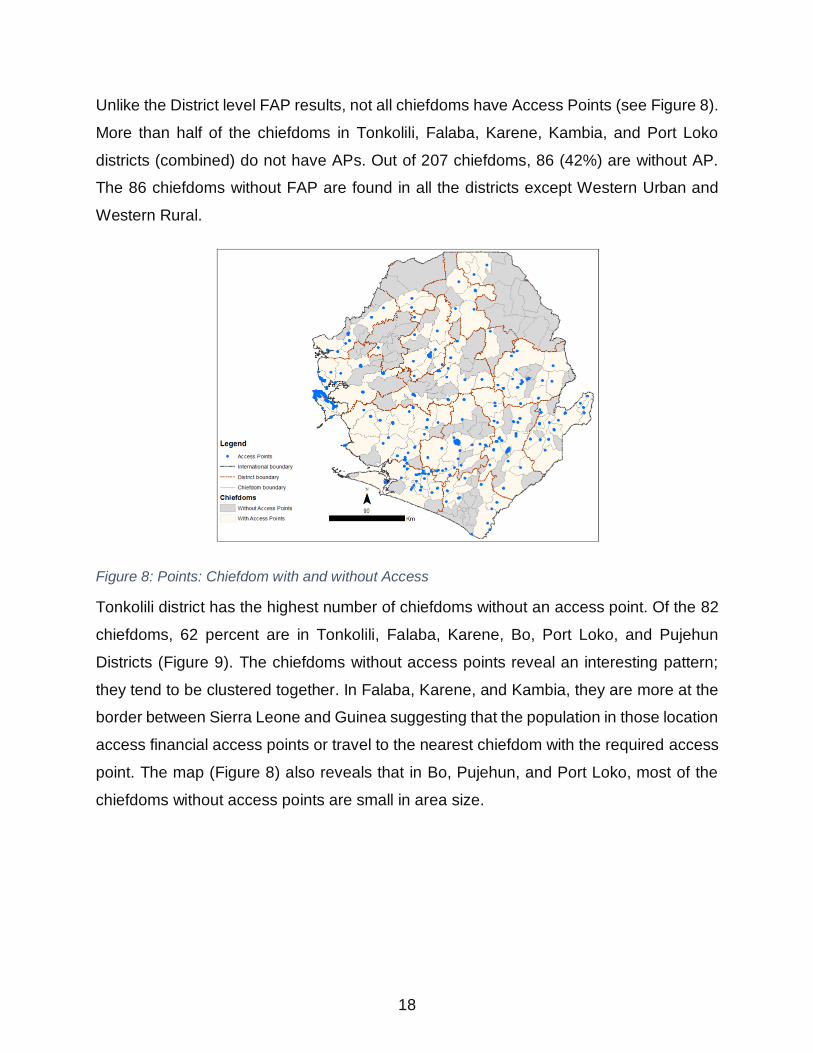
Unlike the District level FAP results, not all chiefdoms have Access Points (see Figure 8).
More than half of the chiefdoms in Tonkolili, Falaba, Karene, Kambia, and Port Loko
districts (combined) do not have APs. Out of 207 chiefdoms, 86 (42%) are without AP.
The 86 chiefdoms without FAP are found in all the districts except Western Urban and
Western Rural.
Figure 8: Points: Chiefdom with and without Access
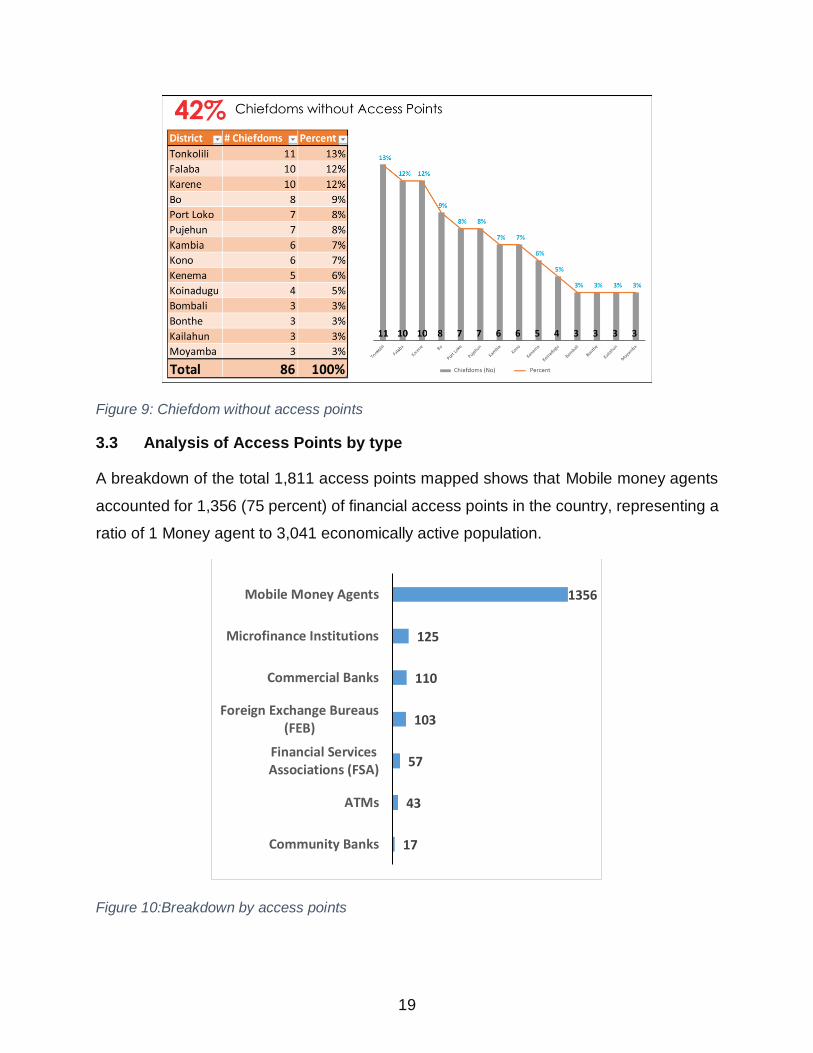
Tonkolili district has the highest number of chiefdoms without an access point. Of the 82
chiefdoms, 62 percent are in Tonkolili, Falaba, Karene, Bo, Port Loko, and Pujehun
Districts (Figure 9). The chiefdoms without access points reveal an interesting pattern;
they tend to be clustered together. In Falaba, Karene, and Kambia, they are more at the
border between Sierra Leone and Guinea suggesting that the population in those location
access financial access points or travel to the nearest chiefdom with the required access
point. The map (Figure 8) also reveals that in Bo, Pujehun, and Port Loko, most of the
chiefdoms without access points are small in area size.
19
Figure 9: Chiefdom without access points
3.3 Analysis of Access Points by type
A breakdown of the total 1,811 access points mapped shows that Mobile money agents
accounted for 1,356 (75 percent) of financial access points in the country, representing a
ratio of 1 Money agent to 3,041 economically active population.
Figure 10:Breakdown by access points
17
43
57
103
110
125
1356
Community Banks
ATMs
Financial ServicesAssociations (FSA)
Foreign Exchange Bureaus(FEB)
Commercial Banks
Microfinance Institutions
Mobile Money Agents
20
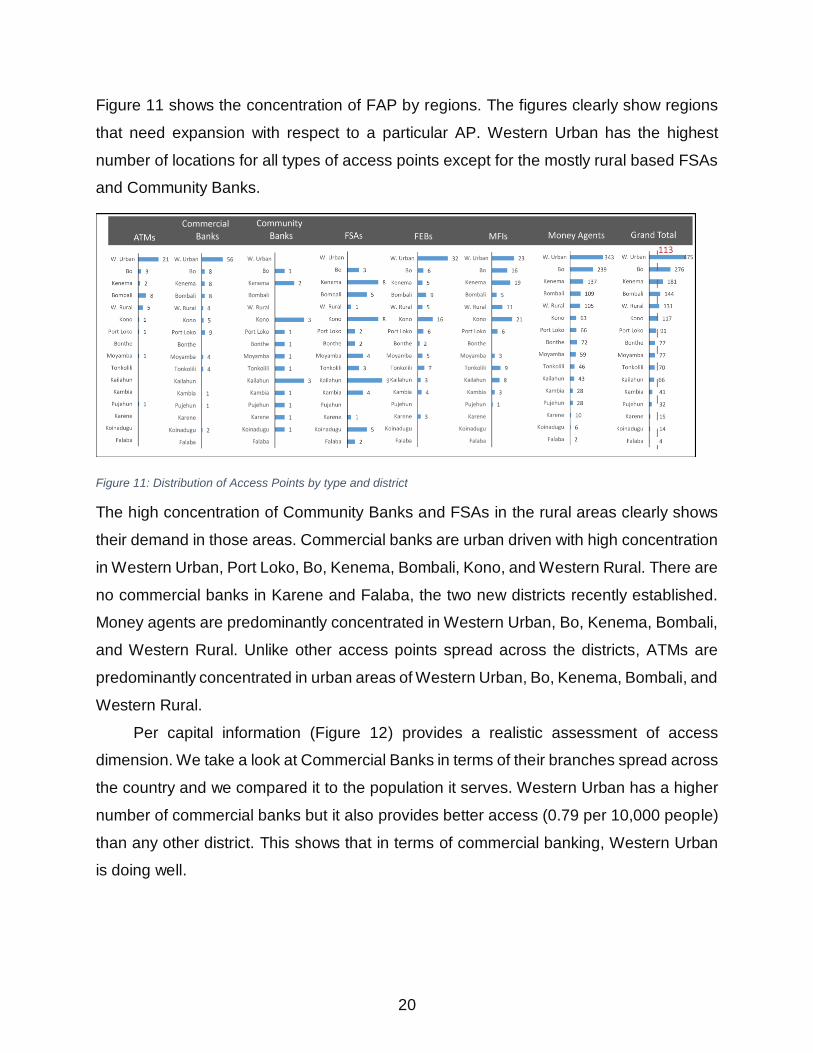
Figure 11 shows the concentration of FAP by regions. The figures clearly show regions
that need expansion with respect to a particular AP. Western Urban has the highest
number of locations for all types of access points except for the mostly rural based FSAs
and Community Banks.
Figure 11: Distribution of Access Points by type and district
The high concentration of Community Banks and FSAs in the rural areas clearly shows
their demand in those areas. Commercial banks are urban driven with high concentration
in Western Urban, Port Loko, Bo, Kenema, Bombali, Kono, and Western Rural. There are
no commercial banks in Karene and Falaba, the two new districts recently established.
Money agents are predominantly concentrated in Western Urban, Bo, Kenema, Bombali,
and Western Rural. Unlike other access points spread across the districts, ATMs are
predominantly concentrated in urban areas of Western Urban, Bo, Kenema, Bombali, and
Western Rural.
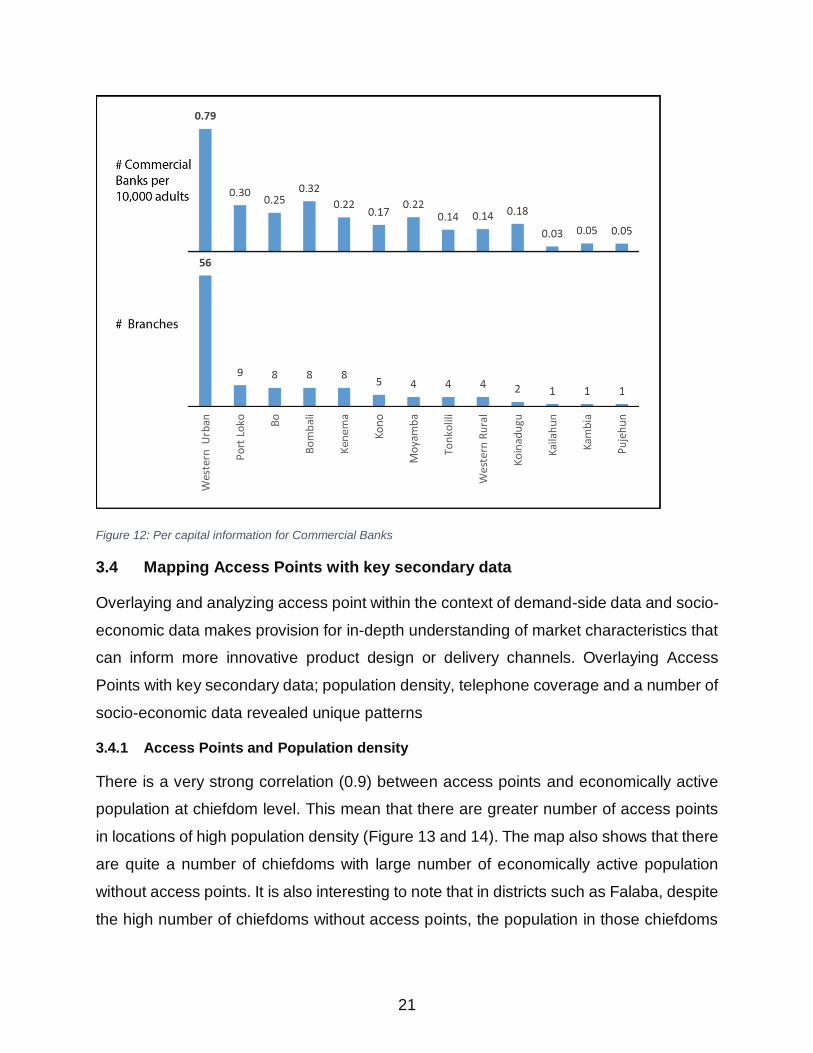
Per capital information (Figure 12) provides a realistic assessment of access
dimension. We take a look at Commercial Banks in terms of their branches spread across
the country and we compared it to the population it serves. Western Urban has a higher
number of commercial banks but it also provides better access (0.79 per 10,000 people)
than any other district. This shows that in terms of commercial banking, Western Urban
is doing well.
21
Figure 12: Per capital information for Commercial Banks
3.4 Mapping Access Points with key secondary data
Overlaying and analyzing access point within the context of demand-side data and socio-
economic data makes provision for in-depth understanding of market characteristics that
can inform more innovative product design or delivery channels. Overlaying Access
Points with key secondary data; population density, telephone coverage and a number of
socio-economic data revealed unique patterns
3.4.1 Access Points and Population density
There is a very strong correlation (0.9) between access points and economically active
population at chiefdom level. This mean that there are greater number of access points
in locations of high population density (Figure 13 and 14). The map also shows that there
are quite a number of chiefdoms with large number of economically active population
without access points. It is also interesting to note that in districts such as Falaba, despite
the high number of chiefdoms without access points, the population in those chiefdoms
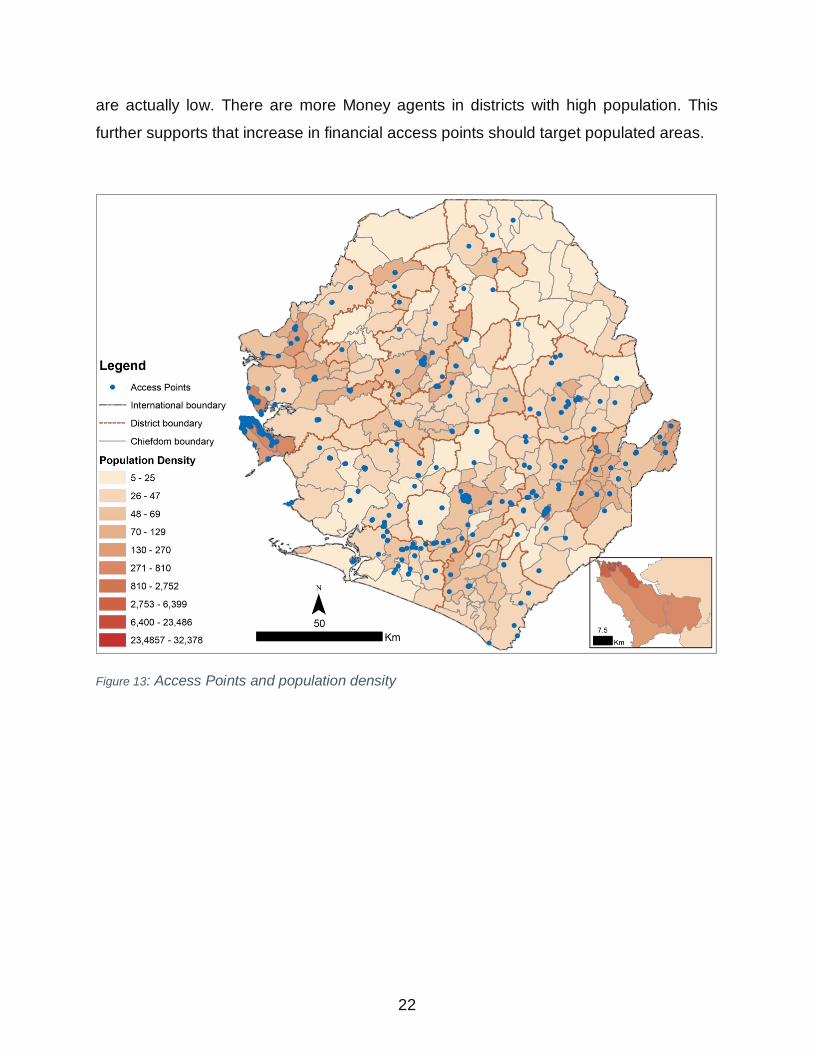
22
are actually low. There are more Money agents in districts with high population. This
further supports that increase in financial access points should target populated areas.
Figure 13: Access Points and population density
23
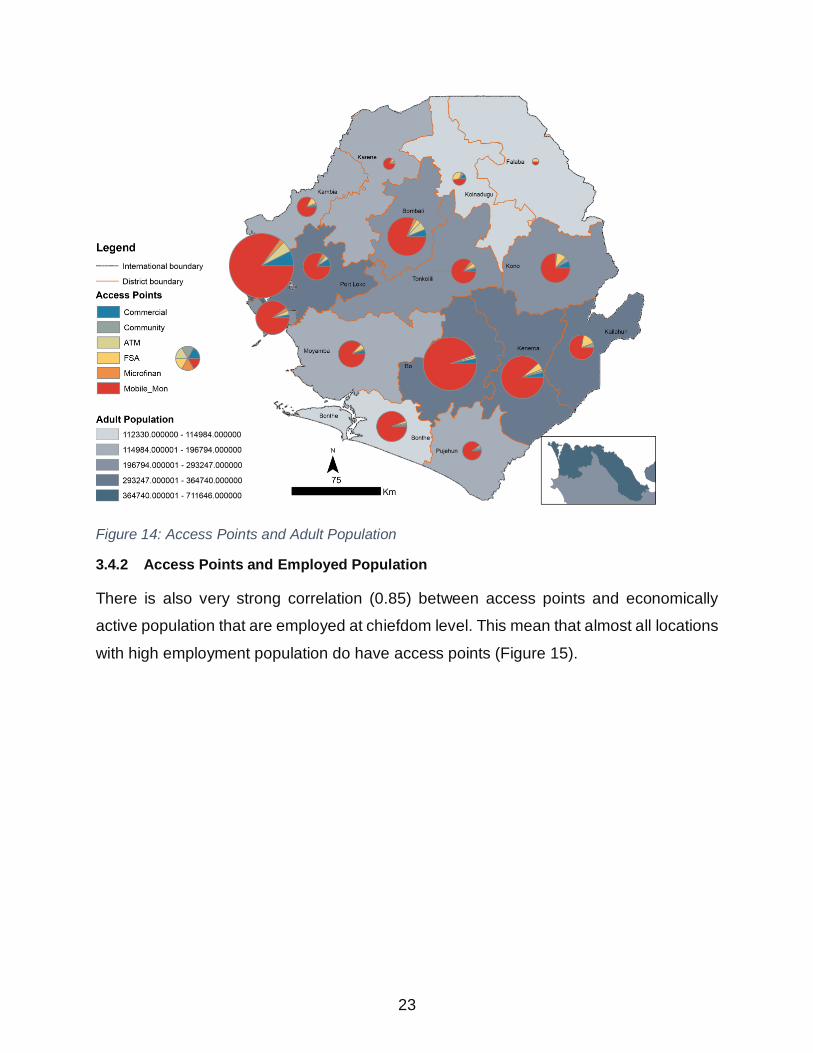
Figure 14: Access Points and Adult Population
3.4.2 Access Points and Employed Population
There is also very strong correlation (0.85) between access points and economically
active population that are employed at chiefdom level. This mean that almost all locations
with high employment population do have access points (Figure 15).

24
Figure 15: Access Points and Adult population employed
3.4.3 Access Points and Literate Population
There is also very strong correlation (0.93) between access points and literate population.
Areas with high literate population are also areas with high number of access points. High
literate population are enlightened and most likely to be financially literate about the
options of utilizing the various financial access points and digital platforms for monetary
transaction.
Figure 16: Access Points and literate population
25
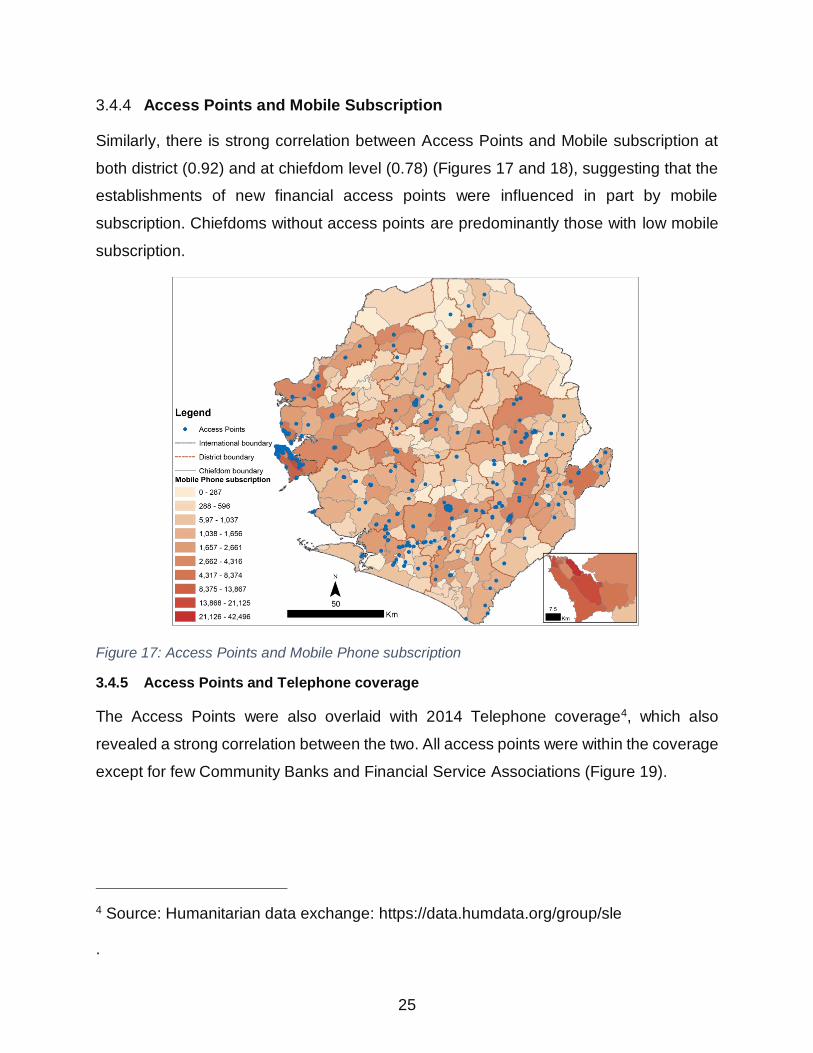
3.4.4 Access Points and Mobile Subscription
Similarly, there is strong correlation between Access Points and Mobile subscription at
both district (0.92) and at chiefdom level (0.78) (Figures 17 and 18), suggesting that the
establishments of new financial access points were influenced in part by mobile
subscription. Chiefdoms without access points are predominantly those with low mobile
subscription.
Figure 17: Access Points and Mobile Phone subscription
3.4.5 Access Points and Telephone coverage
The Access Points were also overlaid with 2014 Telephone coverage4, which also
revealed a strong correlation between the two. All access points were within the coverage
except for few Community Banks and Financial Service Associations (Figure 19).
4 Source: Humanitarian data exchange: https://data.humdata.org/group/sle
.

26
Figure 18: Access Points and Mobile Phone subscription
Figure 19: Access Points and Mobile Phone coverage
27
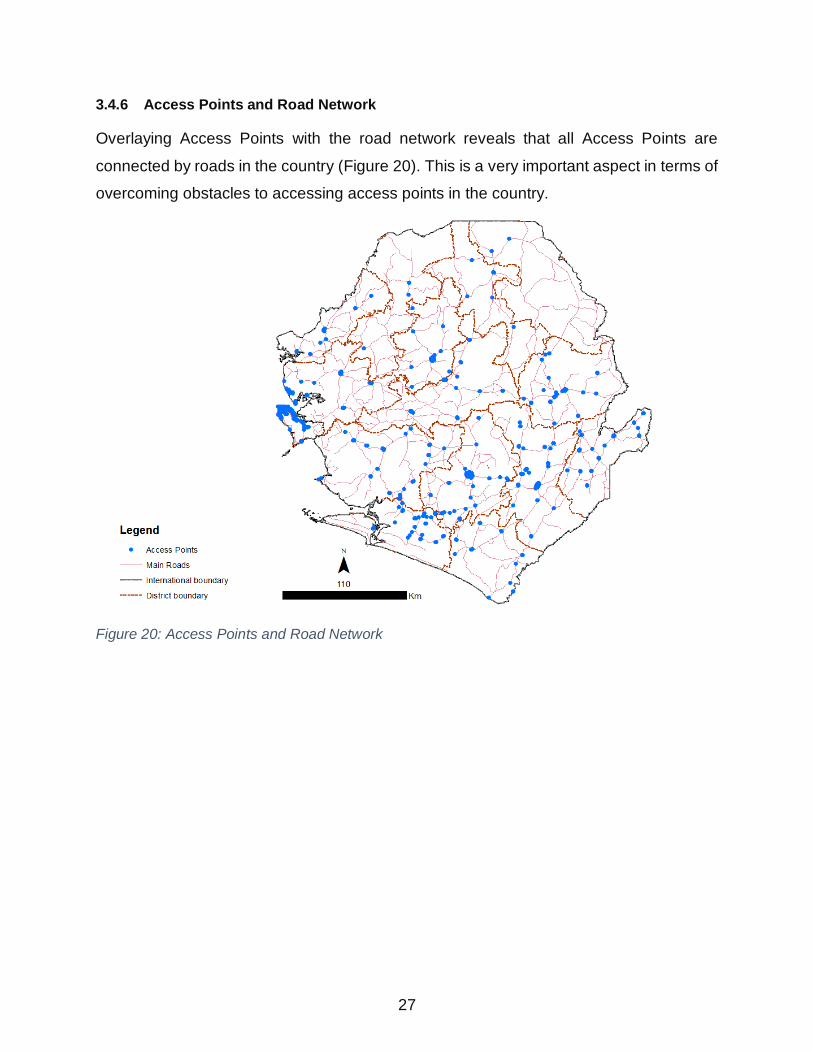
3.4.6 Access Points and Road Network
Overlaying Access Points with the road network reveals that all Access Points are
connected by roads in the country (Figure 20). This is a very important aspect in terms of
overcoming obstacles to accessing access points in the country.
Figure 20: Access Points and Road Network
28
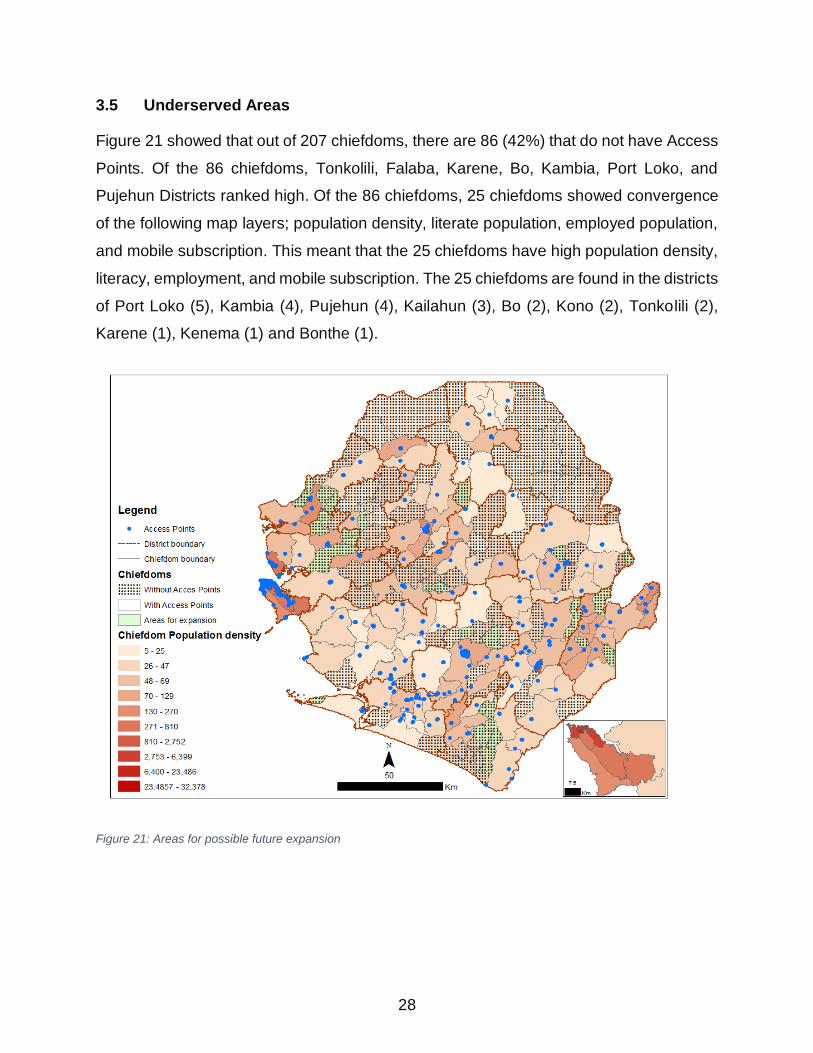
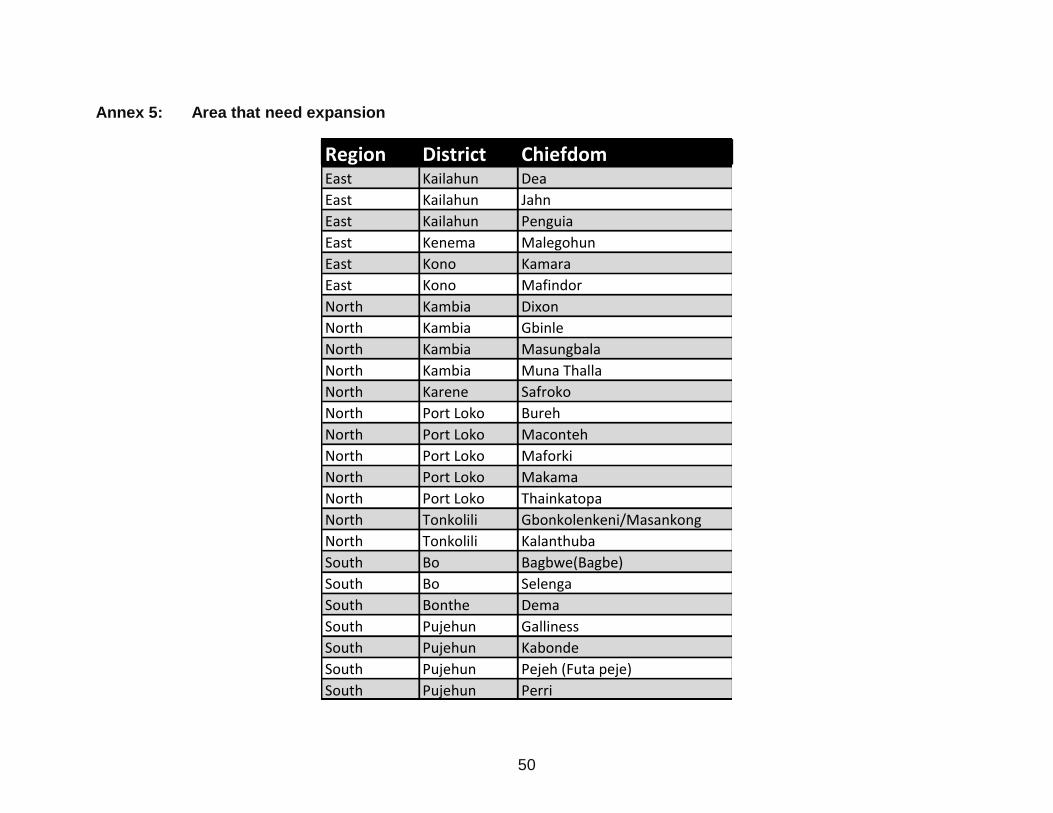
3.5 Underserved Areas
Figure 21 showed that out of 207 chiefdoms, there are 86 (42%) that do not have Access
Points. Of the 86 chiefdoms, Tonkolili, Falaba, Karene, Bo, Kambia, Port Loko, and
Pujehun Districts ranked high. Of the 86 chiefdoms, 25 chiefdoms showed convergence
of the following map layers; population density, literate population, employed population,
and mobile subscription. This meant that the 25 chiefdoms have high population density,
literacy, employment, and mobile subscription. The 25 chiefdoms are found in the districts
of Port Loko (5), Kambia (4), Pujehun (4), Kailahun (3), Bo (2), Kono (2), Tonkolili (2),
Karene (1), Kenema (1) and Bonthe (1).
Figure 21: Areas for possible future expansion
29
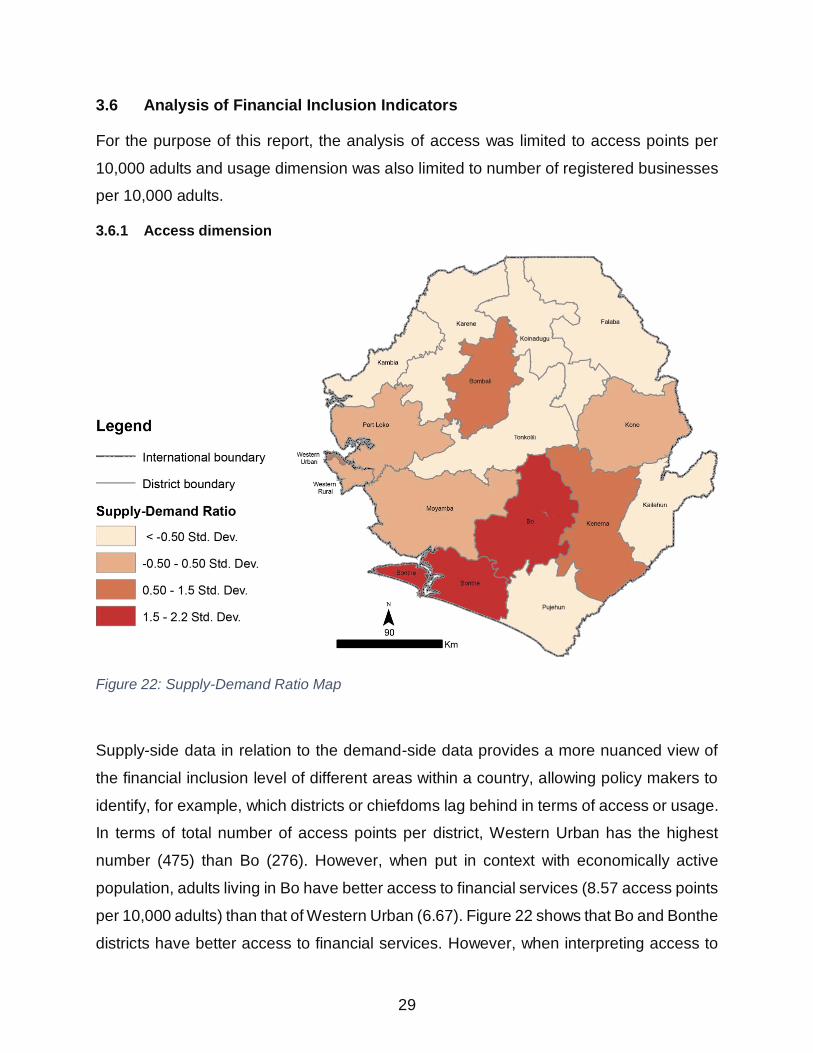
3.6 Analysis of Financial Inclusion Indicators
For the purpose of this report, the analysis of access was limited to access points per
10,000 adults and usage dimension was also limited to number of registered businesses
per 10,000 adults.
3.6.1 Access dimension
Figure 22: Supply-Demand Ratio Map
Supply-side data in relation to the demand-side data provides a more nuanced view of
the financial inclusion level of different areas within a country, allowing policy makers to
identify, for example, which districts or chiefdoms lag behind in terms of access or usage.
In terms of total number of access points per district, Western Urban has the highest
number (475) than Bo (276). However, when put in context with economically active
population, adults living in Bo have better access to financial services (8.57 access points
per 10,000 adults) than that of Western Urban (6.67). Figure 22 shows that Bo and Bonthe
districts have better access to financial services. However, when interpreting access to

30
financial services, it is better to examine the underlying factors. In the case of Bonthe,
ninety four percent of the access points in Bonthe are Money agents.
Figure 23: Supply-Demand chart
3.5.2 Usage Dimension
Due to unavailability of supply-side data, the number of registered businesses per 10,000
adults was used as a proxy to assess the usage of financial services. Data on Kono district
was incomplete and cannot be compared to the other districts. There is a positive and
strong relationship between access points and number of registered businesses. The
information suggests that areas with high registered businesses have high access points
although this does not tell us the extent and quality of the usage.
31
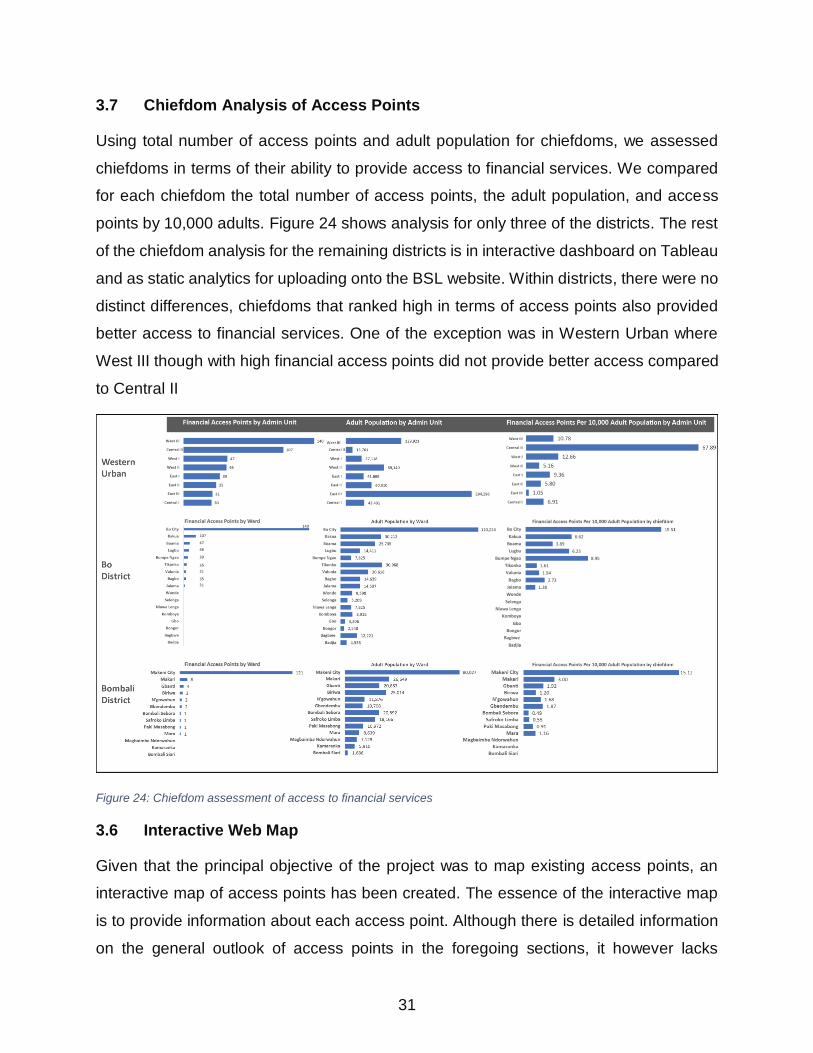
3.7 Chiefdom Analysis of Access Points
Using total number of access points and adult population for chiefdoms, we assessed
chiefdoms in terms of their ability to provide access to financial services. We compared
for each chiefdom the total number of access points, the adult population, and access
points by 10,000 adults. Figure 24 shows analysis for only three of the districts. The rest
of the chiefdom analysis for the remaining districts is in interactive dashboard on Tableau
and as static analytics for uploading onto the BSL website. Within districts, there were no
distinct differences, chiefdoms that ranked high in terms of access points also provided
better access to financial services. One of the exception was in Western Urban where
West III though with high financial access points did not provide better access compared
to Central II
Figure 24: Chiefdom assessment of access to financial services
3.6 Interactive Web Map
Given that the principal objective of the project was to map existing access points, an
interactive map of access points has been created. The essence of the interactive map
is to provide information about each access point. Although there is detailed information
on the general outlook of access points in the foregoing sections, it however lacks
32
information with respect to its name, where it is situated, the services it provide and
analysis.
To operationalised the interactive map, an organizational account for ArcGIS
online has been subscribed for a year (12 calendar months). The subscribed ArcGIS
online organizational account provides access for three staff members at the moment:
one with administrative right, the other with publishing right, and the other as viewer. Staff
with administrative right can author, edit and publish map layers whilst those with viewing
right can only visualized and share the map layers.
The interactive web map displays a comprehensive visual representation of the
landscape of financial access points in Sierra Leone. The web map contains the following:
• Locational information for all financial access points across the country.
• On clicking each access point, a pop window shows up which shows relevant
attribute information about the access point including a portrait that represents the
access point. Due to the large number of mobile money agents, a standard portrait
was used to represent all of them.
33
4 CHALLENGES AND LESSONS LEARNED
4.1 Key Challenges
Carrying out a study of this nature for an institution with no established GIS infrastructure
is bound to face challenges. A number of challenges influenced the mapping exercise.
For convenience, these are grouped into: before, during, and post field survey.
4.1.1 Challenges Before the Survey
A key requirement to the planning of the field survey was access to the list of banks and
money agents. With the exception of the list of banks, information on addresses and
locations of Orange and Africell Mobile Money Agents were received a week after the
commencement of field work. The delay hampered progress as Enumerators lacked
knowledge as to which streets to visit. However, in the first week of the survey,
Enumerators were able to commence field work by focusing on Freetown and other
district headquarter towns where local knowledge was used to identify the locations of
money agents, and other APs.
4.1.2 Challenges During the Survey
Access to Access Points during field data collection – The progress in the first week
of data collection was slow as some of APs were not informed of the exercise despite
assurances. Most Enumerators were refused to collect pictures and GPS coordinates of
APs by Security personnel and staff of APs due to lack of knowledge about the exercise.
At the Lungi Airports where there are few banks within the Airport building, the
Enumerator was taken to the Police Station to make a statement for taking photos of the
banks. Resolving such issues required Supervisors making calls to the Consultant who
in turn called FSD to resolve the issue. In cases where FSD staff could not be reached,
the Enumerator is asked to abandon the AP and revisit it the next day. This interference
from AP staff hampered progress.
Road Network in the rural areas - The poor road network and in addition the rains also
hampered movement of Enumerators particularly in the districts of Kailahun, Koinadugu,
Falaba and parts of Pujehun. In most cases the Motor bikes used by Enumerators
34
breakdown and in one or two cases leading to accidents, although not with severe
consequences.
Mobile Money Agent list – To support the field survey, both Orange and Africell provided
a list of their agents. Orange had about 1,500 agents with Africell having about 1,000.
The list from Orange had a lot of errors in the addresses, making it difficult to group agents
by streets, sections (e.g. Goderich, Lumley), towns or districts. In addition, most of the
agents in the lists of both providers were no longer active. Enumerators invariably
depended on local knowledge in seeking out locations of money agents. This was mostly
done by asking locals in the community where money agents were located.
Weather conditions – Heavy down pour of rains slowed down data collection in most
parts of the country. Bad weather conditions reduce mobility and the accuracy of the GPS
coordinates. Enumerators were required to record coordinates within 5 meters accuracy
and in exceptional cases not exceeding 10 meters. Coordinates beyond the threshold
were not accepted with the Enumerator asked to revisit the AP when weather conditions
improve.
4.2 Overall challenges
4.2.1 Access to supply-side data, timeliness and overall data characteristics
Delays in accessing supply-side data from BSL caused delay in the analysis and
assessment of usage dimension. Supply-side data in the form of number of bank
accounts and loans disaggregated by commercial banks and locations took long to
compile and in the end, could not be used due to their incompleteness.
4.2.2 Overlaps and Gaps in administrative Boundaries
ArcGIS Online has a number of base maps upon which administrative boundary layers of
Sierra Leone are overlaid. The administrative layers are made up of; National (Admin 0),
Provincial (Admin 1), District (Admin 2), Chiefdom (Admin 3), Section (Admin 4), and
Enumeration Areas (EAs) (Admin 5). These layers were acquired from Statistics Sierra
Leone (SSL). In the past few months there has been changes in the total number of
districts and chiefdoms leading to changes in the map layers. The new administrative
boundaries had series of gaps and overlaps making it impossible to use within both
35
ArcGIS Desktop and ArcGIS Online. Fixing such topological errors took almost 2 weeks
to address due to the gravity of the errors.
4.2.3 Mismatch between Datasets (Attribute and Spatial Datasets)
The 2015 Population Census data required extraction of socioeconomic categories.
However, while the spatial datasets (administrative boundaries) were based on the recent
de-amalgamated Districts and Chiefdoms, the population figures in the provisional 2015
Census report were aggregated based on the old administrative settings. Rectifying the
problem required overlaying the old and new administrative section layers (administrative
Section boundaries were not changed) in ArcGIS to obtain the New Chiefdom level
population aggregates for different socioeconomic categories. This was very tedious and
time consuming due to the nature and organisation of data which could only permit
manual manipulation. Further compounding these issues was the differences in section
codes which resorting to manual method of checking and aggregating section population
figures for the new chiefdoms and districts. Nonetheless, the chiefdom level statistics so
obtained are accurate and were shared with SSL.
4.3 Lessons learned
During the consultancy period, the following lessons were learnt:
• A 60-day duration of a project of this magnitude is too short bearing in mind the
challenges of acquiring both primary and secondary data, analysis, systems
development and testing and implementation. With the same budget,
implementing the project for 90 days (instead of 60 days) could have seen far
greater analysis and greater features in the interactive map.
• The involvement of Banking Supervision in this project could have significantly
improved the turnaround time in acquisition of data from Bank of Sierra Leone.
• Involving Statistics Sierra Leone as part of a project of this nature could have far
reaching benefits as custodian of government statistics.

36
5 CONCLUSIONS AND RECOMMENDATIONS
The consultancy was undertaken to:
• To map out current and potential access points
• To overlay Access Points with population, economic activity, financial behaviors,
telephone networks, postal offices, and other parameters.
• To identify underserved areas and areas ready for financial service expansion
and optimum/maximized opportunities.
• Provide information that will help assess the strategic placement of current and
potential financial products and access channels and, potentially build a business
case for reforms and the expansion of products and services in new areas
5.1 Conclusions
Given the objective of the consultancy, the following conclusion can be drawn
• One thousand eight hundred and eleven (1,811) access points were mapped
• The study identified that sixty-one (61) percent of financial access points are
concentrated in Western Urban, Bo, Kenema, and Bombali districts, making
these the main hub for financial services in Sierra Leone.
• Four (4) percent of financial access points are concentrated in Falaba, Karene,
Koinadugu, and districts, making these the main targets for financial services
expansion.
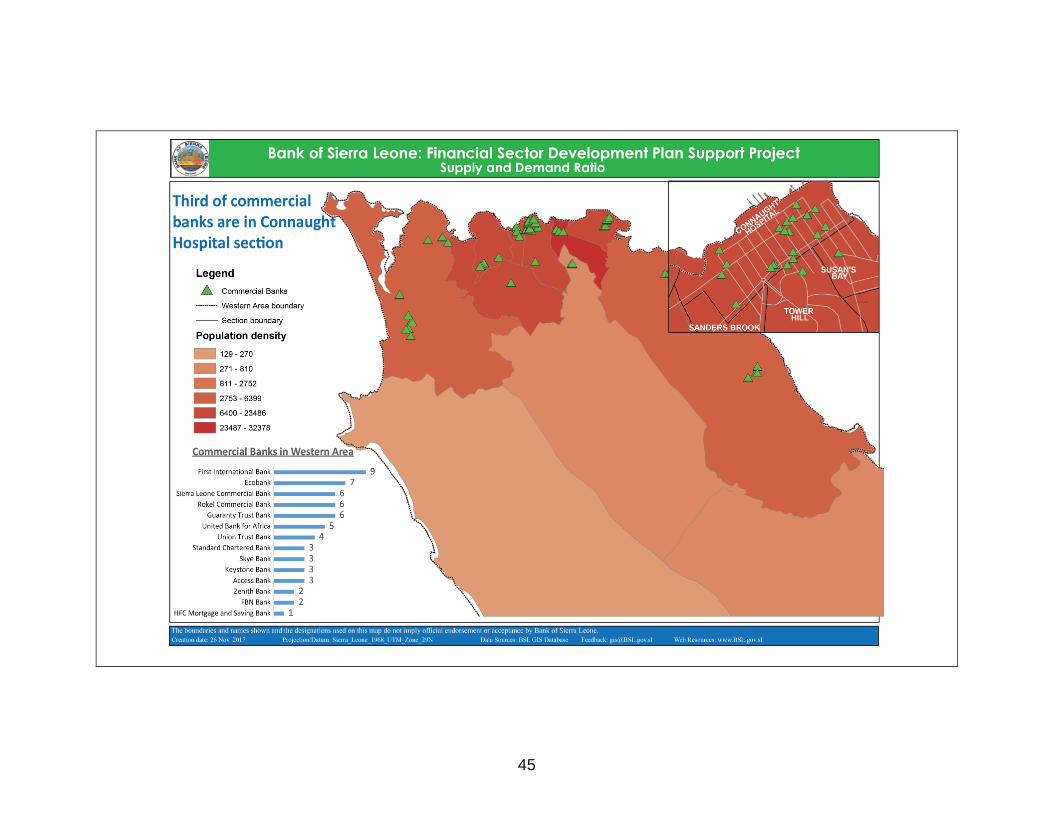
• Fifty-one (51) percent of commercial banks are in Western Urban area, of which
a third of it are in the Central Business District (CBD) of Freetown.
• Eighty-six (86) percent of all financial access points in Sierra Leone belong to
Mobile Network operators; of which Orange has the largest number of Mobile
Money Agents. Over half of the money agents are in Western Urban, Bo, and
Kenema districts.
• Forty two (42) percent of the chiefdoms lack financial access points; 62 percent
of these are in the following; Tonkolili, Falaba, Karene, Bo, Port Loko, and
Pujehun.
• There is high concentration of Community Banks, and FSAs, in the rural areas
37
• Commercial banks are urban driven with high concentration in Western Urban,
Port Loko, Bo, Kenema, Bombali, Kono, and Western Rural.
• Money agents are predominantly concentrated in Western Urban, Bo, Kenema,
Bombali, and Western Rural.
• ATMs are predominantly concentrated in urban areas of Western Urban, Bo,
Kenema, Bombali, and Western Rural.
• Western Urban provides better access to commercial banks than any other
district.
• Western Urban region has the highest number of access points in the country but
lags behind Bo (8.57), and Bonthe (6.7) in terms of access points per 10,000
adults in all districts.
• Strong relationships exist between APs and population density, employed
population, literacy, mobile subscription and telephone coverage. This suggests
that areas without access points but with high population density, high adult
population that is employed, high economic activity, and high mobile subscription
and within telephone coverage should be considered for possible areas for
expansion of financial access points in the future.
• All APs are connected by roads – making them accessible to the economically
active population.
• The study has mapped 1,811 financial access points found in 121 chiefdoms
spread in the 16 districts of Sierra Leone.
• The study has identified 86 of the 207 chiefdoms in Sierra Leone lacking financial
access points. Of the 86 chiefdoms, 25 have been identified to require financial
expansion.
• A platform has been provided to visualize and analyze spatial distribution of APs
for government and financial service providers working to expand financial
inclusion.
• Platform provides baseline and analysis to assess progress towards targets
(services and products) under the National Financial Inclusion Strategy.
• The Interactive Map provides critical data and analysis to inform, raise awareness
and to educate.
38
5.2 Recommendations
• BSL to encourage and promote routine collection of supply-side data by all
financial service providers,
• For optimized use of the tool, it is important that BSL and its partners
systematically and frequently capture latitude and longitude coordinates of
access points to ensure meaningful analysis. This can be done through;
o Financial service providers to provide GPS locations of new branches that
are established.
o Mobile Money Providers to collect the GPS locations of new mobile money
agents during the period of registration.
• Mobile Money Providers to ensure that their agents’ lists are periodically kept
updated,
• The MIS unit of BSL should establish a GIS section to be able to maintain the
developed GIS system and to respond to future demands.

39
ANNEXES
Annex 1: Terms of Reference
INDIVIDUAL CONSULTANT TO CONDUCT A GEOSPATIAL DATA AND
ANALYSIS FOR FINANCIAL INCLUSION PLANNING
COUNTRY: Sierra Leone
NAME OF PROJECT: Financial Sector Development Plan Support Project
SECTOR: Financial Sector
Reference No: BSL/FSDPSP/IC/20016/0016
Grant No.H-662-SL
Project ID No. 121514
The Government of Sierra Leone has received financing from the World Bank toward
the cost of the Financial Sector Development Plan Support Project (FSDPSP) and
intends to apply part of the proceeds for consulting services as detailed below.
Position: Consultant, GIS Technical Analyst
Summary: A GIS and planning professional, with broad technical knowledge and
demonstrated experience in the use of geospatial data and analytics for financial inclusion
planning, to provide technical and program management support to the Bank of Sierra
Leone (BSL) toward the implementation of the FSDP in Sierra Leone.
Workload: Maximum of 80 days, with.mission to Sierra Leone.
Reporting: Consultant will report to Bank of Sierra Leone (BSL) Senior Director of the
Financial Sector Strategy and members of the FSDP secretariat
A. Background
Only 14 percent of Sierra Leoneans have an account at a financial institution, while many
key groups, such as women and the poor (poorest 40 percent) have even lower levels of
access, 11 and 6 percent, respectively. The low level of access across all groups, is due
to a variety of key factors, including the geographical concentration of bank branches in
urban areas and the cost of branches, among others. With more than 60 percent of the
population living in rural areas, there is a need to expand access to financial services to
these areas by overcoming the barriers thereto. While mobile money has the potential to
40
promote financial inclusion in rural rears, less than five percent of Sierra Leoneans have
used mobile money accounts in the last twelve months, with women and the poor having
below national average usage rates. A significant impediment to the expansion of mobile
money services is managing the cash liquidity of its agents to meet client needs.
To bolster efforts to increase financial inclusion, BSL adopted the National Strategy for
Financial Inclusion, 2017-2020, in December 2016. Developed with support from UNCDF,
the Strategy focuses on interventions in six key areas: (1) responsive policy, regulations,
and coordination; (2) client-centric products and services; (3) digital financial services
(DFS); (4) access to finance for MSMEs; (5) financial literacy, financial education, and
consumer protection; and (6) data and measurement. The Strategy is also supported by
a governance framework, including working groups, to assist with implementation. BSL
has also requested support from the World Bank to conduct a financial inclusion survey
under the ongoing Financial Sector Development Plan (FSDP) Support Project. This
survey will help to measure the state of and progress in financial inclusion in Sierra Leone
in 2017, while also identifying consumer needs.
Within this context of increased efforts to support financial inclusion and to gain valuable
data and information thereon, BSL has requested support to conduct a geospatial
mapping of the financial inclusion landscape under the FSDP. The purpose of the
analytical exercise is to map out current and potential access points, such as banks and
mobile money agents. The mapping exercise will map and analyze access points (by
size and type) overlaid with population, economic activity, financial behaviors (if feasible),
telephone networks, postal offices, and other parameters. The mapping exercise will
thereby identify areas that are currently underserved, areas ready for financial service
expansion, and optimum/maximized opportunities. Using this information, the mapping
can help assess the strategic placement of current and potential financial products and
access channels and, potentially build a business case for reforms and the expansion of
products and services in new areas. In doing so, the mapping exercise will serve as a
public good for financial institutions and other stakeholders/partners.
BSL's Senior Director of the Financial Sector Strategy and the FSDP Secretariat will
manage and implement the mapping exercise in close coordination and support from the
WB's Finance and Markets Global Practice and Central GIS (GOST) team, including the
GIS Analyst (consultant). The GOST team works on projects for various World Bank
Group units and sectors- and these projects require extensive knowledge of GIS and
remote sensing platforms. The GIS Analyst is responsible for working with BSL, the
World Bank, and stakeholders in Sierra Leone, to obtain and organize spatial data,
facilitate the migration of existing data to new platforms, conduct data analysis, create

41
maps, and work on web mapping application development. The GIS Analyst will be
expected to assist with any tasks relevant to maintaining these applications.
B. RESPONSIBILITIES
1. Data collection and management: Collect and compile spatial data and prepare it
for specific projects, as well as public sharing
o This includes, but is not limited to: designing data collection templates and data
requests for authorities, managing data collection, data cleaning, metadata creation, and
geodatabase management).
2. Data Migration: Assist in the migration of data from versions of ArcGIS Server to
latest, including updating items in Portal for ArcGIS.
3. Assists BSL in the creation of interactive online mapping applications.
4. Provides business and technical solutions by developing, maintaining, and
enhancing web mapping applications using Open Source and ESRI products.
5. Support development of various in house GIS solutions.
6. Communicates successfully with BSL, the World Bank, and other stakeholders.
QUALIFICATIONS
7. University degree in information systems, geography, cartography or a related field
with concentration in GIS and technology applications with 3 years of experience.
Master's degree preferred.
8. Strong theoretical base and technical knowledge of spatial and geographic
systems, including working knowledge of geographic, cartographic principles,
image processing, database principles, geospatial production techniques, good
data management practices, and urban spatial analytics.
9. Ability to conceptualize, design, and implement major projects and to collaborate
on major and complex reports.
10. Must have knowledge of the latest ESRI GIS software (ArcInfo, ArcCatalog,
ArcGIS Online, Portal for. ArcGIS, and Spatial Analyst).
11. Ability to manage and render large amounts of spatial data.
12. Ability to multi-task and prioritize tasks.
13. Excellent communication and presentation skills (both written and verbal) in
English. Other languages is an added advantage but not mandatory.
14.
42
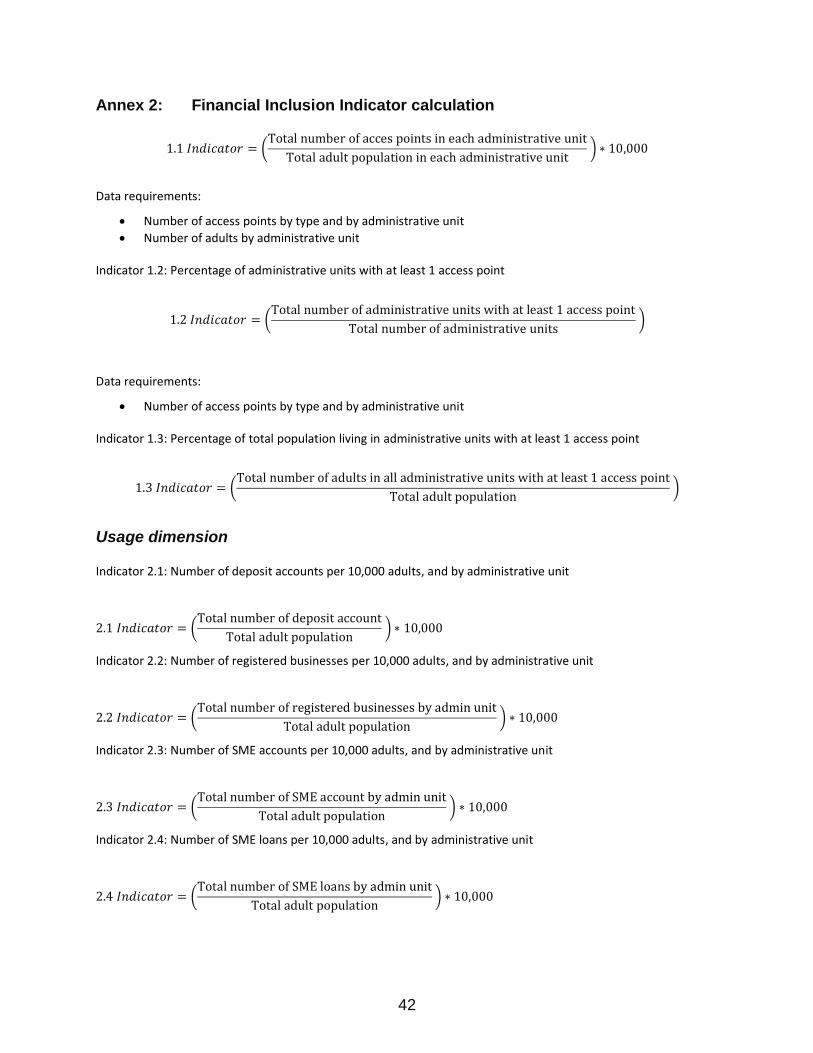
Annex 2: Financial Inclusion Indicator calculation
1.1 𝐼𝑛𝑑𝑖𝑐𝑎𝑡𝑜𝑟 = (Total number of acces points in each administrative unit
Total adult population in each administrative unit ) ∗ 10,000
Data requirements:
• Number of access points by type and by administrative unit
• Number of adults by administrative unit
Indicator 1.2: Percentage of administrative units with at least 1 access point
1.2 𝐼𝑛𝑑𝑖𝑐𝑎𝑡𝑜𝑟 = (Total number of administrative units with at least 1 access point
Total number of administrative units )
Data requirements:
• Number of access points by type and by administrative unit
Indicator 1.3: Percentage of total population living in administrative units with at least 1 access point
1.3 𝐼𝑛𝑑𝑖𝑐𝑎𝑡𝑜𝑟 = (Total number of adults in all administrative units with at least 1 access point
Total adult population )
Usage dimension
Indicator 2.1: Number of deposit accounts per 10,000 adults, and by administrative unit
2.1 𝐼𝑛𝑑𝑖𝑐𝑎𝑡𝑜𝑟 = (Total number of deposit account
Total adult population ) ∗ 10,000
Indicator 2.2: Number of registered businesses per 10,000 adults, and by administrative unit
2.2 𝐼𝑛𝑑𝑖𝑐𝑎𝑡𝑜𝑟 = (Total number of registered businesses by admin unit
Total adult population ) ∗ 10,000
Indicator 2.3: Number of SME accounts per 10,000 adults, and by administrative unit
2.3 𝐼𝑛𝑑𝑖𝑐𝑎𝑡𝑜𝑟 = (Total number of SME account by admin unit
Total adult population ) ∗ 10,000
Indicator 2.4: Number of SME loans per 10,000 adults, and by administrative unit
2.4 𝐼𝑛𝑑𝑖𝑐𝑎𝑡𝑜𝑟 = (Total number of SME loans by admin unit
Total adult population ) ∗ 10,000

43
Annex 3: National Overview

44
45
46
Annex 4 Data Collection Tool

47
48

49
50
Annex 5: Area that need expansion
Region District ChiefdomEast Kailahun Dea
East Kailahun Jahn
East Kailahun Penguia
East Kenema Malegohun
East Kono Kamara
East Kono Mafindor
North Kambia Dixon
North Kambia Gbinle
North Kambia Masungbala
North Kambia MunaThalla
North Karene Safroko
North PortLoko Bureh
North PortLoko Maconteh
North PortLoko Maforki
North PortLoko Makama
North PortLoko Thainkatopa
North Tonkolili Gbonkolenkeni/Masankong
North Tonkolili Kalanthuba
South Bo Bagbwe(Bagbe)
South Bo Selenga
South Bonthe Dema
South Pujehun Galliness
South Pujehun Kabonde
South Pujehun Pejeh(Futapeje)
South Pujehun Perri

51
Annex 6 Screen Shoot of the web map