Embed Size (px)
DESCRIPTION
Research Report on ‘Poverty and Wealth’ for the Rosa Luxemburg Stiftung Brussels/Athens conference on 18-21 April 2013 by Georgios Daremas
Citation preview
PAUPERISM AND SOCIAL DISTRESS IN CONTEMPORARY GREECE
Georgios Daremas
Research Report on ‘Poverty and Wealth’ for the Rosa Luxemburg Stiftung Brussels/Athens conference on 18-21 April 2013
1
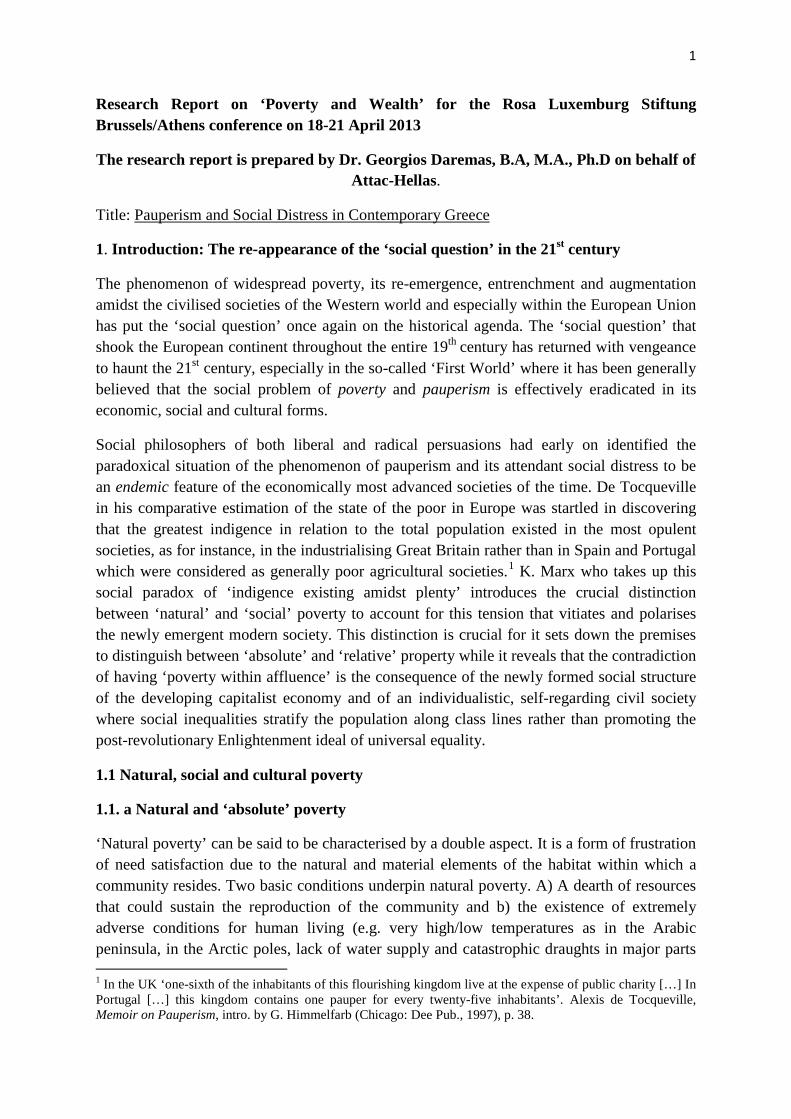
Research Report on ‘Poverty and Wealth’ for the Rosa Luxemburg Stiftung Brussels/Athens conference on 18-21 April 2013
The research report is prepared by Dr. Georgios Daremas, B.A, M.A., Ph.D on behalf of Attac-Hellas.
Title: Pauperism and Social Distress in Contemporary Greece
1. Introduction: The re-appearance of the ‘social question’ in the 21st century
The phenomenon of widespread poverty, its re-emergence, entrenchment and augmentation amidst the civilised societies of the Western world and especially within the European Union has put the ‘social question’ once again on the historical agenda. The ‘social question’ that shook the European continent throughout the entire 19th century has returned with vengeance to haunt the 21st century, especially in the so-called ‘First World’ where it has been generally believed that the social problem of poverty and pauperism is effectively eradicated in its economic, social and cultural forms.
Social philosophers of both liberal and radical persuasions had early on identified the paradoxical situation of the phenomenon of pauperism and its attendant social distress to be an endemic feature of the economically most advanced societies of the time. De Tocqueville in his comparative estimation of the state of the poor in Europe was startled in discovering that the greatest indigence in relation to the total population existed in the most opulent societies, as for instance, in the industrialising Great Britain rather than in Spain and Portugal which were considered as generally poor agricultural societies.1 K. Marx who takes up this social paradox of ‘indigence existing amidst plenty’ introduces the crucial distinction between ‘natural’ and ‘social’ poverty to account for this tension that vitiates and polarises the newly emergent modern society. This distinction is crucial for it sets down the premises to distinguish between ‘absolute’ and ‘relative’ property while it reveals that the contradiction of having ‘poverty within affluence’ is the consequence of the newly formed social structure of the developing capitalist economy and of an individualistic, self-regarding civil society where social inequalities stratify the population along class lines rather than promoting the post-revolutionary Enlightenment ideal of universal equality.
1.1 Natural, social and cultural poverty
1.1. a Natural and ‘absolute’ poverty
‘Natural poverty’ can be said to be characterised by a double aspect. It is a form of frustration of need satisfaction due to the natural and material elements of the habitat within which a community resides. Two basic conditions underpin natural poverty. A) A dearth of resources that could sustain the reproduction of the community and b) the existence of extremely adverse conditions for human living (e.g. very high/low temperatures as in the Arabic peninsula, in the Arctic poles, lack of water supply and catastrophic draughts in major parts 1 In the UK ‘one-sixth of the inhabitants of this flourishing kingdom live at the expense of public charity […] In Portugal […] this kingdom contains one pauper for every twenty-five inhabitants’. Alexis de Tocqueville, Memoir on Pauperism, intro. by G. Himmelfarb (Chicago: Dee Pub., 1997), p. 38.
2
of Africa). The notion of ‘natural poverty’ presages the corresponding current concept of absolute poverty since both concepts rest on the utter inability to provide for the fulfilment of the physical needs of human beings (either no marketable resources exist to permit societal incorporation in world trade or the local communities are excluded from access and deprived of the benefits of exploiting such resources in dictatorial regimes, or they lack basic infrastructural facilities, i.e. irrigation networks, whose effects result in limited food supply and in ill-health epidemics with millions of deaths). Given the near total monetisation of the conditions of living of humanity on the planet, the quantitative monetary criterion has become the sole absolute standard defining absolute poverty. The cost-of-living indices used to set absolute poverty lines are typically based on observed prices (allowing for some spending on non-food items whose price data are missing) and then poverty measures are constructed, such as the headcount index or poverty gap index, which are calculated by deflating actual consumptions or incomes at household level by these poverty lines.2 According to the United Nations’ definition, the absolute poverty threshold is set by various fixed numerical standards as one, two or 10 dollars per day worldwide. This assumes that the income poverty line is invariant to context.
1.1. b Social and ‘relative’ poverty
The concept of social poverty includes natural poverty3 but it also describes the effects of deprivation, the consequences of increasing social inequality and the concentration of social wealth in the hands of the few, whether these may be some few rich countries, giant multinational corporations or single private individuals. Given the current trend of wealth concentration and the sequestering of global material resources under the principle of private property, it is no wonder that the decision-making process about the allocation and the use of social wealth escapes the confines of political democratic control and rests with an increasingly deregulated private market economy and the private proprietors of such wealth who determine more or less the investment flows worldwide.4 The concept of social poverty is central to any scientific analysis of poverty because it subtends and establishes the forms of ‘relative poverty’ both intra-societally and inter-societally in comparative perspective. Social poverty as a relational phenomenon is estimated by the use of relative standards of poverty in comparing distinctive social categories and stratifying the relevant social groups according to 2 Martin Ravallion, ‘On the Welfarist Rationale for Relative Poverty Lines’ in Kaushik Basu and Ravi Kanbur (eds.) Arguments for a Better World: Essays in Honour of Amartya Sen, Volume I: Ethics, Welfare, and Measurement (Oxford: Oxford University Press, 2009), pp. 375-396, 375. 3 The effects of ‘natural poverty’ are mediated by the specific social structures that characterise existing societies as well as by the types of bonds and forms of exchange they have within the framework of the international inter-state system and the global societal inter-dependency. 4 Apart from the widely known world inequality between North and South, of the West and the East and of the First world over the Third world, what is of particular significance is the continuously rising inequality in the last three decades within the block of countries comprising OECD and considered to be the most developed economies on the planet. Though growing income inequality has followed different rhythms and patterns between OECD countries, ‘[t]he latest trends in the 2000s showed a widening gap between rich and poor not only in some of the already high-inequality countries like Israel and the United States, but also – for the first time – in traditionally low-inequalities countries, such as Germany, Denmark, and Sweden (and other Nordic countries), where inequality grew more than anywhere else in the 2000s.’ OECD 2011, Divided We Stand: Why Inequality Keeps Rising: An Overview of Growing Income Inequalities in OECD Countries: Main Findings, p. 22 (accessed at www.oecd.org/els/social/inequality).
3
the applied standards. Three standards of poverty measurement are commonly employed in the literature. 1) Extremes of income scales (usually measured in quintile and decile shares) 2) the Gini coefficient5 3) the at-risk-of-poverty threshold, which is set at 60% of the national median equivalised disposable income after social transfers.6 Because of the generalised commodity character of capitalist production and consumption and the near-total monetisation of social relations such conditions presuppose, income and its distribution has become the main indicator of ‘poverty and wealth’ and of the resultant social inequality as well as the dominant criterion of access to the basic amenities necessary for social life sustenance. Still, ‘the pervasive use of income to measure and compare human welfare’, especially the per capita incomes of the people as the indicator of economic performance between countries, has been aptly questioned by the Nobel laureate economist and philosopher Amartya Sen.7 Moreover, even in regard to indicators of absolute income or consumption there is a growing scientific consensus that the relative economic position is a far better evaluator of welfare standings since it takes into account regional and country-specific levels of development. This standpoint is called the theory of relative deprivation (RD), following Runciman.8
1.1. c Cultural poverty
Monetary indicators cannot fully capture the multi-dimensionality of poverty nor are basic aspects of poverty correlated exclusively with income scales. A wide gamut of non-financial aspects defines welfare and the quality of life.9 We can call the non-monetary complex of factors and conditions that defines the well-being of individuals, socio-cultural endowment and its lack as ‘cultural poverty’. Next to the two social structures that are major constituent components of the phenomenon of poverty, a) lack of access to the labour market hence unemployment and b) low remuneration below the national poverty threshold, e.g. the neo-poor or the ‘working poor’, the dimension of cultural poverty not only accompanies lack or low income but it itself constitutes a prevalent cause for the genesis, expansion and reinforcement of the poverty phenomenon.
5 The Gini coefficient or Gini index was invented by the Italian sociologist Corrado Gini, and measures the inequality among values of a frequency distribution (usually of income or wealth) where a coefficient of zero reflects perfect equality and the value of one (or 100 on the percentile scale) reflects maximal inequality. For OECD countries in the late 2000s, the income Gini coefficient ranged between 0.24 (Slovenia) to 0.49 (Chile). The global income inequality Gini coefficient in 2005, for all human beings taken together has been estimated to be between 0.61 and 0.68 (Wikipedia, lemma ‘Gini coefficient’, p.1, http://en.wikipedia.org/wiki/ Gini_coefficient . According to the latest figures of the United Nations University’s World Income Inequality Database (UNU-WIDER – WIID), Greece in 2006 had a reported Gini coefficient of 34.0 (in 100 percentile scale), a mean income of 11.664 EUR/year and a median income of 9.850 EUR/year. 6 The at-risk-of-poverty threshold defines the income poverty line and then the at-risk-of-poverty rate counts the share of people who fall below the at-risk-of-poverty threshold. See: Eurostat, Glossary: At-risk-of-poverty rate, accessed at http://epp.eurostat.ec.europa.eu/statistics_explained/index.php 7 Kaushik Basu and Ravi Kanbur, ‘Introduction’ in Basu and Kanbur (eds.) Arguments for a Better World, op. cit., pp. 1-4, 3. 8 W. G. Runciman, Relative Deprivation and Social Justice (London: Routledge and Kegan Paul, 1966). 9 Paul Anand, Cristina Santos, Ron Smith, ‘The Measurement of Capabilities’ in K. Basu & R. Kanbur (eds.) Arguments for a Better World, op. cit., pp. 283-310, 287.
4
‘Cultural poverty’ condenses three main dimensions which shape the social conditioning of poverty. 1) The educational level. In the societies of late capitalism the main explanatory factor of the level of income received consists in the possession of ‘educational credentials’, basically university/college degrees and post-graduate degrees. In Western societies the statistical correlation between educational and income levels ranges between 70-90% which means that the educational qualifications (number of years in formal education and possession of titles of accredited education) explain almost the totality of the various national income stratification scales.10 Educational qualifications can account also for the inner composition of unemployment in Greece in the pro-crisis period. (Unemployment in Greece during the crisis period shows new qualitative variations, the most significant being the dislocation and bankruptcy avalanche of small business entrepreneurship, independent entrepreneurs, small-scale manufacturers, retailers etc., and consequently of the dramatic reduction of the labour force they employ. It must be noted that Greece has one of the highest self-employment rates in the world. This rate has remained consistently steady during the last years and it has ranged from 36.6% in 2004 to 36.3% in 2011, the latest officially recorded figure).11 Consequently, social phenomena like ‘school dropping-out’, formal and functional illiteracy and the massive expansion of university education in the last two decades that is coming to a halt12 as a consequence of drastic cut-downs in budgetary allocations to higher education and inclines towards class exclusiveness and becoming a restricted privilege for the middle and upper classes due to difficult-to-meet student expenditures (especially when the candidates succeed to enter higher education places that require emigration to another city than one’s own family residence) on the one hand, and because of the national trend of shrinking the number of higher education places offered on the other hand, such social trends constitute significant cultural causes shaping the poverty profile.13 It must be emphasised that 10 ‘Increases in household income inequality have been largely driven by changes in the distribution of wages and salaries, which account for 75% of household incomes among working-age adults.’ OECD 2011, An Overview of Growing Income Inequalities in OECD Countries, op. cit., p. 22. But which causal factor can account for the income inequality revealed by the skewed distribution of wages and salaries? A highly plausible candidate is possession of tertiary education qualifications. According to recent OECD trend figures, the relative earnings for the male age group 25-54 with tertiary education (upper secondary and post-secondary non-tertiary education taken as the base=100) were, in two of the largest economies in the world, 138 for Germany in 1999 and 167 for United States in 1999, both having risen to 163 for Germany in 2006 and to 183 for the US in the same year (there are no figures for Greece). Source: OECD Factbook 2009 (http://dx.doi.org/10.1787/20755120-2009-table4). 11 OECD Factbook statistics. Country stat profile: Greece 2013. Due to the protracted economic slump an inordinate number of self-employed and their private businesses go bankrupt. According to Greek labour law loss of self-employment does not entitle one to any unemployment benefits. Moreover, this increasingly augmenting middle-class stratum of formerly self-employed entrepreneurs is not recorded in the officially registered unemployment data though they do actually seek alternative employment and thus the official unemployment figures systematically under-report the actual total unemployment. 12 Greece experienced a steep rise exceeding 63% (author’s calculation) in the number of students entering tertiary education in the 2000s. Specifically, the first time entrants as a percentage of the population in the corresponding age group amounted to 30% in 2000 and 2001, their proportion increased to 35% in 2003 and 2004 and skyrocketed to 49% in 2006 slightly declining to 43% in 2007. Source: OECD Factbook 2010 (http://dx.doi.org/10.1787/20755120-2010-table2). 13 The government’s policy (Athina programme plan) to reduce the number of university entrants and to merge and eliminate university schools and technical higher education institutions increases drastically the preparatory financial cost for the extremely competitive national university entrance examinations and the prospective consequence of this policy is to skew the class profile of the new entrants in favour of the middle class at the expense of youth coming from working-class and agricultural backgrounds.
5
the massive expansion of higher education has allowed Greece to achieve parity with other developed societies in regard to tertiary attainment among the general population. Specifically, in the population cohort aged 25-64, Greece had already attained a 21.3% rate in university graduates in 2005, i.e. slightly more than one fifth of the active population held university qualifications, a percentage that was further increased to one quarter of the effective active population (24.6%) by 2010.14
The second dimension of cultural poverty is highlighted by the sociological theory of R. Putnam on ‘social capital’. The concept of ‘social capital’ refers to interpersonal networks of social interaction and bonds of solidarity through which the individual derives social support regardless of his/her employment status or his/her income. Access to ‘social capital’ constitutes the major mechanism of survival of the poor (in Greece the dominant form of ‘social capital’ is the family institution) after the welfare transfers of the social state. Due to the neoliberal attack on the ‘welfare state’ internationally in order to cut down drastically the social expenditures of state budgets, ‘social capital’ becomes the main factor of support of the survival strategies of the poor, while it itself suffers the pressure exercised by the creeping disintegration of the ‘social web’ that Greece undergoes in the current crisis.
The third dimension of cultural poverty concerns the possession of ‘symbolic capital’ according to the sociological approach of P. Bourdieu. ‘Symbolic capital’ refers to the kinds and the quality of sociocultural resources that an individual possesses or can utilise. It is connected to the educational level attained but it is irreducible to the latter. It encompasses the diverse cultural attitudes and the competence in language use to understand and interpret the symbolic structures of society, the flows of representations and the intentions inscribed tacitly in behavioural patterns and in social practices and which predispose positively or negatively the ability of the individuals to confront and/or adjust to social changes and the risks countenanced and experienced by the contemporary subjects and social groups. The concept of symbolic or cultural capital refers also to the plexus of sociocultural skills that determine the ability of the subject to adapt to the contingent technological, aesthetic, economic and cultural changes that take place in late modernity (f.ex. ‘life-learning’ policies that constitute the contemporary training strategy for re-entrance in the labour markets cannot work effectively in the absence of symbolic capital or if it is meekly present). Symbolic capital is tied closely to forms of public knowledge and the capacity to mobilise symbolic capital is tantamount to an understanding of political processes and a precondition for an effective political participation. In general, the knowledge reservoir is a basic cultural resource for both a meaningful and critical engagement with the political realm since ‘the specifically symbolic power to impose the principles of the construction of reality – in particular, social reality – is a major dimension of political power’15. As a consequence, lack of symbolic capital by the poor can account for their preponderant tendency to abstain from involvement in political processes, for their political apathy and the inability to exercise their political rights. 14 OECD Factbook statistics. Country statistical profile: Greece 2013, http://dx.doi.org/10.1787/csp-grc-table-2013-en 15 P. Bourdieu, Outline of a Theory of Practice (Cambridge: Cambridge University Press, 1977), p. 165 cited in S. W. Foster, ‘Reading Pierre Bourdieu’, Cultural Anthroplogy, 1(1), (February 1986): 103-110, 105.
6
Lastly, the question of the genetic causes of the specific characteristics of poverty is starkly illuminated by the ‘capabilities approach’ of Amartya Sen, emphasising the freedoms and rights people have.16 ‘Capability’ refers to a person’s ability to achieve certain outcomes, doings and beings which collectively are termed ‘functionings’. It measures human development by freedom, which is according to Sen ‘the capabilities of people to lead the kind of lives they value’.17 Among other things, this approach has shown that on the macroscopic level the magnitude of poverty in a society bears a direct relationship to the political form of rule, that is, it is consistently lower under a democratic form of governance rather than in a dictatorship. Sen’s perspective exploded the dominant neoclassical understanding of welfare economics and showed that a narrow ‘economistic’ consideration of the social problem of poverty not only distorts the scientific analysis of it but it cannot also contribute to the design of a holistic policy perspective addressing it effectively.
2. Key trends of inequality and poverty in Greece
2.1 The evolution of income disparity from 1985 to the present
As it was mentioned above, a key indicator that captures income inequality is the Gini coefficient applied to the national income distribution. This index is distinguished in the before-tax Gini and the after-tax Gini. The pre-tax Gini coefficient describes disparity in market income whereas the after-tax Gini coefficient refers to the inequality of disposable income after taxes and having taken into consideration welfare transfers. In Greece the evolution of income disparity according to OECD figures ranged from 0.43 in 1986 on the before-tax Gini to 0.45 in 1994 to 0.47 in 1998 and then started to move slightly downward to 0.45 in 2003 to 0.44 in 2008. The after-tax Gini remained steady at 0.34 in 1986 to 1994, increased slightly to 0.35 in 1998 and declined afterwards to 0.32 in 2004 and 0.31 in 2008.18 According to the OECD analysis of the income inequality trends in the OECD countries in the late 2000s, Greece was the stark exception in exhibiting a declining rate of inequality (Turkey too but falling from a significantly higher level of unequal income dispersal).19 The Eurostat figures of the income Gini coefficient for Greece portray a slightly different picture. The Gini figure for 2008 is 33.4. In the next two years it falls imperceptibly (33.1 for 2009 and 32.9 for the year 2010) but the downward inclination is halted and the Gini index swings upward to 33.5 in 2011.20
Given the historically unprecedented and severest crisis Greece is undergoing currently, it is plausible to claim that the after-tax rate of income inequality will be subject to countervailing forces. A potential decline must not be interpreted as the policy outcome of any deliberate strategy to blunt income disparities but as the unintended structural effect of the general impoverishment of the Greek people. Since the income Gini coefficient measures the total
16 P. Anand et al., ‘The Measurement of Capabilities’, p. 283. 17 James E. Foster, Christopher Handy, ‘External Capabilities’ in Basu and Kanbur (eds.), Arguments for a Better World , op. cit., pp. 362-374, 362. A. Sen, Development as Freedom (New York: Knopf, 1999). 18 See table GiniPlots Greece.png in Wikipedia, lemma ‘Gini coefficient’, p. 4. 19 An Overview of Growing Income Inequalities in OECD Countries: Main Findings, OECD 2011, p. 24. www.oesd.org/els/social/inequality 20 Eurostat table on Gini coefficient of equivalised disposable income
7
aggregate of the mean relative differences, if a disproportionate large share of the population suffers income reduction then this widespread income levelling and the explosion in numbers of the bottom and lower income groups will translate itself in a less pointed income dispersion and thus as a decline in the measured index. The Gini coefficient is a relative indicator of inequality. If the income gap between two individuals narrows considerably while the income of both drops then their relative standing to each other is less unequal even though they are getting poorer simultaneously.
Four empirical reasons which can support such an extrapolation are 1) the continual increase in taxation imposed on the population and especially the abolition of tax-exempt income and of various tax-exempt household expenditures for the social category of free-lance professionals and small business owners who constitute a significant portion of the overall tax basis. 2) The imposition of a poll-tax (‘haratsi’) for the third consecutive year on all privately-owned buildings, apartments, warehouses and land-holdings, 3) an expected increase on undeclared income and intensified tax evasion as a reaction to the horizontal over-taxation imposed on the active population as a whole and 4) the fierce loosening of the employment protection legislation, the dismantling of collective bargaining in the name of increasing ‘labour cost competitiveness’ and in favour of enterprise-level wage negotiations will push downwards the average full-time wage earnings across the whole private sector. The concerted effect of these four reasons will lower the officially registered after-tax disposable income and this will appear as a declining after-tax income Gini coefficient for the country as a whole. It has to be noted that the income Gini coefficient is an indicator of the variability of the mean relative differences depending on the granularity (the number of measured brackets) of the income scale and not an indicator of the absolute level of poverty. This means practically that we can have declining income inequality while the country is getting poorer as a whole.21
On the other hand, if we consider a) the fast rising unemployment rate and in particular the disproportionate share of long-term unemployment in the overall composition of unemployment b) the significant shift of the waged employment structure toward part-time and casual labour and c) the policy effect of the diminution of welfare transfers to households (lower unemployment benefits, reduced pensions) then the concerted impact of such loss of earnings and of social spendings for a large part of the population will amplify income disparity between employed individuals and the stratum of the unemployed in tandem with part-time and temporary labour and the pensioners.22 A possible scenario of the trend in income inequality is to have a declining rate of the market income Gini index (data for which
21 A characteristic example of the misleading effects of the Gini coefficient when used in comparative measurement (the Gini coefficient is a synchronic indicator and potentially misleads when it compares two or more countries at the same time or a country at different time points without considering possible structural demographic changes in the population) is the case of Bangladesh (per capita income of $ 1,693) and the Netherlands (per capita income of $ 42,183) that both had an income Gini index of 0.31 in 2010, in spite of the obvious great difference in absolute income. See: Wikipedia, ‘Gini coefficient’, p. 6. 22 On average across the OECD, the share of part-time employment in total employment increased to about 16% by the late 2000s. If we add part-time workers to the full-time gross earnings distribution then the Gini coefficient of inequality increases by more than five percentage points on the average. OECD 2011, An Overview of Growing Income Inequalities, p. 32.

8
are not collected by Greece) and an increase of the after-tax net disposable income inequality rate and a consequent narrowing of the gap between the two, a prominent sign that the redistributive effect of cash benefits of the welfare state has failed on its purpose to mitigate income inequality. It must be noted that welfare redistribution is not restricted only to cash transfers but it involves also the degree of state expenditures relative to GDP on public social services (education, health, care services, etc.) even though the redistribution effects of public social services are not the prime objective but the provision of a decent living standard for all. Still, governmental provision of social services has a strong redistributive impact by reducing income inequality by one-fifth on average across the OECD countries. For Greece in-kind benefits from public services in the pre-crisis year 2007 resulted in reducing the household income inequality Gini coefficient before accounting for services from education, health, social housing and care services, from 0.34 to approximately 0.28 after accounting for such services.23 In view of the systematic curbing in financing Greek public social services consequent to the imposition of the two austerity package pacts, the prospect is that the redistributive impact of the lowered in-kind benefits will minimise the hitherto achieved moderation of household income inequality and will tend to nullify its redistributional effect on income disparities.
2.2 Greek income inequality by income quintile share ratio
The inequality of income distribution can be depicted by an indicator that calculates the income received by the bottom 20% of the population in the income scale and compares it to the income apportioned to the top 20% of the income scale. The ratio between these two quintiles is the index of income inequality. Income refers to ‘equivalised disposable income’. The trend in the ratio between the two quintiles was slowly declining from 6.1 in 2006 to 6.0 in 2007 to 5.9 in 2008 to 5.8 in 2009 to 5.6 in 2010. In 2011 it halted its descent, it increased and reverted back to its 2007 ratio of 6.0. It shows that the top 20% income bracket enjoys six times more disposable income than the lowest 20% income bracket. This ratio compares unfavourably to the EU average of 27 countries or to the EU average of the 15 countries since the latter two have a value of 5.1. Greece has the second highest unequal income distribution in the Eurozone after Spain (whose ratio is 6.8).
2.3 The standing of Greece on the main indicators of poverty risk
The overall trend of Greek GDP (Gross Domestic Product) growth expressed in PPS (purchasing power standard that adjusts for cross-country price differentials) per inhabitant peaked in 2008 to a provisional estimate of 23100E and thereafter declined continuously reaching a provisional 20100E level (and expected to further shrink in 2012 and in 2013) having regressed below the 2004 level.24
A similar trend of overall national impoverishment is indicated when we consider the decline of the aggregate fund of gross wages and salaries. From the peak level of 66858.8 million
23 OECD 2011, An Overview of Growing Income Inequalities, pp. 38-9, Figure 11. 24 Source: Eurostat latest figures updated April 2013.
9
EUR in current prices in 2009, the total wages fund has declined to 49291.6 million EUR in 2012, a reduction of 26.27% (author’s calculation) in just a three-year span.25
The most significant national poverty indicator is the at-risk-of-poverty or social exclusion indicator which corresponds to the sum of persons who are at risk of poverty (those who are below the poverty threshold after social transfers) or severely materially deprived or living in households with very low work intensity (where the adults – aged 18-59 – work less than 20% of their total work potential during the past year). Regardless of the fact that persons may be present in several sub-indicators, the at-risk-of poverty/exclusion indicator counts them only once so it determines the actual or absolute number of paupers in a given country. Percentage-wise the estimate of people at risk of poverty or social exclusion in Greece is 31.0%, the fourth largest after Bulgaria, Latvia and Romania and by far the highest in the Eurozone. In terms of absolute numbers, the figure stands for 3403 thousand persons (or three million four hundred thousand individuals) the highest ever in the EU recorded history.26
Since the at-risk-of-poverty rate is calculated on the basis of the at-risk-of-poverty threshold that estimates the 60% of the national median equivalised disposable income after social transfers and in purchase parity standards to eliminate the discrepancy in the different national costs of living, it is important to pinpoint its actual figure. It was 6889E in 2011 having fallen 9% (author’s calculation) from the previous year. Because the poverty threshold is a relative moving standard of income estimation when it falls it may signify a lowering of the at-risk-of-poverty rate depending on how the different population income segments are affected by the deteriorating economic situation of a country. The at-risk-of poverty rate (which indicates solely income poverty, not social exclusion and deprivation, and refers to those who are below the 60% poverty threshold) remained almost stable throughout the 2000s culminating to a 21.4% in 2011. The absolute number of people at risk of poverty after social transfers ranged around 2200 thousand persons from 2003 to 2010 and increased to 2349000 individuals in 2011.
What is of significance in terms of being mired in pauperism is the time span a poor household endures in poverty conditions. This endurance under poverty status (hard-core poverty) is captured by the ‘persistent at-risk-of-poverty rate’ indicator. It shows the percentage of the population whose equivalised disposable income was below the poverty threshold for any given year and at least for 2 out of the preceding 3 years. From the onset of the crisis the available data show that persistent poverty reached 17.6% in 2010, a 35.4% rise over the year 2008 (author’s calculation).27
The depth of poverty, which helps to quantify just how poor the poor are, can be measured by the relative median at-risk-of-poverty gap. This indicator presents the difference between the poverty threshold and the median equivalised disposable income of the poor expressed as a percentage of the at-risk-of-poverty threshold, i.e how much the median income of the poor is
25 Eurostat table on Gross wages and salaries. 26 Eurostat tables on People at risk of poverty or social exclusion by percentage of total population and by 1000 persons. 27 Eurostat table on Persistent at-risk-of-poverty rate (the Greek rate for 2008 is 13.0).
10
below the 60% poverty threshold. The larger the percentage the deeper is the poverty of the poor. This percentage stands at 26.1% in 2011, slightly above the previous seven years (2004-2010) but it is nearly 10% lower than the poverty depth existing in Greece throughout the late 1990s and early 2000s (1995 to 2003).28
An indicator and the cluster of sub-indicators that allows recognition of the internal composition of the pauper stratum and identification of the social groups that tend to fall below the poverty line is the at-risk-of-poverty rate by most frequent activity status. The sub-indicators refer to the following types of activity: a) employment b) non employment c) unemployment d) retired e) inactive population f) other. For Greece the poverty rate by most frequent activity for the population as a whole was 20.9% in 2011. By type of most frequent activity the rates for 2011 are as follows: The share of employed persons who fall below the poverty line is 11.9%. These are the so-called working poor. The share of ‘not employed persons’ rises to 28.1%. The rate for the unemployed persons leaps to 44.0% which means that nearly one in two unemployed persons lives in poverty. It also highlights the close correlation between unemployment and poverty status. The percentage of retired persons living in poverty is 19.9% whereas the category of ‘other inactive persons’ exhibits a sizable share of 30.0% faced with an impoverished existence.29 It must be noted that the category of ‘other inactive persons’ under-estimates the actual rate of persons living in poverty because the ECHR (European Community Household Panel) does not include in its representative sample the homeless, those living in collective households and difficult to reach groups.30 All these ‘difficult-to-reach’ groups refer to groups steeped in poverty like the prison inmate population, drug-dependent communities, the institutionalised mentally ill, senior citizens living in collective housing, orphanages and most importantly slum dwellers (the ‘Fourth world’ within the ‘First world’). Apart from the distorting effect such cavalier attitude to appropriate sampling procedures creates by excluding precisely the typical socially excluded and marginalised groups from (statistical) representation, as the authors themselves confess, ‘there are concerns about data quality for those at the lower end of the income distribution’.31
One crucial indicator of abject absolute poverty is living in a jobless household. This indicator grasps the share of persons aged 18 to 59 who are living in households where no-one works and thus they are deprived of any (market) income. In the last two to three years the share of income deprived households has nearly doubled. Broken down by sex the indicator reveals that the share of males (the traditional bread-winner in Greek society) living in jobless households rose to unprecedented levels from 5.7% in 2008 to 8.6% in 2010 and higher up to 12.2% in 2011. The corresponding figures for the female sex are 9.3% in 2008, 12.0% in 2010 and 15.3% in 2011. Thus over one in ten households live in extreme indigence. Of particular significance is the share of jobless households with children since family joblessness implies that these children are victims of child poverty. The share of
28 Eurostat table on Relative median at-risk-of-poverty gap. 29 Eurostat tables on At-risk-of-poverty rate by most frequent activity status. 30 Ian Dennis and Anne-Catherine Guio, ‘Poverty and social exclusion in the EU after Laaken-part 1’, Eurostat: Population and Social Conditions, Theme 3-8/2003, p. 7. 31 I. Dennis and A. Guio, ibid., p. 7.
11
persons aged 0-17 who are living in households where no-one works almost tripled in the last few years. From a share of 3.6% in 2008 it skyrocketed to 9.2% in 2011.32
2.4 Indices of material and social deprivation
Material deprivation refers to the inability of persons to satisfy some primary needs f.ex. heating one’s home) and their lack of basic amenities that provide for an acceptable standard of living. It is operationalised by nine discrete items (listed in section 3.2.c) where the lack of any three items defines the individual as suffering material deprivation and if s/he lacks at least four items s/he suffers severe material deprivation. The material deprivation rate in Greece has ranged in the last decade from 21.8% in 2008 to 31.0 in 2003 with the latest yearly datum available, on the high end of the trend, being 28.4% in 2011. This percentage of the population suffering material deprivation is almost double or 91.9% higher (author’s calculation) than the average rate for the Eurozone area as a whole (14.8% in 2011) and bespeaks of a trend of divergence rather than convergence with the rest of the Eurozone countries. This trend of divergence has intensified from 2009 onwards. In terms of gender breakdown there is no significance in male or female deprivation, the women’s being very slightly higher (29.0% vis-à-vis 27.7% for males).33
A revealing indicator of the degree of relative social deprivation in the poverty profile of a country is the housing cost overburden. This indicator defines the percentage of the population that lives in a household where the net total housing costs represent more than 40% of the total disposable household income. The percentage shares are estimated according to income quintiles (from the bottom 20% of the income scale, the first quintile to the top 20% income earners or the fifth quintile). From 2004 to 2010 the housing cost overburden rate for the bottom 20% fluctuated from 65.4% (2005) to 70.9% (2004). In 2011 it jumped over 80.5%. This means that 8 out of 10 poor households34 allocate a disproportionate share of their income to meet housing costs. The percentage share of the next quintile above the bottom one that is overburdened with housing costs falls to a 29.0% rate (one in three households) and as expected the percentage share for the higher up quintiles drops progressively to near nil. 7.0% for the third quintile in 2011, 3.6% for the fourth quintile and barely 1% for the fifth quintile in 2011.35 The relatively higher percentage of housing cost overburdened households living in urban centres indicates on the one hand the effect of higher rents and on the other hand that there is a tendency of poor households to cluster in poverty ghettoes in large urban conurbations.36 In terms of income stratification, the poor households whose income is less than the 60% of median equivalised income suffer in their
32 Eurostat tables on Jobless households by sex (males/females) and Jobless households- children. 33 Eurostat: Material Deprivation rate by sex. 34 Since the national income poverty rate exceeds 20% then the whole bottom income quintile belongs to the category of paupers. 35 Eurostat tables on Housing cost overburden rate by income quintiles. 36 The housing cost overburden rate for densely-populated areas is 27.2% whereas for the thinly-populated areas falls to 20.5% in 2011. See: Eurostat, Housing cost overburden rate by degree of urbanisation

12
largest part from housing cost overburdens (52.6% in 2011) as against those households which are above the poverty threshold (23.8% in 2011).37
Another indicator that partially reflects the ‘cultural poverty’ of the poor and the sense of cultural impotence that permeates this social stratum is the ‘self-reported unmet need for medical examination or treatment’. It does not describe the objective health condition of the poor but the subjective incapacitation when they have a medical problem to seek out treatment. The reasons for eschewing seeking medical advice or treatment include unaffordability to pay, long distance to travel, long waiting lists, lack of time, fear, lack of guidance and informational poverty as to the appropriate specialist to address themselves. According to the first quintile of equivalised income that concerns the bottom 20% of the people in the income scale, in Greece in 2011, 10.2% or one in ten was deprived from self-acknowledged medical assistance.
2.5 The Labour market and the rates of unemployment by age and sex
The growth of unemployment has obtained a nightmarish dimension from the onset of the economic crisis and the recessionary impact of the austerity measures. The rate of unemployment for the youth (person aged less than 25 years) climbed from 25.8% in 2009 to 32.9% in 2010 to 44.4% in 2011 reaching the exorbitant magnitude of 55.4% in 2012. This means that more than one in two young persons is unemployed even though s/he has been actively seeking to find any kind of job.
The total rate of unemployment has skyrocketed. From the beginning of 2010 till the beginning of 2012 the rate of unemployment increased steeply from 11.2% to 21.9%. By the end of the fourth quarter of 2012 it had exceeded 26%, the highest ever in the post-dictatorship (1974) period. In the middle of 2012 the rate of unemployment was twice as much as the unemployment average for the EU of the 15 countries. By the end of 2012 the Greek unemployment rate exceeded that of Spain, a country characterised by the highest persistent unemployment rate.38
Historically, in the diachronic composition of unemployment women were always over-represented. For instance in the gender composition of unemployment in 2007, women constituted 63% of the total unemployment. Between the years 2007 and 2011, while the total number of unemployed among the population of working age increased by 470000 individuals (or 115%), the number of male unemployed aged 15-64 almost tripled (an increase of 185%). This increase was far greater than the corresponding one for women (75%). As a consequence the unemployed men in 2011 comprised a far larger piece of the unemployment pie in comparison to 2007 (49% as against 37% in 2007). 39
Long-term unemployment in Greece (unemployed persons longer than one year) fluctuated around 55% of total unemployment between 1995 and 2006. From 2006 to 2009 the
37 Source: Eurostat SILC. 38 Source: Observatory of the Labour Institute of the General Confederation of Greek Labour, ww.ineobservatory.gr 39 Source: Observatory of the Labour Institute of GSEE.
13
percentage of long-term unemployment was reduced by 15 percentile points. While till 2008 the reduced percentage of long-term unemployment was due to an actual reduction of the absolute number of long-term unemployed persons, from 2009 the reduction is due to the extremely fast rising unemployment of the short-term unemployed. After 2010 the recessionary impact of the Memorandum’s austerity measures led to a significant increase of long-term unemployment. In 2011 long-term unemployment’s share constituted 50% of the total unemployment. The rate of increase of long-term unemployment has not abated at all. On the contrary while it increased 44.8% in the first quarter of 2011, it grew even more rapidly by 54.7% in the first quarter of 2012.40
The rate of employment of the active population (aged 15-64) increased by 7.5 percentile points in the period 1995 to 2008, and this increase corresponds to a 21% growth of the total employment. The increase in the rate of employment was significantly higher for women (their participation rate grew from 38% to 48.7%) than for men (it grew from 72.2% to 75%). Nevertheless, the economic crisis has caused disastrous effects on the employment rate. In 2011 the employment rate returned back to the 1995 level (55.6% in 2011 vis-à-vis 54.5% in 1995). In the years 2010 and 2011 when Memorandum’s austerity was implemented the rate of employment declined by 6 percentile points, a decline that corresponds to the loss of 400000 jobs in relation to the 2009.41
3. The divide between rich and poor in everyday life
3.1 The class polarisation of society
The poor are located in certain positions in the societal structure. These positions are hierarchically organised and define the relative standing of the poor as distinctive groups vis-à-vis other categories of the poor and in relation to the affluent whether of the middle-class or of the high bourgeoisie. Such positions entail clusters of necessities associated with them (f.ex. certain norms of consumption to keep up with the neighbours), and are signposts in the overall distribution of economic and symbolic capital.42
In Greek society under crisis there is a severe social cleavage that polarises rapidly the existing social groups into two distinctive class groupings. The poor are getting poorer, the employed middle classes are being proletarianised and the bourgeois class depending on the mode of its integration in the social division of labour is affected variously by the ongoing economic slump. There are three major causes that contribute preponderantly to such dramatic shift in the character of the socio-economic structure of society.
1) The protracted and deep economic recession has lowered the GNP more than 20% in the last four years (2009-2012) and the projections of international organisations estimate an additional reduction of 4.5% for the current (2013) year. Such abrupt reduction in the annual wealth produced in such a short time span has been appropriately described as the equivalent
40 Source: Observatory of the Labour Institute. 41 Source: Observatory of the Labour Institute. 42 P. Bourdieu, ‘From Rules to Strategies: An Interview with Pierre Bourdieu’, Cultural Anthropolgy 1(1), (February 1986): 110-120, 117.
14
to a war’s impact. Historical comparative evaluations suggest that the Greek economic crisis is unprecedented and that it exceeds even the Great depression suffered by the US economy in the inter-war years. The consequence of the slump is the ruination of a major portion of the small-scale and medium-sized businesses which form the backbone of the economy and constitute the major source of employment in the private sector. The main reason for their ruination is the free-fall of effective demand. It has to be noted that those affected most severely are the business segments that depend primarily on internal consumption and on imports from abroad. Two other reasons that contribute to the demise of the petty-bourgeoisie are a) the inability to get bank loans and/or to refinance stock replenishments and operating expenses. Such credit crunch is the consequence of the bankrupt state of the Greek banking sector due to substandard capitalisation as a result of both the PSI and the PSI plus in tandem with the steeply increased unserviceable debt incurred by the private sector and domestic households. The third reason is of a sociocultural provenance. Greek society is a predominantly individualistic society. Such staunch individualism has hindered business owners from marshalling their resources in common, from establishing collaborative business networks and from seeking economies of scale to weather the oncoming crisis. Additionally, the great majority of private proprietors lack business expertise and thus the competence to adopt pre-emptive cushioning measures or even understand the cyclical business character of crisis phenomena in capitalism.43 We must also stress the total absence of the state in providing know-how or deploying macro-economic business policies that could upgrade small-scale business operations. Such ‘knowledgeable’ state interventionism seeking nationalist grandeur is considered the primary cause of the developmental success of the private sector in Southeast Asian countries.44
2) The extremely fast rise in the unemployment rate from circa 7% at the beginning of the crisis to 27% and rising currently. The collapse of the small- and medium-sized business sector contributes in two ways to the inflation of the stratum of paupers. Firstly, the business owners themselves become income-less when they go bankrupt or end up with earnings lower than the average wage due to over-taxation and exorbitant social contributions.45 Secondly, the small business sector (enterprises employing less than ten persons) is by far the largest employer in the country accounting for more than 70% of the overall private employment. Bankruptcies or financial distress compel small businesses to lay off or reduce drastically the number of their employees. The rise in unemployment shrinks further the level of effective demand and this in turn accelerates business closures. It must be stressed in this
43 This form of ‘cultural poverty’ is indicated by the extremely low rate of technological change (operationalised by small business R&D expenditures) that characterises small- and medium-sized firms. It also reflects widespread societal cultural poverty as it is shown by the dwindling share of R&D in the State’s budget. An illustrative instance of this is the closing down of the sole National Centre for Social Research (EKKE) and its partial merging with another scientific institute catering to natural sciences, purely for economising reasons. The EU grand project of promoting a ‘knowledge society’ is translated in the Greek state’s research policy into the mission for a ‘society of ignorance’ where national social research is deemed a superfluity. 44 Manuel Castells, The Information Age: Economy, Society and Culture, Volume 1: The Rise of the Network Society, 2nd edition (Oxford: Blackwell, 2000), pp. 135, 198ff. 45 The average monthly mandatory contribution to his/her state-controlled social insurance fund of a self-employed professional or a small entrepreneur exceeds 450 Euros, i.e. it is a bit less than the current minimum full-time wage.
15
regard that the level of effective demand was seriously hurt by the state austerity policies that reduced by fiat the wages and salaries in the public sector.
3) The third factor that leads to class polarisation is the great number of debtors who are in serious difficulty to serve their debt burden. According to a research conducted by Public Issue46 8 out of 10 households face serious difficulties to service their debt. The rate was 65% in 2008, 60% in 2009 and rose to 84% in 2012. In 2012 four out of ten Greek households (41%) had incurred a bank loan. In absolute numbers, the rate of indebted households corresponds to 1.541.735 households. The greater percentage of such loans concerns home mortgages. 78% of the households report great difficulty to pay the monthly instalments whereas an additional 6% declare that they have ceased payments altogether. The households which face the greatest difficulty to serve their loans are households with children (83%) and households which belong to the lower social strata (90%). The case study family we analyse below belongs precisely in these two categories which encompass the greatest portion of households at-risk-of-poverty in Greece. Financial inability to serve regularly one’s debt is a main indicator of material deprivation.
The class stratification in Greece is traversed by the three socio-economic cleavages highlighted above. There is the growing impoverishment of the middle-classes and of the petty-bourgeoisie who turn en masse to casual or temporary employment or inflate the ranks of the unemployed or persist in their business activity but earn only a substandard income, insufficient to achieve a material reproduction of themselves and their families. Second, there is the divide between the employed and the unemployed. The upsurge in the ranks of the unemployed implies a continuous pressure on the wage scales of the employed and in view of the fierce labour employment protection (LEP) deregulation policies enacted by the right-wing coalition government it is fairly predictable that an overall down-swing of the wage structure will ensue as well as mounting social tensions between those with work and the workless. The third cleavage concerns the two distinctive social categories of the indebted and those without any debt obligations. Given the huge percentage of those indebted who report inability to pay up regularly, any continuation of the economic slump makes them extremely vulnerable to end up in the precariat or augment the ranks of the pauper class.
3.2 A case study of a typical poor multi-member household
Employing a qualitative research method, that of semi-structured interview, the study records and analyses the ‘lived experience’ of a typical poor Greek family. The case study concerns a household unit of six members, a multi-children family (polytechni) with two parents and four young children residing in one of the largest urban conurbations in Greece (the city of Patra). The pater familias (male in his late forties) is a long-term unemployed (two years in a row) formerly employed as an informatics technician in a large, foreign multinational company operating in Greece. The wife (in her late thirties) holds a typical secretarial job in a public higher education institution. The age of the four children (three female, one male) ranges from four years’ old to nine years’ old. Two of those are enrolled to a primary public
46 See: www. iapopsi.gr (Public Issue research on inability of households to service their debt), 27/3/2013.
16
school in their municipality and the other two of under-school age stay at home. The study examines a) the structure of the unit’s average monthly household consumption and its budget allocations to primary and secondary goods and services b) the degree of material deprivations and their social effects on the family’s state of living c) the subjective estimation of social needs that the family unit considers necessary to fulfil in order to attain a dignified social reproduction and the cost of living and the hypothetical income stream which could support such standard of living.
3.2.a Monthly household expenditure
The household income is 850 Euros per month (approximately 11000 Eur/year) and the annual income gained sets this typical multi-person household well below the national poverty threshold. According to my calculations the equivalised disposable income for this six-member family is approximately 4,000 euros. The equivalised disposable income is the total income of a household, after tax and other deductions have been subtracted, that is available for spending or saving, divided by the number of household members converted into equalised adults.47 It must be stressed that this indicator (equivalised disposable income) which is the basis on which the at-risk-of-poverty rate is determined and thus the magnitude of poverty in any country, under-reports the real magnitude of poverty, at least in the case of Greece and this occurs because of the following two reasons.48 A major part of the austerity measures enforced by the Memorandum agreements concerns the imposition of poll taxes on all forms of landed property (home ownership etc.). These poll taxes are not collected directly by the tax authorities but via the electricity bills. So they do not appear as taxes deductible in order to determine the net disposable income but they are ‘hidden’ as a part of household expenses on electricity consumption. The same logic applies also to municipal taxes which are also collected through the electricity bill. Thus all such tax payments that ought to be deducted and they would have lowered significantly the average disposable income, appear to be a portion of disposable income to be spent at one’s discretion. In absolute terms, households appear to enjoy a higher level of discretionary income than they actually do.
The monthly budget of the case study’s family is wholly allocated in three distinctive consumptive categories, food, transportation costs, utility bills. The expenditure breakdown is as follows. Expenditure on food takes up more than 50% of the monthly budget or 500 E – 59% of the total household monthly expenditure. Any percentage higher than 30% of the total monthly disposable income is considered a sign of a state of poverty since food expenditure is the primary need poor households tend to provide for. Expenditure on transportation costs takes up almost one fourth of the total monthly budget or 200 euros (24%). The working
47 The making equivalent of the household members is done by weighting each person according to their age using the so-called modified OECD equivalence scale. This scale gives a weight of 1.0 to the first adult, 0.5 to the second and each subsequent person aged 14 and over and 0.3 to each child aged under 14. The equivalised household size figure of our case study family is 2.7. For the definitions used, see: Eurostat, Glossary: Equivalised disposable income. 48 The Eurostat calculation of ‘equivalised disposable income’ is derived from a longitudinal panel study so it can control for a surreptitious estimation of ‘net income’ encompassing tax payments. On the other hand, since its measurement involves sampling it is exposed to sample margins of error which remain unspecified in its database.

17
mother commutes to her workplace at a distance of more than 10Khm by car and transports her school-attending children to their school located nearby her workplace. The use of a private car is an absolute necessity since there are neither mass transportation connections between the place of residence and the workplace nor public school-bus provision for the kids. This dependence on private commutation makes the family much exposed to increases in gasoline prices and creates great worries when regular car service is required or unexpected repair costs are incurred. The rest of the monthly income is spent on utility bills, electricity, water supply and telephony, and takes up 150 E or 17% of the total.
This typical poor family is in dire need. Once-a-time annual expenditures cannot be provided for. Expenses on clothes, shoes and school materiel for the children cannot be met. Some support for these expenses is provided by the pensioned grand-parents (use of family ‘social capital’ as mentioned above). Some second-hand clothes are given to the kids (apart from the younger wearing the clothes of the older) from family friends. The parents cannot afford to buy any clothes for themselves or to buy any gifts for each other and for the kids in birthdays or name-day festivities.
Lastly, the family does not have to pay any rent but it has to pay the monthly loan instalments for the purchased house. The total monthly debt owed amounts to 750 euros (it includes bank loans, credit card debt and debt obligations to third persons). The family is utterly unable to serve this debt burden and has ceased payments. It is faced with the imminent possibility of foreclosure which suggests the realistic threat of becoming homeless in the next twelve months. It is a typical case of an indebted family household among hundreds of thousand other Greek households who cannot serve private housing loans and are faced with massive foreclosures. (It has to be stressed that there was never implemented in Greece any national public housing policy offering either interest-free loans to the poor or cheap rents in public housing projects).
3.2.b Material deprivation and its socio-psychological impact
Living under perennial material deprivation creates a tremendously adverse impact on the social and psychological state of a poor family. Here I will briefly touch upon only on the most significant aspects of deprivation and its ill-effects revealed by the interview. The three main forms of material and social deprivation suffered by this typical poor household consist of a) undernourishment b) impossibility to go out and participate in social outings and maintaining the social network of friends and acquaintances and c) inability to provide for consumption of cultural goods, for the children’s education and to take vacations.
The food composition is of a low nutritional value and heavily unbalanced in spite of parental knowledge of a proper hygienic diet. The interviewee mentioned that the family is most often unable to purchase fruits and cheese products on a weekly basis, rarely meat and never fish. Consumption of pasta is the daily staple diet. It is characteristic of such deprived state that the purchase of souvlakia (a traditional cheap Greek food item) for the kids is considered a ‘luxury’ and the kids ‘celebrate’ if the chance appears to eat souvlakia. Undernourishment results not only due to the expensiveness of high-protein edibles but also due to the illegal
18
cartelisation of oligopolistic industries, their consequent price fixing and the ‘market rents’ they enjoy. A case in point is the dairy industry and the consumption of milk, milk being the commonest child nutrient for the average Greek family. Let us calculate the monthly cost of milk consumption for our case study family. The regular retail price for a so-called ‘freshly’ packaged milk bottle of one litter ranges from 1 euro 20 cents to 2 euros 13 cents for the bio high-end milk market. The medically recommended dosage is 300 millilitres twice a day per child. If we assume an average price of 1 and ½ euros per bottle then the daily cost is 90 cents per day per child which gives a monthly cost of 108 euros for milk consumption just for the children or more than one fifth of the total monthly food expenditure. If we assume that overpricing amounts to one third (1/3, this being a conservative estimate) of the retail price or 50 cents per bottle and annualise milk consumption per child we end up with an amount of 110 euros surcharge due to price fixing. For reasons of comparison we should pinpoint that the government’s subsidy for families having three or more children is 500 euros per child yearly and this subsidy is meant to cover all the child’s living expenses.
In the pre-crisis period when the household was two-waged the family used to go out every weekend. Either to a movie house, to a tavern or to a social gathering and/or a children’s party. Every month they used to take a family excursion to nearby vicinities in the Peloponnesus peninsula. Currently, they cannot finance either excursions or even a simple weekend outing. This condition breeds social isolation and self-imposed exclusion from social gatherings, networks of friends and relatives and abstinence from periodic communal festivities. No interpersonal social bonds can be established and be maintained for long without the capacity to reciprocate in kind (buying gifts, bringing presents, paying your share at common dinners) and paying participation costs at the various community events. For instance, in Patra there exists the custom of annual celebration of the carnival parade (nationally famed) that is both a mark of local pride and the culturally necessary event to participate for the whole town. As reported by the interviewee the family had to abstain from parading (to the great disappointment of the kids) because it could not afford the 64 euros required for the purchase of costumes for the mother and the four children.
Consumption of cultural goods and services is nearly impossible. This is an educated book reading family. No books can be bought either for the parents or the kids. (It has to be noted that there is no developed public library loan system in Greece and municipal libraries wherever they exist are under-resourced, under-staffed and at the brink of collapse). Movie-going, music concert-going or theatre-going is out of the question. Children at school cannot pay their contribution to school-organised excursions and cultural visits and so they have to remain behind and suffer the ‘stigma’ of segregation from the rest of the class. The children are also culturally deprived for the family cannot finance any extra-curriculum activities, for drawing and ballet lessons and sports’ activities as it used to do in the past.
The household also belongs in the category of the information and communication poor. In the past they could afford leased-based mobile telephony. This has been replaced now by a 10 euro monthly pre-paid mobile phone card. Stable telephony/internet use provision is irregular (the service was interrupted for four months due to unpaid bills).
19
Lastly, after the father lost his job (three years ago, as a long-lasting unemployed he is not entitled to any unemployment benefits nor any social allowances for being an income-less poor) the family had to forego any kind of vacations. Previously the whole family vacated for a ten-day period. In the last two years the only summer recreational activity was to travel by car to the nearest beach (12 Km trip) for a swim. They went altogether seven times. This year they cannot afford to visit a beach even once due to the transportation costs.
The continual financial distress and the inability to meet its basic needs, exerts a tremendous socio-psychological impact on the case study family. A three-fold impact effect is revealed by the interview. 1) A tendency towards intensifying psychological depression permeates the whole family.49 The three main factors triggering the depressive mood are a) the inability to serve the family’s debt burden and the fear of eviction that generates a feeling of despair. B) The imminent possibility of an enforced re-location to another city of the waged mother’s job as a consequence of the Athena governmental programme of re-arranging the higher education map in order to cut down higher education public expenditure. C) The inability to go out and ‘discharge’ the built-up tension. A depressive mood is most often punctuated by episodic manic eruptions. One of the children (the boy aged seven and a half) is exhibiting constant aggressive behaviour vis-a-vis its parents and shows deviant aspects in his conduct.
2) A growing sense of social isolation and exclusion from the surrounding social habitat. Due to the inability to reciprocate, social visits, participation to social gatherings and communal festivities have been reduced to a minimum. Thus the ‘social capital’ held by the family is disintegrating rapidly. Moreover, the school-children are exposed to social discrimination since they are excluded from partaking in the common school festivities that require monetary contributions.
3) The ‘no future’ mentality. The bleak personal situation of the family and the ‘humanitarian crisis’ that has befallen Greek society where no prospect of exiting the cul-de-sac is envisioned (inability to find even a temporary or casual job for the unemployed member and the state of precariousness for the job-holding family partner) breeds the sense of being mired in a hopeless situation. This family mind-set is reinforced by the parental impotence to cater for the proper nurturing of the kids and the inability to safeguard them from stark social and cultural impoverishment.
3.2.c. Material deprivation and subjective estimation of a dignified standard of living
According to the definition of ‘material deprivation’ adopted by the Social protection committee of the EU, if an individual or a household is unable due to economic exigencies to pay for at least three items from a list of nine items deemed necessary to lead an adequate life then this individual or household is classified as suffering material deprivation.50 Moreover if
49 According to some recent estimates, the depression rate in the Greek population –across all ages- exceeds the 35% landmark (more than one-third of the general population) and so it can be plausibly claimed that severe economic depression goes hand in hand with psychic depression. 50 The list of the nine items comprises of the following: 1. To pay their rent, mortgage or utility bills; 2. To keep their home adequately warm; 3. To face unexpected expenses; 4. To eat meat or proteins regularly; 5. To go on holiday; 6. To own a television set; 7. To have a washing machine; 8. To have a car; 9. To possess a telephone.
20
the individual or the household exhibits the enforced inability to pay for at least four (of the below-listed) items then such individual or household is defined as suffering severe material deprivation. As the analysis of the case study has pinpointed, this typical multi-children household unit is a characteristic specimen suffering severe material deprivation. Specifically, it has ceased serving its mortgage loan for a long time and it is confronted with payment arrears on the credit card and the electricity and telephony bills (item no. 1), it cannot face unexpected expenses like car repairs (item no. 3), it is undernourished, unable to eat fish or even cheap meat on a regular basis (item no. 4),51 it cannot afford any holiday (item no. 5)52 and lastly it cannot afford a home internet connection and only an irregular telephone service (item no. 9).
To complete this brief sketch of a typical family household in financial and social distress we queried the interviewee about the hypothetical income level that he estimated, on a reasonable basis, that it could satisfy the basic needs of the family and allow them to lead a life of dignity without any extravagance. Aggregating the sums in the itemised expenditures gives us a figure of a monthly household net disposable income of 3,000 Euros (after taxes and social contributions).53 As it became evident during the interview that was the approximate income the household earned when the father was regularly employed (working also overtime) and the mother’s salary had not yet suffered the severe reductions introduced by the austerity measures imposed by the memorandum agreements of the recent Greek governments from 2010 onwards.
4. The Public Concealment of the Poverty problem and ways to address it
In the Greek public sphere the social problem of poverty is concealed beneath the media limelight. The national mainstream media of communication have never dedicated a broadcast addressing the problem of poverty in its various dimensions. Since, in their great majority, they endorse and support the policy measures of the standing coalition government, i.e. the implementation of the various austerity measures that are responsible for the rapid impoverishment of the Greek society, they prefer to depict a ‘rosy’ picture leaving aside issues and social problems that could question the ‘right-mindedness’ of the existing government. The issue of social and economic inequality is completely absent from the media agenda. The only problem associated with poverty that passes through the media’s gatekeeping is the problem of unemployment when periodic announcements of INE/GSEE publicise the latest figures of unemployment and these become momentary news items in the news agenda. Next to the TV channels (both private and state ones) no major newspaper has conducted any sustained investigative reporting on the conditions and the multifarious
Source : DG Employment, Social Affairs and Inclusion (http://ec.europa.eu/social/main.jsp?landId=en&catId=89&newsId=596) 51 The descriptor of the item specifies ‘a meal involving meat, chicken or fish every second day’. 52 The descriptor states ‘to afford a one-week annual holiday away from home’. 53 The breakdown is as follows: Gasoline 300 eur/month, food 500 E, clothing/gifts 150E, electricity 300E, water supply 30E, telephony/internet 45E, loans, debt servicing 750E, after-school social and cultural activities for kids and parents 225E, weekend outings 240E, annual vacation expenditure reduced to monthly expense 120E and 350E for unexpected expenses or potential savings.
21
aspects of poverty in Greece. So the ‘social question’ is communicatively absent from the public agenda.
The government, at various times, has announced its desire to take piecemeal measures addressing secondary aspects of the overall problem. There are three aspects it has voiced its concern to address. 1) To provide an annual subsidy to families having three or more children, 2) to find a way to restore access to health services for the many self-employed and small-business owners who cannot pay their contributions to public pension funds and thus are denied access to the public health system 3) to set up an unemployment fund providing some support to the long-term unemployed who are deprived of any state subsidy. Since these measures require earmarking sizable funds, the government does not know where to find the money to realise these projects and thus it simply reiterates its promises than actually initiating action plans to handle the problem.
As far as the non-governing parties are concerned, no party has run a campaign to highlight the centrality of the problem of poverty by bringing it up in the parliament. Parliamentary opposition focuses on the various aspects that the deleterious effects of austerity policies produce and ‘poverty’ is rhetorically mentioned profusely but the salience of the social problem of absolute and relative poverty and the deepening trend of impoverishment is not directly addressed as such. Oppositional criticism tends to react erratically following the array of prominent issues that the hegemonic media/political discourse spotlights day in and out.
The General Confederation of trade unions has not initiated any campaign to enlist or even coordinate the one million three hundred thousand unemployed persons who lack a public voice and by necessity they lack the needed resources to self-organise and publicise the desperate situation and the immiseration they are confronted with.
If we go looking for actors who engage more or less successfully with the issue of poverty at a mundane level, three types of social actors exist. 1) The local self-administration at the municipal level, 2) the Christian orthodox Church and 3) NGOs, grass roots social movements and citizens’ initiatives. In local self-administration especially in municipalities controlled by progressive and/or left-leaning mayors there are multiple efforts to set up ‘social supermarkets’ that provide free food to incomeless municipal residents. Less common but the idea is catching up is setting up ‘social drugstores’ to provide free health service and medicinal drugs to needy persons. Also some municipalities run free remedial classes for school children. The initiative of social drugstores is also promoted by NGOs that address themselves also to the immigrant population. The social movement minded followers of SYRIZA and some local chapters with the encouragement of the party try to establish solidarity networks through which food provision is offered and the regular organisation of bazaars where clothes and other items are given freely or exchanged. Lastly the Church has a rather extended parish-based programme of providing daily meals to needy parishioners. It must be noted that these three types of social actors abstain from cooperating with each other even if they engage in the same type of assistance provision to the poor. Apart from the organised actors there are various grass roots initiatives (usually of local provenance) which
22
cater to the poor. There too it is noticeable that there is no motivation or intent to coordinate their actions by setting up organisational networks that could withstand the everyday drabness, the tiredness and disappointment that often ensues when these initiatives do not root socially and they do not find a wider appeal. All in all, the disparate initiatives exhale amateurism and they lack organisational know-how and enough resources to effect any significant resolution to the poverty problem on the micro-level they operate. Perhaps, an alternative solution could be offered via the development of ‘social economy’ and the wide networking of people offering and participating in non-commodified social services. Even this alternative requires a re-invigorated communal democratic spirit that prioritises societal well-being above the self-regarding convenience of the egoistic individual. To conclude by borrowing Rosa Luxemburg’s admonition: ‘One cannot realise socialism with lazy, frivolous, egoistic, thoughtless and indifferent human beings. A socialist society needs human beings from whom each one in his place, is full of passion and enthusiasm for the general well-being, full of sacrifice and sympathy for his fellow human beings, full of courage and tenacity in order to dare to attempt the most difficult’.54
54 R. Luxemburg, ‘The Socialisation of Society’ (December 2018), Gesammelte Werke, Berlin (GDR) 1970-75, Vol.4, pp. 431-34.