Embed Size (px)
Citation preview
Geophysical Fluid Dynamics-I
Peter B. RhinesProf. of Oceanography and Atmospheric
Sciences, UWDan Kirshbaum
Atmospheric Sciences: TAEric Lindahl: GFD lab instructor
Oceanography
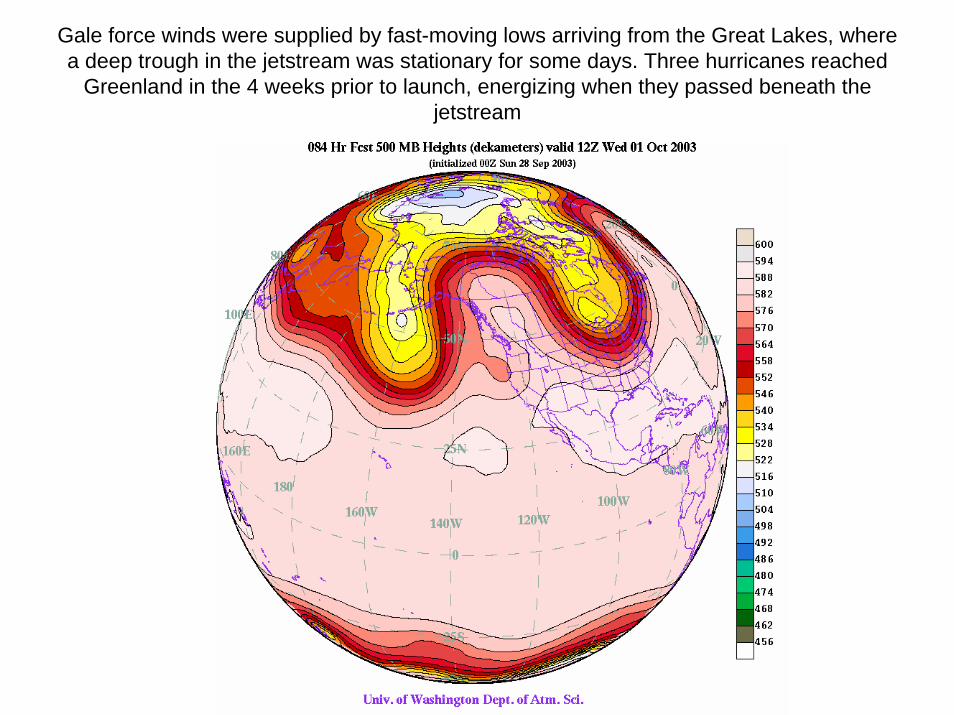
Gale force winds were supplied by fast-moving lows arriving from the Great Lakes, where a deep trough in the jetstream was stationary for some days. Three hurricanes reached
Greenland in the 4 weeks prior to launch, energizing when they passed beneath the jetstream
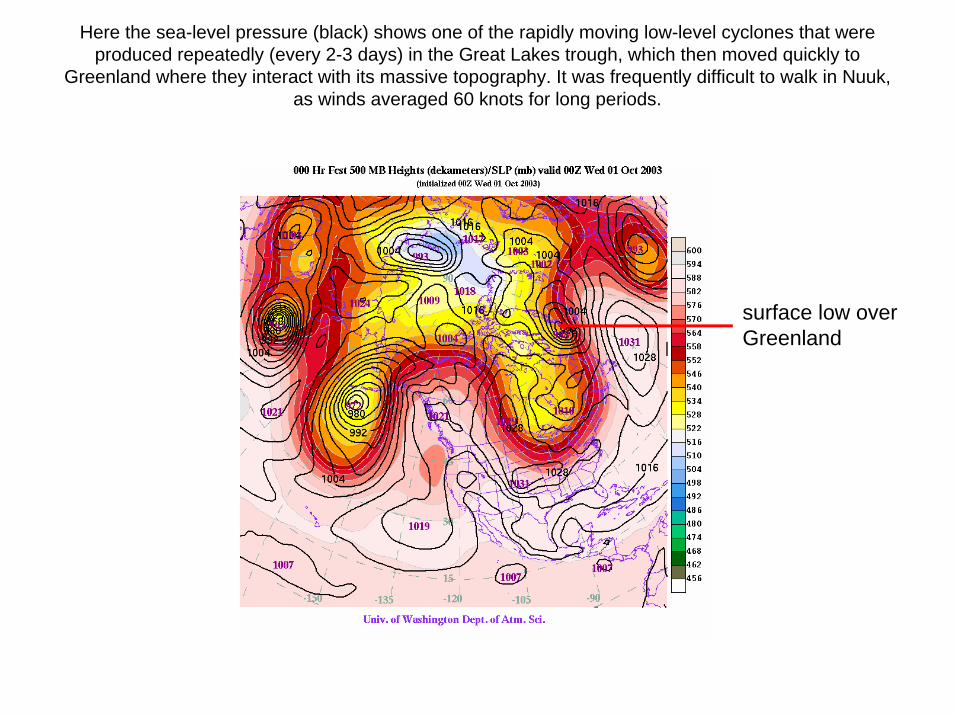
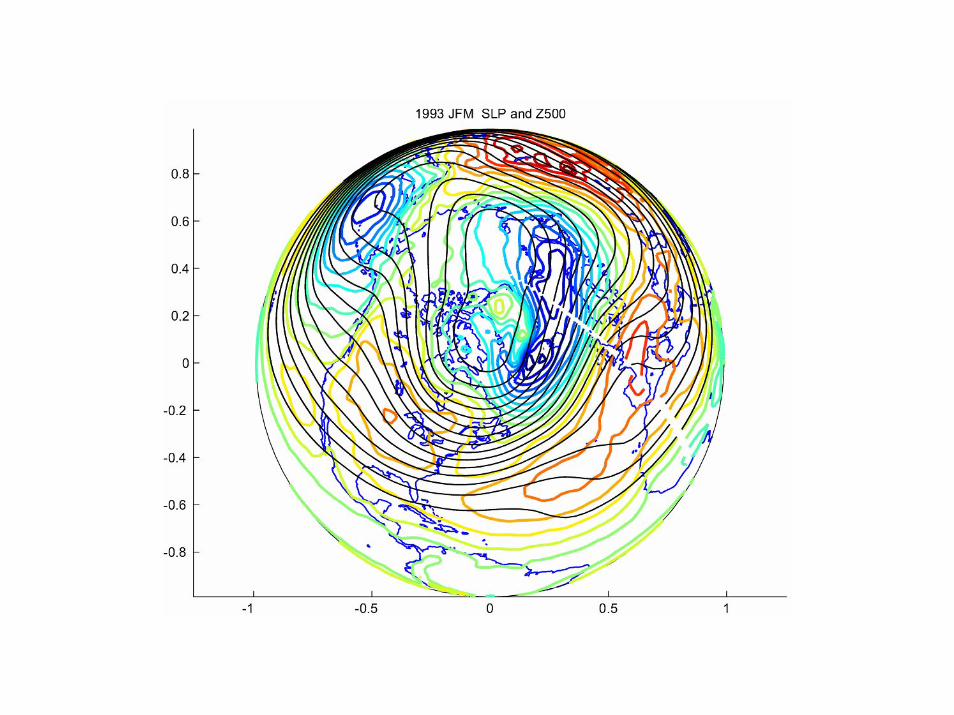
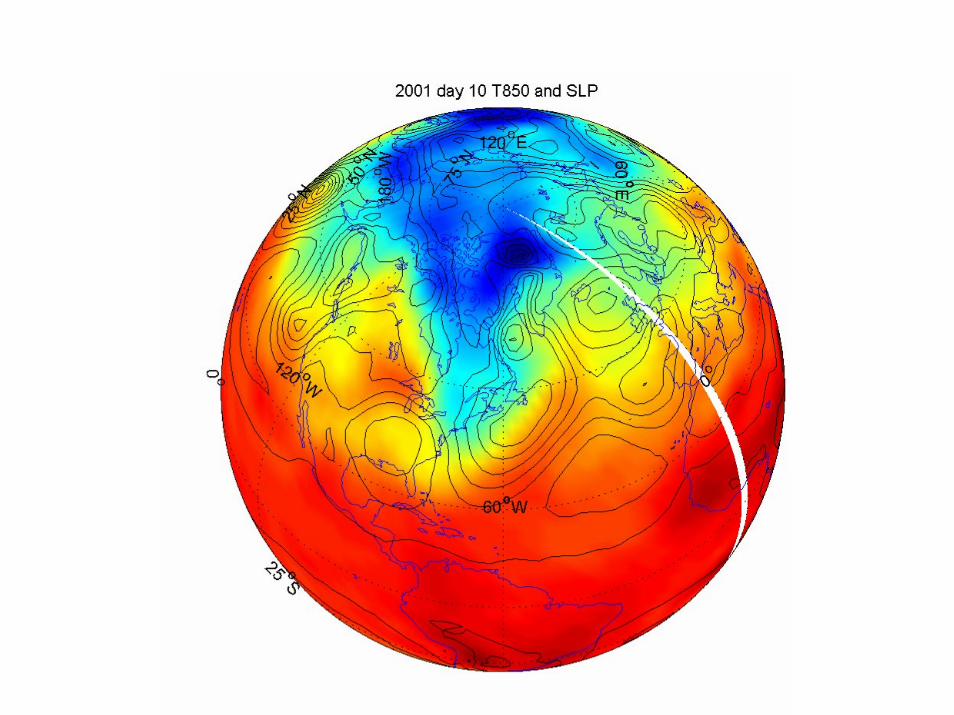
Here the sea-level pressure (black) shows one of the rapidly moving low-level cyclones that were produced repeatedly (every 2-3 days) in the Great Lakes trough, which then moved quickly to
Greenland where they interact with its massive topography. It was frequently difficult to walk in Nuuk, as winds averaged 60 knots for long periods.
surface low over Greenland
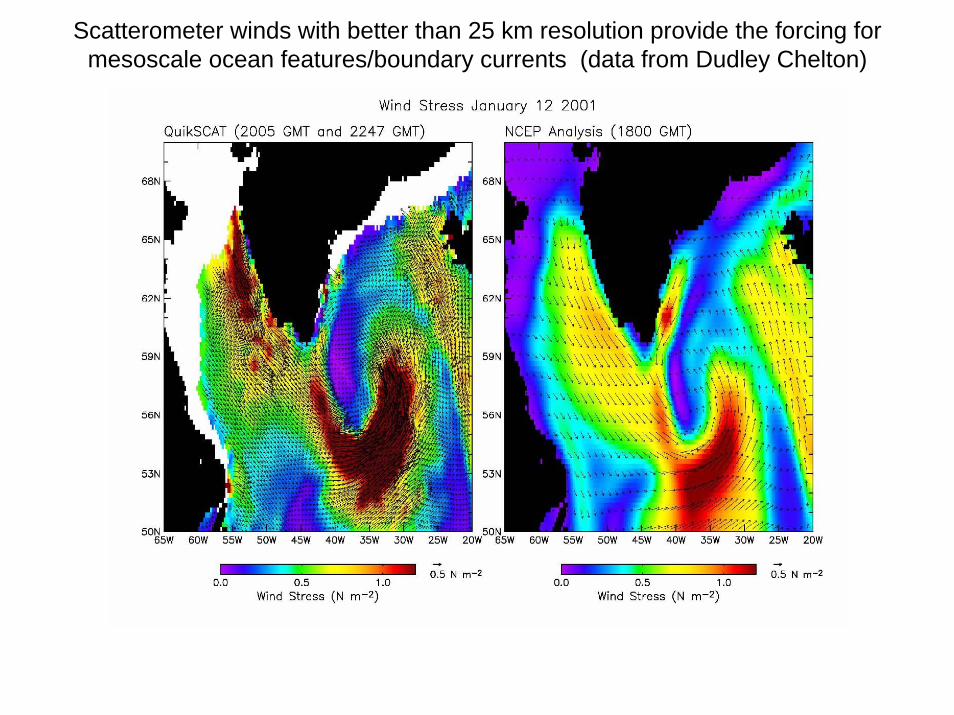
Scatterometer winds with better than 25 km resolution provide the forcing formesoscale ocean features/boundary currents (data from Dudley Chelton)
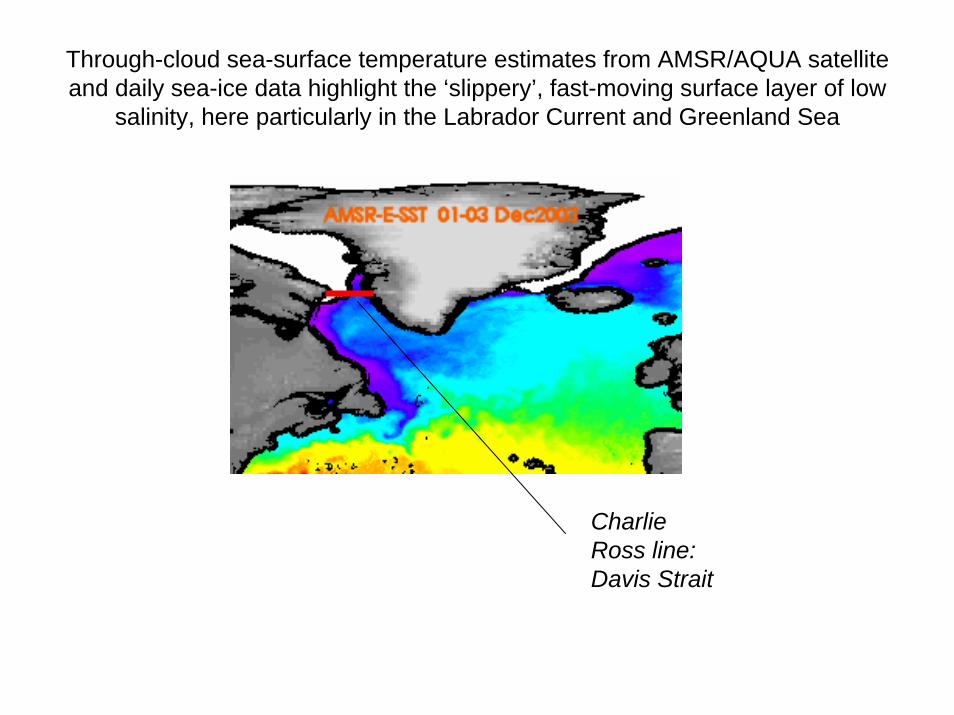
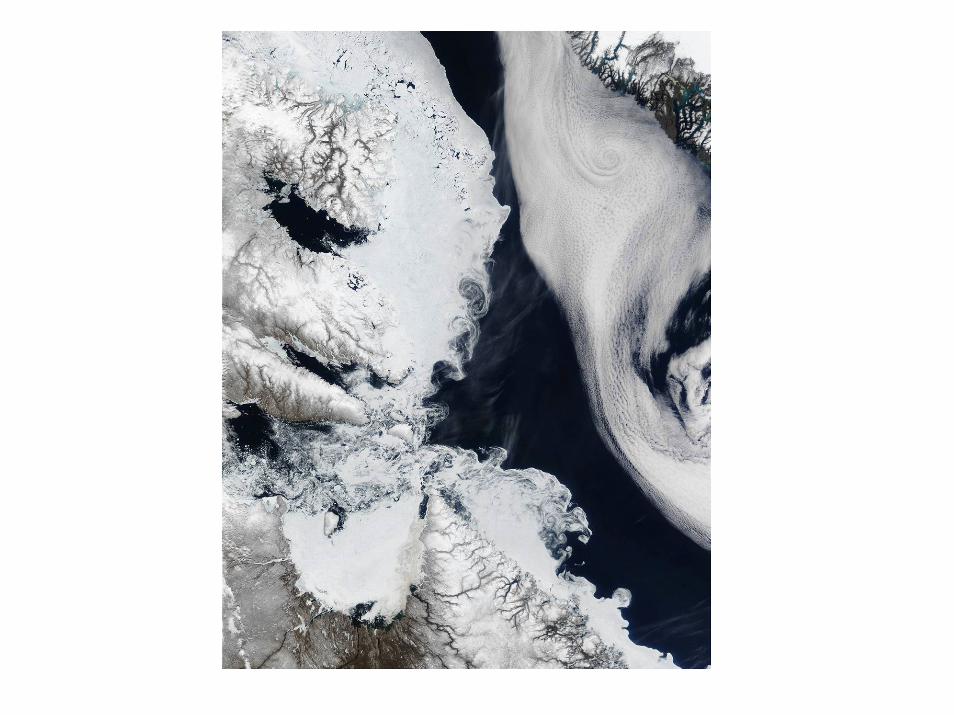
Through-cloud sea-surface temperature estimates from AMSR/AQUA satellite and daily sea-ice data highlight the ‘slippery’, fast-moving surface layer of low
salinity, here particularly in the Labrador Current and Greenland Sea
Charlie Ross line: Davis Strait
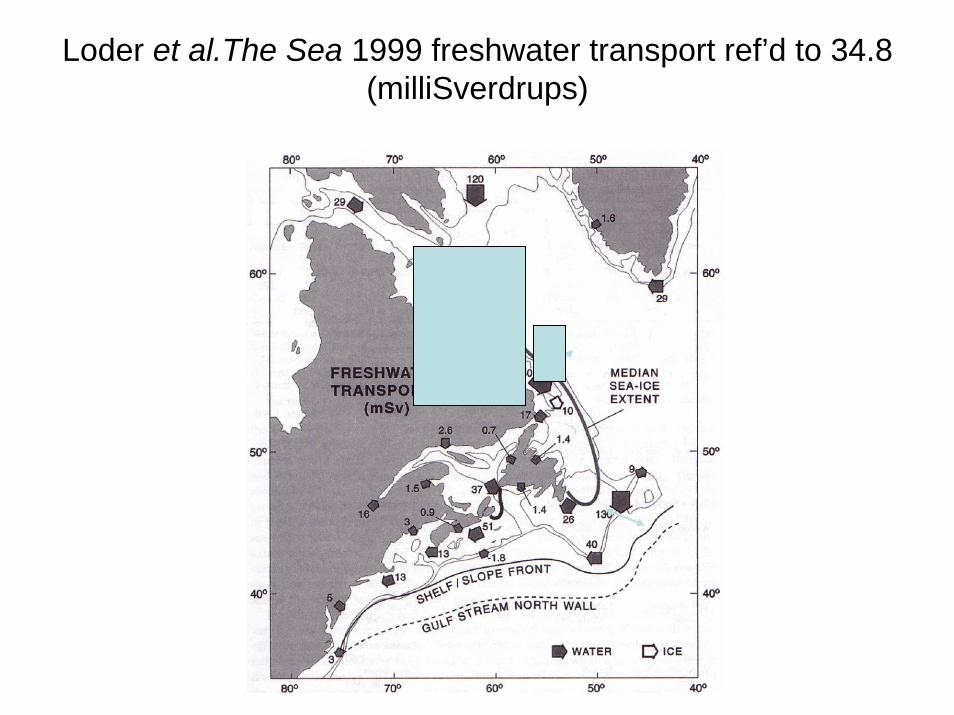
Loder et al.The Sea 1999 freshwater transport ref’d to 34.8(milliSverdrups)
• animation of the past 8 days of weather, centered in N America
(atmos.washington.edu SLP:black lines + Z500:colors)
Aleutian low/Alaska gyre spawns fast moving low-level cyclones which pass into Arctic; ridge over E Pacific...snow in Seattle
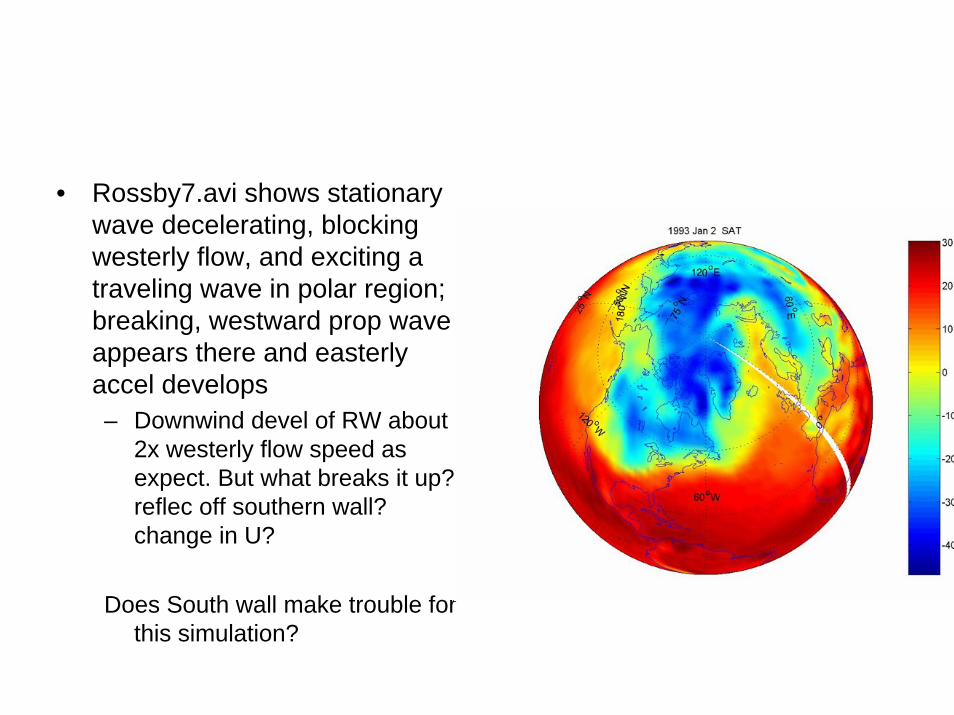
• Rossby7.avi shows stationary wave decelerating, blocking westerly flow, and exciting a traveling wave in polar region; breaking, westward prop wave appears there and easterly accel develops– Downwind devel of RW about
2x westerly flow speed as expect. But what breaks it up? reflec off southern wall? change in U?
Does South wall make trouble for this simulation?
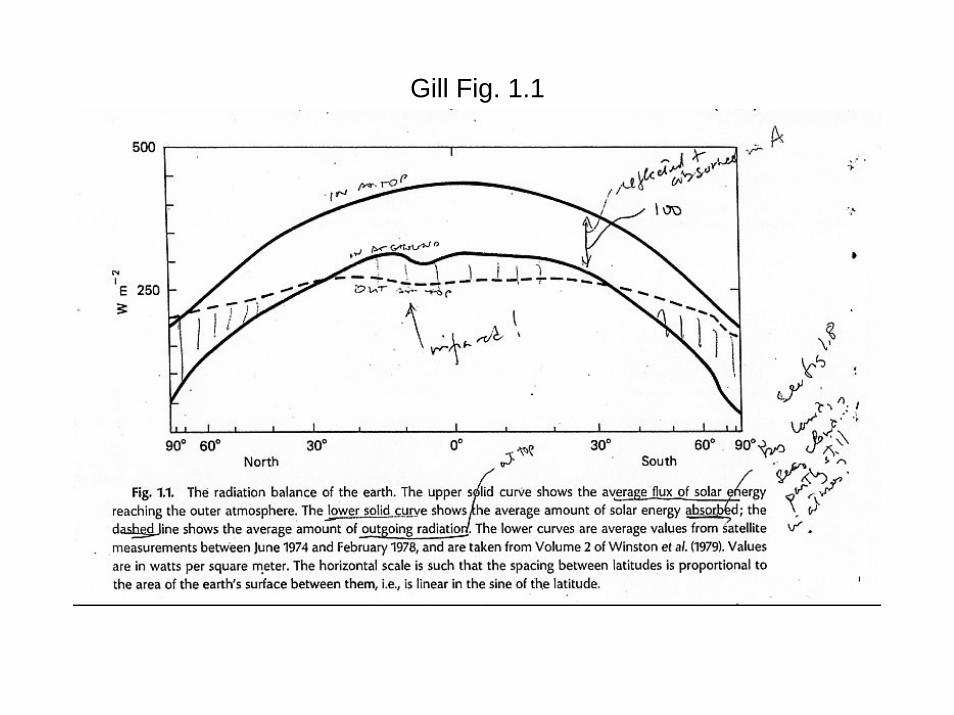
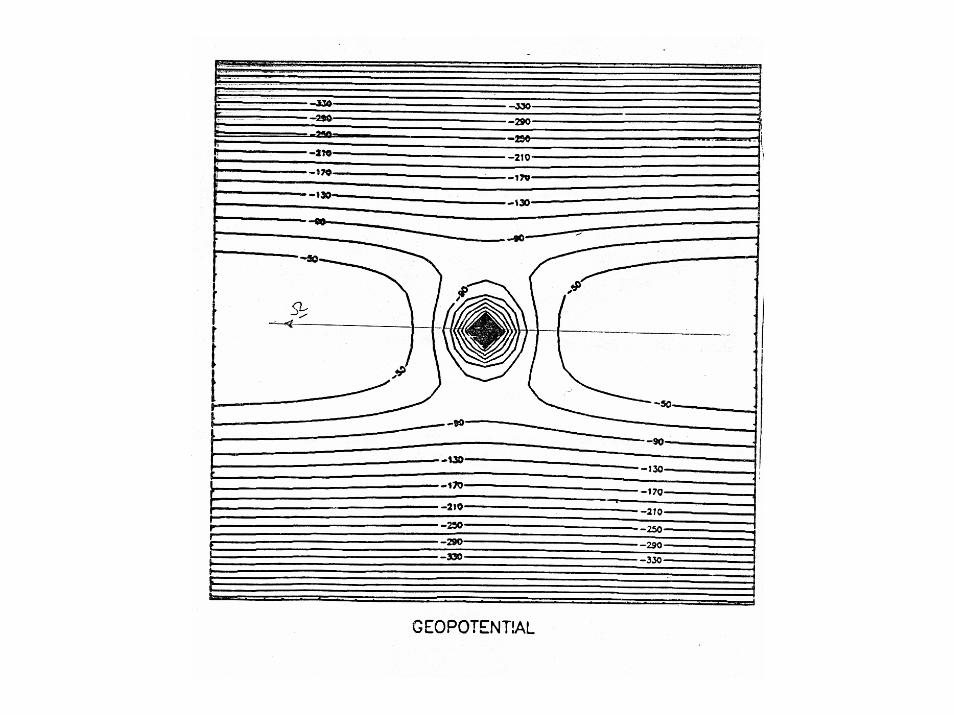
Gill Fig. 1.1
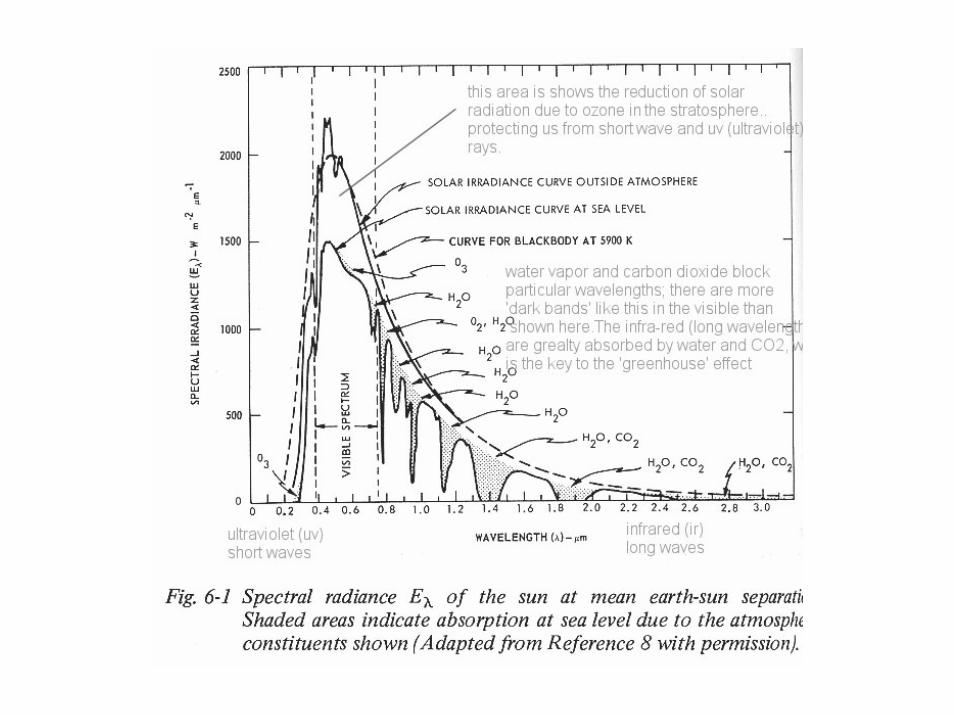
The energy output of the sun is about 1027 watts, radiating to space from its bright surface, which has a temperature of about 5900K. By the time it reaches Earth, 93 million miles away, it amounts to 1368 watts per square meter (watts m-2), just outside the atmosphere.
On a bright sunny day at noon you may have about 1000 watts (1 kilowatt) arriving at the ground: the rest is blocked or absorbed by the atmosphere. But averaging over night and day, summer and winter, tropics and poles, the Earth’s surface absorbs only about 120 watts m-2.
The solar energy absorbed by growing plants on land and in the sea is enough to grow 6 x 10¹⁴ kg of glucose per year (glucose being a simple sugar, here used to represent the more complex biology of green plants), and the biomass energy produced contains about 1022 Joules of energy. This is 30 times bigger than the use of fuel energy by human beings (see below) However only a very small part of growing plants turn into future oil and coal and gas deposits, and we are now using them up far faster than they are being regenerated.
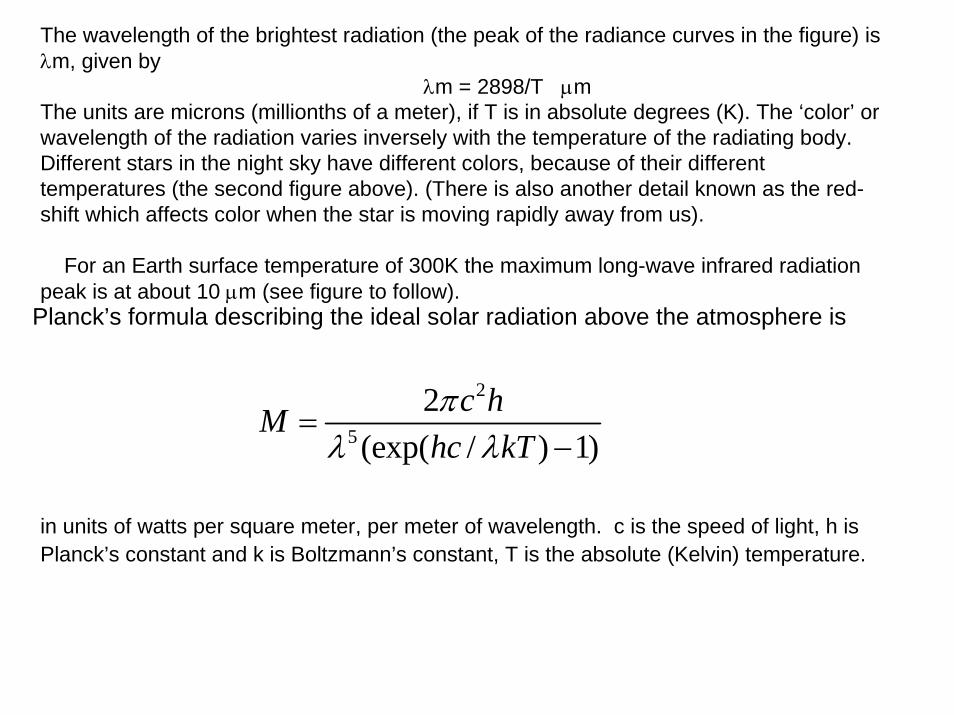
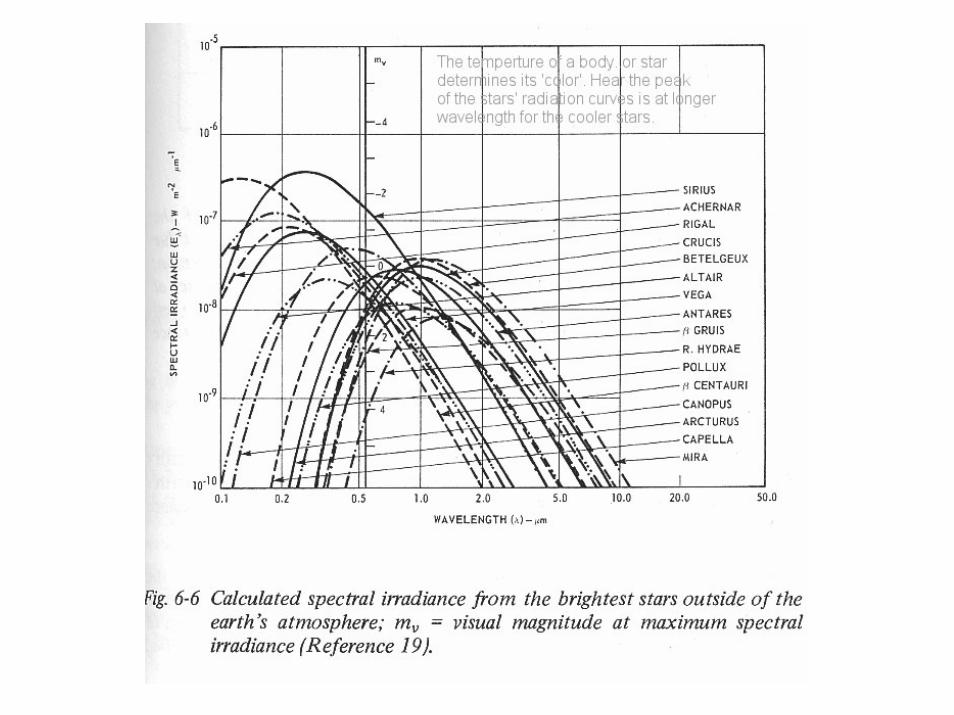
The wavelength of the brightest radiation (the peak of the radiance curves in the figure) is λm, given by
λm = 2898/T µm The units are microns (millionths of a meter), if T is in absolute degrees (K). The ‘color’ or wavelength of the radiation varies inversely with the temperature of the radiating body. Different stars in the night sky have different colors, because of their different temperatures (the second figure above). (There is also another detail known as the red-shift which affects color when the star is moving rapidly away from us).
For an Earth surface temperature of 300K the maximum long-wave infrared radiation peak is at about 10 µm (see figure to follow).
Planck’s formula describing the ideal solar radiation above the atmosphere is
2
5
2(exp( / ) 1)
c hMhc kTπ
λ λ=
−
in units of watts per square meter, per meter of wavelength. c is the speed of light, h is Planck’s constant and k is Boltzmann’s constant, T is the absolute (Kelvin) temperature.
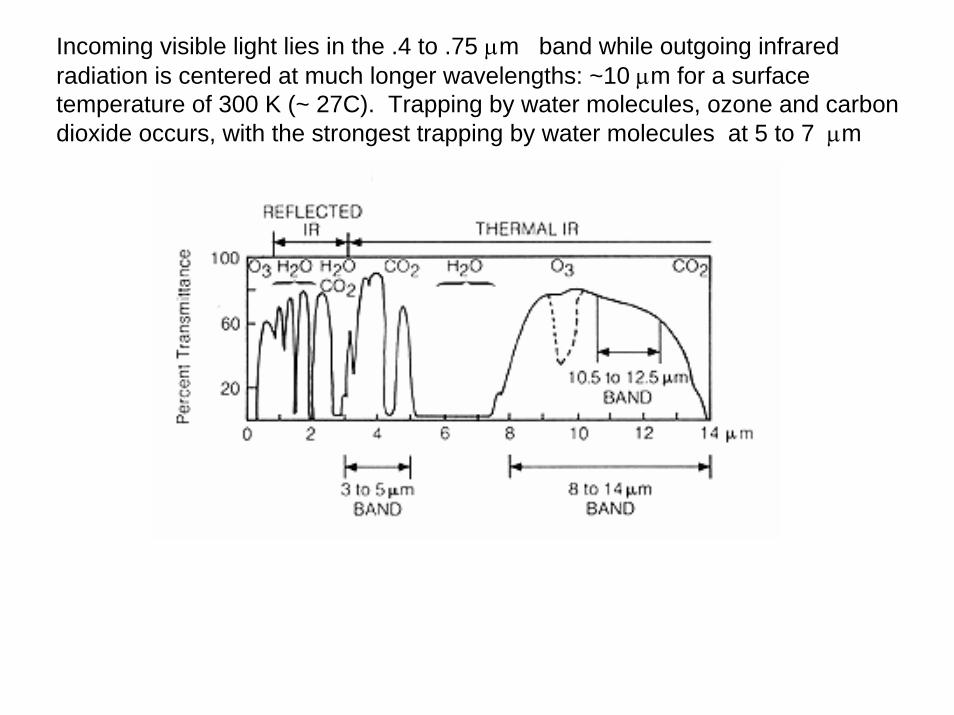
Incoming visible light lies in the .4 to .75 µm band while outgoing infrared radiation is centered at much longer wavelengths: ~10 µm for a surface temperature of 300 K (~ 27C). Trapping by water molecules, ozone and carbon dioxide occurs, with the strongest trapping by water molecules at 5 to 7 µm
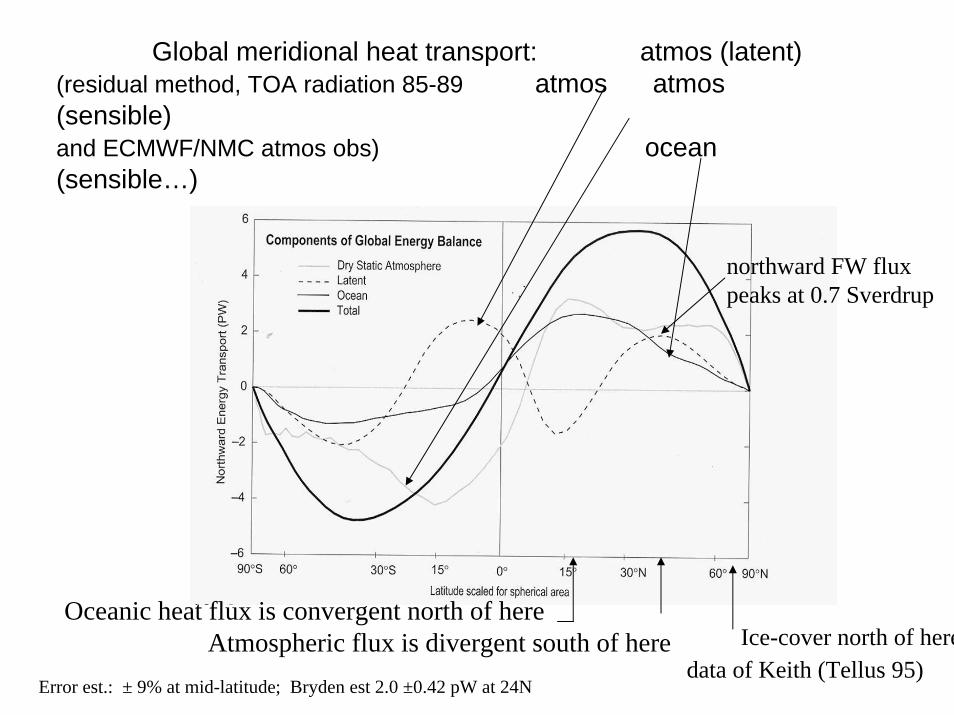
Global meridional heat transport: atmos (latent)(residual method, TOA radiation 85-89 atmos atmos(sensible)and ECMWF/NMC atmos obs) ocean (sensible…)
Atmospheric flux is divergent south of hereOceanic heat flux is convergent north of here
Ice-cover north of here
northward FW fluxpeaks at 0.7 Sverdrup
data of Keith (Tellus 95)Error est.: ± 9% at mid-latitude; Bryden est 2.0 ±0.42 pW at 24N