Embed Size (px)
Citation preview
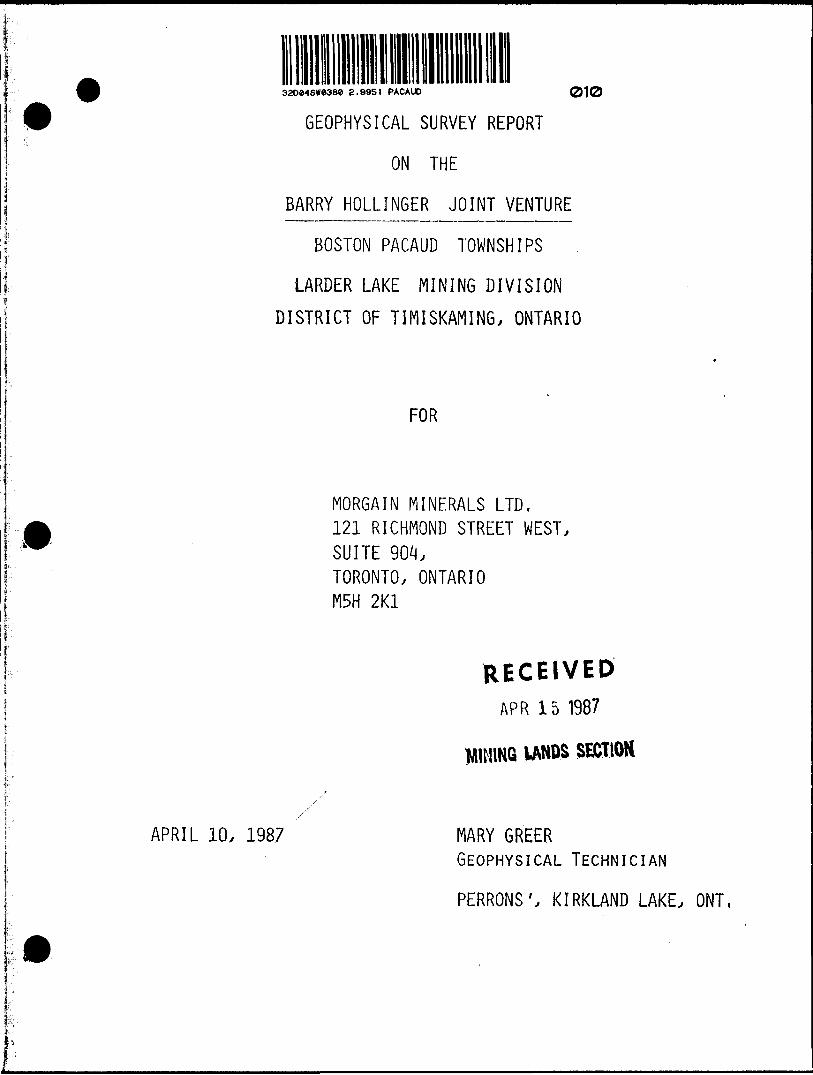
2.9951 PACAUD 010
GEOPHYSICAL SURVEY REPORT
ON THE
BARRY HOLLINGER JOINT VENTURE
BOSTON PACAUD TOWNSHIPS
LARDER LAKE MINING DIVISION
DISTRICT OF TIMISKAMING, ONTARIO
FOR
MORGAIN MINERALS LTD, 121 RICHMOND STREET WEST, SUITE 904, TORONTO, ONTARIO M5H 2K1
RECEIVED
APR 15 1987
MIMING IANDS &CTIOK
APRIL 10, 1987 MARY GREERGEOPHYSICAL TECHNICIAN
PERRONS', KIRKLAND LAKE, ONT,
ILLUSTRATIONS
Claim Location Map - (Figure la). . . . . . . . . . . . . 2 a)
Location Map - (Figure Ib). . . . . . . . . . . . . 3 a)
Accompanying Plan Maps. . . . . . . . . . . . . . In Back Pocket
Scale: l inch to 200 feet
Date: March 1987
Mo rg a. in Minerals Ltd.
Barry Hollinger Joint Venture
Ground Magnetometer Survey
Map No. BH-87-1
Mo rg a. in Minerals Ltd.
Barry Hollinger Joint Venture
Ground VLF-EM Survey
NAA - Contoured
Map No. BH-87-2
2.9951 PACAUD 010C
l f 11^ U L. W l Is l/M l L.I l i *bJ
INTRODUCTION. . . . . . . . . . . . . . . . . . . . . . l, 2
PROPERTY DESCRIPTION. . . . . . . . . . . . . . . . . . 2
LOCATION AND ACCESS . . . . . . . . . . . . . . . . . . 3
PREVIOUS WORK . . . . . . . . . . . . . . . . . . . . . 3
SURVEY PROCEDURE. . . . . . . . . . . . . . . . . . . . 3, 4
TOPOGRAPHY. . . . . . . . . . . . . . . . . . . . . . . 4
GENERAL GEOLOGY . . . . . . . . . . . . . . . . . . . . 5
ECONOMIC GEOLOGY. . . . . . . . . . . . . . . . . . . . 5, 6
INSTRUMENTATION . . . . . . . . . . . . . . . . . . . . 7, 8, 9
PRESENTATION AND DISCUSSION OF RESULTS. . . . . . . . . 9, 10, 11, 12, 13
CONCLUSIONS AND RECOMMENDATIONS . . . . . . . . . . . . 13, 14
BIBLIOGRAPHY. . . . . . . . . . . . . . . . . . . . . . 15
CERTIFICATE . . . . . . . . . . . . . . . . . . . . . . 16
GEOPHYSICAL SURVEY REPORT
ON THE
BARRY HOLLINGER JOINT VENTURE
BOSTON PACAUD TOWNSHIPS
LARDER LAKE MINING DIVISION
DISTRICT OF TIMISKAMING, ONTARIO
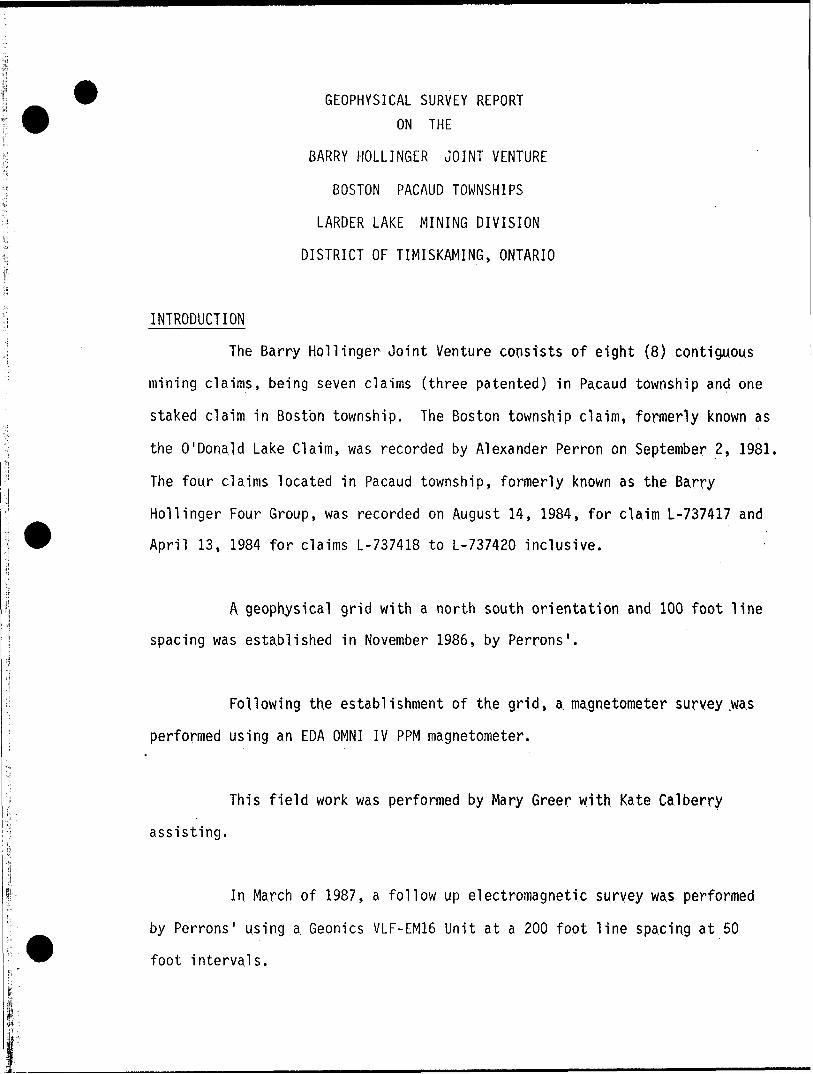
INTRODUCTION
The Barry Hollinger Joint Venture consists of eight (8) contiguous
mining claims, being seven claims (three patented) in Pacaud township and one
staked claim in Boston township. The Boston township claim, formerly known as
the O'Donald Lake Claim, was recorded by Alexander Perron on September 2, 1981.
The four claims located in Pacaud township, formerly known as the Ba.rry
Hollinger Four Group, was recorded on August 14, 1984, for cla.im L-737417 and
April 13, 1984 for claims L-737418 to L-737420 inclusive.
A geophysical grid with a north south orientation and 100 foot line
spacing was established in November 1986, by Perrons'.
Following the establishment of the grid, a. magnetometer survey was
performed using an EDA OMNI IV PPM magnetometer.
This field work was performed by Mary Greer with Kate Calberry
assisting.
In March of 1987, a follow up electromagnetic survey wa.s performed
by Perrons' using a Geonics VLF-EM16 Unit at a 200 foot line spacing at 50
foot intervals.
-2-
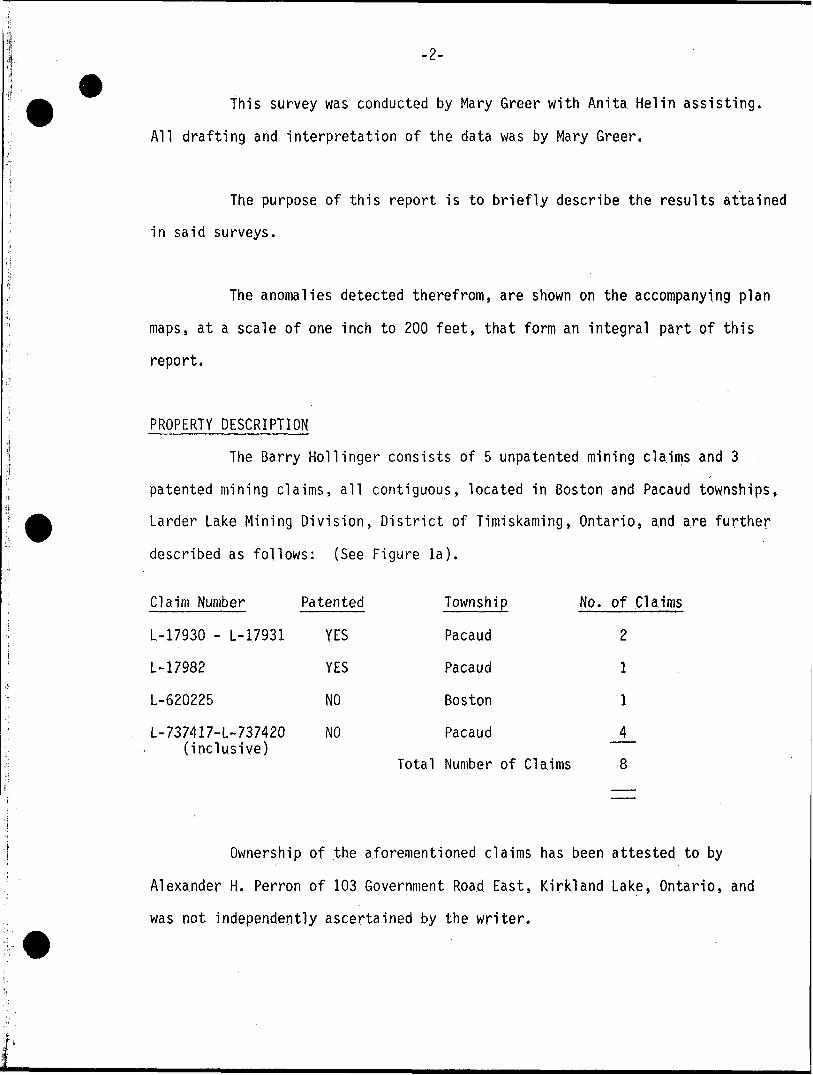
This survey was conducted by Mary Greer with Anita Melin assisting.
All drafting and interpretation of the data was by Mary Greer.
The purpose of this report is to briefly describe the results attained
in said surveys.
The anomalies detected therefrom, are shown on the accompanying plan
maps, at a scale of one inch to 200 feet, that form an integral part of this
report.
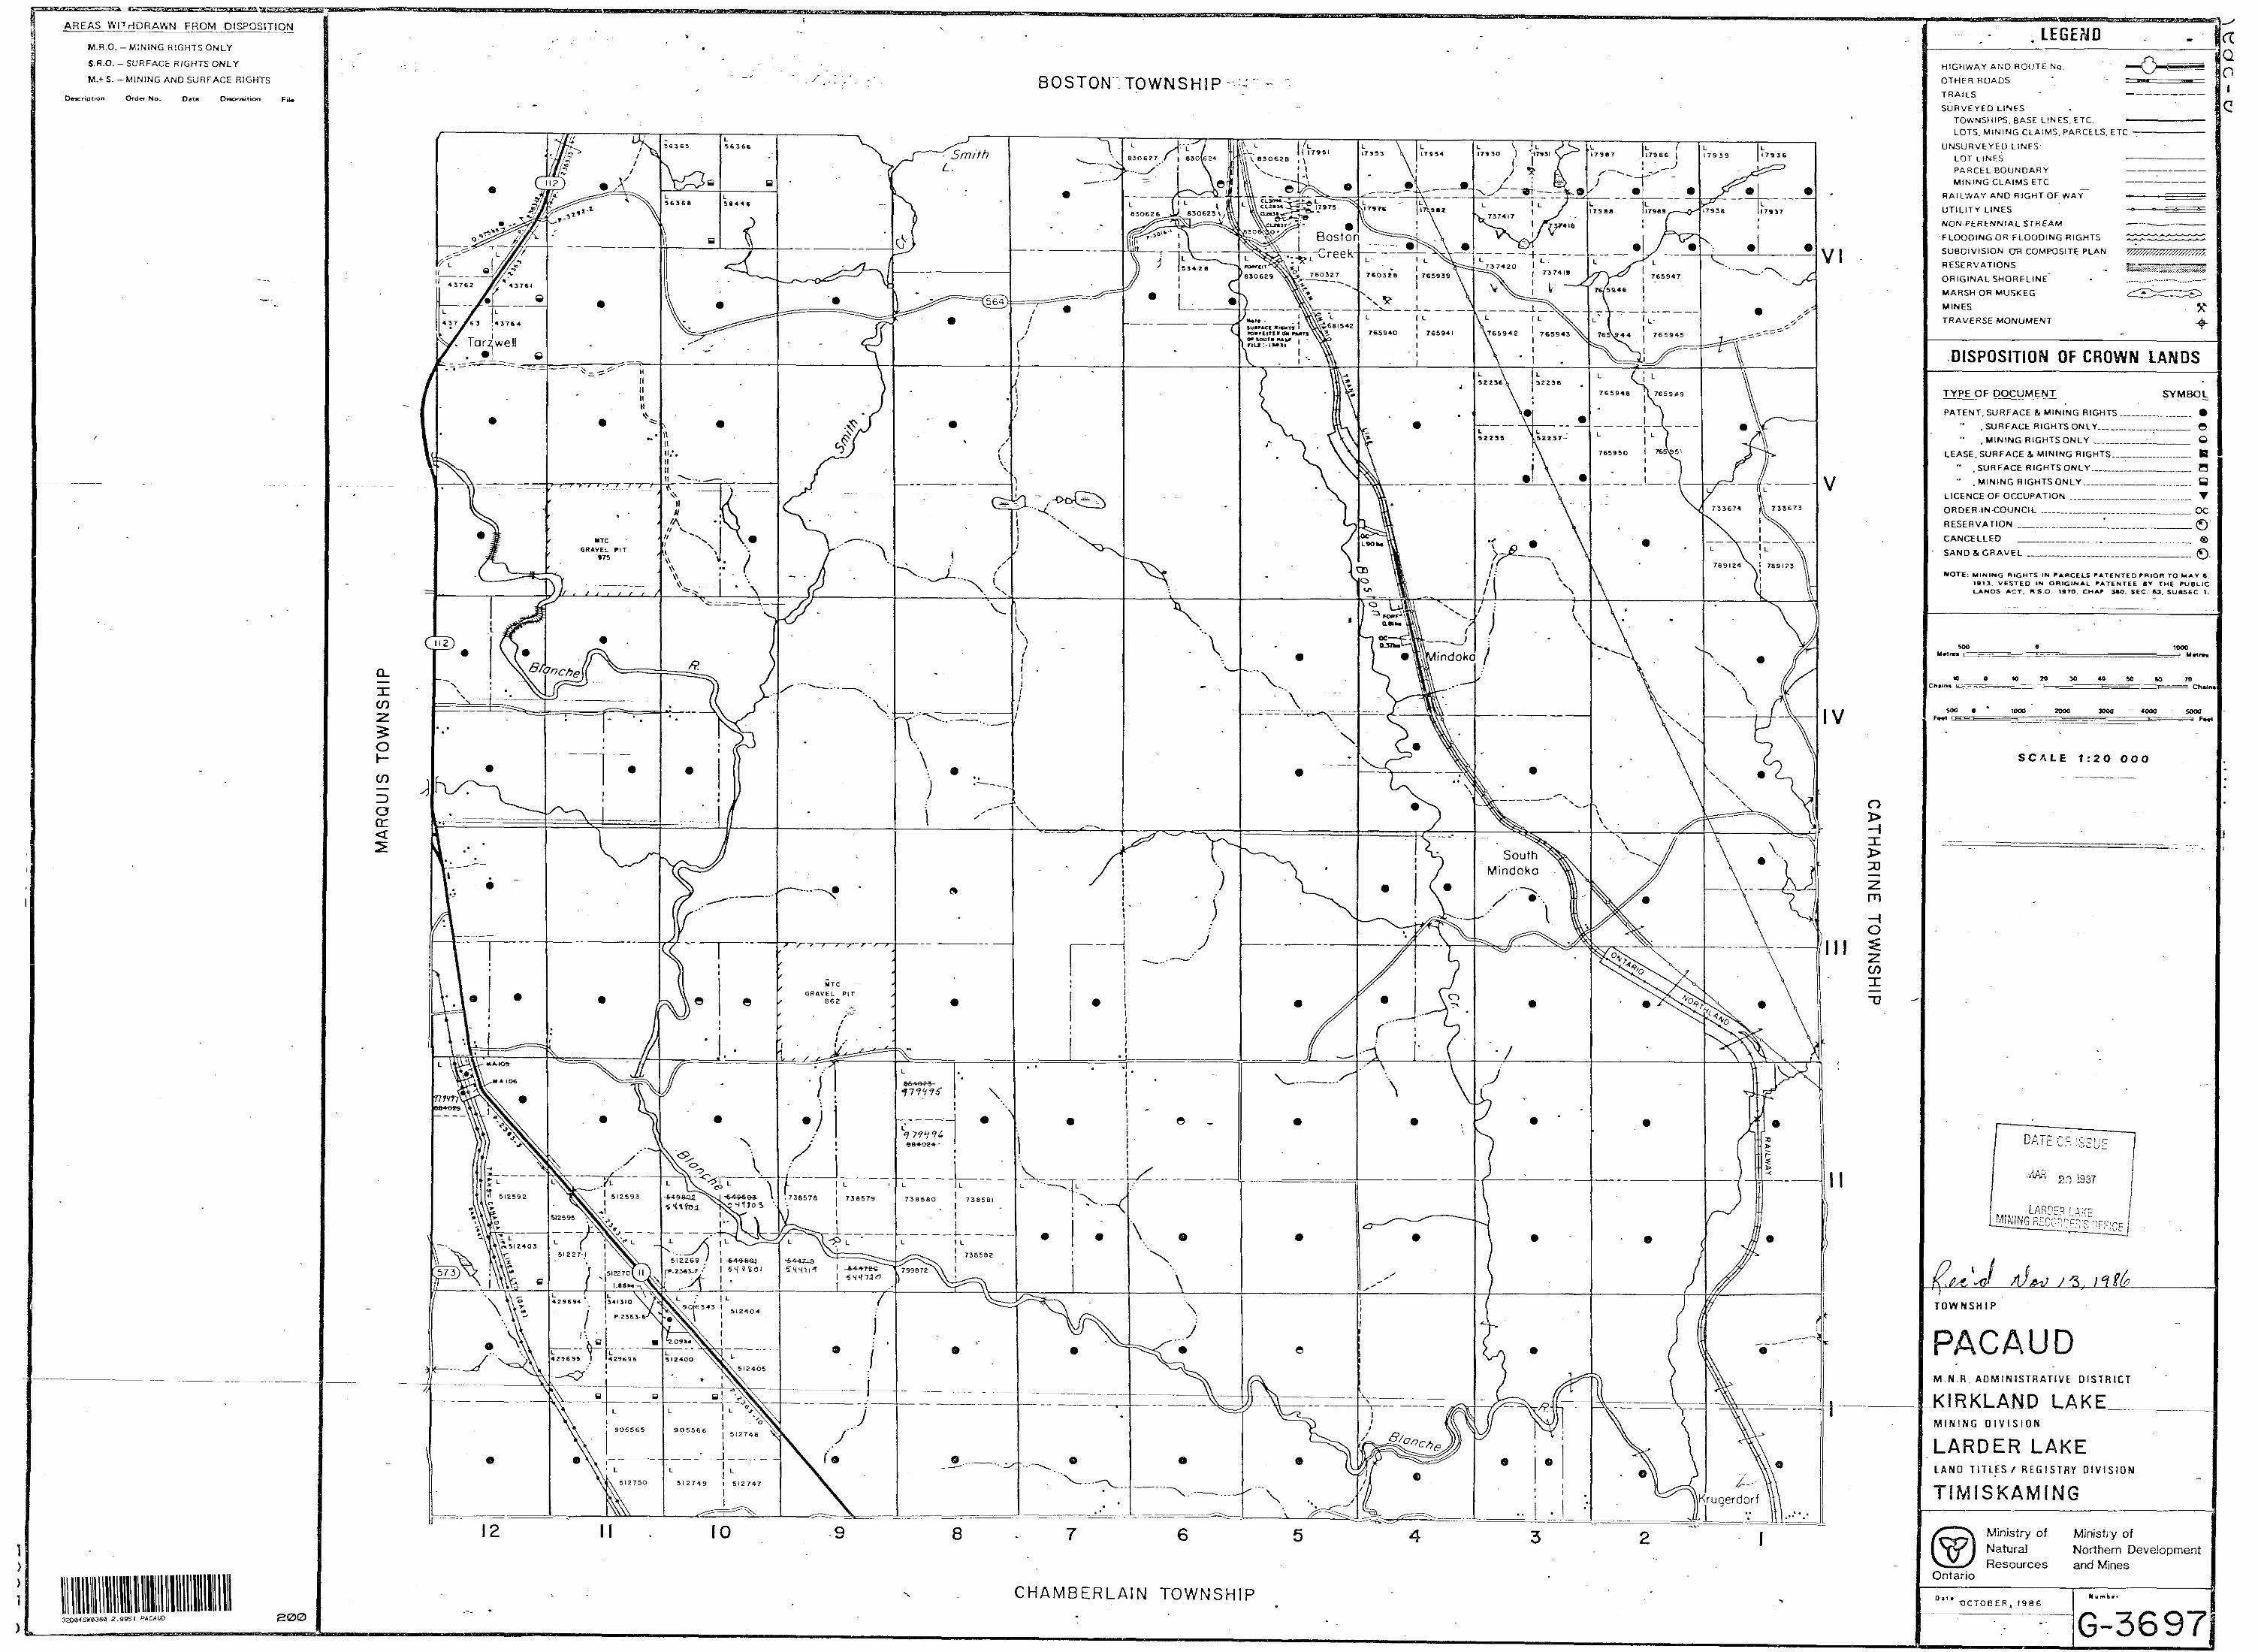
PROPERTY DESCRIPTION
The Barry Hollinger consists of 5 unpatented mining claims and 3
patented mining claims, all contiguous, located in Boston and Pacaud townships,
Larder Lake Mining Division, District of Timiskaming, Ontario, and are further
described as follows: (See Figure la).
Claim Number Patented Township No. of Claims
L-17930 - L-17931 YES Pacaud 2
L-17982 YES Pacaud l
L-620225 NO Boston l
L-737417-L-737420 NO Pacaud 4 (inclusive)
Total Number of Claims 8
Ownership of the aforementioned claims has been a.ttested to by
Alexander H. Perron of 103 Government Road. East, Kirkland Lake, Ontario, and
was not independently ascertained by the writer.
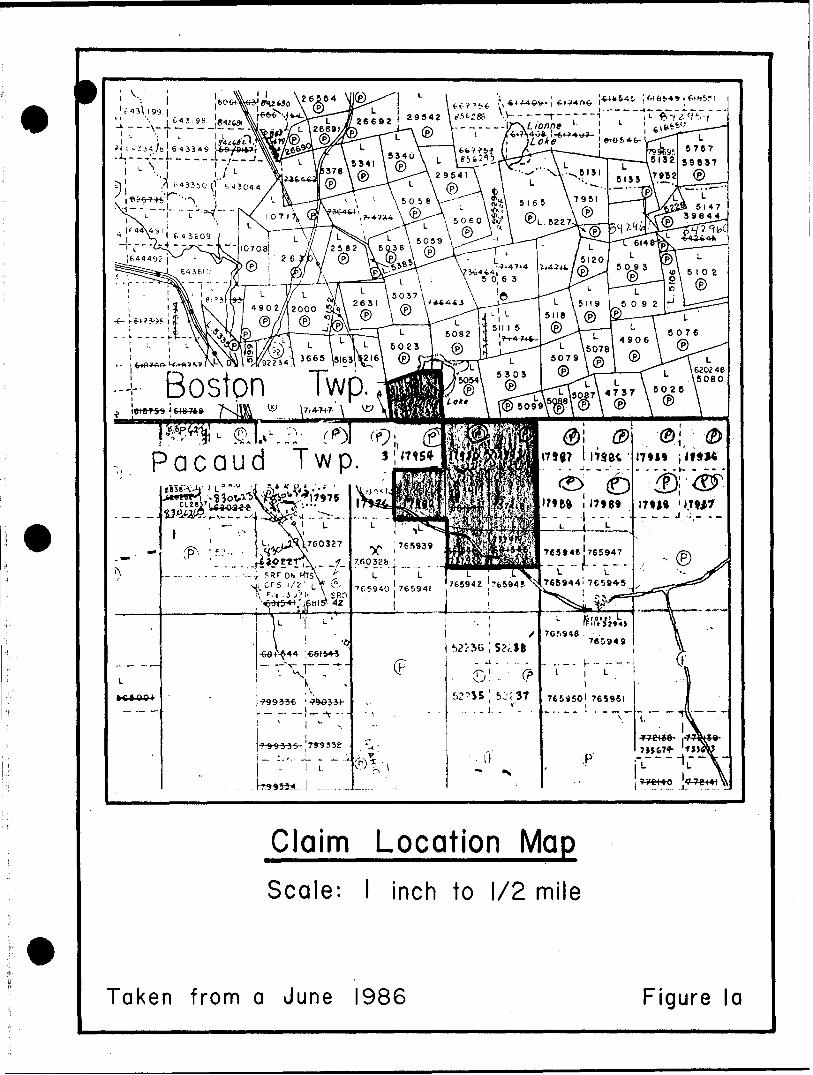
f43\199 l
--A. J \ l
H i -2^4^! 643349
Bostpn Twp.
ud Twp. -
Claim Location MapScale: l inch to 1/2 mile
Taken from a June 1986 Figure la
-3-
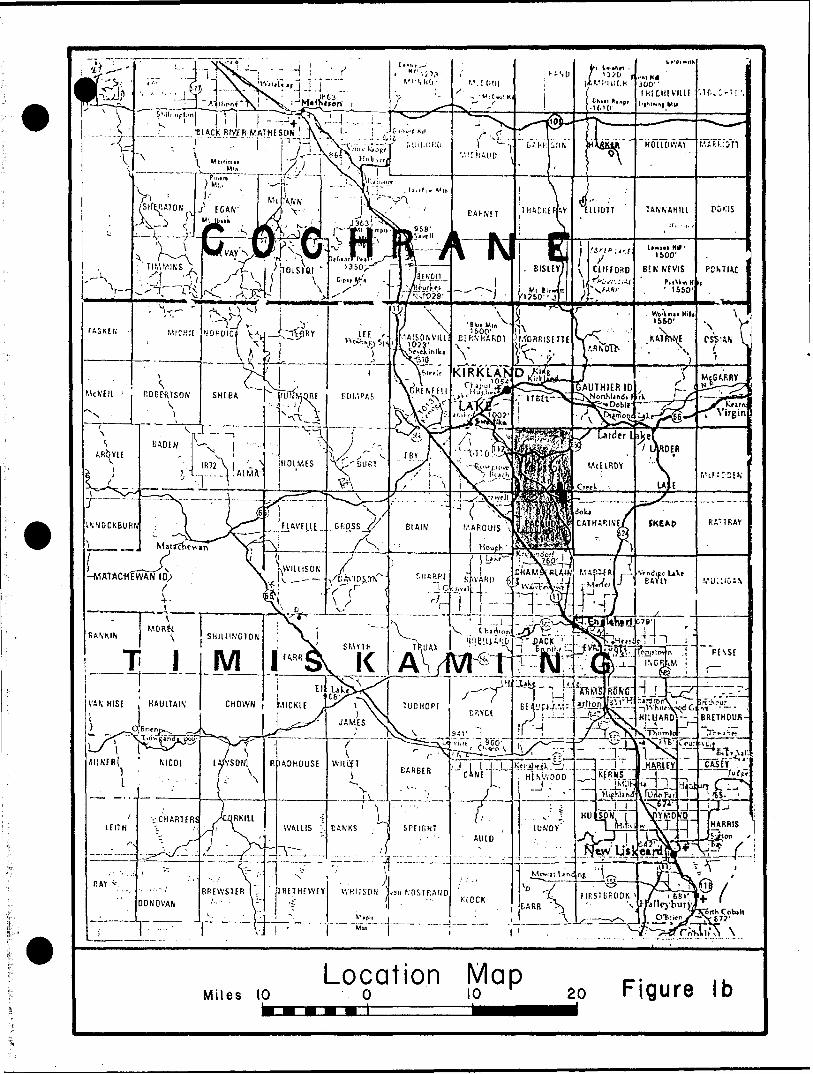
LOCATION AND ACCESS
The claim group lies along the Boston-Pacaud township line approxi-
mately one half mile from the village of Boston Creek which is twelve (12)
miles southeast of the town of Kirkland Lake.
4
The property is accessible via a secondary roa.d that extends eastward
from the village into the Barry Hollinger mine site, and may be reached via high
way No. 112 and highway No. 564. (See figure Ib).
PREVIOUS WORK
Scattered old trenchings can be found throughout the staked cla,ims,
no records are available to show any results found from these workings. Any
assays, if obtained at the time these trenches were made, are not on record.
The work performed on the patent claims are associated with the mine
workings of the Barry Hollinger Gold Mines. Some surface and underground work
ings maps are no longer available.
See the Regional Geologist office for any work filed in the Assessment
files, including recent geophysical surveys filed by Perrons'.
SURVEY PROCEDURE
A baseline was established along the Boston- Pacaud township line
which was turned off by a surveyor's transit from located surveyed patent pins.
A grid system of picket lines 100 feet apart was established at right angles
to the baseline, using a transit.
^ ^ -^— _...;..j .i."^jn"
— _ — N:tp ' .J _ i~~ ' " ~j " *" "~
Miles 10Location Map
O 10 20 Figure Ib
-4-
Two control tielines were established, one 1,320 feet south of the
baseline, along the boundary of the patent claims, and one approximately 4,000
feet south of the baseline.
Stations 100 feet apart were picketed along the lines controlled by
break chaining and readings were taken at 25 foot intervals on all picket lines.
For the VLF-EM Survey readings were taken at 50 foot intervals on all lines 200
feet apart.
A primary magnetic base station was established at BL 24 -t- 00 E with
secondary check stations located at each baseline-picket line intersection.
Secondary check stations were also fixed along the 40 * 00 S tieline to keep
tight control on the diurnal drift. The time interval between each secondary
check station was within forty (40) minutes.
TOPOGRAPHY
The southern claims are covered by open swamp and a tailings pond
surrounded by rough outcrop to the north, and a high glacial drift covered hill
to the south.
A small lake, O'Donald Lake, is found in Boston township on the corner
of L-620225.
Most of the property is covered by poplar and birch bush, particularly
on the high areas. Some spruce and balsam mixed bush can be found in the areas
of exposed outcrop. Most low and swampy areas are covered with spruce and alder
or are open, covered with grass and cattails.
-5-
6ENERAL GEOLOGY
According to the O.D.M. Annual Report covering Geology of Boston town
ship and part of Pacaud township, Map No. 1957-4 indicates the underlying bedrock
consists of basic volcanic lava flows of the Keewatin age. These rock types are
primarily gabbroic lava flows and andesite, basalt and pillow lava. The flows
appear to be trending northwest-southeast and are facing east. These lava flows
lie in faulted contact with sheared and altered tuffs and tuffaceous sediments.
The fault strikes southeast and is known as the Pacaud Fault.
ECONOMIC GEOLOGY
The patent claim group was the former Barry Hollinger Gold Mines, which
was originally known as the Patricia property and was acquired in 1918. The mine
was in operation until 1936 and 267,741 tons of ore was milled. Over SI.6 million
in gold and S3,800. in silver was recovered.
Underground operations were carried out primarily on the No. 7 Vein,
although twelve (12) veins were found on the property.
The No. 7 Vein strikes N 57 0 E and dips 70 0 SE. The presence of gold
appears to depend largely on the quartz and is found as irregular lenses in the
vein.
The mine workings are primarily in basic lavas and the shaft is in
Keewatin diabase. The mine is developed to the 2,500 foot level, a two com
partment shaft extends from surface to the 1,000 foot level with a three com
partment winze from the 1,000 foot level td the 2,250 foot level.
-6-
Directly to the north of the Barry Hoi linger lies th.e Bargnesi property
which has a gold showing of a quartz-carbonate vein stockwork which occurs in
massive dark green, dioritic lava. The property was worked through 1937 to 1956.
The area of Boston Creek saw a fury of gold prospecting and developing
at the time of the Barry Hollinger Mine. An idle period over the years has been
brought to an end by the recent exploration and redevelopment by Golden Shield
Resources Ltd. on the old Mirado Mine property.
The property occurs along the northern township line of Catharine and
McElroy and was developed and then closed. New development of a new zone in
volving open pit mining as well as further underground work has prompted new
interest in similar properties such as the Barry Hollinger.
-7-
INSTRUMENTATION
Electromagnetic Survey:
The VLF-EM method uses as a source, one of the main submarine com
munications transmitters in the 15 to 25 kHz band found throughout the world.f
These submarine communication radio waves travel in a single mode parallel
to the surface of the earth along the earth-air surface.
Without vertical conductors and travelling over flat ground, the
magnetic field component of this radio or surface wave is horizontal and
perpendicular to it's direction of travel.
VLF instruments are capable of picking up these structures that
change the direction of the waves by measuring the tilt angle of the major
axis of the polarization ellipse. This is illustrated by the tilt angle
being zero on flat ground, but when a conductor is present the tilt angle
will acquire a finite value. The direction of tilt indicates the direction
of the conductor. Calculations of such parameters as depth, depth extent,
dip and width, of the conductor is very minimal.
The VLF easily illustrates the location of the upper limit of dip
ping structures which can be seen or plotted as VLF profiles as areas of
greatest change in tilt angle per unit of distance.
The instrument used for this EM survey was a Geonics VLF-EM16
Unit. The sensitivity of this unit is - 15& for the in-phase and - U for
the quadrature. The operating frequency for the EM16 is from 15-25 kHz and
the station selection is made by plug-in units.
-8-
For the purpose of this EM survey the station used was Cutler,
Maine, which has a frequency of 24.0 kHz.
All the readings were taken facing north at 50 foot intervals and
the topography was noted for future use in the interpretation of the EM
results.
Magnetic Survey:
This system uses a backward motion of spinning protons of a hydro
gen atom within a fluid of hydrogen and carbon. These spinning magnetic
protons are caused to have two opposite poles by applying a magnetic field
using a current within a coil of wire. When the current is stopped, the
protons precess about the earth's magnetic field and in turn generate a
small current in the wire. This frequency of precession is proportional
to the earth's total magnetic field.
This instrument is read directly in gammas which is the absolute
value of the earth's total field for that station.
The instrument used for this survey was an EDA OMNI IV Tie-Line
Proton Magnetometer, this instrument has a sensitivity of .01 gammas.
The diurnal variation was monitored by tieing in each Hue at a
check station located at the ends of the lines on the baseline and the tie-
line at 40 f 00 S.
This magnetometer has the ability to calculate and correct any
diurnal variations. This is calculated by tieing in all lines to known
-9-
points on the ground and known tie-ins to the computer in the magnetometer.
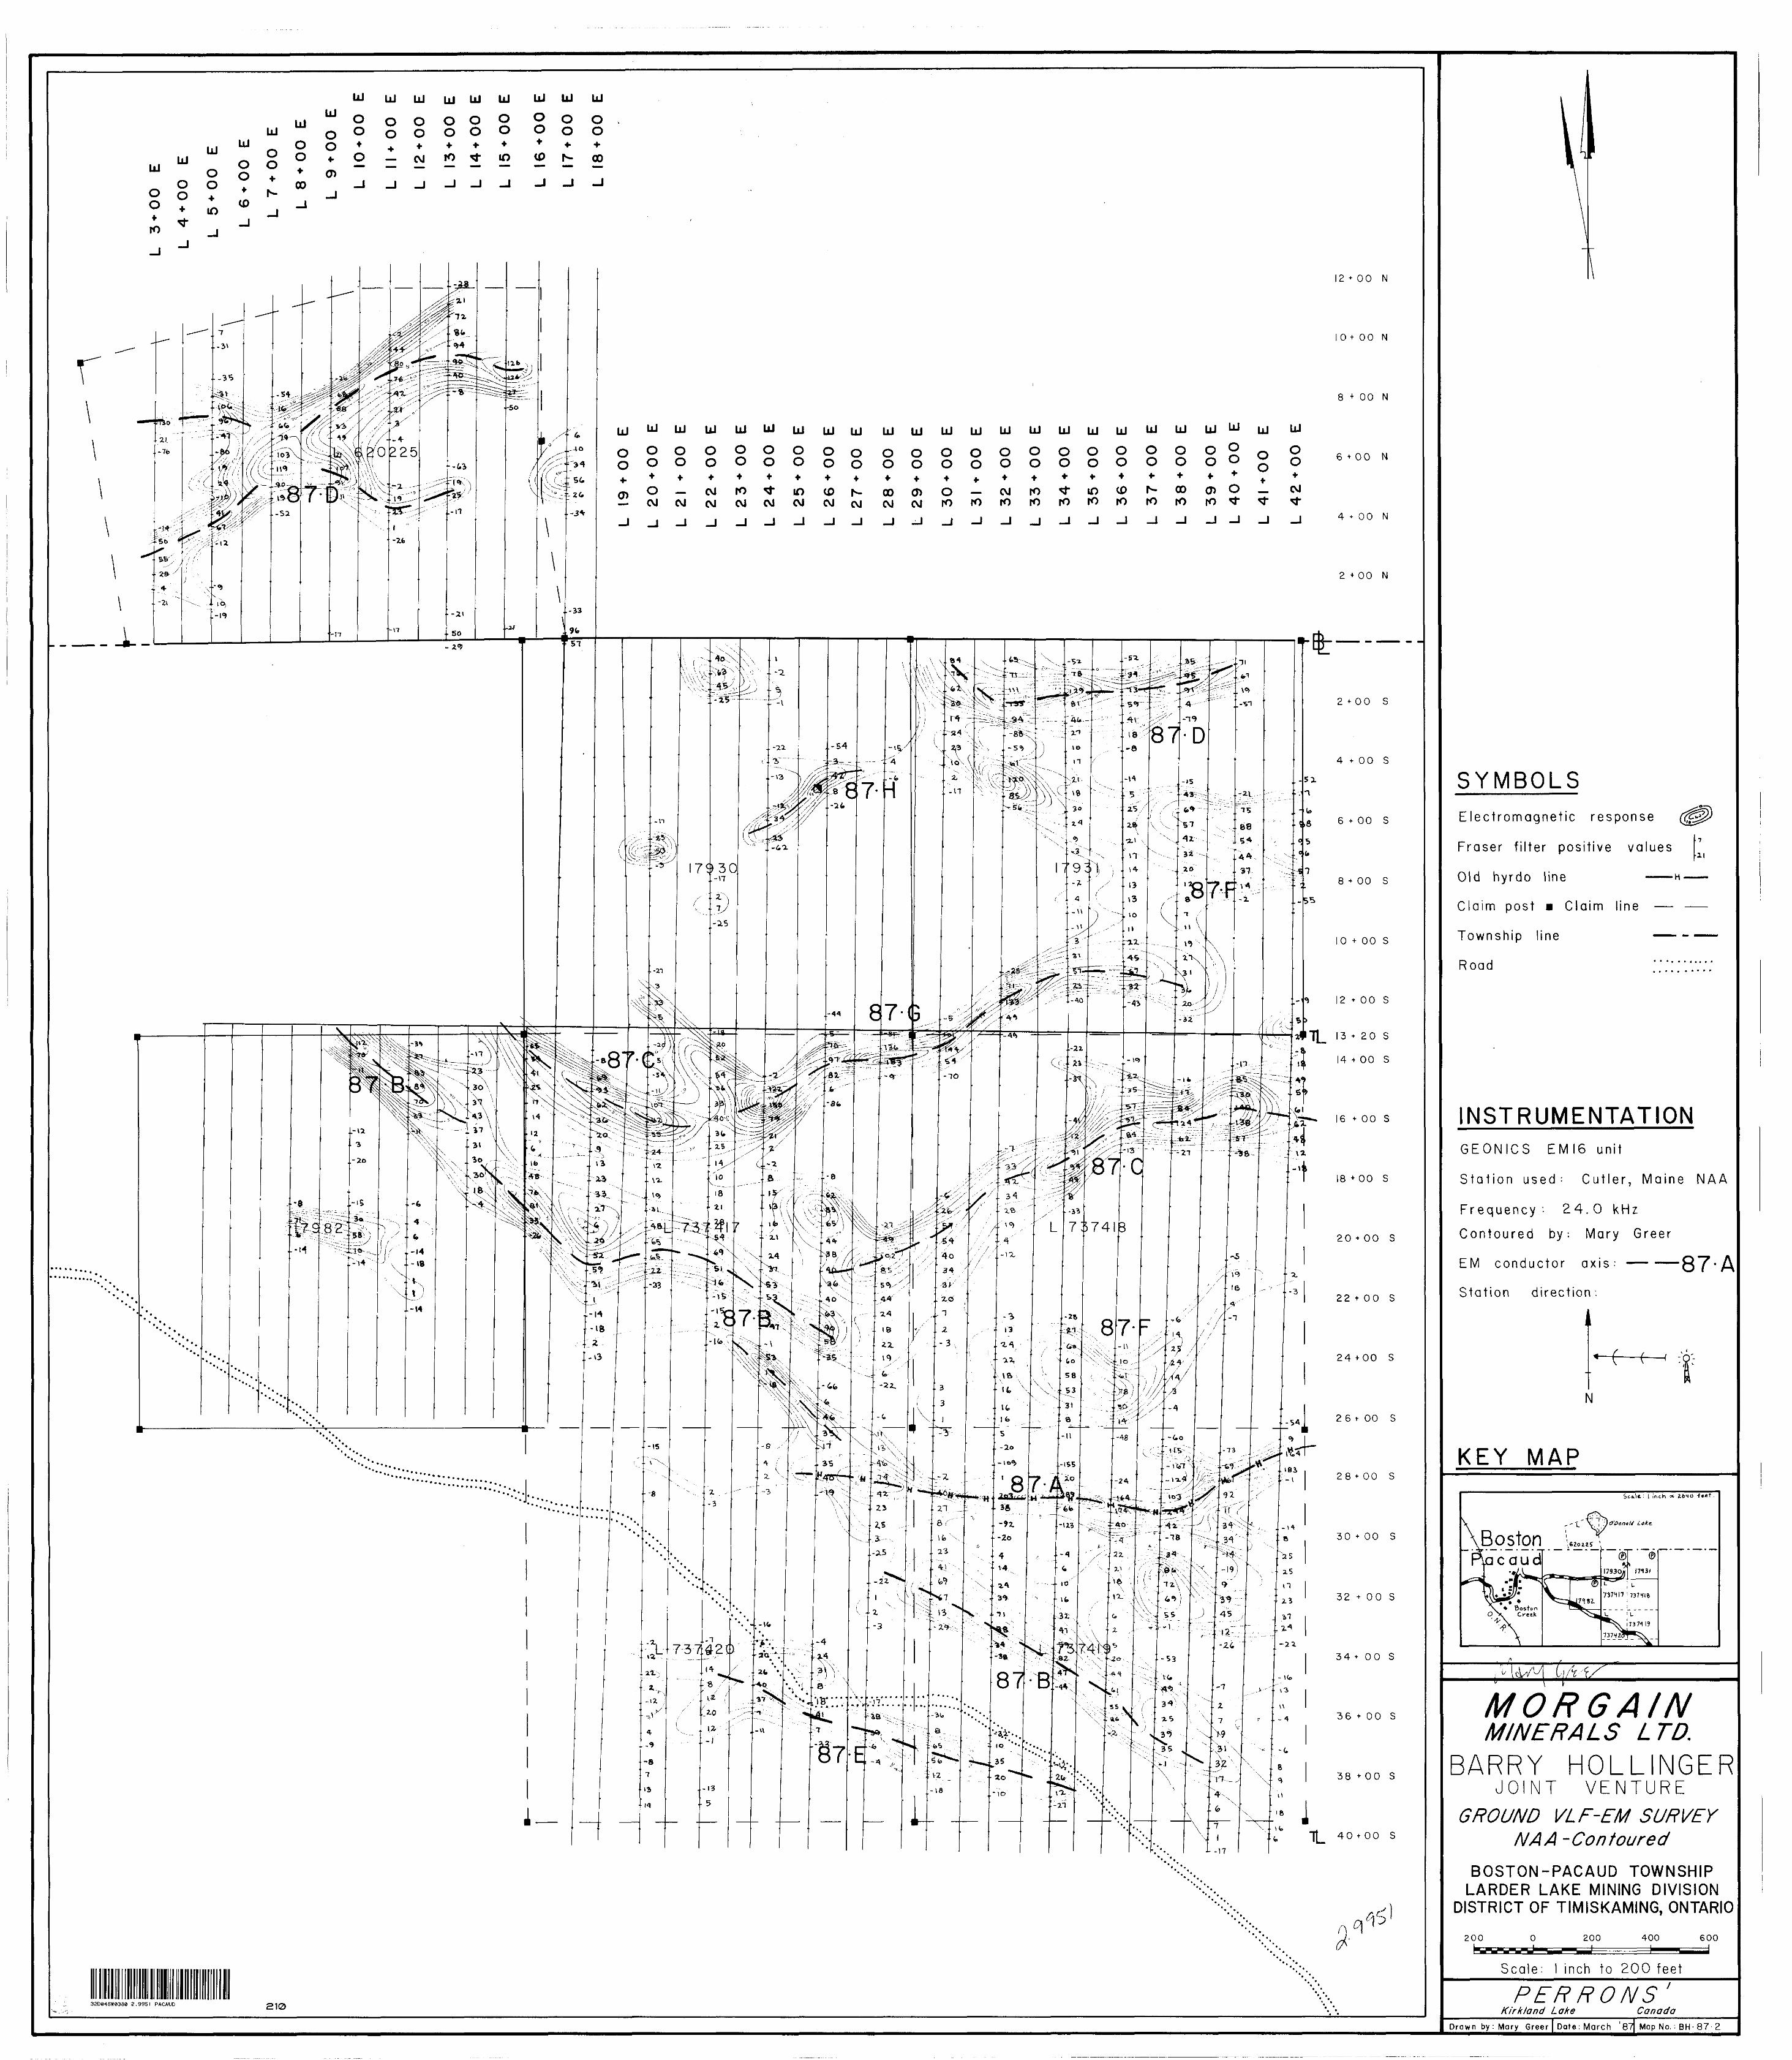
PRESENTATION AND DISCUSSION OF RESULTS
i) EIectromagnetic Survey:
The field data is presented on a map at a horizontal scale of one
inch to 200 feet, Map No. BH-87-2, found in the back pocket of this report.
The VLF-EM data is illustrated in this report as contoured data
using the Fraser Filter method. This was done as such to show simple clarity
on the printed map. At such a close line spacing of 100 feet, it would be
difficult to tell which profiled information belongs to their respective
data numbers and lines. Also to help reduce the possibility of a large
geologic noise component which can result from the high-transmitted fre
quency, again over close line spacing.
A method of contouring the da,ta. wa.s devised by D.C. Fraser in
volving data manipulation to filter out the geologic noise. This method
involves simple adding and subtracting of the in-phase values, eliminates
the dynamic range problem and reduces the noise.
This method is the sum of the in-phases at two consecutive sta
tions, subtracted from the sum at the next two stations. Negative values
are not plotted or contoured since they do not aid in the interpretation of
the conductors.
For the presentation of this report see the plan maps for con
ductor locations.
-10-
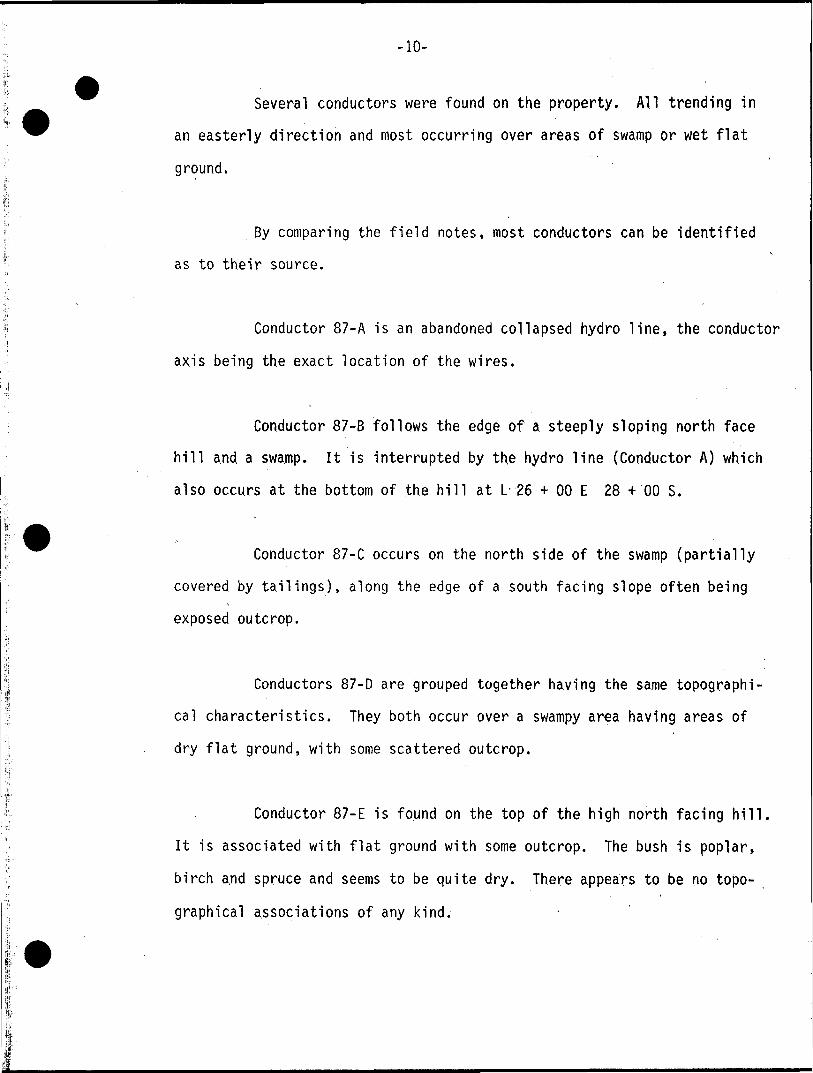
Several conductors were found on the property. All trending in
an easterly direction and most occurring over areas of swamp or wet flat
ground.
By comparing the field notes, most conductors can be identified
as to their source.
Conductor 87-A is an abandoned collapsed hydro line, the conductor
axis being the exact location of the wires.
Conductor 87-B follows the edge of a steeply sloping north face
hill and a swamp. It is interrupted by the hydro line (Conductor A) which
also occurs at the bottom of the hill at L 26 4^ 00 E 28 -f 00 S.
Conductor 87-C occurs on the north side of the swamp (partially
covered by tailings), along the edge of a south facing slope often being
exposed outcrop.
Conductors 87-D are grouped together having the same topographi
cal characteristics. They both occur over a swampy area having areas of
dry flat ground, with some scattered outcrop.
Conductor 87-E is found on the top of the high north facing hill.
It is associated with flat ground with some outcrop. The bush is poplar,
birch and spruce and seems to be quite dry. There appears to be no topo
graphical associations of any kind.
-11-
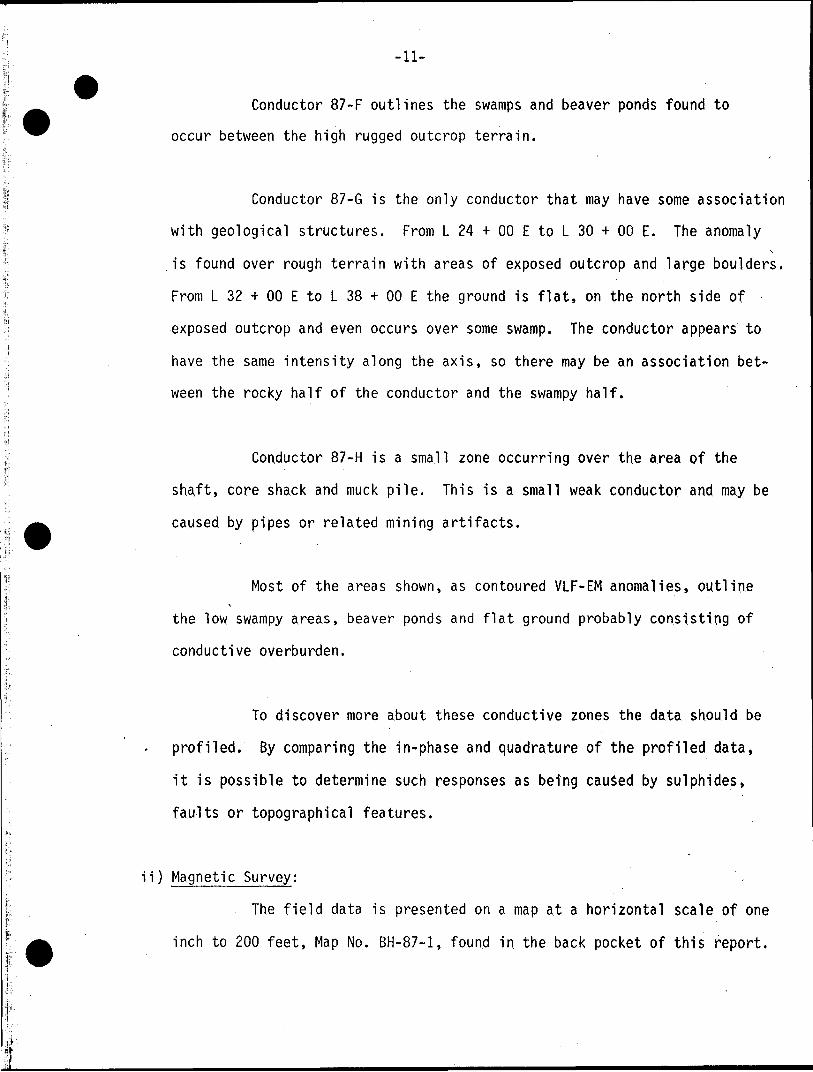
Conductor 87-F outlines the swamps and beaver ponds found to
occur between the high rugged outcrop terrain.
Conductor 87-G is the only conductor that may have some association
with geological structures. From L 24 + 00 E to L 30 + 00 E. The anomaly^\
is found over rough terrain with areas of exposed outcrop and large boulders.
From L 32 t 00 E to L 38 H- 00 E the ground is flat, on the north side of
exposed outcrop and even occurs over some swamp. The conductor appears to
have the same intensity along the axis, so there may be an association bet
ween the rocky half of the conductor and the swampy half.
Conductor 87-H is a small zone occurring over the area of the
shaftj core shack and muck pile. This is a small weak conductor and may be
caused by pipes or related mining artifacts.
Most of the areas shown, as contoured VLF-EM anomalies, outline
the low swampy areas, beaver ponds and flat ground probably consisting of
conductive overburden.
To discover more about these conductive zones the data should be
profiled. By comparing the in-phase and quadrature of the profiled data,
it is possible to determine such responses as being caused by sulphides,
faults or topographical features.
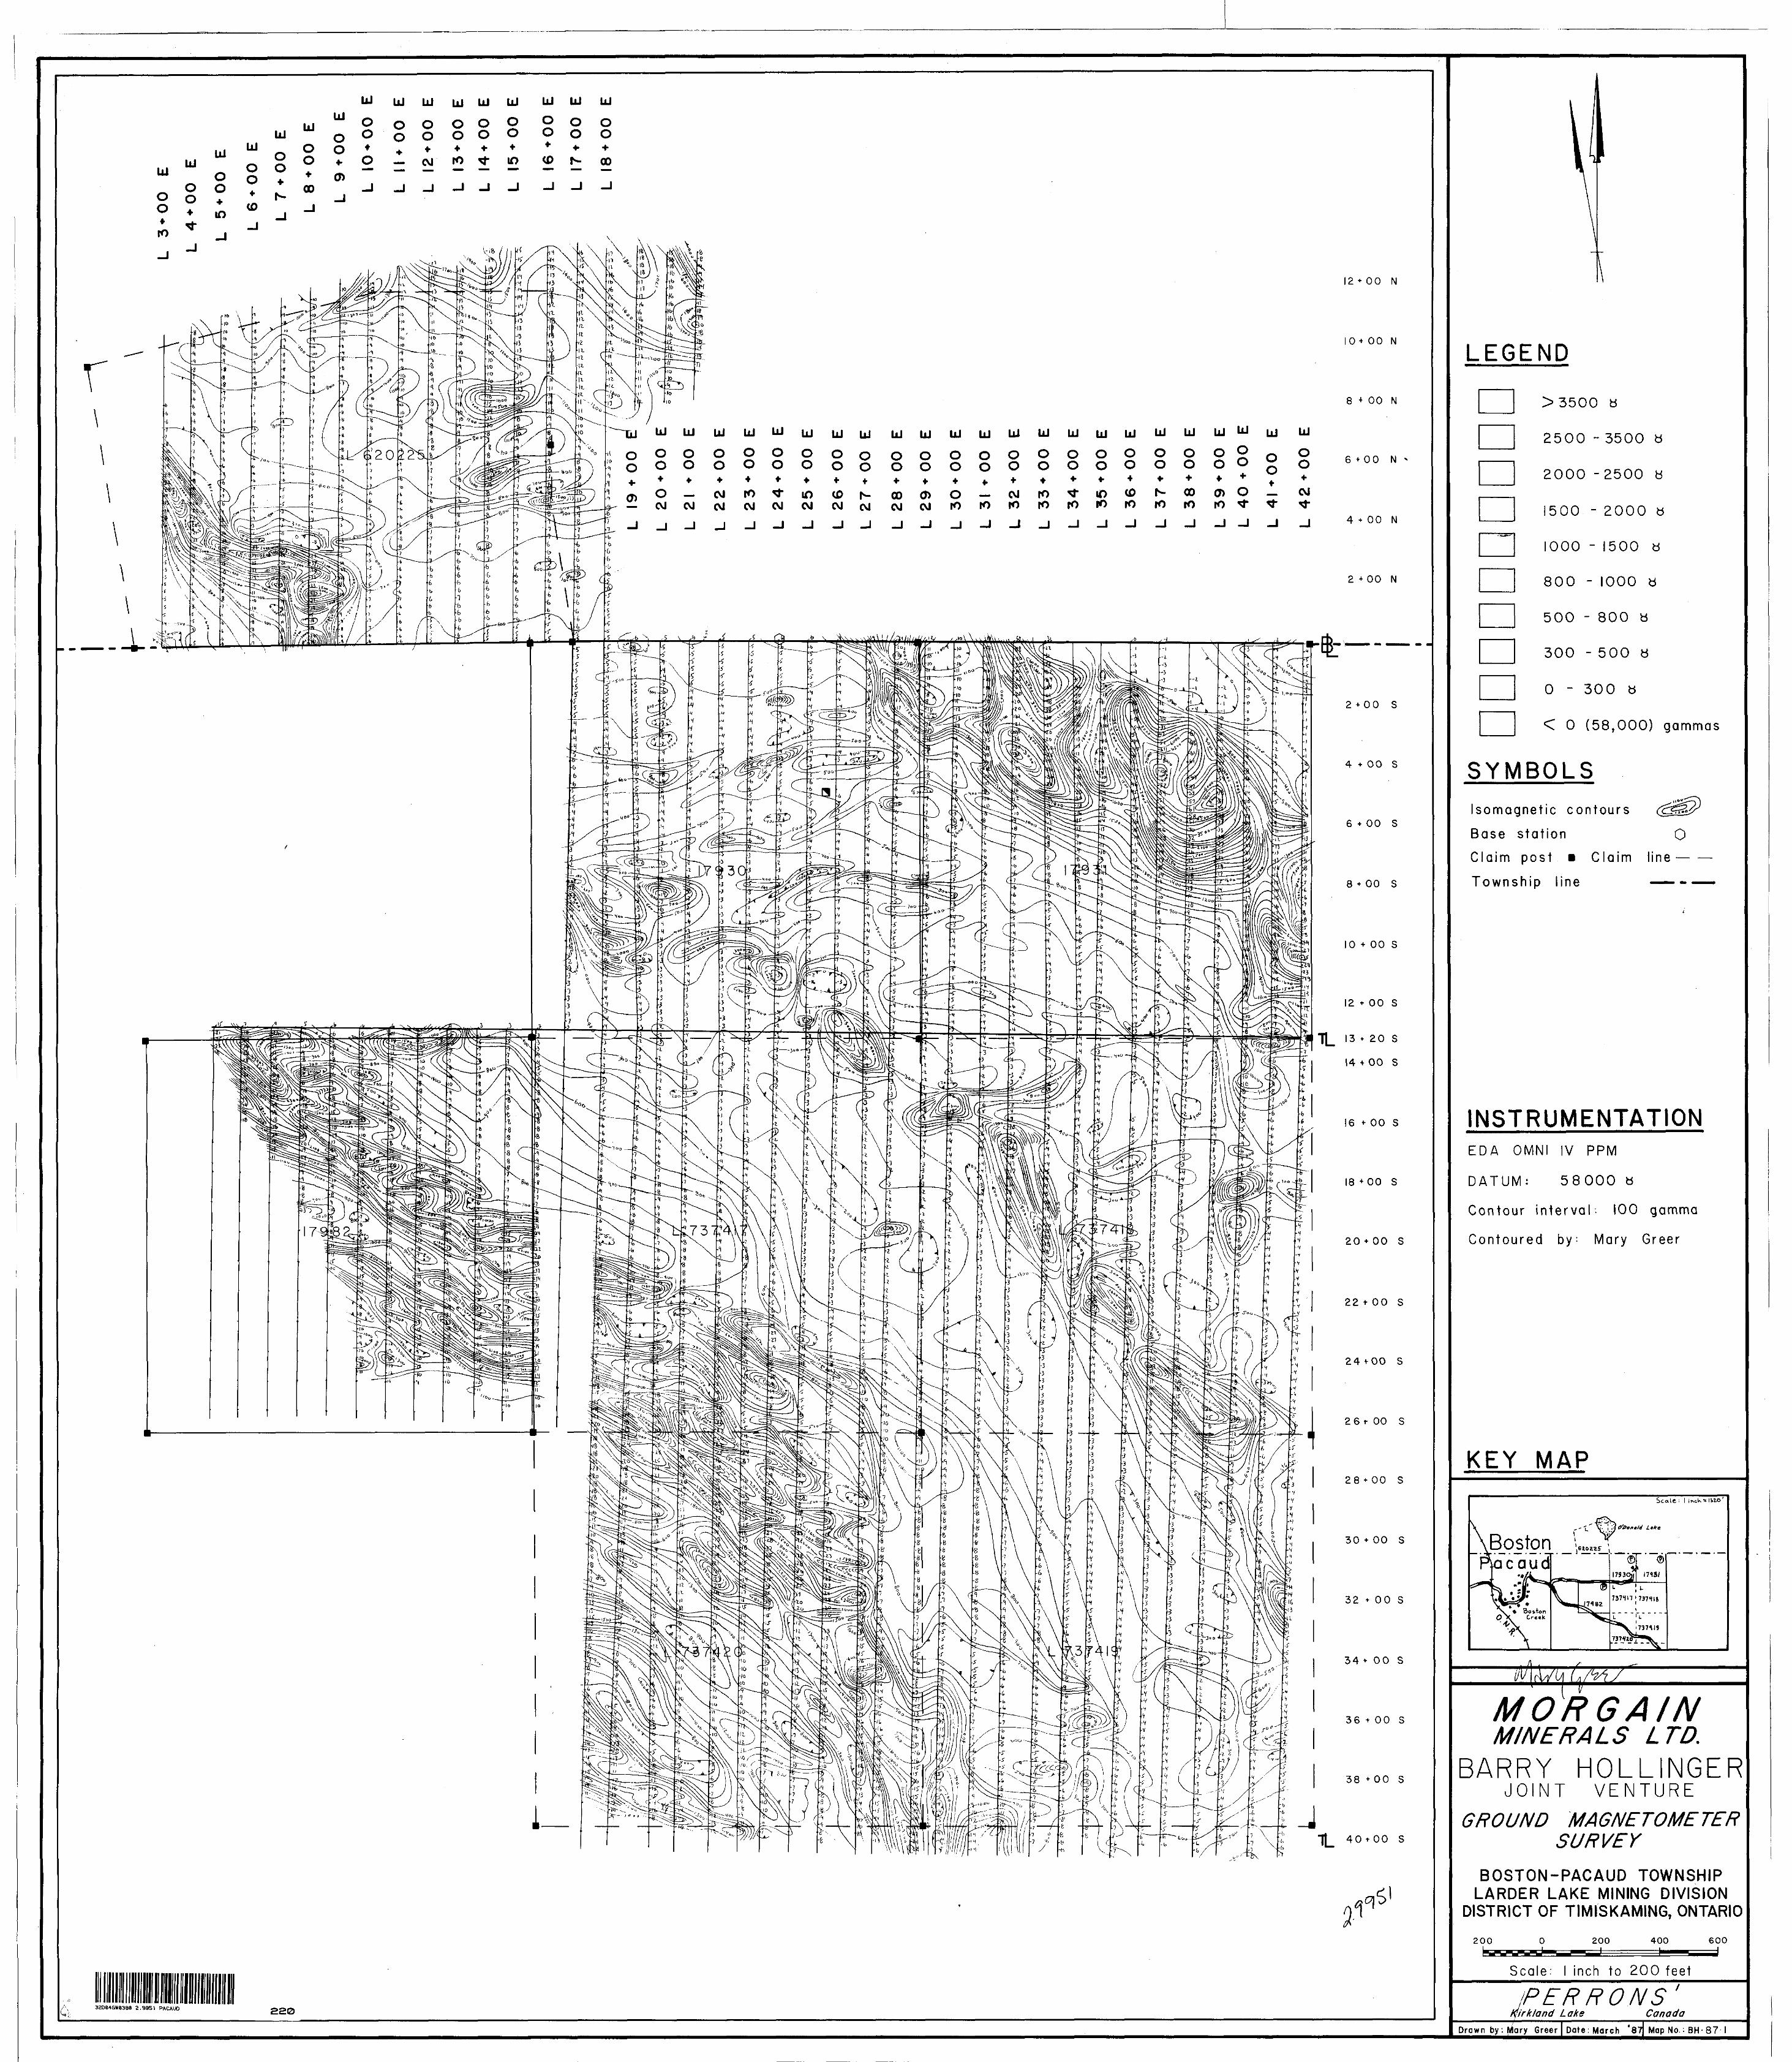
ii) Magnetic Survey:
The field data is presented on a map at a horizontal scale of one
inch to 200 feet, Map No. BH-87-1, found in the back pocket of this report.
-12-
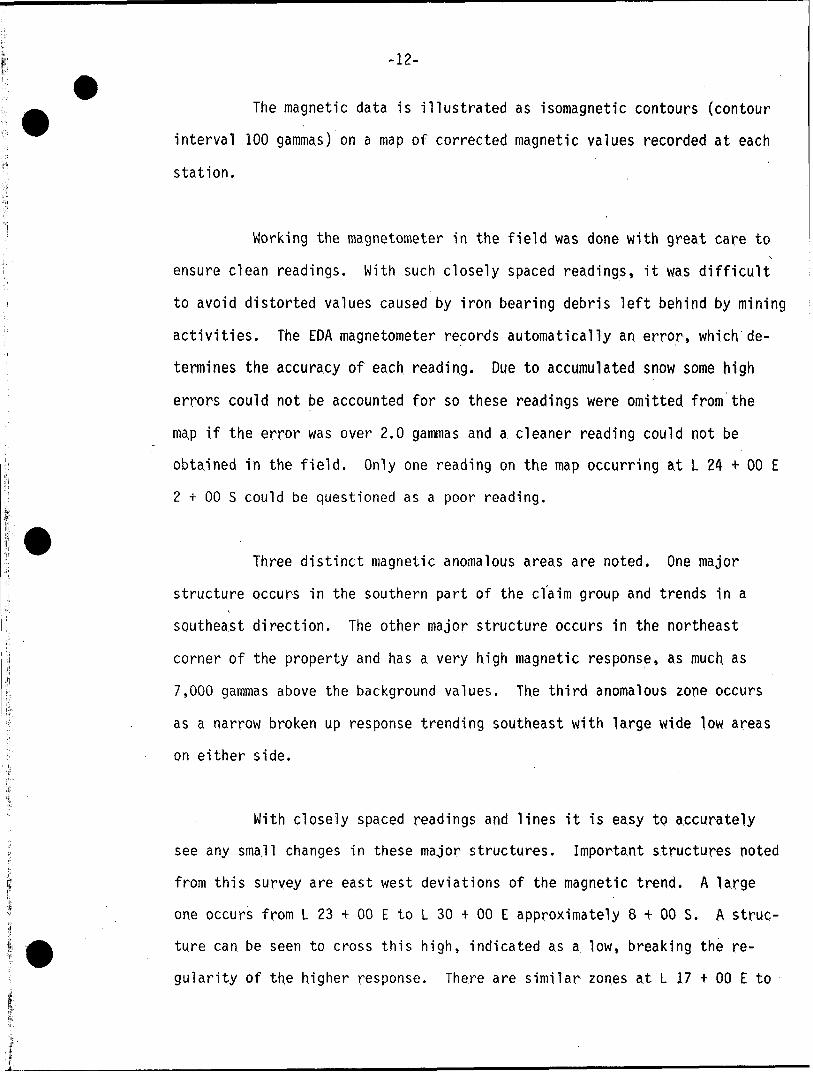
Th e magnetic data is illustrated as isomagnetic contours (contour
interval 100 gammas) on a map of corrected magnetic values recorded at each
station.
Working the magnetometer in the field was done with great care to s
ensure clean readings. With such closely spaced readings, it was difficult
to avoid distorted values caused by iron bearing debris left behind by mining
activities. The EDA magnetometer records automatically an error, which de
termines the accuracy of each reading. Due to accumulated snow some high
errors could not be accounted for so these readings were omitted from the
map if the error was over 2.0 gammas and a cleaner reading could not be
obtained in the field. Only one reading on the map occurring at L 24 f 00 E
2 * 00 S could be questioned as a poor reading.
Three distinct magnetic anomalous areas are noted. One major
structure occurs in the southern part of the claim group and trends in a
southeast direction. The other major structure occurs in the northeast
corner of the property and has a very high magnetic response, as much as
7,000 gammas above the background values. The third anomalous zone occurs
as a. narrow broken up response trending southeast with large wide low areas
on either side.
With closely spaced readings and lines it is easy to accurately
see any small changes in these major structures. Important structures noted
from this survey are east west deviations of the magnetic trend. A large
one occurs from L 23 -t- 00 E to L 30 t 00 E approximately 8 -e 00 S. A struc
ture can be seen to cross this high, indicated as a low, breaking the re
gularity of the higher response. There are similar zones at L 17 * 00 E to
-13-
L 22 + 00 E at 4 + 00 S; L 30 * 00 E to L 34 * 00 E 15+00 S; and
31 t 00 E to L 34 H 00 E 34 -f 00 S.
These described areas occurring over claim L-17930 are in direct
relationship with the known locations of the major gold veins, which gives
cause to further consider the other zones as possible .outlines for aurife
rous areas.
The heavily altered and shear zones of the Pacaud fault is clearly
shown by the southern magnetic high, it is also shown to deviate from it's
southeastern trend to bend nearly due south at L 28 t 00 E to L 30 t 00 E.
This may show a shifting of the fault or a cross-cutting north south fault
which may also show up in the mixed up, broken up magnetic trend which
crosses the centre part of the property. This trend may be carried through
to the bottom left corner of claim L-620225. This zone is just bending
south at L 8 t 00 E and cannot be projected south of the baseline without
further field work.
CONCLUSIONS AND RECOMMENDATIONS
Only Conductor 87-B appears to have any association with the magnetic
trend and structure when overlayed with the magnetic survey map. It should be
noted from the TL 13 + 20 S 10 + 00 E to L 26 + 00 E the VLF conductor axis is
found to occur along the edge of a higher magnetic gradient. This gradient when
compared with the local geology map shows the boundary of the Pacaud Fault. The
EM conductor 87-B may be this fault, normally faults or shear zones do not give
anomalies without a cause. Some conductivity must be associated with them, sul
phide deposits may be one of the causes. Because of the conductive overburden
found in the swamp, the EM response is influenced, causing a modification of the
l
-14-
profiled data. This gives cause for a geological interest in 87-B rather than
passing it off as a topographical response.
Conductor 87-G has no relation with any known geology whem compared to
the local geology map, nor does it have any magnetic associations.
The only point of interest occurs at L 28 4- 00 E 15 * 00 S. Here the
southeast-northwest magnetic trend is interrupted at this point by a magnetic low
and this low is immediately south of the EM conductor axis. This low indicates a
change in the structure, possibly caused by a fault which also may be indicated
by the EM response. This conductor and magnetic zone should be tested with enough
diamond drill footage, to completely test the cause for the magnetic trend and EM
response. It may be possible that this structure may be found at depth, a deep
hole should be considered.
Also the small magnetic east-west deviations should be tested by diamond
drilling. These zones have been mapped out to have strong associations with the
known gold veins. These zones have never been tested over the staked claims and
may prove to be favourable gold zones. One good example would be found at L 29 *
00 E to L 34 + 00 E 14 * 00 S. This zone has the same characteristics as the
known gold veins mapped and tested as the Barry Hollinger ore deposits.
Respectfully submitted,
April 10, 1987 Mary GreerGeophysical^Technician
-15-
BIBLIOGRAPHY
Sixty-sixth Annual Report of the
Ontario Department of Mines
Volume LXVI, Part 5, 1957
Geology of Boston Township and part of
Pacaud Township by K.D. Lawton
CERTIFICATE
I, Mary Greer, of Kirkland Lake, Ontario, do hereby certify:
,1) That I am a Geophysical Technician and reside at:.
, - . vf-V ;, .'-."5',.-. 1 '. k: ,'\'.l
49 McKelvie Avenue, Kirkland Lake, Ontar1o??*P2N ;'.2K6
2.) That I graduated from Sir Sandford Fleming College at
Lindsay, Ontario, in 1978, with a diploma as a Geological
Technician.
3) That I have been continuously engaged in my profession for
the past six (6) years and I am qualified to write this
report.
4) That I supervised and participated in this survey.
Datei-.'HMaryvGreei'
Geophysical Technician
and MinesOntario
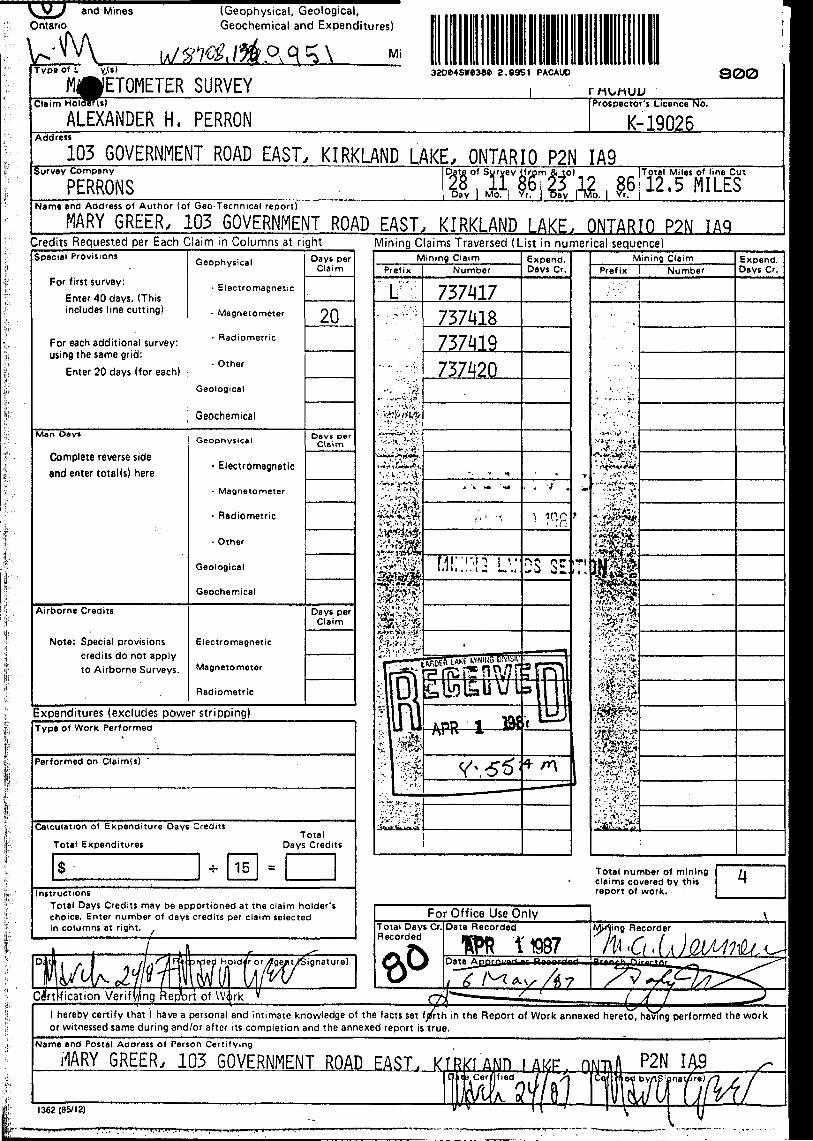
(Geophysical, Geological, Geochemical and Expenditures)
Mi
ETOMETER SURVEYaaoenswease z.995t PACAUD 900
Holdlr(t)
ALEXANDER H, PERRONProspector's Licence No.
K-19Q26Address
103 GOVERNMENT ROAD EAST, KIRKLAND LAKE. ONTARIO P2N IA9Survey Company
PERRONSDate of Survey Ifrpm a to) Total Miles of line Cut
Name and Address of Author (of Geo-Tecnnical report)
MARY GREER, 103 GOVERNMENT ROAD EAST. KIRKLAND LAKE, ONTARIO P?N TAQCredits Requested per Each Claim in Columns at rightSpecial Provisions
For first survey:Enter 40 days. (This includes line cutting)
For each additional survey: using the same grid:
Enter 20 days (for each)
Man Day*
Complete reverse side end enter total (s) here
Airborne Credits
Note: Special provisions credits do not apply to Airborne Surveys.
Geophysical
- Electromagnetic
- Magnetometer
- Radiometric
- Other
Geological
Geochemical
Geophysical
- Electromagnetic
- Magnetometer
- Radiometric
- Other
Geological
Geochemical
Electromagnetic
Magnetometer
Radiometric
Days perClaim
20
Days per Claim
Days per Claim
Expenditures (excludes power stripping)Type Of Work Performed
Performed on Claim(s)
Calculation of Expenditure Days Credits
Total ExpendituresTotal
Days Credits
15 "Instructions
Total Days Credits may be apportioned at the claim holder's choice. Enter number of days credits per claim selected in columns at right.
ed Holdfr ordge/it/Signature)
Gift rji cat i on Verif^ng ftepbrt of W^rk
Mining Claims Traversed (List in numerical sequence)
Total number of mining claims covered by this report of work.
For Office Use OnlyTotal Days Cr. Date Recorded Recorded
,-
d M/rting Recorder
11987 ' m'GJ,
1 hereby certify that 1 have a personal and intimate knowledge of the facts set tyfrth in the Report or witnessed same during and/or after its completion and the annexed report is true.
Name and Postal Address of Person Certifying
ilARY GREER, 103 GOVERNMENT ROAD EAST ,
of Work annexed hereto, having performed
KTRKI AND 1 AHF. DM7H
W)""m li \ P2N
IvyfnWMIA9
nat/ire) XIr//*the work
/^
4/1362 (85/12)
Ministry ofNorthern Developmentand Mines
Ontario
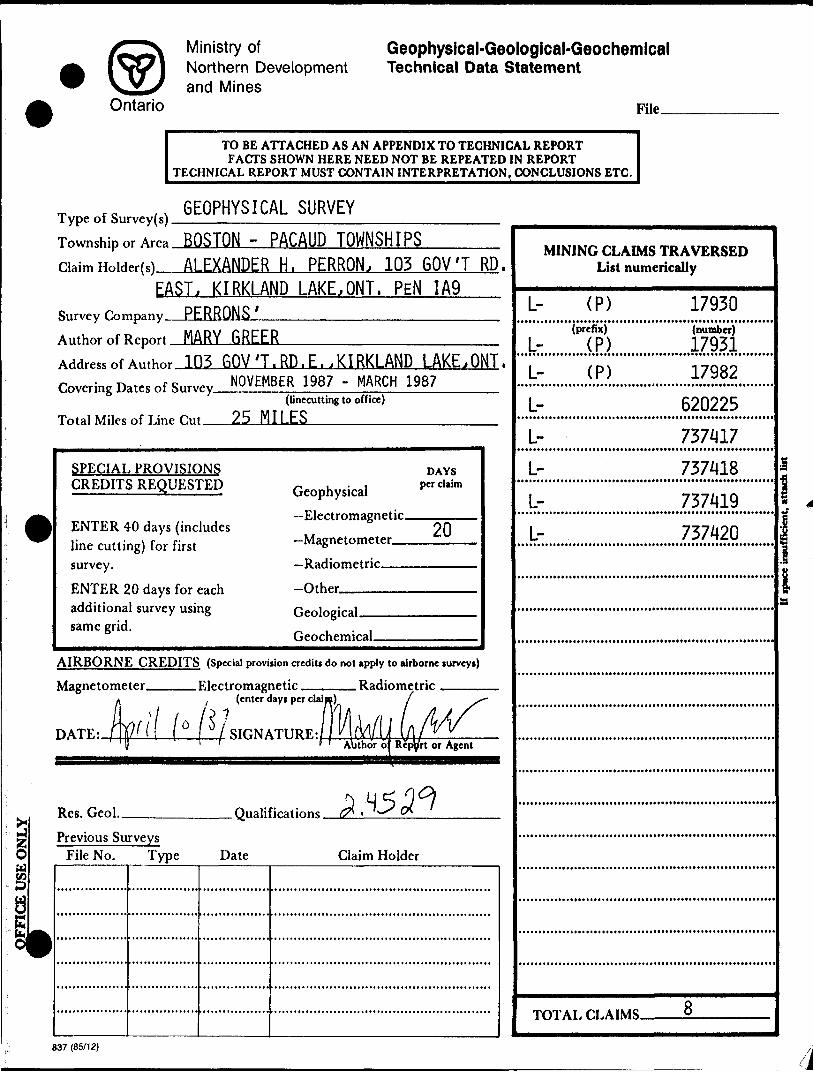
Geophysical-Geological-Geochemlcal Technical Data Statement
File_
TO BE ATTACHED AS AN APPENDIX TO TECHNICAL REPORTFACTS SHOWN HERE NEED NOT BE REPEATED IN REPORT
TECHNICAL REPORT MUST CONTAIN INTERPRETATION, CONCLUSIONS ETC.
T fc ,. GEOPHYSICAL SURVEYType of Survey(s) —————————^—.—...—^—.^^^———.——^Township or Ar.a BOSTON - PACAUD TOWNSHIPS————, ClaimHnMarM ALEXANDER H. PERRON. 105 GOV'T RD.
EAST. KIRKLAND LAKE.ONT. PEN IA9Survey P-nmpany PERRONS '-......-^.......^^.....^
Author of Report MARY GREER____________________Address nf A..thnr 103 6QV 'T. RD. E., KIRKLAND LAKE.QNT.Covering Dates of s..™y NOVEMBER 1987 - MARCH 1987
([incoming to office) Total Miles of Line rm 25 MILES_________________
SPECIAL PROVISIONS CREDITS REQUESTED
ENTER 40 days {includes line cutting) for first survey.ENTER 20 days for each additional survey using same grid.
Geophysical—Electromagnetic.—Magnetometer——Radiometric———Other.—————
DAYSper claim
20
Geological.Geochemical.
AIRBORNE CREDITS (Special provision credits do not apply to airborne surveys)
Magnetometer
DATE:
Electromagnetic. . Radiometric(enter days per claim)
SIGNATURE:Author of Reptirt or Agent
iI
Res. Geol.. .Qualifications.Previous Surveys
File No. Type Date Claim Holder
MINING CLAIMS TRAVERSED List numerically
L-
L-L-
L-
kL-
L: L-
(P) 17930(prefix)
(P)
(number)
17931(P) 17982
620225
737(117
737418 i
737419
737420
TOTAL CLAIMS. 8
837 (85/T2)
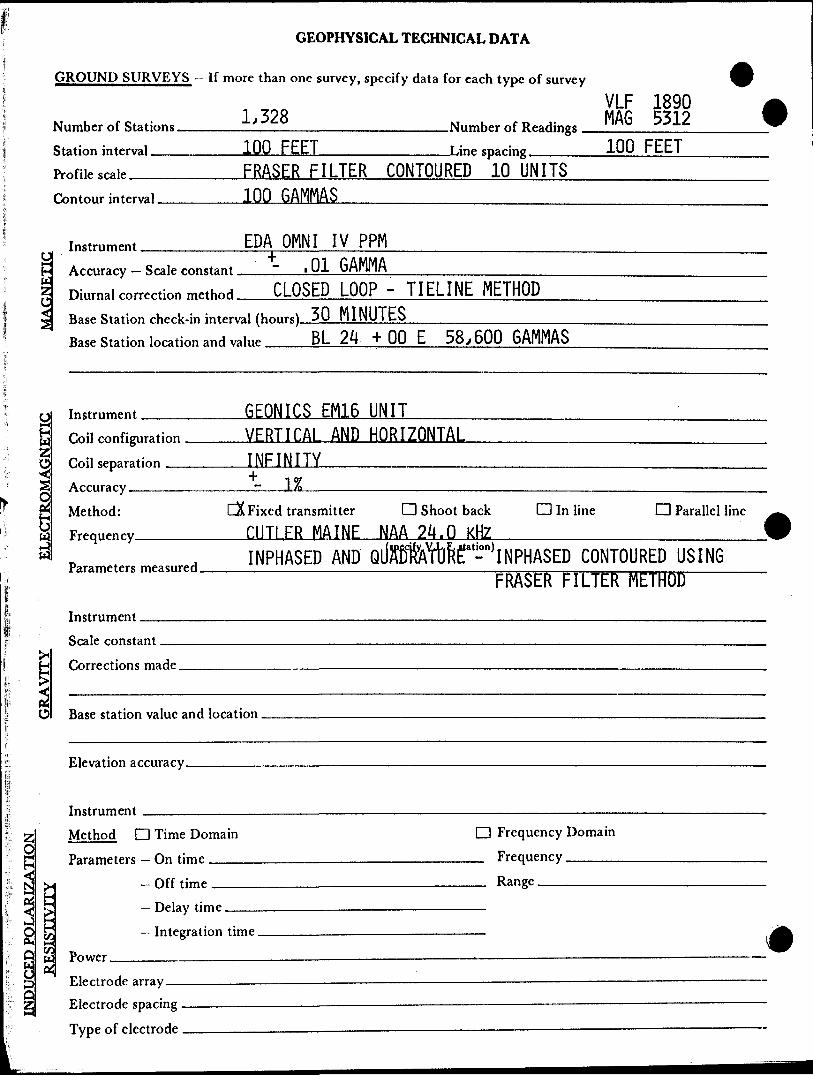
GEOPHYSICAL TECHNICAL DATA
GROUND SURVEYS — If more than one survey, specify data for each type of survey
, * ft VLF 1890 Ai ^OO MAP K^l 0 ^^V Number of Stations -L;-^O Number of Readings ' IHb W1* W
Station interval 100 FEET T.ine snacincr 100 FEET
Pronie s,aie FRASER FILTER CONTOURED 10 UNITSContour interval 100 GAMMAS
In.tm.nen, EDA OMNI IV PPM
P Arrnrary Sr-ale ronstant ~ .01 GAMMA
2 nn,rna. ,orre,tion method CLOSED LOOP - TIELINE
^ Race Station rherk.in interval (hours) 30 MINUTES
Rase Station location and value KL ZH T UU t JO t
METHOD
600 GAMMAS
0, Instrument GEONICS EM16 UNIT
g mn ^nfignr-tinn VFRT I CAI AND HDR I ZONTAL^ Coil separation INFINITY'"^C j S Af"'rary - IA
?^ Method: CX Fixed transmitter D Shoot back D In line Q Parallel line ^^S Fr^nenry f.HTI FR MAINE NAA 24 . 0 KHZ V
d t H INPHASED AND ' QlttURffljfifParameters measured
Instrument . .... .., . ,.,......,, . — .... ......Scale constant
H C-orrertions made
WO Base station value and location
Elevation accuracy,
Instrumenty Method D Time DomainoP Parameters - On timeS S-d — Off timea *" * tr1 Delay timeO H — Jritegratinn time
Q S Power ____________________ - ————————————S *! p Electrode array ——————— - ———————————————————————cZ Electrode spacing ————— - ———————— - ——————————————
Tvoe of electrode ..,,.... ———————— — ——————————
- n) INPHASED CONTOURED USINGFRASER FILTER METHOD
1 i Frequency Domain FrequencyRange
*
SELF POTENTIALInstrument-—————^^————^———-————--^———^—^———— Range.Survey Method ———————————————————————————————————————————
Corrections made.
RADIOMETRICInstrument ———.Values measured.Energy windows (levels)—^—^———-^^^———^-^——^——.—.^^^-——.^————..—— Height of instrument____________________________Background Count. Size of detector-————^—.-——^^-——-—^———-——-.——.—.-—--.———--—^^—.Overburden —————————.---—.——.^^—-..——^^———.——.————...—.-—...—^—
(type, depth — include outcrop map)
OTHERS (SEISMIC, DRILL WELL LOGGING ETC.) Type of survey———————————————————————Instrument ————————————————————————Accuracy-———————-————-—-—————^—-——Parameters measured.
Additional information (for understanding results).
AIRBORNE SURVEYS Type of survey(s)———— Instrument(s) —————
(specify for each type of lurvey) Accuracy—————.————.—.———
(specify for each type of survey) Aircraft used-———————-———^————-.^^—.——.——.-—.
Sensor altitude-
Navigation and flight path recovery method.
Aircraft altitude______________________________Line Spacing.Miles flown over total area—-————-——.-——————————..—-—Over claims only_________________
___________________J
GEOCHEMICAL SURVEY - PROCEDURE RECORD
Numbers of claims from which samples taken.
Total Number of Samples. Type of Sample.
(Nature of Material)Average Sample Weight——————— Method of Collection————————
Soil Horizon Sampled. Horizon Development- Sample Depth———— Terrain————————
Drainage Development——————————— Estimated Range of Overburden Thickness.
ANALYTICAL METHODSValues expressed in: per cent
p. p. m. p. p. b.
Daa
Cu, Pb,
Others_
Zn, Ni, Co, Ag, Mo, As,-(circle)
Field Analysis (~Extraction Method. Analytical Method- Reagents Used——
Field Laboratory AnalysisNo. ———————.——.
SAMPLE PREPARATION(Includes drying, screening, crushing, ashing)
Mesh size of fraction used for analysis——--.
Extraction Method. Analytical Method - Reagents Used -—-
Commercial Laboratory (. Name of Laboratory^ Extraction MpthoH
Analytical Method —— Reagents Used ————-
.tests)
.tests)
-tests)
GeneraL General.
l E R RO N S 103 GOVERNMENT ROAD EAST - KIRKLAND LAKE, ONTARIO - P2N 1A9 - (705) 667-7057
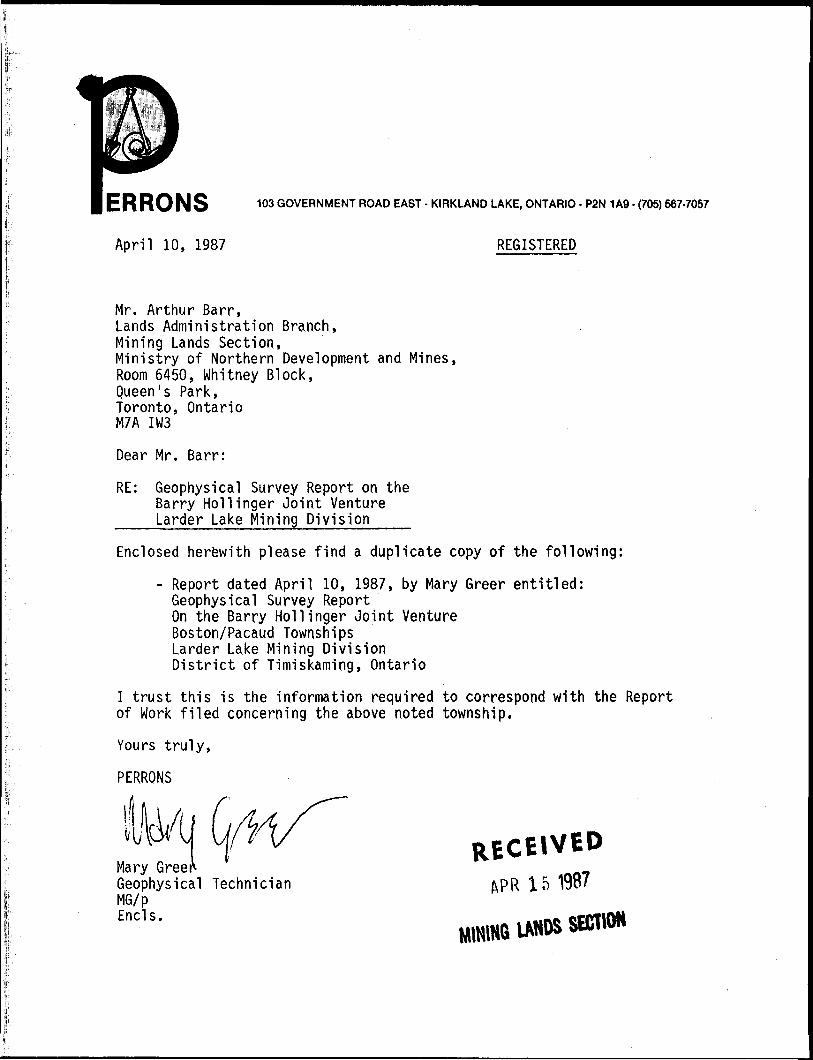
April 10, 1987 REGISTERED
Mr. Arthur Barr,Lands Administration Branch,Mining Lands Section,Ministry of Northern Development and Mines,Room 6450, Whitney Block,Queen's Park,Toronto, OntarioM7A IW3
Dear Mr. Barr:
RE: Geophysical Survey Report on the Barry Hollinger Joint Venture Larder Lake Mining Division
Enclosed herewith please find a duplicate copy of the following:
- Report dated April 10, 1987, by Mary Greer entitled: Geophysical Survey Report On the Barry Hollinger Joint Venture Boston/Pacaud Townships Larder Lake Mining Division District of Timiskaming, Ontario
I trust this is the information required to correspond with the Report of Work filed concerning the above noted township.
Yours truly,
PERRONS
RECEIVEDMary Greei^ ' - Geophysical Technician ApR 15 19o7 MG/p
P J "i •fi' j^ o 3 9 a a Z
p O * r* a n jf 3 i1 Tl
f
2 V to i S z z CD > Z O t/1 c 23 Tl
> n rn 5 Q T
H C/)
V) 33 O 1 in C
^i Tl
> n m 3J O x H
(/l O Z r -c
2 3J P 1 Z z z n n o x H in
O
Z r ^
> 33 m > 00 5 i D JJ
> 5 z -n O
S g CO •o
O CO H O 12
MA
RQ
UIS
TO
WN
SH
IP
dIH
SN
MO
l 3N
IHV
H1V
O
CANCELLED
' SAND S.
GRAVEL
. ... NOTE
: MINING RIGHTS
IN PARI
1913.
VESTED
IN
ORIG
LANDS
ACT.
RSO
19T o ;
n -
Z m
\??
S
i'
**:
!t
-* > > H -
* '
w m
5
j.m
-r
e. i
•0^ s*s
P.;
i' B
" 5
•x"
M ^ -i
' c
mo
1 82*
' R
?S
'f*1
-B*
O®
1
ORDER-1N-COUNCIL ... ...
RESERVATION
10
8
1
LICENCE
OF
OCCUPATION -4
1
" MININ
G HIGHTSO
NI
f- < C
1
" SURFAC
E RIGHTS
O
Z r * a
1
LEASE.
SURFACE
A
MINING 3) 5 I
H C/l n
1
" . MININ
G RIGHTS
O
Z r K , O
1
" .SURFA
CE RIGHT
S
O Z f K 3
1
PATENT
SURFACE 81
MININ D 33 5 x H
en
-
0
1
TYPE
OF
DOCUMENT
w < Z S r '
|
DISPOSITION 01 •n O za o K
?* S z r— > a CO
•FLOODING OR FLOODING R SUBDIVISION on COMPOS!!
RESERVATIONS
ORIGINAL
SHORELINE
MARSH
OR
MUSKEG
MINES
TRAVERSE
MONUMENT
—i
—
m
n V '
- ?
51
si
2
i
fN
P C
f 1
:\
' SS
S
- .
i 1
--! V
k
® ^
^ 1
(M
ii"
^-4
-^^
1 i
1
1
RAILWAY
AND
RIGHT
OF
W
UTILITY
LINES
> *l
1
•~
1
MINING
CLAIMS
ETCHIGHWA
Y AND
ROUT
E No
.
OTHER
ROADS
TRAILS
SURVEYED
LINES
TOWNSHIPS. BASE
LINE
S, LOTS
. MININ
G CLAIM
S. Pt
UNSURVEYED
LINES
LOT
LINES
H)
m-*
1 _ i
2n
r-
-w m H f~
l
.
A.
1
' |J6 i
V^
.1 !
1 j
i 1
\ i i
* ;
P" m
en m S-*
K
S.
O , D
-OO
A
IU UJ UJ UJ LU UJ UJUJUJ
UJ
O O*ro
UJ
O O4-*-
LJ
O O*1O
UJ
o of
CO
UJ
o o4-r-
UJ
o o4-00
UJ
o o4-
o
o o*o
o o
o o4-
OJ
o oo o4- 4-
10 *fr
o o*in
o o*
CD
o o4-
N-
o o4- 00
LJ UJ UJ UJ UJ UJ
oot
CMro
o o4-ro ro
73720
LJ UJ UJ UJ W UJ
o o4-*frro
o o4-
to ro
oO4
CD 10
O O4-
h-
ro
O O•fCDro
O oO O* *en o10 ^-j -i
Oot
UJ
o o4-
(M ^
A xAVv\;.v
ji
i _ -
84xV^
:;•p^-'-r~-^ \
( 1H f - X^A
. i" --,;
: -n
-- - B"^- I '"--V '
"' Q^lf/ f-" ^^ '?^*y.'.•- i^
\x
^"""S^i.^. —— -C^-*-
j''
\\^-"•••.
^i-V-i;KAv'.-v-'^s-
x
x
'' d
X,'^X
^;xx /' -* — -t—
. WE ^
•TT.U2: 1..
:.\W "-"rtry'-: ,;
^A ^-^~.. . -1 "So"^
' \
~ 5 ^ s
\-te1".""c-^vv^ -:-"x-;'Nv-X
'~ti3^
^si,;-;" :
s".s' ,
•ZtS^ '^^^-
^V'sJw//'--/,W&''"*t*l
-A** -
\"x
:- ;.-: .O
-- ^Z- ' '^-.
-. --~-
- " ' . . J\
y '^^5^c^3 \
- - - -j~ - ~
-. ^- n" \, ' ^.
l l
/'
-Si: -Tft~
^i
ftv;'"Ai.—-—
XT
\©
n
\Z( *\8
30
l^l
^
: ^3^''3:-i4•|.u
' ^i^';
^^T/^-^-s s.' ,-'
C r.
.-li.'3 '
.-31;
^T^^'- ~".'.~
J3T7
t o —— ...
p1
/'
- -^'--
- - --
' -.. ,
S.
\ ( j ',/
i
/;:-^." nu:r— ,- . ~~":--..r" - - -I~
. - - t" - -— - ---
.-AO i
-j• lii-- --
-51 ;
^ifc-T* 1
^~A*.
-''1 8.^-6
-H'"5- ::is /'za\•2-1 \
n\4-
13
\3
. 10it
raz-
45
iL~^^^^^d^. - ^ . -—.-4*
. . j*
:;x;PO
;"
i t
\ ,-^-
~-
^.i ...^
- 1^ t
u . '^'
^-—1 . "
2-'
W
'- ,
/' ,.( '-:
*^
^A-l**
•D
-15
•4a?-^fc*
^si
^f --^r '
"r"" ,
A;r- ;-
,^l ,fcl. \^.-vi
-2.L-r 15
A@
... .• n
32
, *Q
'37f-T
tt
o-K*X 31
5^
..A'V -. 37
4
511
5^
l
-4
-^\eW-"^i7
V,
\ -\-• f
j
i v V z-3
-n
-ias---,^fit, - '^^•^ "-^-^ /"*.^
'
v )
*x
1
IS
^
ij
rv-| 1 V.r- a;*,-,.
-3(*
, S . .
: ; fe,S5?^:
VZ
-\8
,
.* *
4.
12 * 00 N
10+00 N
8 * 00 N
6+00 N
4 * 00 N
2 * 00 N
2+00 S
4 * 00 S
6 * 00 S
8 + 00 S
O t 00 S
2 * 00 S
3 * 20 S
14 + 00 S
22+00 S
24+00 S
26 f 00 S
28+00 S
30 + 00 S
32 * 00 S
34+00 S
36 + 00 S
38+00 S
"[L 40 + 00 S
A SI ^5
32D045W0380 2.9951 PACAUD 210
SYMBOLSElectromagnetic response
Fraser filter positive values
Old hyrdo line ——
Claim post m Claim line
Township line
Road
INSTRUMENTATIONGEONICS EMI6 unit
Station used: Cutler, Maine NAA
Frequency - 24.0 kHz
Contoured by: Mary Greer
EM conductor axis-- —— —— QT' A
Station direction.
fN
KEY MAP
\BostpnLake.
Placaud
MORGAINMINERALS LTD.
BARRYJO NT
OLLINGERVENTURE
GROUND VLF-EM SURVEY NAA -Contoured
BOSTON-PACAUD TOWNSHIPLARDER LAKE MINING DIVISION
DISTRICT OF TIMISKAMING, ONTARIO
200 O 200 400 600
Scale: l inch to 200 feet
PERRONS 1Kirkland Lake Canada
Drawn by : Mary Greer Date: March 87 Map No.- BH- 87-2
UJ UJ UJ UJ LU LJ UJ UJ
111
O O
ro
UJ
O O
UJ
o o* IO
UJ
o o
UJ
o o4-
UJ
o ot 00
UJ
o o* O)
-J
o o*o-J
o o
o o*
CM
o o•f ro
o oo o*in
o oo o* *CO N-
o o•f 00
-l -l
UJ UJ
32004SWei380 2.9951 PACAUD 220
2 * 00 N
0+ 00 N
8 * 00 N
6*00 N
4 * 00 N
2 +00 N
2+00 S
4 * 00 S
6 * 00 S
8 + 00 S
10 * 00 S
12 * 00 S
13 * 20 S
14+00 S
16 t 00 S
18+00 S
20+00 S
22 t 00 S
24+00 S
26tOO S
28+00 S
30 + 00 S
32 * 00 S
34+00 S
36 + 00 S
38+00 S
40tOO S
LEGEND
^500 b
2500 -3500 b
2000 -2500 b
1500 - 2000 b
000 - 1500 b
800 - 1000 b
500 - 800 b
300 - 500 b
O - 300 b
< O (58,000) gammas
SYMBOLSIsomagnetic contours
Base station
Claim post m Claim
Township line
INSTRUMENTATIONEDA OMNI IV PPM
DATUM: 58000 b
Contour interval. 100 gamma
Contoured by: Mary Greer
KEY MAP
BpstpnRacau
MORGAINMINERALS LTD.
BARRY HOLLINGERJOINT VENTURE
GROUND MAGNETOMETERSURVEY
BOSTON-PACAUD TOWNSHIPLARDER LAKE MINING DIVISION
DISTRICT OF TIMISKAMING, ONTARIO
200 O 200 400 600
Scale, l inch to 200 feet
PER RONS'Kirkland Lake Canada
J)rawn by: Mary Greer Date: March '87| Map No. :BH-87