Embed Size (px)
Citation preview
Foto: Försvarsmakten/David Gernes
Geomagnetic storm impact in Sweden – observations, modelling and prediction capability
European Space Weather Symposium 2020 L. Rosenqvist, J. Kjäll, A. P. Dimmock, D. Welling, E. Yordanova
Swedish Defence Research Agency, FOI, Sweden
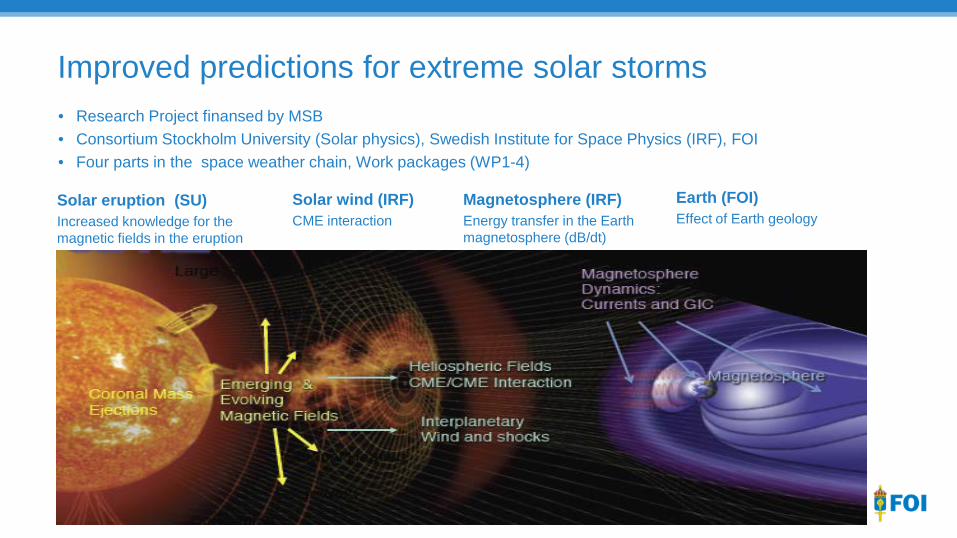
Improved predictions for extreme solar storms
• Research Project finansed by MSB • Consortium Stockholm University (Solar physics), Swedish Institute for Space Physics (IRF), FOI • Four parts in the space weather chain, Work packages (WP1-4)
Solar eruption (SU) Increased knowledge for the magnetic fields in the eruption
Solar wind (IRF) CME interaction
Magnetosphere (IRF) Energy transfer in the Earth magnetosphere (dB/dt)
Earth (FOI) Effect of Earth geology
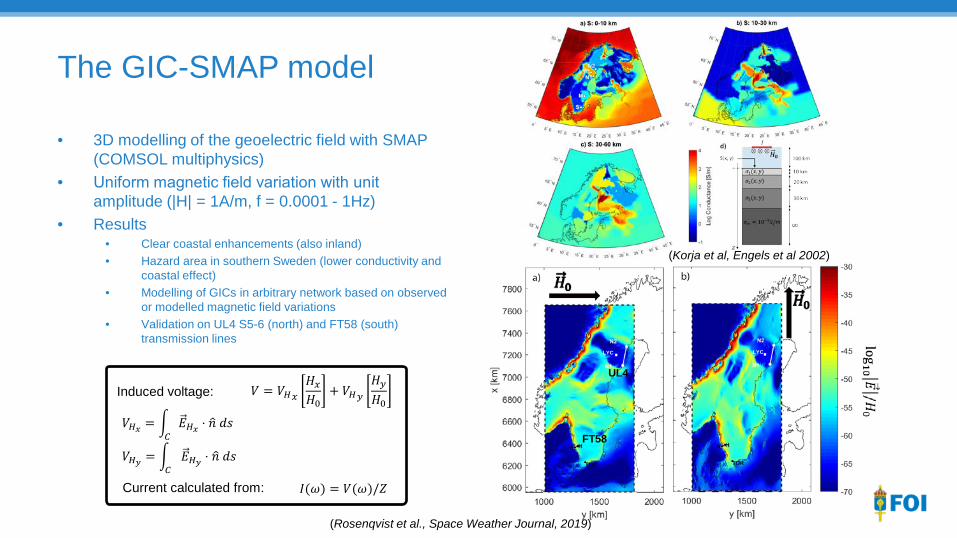
The GIC-SMAP model
• 3D modelling of the geoelectric field with SMAP (COMSOL multiphysics)
• Uniform magnetic field variation with unit amplitude (|H| = 1A/m, f = 0.0001 - 1Hz)
• Results • Clear coastal enhancements (also inland) • Hazard area in southern Sweden (lower conductivity and
coastal effect) • Modelling of GICs in arbitrary network based on observed
or modelled magnetic field variations • Validation on UL4 S5-6 (north) and FT58 (south)
transmission lines
𝑉𝑉𝐻𝐻𝑥𝑥 = � 𝐸𝐸𝐻𝐻𝑥𝑥 ⋅ 𝑛𝑛� 𝑑𝑑𝑑𝑑𝐶𝐶
𝑉𝑉 = 𝑉𝑉𝐻𝐻𝑥𝑥𝐻𝐻𝑥𝑥𝐻𝐻0
+ 𝑉𝑉𝐻𝐻𝑦𝑦𝐻𝐻𝑦𝑦𝐻𝐻0
𝑉𝑉𝐻𝐻𝑦𝑦 = � 𝐸𝐸𝐻𝐻𝑦𝑦 ⋅ 𝑛𝑛� 𝑑𝑑𝑑𝑑𝐶𝐶
𝐼𝐼(𝜔𝜔) = 𝑉𝑉(𝜔𝜔)/𝑍𝑍
Induced voltage:
Current calculated from:
LYC . LYC .
FT58
UL4
(Rosenqvist et al., Space Weather Journal, 2019)
(Korja et al, Engels et al 2002)
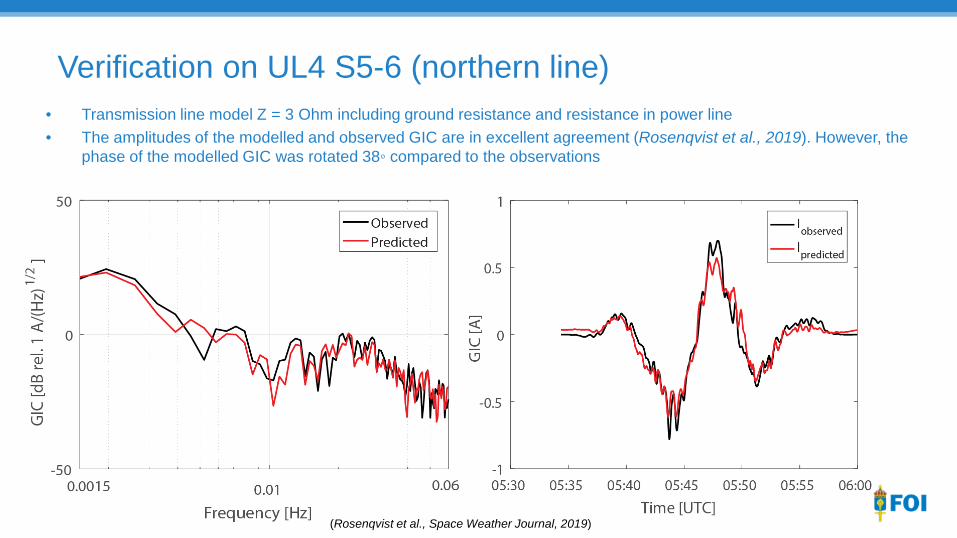
• Transmission line model Z = 3 Ohm including ground resistance and resistance in power line • The amplitudes of the modelled and observed GIC are in excellent agreement (Rosenqvist et al., 2019). However, the
phase of the modelled GIC was rotated 38◦ compared to the observations
Verification on UL4 S5-6 (northern line)
(Rosenqvist et al., Space Weather Journal, 2019)
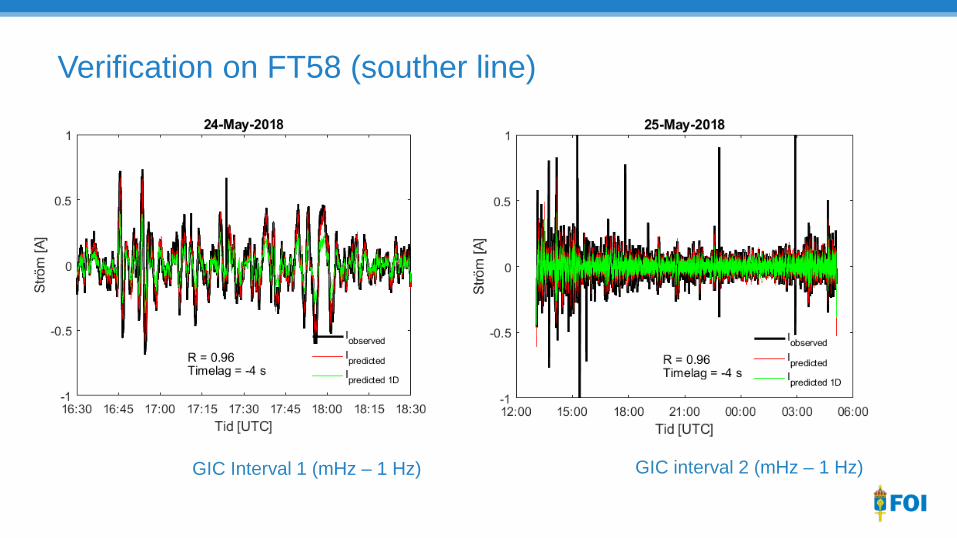
GIC Interval 1 (mHz – 1 Hz) GIC interval 2 (mHz – 1 Hz)
Verification on FT58 (souther line)
What about severe solar storms?
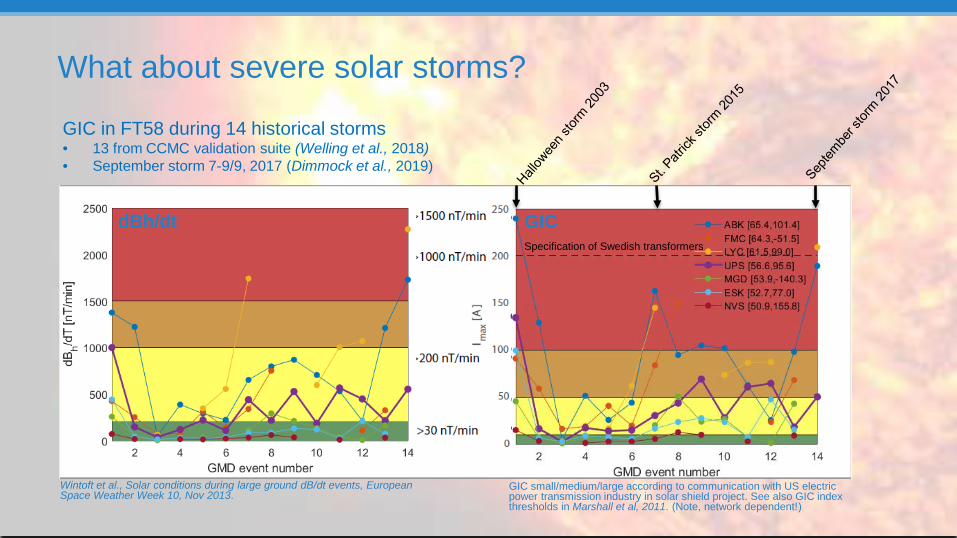
Wintoft et al., Solar conditions during large ground dB/dt events, European Space Weather Week 10, Nov 2013.
GIC small/medium/large according to communication with US electric power transmission industry in solar shield project. See also GIC index thresholds in Marshall et al, 2011. (Note, network dependent!)
GIC in FT58 during 14 historical storms • 13 from CCMC validation suite (Welling et al., 2018) • September storm 7-9/9, 2017 (Dimmock et al., 2019)
GIC
Specification of Swedish transformers
dBh/dt
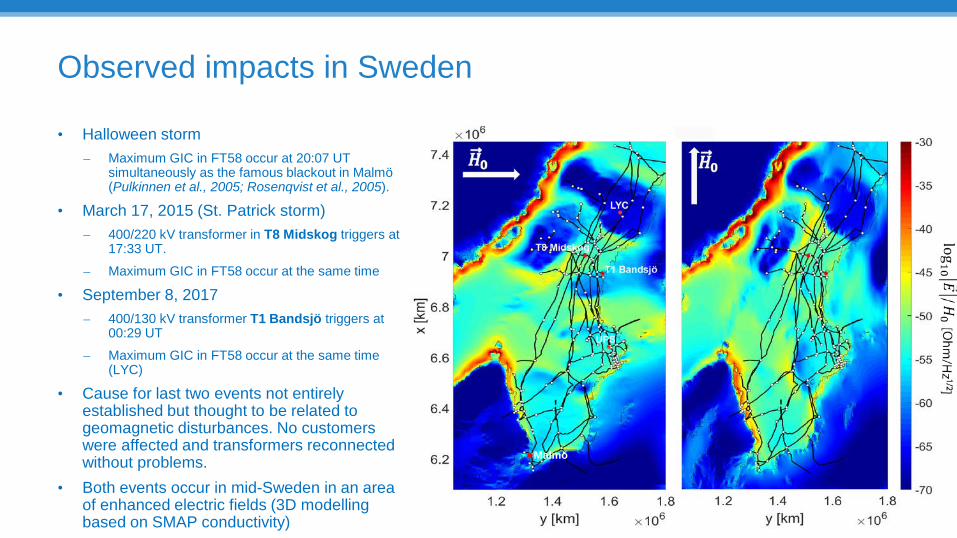
• Halloween storm – Maximum GIC in FT58 occur at 20:07 UT
simultaneously as the famous blackout in Malmö (Pulkinnen et al., 2005; Rosenqvist et al., 2005).
• March 17, 2015 (St. Patrick storm) – 400/220 kV transformer in T8 Midskog triggers at
17:33 UT. – Maximum GIC in FT58 occur at the same time
• September 8, 2017 – 400/130 kV transformer T1 Bandsjö triggers at
00:29 UT – Maximum GIC in FT58 occur at the same time
(LYC)
• Cause for last two events not entirely established but thought to be related to geomagnetic disturbances. No customers were affected and transformers reconnected without problems.
• Both events occur in mid-Sweden in an area of enhanced electric fields (3D modelling based on SMAP conductivity)
Observed impacts in Sweden
Malmö
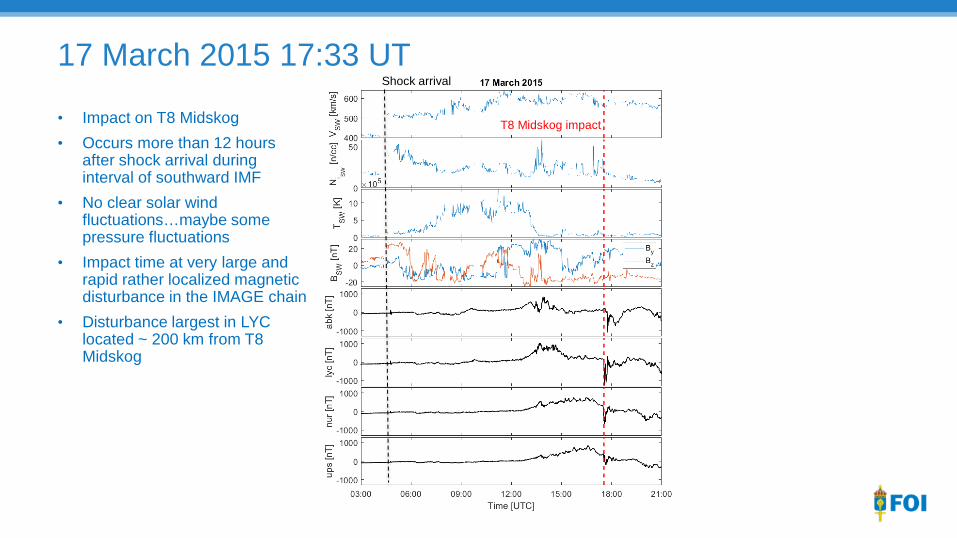
17 March 2015 17:33 UT
• Impact on T8 Midskog • Occurs more than 12 hours
after shock arrival during interval of southward IMF
• No clear solar wind fluctuations…maybe some pressure fluctuations
• Impact time at very large and rapid rather localized magnetic disturbance in the IMAGE chain
• Disturbance largest in LYC located ~ 200 km from T8 Midskog
T8 Midskog impact
Shock arrival
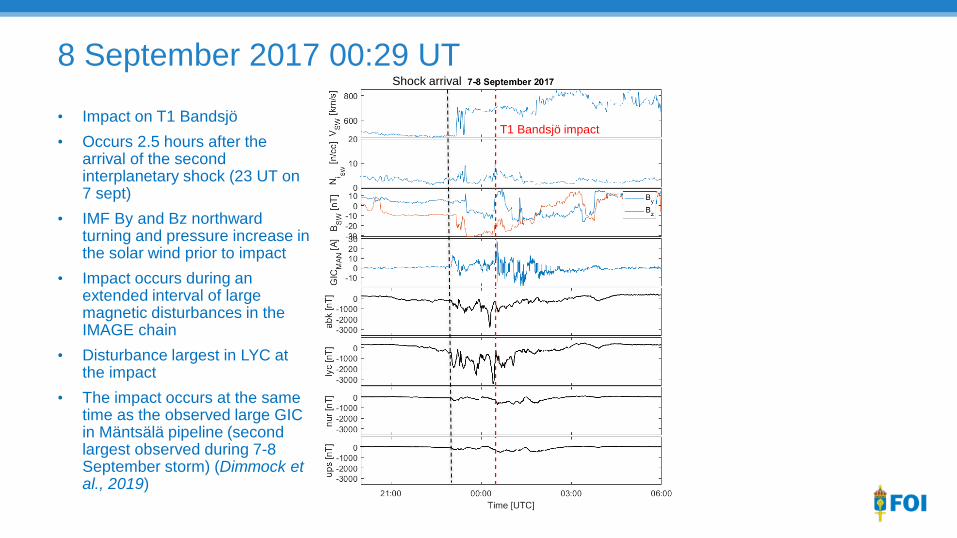
T1 Bandsjö impact • Impact on T1 Bandsjö • Occurs 2.5 hours after the
arrival of the second interplanetary shock (23 UT on 7 sept)
• IMF By and Bz northward turning and pressure increase in the solar wind prior to impact
• Impact occurs during an extended interval of large magnetic disturbances in the IMAGE chain
• Disturbance largest in LYC at the impact
• The impact occurs at the same time as the observed large GIC in Mäntsälä pipeline (second largest observed during 7-8 September storm) (Dimmock et al., 2019)
8 September 2017 00:29 UT Shock arrival
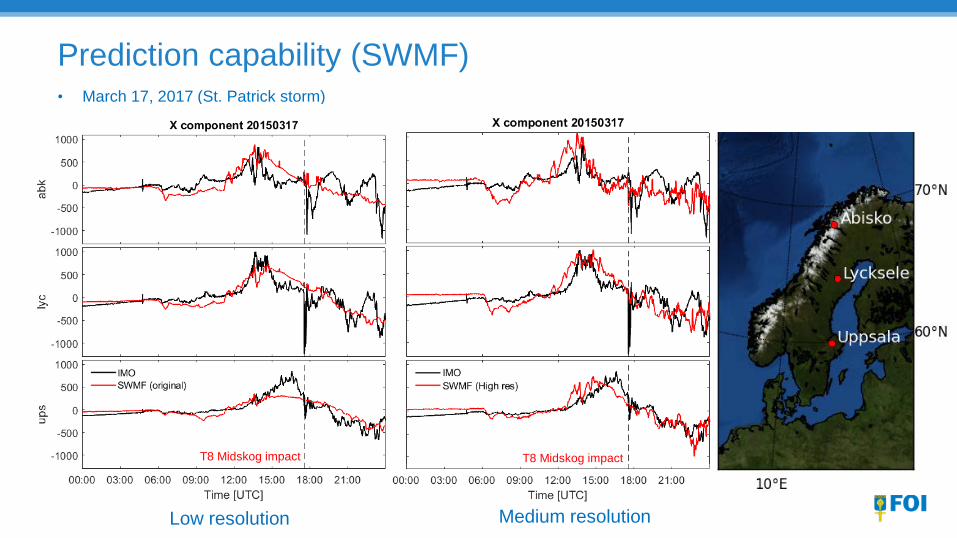
• March 17, 2017 (St. Patrick storm)
Prediction capability (SWMF)
T8 Midskog impact T8 Midskog impact
Medium resolution Low resolution
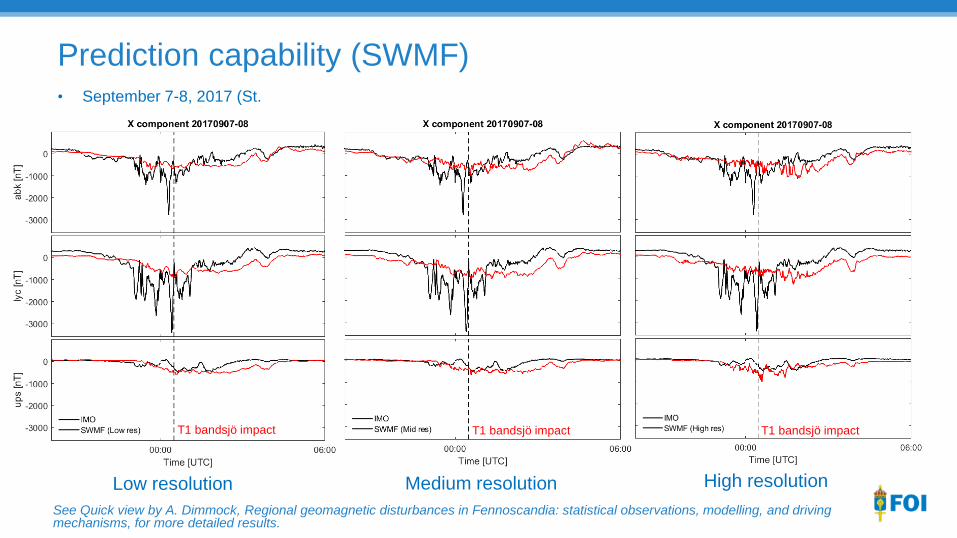
• September 7-8, 2017 (St.
Prediction capability (SWMF)
T1 bandsjö impact T1 bandsjö impact T1 bandsjö impact
Low resolution Medium resolution High resolution
See Quick view by A. Dimmock, Regional geomagnetic disturbances in Fennoscandia: statistical observations, modelling, and driving mechanisms, for more detailed results.

Summary and Conclusions
• Predicted GICs with GIC-SMAP (in a verified southern line) are > 100 A based on high-latitude magnetometer data for three historical storms (Halloween, St. Patrick and September storm)
• The Swedish power grid experienced impacts during all three events • Modelling results taking into account the 3D conductivity structure show that two impacts occur in mid-
Sweden in a region of enhanced electric fields due to – Lower ground conductivity in this region – 3D effects due to neighbouring high conductivity regions on land and at the coast
• The analysis shows that it is highly likely that the impacts were driven by strong GICs in the area as both impacts are closely related to large geomagnetic disturbances with observed maximum amplitudes in the magnetometerstation in LYC which is only ~200 km away from the impact regions
• The impacts occur during different phases of the geomagnetic storm – In the storm main phase at a very large and rapid rather localized magnetic disturbance. No clear solar wind fluctuations – A couple of hours after shock arrival during an extended interval of large magnetic disturbances. IMF turning and SW
pressure increase.
• Both impacts have been modelled with SWMF for low, medium and high resolution • The modelling for all resolution runs fails to reproduce the large geomagnetic disturbances responsible for
the impacts – SWMF underpredicts substorm strength (Haiducek et al, 2020). Work ongoing on producing a stronger response by
addressing the ionospheric conductance model.


![Geomagnetic activity during St. Patrick’s Day storm inferred from …elpub.wdcb.ru/journals/rjes/v16/2016ES000593/2016ES... · 2016-12-22 · data [Gvishiani et al., 2014, 2016b]](https://img.pdfslide.us/doc/110x75/5f787e92eb6c4631763e1233/geomagnetic-activity-during-st-patrickas-day-storm-inferred-from-elpubwdcbrujournalsrjesv162016es0005932016es.jpg)