Embed Size (px)
Citation preview

GEOLOGY OF THE FARMVILLE METAGRANITE AND ASSOCIATED UNITS AS
EXPOSED AT THE NOTASULGA QUARRY, NOTASULGA, ALABAMA
Except where reference is made to work of others, the work described in this thesis is my
own or was done in collaboration with my advisory committee. This thesis does not
include proprietary or classified information.
_________________________
Kevin Robert Bogdan
Certificate of Approval:
_________________________ _________________________
Marsha Andrews Mark G. Steltenpohl, Chair
Geologist Professor
Vulcan Materials Company Geology
_________________________ _________________________
Willis E. Hames Lorraine W. Wolf
Professor Professor
Geology Geology
_________________________
George T. Flowers
Dean
Graduate School
GEOLOGY OF THE FARMVILLE METAGRANITE AND ASSOCIATED UNITS AS
EXPOSED AT THE NOTASULGA QUARRY, NOTASULGA, ALABAMA
Kevin Robert Bogdan
A Thesis
Submitted to
the Graduate Faculty of
Auburn University
in Partial Fulfillment of the
Requirements for the
Degree of
Master of Science
Auburn, Alabama
August 10, 2009
iii
GEOLOGY OF THE FARMVILLE METAGRANITE AND ASSOCIATED UNITS AS
EXPOSED AT THE NOTASULGA QUARRY, NOTASULGA, ALABAMA
Kevin Robert Bogdan
Permission is granted to Auburn University to make copies of this thesis at its discretion,
upon request of individuals or institutions and at their expense. The author reserves all
publication rights.
______________________________
Signature of Author
______________________________
Date of Graduation
iv
VITA
Kevin Robert Bogdan was born on December 4, 1980, in Green Bay, Wisconsin
to Kenneth R. and Kathryn L. Bogdan. He graduated from Trinity High School in Camp
Hill, Pennsylvania, in 1999. He received his Bachelor of Science (cum laude) degree in
geology from the University of Pittsburgh at Johnstown, Johnstown, Pennsylvania, in
December of 2003. Kevin worked in industry as an environmental and engineering
geophysicist from January 2004 through January 2006. Desiring to get reacquainted with
actual rocks, in January of 2006 he switched career paths and entered the aggregate
industry as a geologist working for a consulting company. The later job primarily
focused on core logging, geologic mapping, and reserve calculation. In the fall of 2007,
he entered the graduate program in geology at Auburn University. While at Auburn, he
was an active Graduate Teaching Assistant and received one of two College of Science
and Mathematics Outstanding GTA Awards for 2009.
v
THESIS ABSTRACT
GEOLOGY OF THE FARMVILLE METAGRANITE AND ASSOCIATED UNITS AS
EXPOSED AT THE NOTASULGA QUARRY, NOTASULGA, ALABAMA
Kevin Robert Bogdan
Master of Science, August 10, 2009
(B.Sc., University of Pittsburgh at Johnstown, 2003)
113 Typed Pages
Directed by Mark G. Steltenpohl
Predicting the locations and thicknesses of aggregate-affable lithologies (ore
units), interburden (non-ore material between ore-units), and overburden (overlying
soil/saprolite) on a local level is critical for developing a cost-effective aggregate stone
mine. This research thesis investigates a tectonic sequence of meta-sedimentary and
igneous lithologies that have been metamorphosed under amphibolite-facies conditions
yielding both a tectonically and lithologically complex deposit within a historically
problematic group of Inner Piedmont rocks. Temporal, geometric, and lithologic control
over the Farmville Metagranite and its encapsulating units at the Vulcan Materials
Company Notasulga Quarry, Notasulga, Alabama, was achieved through geologic
mapping, diamond drill core logging, petrographic analysis, electrical resistivity, seismic
refraction, and geomorphologic methods. Five rock packages (RPs), or units, were
recognized within the immediate area of mining operations. From structurally lowest to
vi
highest these include: 1) RP1, a metasedimentary package consisting of paraquartzite,
quartz-plagioclase paragneiss, and garnet-muscovite schist; 2) RP2, an ore unit,
characterized as an augen gneiss with persistent concordant pegmatite layers; 3) RP3, a
metasedimentary package predominantly composed of quartz-biotite schist with common
leucosomal pegmatitic boudins; 4) RP4, the primary ore unit, a metagranite with gneissic
margins corresponding to the Farmville Metagranite; and 5) RP5, a relatively pure
muscovite quartzite marking the uppermost structural layer encountered within the
mining area. Electrical resistivity was found to be an effective method for delineating
RP3, a local interburden unit that affects the quality of stone produced from the mine
operation if incorporated into the production mix. Estimation of overburden, which is
costly to remove, was achieved through a seismic refraction survey. It is demonstrated
that the overburden/rock interface can be found through this non-invasive technique at a
fraction of the cost of drilling. Field mapping of joints and foliations and their
geomorphologic relations provide technical information for enhancing mine design.
Analyses of boudinage structures and metamorphic conditions aided in explaining the
morphology of rock packages and contributed to our understanding of the tectonic and
metamorphic evolution of the Opelika Complex. Computer-generated rock solids were
used to model the five rock packages utilizing Gemcom GEMS 6.2®. These were used
in the creation of an accurate geologic map that can guide future exploration programs
and mine design.
vii
ACKNOWLEDGMENTS
The author would like to thank Vulcan Materials Company for access to the
property, valuable data, and financial support without which this thesis research would
not have been possible. A note of gratitude is extended to the following companies or
institutions for providing gratis use of equipment and/or software: Auburn University
Department of Geology and Geography; Auburn University Geophysics Laboratory;
Auburn University Facilities Division; Auburn University Department of Civil
Engineering; Autodesk, Inc.; Gemcom, Inc.; Geometrics, Inc.; and the University of
Alabama Department of Geological Sciences.
The author would like to thank his undergraduate faculty (Dr. Jack Beuthin
[retired], Dr. William Brice [emeritus], and Dr. Uldis Kaktins [retired]) at the University
of Pittsburgh at Johnstown for instilling the sense awe and wonder that is the science of
geology. Special thanks go out to Dr. Mark Steltenpohl who was constantly available
and provided me with valuable insight in completion of my curriculum and research.
Fieldwork support was graciously donated by fellow graduate students Lee Beasley,
Nathan Layfield, Billie Palmer, and Thomas Key.
Finally, the author would like to thank his parents for always supporting him with
constant encouragement and advice, without which his life goals may very well never
have been achievable.

viii
Style manual used: Suggestions to Authors of the Reports of the United States
Geological Survey
Computer software used: AGI EarthImager 2D®, Autodesk AutoCAD Civil 3D
2008®, ESRI ArcGIS 9.2®, ESRI Rockworks 14®, Gemcom GEMS 6.2®, Geometrics
Seisimager 2D®, Golden Software Surfer 8®, Microsoft Office 2007®, NIS Elements D
2.30®, and Trimble Pathfinder Office.
ix
TABLE OF CONTENTS
LIST OF FIGURES………………………………………………………………..……..xi
LIST OF TABLES………………………………………………………………………xvi
LIST OF PLATES……………………………………………………………………...xvii
SECTION I. INTRODUCTION………………………………………………………….1
General Statement…………………………………………………………………1
Location of Study Area……………………………………………………………2
Methods of Investigation………………………………………………………….4
Geologic Background……………………………………………………………..7
Dadeville Complex………………………………………………………..7
Ropes Creek Amphibolite………………………………………....9
Opelika Complex…………………………..……………………………...9
Loachapoka Schist……………………………………………….11
Auburn Gneiss……………………………………………………13
Farmville Metagranite……………………………………………13
Pegmatites………………………………………………………..15
SECTION II. SITE-SPECIFIC TECTONOSTRATIGRAPHY…………………………16
Introduction………………………………………………………………………16
Rock Packages…………………………………………………………...20
Rock Package 1………………………………………………….20
x
Rock Package 2………………………………………………….25
Rock Package 3………………………………………………….30
Rock Package 4………………………………………………….37
Rock Package 5………………………………………………….42
SECTION III. GEOPHYSICAL INVESTIGATIONS………………………………….50
Electrical Resistivity……………………………………………………………...50
Seismic Refraction……………………………………………………………….55
SECTION IV. STRUCTURE AND METAMORPHISM................................................61
Joint Mapping.........................................................................................................61
Foliation…………………………………………………………………………..72
Geomorphologic Analysis………………………………………………………..77
Boudinage Structures.............................................................................................79
Metamorphism........................................................................................................81
SECTION V. GEOLOGIC MODEL................................................................................86
Drillhole Database.................................................................................................86
Topographic and Geologic Surface Modeling.......................................................86
Geologic Map.........................................................................................................90
SECTION VI. CONCLUSIONS.......................................................................................92
REFERENCES……………………………………………………………………..........94
xi
LIST OF FIGURES
1. Notasulga, Alabama U.S.G.S. 7.5’ Quadrangle. Study area is bounded by
Sougahatchee Creek and red line….…………………………………………………..3
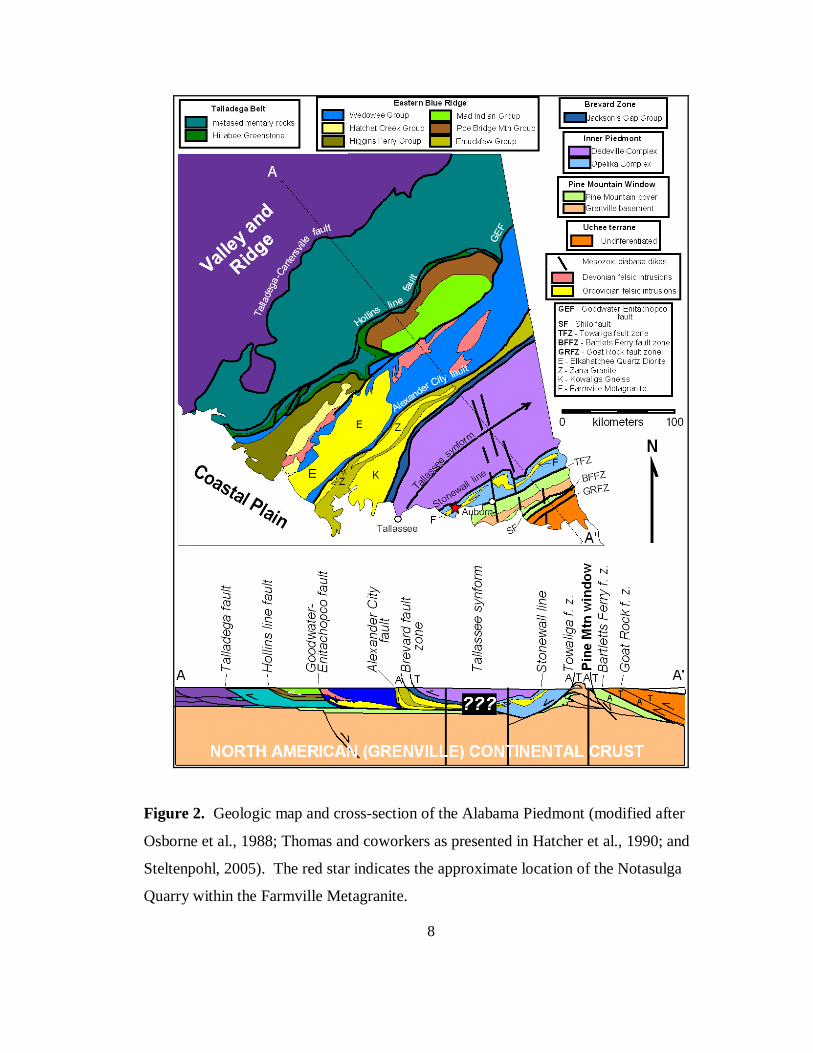
2. Geologic map and cross-section of the Alabama Piedmont (modified
after Osborne et al., 1988; Thomas and coworkers as presented in Hatcher
et al., 1990; and Steltenpohl, 2005). The red star indicates the approximate
location of the Notasulga Quarry within the Farmville Metagranite.............................8
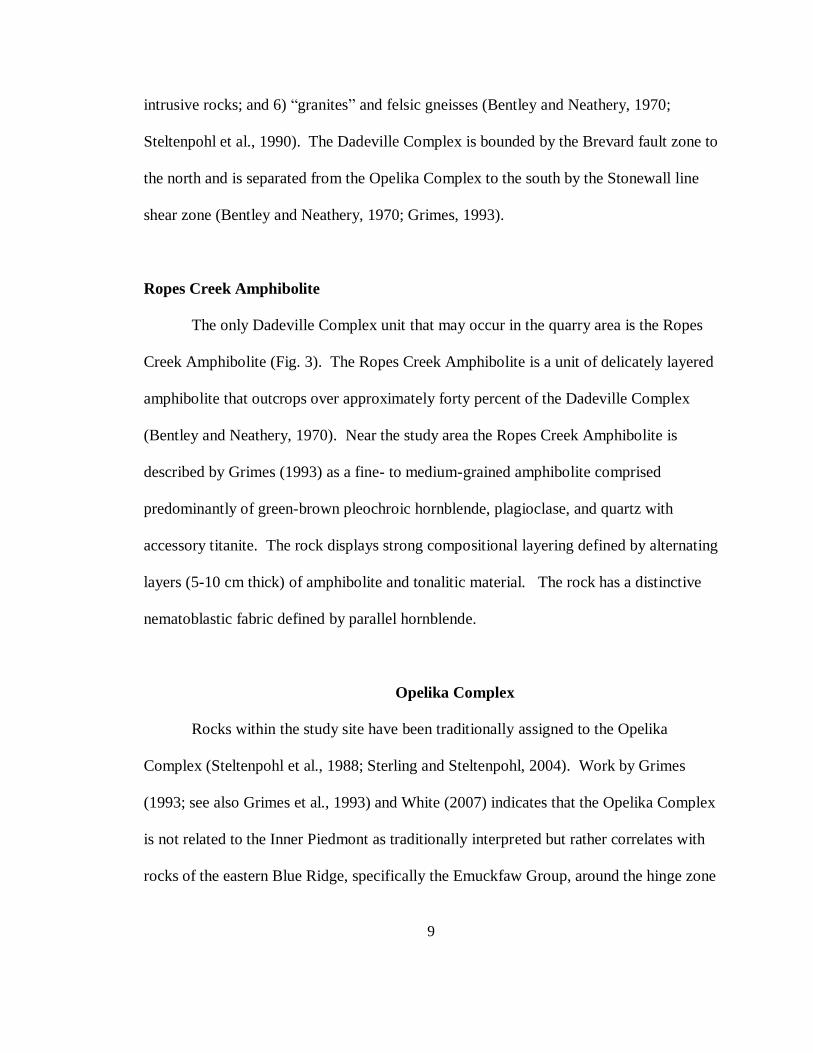
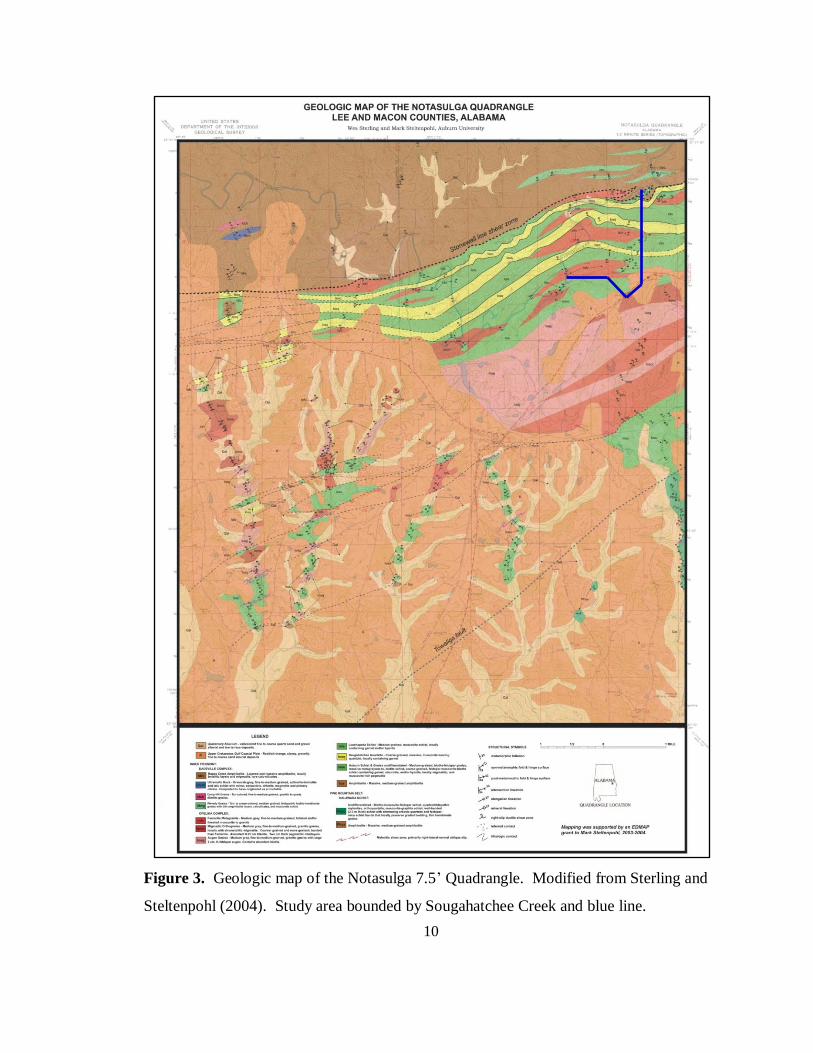
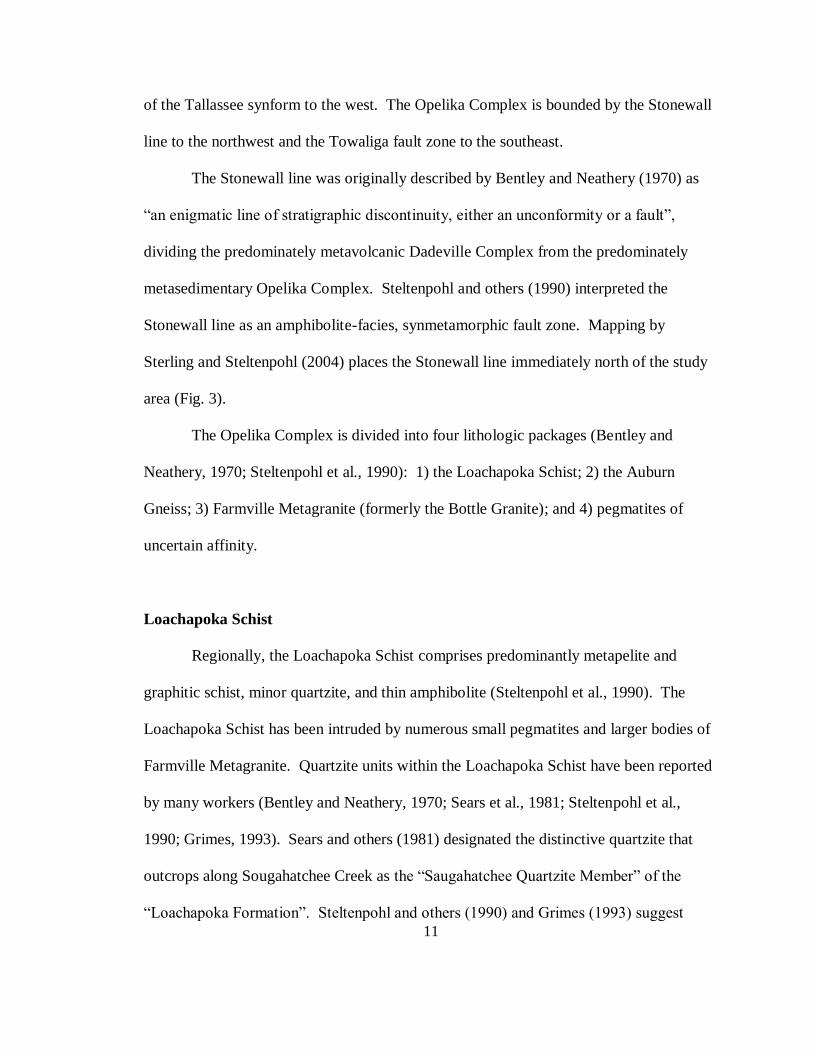
3. Geologic map of the Notasulga 7.5’ Quadrangle. Modified from Sterling
and Steltenpohl (2004). Study area bounded by Sougahatchee Creek and
blue line.………………………………...................................................................…10
4. Diamond drillhole location map. Note that drillholes are also displayed
along with logs in Plate 1.............................................................................................17
5. Site specific tectonostratigraphic column based upon diamond drillhole data.
RP represents “Rock Package”. UMS = upper metasedimentary unit. LMS =
lower metasedimentary unit. Unit thickness in feet....................................................19
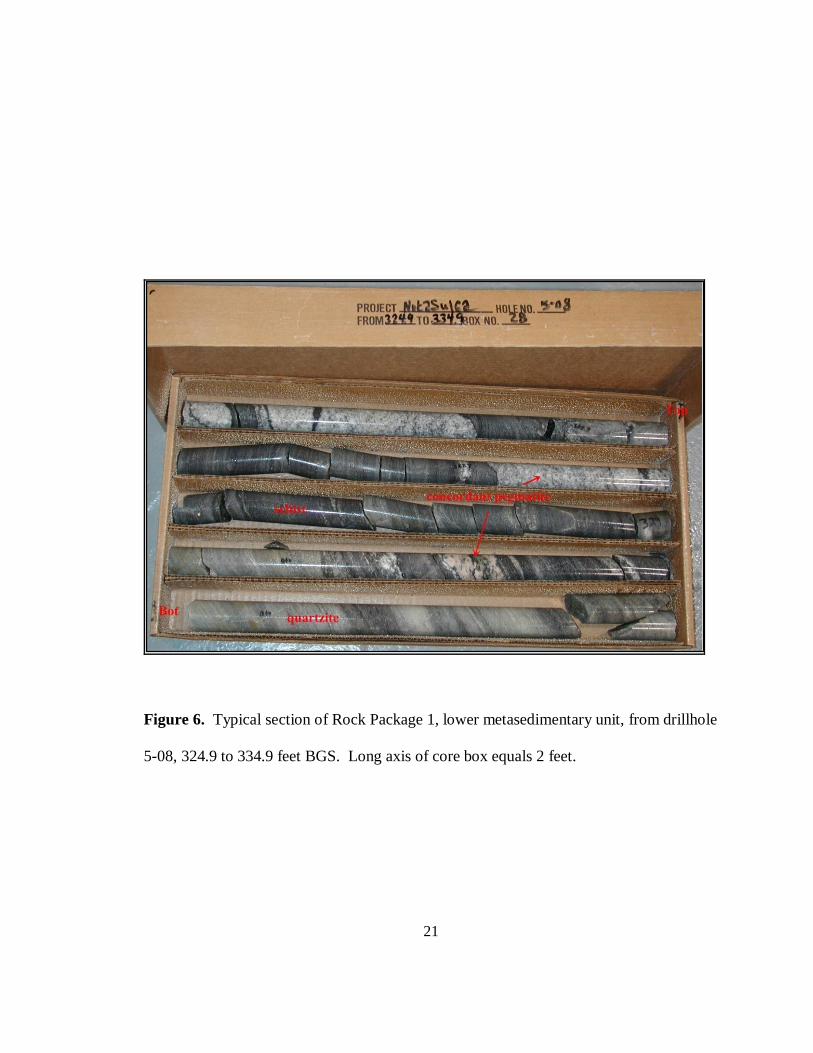
6. Typical section of Rock Package 1, lower metasedimentary unit, from
drillhole 5-08, 324.9 to 334.9 feet BGS. Long axis of core box equals
2 feet....................................................................................................................... ......21
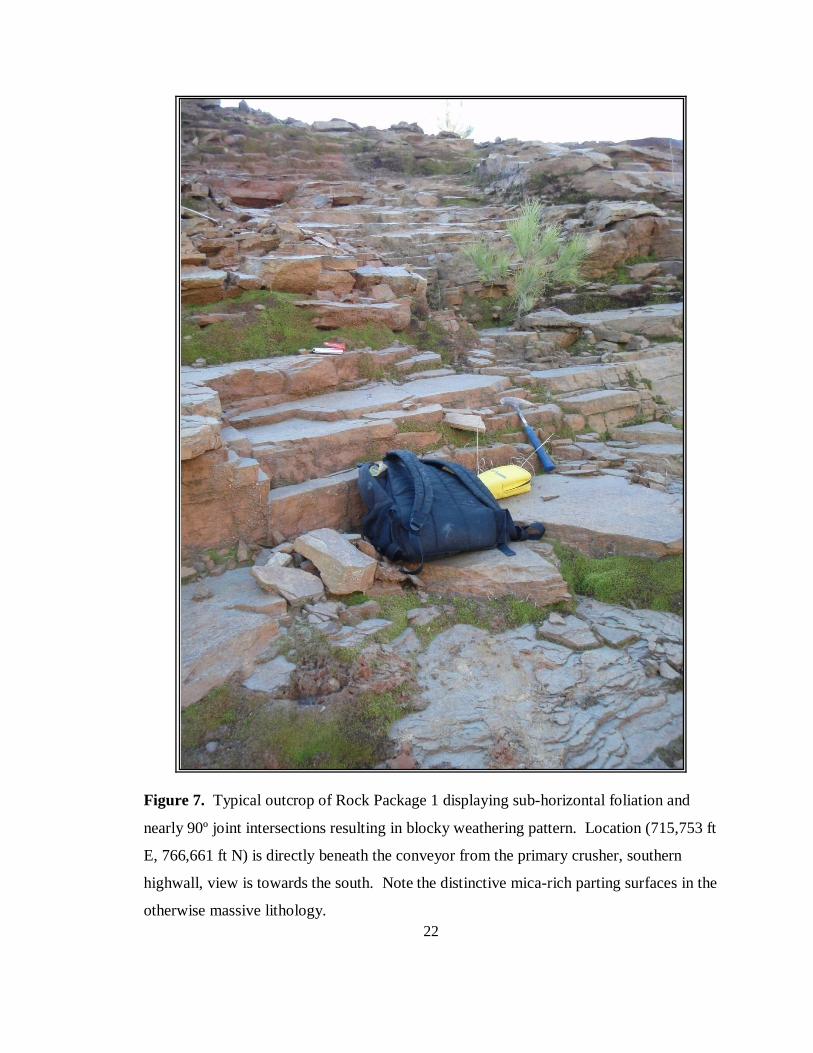
7. Typical outcrop of Rock Package 1 displaying sub-horizontal foliation
and nearly 90º joint intersections resulting in blocky weathering pattern.
Location (715,753 ft E, 766,661 ft N) is directly beneath the conveyor
from the primary crusher, southern highwall, view is towards the south.
Note the distinctive mica-rich parting surfaces in the otherwise massive
lithology.......................................................................................................................22
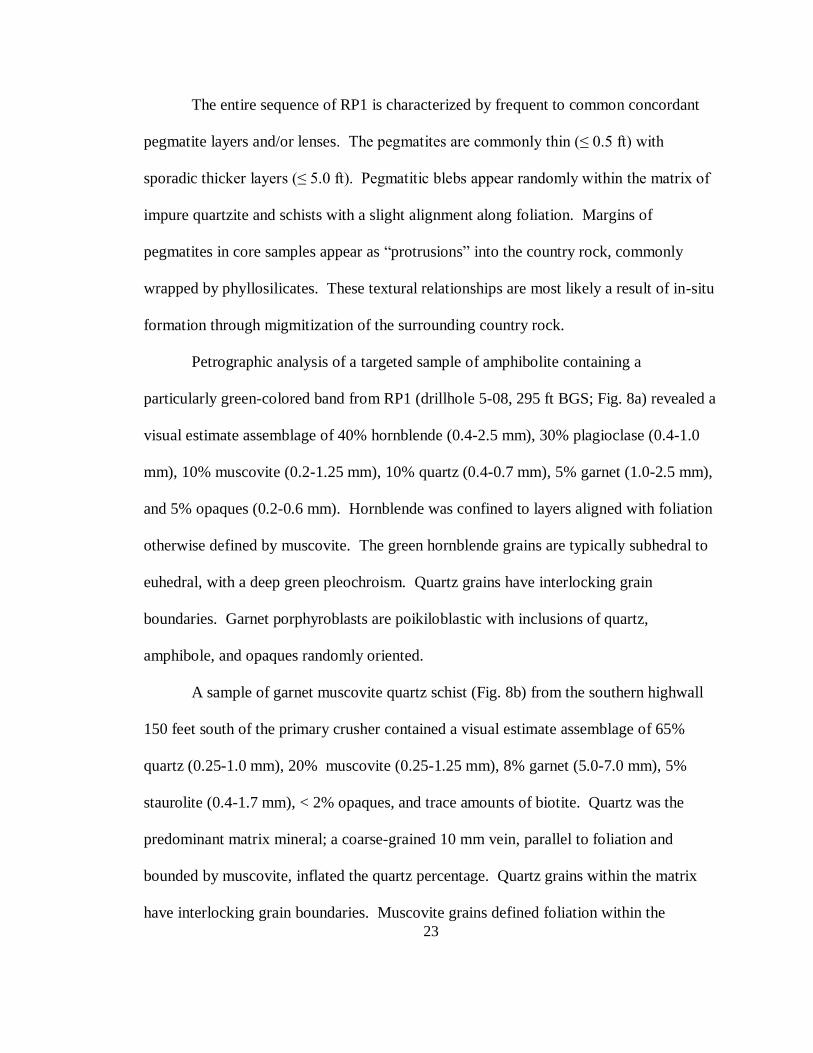
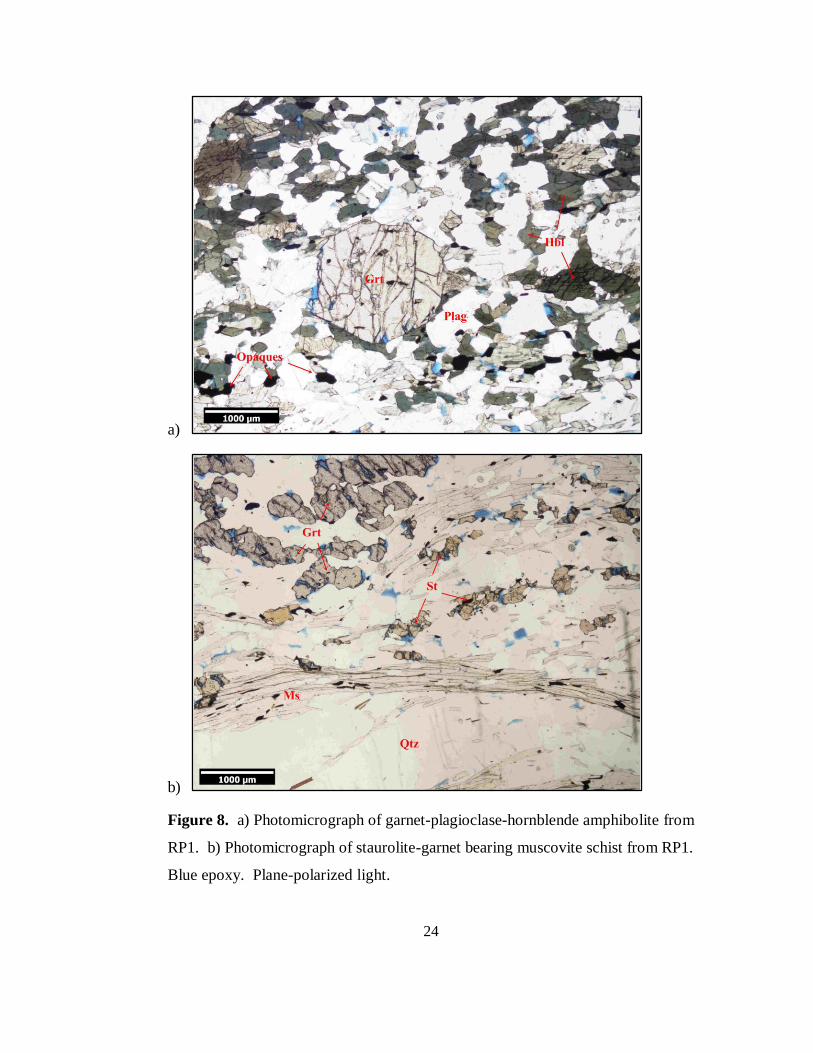
8. a) Photomicrograph of garnet-plagioclase-hornblende amphibolite from
RP1. b) Photomicrograph of staurolite-garnet bearing muscovite schist
from RP1. Blue epoxy. Plane-polarized light............................................................24
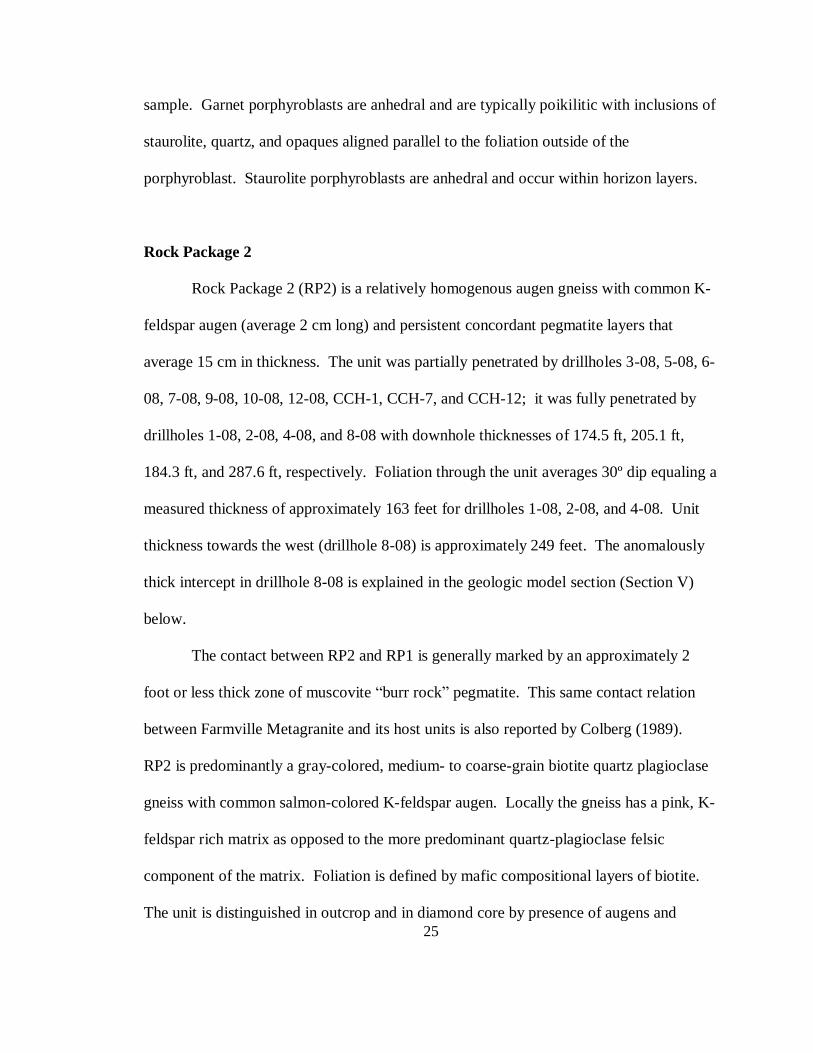
9. Typical section of Rock Package 2 augen gneiss from drillhole
4-08, 198.1 to 207.7 feet BGS. Long axis of core box equals 2 feet.
Note concordant pegmatitic layers...............................................................................27
xii
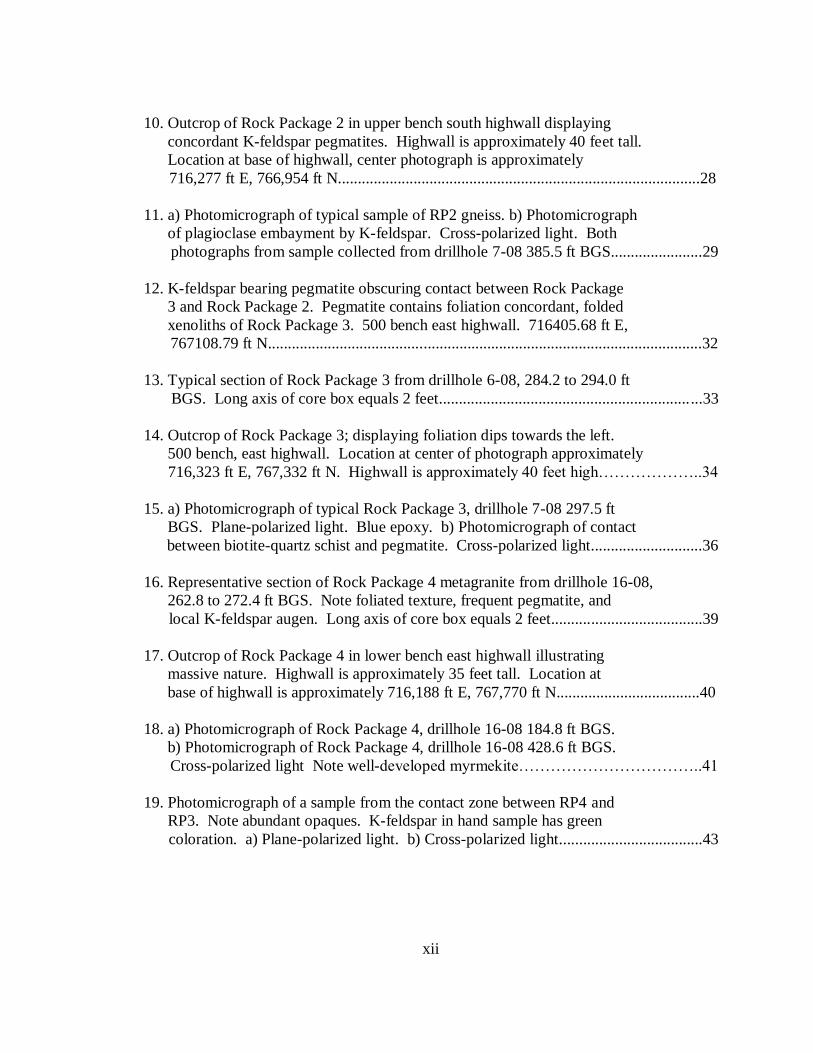
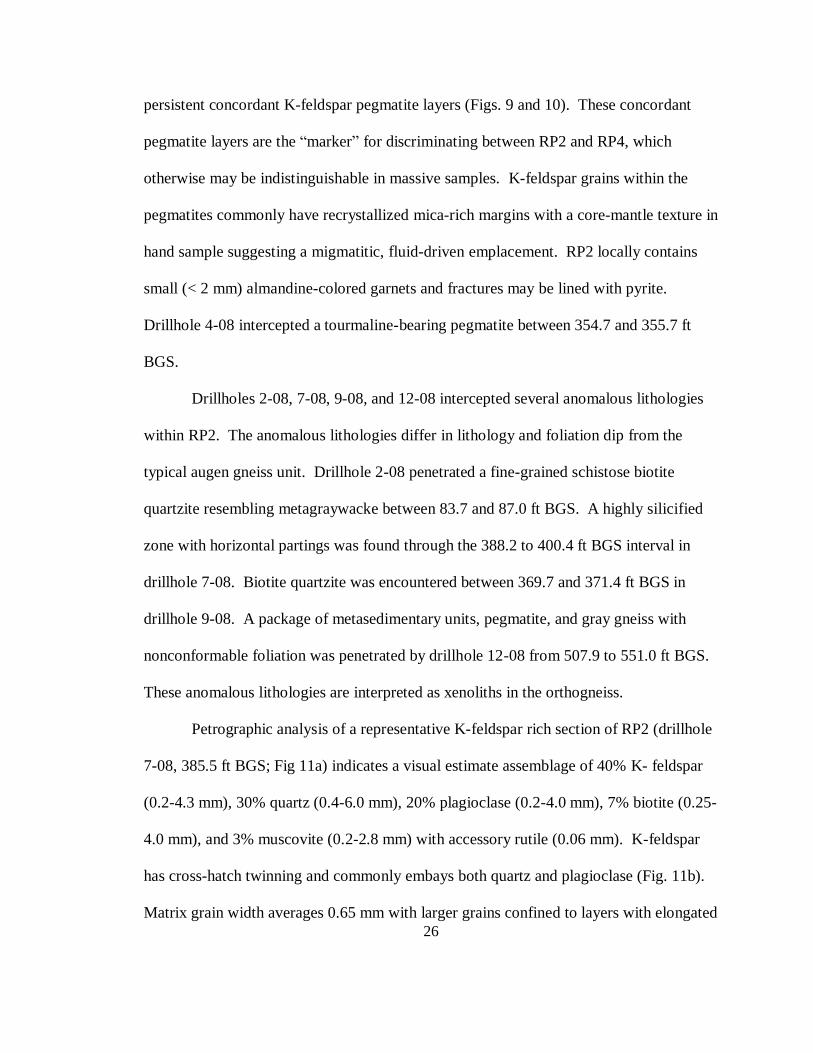
10. Outcrop of Rock Package 2 in upper bench south highwall displaying
concordant K-feldspar pegmatites. Highwall is approximately 40 feet tall.
Location at base of highwall, center photograph is approximately
716,277 ft E, 766,954 ft N...........................................................................................28
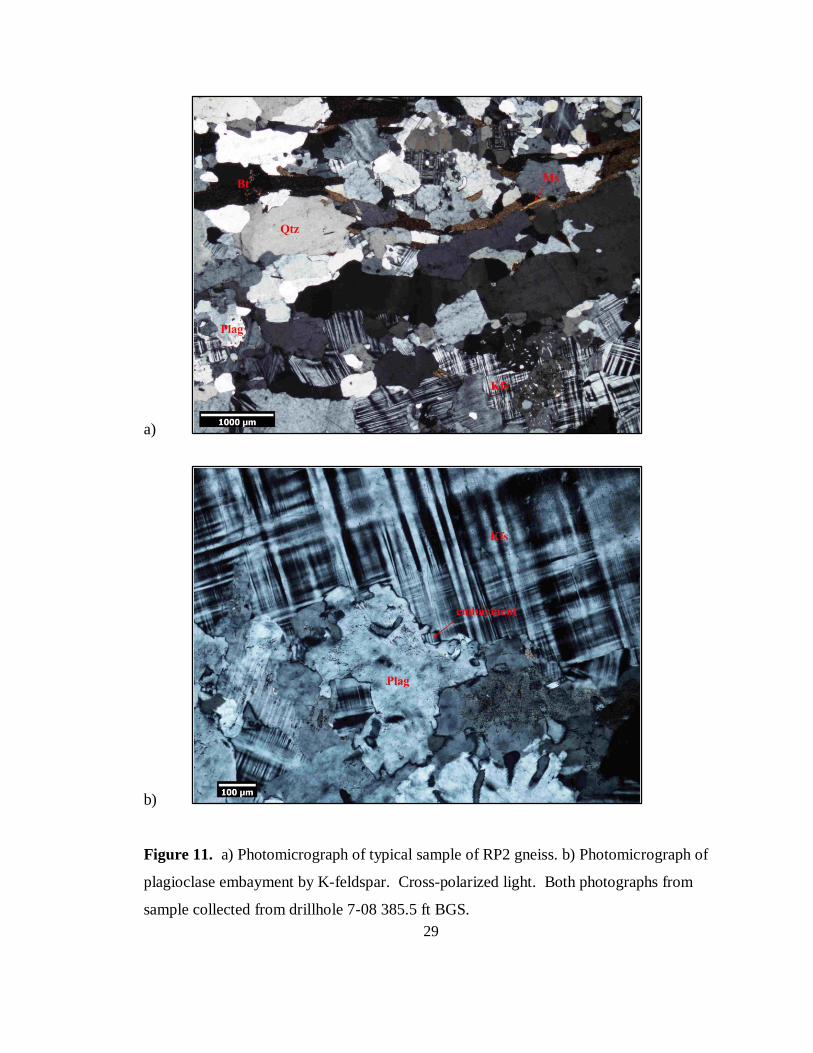
11. a) Photomicrograph of typical sample of RP2 gneiss. b) Photomicrograph
of plagioclase embayment by K-feldspar. Cross-polarized light. Both
photographs from sample collected from drillhole 7-08 385.5 ft BGS.......................29
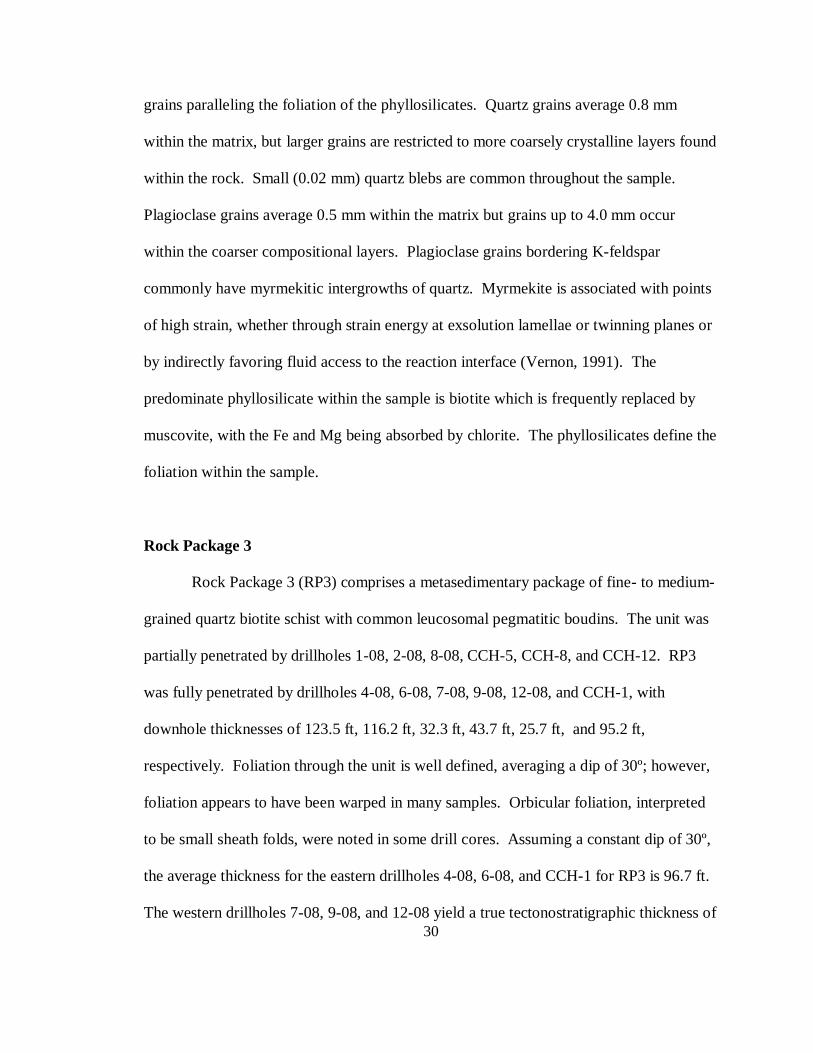
12. K-feldspar bearing pegmatite obscuring contact between Rock Package
3 and Rock Package 2. Pegmatite contains foliation concordant, folded
xenoliths of Rock Package 3. 500 bench east highwall. 716405.68 ft E,
767108.79 ft N.............................................................................................................32
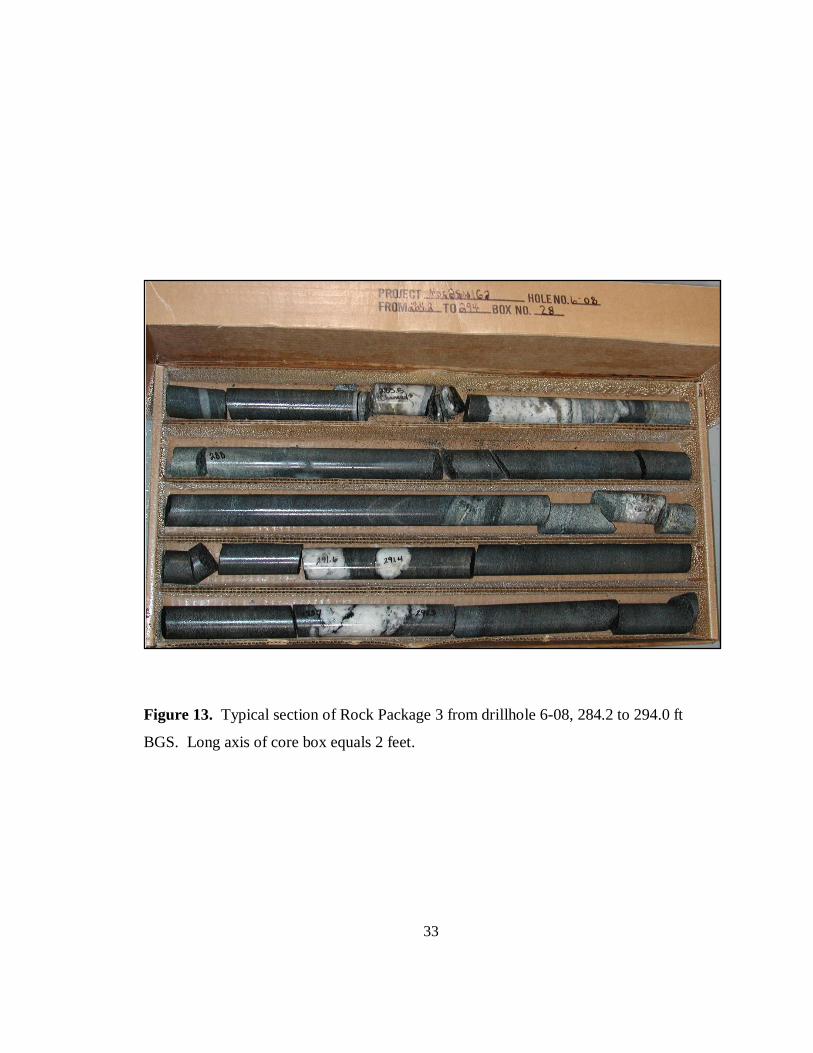
13. Typical section of Rock Package 3 from drillhole 6-08, 284.2 to 294.0 ft
BGS. Long axis of core box equals 2 feet..................................................................33
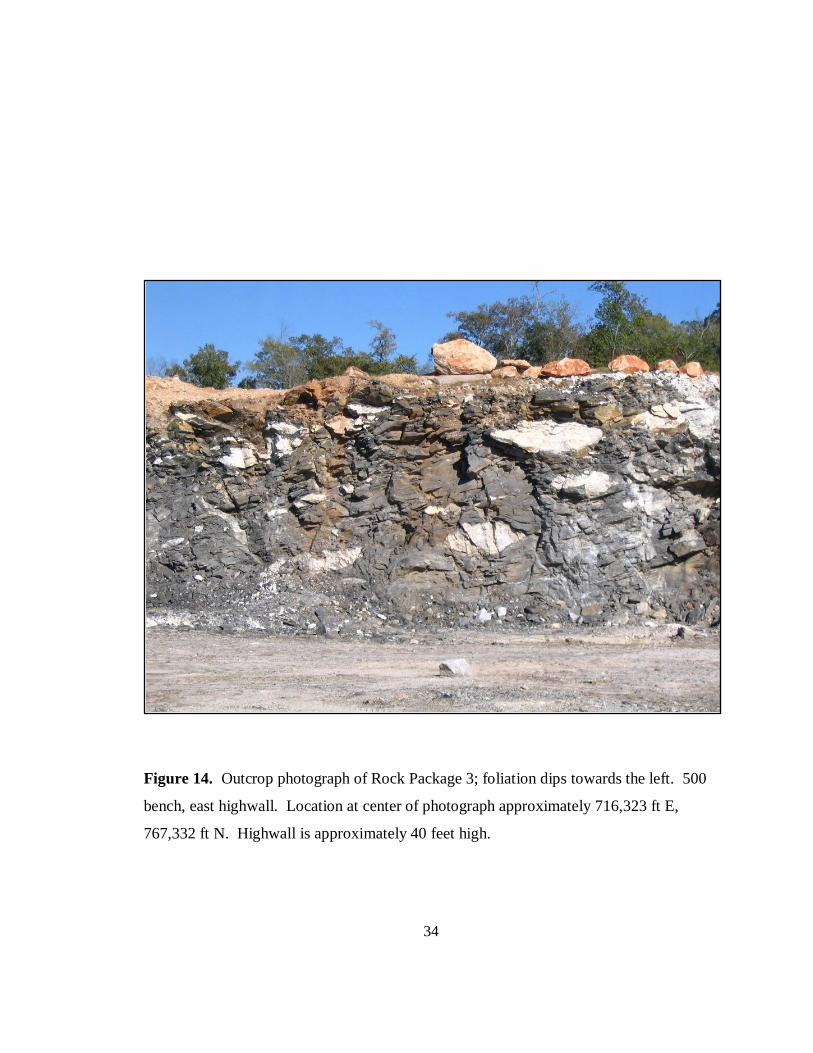
14. Outcrop of Rock Package 3; displaying foliation dips towards the left.
500 bench, east highwall. Location at center of photograph approximately
716,323 ft E, 767,332 ft N. Highwall is approximately 40 feet high………………..34
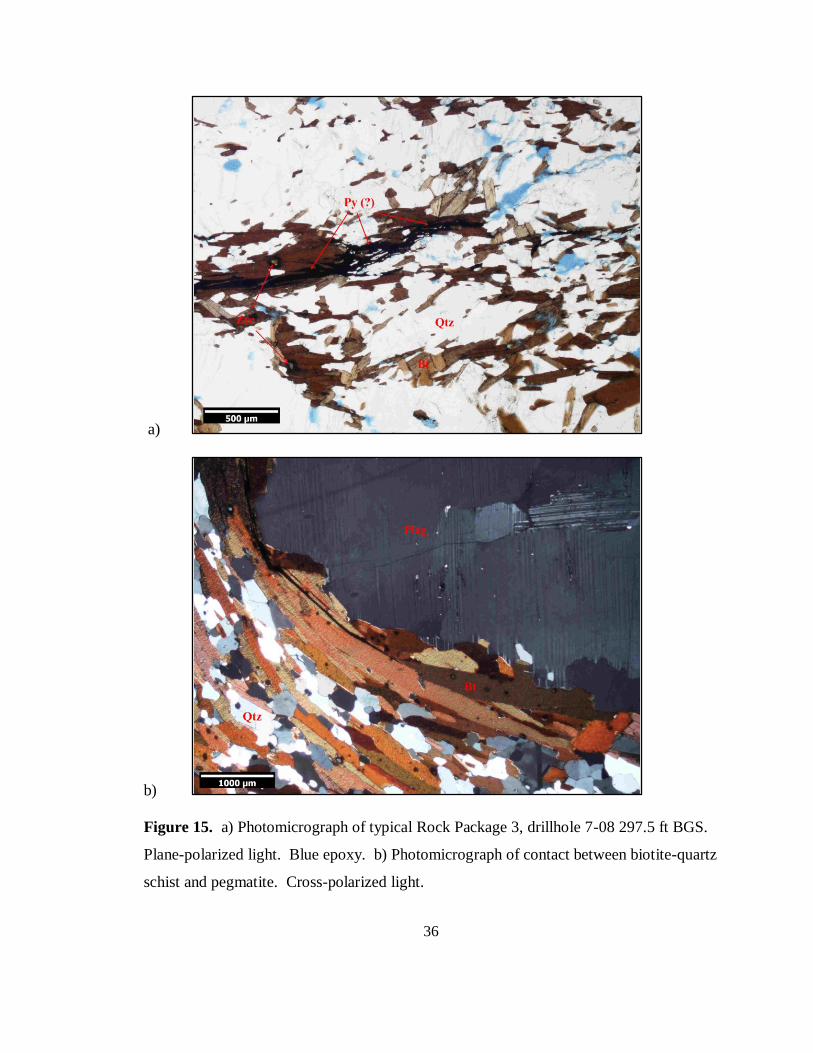
15. a) Photomicrograph of typical Rock Package 3, drillhole 7-08 297.5 ft
BGS. Plane-polarized light. Blue epoxy. b) Photomicrograph of contact
between biotite-quartz schist and pegmatite. Cross-polarized light............................36
16. Representative section of Rock Package 4 metagranite from drillhole 16-08,
262.8 to 272.4 ft BGS. Note foliated texture, frequent pegmatite, and
local K-feldspar augen. Long axis of core box equals 2 feet......................................39
17. Outcrop of Rock Package 4 in lower bench east highwall illustrating
massive nature. Highwall is approximately 35 feet tall. Location at
base of highwall is approximately 716,188 ft E, 767,770 ft N....................................40
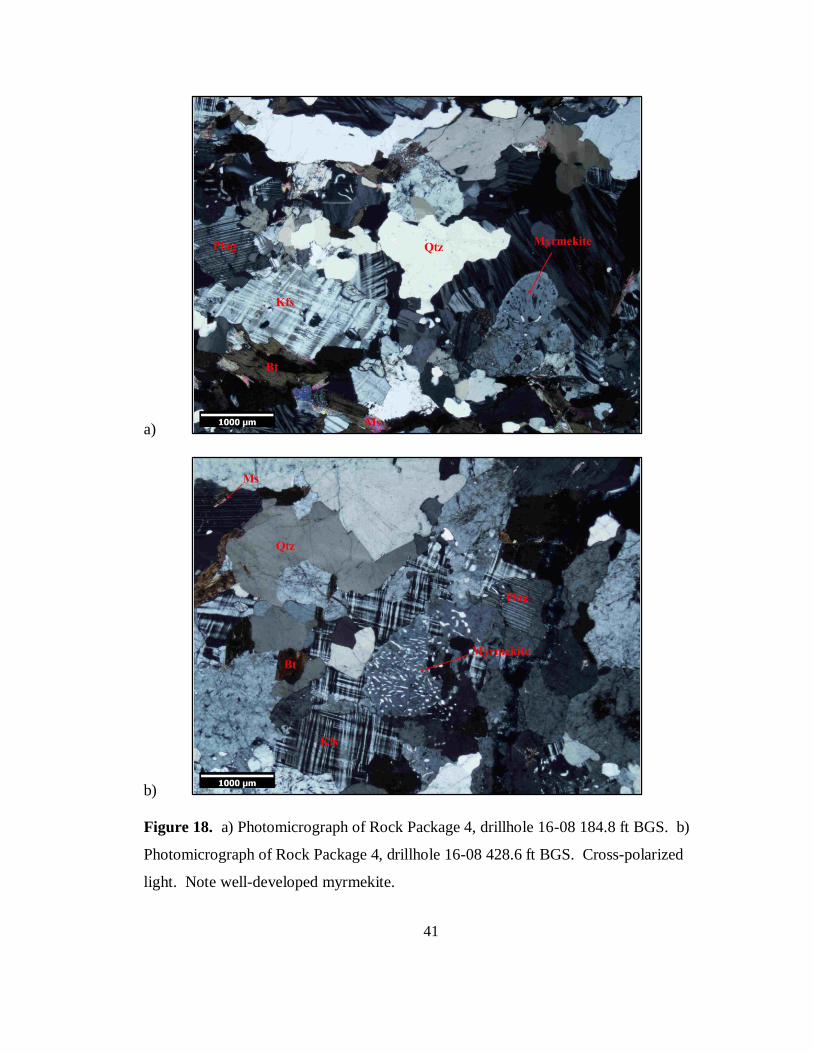
18. a) Photomicrograph of Rock Package 4, drillhole 16-08 184.8 ft BGS.
b) Photomicrograph of Rock Package 4, drillhole 16-08 428.6 ft BGS.
Cross-polarized light Note well-developed myrmekite……………………………..41
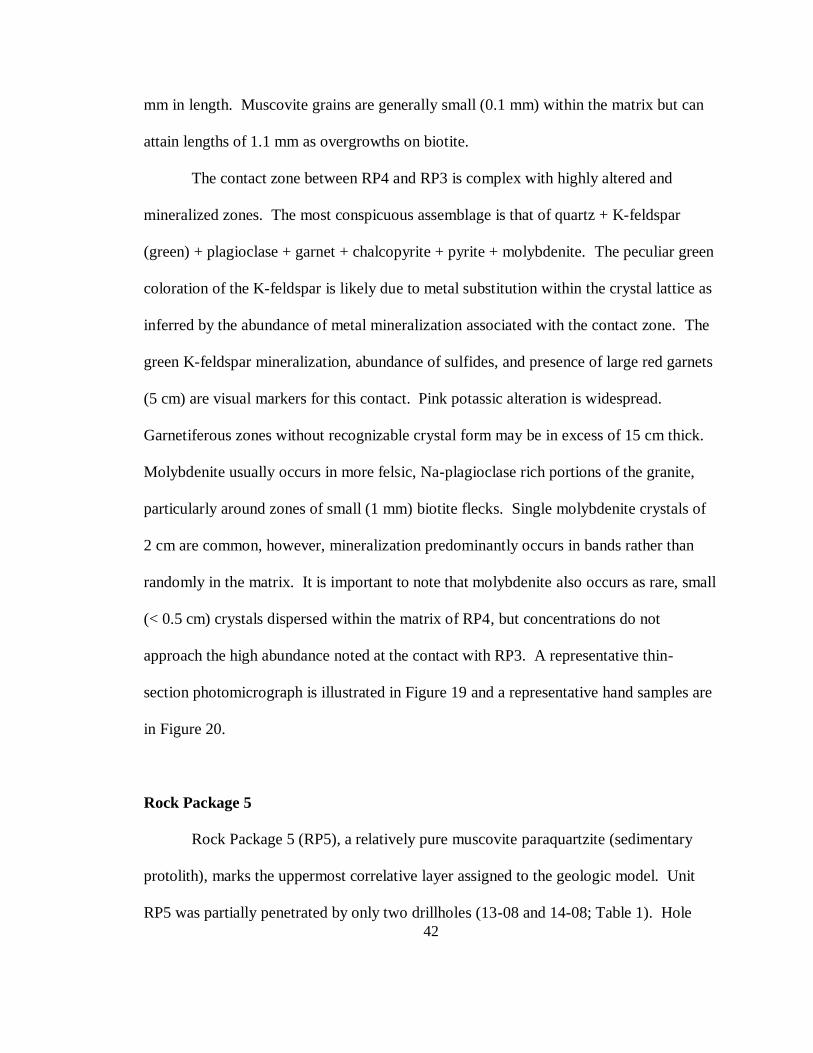
19. Photomicrograph of a sample from the contact zone between RP4 and
RP3. Note abundant opaques. K-feldspar in hand sample has green
coloration. a) Plane-polarized light. b) Cross-polarized light....................................43
xiii
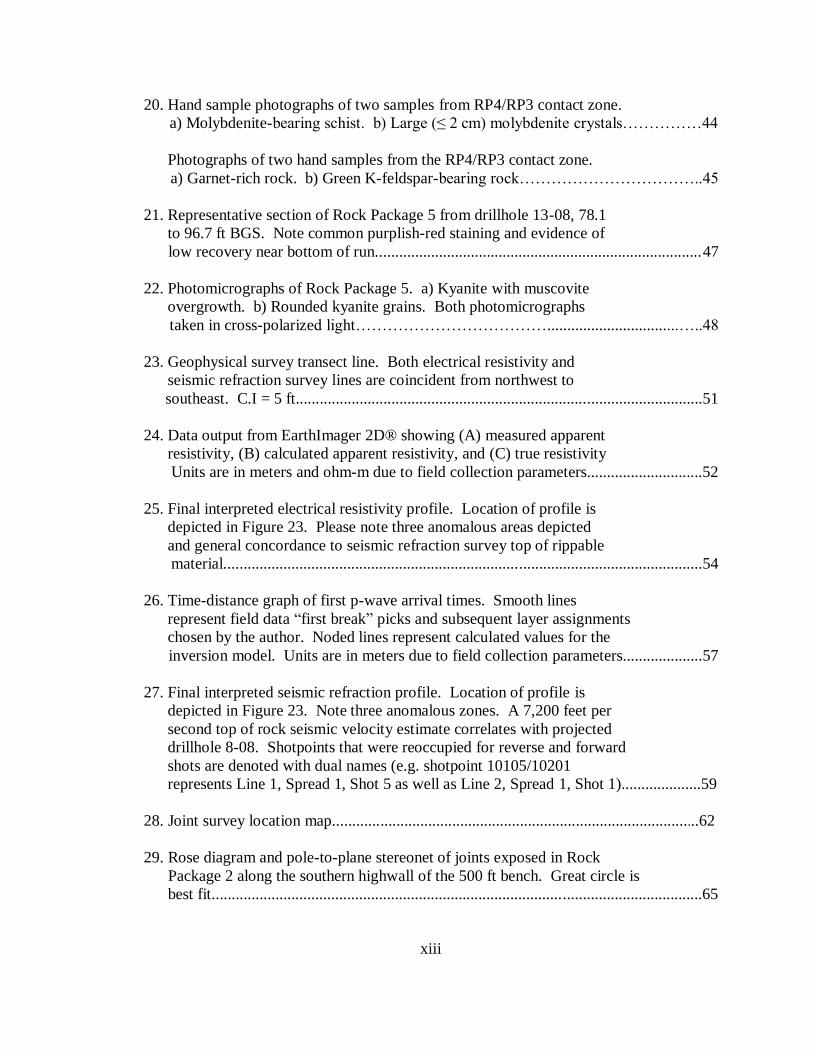
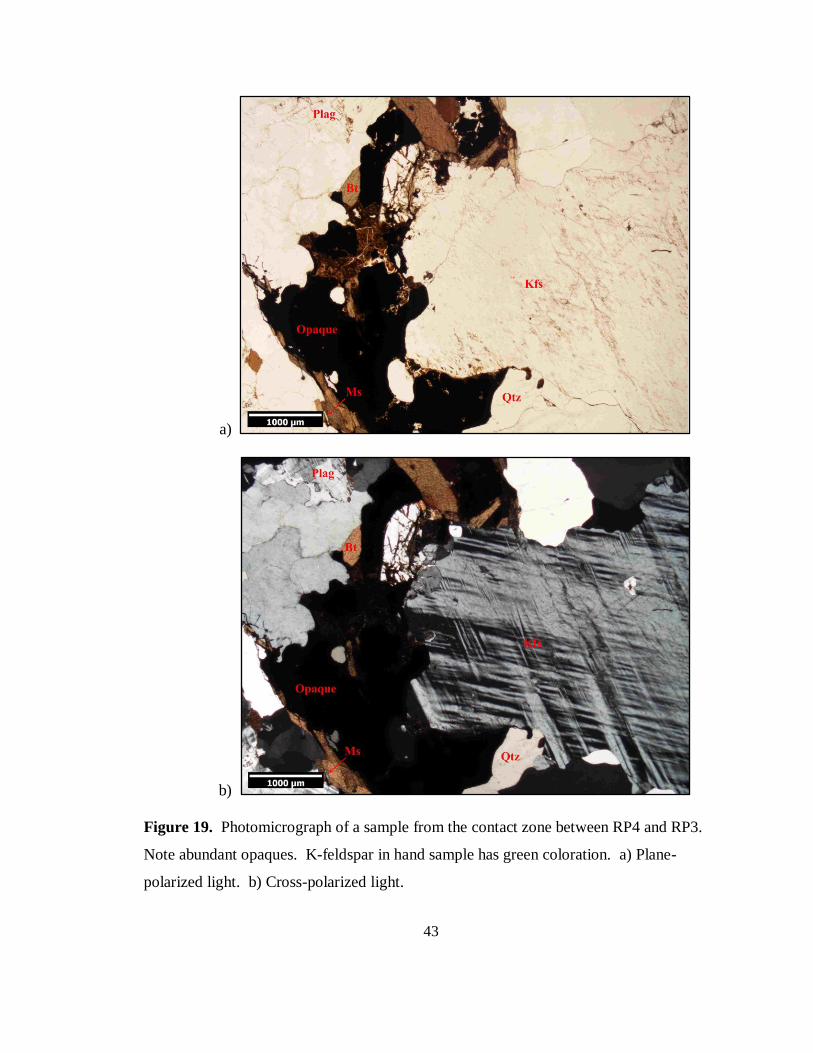
20. Hand sample photographs of two samples from RP4/RP3 contact zone.
a) Molybdenite-bearing schist. b) Large (≤ 2 cm) molybdenite crystals……………44
Photographs of two hand samples from the RP4/RP3 contact zone.
a) Garnet-rich rock. b) Green K-feldspar-bearing rock……………………………..45
21. Representative section of Rock Package 5 from drillhole 13-08, 78.1
to 96.7 ft BGS. Note common purplish-red staining and evidence of
low recovery near bottom of run..................................................................................47
22. Photomicrographs of Rock Package 5. a) Kyanite with muscovite
overgrowth. b) Rounded kyanite grains. Both photomicrographs
taken in cross-polarized light……………………………….................................…..48
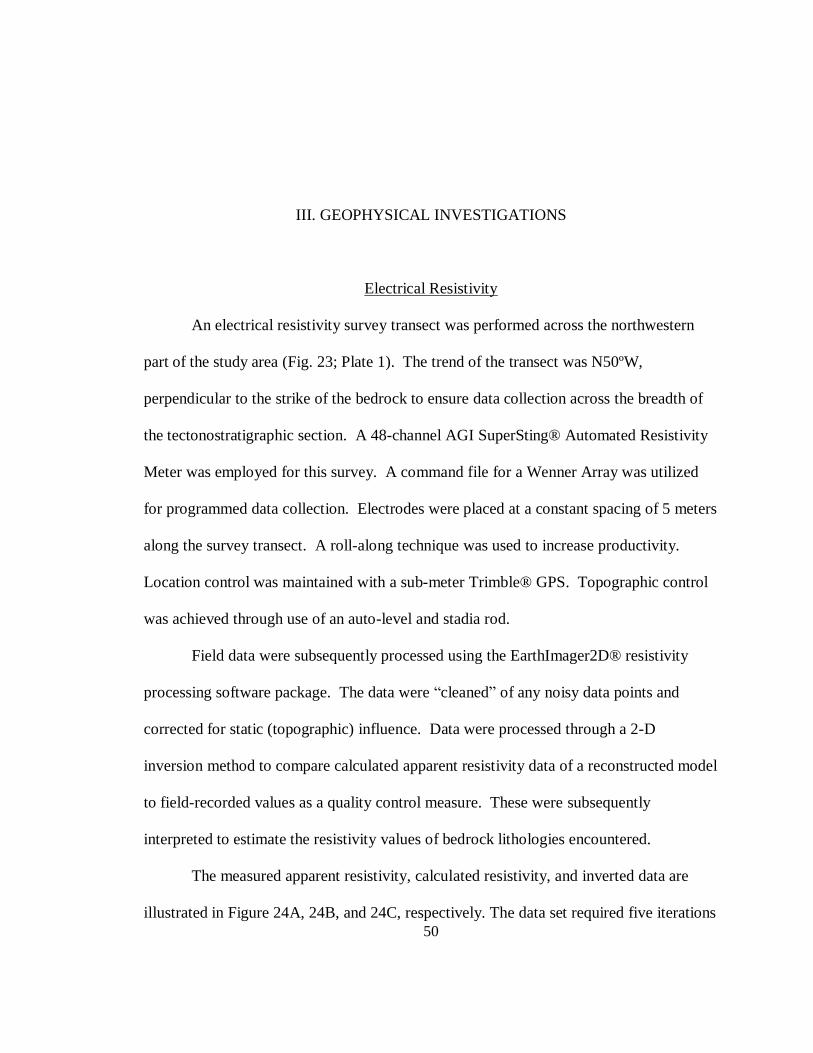
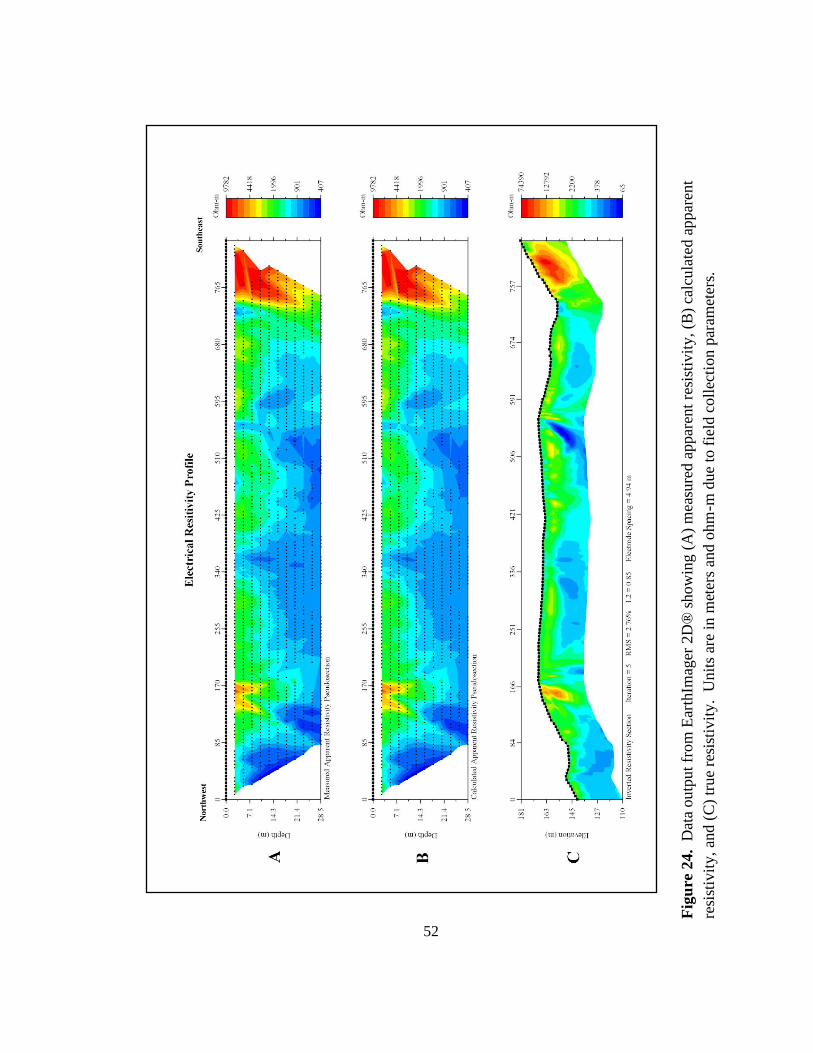
23. Geophysical survey transect line. Both electrical resistivity and
seismic refraction survey lines are coincident from northwest to
southeast. C.I = 5 ft......................................................................................................51
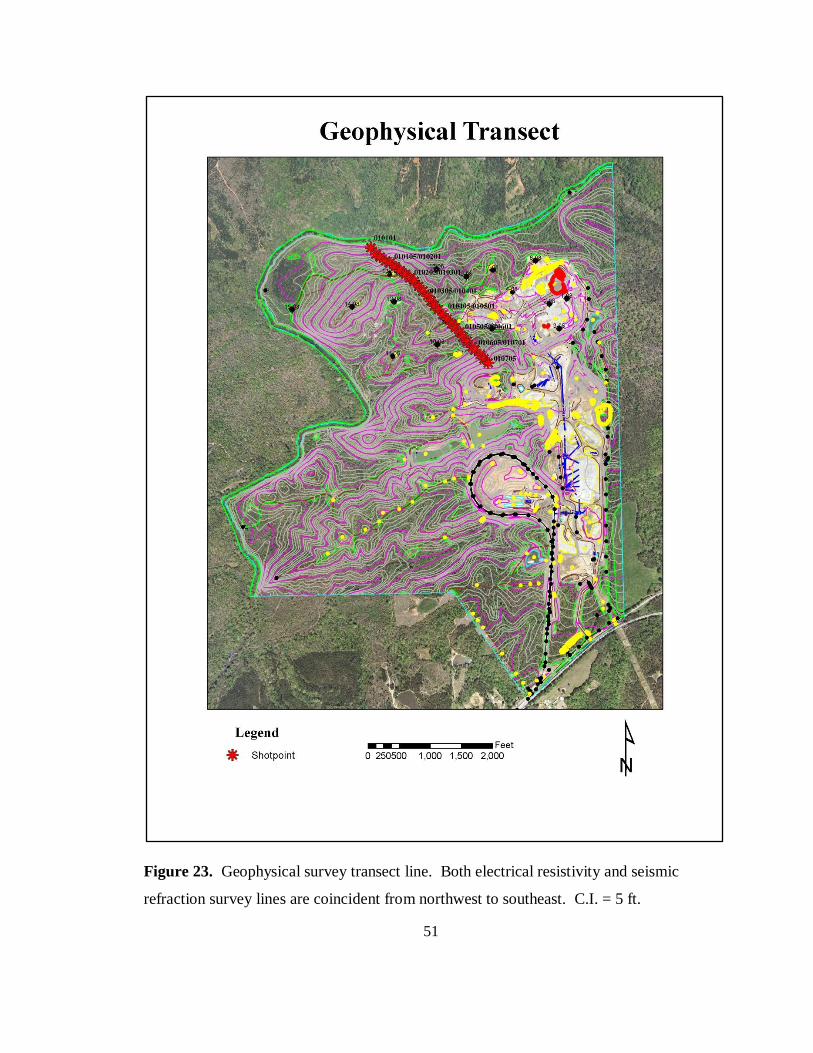
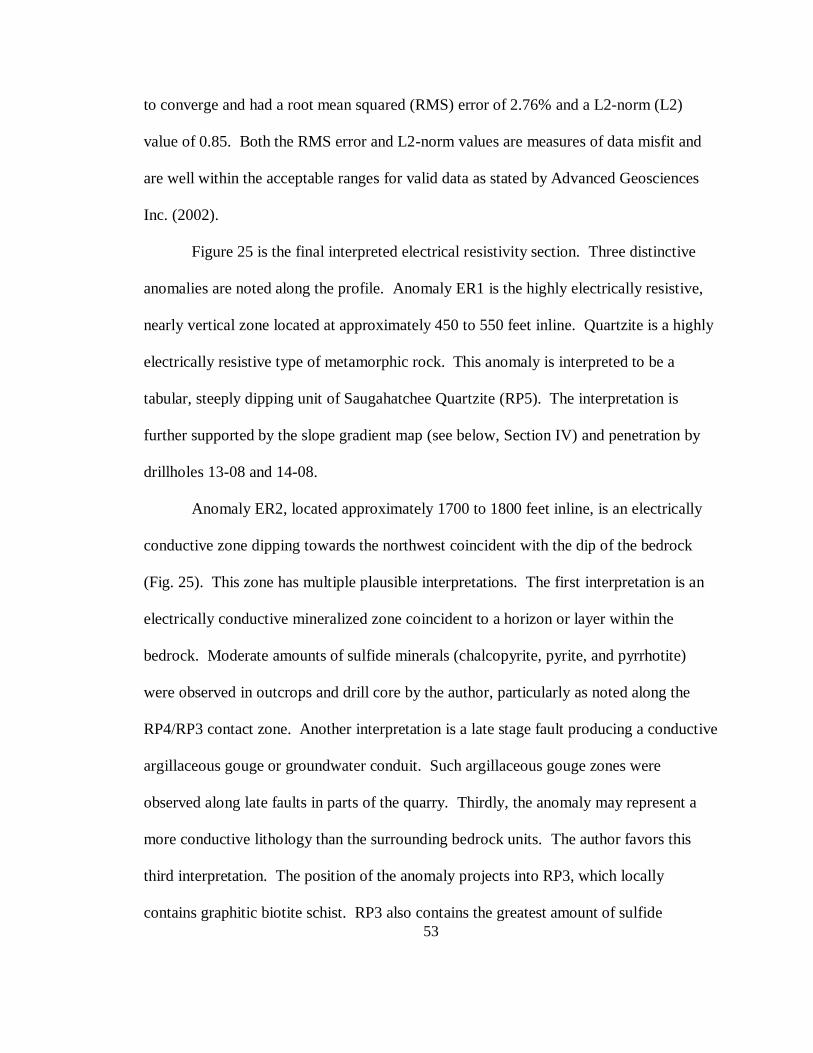
24. Data output from EarthImager 2D® showing (A) measured apparent
resistivity, (B) calculated apparent resistivity, and (C) true resistivity
Units are in meters and ohm-m due to field collection parameters.............................52
25. Final interpreted electrical resistivity profile. Location of profile is
depicted in Figure 23. Please note three anomalous areas depicted
and general concordance to seismic refraction survey top of rippable
material........................................................................................................................54
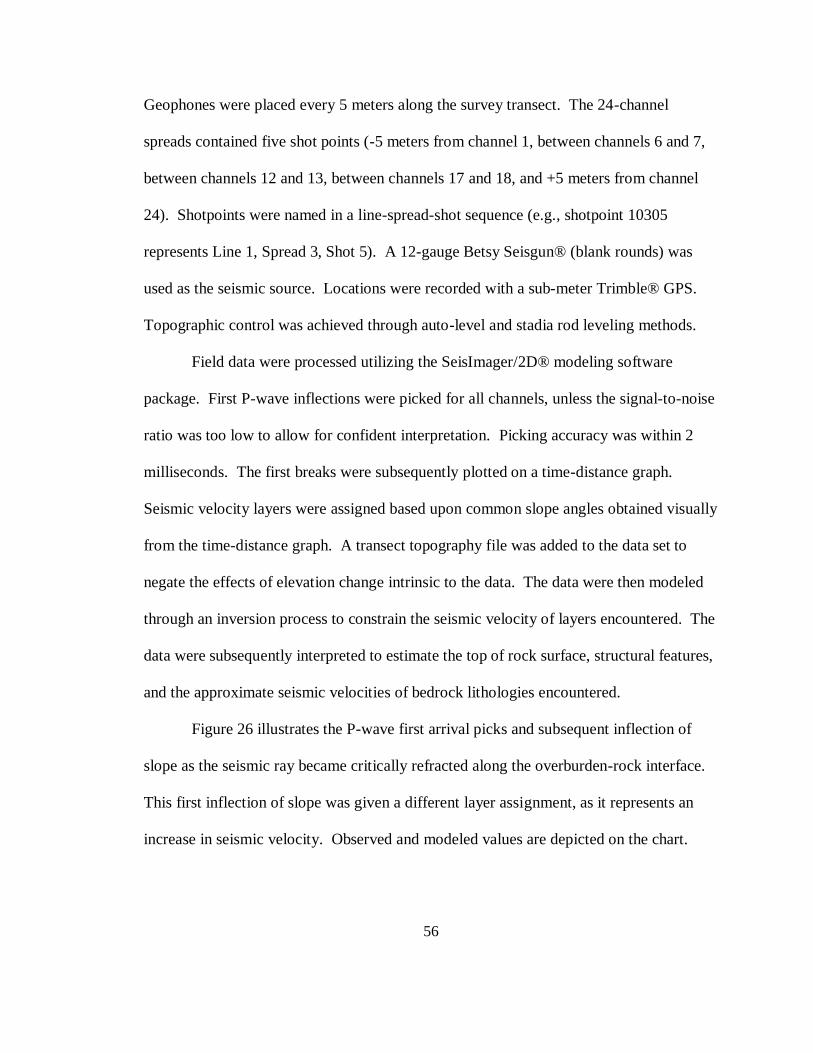
26. Time-distance graph of first p-wave arrival times. Smooth lines
represent field data “first break” picks and subsequent layer assignments
chosen by the author. Noded lines represent calculated values for the
inversion model. Units are in meters due to field collection parameters....................57
27. Final interpreted seismic refraction profile. Location of profile is
depicted in Figure 23. Note three anomalous zones. A 7,200 feet per
second top of rock seismic velocity estimate correlates with projected
drillhole 8-08. Shotpoints that were reoccupied for reverse and forward
shots are denoted with dual names (e.g. shotpoint 10105/10201
represents Line 1, Spread 1, Shot 5 as well as Line 2, Spread 1, Shot 1)....................59
28. Joint survey location map............................................................................................62
29. Rose diagram and pole-to-plane stereonet of joints exposed in Rock
Package 2 along the southern highwall of the 500 ft bench. Great circle is
best fit...........................................................................................................................65
xiv
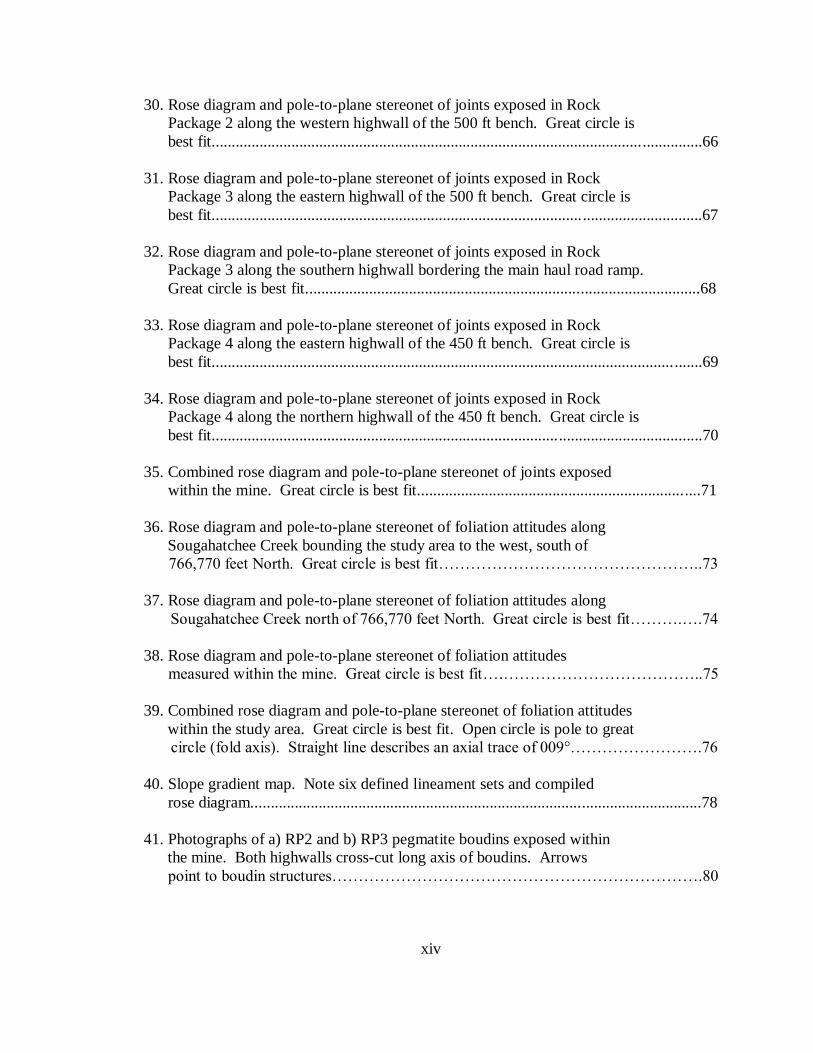
30. Rose diagram and pole-to-plane stereonet of joints exposed in Rock
Package 2 along the western highwall of the 500 ft bench. Great circle is
best fit...........................................................................................................................66
31. Rose diagram and pole-to-plane stereonet of joints exposed in Rock
Package 3 along the eastern highwall of the 500 ft bench. Great circle is
best fit...........................................................................................................................67
32. Rose diagram and pole-to-plane stereonet of joints exposed in Rock
Package 3 along the southern highwall bordering the main haul road ramp.
Great circle is best fit...................................................................................................68
33. Rose diagram and pole-to-plane stereonet of joints exposed in Rock
Package 4 along the eastern highwall of the 450 ft bench. Great circle is
best fit...........................................................................................................................69
34. Rose diagram and pole-to-plane stereonet of joints exposed in Rock
Package 4 along the northern highwall of the 450 ft bench. Great circle is
best fit...........................................................................................................................70
35. Combined rose diagram and pole-to-plane stereonet of joints exposed
within the mine. Great circle is best fit.......................................................................71
36. Rose diagram and pole-to-plane stereonet of foliation attitudes along
Sougahatchee Creek bounding the study area to the west, south of
766,770 feet North. Great circle is best fit…………………………………………..73
37. Rose diagram and pole-to-plane stereonet of foliation attitudes along
Sougahatchee Creek north of 766,770 feet North. Great circle is best fit……….….74
38. Rose diagram and pole-to-plane stereonet of foliation attitudes
measured within the mine. Great circle is best fit….………………………………..75
39. Combined rose diagram and pole-to-plane stereonet of foliation attitudes
within the study area. Great circle is best fit. Open circle is pole to great
circle (fold axis). Straight line describes an axial trace of 009°…………………….76
40. Slope gradient map. Note six defined lineament sets and compiled
rose diagram.................................................................................................................78
41. Photographs of a) RP2 and b) RP3 pegmatite boudins exposed within
the mine. Both highwalls cross-cut long axis of boudins. Arrows
point to boudin structures…………………………………………………………….80
xv
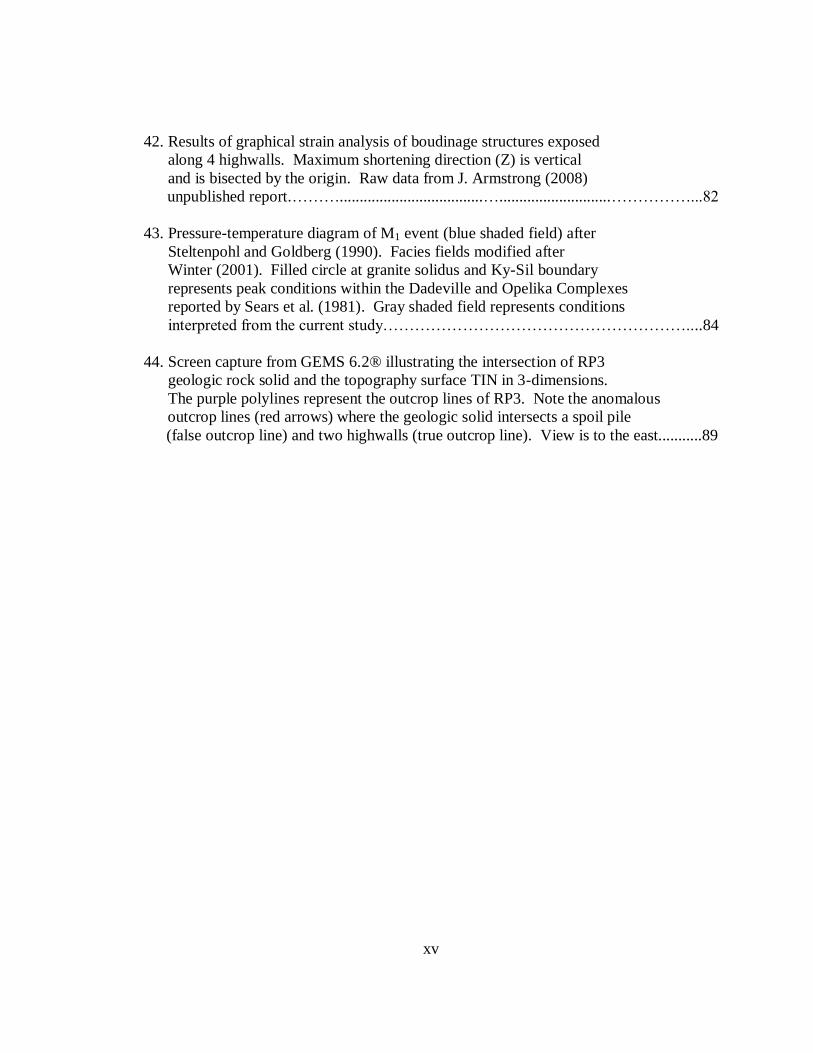
42. Results of graphical strain analysis of boudinage structures exposed
along 4 highwalls. Maximum shortening direction (Z) is vertical
and is bisected by the origin. Raw data from J. Armstrong (2008)
unpublished report.………....................................…............................……………...82
43. Pressure-temperature diagram of M1 event (blue shaded field) after
Steltenpohl and Goldberg (1990). Facies fields modified after
Winter (2001). Filled circle at granite solidus and Ky-Sil boundary
represents peak conditions within the Dadeville and Opelika Complexes
reported by Sears et al. (1981). Gray shaded field represents conditions
interpreted from the current study…………………………………………………....84
44. Screen capture from GEMS 6.2® illustrating the intersection of RP3
geologic rock solid and the topography surface TIN in 3-dimensions.
The purple polylines represent the outcrop lines of RP3. Note the anomalous
outcrop lines (red arrows) where the geologic solid intersects a spoil pile
(false outcrop line) and two highwalls (true outcrop line). View is to the east...........89

xvi
LIST OF TABLES
1. Diamond drillhole intercepts........................................................................................18
xvii
LIST OF PLATES
1. Geologic Map of the Notasulga Quarry..............................................................attached
1
I. INTRODUCTION
General Statement
The importance of the Farmville Metagranite in both its implications for southern
Appalachian evolution and as a valuable aggregate resource necessitates further research.
The Vulcan Materials Company’s (VMC) Notasulga Quarry affords the best exposure of
the Farmville Metagranite and its encapsulating units along its entire outcrop belt. The
geologic relations of the units are available to be studied in three dimensions. Prior to the
opening of the current mine operation, outcrops were limited strictly to surficial
exposures along ridge crests and streams and were largely covered by a thick saprolitic or
colluvial cover. Diamond drillhole data are also available, allowing inspection of the
Farmville Metagranite beneath surface exposures for the first time.
The Farmville Metagranite is a regionally significant aggregate resource because
it occurs along the “fall line” with the Gulf Coastal Plain physiographic province, making
it one of the southernmost exposures of crystalline bedrock available to serve a large
portion of the southeastern United States. The complex intrusive relations and their
amphibolite-facies metamorphic and deformational overprint make for a deposit that
necessitates a detailed and accurate geological evaluation to understand both academic
implications and applied applications.
2
The primary objective of this thesis is to establish a temporal, geometric, and
lithologic understanding of the Farmville Metagranite and its encapsulating units at the
VMC Notasulga Quarry that may affect present or future mining operations. The goal of
my thesis is to generate an accurate geologic model for the Farmville Metagranite at the
site by synthesizing the data in such a way that it will best serve the aggregate industry in
its efforts to develop similar deposits.
Location of Study Area
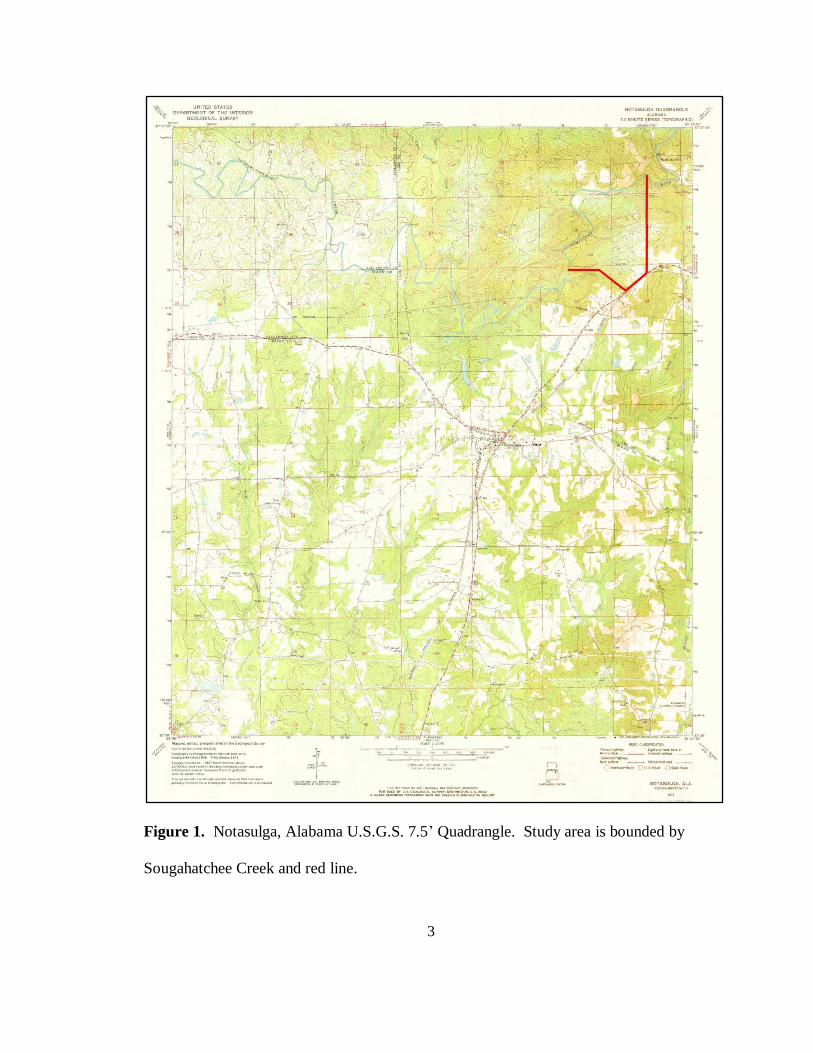
The study area is located 2.25 miles west of Loachapoka in western Lee County,
Alabama, within the Notasulga 7.5’ U.S. Geological Survey topographic quadrangle map
(Fig. 1). The northern and western boundaries of the study area are formed by
Sougahatchee Creek. Access to the site is provided by the main entrance road to the
mine operation that is located near mile marker 10.2 of Alabama State Route 14.
Topography of the study area is characterized by approximately parallel
southwest-northeast trending ridges that are a manifestation of the more resistant
quartzite units underlying portions of the site. Shallow valleys occur over areas underlain
by less resistant schist, gneiss, and granitic units. One valley is obscured by two
impoundments related to the mining operation. Pre-mining elevations on the site range
from approximately 450 to 672 feet above mean sea level. The maximum local relief is
approximately 130 feet.
Surface-water drainage of the study area is manifest as a modified trellis pattern
with main tributary channels to Sougahatchee Creek running parallel to the strike of the
underlying bedrock. Lower order tributaries commonly intersect the main tributary
3
Figure 1. Notasulga, Alabama U.S.G.S. 7.5’ Quadrangle. Study area is bounded by
Sougahatchee Creek and red line.
4
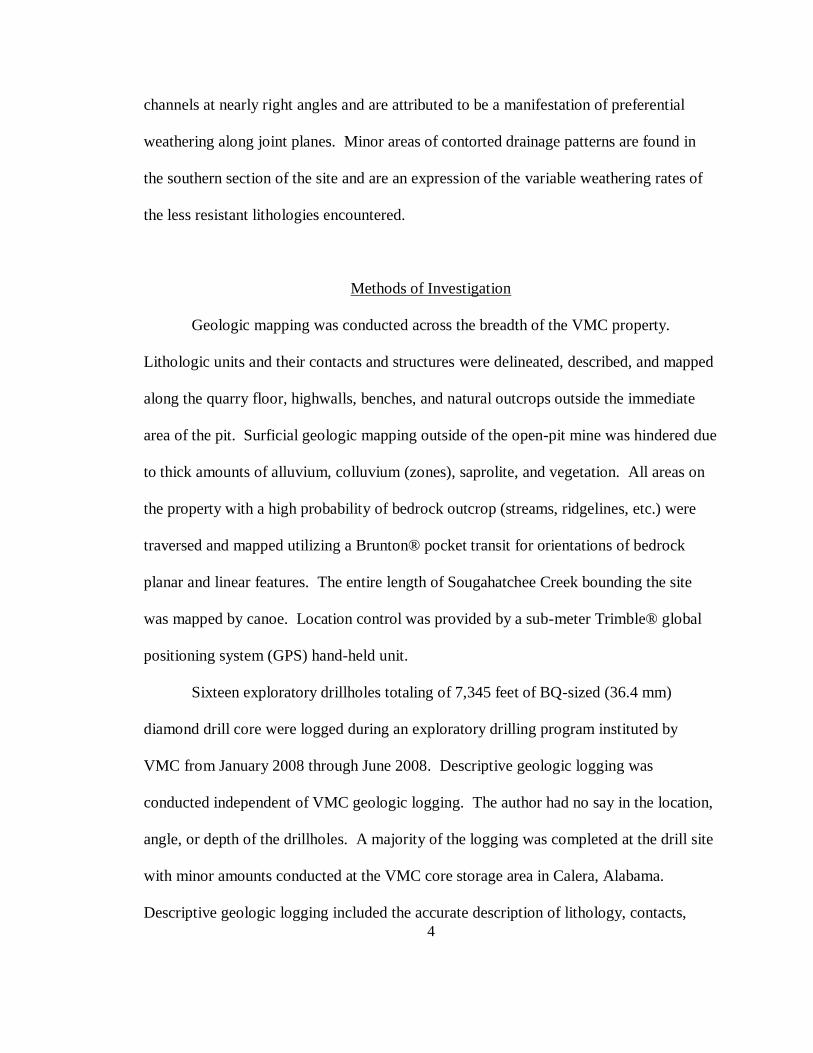
channels at nearly right angles and are attributed to be a manifestation of preferential
weathering along joint planes. Minor areas of contorted drainage patterns are found in
the southern section of the site and are an expression of the variable weathering rates of
the less resistant lithologies encountered.
Methods of Investigation
Geologic mapping was conducted across the breadth of the VMC property.
Lithologic units and their contacts and structures were delineated, described, and mapped
along the quarry floor, highwalls, benches, and natural outcrops outside the immediate
area of the pit. Surficial geologic mapping outside of the open-pit mine was hindered due
to thick amounts of alluvium, colluvium (zones), saprolite, and vegetation. All areas on
the property with a high probability of bedrock outcrop (streams, ridgelines, etc.) were
traversed and mapped utilizing a Brunton® pocket transit for orientations of bedrock
planar and linear features. The entire length of Sougahatchee Creek bounding the site
was mapped by canoe. Location control was provided by a sub-meter Trimble® global
positioning system (GPS) hand-held unit.
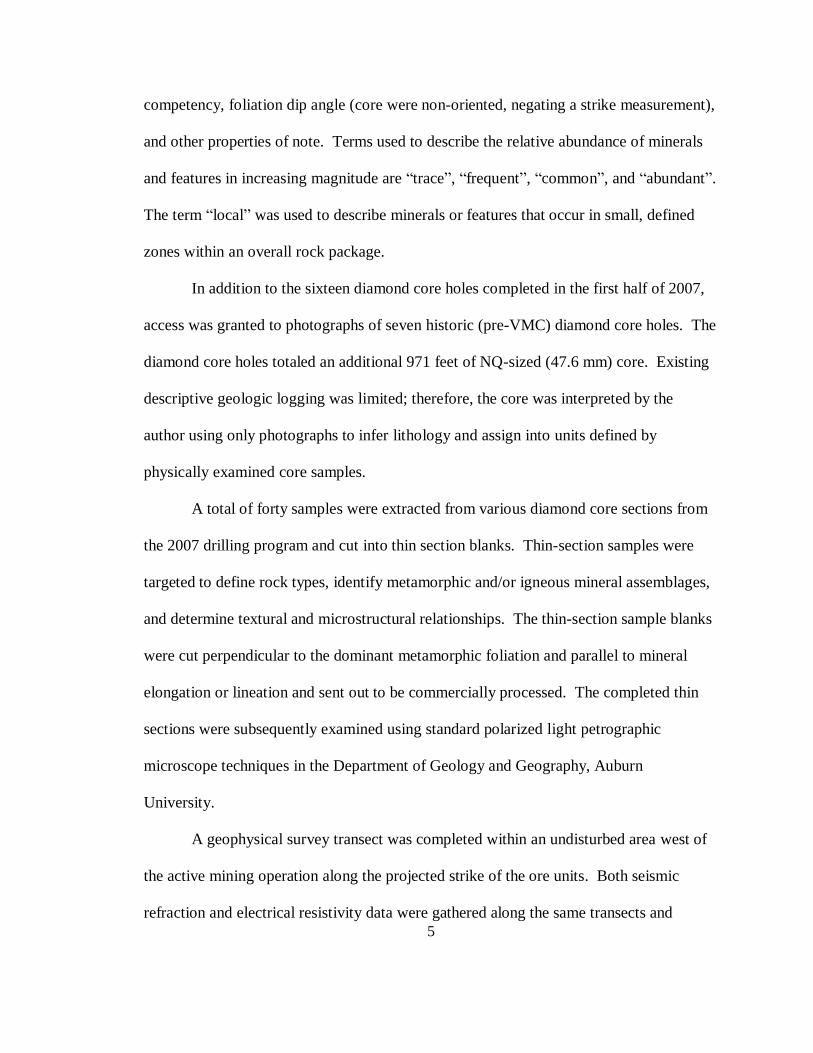
Sixteen exploratory drillholes totaling of 7,345 feet of BQ-sized (36.4 mm)
diamond drill core were logged during an exploratory drilling program instituted by
VMC from January 2008 through June 2008. Descriptive geologic logging was
conducted independent of VMC geologic logging. The author had no say in the location,
angle, or depth of the drillholes. A majority of the logging was completed at the drill site
with minor amounts conducted at the VMC core storage area in Calera, Alabama.
Descriptive geologic logging included the accurate description of lithology, contacts,
5
competency, foliation dip angle (core were non-oriented, negating a strike measurement),
and other properties of note. Terms used to describe the relative abundance of minerals
and features in increasing magnitude are “trace”, “frequent”, “common”, and “abundant”.
The term “local” was used to describe minerals or features that occur in small, defined
zones within an overall rock package.
In addition to the sixteen diamond core holes completed in the first half of 2007,
access was granted to photographs of seven historic (pre-VMC) diamond core holes. The
diamond core holes totaled an additional 971 feet of NQ-sized (47.6 mm) core. Existing
descriptive geologic logging was limited; therefore, the core was interpreted by the
author using only photographs to infer lithology and assign into units defined by
physically examined core samples.
A total of forty samples were extracted from various diamond core sections from
the 2007 drilling program and cut into thin section blanks. Thin-section samples were
targeted to define rock types, identify metamorphic and/or igneous mineral assemblages,
and determine textural and microstructural relationships. The thin-section sample blanks
were cut perpendicular to the dominant metamorphic foliation and parallel to mineral
elongation or lineation and sent out to be commercially processed. The completed thin
sections were subsequently examined using standard polarized light petrographic
microscope techniques in the Department of Geology and Geography, Auburn
University.
A geophysical survey transect was completed within an undisturbed area west of
the active mining operation along the projected strike of the ore units. Both seismic
refraction and electrical resistivity data were gathered along the same transects and
6
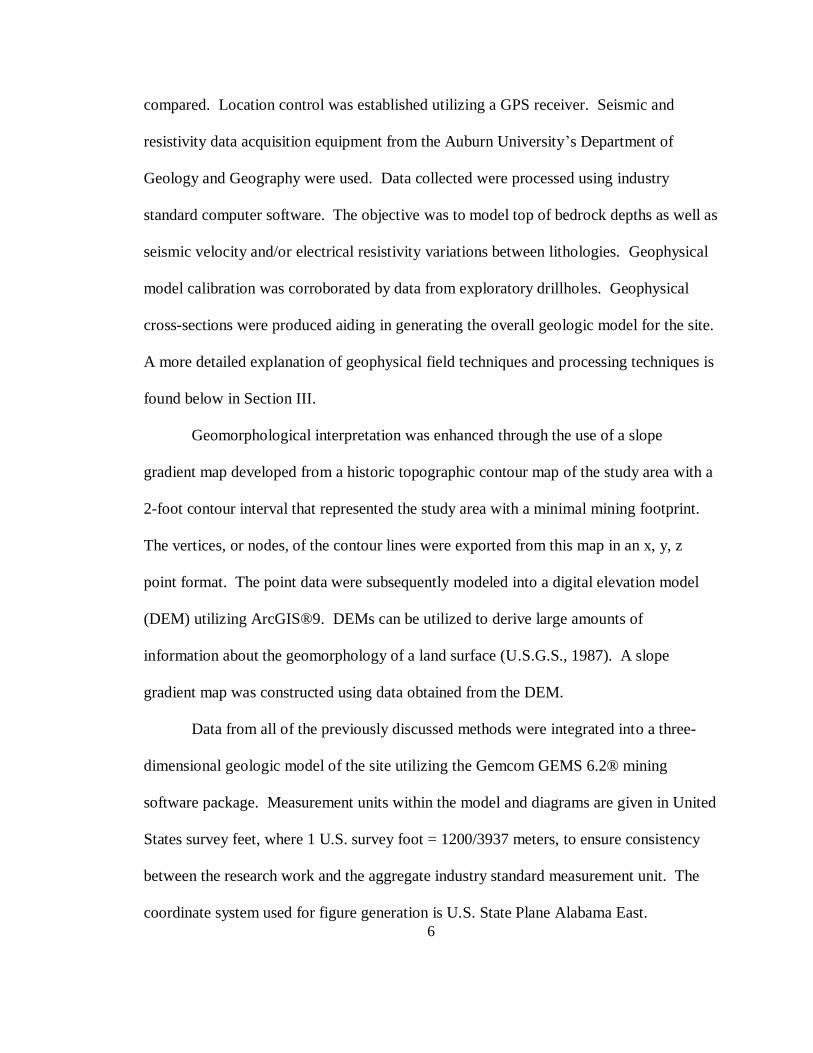
compared. Location control was established utilizing a GPS receiver. Seismic and
resistivity data acquisition equipment from the Auburn University’s Department of
Geology and Geography were used. Data collected were processed using industry
standard computer software. The objective was to model top of bedrock depths as well as
seismic velocity and/or electrical resistivity variations between lithologies. Geophysical
model calibration was corroborated by data from exploratory drillholes. Geophysical
cross-sections were produced aiding in generating the overall geologic model for the site.
A more detailed explanation of geophysical field techniques and processing techniques is
found below in Section III.
Geomorphological interpretation was enhanced through the use of a slope
gradient map developed from a historic topographic contour map of the study area with a
2-foot contour interval that represented the study area with a minimal mining footprint.
The vertices, or nodes, of the contour lines were exported from this map in an x, y, z
point format. The point data were subsequently modeled into a digital elevation model
(DEM) utilizing ArcGIS®9. DEMs can be utilized to derive large amounts of
information about the geomorphology of a land surface (U.S.G.S., 1987). A slope
gradient map was constructed using data obtained from the DEM.
Data from all of the previously discussed methods were integrated into a three-
dimensional geologic model of the site utilizing the Gemcom GEMS 6.2® mining
software package. Measurement units within the model and diagrams are given in United
States survey feet, where 1 U.S. survey foot = 1200/3937 meters, to ensure consistency
between the research work and the aggregate industry standard measurement unit. The
coordinate system used for figure generation is U.S. State Plane Alabama East.
7
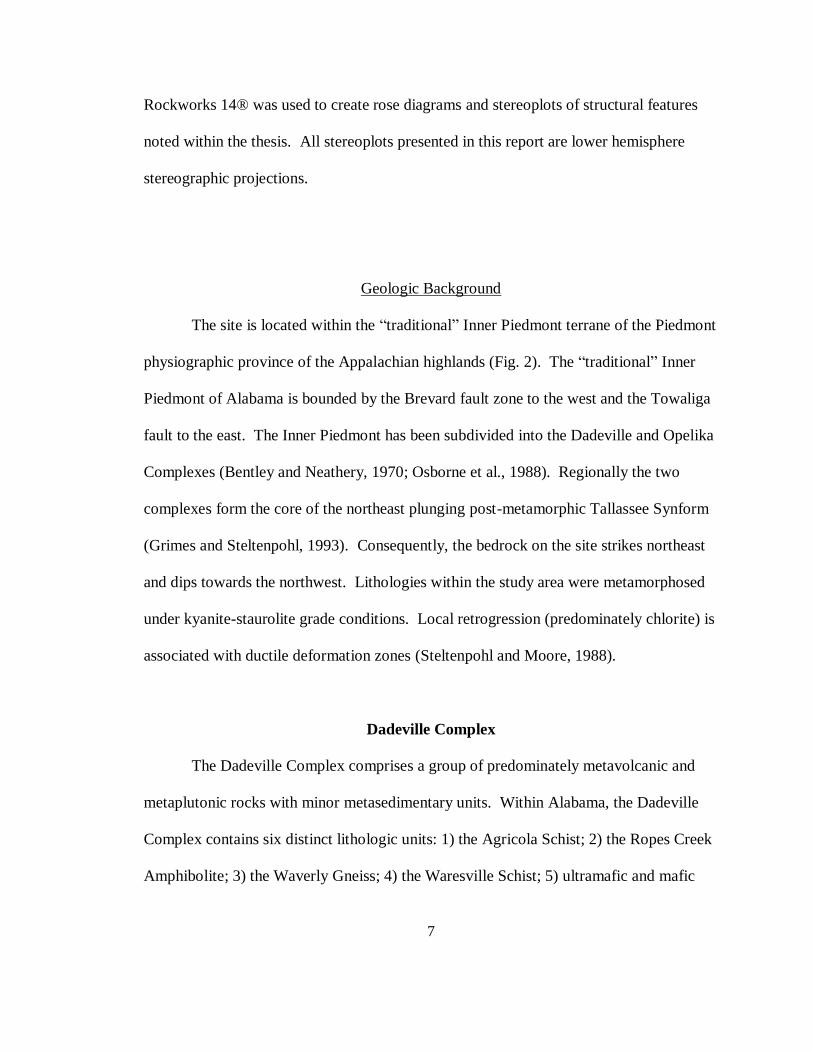
Rockworks 14® was used to create rose diagrams and stereoplots of structural features
noted within the thesis. All stereoplots presented in this report are lower hemisphere
stereographic projections.
Geologic Background
The site is located within the “traditional” Inner Piedmont terrane of the Piedmont
physiographic province of the Appalachian highlands (Fig. 2). The “traditional” Inner
Piedmont of Alabama is bounded by the Brevard fault zone to the west and the Towaliga
fault to the east. The Inner Piedmont has been subdivided into the Dadeville and Opelika
Complexes (Bentley and Neathery, 1970; Osborne et al., 1988). Regionally the two
complexes form the core of the northeast plunging post-metamorphic Tallassee Synform
(Grimes and Steltenpohl, 1993). Consequently, the bedrock on the site strikes northeast
and dips towards the northwest. Lithologies within the study area were metamorphosed
under kyanite-staurolite grade conditions. Local retrogression (predominately chlorite) is
associated with ductile deformation zones (Steltenpohl and Moore, 1988).
Dadeville Complex
The Dadeville Complex comprises a group of predominately metavolcanic and
metaplutonic rocks with minor metasedimentary units. Within Alabama, the Dadeville
Complex contains six distinct lithologic units: 1) the Agricola Schist; 2) the Ropes Creek
Amphibolite; 3) the Waverly Gneiss; 4) the Waresville Schist; 5) ultramafic and mafic
8
Figure 2. Geologic map and cross-section of the Alabama Piedmont (modified after
Osborne et al., 1988; Thomas and coworkers as presented in Hatcher et al., 1990; and
Steltenpohl, 2005). The red star indicates the approximate location of the Notasulga
Quarry within the Farmville Metagranite.
9
intrusive rocks; and 6) “granites” and felsic gneisses (Bentley and Neathery, 1970;
Steltenpohl et al., 1990). The Dadeville Complex is bounded by the Brevard fault zone to
the north and is separated from the Opelika Complex to the south by the Stonewall line
shear zone (Bentley and Neathery, 1970; Grimes, 1993).
Ropes Creek Amphibolite
The only Dadeville Complex unit that may occur in the quarry area is the Ropes
Creek Amphibolite (Fig. 3). The Ropes Creek Amphibolite is a unit of delicately layered
amphibolite that outcrops over approximately forty percent of the Dadeville Complex
(Bentley and Neathery, 1970). Near the study area the Ropes Creek Amphibolite is
described by Grimes (1993) as a fine- to medium-grained amphibolite comprised
predominantly of green-brown pleochroic hornblende, plagioclase, and quartz with
accessory titanite. The rock displays strong compositional layering defined by alternating
layers (5-10 cm thick) of amphibolite and tonalitic material. The rock has a distinctive
nematoblastic fabric defined by parallel hornblende.
Opelika Complex
Rocks within the study site have been traditionally assigned to the Opelika
Complex (Steltenpohl et al., 1988; Sterling and Steltenpohl, 2004). Work by Grimes
(1993; see also Grimes et al., 1993) and White (2007) indicates that the Opelika Complex
is not related to the Inner Piedmont as traditionally interpreted but rather correlates with
rocks of the eastern Blue Ridge, specifically the Emuckfaw Group, around the hinge zone
10
Figure 3. Geologic map of the Notasulga 7.5’ Quadrangle. Modified from Sterling and
Steltenpohl (2004). Study area bounded by Sougahatchee Creek and blue line.
11
of the Tallassee synform to the west. The Opelika Complex is bounded by the Stonewall
line to the northwest and the Towaliga fault zone to the southeast.
The Stonewall line was originally described by Bentley and Neathery (1970) as
“an enigmatic line of stratigraphic discontinuity, either an unconformity or a fault”,
dividing the predominately metavolcanic Dadeville Complex from the predominately
metasedimentary Opelika Complex. Steltenpohl and others (1990) interpreted the
Stonewall line as an amphibolite-facies, synmetamorphic fault zone. Mapping by
Sterling and Steltenpohl (2004) places the Stonewall line immediately north of the study
area (Fig. 3).
The Opelika Complex is divided into four lithologic packages (Bentley and
Neathery, 1970; Steltenpohl et al., 1990): 1) the Loachapoka Schist; 2) the Auburn
Gneiss; 3) Farmville Metagranite (formerly the Bottle Granite); and 4) pegmatites of
uncertain affinity.
Loachapoka Schist
Regionally, the Loachapoka Schist comprises predominantly metapelite and
graphitic schist, minor quartzite, and thin amphibolite (Steltenpohl et al., 1990). The
Loachapoka Schist has been intruded by numerous small pegmatites and larger bodies of
Farmville Metagranite. Quartzite units within the Loachapoka Schist have been reported
by many workers (Bentley and Neathery, 1970; Sears et al., 1981; Steltenpohl et al.,
1990; Grimes, 1993). Sears and others (1981) designated the distinctive quartzite that
outcrops along Sougahatchee Creek as the “Saugahatchee Quartzite Member” of the
“Loachapoka Formation”. Steltenpohl and others (1990) and Grimes (1993) suggest
12
using the term Saugahatchee quartzite as a collective informal name for all quartzites
found within the Loachapoka Schist. (Note that the spelling “Saugahatchee” does not
match the name of the creek on the 1971 Notasulga U.S.G.S. 7.5’ quadrangle. R.B. Cook
[as presented in Steltenpohl and others,1990] reports that the spelling Saugahatchee does
appear on some of the older deeds from this area.)
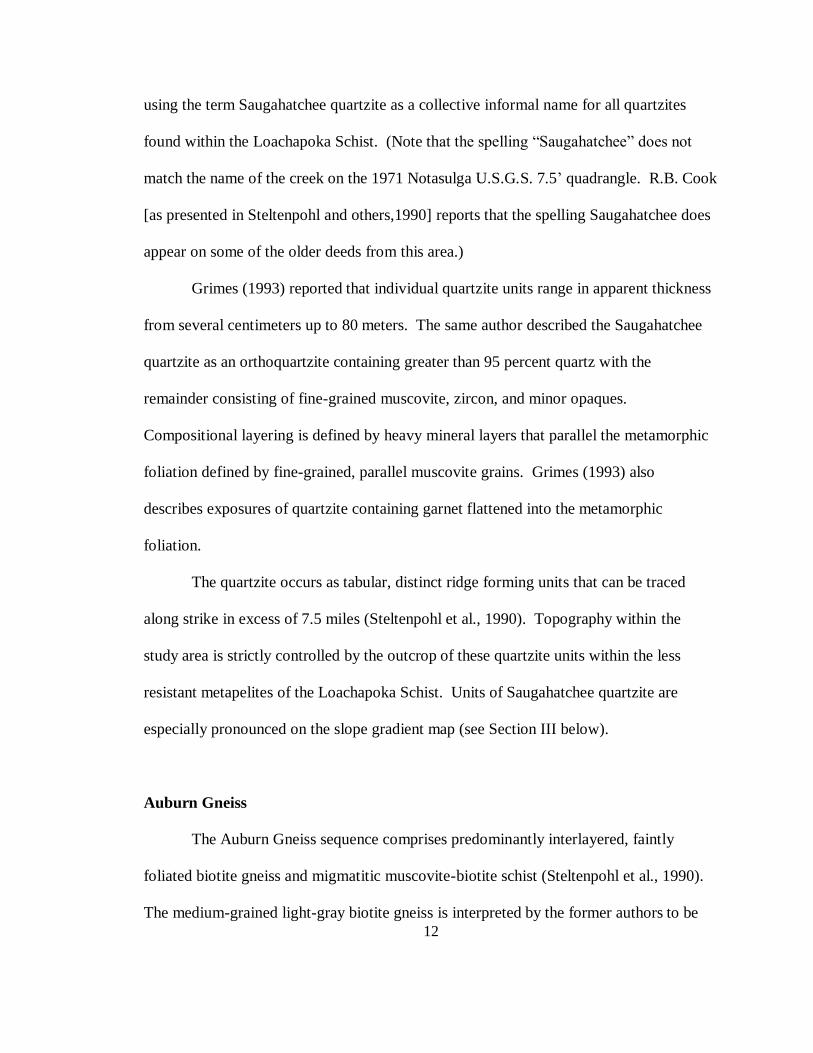
Grimes (1993) reported that individual quartzite units range in apparent thickness
from several centimeters up to 80 meters. The same author described the Saugahatchee
quartzite as an orthoquartzite containing greater than 95 percent quartz with the
remainder consisting of fine-grained muscovite, zircon, and minor opaques.
Compositional layering is defined by heavy mineral layers that parallel the metamorphic
foliation defined by fine-grained, parallel muscovite grains. Grimes (1993) also
describes exposures of quartzite containing garnet flattened into the metamorphic
foliation.
The quartzite occurs as tabular, distinct ridge forming units that can be traced
along strike in excess of 7.5 miles (Steltenpohl et al., 1990). Topography within the
study area is strictly controlled by the outcrop of these quartzite units within the less
resistant metapelites of the Loachapoka Schist. Units of Saugahatchee quartzite are
especially pronounced on the slope gradient map (see Section III below).
Auburn Gneiss
The Auburn Gneiss sequence comprises predominantly interlayered, faintly
foliated biotite gneiss and migmatitic muscovite-biotite schist (Steltenpohl et al., 1990).
The medium-grained light-gray biotite gneiss is interpreted by the former authors to be
13
the paleosome of the migmatitic muscovite-biotite schist. Also present within the
sequence are rare beds of pelitic schist and scattered calc-silicate pods (Colberg, 1989).
The Auburn Gneiss was interpreted by Bentley and Neathery (1970) as a metamorphosed
sequence of graywacke and pelitic sediments possibly representing a turbidite sequence.
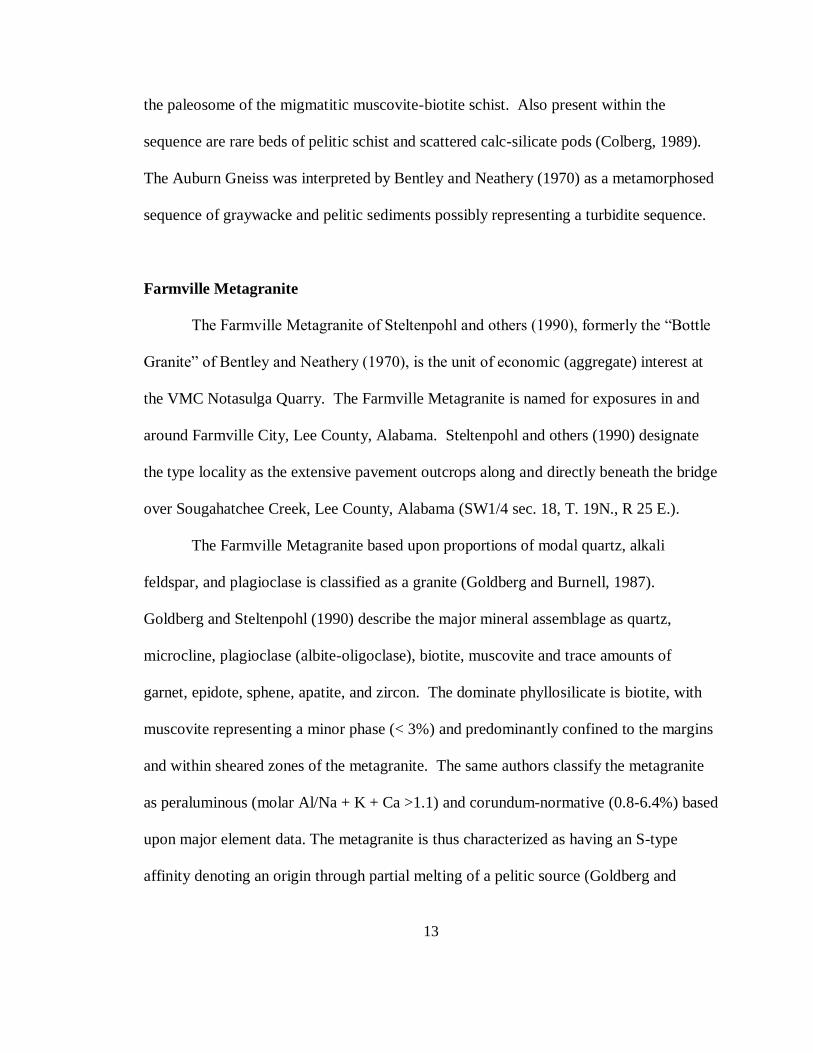
Farmville Metagranite
The Farmville Metagranite of Steltenpohl and others (1990), formerly the “Bottle
Granite” of Bentley and Neathery (1970), is the unit of economic (aggregate) interest at
the VMC Notasulga Quarry. The Farmville Metagranite is named for exposures in and
around Farmville City, Lee County, Alabama. Steltenpohl and others (1990) designate
the type locality as the extensive pavement outcrops along and directly beneath the bridge
over Sougahatchee Creek, Lee County, Alabama (SW1/4 sec. 18, T. 19N., R 25 E.).
The Farmville Metagranite based upon proportions of modal quartz, alkali
feldspar, and plagioclase is classified as a granite (Goldberg and Burnell, 1987).
Goldberg and Steltenpohl (1990) describe the major mineral assemblage as quartz,
microcline, plagioclase (albite-oligoclase), biotite, muscovite and trace amounts of
garnet, epidote, sphene, apatite, and zircon. The dominate phyllosilicate is biotite, with
muscovite representing a minor phase (< 3%) and predominantly confined to the margins
and within sheared zones of the metagranite. The same authors classify the metagranite
as peraluminous (molar Al/Na + K + Ca >1.1) and corundum-normative (0.8-6.4%) based
upon major element data. The metagranite is thus characterized as having an S-type
affinity denoting an origin through partial melting of a pelitic source (Goldberg and
14
Burnell, 1987). The same authors also indicate that the schists of the Auburn Gneiss
sequence could not have been source for the Farmville.
Goldberg and Steltenpohl (1990) recognized that the Farmville Metagranite
occurs as smaller, ill-defined tabular bodies with highly mobilized margins against its
host units rather than distinct, homogenous, regional scale individual plutons as depicted
on the geologic map of Alabama (Osborne et al., 1988). Sills of Farmville are generally
concordant to the regional foliation and exhibit a lit-par-lit relationship attributed to
injection along foliation planes and lithologic contacts in the country rock (Colberg,
1989). These observations are supported by field relationships exposed at the study site.
Emplacement of the Farmville Metagranite was determined to be syntectonic by
Goldberg and Steltenpohl (1990) based upon the criteria established by Paterson and
Tobisch (1988) of: 1) continuity of dominant foliation in both the metagranite and
country rock; 2) continuity of stretching lineations in both the metagranite and country
rock; 3) the greatest intensities of strain occur along the margins of the metagranite
bodies; and 4) the general concordance of the bodies with regional structures.
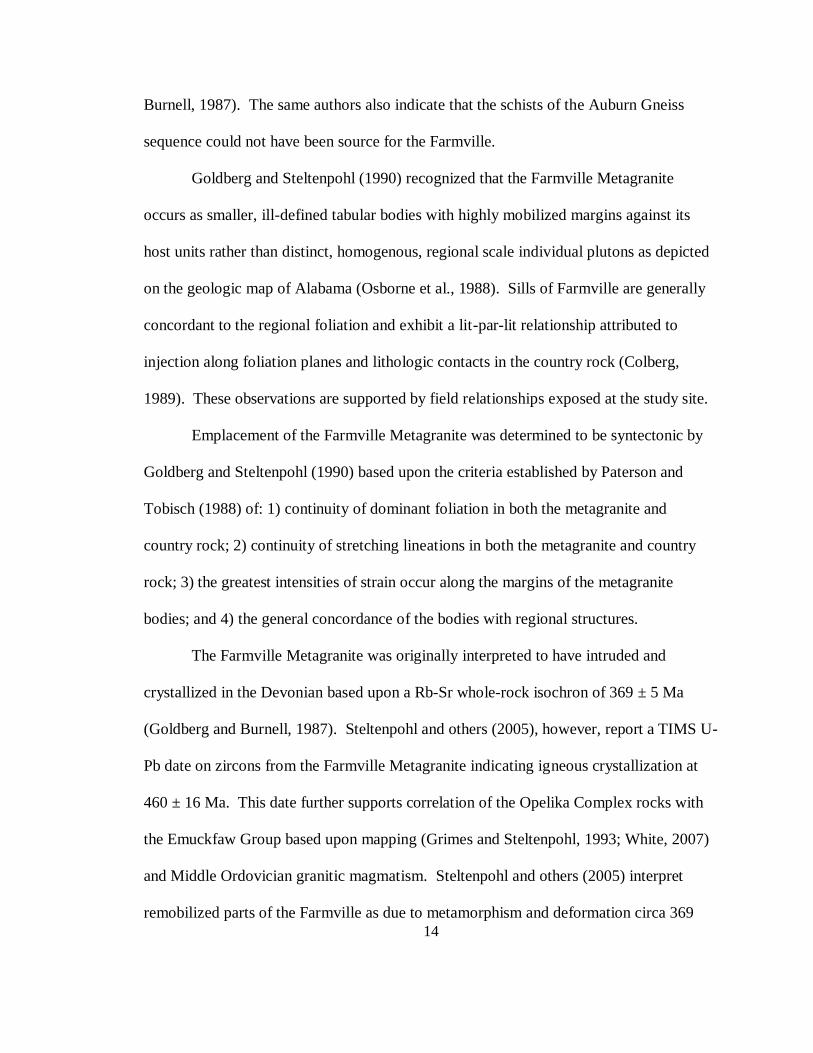
The Farmville Metagranite was originally interpreted to have intruded and
crystallized in the Devonian based upon a Rb-Sr whole-rock isochron of 369 ± 5 Ma
(Goldberg and Burnell, 1987). Steltenpohl and others (2005), however, report a TIMS U-
Pb date on zircons from the Farmville Metagranite indicating igneous crystallization at
460 ± 16 Ma. This date further supports correlation of the Opelika Complex rocks with
the Emuckfaw Group based upon mapping (Grimes and Steltenpohl, 1993; White, 2007)
and Middle Ordovician granitic magmatism. Steltenpohl and others (2005) interpret
remobilized parts of the Farmville as due to metamorphism and deformation circa 369

15
Ma. Goldberg and Steltenpohl (1990) report a 341 +/- 10 Ma Rb-Sr isochron on rocks
marginal to these remobilized Farmville bodies, which likely reflects mid-Mississippian
fluid-driven shear deformation.
Pegmatites
Pegmatite bodies are common within the migmatitic schists and Farmville
Metagranite of the Opelika Complex (Steltenpohl et al., 1990; Cook et al., 2007). At the
study site two different pegmatite-generating events are evident. One generation is
characterized by classic boudinage structures in which the long and intermediate axes of
the boudins are aligned parallel to the foliation of the country rock. The other is strongly
tabular in shape and cross-cuts both the former generation as well as metamorphic
foliation at a high angle, in a dike-like manner. The second type of pegmatite appears
relatively undeformed but “zoned” with a coarse-grained central core that progressively
fines toward the margins. The core of these pegmatite dikes commonly contain a greater
abundance of quartz than the more K-feldspar rich margins.
16
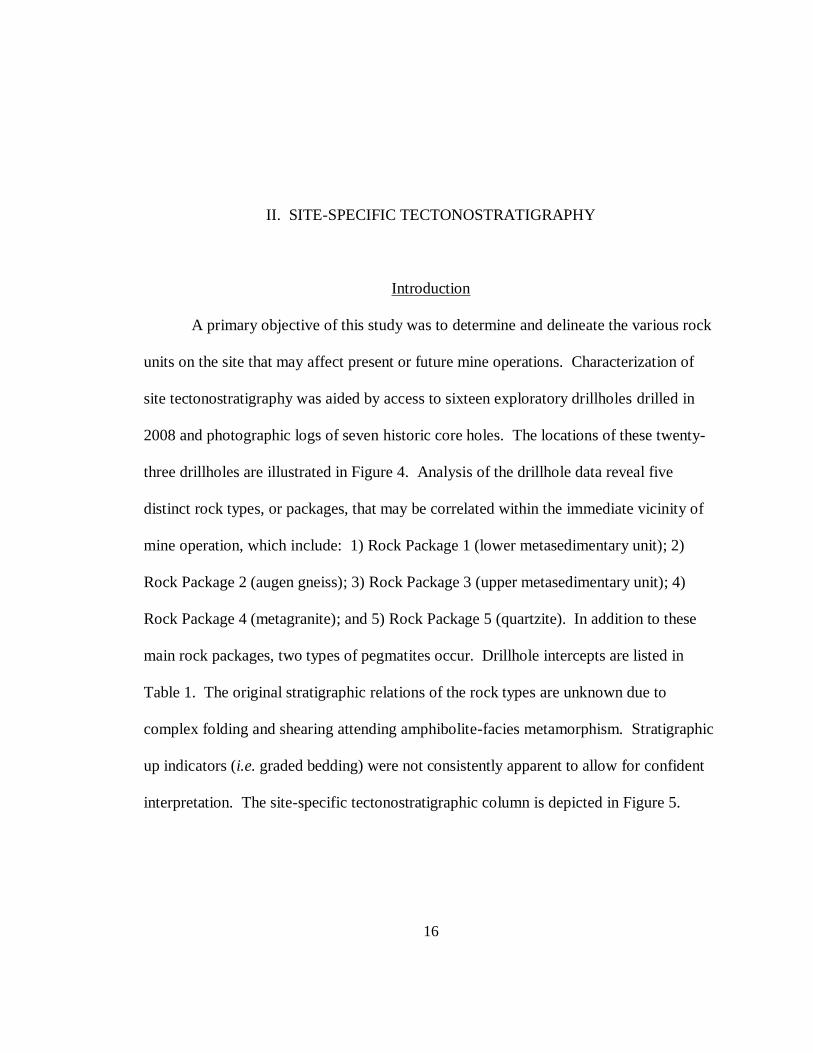
II. SITE-SPECIFIC TECTONOSTRATIGRAPHY
Introduction
A primary objective of this study was to determine and delineate the various rock
units on the site that may affect present or future mine operations. Characterization of
site tectonostratigraphy was aided by access to sixteen exploratory drillholes drilled in
2008 and photographic logs of seven historic core holes. The locations of these twenty-
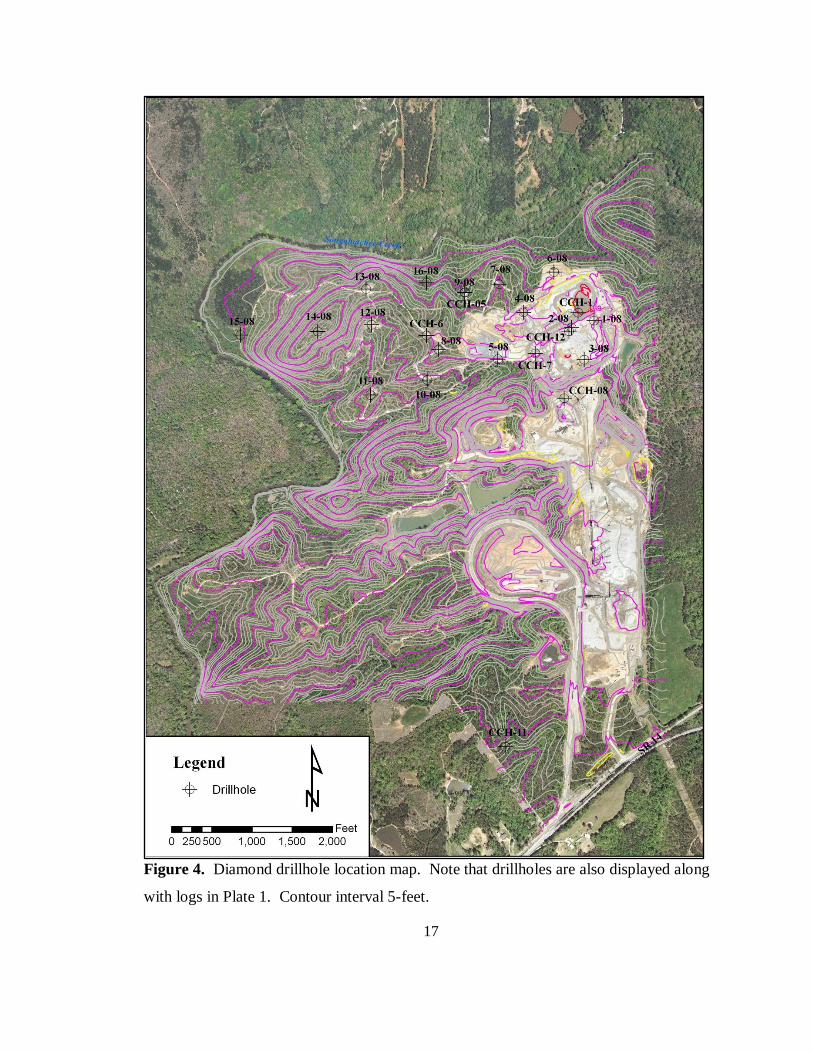
three drillholes are illustrated in Figure 4. Analysis of the drillhole data reveal five
distinct rock types, or packages, that may be correlated within the immediate vicinity of
mine operation, which include: 1) Rock Package 1 (lower metasedimentary unit); 2)
Rock Package 2 (augen gneiss); 3) Rock Package 3 (upper metasedimentary unit); 4)
Rock Package 4 (metagranite); and 5) Rock Package 5 (quartzite). In addition to these
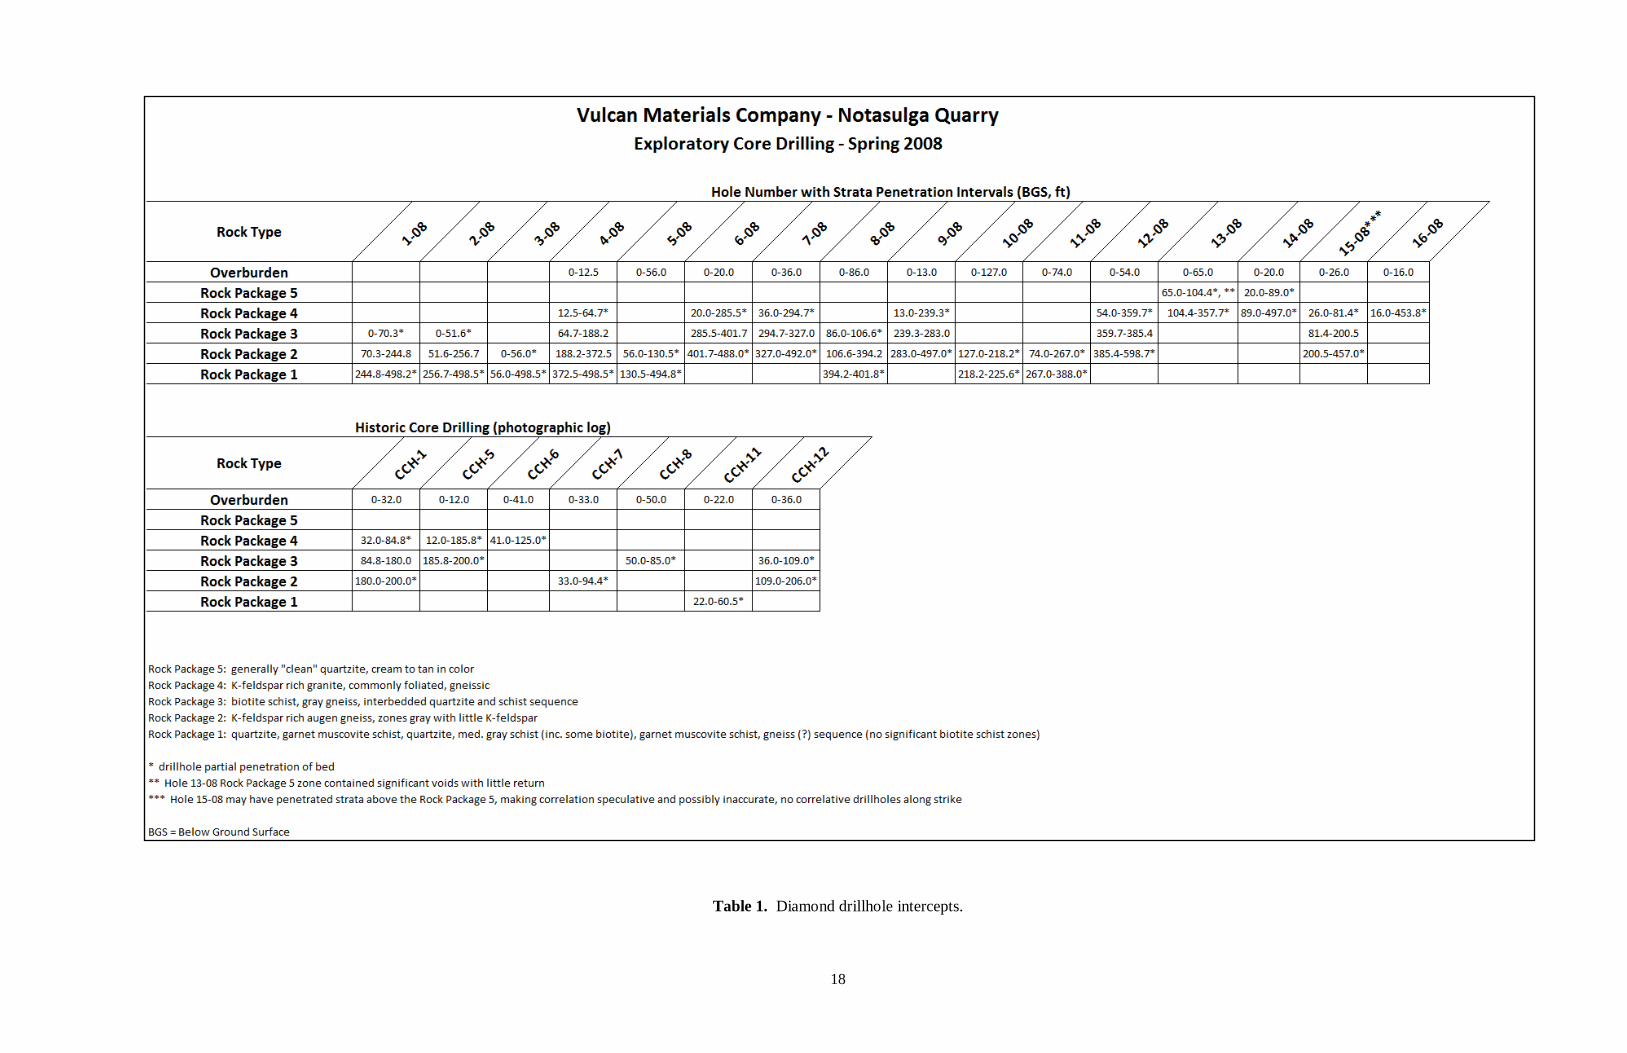
main rock packages, two types of pegmatites occur. Drillhole intercepts are listed in
Table 1. The original stratigraphic relations of the rock types are unknown due to
complex folding and shearing attending amphibolite-facies metamorphism. Stratigraphic
up indicators (i.e. graded bedding) were not consistently apparent to allow for confident
interpretation. The site-specific tectonostratigraphic column is depicted in Figure 5.
17
Figure 4. Diamond drillhole location map. Note that drillholes are also displayed along
with logs in Plate 1. Contour interval 5-feet.
18
Table 1. Diamond drillhole intercepts.
19
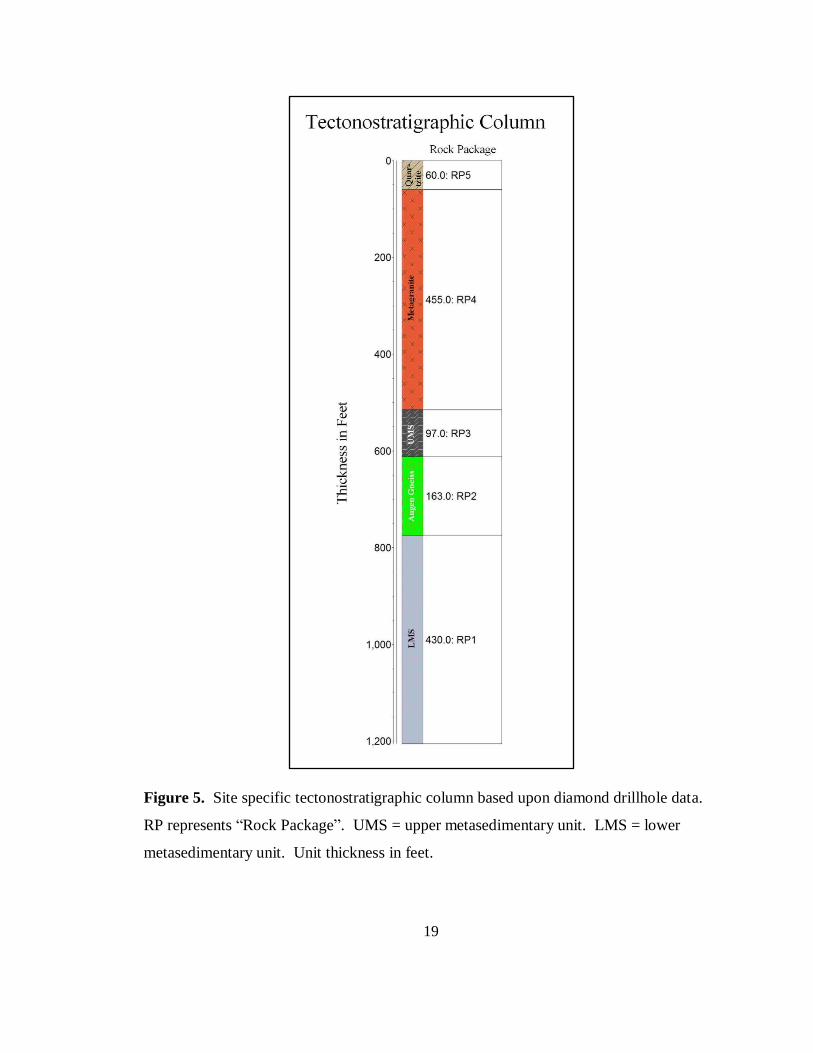
Figure 5. Site specific tectonostratigraphic column based upon diamond drillhole data.
RP represents “Rock Package”. UMS = upper metasedimentary unit. LMS = lower
metasedimentary unit. Unit thickness in feet.
20
Rock Packages
Rock Package 1
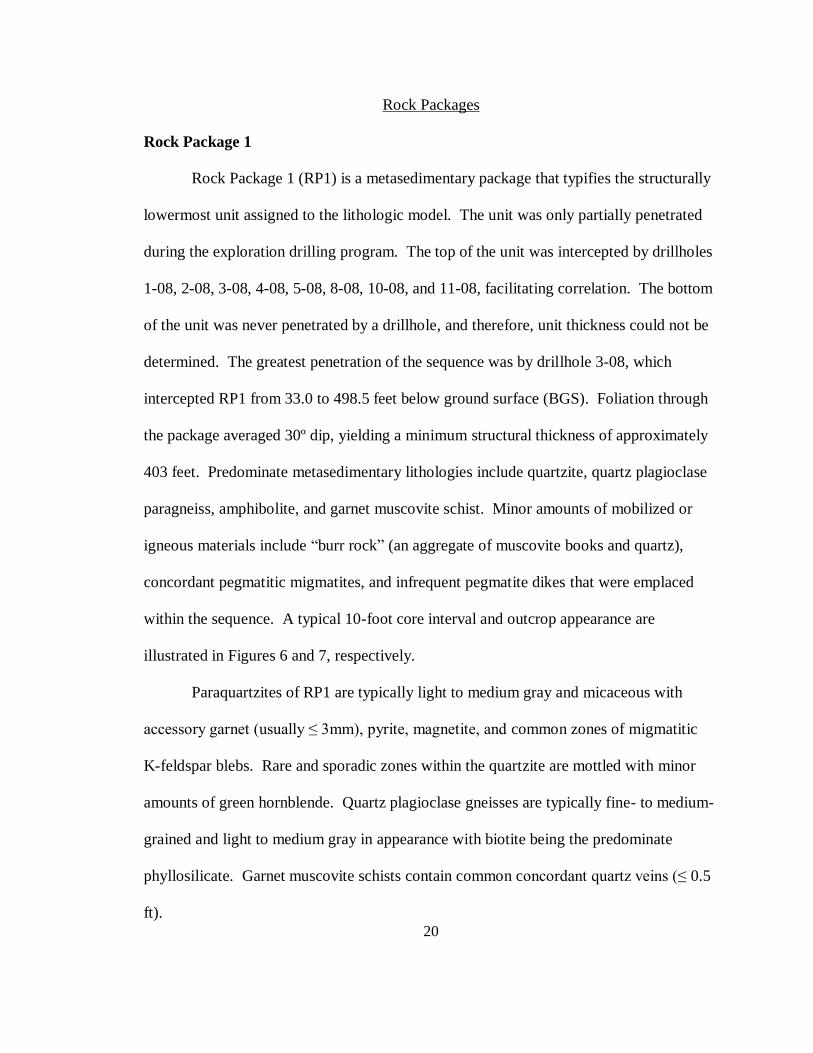
Rock Package 1 (RP1) is a metasedimentary package that typifies the structurally
lowermost unit assigned to the lithologic model. The unit was only partially penetrated
during the exploration drilling program. The top of the unit was intercepted by drillholes
1-08, 2-08, 3-08, 4-08, 5-08, 8-08, 10-08, and 11-08, facilitating correlation. The bottom
of the unit was never penetrated by a drillhole, and therefore, unit thickness could not be
determined. The greatest penetration of the sequence was by drillhole 3-08, which
intercepted RP1 from 33.0 to 498.5 feet below ground surface (BGS). Foliation through
the package averaged 30º dip, yielding a minimum structural thickness of approximately
403 feet. Predominate metasedimentary lithologies include quartzite, quartz plagioclase
paragneiss, amphibolite, and garnet muscovite schist. Minor amounts of mobilized or
igneous materials include “burr rock” (an aggregate of muscovite books and quartz),
concordant pegmatitic migmatites, and infrequent pegmatite dikes that were emplaced
within the sequence. A typical 10-foot core interval and outcrop appearance are
illustrated in Figures 6 and 7, respectively.
Paraquartzites of RP1 are typically light to medium gray and micaceous with
accessory garnet (usually ≤ 3mm), pyrite, magnetite, and common zones of migmatitic
K-feldspar blebs. Rare and sporadic zones within the quartzite are mottled with minor
amounts of green hornblende. Quartz plagioclase gneisses are typically fine- to medium-
grained and light to medium gray in appearance with biotite being the predominate
phyllosilicate. Garnet muscovite schists contain common concordant quartz veins (≤ 0.5
ft).
21
Figure 6. Typical section of Rock Package 1, lower metasedimentary unit, from drillhole
5-08, 324.9 to 334.9 feet BGS. Long axis of core box equals 2 feet.
22
Figure 7. Typical outcrop of Rock Package 1 displaying sub-horizontal foliation and
nearly 90º joint intersections resulting in blocky weathering pattern. Location (715,753 ft
E, 766,661 ft N) is directly beneath the conveyor from the primary crusher, southern
highwall, view is towards the south. Note the distinctive mica-rich parting surfaces in the
otherwise massive lithology.
23
The entire sequence of RP1 is characterized by frequent to common concordant
pegmatite layers and/or lenses. The pegmatites are commonly thin (≤ 0.5 ft) with
sporadic thicker layers (≤ 5.0 ft). Pegmatitic blebs appear randomly within the matrix of
impure quartzite and schists with a slight alignment along foliation. Margins of
pegmatites in core samples appear as “protrusions” into the country rock, commonly
wrapped by phyllosilicates. These textural relationships are most likely a result of in-situ
formation through migmitization of the surrounding country rock.
Petrographic analysis of a targeted sample of amphibolite containing a
particularly green-colored band from RP1 (drillhole 5-08, 295 ft BGS; Fig. 8a) revealed a
visual estimate assemblage of 40% hornblende (0.4-2.5 mm), 30% plagioclase (0.4-1.0
mm), 10% muscovite (0.2-1.25 mm), 10% quartz (0.4-0.7 mm), 5% garnet (1.0-2.5 mm),
and 5% opaques (0.2-0.6 mm). Hornblende was confined to layers aligned with foliation
otherwise defined by muscovite. The green hornblende grains are typically subhedral to
euhedral, with a deep green pleochroism. Quartz grains have interlocking grain
boundaries. Garnet porphyroblasts are poikiloblastic with inclusions of quartz,
amphibole, and opaques randomly oriented.
A sample of garnet muscovite quartz schist (Fig. 8b) from the southern highwall
150 feet south of the primary crusher contained a visual estimate assemblage of 65%
quartz (0.25-1.0 mm), 20% muscovite (0.25-1.25 mm), 8% garnet (5.0-7.0 mm), 5%
staurolite (0.4-1.7 mm), < 2% opaques, and trace amounts of biotite. Quartz was the
predominant matrix mineral; a coarse-grained 10 mm vein, parallel to foliation and
bounded by muscovite, inflated the quartz percentage. Quartz grains within the matrix
have interlocking grain boundaries. Muscovite grains defined foliation within the
24
a)
b)
Figure 8. a) Photomicrograph of garnet-plagioclase-hornblende amphibolite from
RP1. b) Photomicrograph of staurolite-garnet bearing muscovite schist from RP1.
Blue epoxy. Plane-polarized light.
25
sample. Garnet porphyroblasts are anhedral and are typically poikilitic with inclusions of
staurolite, quartz, and opaques aligned parallel to the foliation outside of the
porphyroblast. Staurolite porphyroblasts are anhedral and occur within horizon layers.
Rock Package 2
Rock Package 2 (RP2) is a relatively homogenous augen gneiss with common K-
feldspar augen (average 2 cm long) and persistent concordant pegmatite layers that
average 15 cm in thickness. The unit was partially penetrated by drillholes 3-08, 5-08, 6-
08, 7-08, 9-08, 10-08, 12-08, CCH-1, CCH-7, and CCH-12; it was fully penetrated by
drillholes 1-08, 2-08, 4-08, and 8-08 with downhole thicknesses of 174.5 ft, 205.1 ft,
184.3 ft, and 287.6 ft, respectively. Foliation through the unit averages 30º dip equaling a
measured thickness of approximately 163 feet for drillholes 1-08, 2-08, and 4-08. Unit
thickness towards the west (drillhole 8-08) is approximately 249 feet. The anomalously
thick intercept in drillhole 8-08 is explained in the geologic model section (Section V)
below.
The contact between RP2 and RP1 is generally marked by an approximately 2
foot or less thick zone of muscovite “burr rock” pegmatite. This same contact relation
between Farmville Metagranite and its host units is also reported by Colberg (1989).
RP2 is predominantly a gray-colored, medium- to coarse-grain biotite quartz plagioclase
gneiss with common salmon-colored K-feldspar augen. Locally the gneiss has a pink, K-
feldspar rich matrix as opposed to the more predominant quartz-plagioclase felsic
component of the matrix. Foliation is defined by mafic compositional layers of biotite.
The unit is distinguished in outcrop and in diamond core by presence of augens and
26
persistent concordant K-feldspar pegmatite layers (Figs. 9 and 10). These concordant
pegmatite layers are the “marker” for discriminating between RP2 and RP4, which
otherwise may be indistinguishable in massive samples. K-feldspar grains within the
pegmatites commonly have recrystallized mica-rich margins with a core-mantle texture in
hand sample suggesting a migmatitic, fluid-driven emplacement. RP2 locally contains
small (< 2 mm) almandine-colored garnets and fractures may be lined with pyrite.
Drillhole 4-08 intercepted a tourmaline-bearing pegmatite between 354.7 and 355.7 ft
BGS.
Drillholes 2-08, 7-08, 9-08, and 12-08 intercepted several anomalous lithologies
within RP2. The anomalous lithologies differ in lithology and foliation dip from the
typical augen gneiss unit. Drillhole 2-08 penetrated a fine-grained schistose biotite
quartzite resembling metagraywacke between 83.7 and 87.0 ft BGS. A highly silicified
zone with horizontal partings was found through the 388.2 to 400.4 ft BGS interval in
drillhole 7-08. Biotite quartzite was encountered between 369.7 and 371.4 ft BGS in
drillhole 9-08. A package of metasedimentary units, pegmatite, and gray gneiss with
nonconformable foliation was penetrated by drillhole 12-08 from 507.9 to 551.0 ft BGS.
These anomalous lithologies are interpreted as xenoliths in the orthogneiss.
Petrographic analysis of a representative K-feldspar rich section of RP2 (drillhole
7-08, 385.5 ft BGS; Fig 11a) indicates a visual estimate assemblage of 40% K- feldspar
(0.2-4.3 mm), 30% quartz (0.4-6.0 mm), 20% plagioclase (0.2-4.0 mm), 7% biotite (0.25-
4.0 mm), and 3% muscovite (0.2-2.8 mm) with accessory rutile (0.06 mm). K-feldspar
has cross-hatch twinning and commonly embays both quartz and plagioclase (Fig. 11b).
Matrix grain width averages 0.65 mm with larger grains confined to layers with elongated
27
Figure 9. Typical section of Rock Package 2 augen gneiss from drillhole 4-08, 198.1 to
207.7 feet BGS. Long axis of core box equals 2 feet. Note concordant pegmatitic layers.
28
Figure 10. Outcrop of Rock Package 2 in upper bench south highwall displaying
concordant K-feldspar pegmatites. Highwall is approximately 40 feet tall. Location at
base of highwall, center photograph is approximately 716,277 ft E, 766,954 ft N.
29
a)
b)
Figure 11. a) Photomicrograph of typical sample of RP2 gneiss. b) Photomicrograph of
plagioclase embayment by K-feldspar. Cross-polarized light. Both photographs from
sample collected from drillhole 7-08 385.5 ft BGS.
30
grains paralleling the foliation of the phyllosilicates. Quartz grains average 0.8 mm
within the matrix, but larger grains are restricted to more coarsely crystalline layers found
within the rock. Small (0.02 mm) quartz blebs are common throughout the sample.
Plagioclase grains average 0.5 mm within the matrix but grains up to 4.0 mm occur
within the coarser compositional layers. Plagioclase grains bordering K-feldspar
commonly have myrmekitic intergrowths of quartz. Myrmekite is associated with points
of high strain, whether through strain energy at exsolution lamellae or twinning planes or
by indirectly favoring fluid access to the reaction interface (Vernon, 1991). The
predominate phyllosilicate within the sample is biotite which is frequently replaced by
muscovite, with the Fe and Mg being absorbed by chlorite. The phyllosilicates define the
foliation within the sample.
Rock Package 3
Rock Package 3 (RP3) comprises a metasedimentary package of fine- to medium-
grained quartz biotite schist with common leucosomal pegmatitic boudins. The unit was
partially penetrated by drillholes 1-08, 2-08, 8-08, CCH-5, CCH-8, and CCH-12. RP3
was fully penetrated by drillholes 4-08, 6-08, 7-08, 9-08, 12-08, and CCH-1, with
downhole thicknesses of 123.5 ft, 116.2 ft, 32.3 ft, 43.7 ft, 25.7 ft, and 95.2 ft,
respectively. Foliation through the unit is well defined, averaging a dip of 30º; however,
foliation appears to have been warped in many samples. Orbicular foliation, interpreted
to be small sheath folds, were noted in some drill cores. Assuming a constant dip of 30º,
the average thickness for the eastern drillholes 4-08, 6-08, and CCH-1 for RP3 is 96.7 ft.
The western drillholes 7-08, 9-08, and 12-08 yield a true tectonostratigraphic thickness of
31
29.4 ft. The thinning of the unit to the west is discussed below in the geologic model
section (Section V).
The contact between RP3 and RP2 is similar to the muscovite “burr stone”
contact between RP2 and RP1, although a persistent medium gray micaceous “quartzite”
was noted in drillholes where not obscured by K-feldspar pegmatite injections. In
outcrop the along the eastern highwall of the 500 bench the contact is obscured by a large
K-feldspar bearing pegmatite injection that contains a folded xenolith of biotite schist
concordant to foliation (Fig. 12).
RP3 is primarily a quartz biotite schist with large pegmatite boudins in excess of
30 feet in length and 10 feet along the short axis. Interbedded quartzites and gray gneiss
in RP3 are not correlative between drillholes. Smaller (<5 cm), white colored pegmatitic
blebs are common throughout the sequence. Concordant and disconcordant smoky quartz
veins are also common within this unit. Garnet, plagioclase, K-feldspar, and chlorite are
locally visible in hand sample. RP3 is locally sulfide rich containing pyrite, chalcopyrite,
and pyrrhotite. Pyrrhotite occurs along foliation planes whereas pyrite and chalcopyrite
are usually associated with the margins of quartz veins and pegmatitic pods. Oxides
noted within the sequence include magnetite and graphite along foliation planes. No
aluminosilicate minerals were identified. Foliation is defined by aligned biotite.
Photographs of a typical 10 foot core interval and an outcrop are provided in Figures 13
and 14, respectively.
Petrographic analysis of a representative sample of a felsic-blebbed
section of RP3 (drillhole 7-08, 298 ft BGS) documents an assemblage of 50% quartz
32
Figure 12. K-feldspar bearing pegmatite obscuring contact between Rock Package 3 and
Rock Package 2. Pegmatite contains foliation concordant, folded xenoliths of Rock
Package 3. 500 bench east highwall. 716405.68 ft E, 767108.79 ft N.
33
Figure 13. Typical section of Rock Package 3 from drillhole 6-08, 284.2 to 294.0 ft
BGS. Long axis of core box equals 2 feet.
34
Figure 14. Outcrop photograph of Rock Package 3; foliation dips towards the left. 500
bench, east highwall. Location at center of photograph approximately 716,323 ft E,
767,332 ft N. Highwall is approximately 40 feet high.
35
(0.3-1.2 mm), 30% biotite (0.1-3.0 mm), 15% plagioclase (0.25-0.8 mm), and 5%
opaques. Accessory minerals include chlorite, zircon, apatite, and pyrite. Quartz grain
size decreases proportionally to the increase in biotite abundance within the matrix.
Quartz grains are commonly anhedral. Biotite has a light to strong brown pleochroism
and infrequently contains small (≤ 0.04 mm) zircon inclusions with dark pleochroic
halos. Biotite grains occur as subhedral, inequigranular books that are locally retrograded
to chlorite. Plagioclase is present as small (< 1.0 mm) anhedral grains with albite twins.
Plagioclase has embayed boundaries with quartz and biotite and frequently contains
quartz blebs. Opaques are presumed to be pyrite (hand sample identification) and appear
as “stringers” in thin-section (Fig. 15a) and as platelets aligned with foliation in hand
sample.
Quartz-plagioclase pegmatite boudins are common throughout the sequence and
are generally wrapped by the enclosing biotite schist. Petrographic analysis of a contact
between pegmatite and schist (Figure 15b: drillhole 2-08, 33.3 ft BGS) demonstrates that
biotite clearly wraps the bulbous quartz-plagioclase pegmatite protrusions. Biotite has
embayed boundaries with plagioclase grains and straight boundaries with quartz grains.
An abnormally high abundance of zircons are included within biotite in this sample.
Core surrounding the thin-section sample contained a high percentage (10%) pyrrhotite
immediately adjacent to the pegmatite contact. The mineral assemblage of the pegmatite
reveals is K-feldspar + plagioclase + quartz + muscovite with accessory calcite, biotite,
and opaques. Secondary calcite is common along fractures and within sericitized zones
within plagioclase grains. Biotite and opaque-rich zones are thought to be xenoliths of
36
a)
b)
Figure 15. a) Photomicrograph of typical Rock Package 3, drillhole 7-08 297.5 ft BGS.
Plane-polarized light. Blue epoxy. b) Photomicrograph of contact between biotite-quartz
schist and pegmatite. Cross-polarized light.
37
biotite schist entrained within the pegmatite. Foliation is not evident within thin-section
samples of the pegmatite.
Rock Package 4
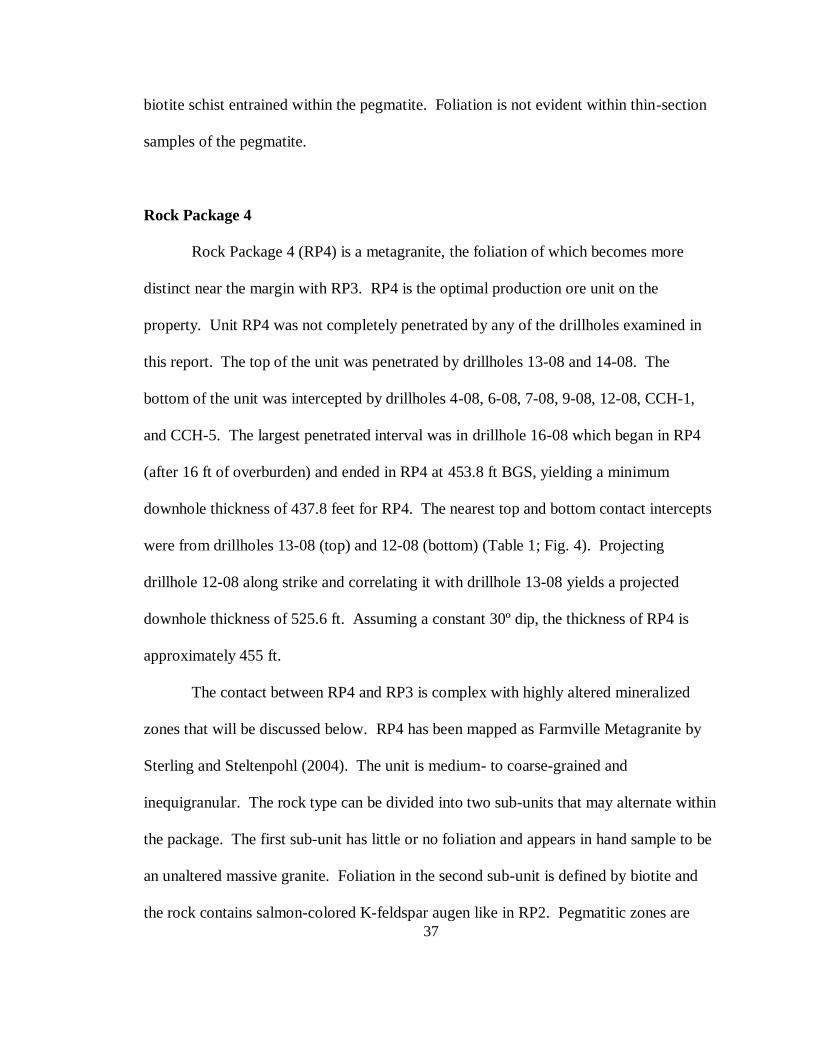
Rock Package 4 (RP4) is a metagranite, the foliation of which becomes more
distinct near the margin with RP3. RP4 is the optimal production ore unit on the
property. Unit RP4 was not completely penetrated by any of the drillholes examined in
this report. The top of the unit was penetrated by drillholes 13-08 and 14-08. The
bottom of the unit was intercepted by drillholes 4-08, 6-08, 7-08, 9-08, 12-08, CCH-1,
and CCH-5. The largest penetrated interval was in drillhole 16-08 which began in RP4
(after 16 ft of overburden) and ended in RP4 at 453.8 ft BGS, yielding a minimum
downhole thickness of 437.8 feet for RP4. The nearest top and bottom contact intercepts
were from drillholes 13-08 (top) and 12-08 (bottom) (Table 1; Fig. 4). Projecting
drillhole 12-08 along strike and correlating it with drillhole 13-08 yields a projected
downhole thickness of 525.6 ft. Assuming a constant 30º dip, the thickness of RP4 is
approximately 455 ft.
The contact between RP4 and RP3 is complex with highly altered mineralized
zones that will be discussed below. RP4 has been mapped as Farmville Metagranite by
Sterling and Steltenpohl (2004). The unit is medium- to coarse-grained and
inequigranular. The rock type can be divided into two sub-units that may alternate within
the package. The first sub-unit has little or no foliation and appears in hand sample to be
an unaltered massive granite. Foliation in the second sub-unit is defined by biotite and
the rock contains salmon-colored K-feldspar augen like in RP2. Pegmatitic zones are
38
frequent, although not as common as in RP2. The mineral assemblage for RP4 includes
quartz + K-feldspar + plagioclase + biotite + muscovite with accessory pyrite, magnetite,
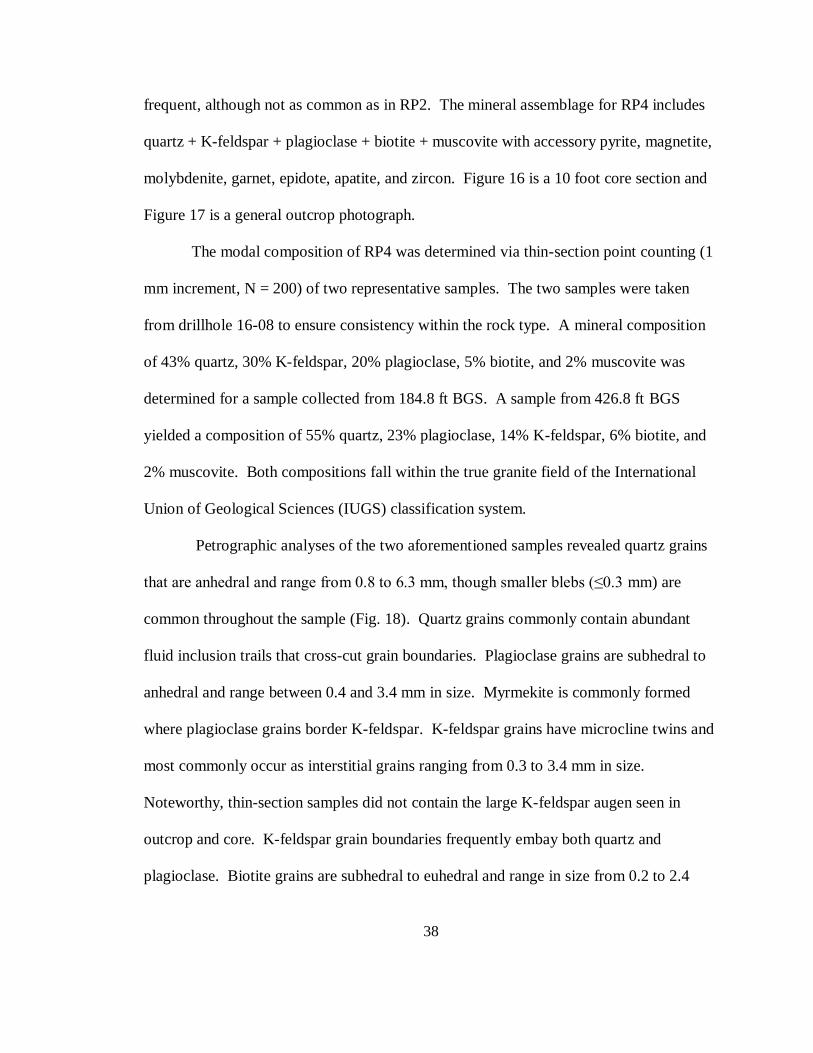
molybdenite, garnet, epidote, apatite, and zircon. Figure 16 is a 10 foot core section and
Figure 17 is a general outcrop photograph.
The modal composition of RP4 was determined via thin-section point counting (1
mm increment, N = 200) of two representative samples. The two samples were taken
from drillhole 16-08 to ensure consistency within the rock type. A mineral composition
of 43% quartz, 30% K-feldspar, 20% plagioclase, 5% biotite, and 2% muscovite was
determined for a sample collected from 184.8 ft BGS. A sample from 426.8 ft BGS
yielded a composition of 55% quartz, 23% plagioclase, 14% K-feldspar, 6% biotite, and
2% muscovite. Both compositions fall within the true granite field of the International
Union of Geological Sciences (IUGS) classification system.
Petrographic analyses of the two aforementioned samples revealed quartz grains
that are anhedral and range from 0.8 to 6.3 mm, though smaller blebs (≤0.3 mm) are
common throughout the sample (Fig. 18). Quartz grains commonly contain abundant
fluid inclusion trails that cross-cut grain boundaries. Plagioclase grains are subhedral to
anhedral and range between 0.4 and 3.4 mm in size. Myrmekite is commonly formed
where plagioclase grains border K-feldspar. K-feldspar grains have microcline twins and
most commonly occur as interstitial grains ranging from 0.3 to 3.4 mm in size.
Noteworthy, thin-section samples did not contain the large K-feldspar augen seen in
outcrop and core. K-feldspar grain boundaries frequently embay both quartz and
plagioclase. Biotite grains are subhedral to euhedral and range in size from 0.2 to 2.4
39
Figure 16. Representative section of Rock Package 4 metagranite from drillhole 16-08,
262.8 to 272.4 ft BGS. Note foliated texture, frequent pegmatite, and local K-feldspar
augen. Long axis of core box equals 2 feet.
40
Figure 17. Outcrop of Rock Package 4 in lower bench east highwall illustrating massive
nature. Highwall is approximately 35 feet tall. Location at base of highwall is
approximately 716,188 ft E, 767,770 ft N.
41
a)
b)
Figure 18. a) Photomicrograph of Rock Package 4, drillhole 16-08 184.8 ft BGS. b)
Photomicrograph of Rock Package 4, drillhole 16-08 428.6 ft BGS. Cross-polarized
light. Note well-developed myrmekite.
42
mm in length. Muscovite grains are generally small (0.1 mm) within the matrix but can
attain lengths of 1.1 mm as overgrowths on biotite.
The contact zone between RP4 and RP3 is complex with highly altered and
mineralized zones. The most conspicuous assemblage is that of quartz + K-feldspar
(green) + plagioclase + garnet + chalcopyrite + pyrite + molybdenite. The peculiar green
coloration of the K-feldspar is likely due to metal substitution within the crystal lattice as
inferred by the abundance of metal mineralization associated with the contact zone. The
green K-feldspar mineralization, abundance of sulfides, and presence of large red garnets
(5 cm) are visual markers for this contact. Pink potassic alteration is widespread.
Garnetiferous zones without recognizable crystal form may be in excess of 15 cm thick.
Molybdenite usually occurs in more felsic, Na-plagioclase rich portions of the granite,
particularly around zones of small (1 mm) biotite flecks. Single molybdenite crystals of
2 cm are common, however, mineralization predominantly occurs in bands rather than
randomly in the matrix. It is important to note that molybdenite also occurs as rare, small
(< 0.5 cm) crystals dispersed within the matrix of RP4, but concentrations do not
approach the high abundance noted at the contact with RP3. A representative thin-
section photomicrograph is illustrated in Figure 19 and a representative hand samples are
in Figure 20.
Rock Package 5
Rock Package 5 (RP5), a relatively pure muscovite paraquartzite (sedimentary
protolith), marks the uppermost correlative layer assigned to the geologic model. Unit
RP5 was partially penetrated by only two drillholes (13-08 and 14-08; Table 1). Hole
43
a)
b)
Figure 19. Photomicrograph of a sample from the contact zone between RP4 and RP3.
Note abundant opaques. K-feldspar in hand sample has green coloration. a) Plane-
polarized light. b) Cross-polarized light.
44
a)
b)
Figure 20. Hand sample photographs of two samples from the RP4/RP3 contact zone.
a) Molybdenite-bearing biotite schist. b) Large (≤ 2 cm) molybdenite crystals.
45
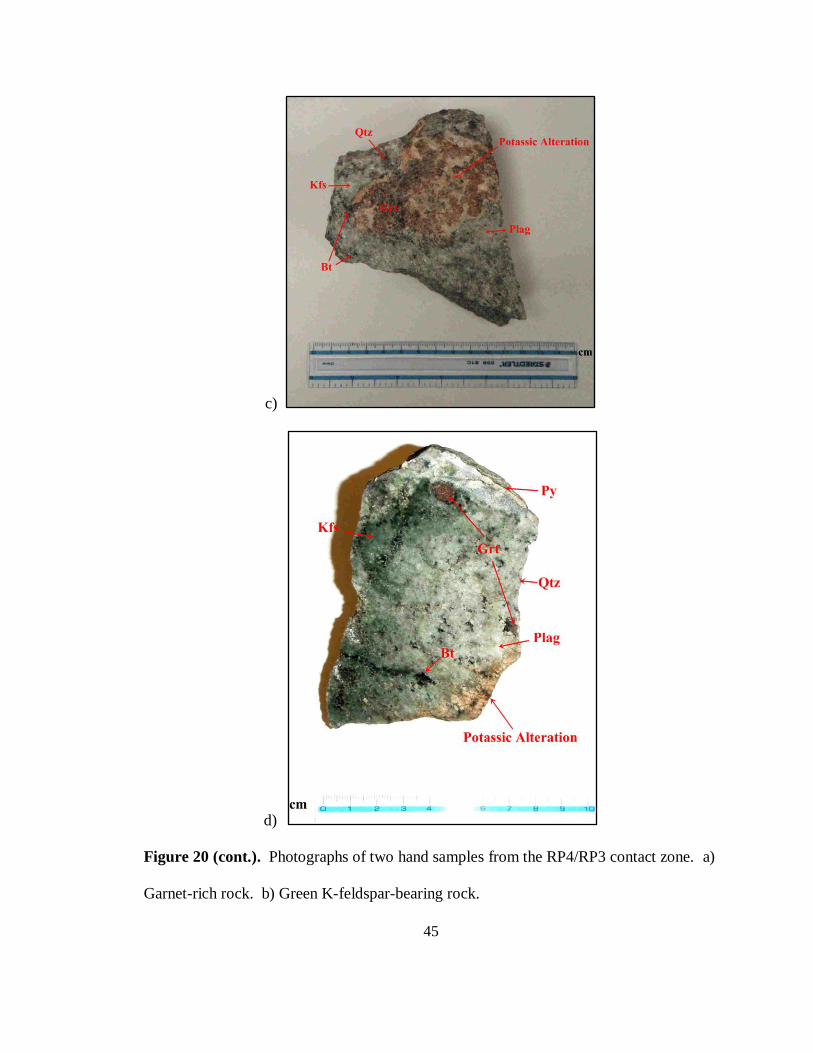
c)
d)
Figure 20 (cont.). Photographs of two hand samples from the RP4/RP3 contact zone. a)
Garnet-rich rock. b) Green K-feldspar-bearing rock.
46
13-08 transitioned from saprolite to quartzite at 65 ft BGS and penetrated RT4 at 104.4 ft
BGS. This core was stained purplish-red and encountered a highly weathered zone (no
recovery) near the base. Drillhole 14-08 encountered quartzite at 20 ft BGS and
penetrated more micaceous intervals. Recovery within the unit averaged 60% between
20 and 49 ft BGS. A clay filled void was intercepted between 49 and 58 ft BGS.
Between 58.5 ft and 89.0 ft BGS a highly weathered zone was penetrated yielding ≤ 10%
recovery; only smoky quartz vein material was recovered and the true bottom of this unit
is difficult to constrain. These voids may be attributed to a muscovite “burr rock” contact
zone as seen at the contact of RP1 and RP2. A weathered muscovite-rich zone may
easily be “washed” out through the drilling process.
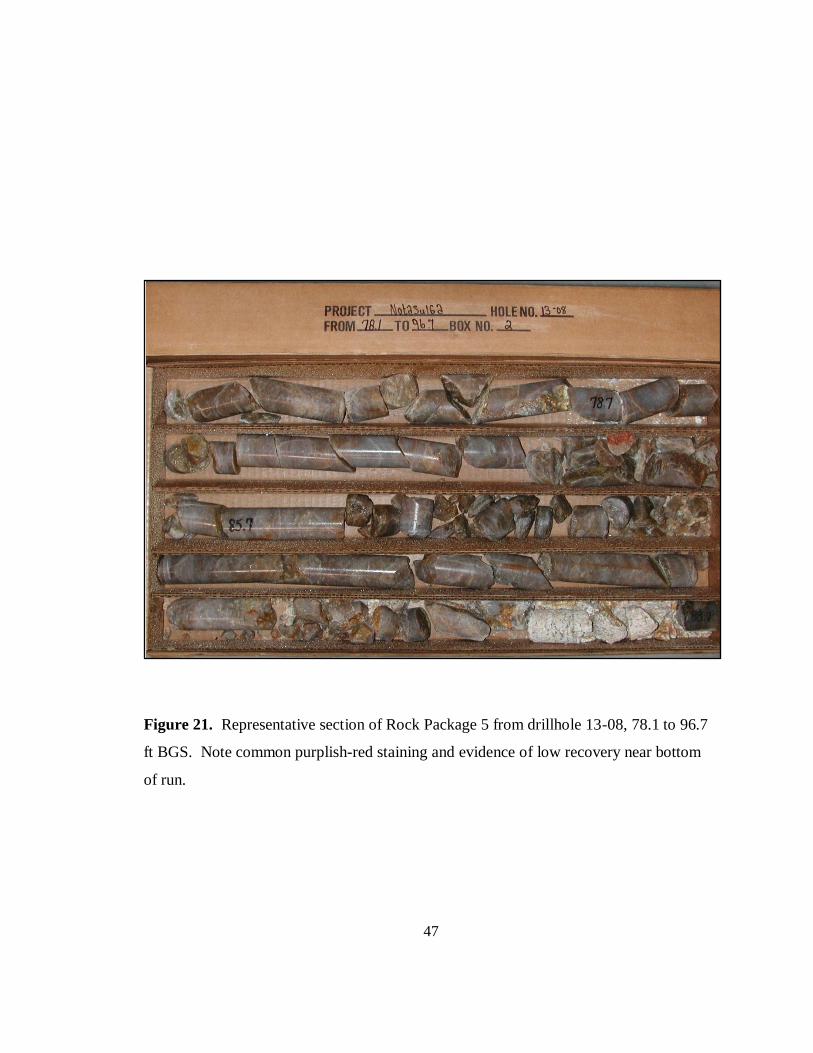
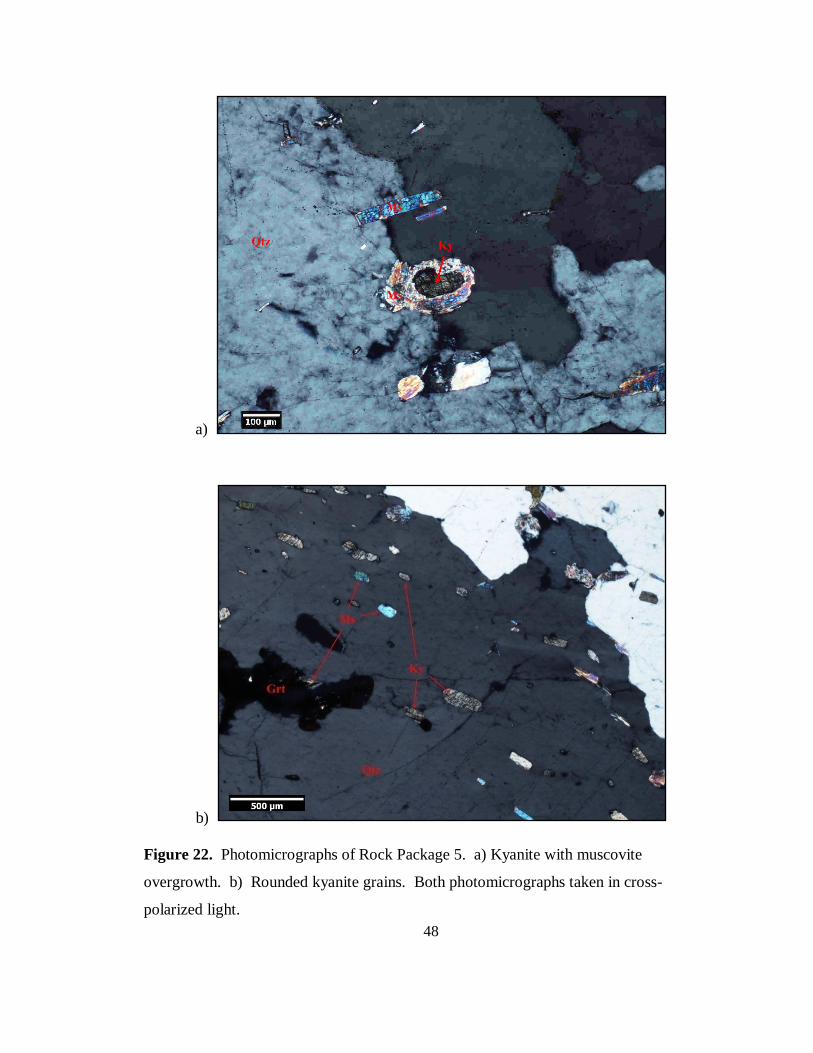
Quartzite is light gray to buff tan in hand sample and comprises chiefly medium-
to coarse-grained quartz with small flecks of muscovite and resorbed garnet (Fig. 21).
Petrographic analysis (Fig. 22) reveals small (<0.5 mm) rounded kyanite grains that
likely are detrital in origin. It is noted that although kyanite was also observed in
quartzite in RP1 but no grains displayed a rounded appearance as found in RP5.
Metamorphic foliation within the sample is defined by parallel layers of fine-grained (< 1
mm) muscovite and elongate, interlocking quartz grains.
Although RT5 was never fully penetrated by a drillhole it is interpreted that the
total thickness of the quartzite lithology is relatively thin, presumably less than 80 feet.
This is evidenced both by the ridge it that appears to “backbone” on the topographic map
(Fig. 4; Plate 1) as well as geophysical data (see Section III below). Units structually
above this quartzite were not penetrated by a drillhole (with the possible exception being
47
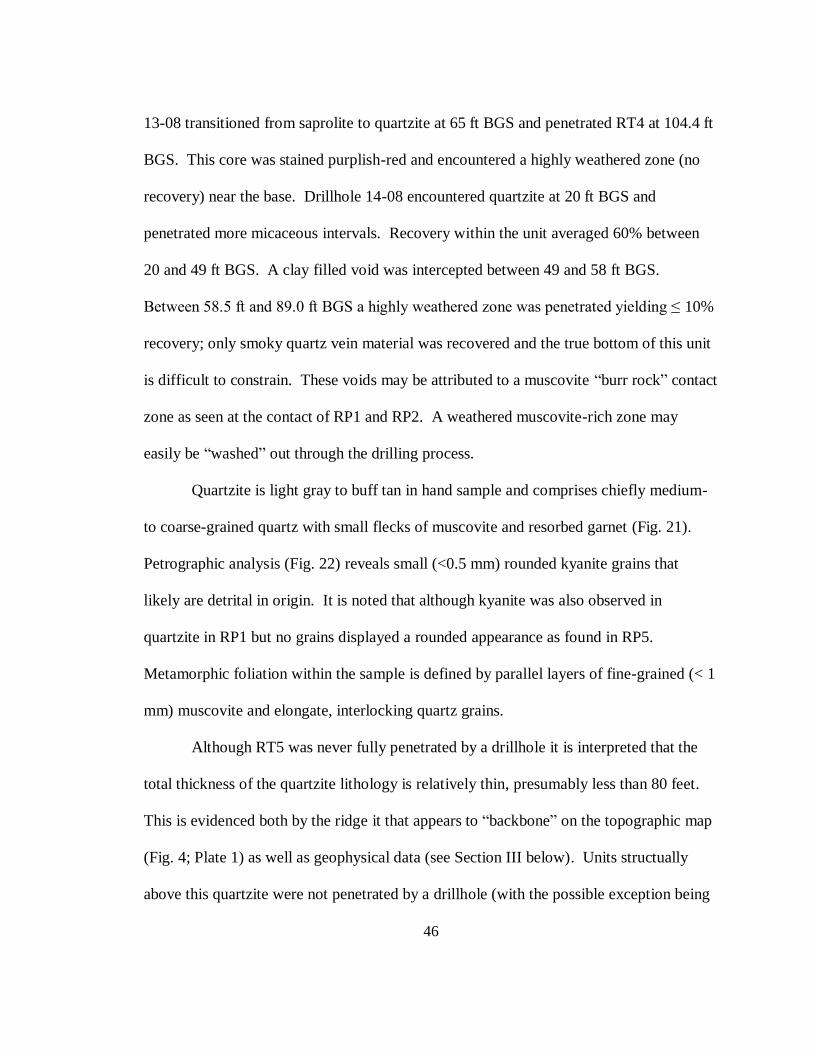
Figure 21. Representative section of Rock Package 5 from drillhole 13-08, 78.1 to 96.7
ft BGS. Note common purplish-red staining and evidence of low recovery near bottom
of run.
48
a)
b)
Figure 22. Photomicrographs of Rock Package 5. a) Kyanite with muscovite
overgrowth. b) Rounded kyanite grains. Both photomicrographs taken in cross-
polarized light.

49
15-08) and outcrops are limited. Due to these constraints, RP5 is only used to designate
this particularly clean quartzite layer; it may well be associated, however, with a
metasedimentary package such as that found within RP1.
50
III. GEOPHYSICAL INVESTIGATIONS
Electrical Resistivity
An electrical resistivity survey transect was performed across the northwestern
part of the study area (Fig. 23; Plate 1). The trend of the transect was N50ºW,
perpendicular to the strike of the bedrock to ensure data collection across the breadth of
the tectonostratigraphic section. A 48-channel AGI SuperSting® Automated Resistivity
Meter was employed for this survey. A command file for a Wenner Array was utilized
for programmed data collection. Electrodes were placed at a constant spacing of 5 meters
along the survey transect. A roll-along technique was used to increase productivity.
Location control was maintained with a sub-meter Trimble® GPS. Topographic control
was achieved through use of an auto-level and stadia rod.
Field data were subsequently processed using the EarthImager2D® resistivity
processing software package. The data were “cleaned” of any noisy data points and
corrected for static (topographic) influence. Data were processed through a 2-D
inversion method to compare calculated apparent resistivity data of a reconstructed model
to field-recorded values as a quality control measure. These were subsequently
interpreted to estimate the resistivity values of bedrock lithologies encountered.
The measured apparent resistivity, calculated resistivity, and inverted data are
illustrated in Figure 24A, 24B, and 24C, respectively. The data set required five iterations
51
Figure 23. Geophysical survey transect line. Both electrical resistivity and seismic
refraction survey lines are coincident from northwest to southeast. C.I. = 5 ft.
52
Fig
ure
24. D
ata
outp
ut
from
Ear
thIm
ager
2D
® s
how
ing (
A)
mea
sure
d a
ppar
ent
resi
stiv
ity, (B
) ca
lcula
ted a
ppar
ent
resi
stiv
ity,
and (
C)
true
resi
stiv
ity. U
nit
s ar
e in
met
ers
and o
hm
-m d
ue
to f
ield
coll
ecti
on p
aram
eter
s.
53
to converge and had a root mean squared (RMS) error of 2.76% and a L2-norm (L2)
value of 0.85. Both the RMS error and L2-norm values are measures of data misfit and
are well within the acceptable ranges for valid data as stated by Advanced Geosciences
Inc. (2002).
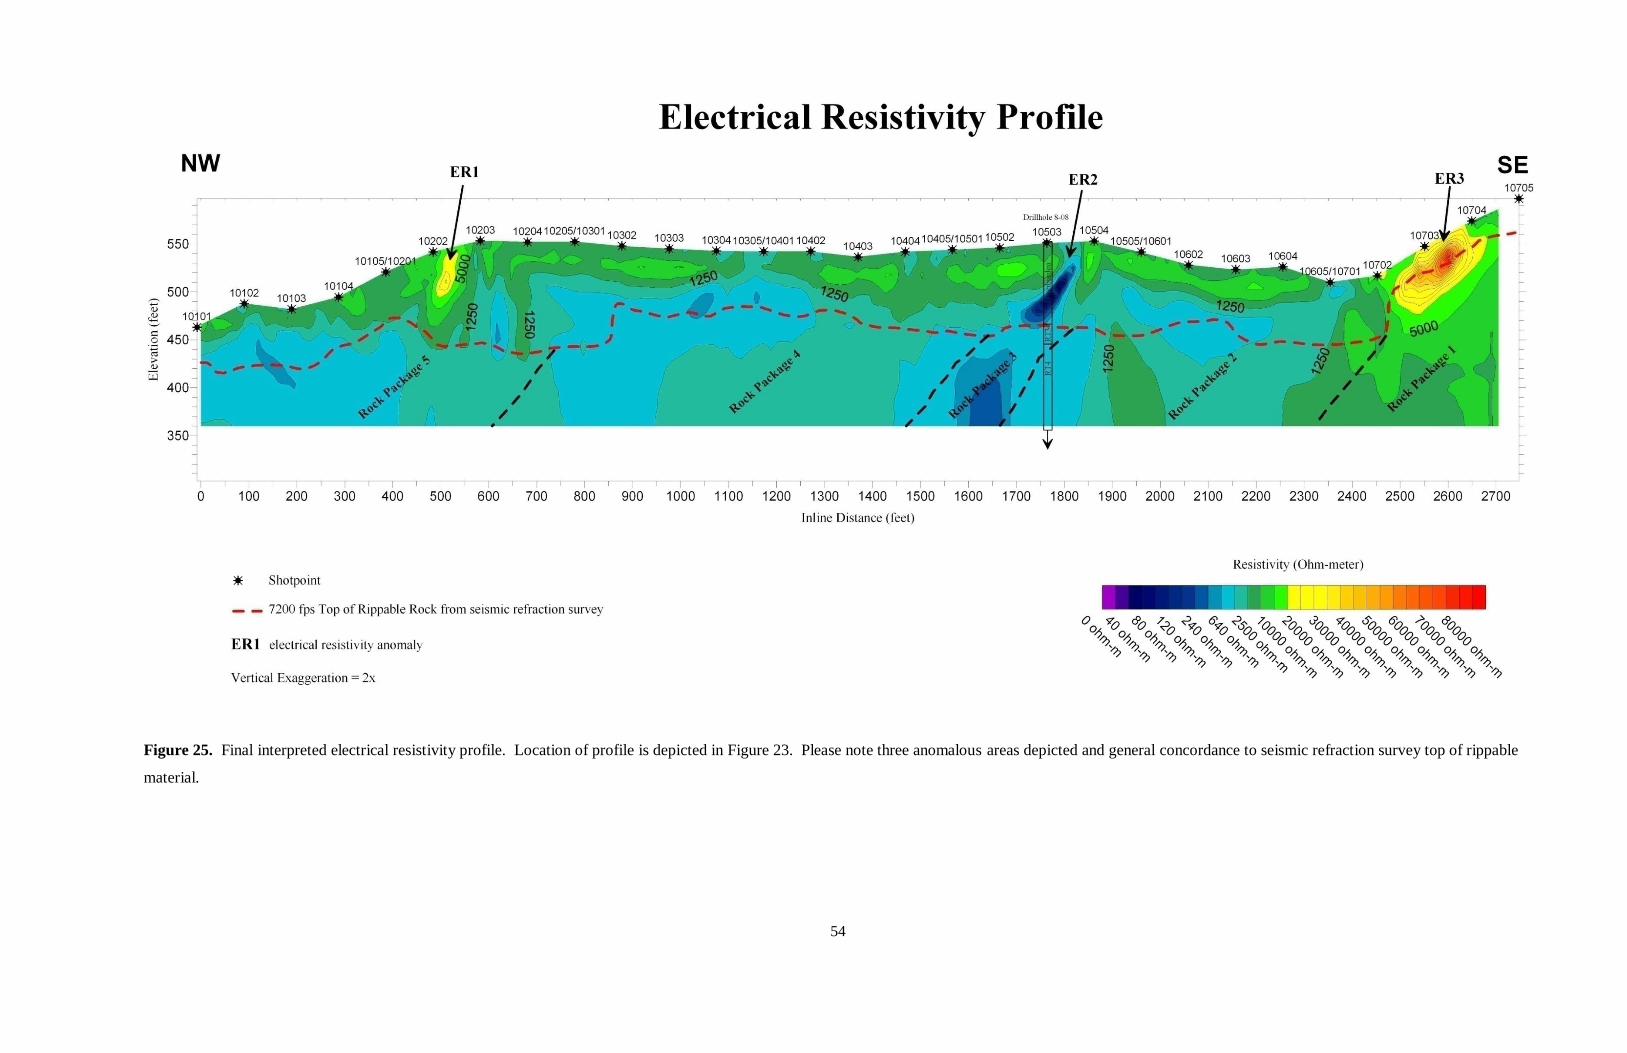
Figure 25 is the final interpreted electrical resistivity section. Three distinctive
anomalies are noted along the profile. Anomaly ER1 is the highly electrically resistive,
nearly vertical zone located at approximately 450 to 550 feet inline. Quartzite is a highly
electrically resistive type of metamorphic rock. This anomaly is interpreted to be a
tabular, steeply dipping unit of Saugahatchee Quartzite (RP5). The interpretation is
further supported by the slope gradient map (see below, Section IV) and penetration by
drillholes 13-08 and 14-08.
Anomaly ER2, located approximately 1700 to 1800 feet inline, is an electrically
conductive zone dipping towards the northwest coincident with the dip of the bedrock
(Fig. 25). This zone has multiple plausible interpretations. The first interpretation is an
electrically conductive mineralized zone coincident to a horizon or layer within the
bedrock. Moderate amounts of sulfide minerals (chalcopyrite, pyrite, and pyrrhotite)
were observed in outcrops and drill core by the author, particularly as noted along the
RP4/RP3 contact zone. Another interpretation is a late stage fault producing a conductive
argillaceous gouge or groundwater conduit. Such argillaceous gouge zones were
observed along late faults in parts of the quarry. Thirdly, the anomaly may represent a
more conductive lithology than the surrounding bedrock units. The author favors this
third interpretation. The position of the anomaly projects into RP3, which locally
contains graphitic biotite schist. RP3 also contains the greatest amount of sulfide
54
Figure 25. Final interpreted electrical resistivity profile. Location of profile is depicted in Figure 23. Please note three anomalous areas depicted and general concordance to seismic refraction survey top of rippable
material.

55
mineralization of all five of the major rock packages. The anomaly may correlate to the
actual contact zone between RP4 and RP3, which could further increase the magnitude of
the anomaly. This interpretation is also supported by the relatively more conductive
material continuing at depth along the projected dip of the unit. In addition, drillhole 8-
08 (Plate 1) is located directly southwest along strike from shotpoint 10503
(approximately 1,750 feet inline distance) and intercepted RP3 at 86.0 feet BGS.
A shallow highly resistive zone located approximately 2,500 to 2,650 feet inline
near the southeastern end of the transect represents anomaly ER3 (Fig. 25). This resistive
zone is located near the surface and is interpreted to be an electrically resistive unit, most
likely quartzite. The shallow depth of the anomaly also supports quartzite, which is very
resistant to physical and/or chemical weathering. Drillhole intercepts and outcrops
support the conclusion that the anomaly is a result of data collected over RP1. The
anomaly increases in depth near the terminus of the survey line where a large spoil pile
increases the depth to rock.
Seismic Refraction
Seismic refraction is a geophysical method that obtains subsurface information
from a surface survey. The method measures travel times of seismic waves, from which
velocities are calculated. The seismic refraction transect was coincident with the
electrical resistivity transect to constrain accurate interpretation of the two results (Fig.
23). A 48-channel Geometrics Strataview® seismograph with 30-hertz Geospace
Digiphone® geophones were utilized in the survey. Only 24 channels were gathered per
shot point due to the expected cultural seismic noise as a result of mining operations.
56
Geophones were placed every 5 meters along the survey transect. The 24-channel
spreads contained five shot points (-5 meters from channel 1, between channels 6 and 7,
between channels 12 and 13, between channels 17 and 18, and +5 meters from channel
24). Shotpoints were named in a line-spread-shot sequence (e.g., shotpoint 10305
represents Line 1, Spread 3, Shot 5). A 12-gauge Betsy Seisgun® (blank rounds) was
used as the seismic source. Locations were recorded with a sub-meter Trimble® GPS.
Topographic control was achieved through auto-level and stadia rod leveling methods.
Field data were processed utilizing the SeisImager/2D® modeling software
package. First P-wave inflections were picked for all channels, unless the signal-to-noise
ratio was too low to allow for confident interpretation. Picking accuracy was within 2
milliseconds. The first breaks were subsequently plotted on a time-distance graph.
Seismic velocity layers were assigned based upon common slope angles obtained visually
from the time-distance graph. A transect topography file was added to the data set to
negate the effects of elevation change intrinsic to the data. The data were then modeled
through an inversion process to constrain the seismic velocity of layers encountered. The
data were subsequently interpreted to estimate the top of rock surface, structural features,
and the approximate seismic velocities of bedrock lithologies encountered.
Figure 26 illustrates the P-wave first arrival picks and subsequent inflection of
slope as the seismic ray became critically refracted along the overburden-rock interface.
This first inflection of slope was given a different layer assignment, as it represents an
increase in seismic velocity. Observed and modeled values are depicted on the chart.
57
Figure 26. Time-distance graph of first p-wave arrival times. Smooth lines represent field data “first break” picks and subsequent layer assignments chosen by the author. Noded lines represent calculated values for
the inversion model. Units are in meters due to field collection parameters.
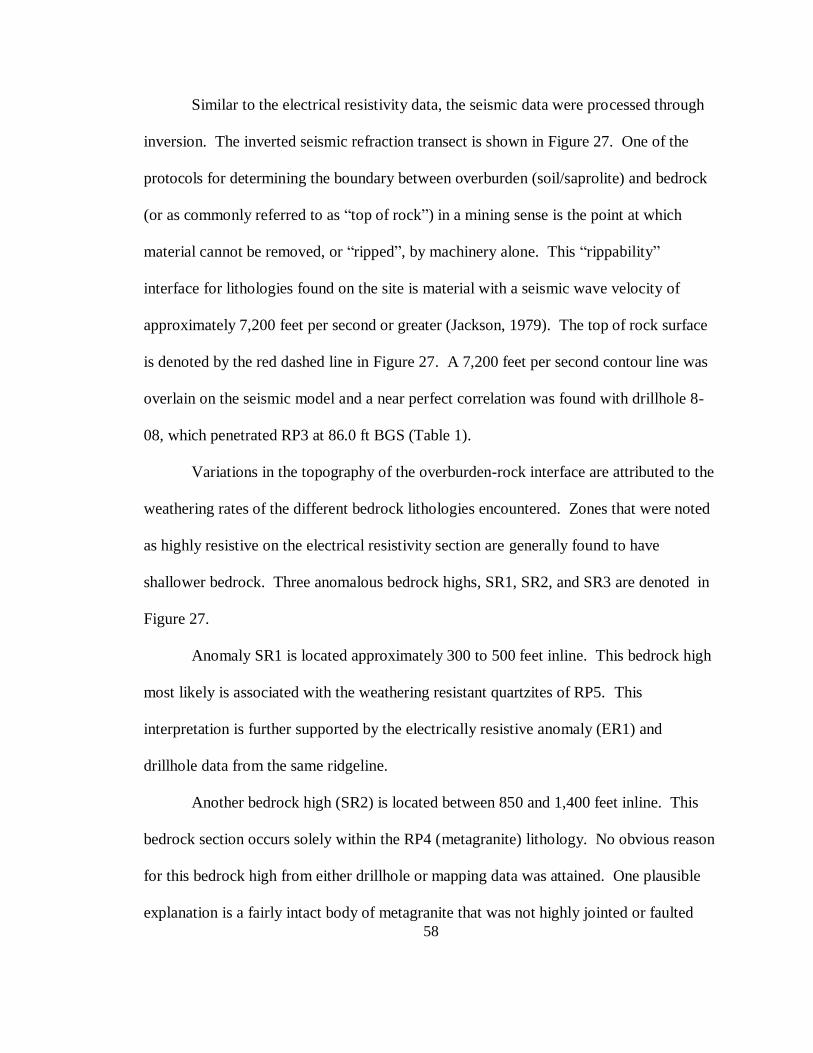
58
Similar to the electrical resistivity data, the seismic data were processed through
inversion. The inverted seismic refraction transect is shown in Figure 27. One of the
protocols for determining the boundary between overburden (soil/saprolite) and bedrock
(or as commonly referred to as “top of rock”) in a mining sense is the point at which
material cannot be removed, or “ripped”, by machinery alone. This “rippability”
interface for lithologies found on the site is material with a seismic wave velocity of
approximately 7,200 feet per second or greater (Jackson, 1979). The top of rock surface
is denoted by the red dashed line in Figure 27. A 7,200 feet per second contour line was
overlain on the seismic model and a near perfect correlation was found with drillhole 8-
08, which penetrated RP3 at 86.0 ft BGS (Table 1).
Variations in the topography of the overburden-rock interface are attributed to the
weathering rates of the different bedrock lithologies encountered. Zones that were noted
as highly resistive on the electrical resistivity section are generally found to have
shallower bedrock. Three anomalous bedrock highs, SR1, SR2, and SR3 are denoted in
Figure 27.
Anomaly SR1 is located approximately 300 to 500 feet inline. This bedrock high
most likely is associated with the weathering resistant quartzites of RP5. This
interpretation is further supported by the electrically resistive anomaly (ER1) and
drillhole data from the same ridgeline.
Another bedrock high (SR2) is located between 850 and 1,400 feet inline. This
bedrock section occurs solely within the RP4 (metagranite) lithology. No obvious reason
for this bedrock high from either drillhole or mapping data was attained. One plausible
explanation is a fairly intact body of metagranite that was not highly jointed or faulted
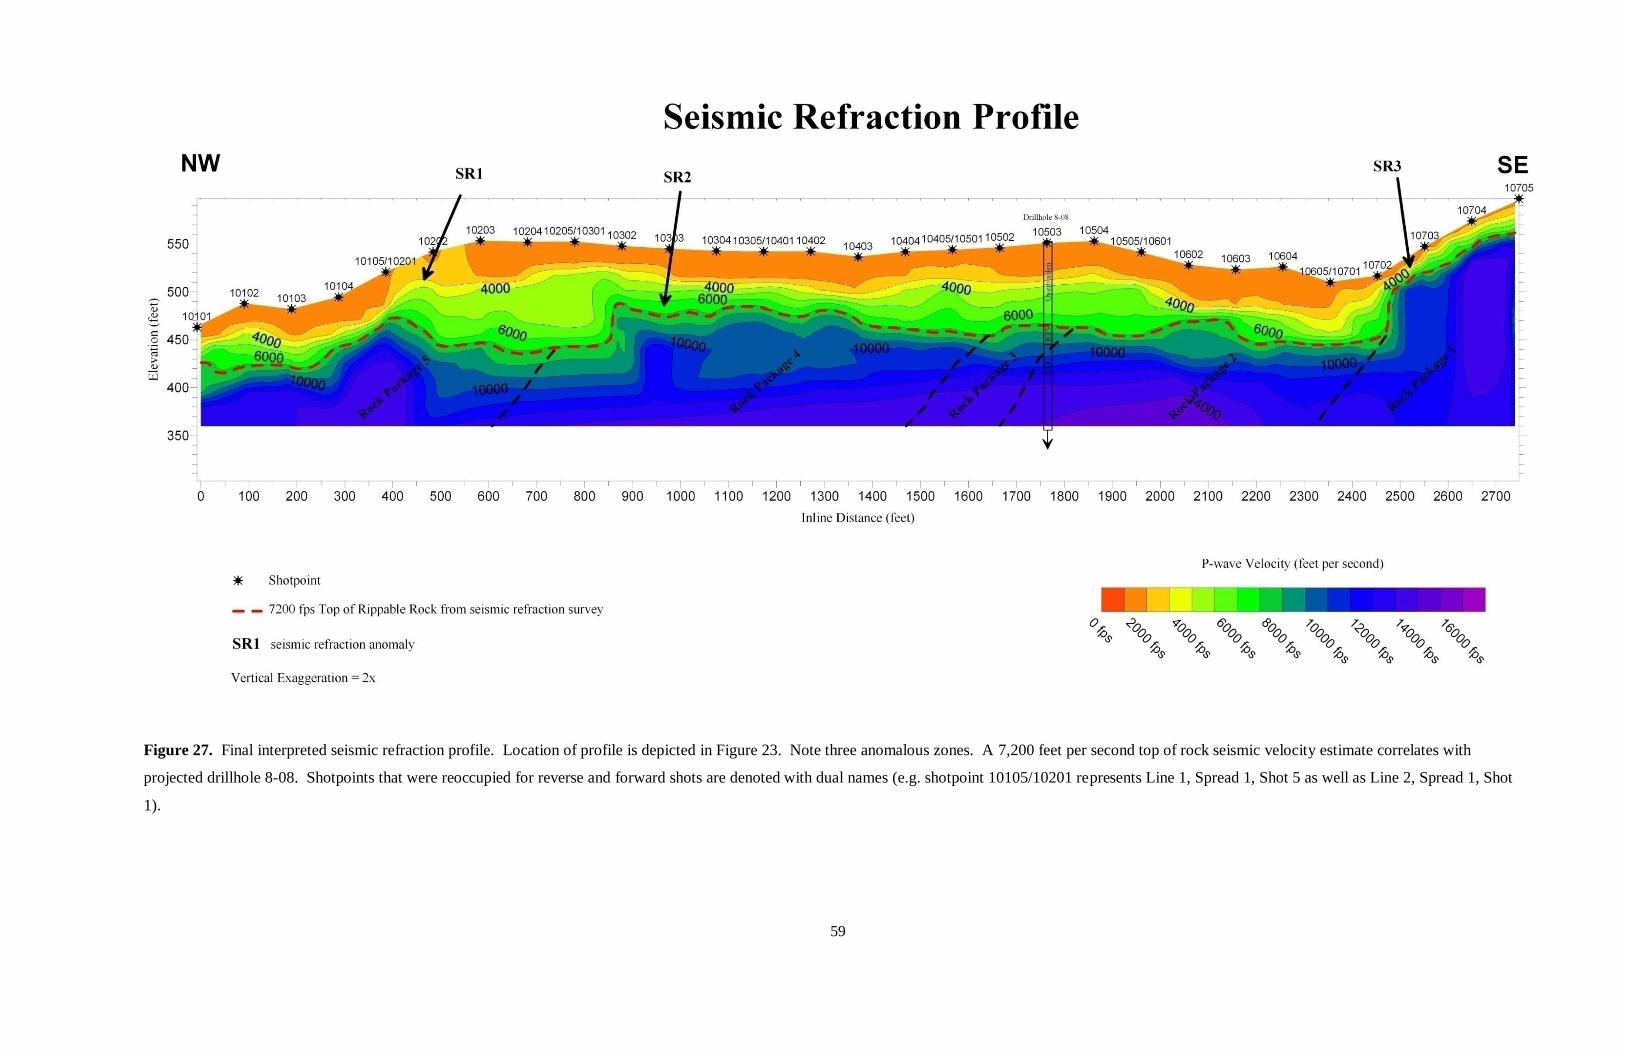
59
Figure 27. Final interpreted seismic refraction profile. Location of profile is depicted in Figure 23. Note three anomalous zones. A 7,200 feet per second top of rock seismic velocity estimate correlates with
projected drillhole 8-08. Shotpoints that were reoccupied for reverse and forward shots are denoted with dual names (e.g. shotpoint 10105/10201 represents Line 1, Spread 1, Shot 5 as well as Line 2, Spread 1, Shot
1).
60
and therefore more resistant to weathering. The Farmville Metagranite is known to
commonly form pavement surface exposures (Steltenpohl et al., 1990), which may be
inferred to happen at depth as well.
Anomaly SR3 is a bedrock high located near 2,475 feet inline and continuing past
the end of the survey line. This abrupt change corresponds to surface topography as a
small stream valley found at the toe of the slope. Shallow bedrock of anomaly SR3 is
attributed to the slight regolith covering metasedimentary package RP1. The dramatic
increase in top of rock elevation is interpreted to correspond to a competent quartzite unit
within RP1. This is supported by both drillhole data and interpretations from the
electrical resistivity survey. The top of rock slope deflects to a lesser gradient near the
end of the line (approximately 2,650 feet inline). Field investigation indicates that the top
the ridge was used as a spoil dumping ground by mining operations, artificially
increasing the depth to bedrock.
The seismic refraction anomalies SR1 and SR3 correspond to the electrical
resistivity anomalies ER1 and ER3, respectively. Anomaly SR2, a bedrock high, is not
apparent conclusively on the electrical resistivity section. This may be a result of high
surficial (sand) contact resistance muting electrical signal from depth near that location.
Likewise, electrical resistivity anomaly ER2 is not noticeable on the seismic refraction
profile. This is attributed the lack of seismic velocity contrast, yet high electrical
resistivity contrast of the subsurface material.
61
IV. STRUCTURE AND METAMORPHISM
Joint Mapping
Joints were mapped along exposed highwalls within the open mine (Fig. 28).
Discretion was used to only measure definitive joint patterns and not blast-induced, off-
axis fracturing. To the author’s knowledge this is the first comprehensive joint survey to
be completed within the Opelika Complex due to the lack of exposure found elsewhere.
Joint attitudes were taken employing a Brunton® pocket transit compass from a distance
to ensure safety from rock fall. Parallax (visual “lining up” of near objects with distant
objects) along joint planes was utilized to ensure true strike bearing. Only “open”
fracture joints were recorded, as vein (or “filled”) joint attitudes were unattainable due to
the two dimensional exposure within the highwall. Many of the joints may be zones of
oriented, inherent weakness within the bedrock that fractures as a result of blasting. Joint
field data were subsequently plotted on both rose diagrams and pole-to-plane stereonets.
A total of 244 joint attitudes were measured from highwalls exposed within the
quarry. Joints are selectively exposed as a function of highwall orientation. Joints
striking parallel to sub-parallel coincident to the strike of the highwall will have a limited
exposure within that highwall and therefore a disproportionately lower percentage of
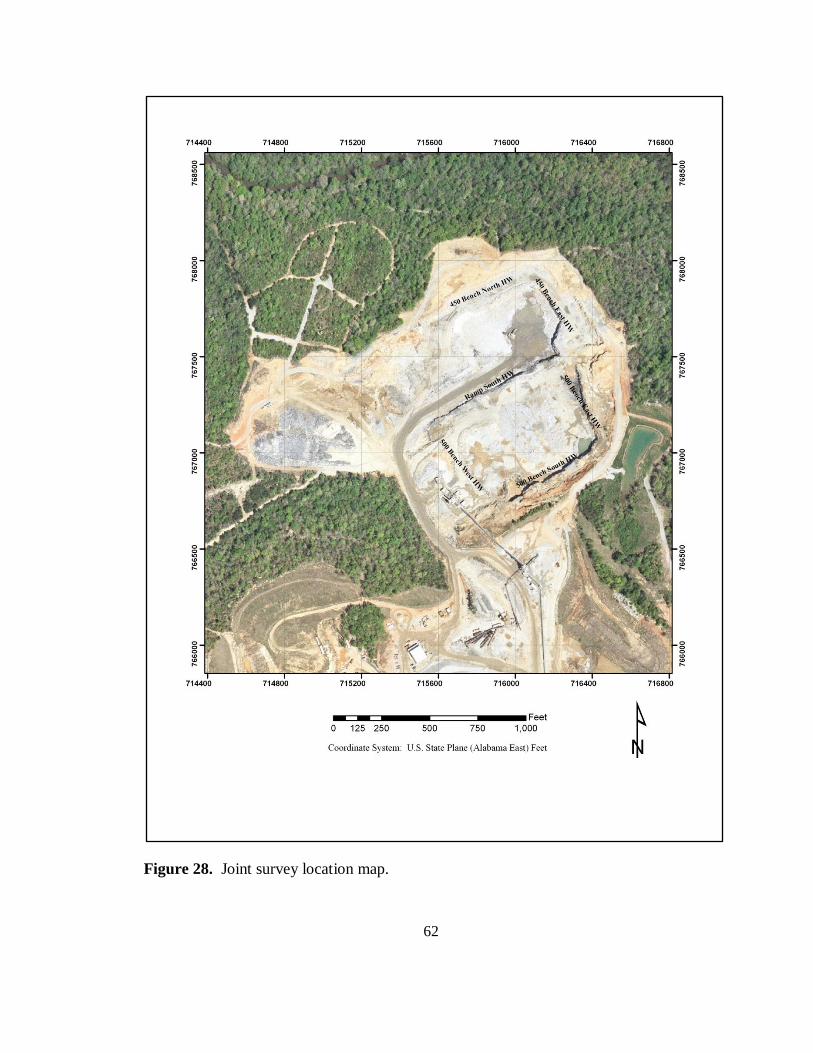
62
Figure 28. Joint survey location map.
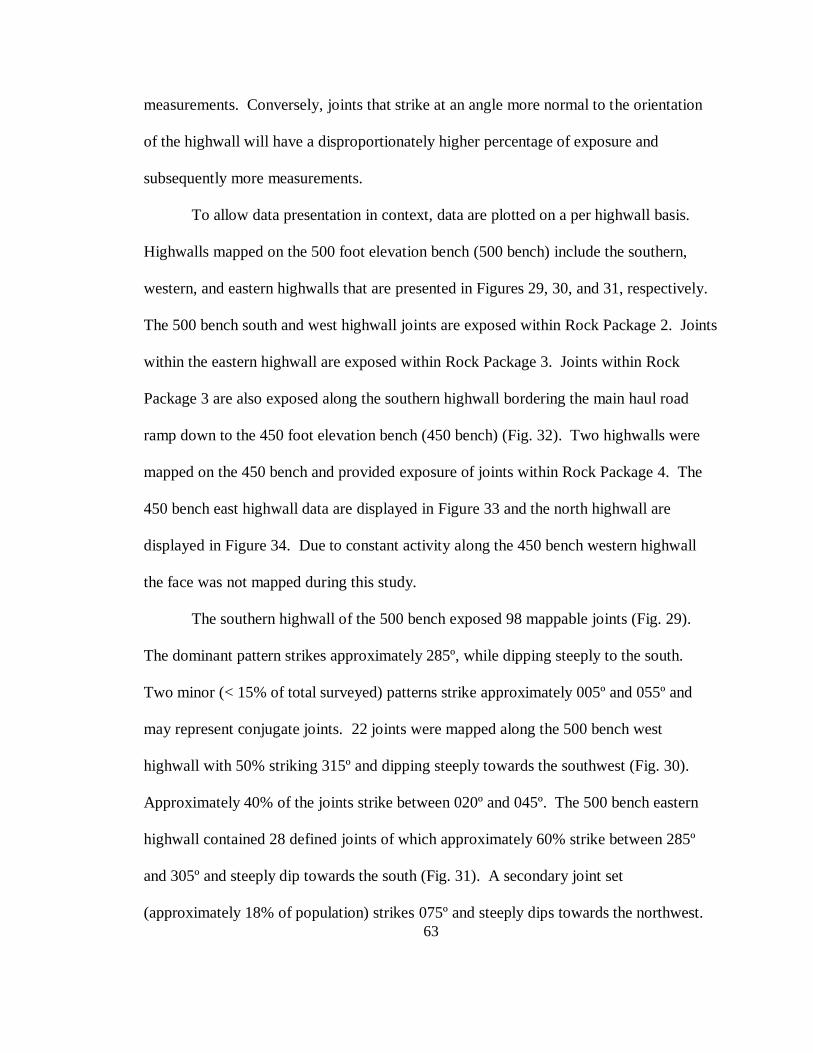
63
measurements. Conversely, joints that strike at an angle more normal to the orientation
of the highwall will have a disproportionately higher percentage of exposure and
subsequently more measurements.
To allow data presentation in context, data are plotted on a per highwall basis.
Highwalls mapped on the 500 foot elevation bench (500 bench) include the southern,
western, and eastern highwalls that are presented in Figures 29, 30, and 31, respectively.
The 500 bench south and west highwall joints are exposed within Rock Package 2. Joints
within the eastern highwall are exposed within Rock Package 3. Joints within Rock
Package 3 are also exposed along the southern highwall bordering the main haul road
ramp down to the 450 foot elevation bench (450 bench) (Fig. 32). Two highwalls were
mapped on the 450 bench and provided exposure of joints within Rock Package 4. The
450 bench east highwall data are displayed in Figure 33 and the north highwall are
displayed in Figure 34. Due to constant activity along the 450 bench western highwall
the face was not mapped during this study.
The southern highwall of the 500 bench exposed 98 mappable joints (Fig. 29).
The dominant pattern strikes approximately 285º, while dipping steeply to the south.
Two minor (< 15% of total surveyed) patterns strike approximately 005º and 055º and
may represent conjugate joints. 22 joints were mapped along the 500 bench west
highwall with 50% striking 315º and dipping steeply towards the southwest (Fig. 30).
Approximately 40% of the joints strike between 020º and 045º. The 500 bench eastern
highwall contained 28 defined joints of which approximately 60% strike between 285º
and 305º and steeply dip towards the south (Fig. 31). A secondary joint set
(approximately 18% of population) strikes 075º and steeply dips towards the northwest.
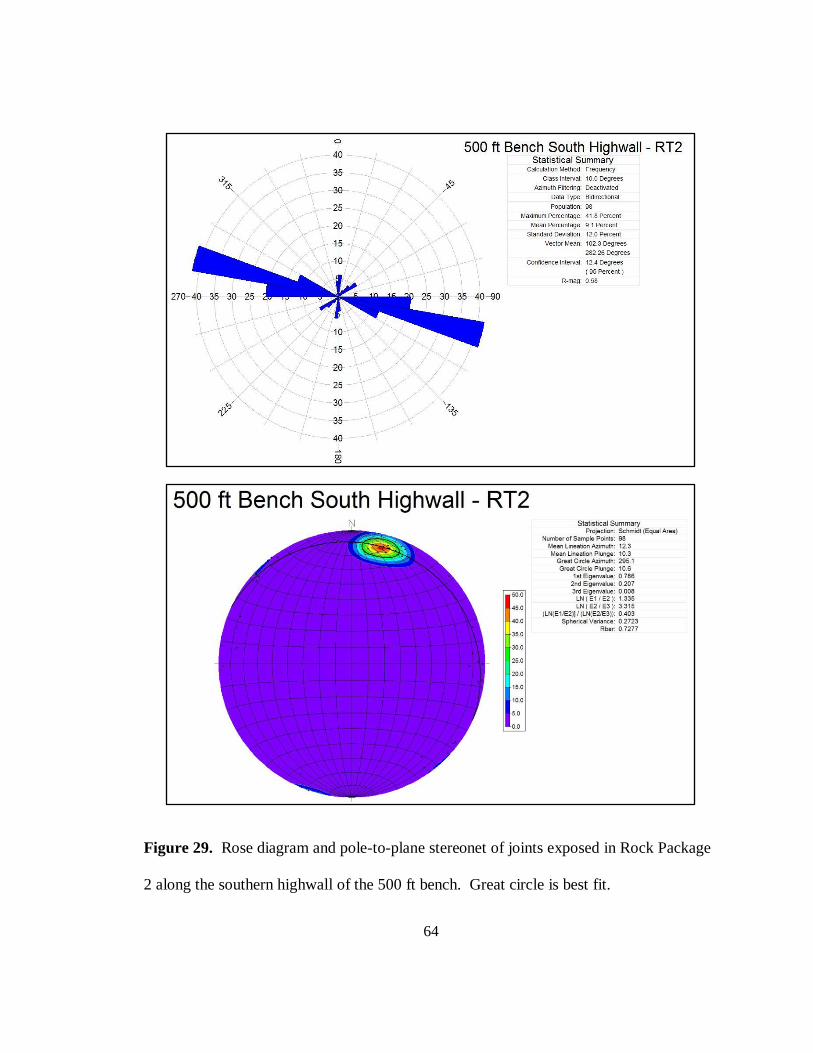
64
Figure 29. Rose diagram and pole-to-plane stereonet of joints exposed in Rock Package
2 along the southern highwall of the 500 ft bench. Great circle is best fit.
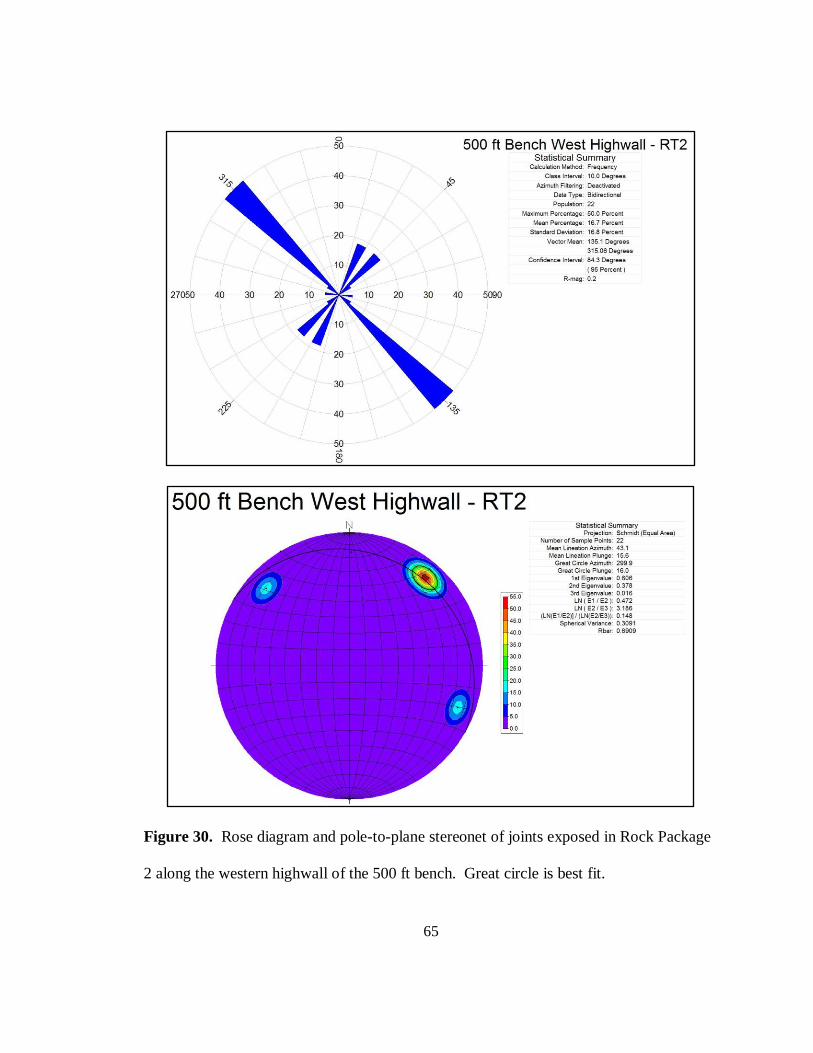
65
Figure 30. Rose diagram and pole-to-plane stereonet of joints exposed in Rock Package
2 along the western highwall of the 500 ft bench. Great circle is best fit.
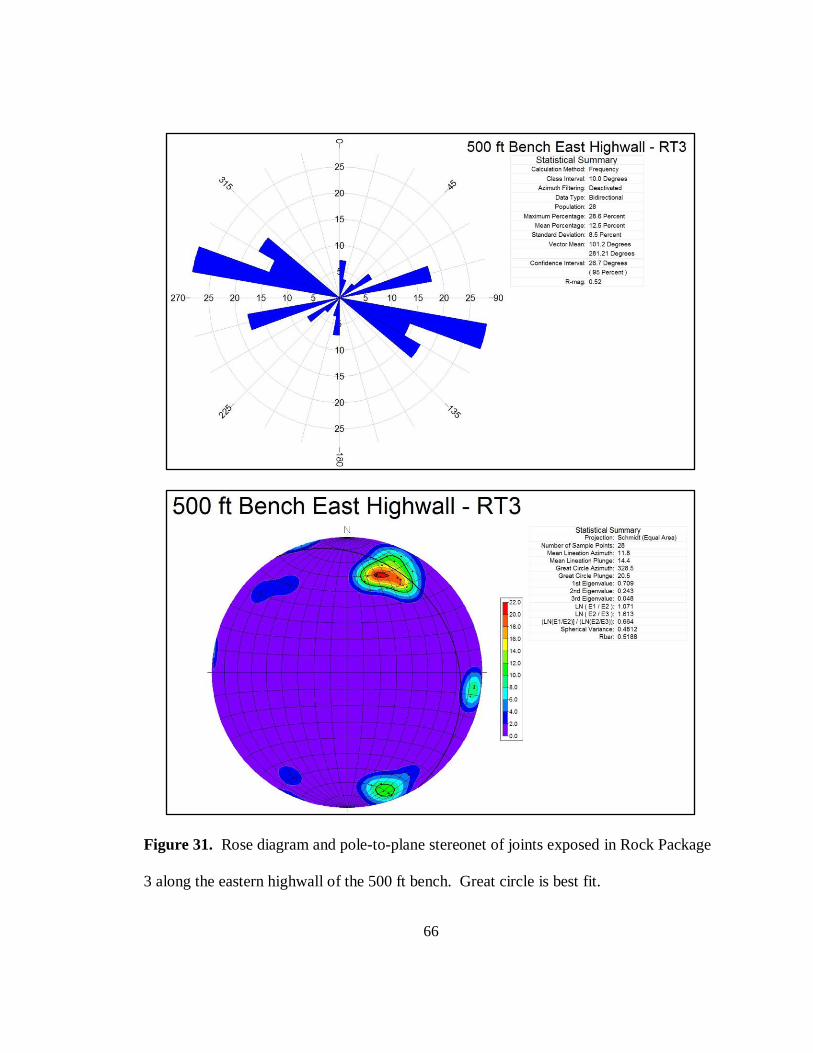
66
Figure 31. Rose diagram and pole-to-plane stereonet of joints exposed in Rock Package
3 along the eastern highwall of the 500 ft bench. Great circle is best fit.
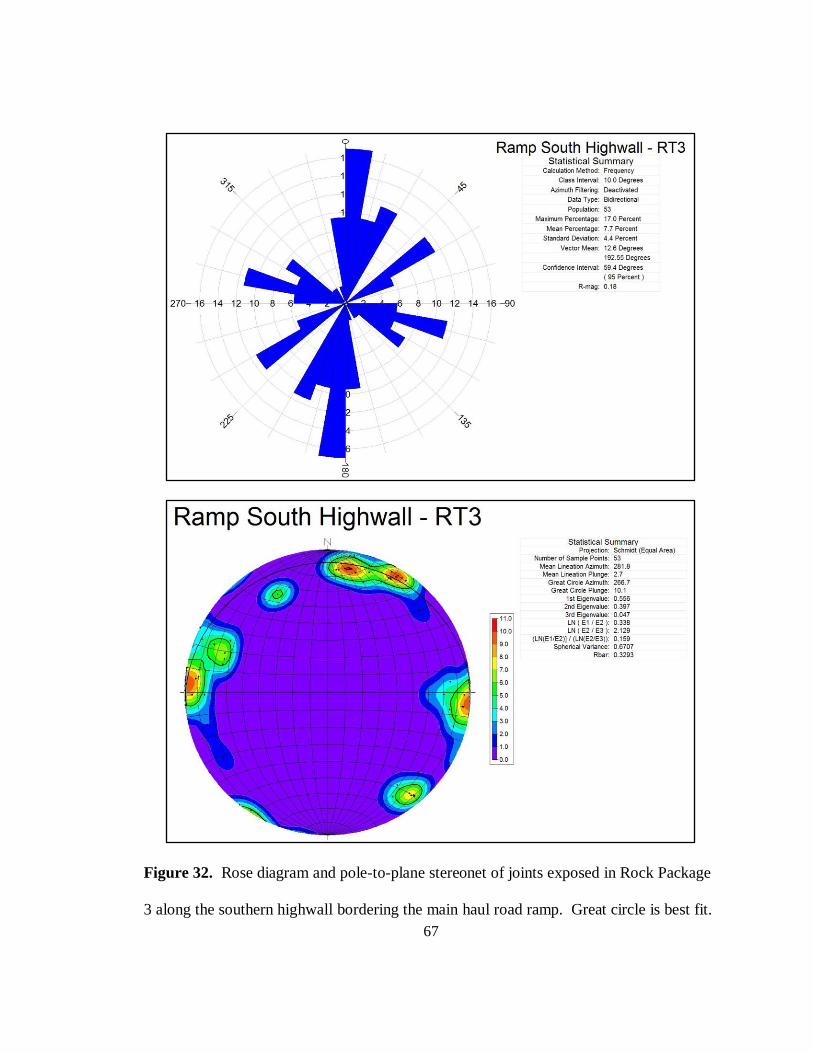
67
Figure 32. Rose diagram and pole-to-plane stereonet of joints exposed in Rock Package
3 along the southern highwall bordering the main haul road ramp. Great circle is best fit.
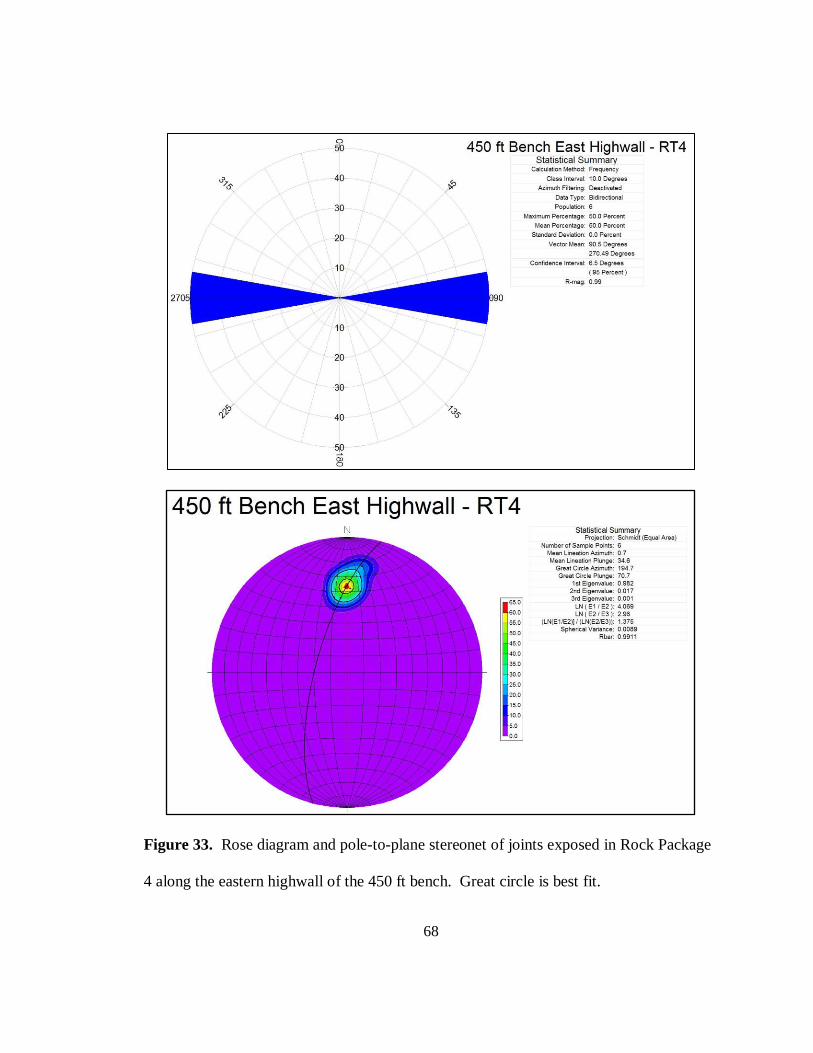
68
Figure 33. Rose diagram and pole-to-plane stereonet of joints exposed in Rock Package
4 along the eastern highwall of the 450 ft bench. Great circle is best fit.
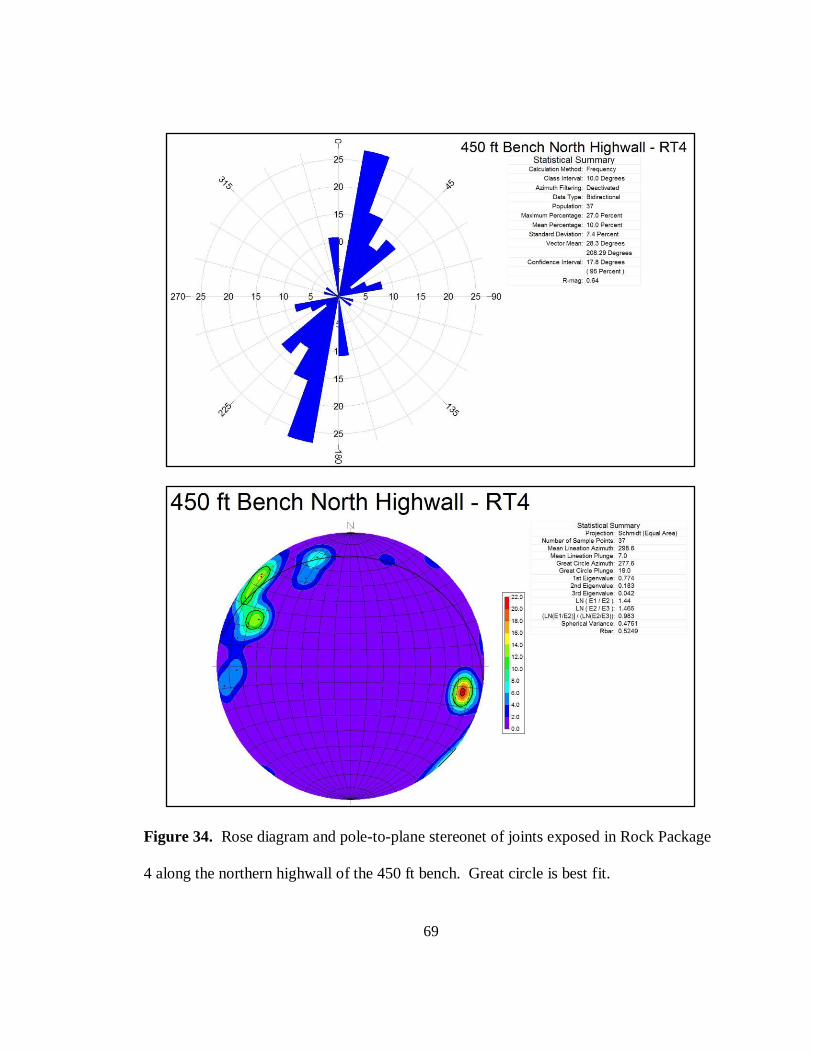
69
Figure 34. Rose diagram and pole-to-plane stereonet of joints exposed in Rock Package
4 along the northern highwall of the 450 ft bench. Great circle is best fit.
70
The southern highwall bounding the main ramp to the 450 bench exposed a vast
array of joint attitudes from 53 measurements (Fig. 32). Approximately 46% of the joints
strike between 355º and 025º and dip nearly vertical to either the east or the west. Two
additional conjugate sets (each constituting 11% of the population) are evident, striking
285º and 055º while dipping steeply to the south or northwest, respectively. The
remaining joints may be related to the 285º set.
The eastern highwall of the 450 bench presented limited exposure at the time this
study was undertaken, with only 6 joint planes exposed (Fig. 33). The joints average
east-west (090º) and dip towards the south. The northern highwall had a measured joint
population of 37 (Fig. 34). The dominant set (27%) strikes 015º and dips steeply towards
the west.
A compilation of all measured joint data within the quarry is displayed in Figure
35. The joints are assumed to be systematic due to their repeatability. However,
outcrops were limited to highwall faces as surficial pavement type exposures were not
found within the property boundaries. The compiled data document one prominent joint
set striking approximately 285º and two subordinate sets averaging 015º and 050º,
respectively. The 285º and 015º joint sets converge at a dihedral angle of 100º in an
orthogonal joint system relationship. The subordinate 050º joint set forms a conjugate
joint system with both the 285º and 015º joint sets, with dihedral angles of 55º and 35º,
respectively.
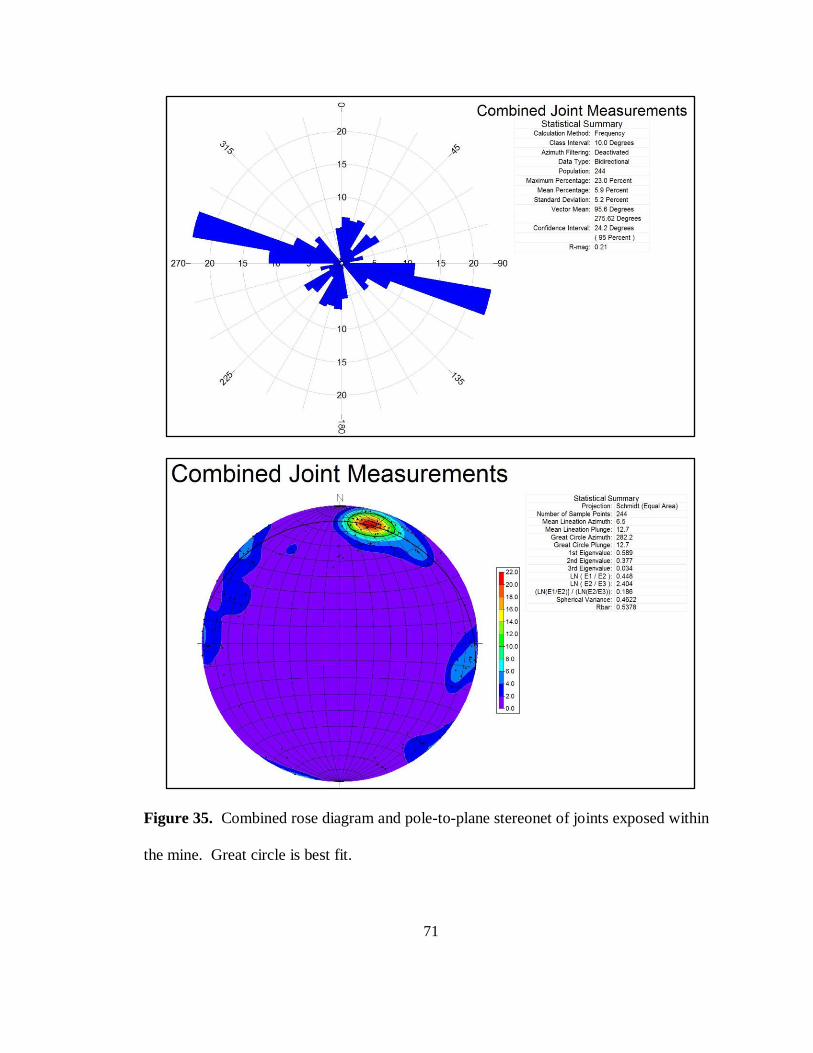
71
Figure 35. Combined rose diagram and pole-to-plane stereonet of joints exposed within
the mine. Great circle is best fit.
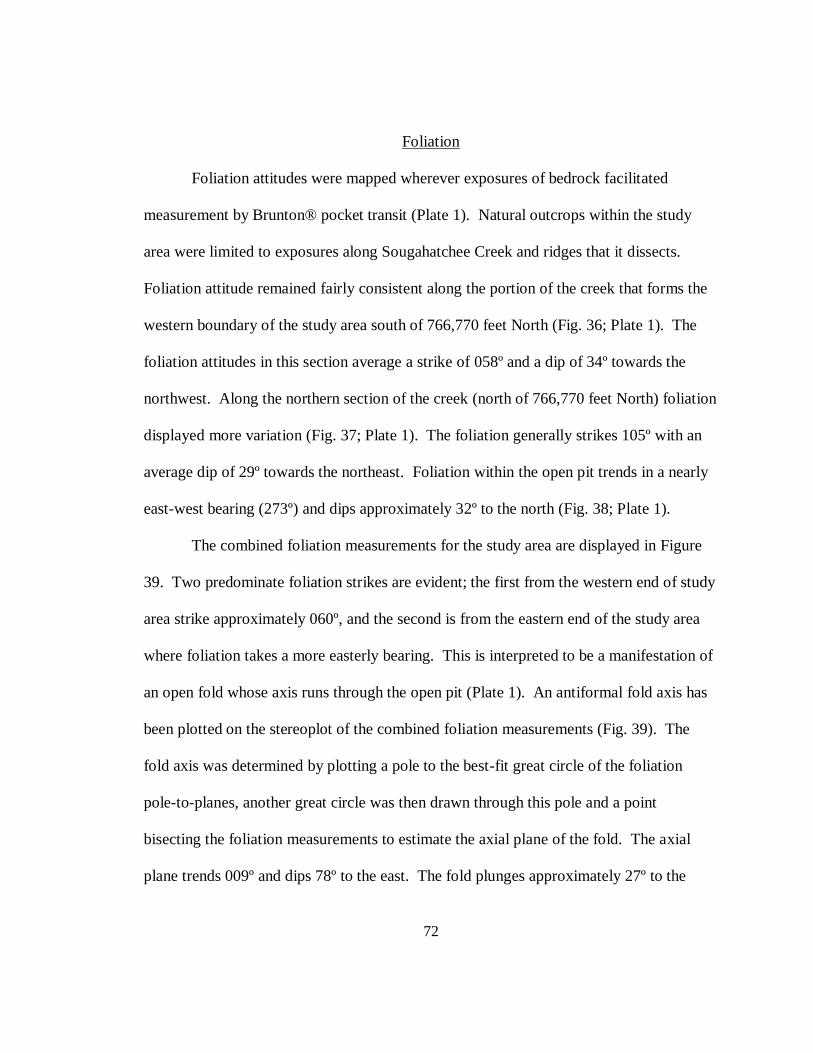
72
Foliation
Foliation attitudes were mapped wherever exposures of bedrock facilitated
measurement by Brunton® pocket transit (Plate 1). Natural outcrops within the study
area were limited to exposures along Sougahatchee Creek and ridges that it dissects.
Foliation attitude remained fairly consistent along the portion of the creek that forms the
western boundary of the study area south of 766,770 feet North (Fig. 36; Plate 1). The
foliation attitudes in this section average a strike of 058º and a dip of 34º towards the
northwest. Along the northern section of the creek (north of 766,770 feet North) foliation
displayed more variation (Fig. 37; Plate 1). The foliation generally strikes 105º with an
average dip of 29º towards the northeast. Foliation within the open pit trends in a nearly
east-west bearing (273º) and dips approximately 32º to the north (Fig. 38; Plate 1).
The combined foliation measurements for the study area are displayed in Figure
39. Two predominate foliation strikes are evident; the first from the western end of study
area strike approximately 060º, and the second is from the eastern end of the study area
where foliation takes a more easterly bearing. This is interpreted to be a manifestation of
an open fold whose axis runs through the open pit (Plate 1). An antiformal fold axis has
been plotted on the stereoplot of the combined foliation measurements (Fig. 39). The
fold axis was determined by plotting a pole to the best-fit great circle of the foliation
pole-to-planes, another great circle was then drawn through this pole and a point
bisecting the foliation measurements to estimate the axial plane of the fold. The axial
plane trends 009º and dips 78º to the east. The fold plunges approximately 27º to the
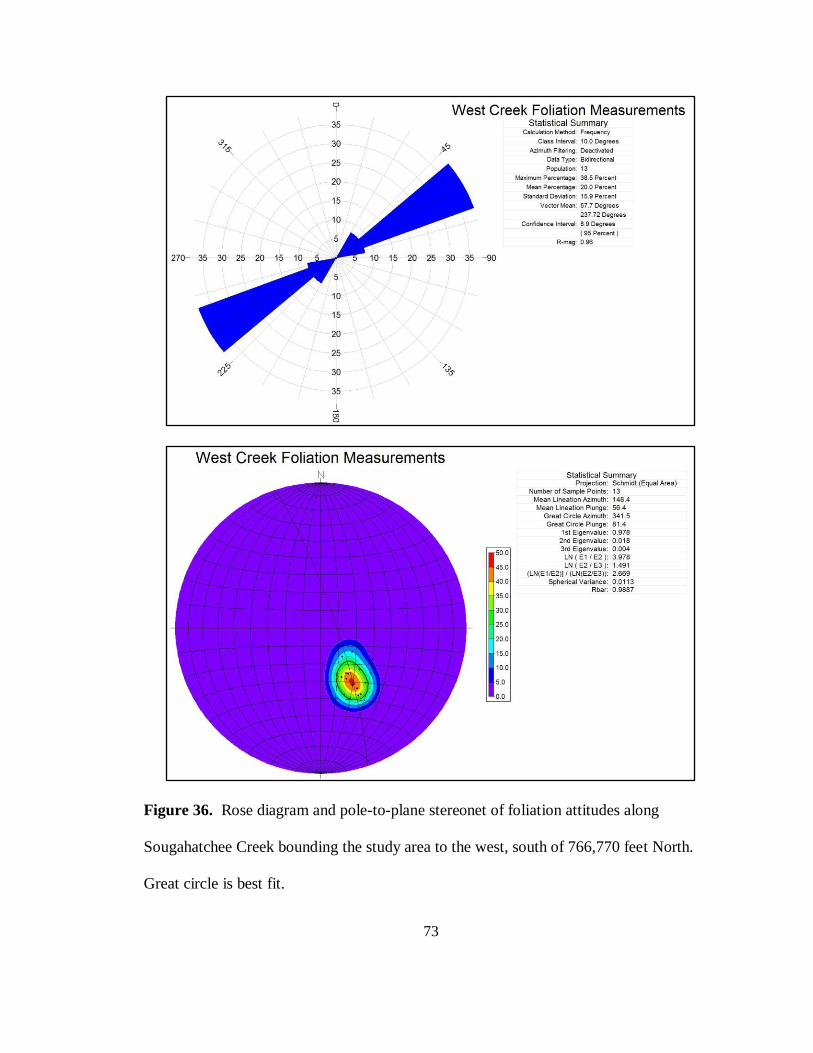
73
Figure 36. Rose diagram and pole-to-plane stereonet of foliation attitudes along
Sougahatchee Creek bounding the study area to the west, south of 766,770 feet North.
Great circle is best fit.
74
Figure 37. Rose diagram and pole-to-plane stereonet of foliation attitudes along
Sougahatchee Creek north of 766,770 feet North. Great circle is best fit.
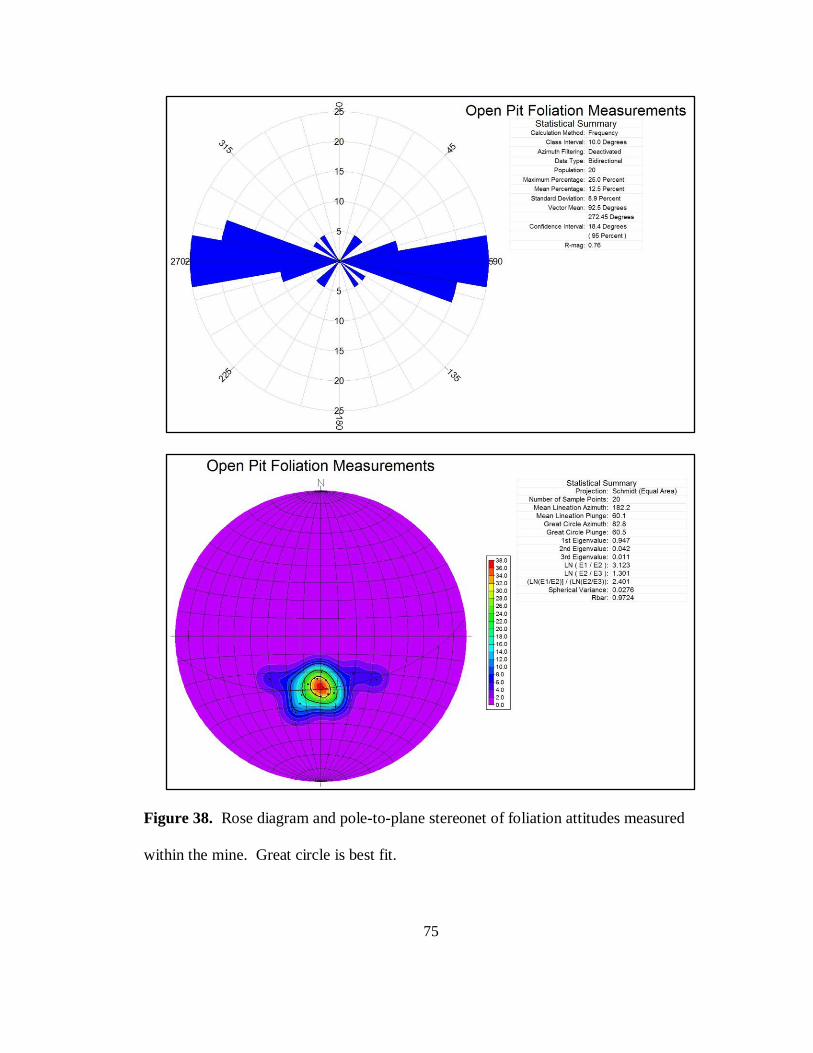
75
Figure 38. Rose diagram and pole-to-plane stereonet of foliation attitudes measured
within the mine. Great circle is best fit.
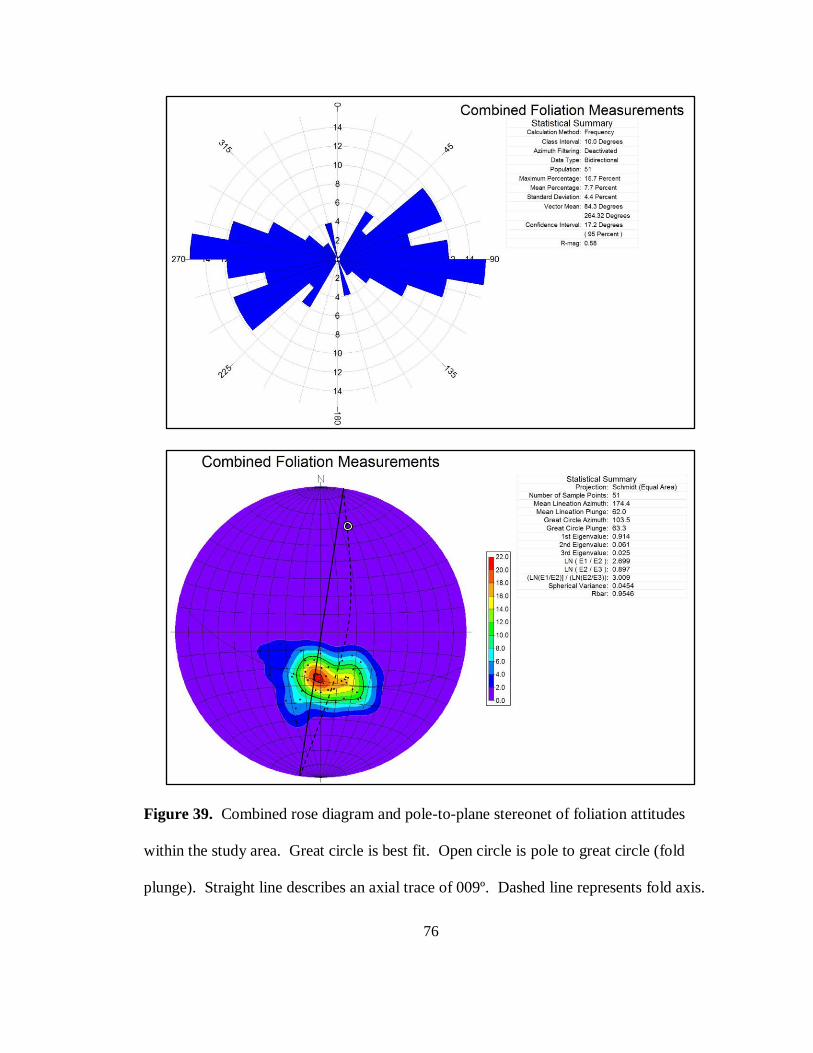
76
Figure 39. Combined rose diagram and pole-to-plane stereonet of foliation attitudes
within the study area. Great circle is best fit. Open circle is pole to great circle (fold
plunge). Straight line describes an axial trace of 009º. Dashed line represents fold axis.
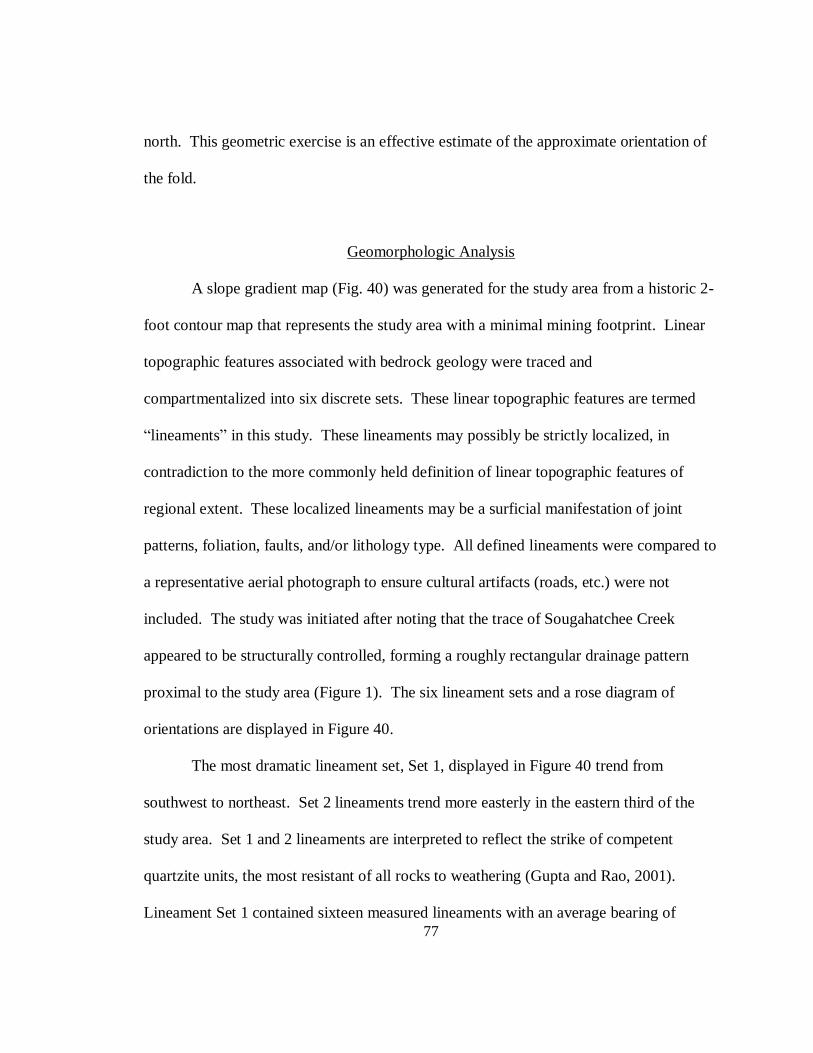
77
north. This geometric exercise is an effective estimate of the approximate orientation of
the fold.
Geomorphologic Analysis
A slope gradient map (Fig. 40) was generated for the study area from a historic 2-
foot contour map that represents the study area with a minimal mining footprint. Linear
topographic features associated with bedrock geology were traced and
compartmentalized into six discrete sets. These linear topographic features are termed
“lineaments” in this study. These lineaments may possibly be strictly localized, in
contradiction to the more commonly held definition of linear topographic features of
regional extent. These localized lineaments may be a surficial manifestation of joint
patterns, foliation, faults, and/or lithology type. All defined lineaments were compared to
a representative aerial photograph to ensure cultural artifacts (roads, etc.) were not
included. The study was initiated after noting that the trace of Sougahatchee Creek
appeared to be structurally controlled, forming a roughly rectangular drainage pattern
proximal to the study area (Figure 1). The six lineament sets and a rose diagram of
orientations are displayed in Figure 40.
The most dramatic lineament set, Set 1, displayed in Figure 40 trend from
southwest to northeast. Set 2 lineaments trend more easterly in the eastern third of the
study area. Set 1 and 2 lineaments are interpreted to reflect the strike of competent
quartzite units, the most resistant of all rocks to weathering (Gupta and Rao, 2001).
Lineament Set 1 contained sixteen measured lineaments with an average bearing of
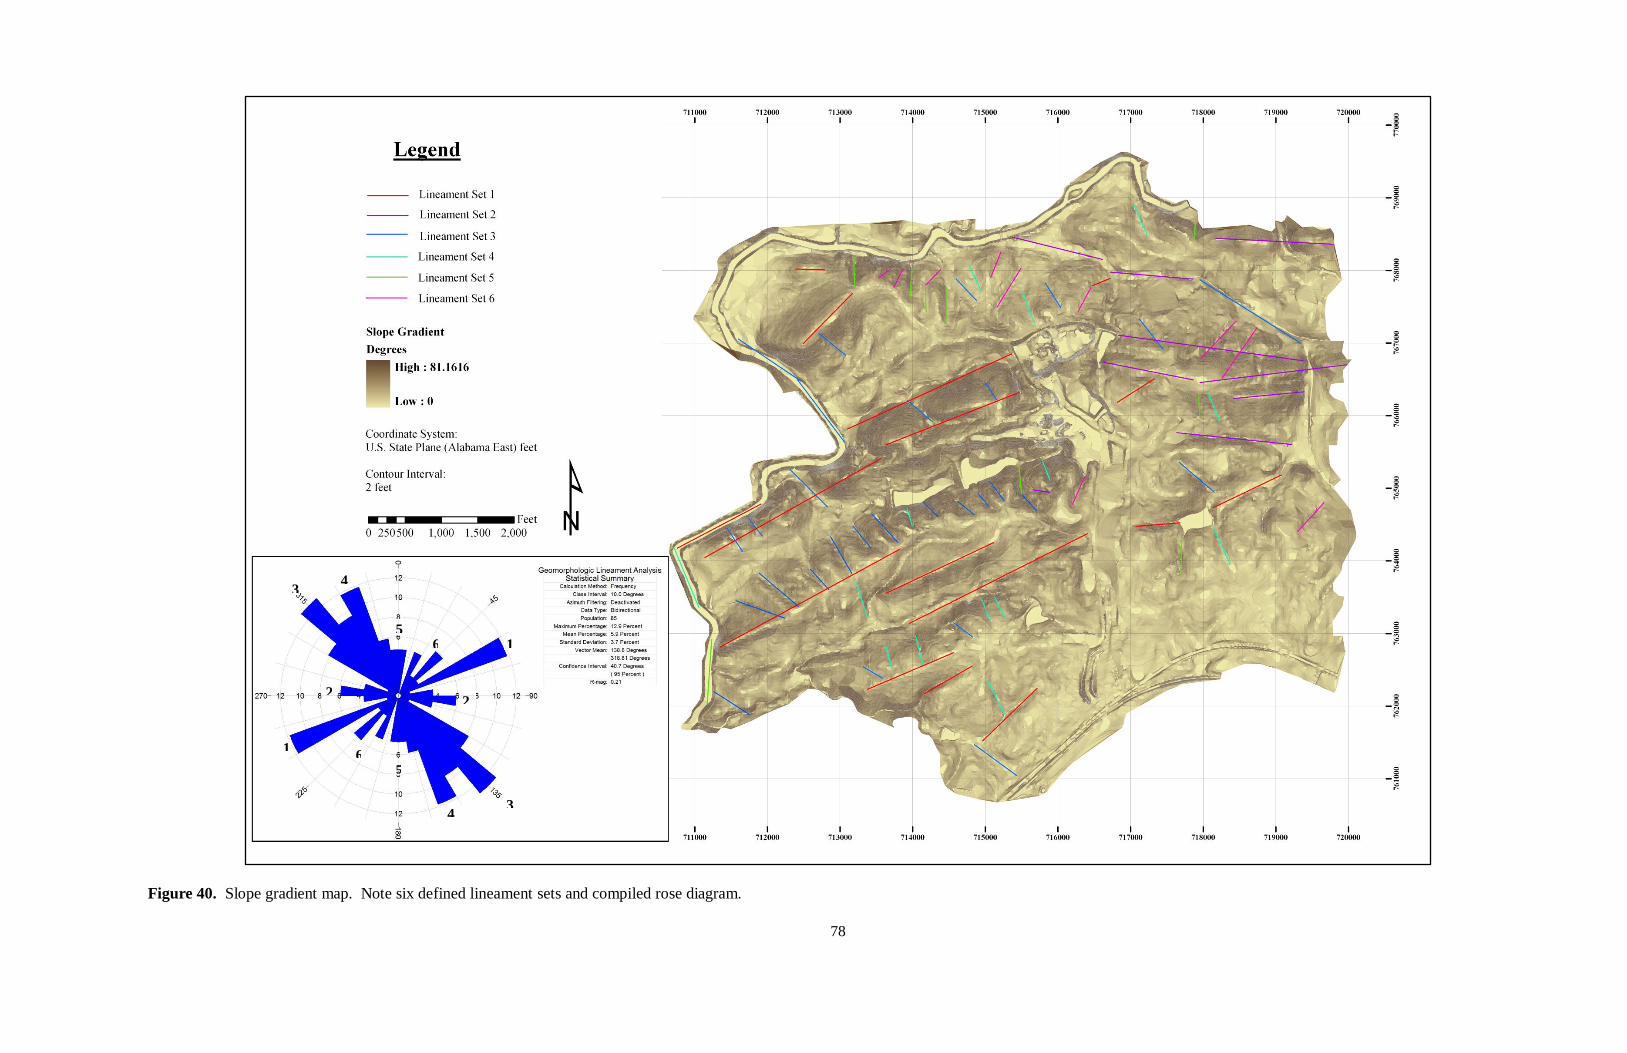
78
Figure 40. Slope gradient map. Note six defined lineament sets and compiled rose diagram.
4
4
2
1
2
1
3
3
5
5 6
6
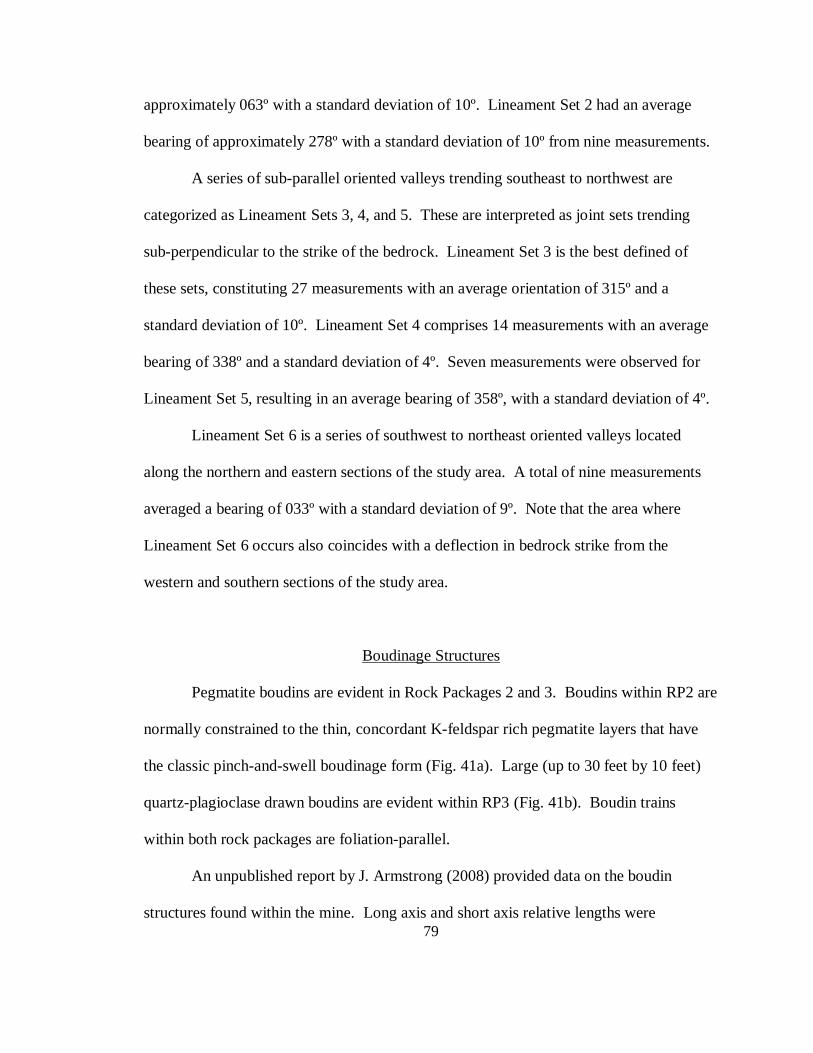
79
approximately 063º with a standard deviation of 10º. Lineament Set 2 had an average
bearing of approximately 278º with a standard deviation of 10º from nine measurements.
A series of sub-parallel oriented valleys trending southeast to northwest are
categorized as Lineament Sets 3, 4, and 5. These are interpreted as joint sets trending
sub-perpendicular to the strike of the bedrock. Lineament Set 3 is the best defined of
these sets, constituting 27 measurements with an average orientation of 315º and a
standard deviation of 10º. Lineament Set 4 comprises 14 measurements with an average
bearing of 338º and a standard deviation of 4º. Seven measurements were observed for
Lineament Set 5, resulting in an average bearing of 358º, with a standard deviation of 4º.
Lineament Set 6 is a series of southwest to northeast oriented valleys located
along the northern and eastern sections of the study area. A total of nine measurements
averaged a bearing of 033º with a standard deviation of 9º. Note that the area where
Lineament Set 6 occurs also coincides with a deflection in bedrock strike from the
western and southern sections of the study area.
Boudinage Structures
Pegmatite boudins are evident in Rock Packages 2 and 3. Boudins within RP2 are
normally constrained to the thin, concordant K-feldspar rich pegmatite layers that have
the classic pinch-and-swell boudinage form (Fig. 41a). Large (up to 30 feet by 10 feet)
quartz-plagioclase drawn boudins are evident within RP3 (Fig. 41b). Boudin trains
within both rock packages are foliation-parallel.
An unpublished report by J. Armstrong (2008) provided data on the boudin
structures found within the mine. Long axis and short axis relative lengths were
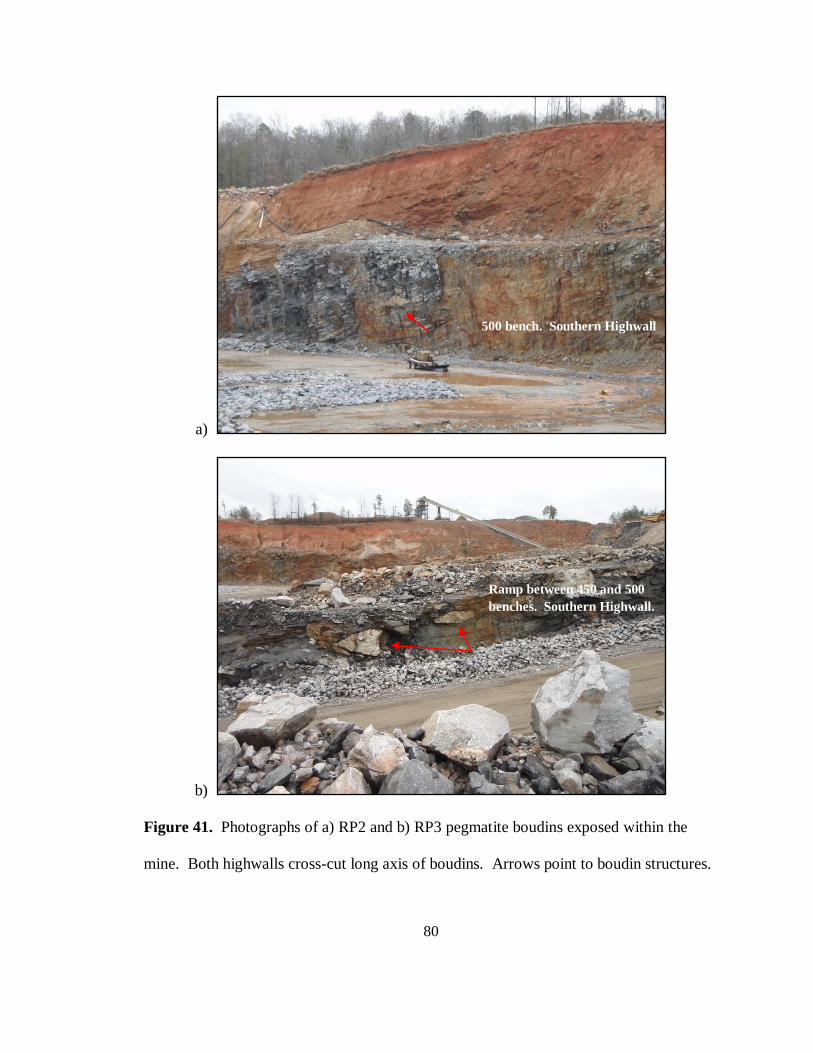
80
a)
b)
Figure 41. Photographs of a) RP2 and b) RP3 pegmatite boudins exposed within the
mine. Both highwalls cross-cut long axis of boudins. Arrows point to boudin structures.
500 bench. Southern Highwall
Ramp between 450 and 500
benches. Southern Highwall.
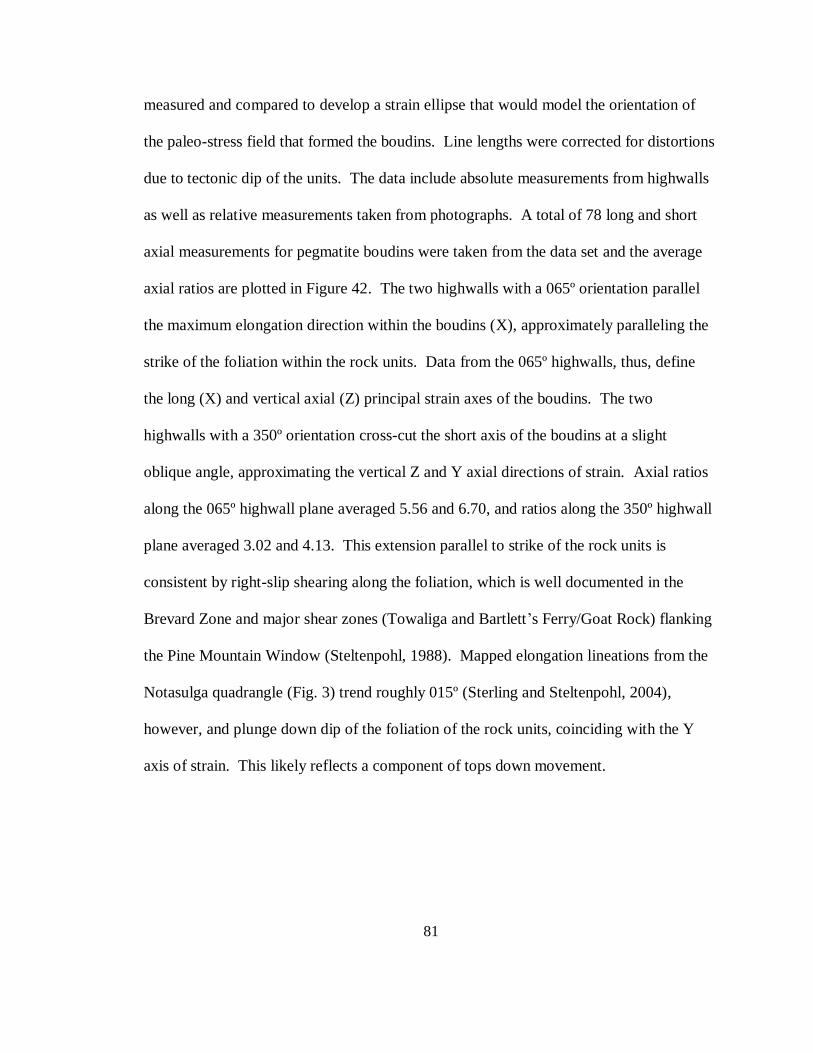
81
measured and compared to develop a strain ellipse that would model the orientation of
the paleo-stress field that formed the boudins. Line lengths were corrected for distortions
due to tectonic dip of the units. The data include absolute measurements from highwalls
as well as relative measurements taken from photographs. A total of 78 long and short
axial measurements for pegmatite boudins were taken from the data set and the average
axial ratios are plotted in Figure 42. The two highwalls with a 065º orientation parallel
the maximum elongation direction within the boudins (X), approximately paralleling the
strike of the foliation within the rock units. Data from the 065º highwalls, thus, define
the long (X) and vertical axial (Z) principal strain axes of the boudins. The two
highwalls with a 350º orientation cross-cut the short axis of the boudins at a slight
oblique angle, approximating the vertical Z and Y axial directions of strain. Axial ratios
along the 065º highwall plane averaged 5.56 and 6.70, and ratios along the 350º highwall
plane averaged 3.02 and 4.13. This extension parallel to strike of the rock units is
consistent by right-slip shearing along the foliation, which is well documented in the
Brevard Zone and major shear zones (Towaliga and Bartlett’s Ferry/Goat Rock) flanking
the Pine Mountain Window (Steltenpohl, 1988). Mapped elongation lineations from the
Notasulga quadrangle (Fig. 3) trend roughly 015º (Sterling and Steltenpohl, 2004),
however, and plunge down dip of the foliation of the rock units, coinciding with the Y
axis of strain. This likely reflects a component of tops down movement.
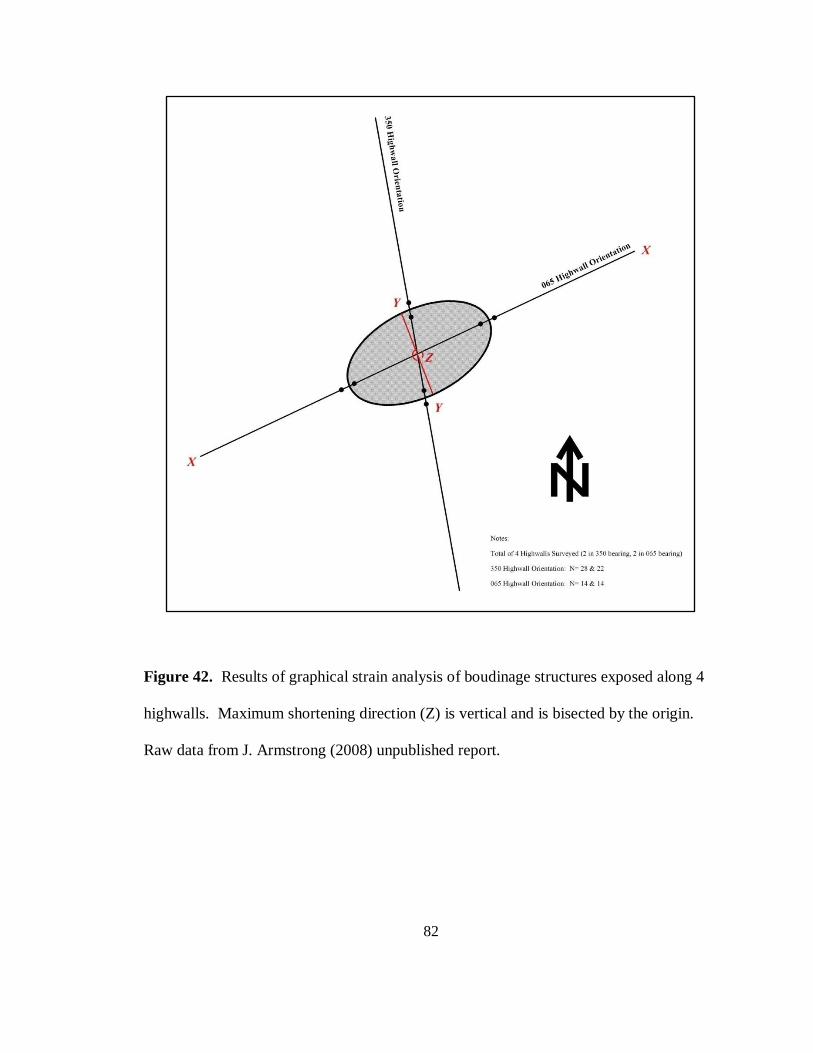
82
Figure 42. Results of graphical strain analysis of boudinage structures exposed along 4
highwalls. Maximum shortening direction (Z) is vertical and is bisected by the origin.
Raw data from J. Armstrong (2008) unpublished report.
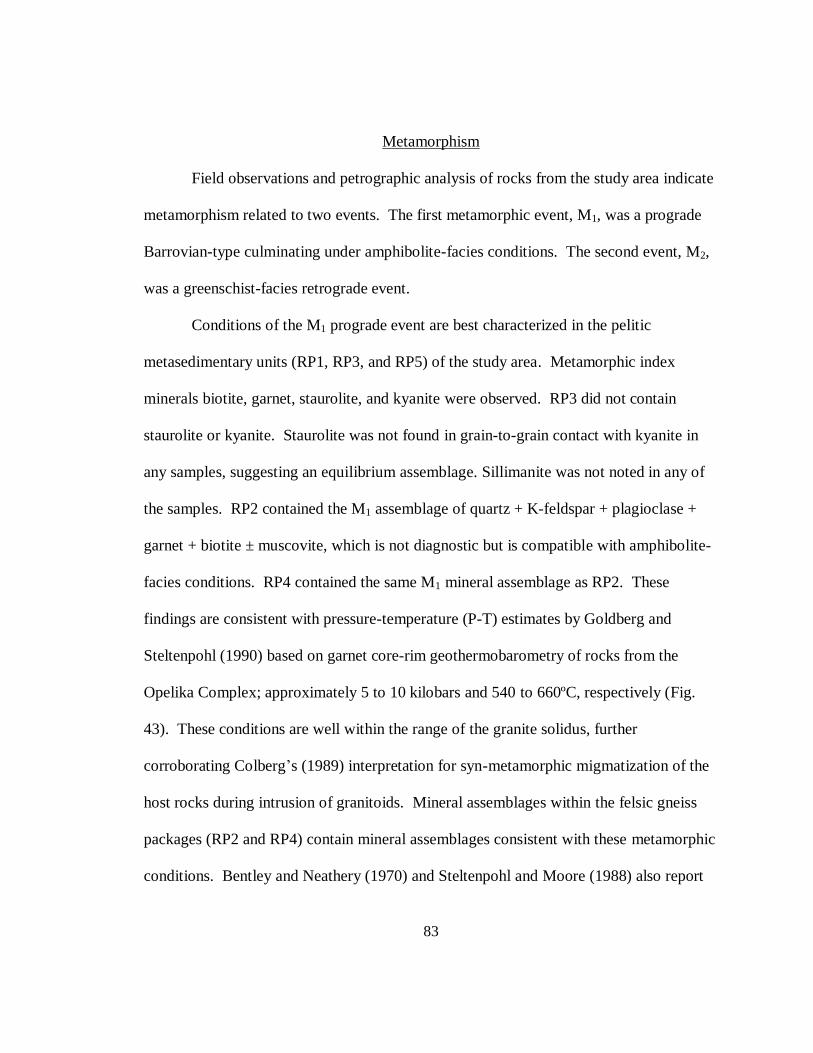
83
Metamorphism
Field observations and petrographic analysis of rocks from the study area indicate
metamorphism related to two events. The first metamorphic event, M1, was a prograde
Barrovian-type culminating under amphibolite-facies conditions. The second event, M2,
was a greenschist-facies retrograde event.
Conditions of the M1 prograde event are best characterized in the pelitic
metasedimentary units (RP1, RP3, and RP5) of the study area. Metamorphic index
minerals biotite, garnet, staurolite, and kyanite were observed. RP3 did not contain
staurolite or kyanite. Staurolite was not found in grain-to-grain contact with kyanite in
any samples, suggesting an equilibrium assemblage. Sillimanite was not noted in any of
the samples. RP2 contained the M1 assemblage of quartz + K-feldspar + plagioclase +
garnet + biotite ± muscovite, which is not diagnostic but is compatible with amphibolite-
facies conditions. RP4 contained the same M1 mineral assemblage as RP2. These
findings are consistent with pressure-temperature (P-T) estimates by Goldberg and
Steltenpohl (1990) based on garnet core-rim geothermobarometry of rocks from the
Opelika Complex; approximately 5 to 10 kilobars and 540 to 660ºC, respectively (Fig.
43). These conditions are well within the range of the granite solidus, further
corroborating Colberg’s (1989) interpretation for syn-metamorphic migmatization of the
host rocks during intrusion of granitoids. Mineral assemblages within the felsic gneiss
packages (RP2 and RP4) contain mineral assemblages consistent with these metamorphic
conditions. Bentley and Neathery (1970) and Steltenpohl and Moore (1988) also report
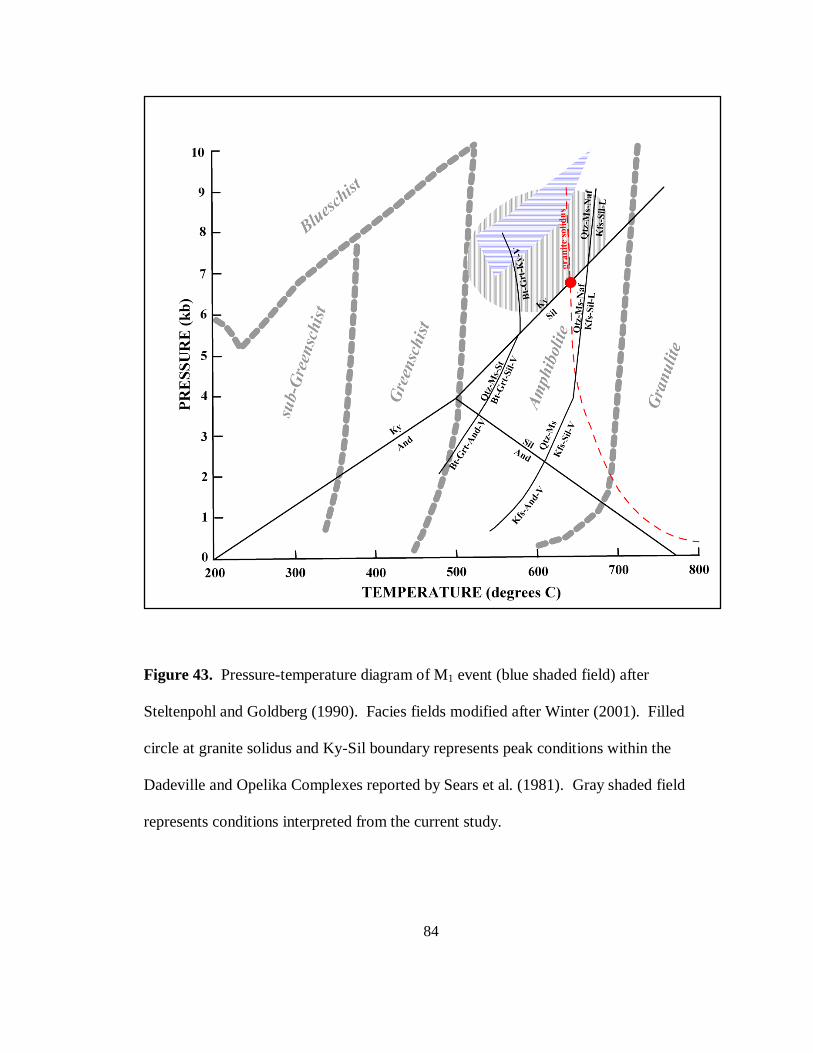
84
Figure 43. Pressure-temperature diagram of M1 event (blue shaded field) after
Steltenpohl and Goldberg (1990). Facies fields modified after Winter (2001). Filled
circle at granite solidus and Ky-Sil boundary represents peak conditions within the
Dadeville and Opelika Complexes reported by Sears et al. (1981). Gray shaded field
represents conditions interpreted from the current study.
85
that kyanite grade conditions affected rocks in the southwestern exposures of the Opelika
Complex.
The retrogressive M2 event is characterized by biotite retrograding to chlorite and
plagioclase retrograding to white mica indicating greenschist-facies conditions. This type
of retrogression is commonly related to ductile deformation zones in the Opelika
Complex (Steltenpohl et al., 1990). Shear zones related to the Stonewall Line, which is a
major ductile deformation zone proximal to the study area (Fig. 3) likely account for this
retrogression.
The retrogressive reaction of kyanite breaking down to muscovite noted in RP5
(Fig. 22a) is also attributed to this M2 retrogressive event. Carmichael (1969) proposed
the reaction:
3 Ky + 3 Qtz + 2 K+ + 3 H2O 2 Ms + 2 H
+.
As a result rims of muscovite grow at the expense of kyanite and quartz. This reaction
consumes both K+ and H2O while releasing H
+, therefore a nearby source of K
+ and a
receptor for H+ must be available. The tectonostratigraphically adjacent RP4
(metagranite) could act as both a potassic source as well as a sink for the H+.
86
V. GEOLOGIC MODEL
Drillhole Database
Drillhole data were entered into an internal database within the Gemcom GEMS
6.2® geology and mine planning software package. In addition to the visually and
photographically logged drillcores, a series of artificial drillholes were required (see
below) and input using the following parameters: 1) known (Easting [x], Northing [y],
elevation [z]) geologic contacts were placed as a shallow (0.1 ft) drillholes; 2) existing
drillholes with partial penetration of rock packages were extrapolated to include the entire
thickness based on the average downhole thicknesses of units discussed in Section II; and
3) seismic refraction and electrical resistivity survey controls where available, as
discussed in Section III. These artificial drillholes are necessary to ensure accurate rock
package surface modeling across the breadth of the study area. The drillhole coverage
was synthetically increased from 23 to 43 drillholes in this manner.
Topographic and Geologic Surface Modeling
A three-dimensional topographic ground surface was created utilizing a triangular
irregular network (TIN) surface. A TIN is a set of contiguous, non-overlapping triangles.
The surface of each triangle is represented by a plane. The topography TIN was
generated by triangulating the vertices from the contour lines of a 5-foot contour map of

87
the study area in May 2008 provided by Vulcan Materials Company. Topographic
control is essential for accurate generation of rock package outcrops.
A TIN was produced for the bottom surface of each rock package. This TIN
represents the contact surface of the upper rock package “bottom” and the lower rock
package “top” (i.e. RP3/RP2 contact). Each geologic surface TIN was generated by
selecting drillhole intercepts from the drillhole database using a filter to single out the
bottom contacts of the target rock package. The bottom contact was chosen to ensure that
partial drillhole penetration of a rock package was not taken into account (partial
penetration intervals of a rock package were omitted from the drillholes within the
database). In this manner a collection of “mass points” with x, y, z coordinates were
activated allowing for the creation of a TIN surface of the geologic boundary between
two adjacent rock packages.
Each geologic TIN was constrained laterally and vertically by the location of the
furthest mass points included in its creation. Drillhole data were not available out to the
edges of the study area, therefore each geologic TIN was “expanded” beyond the
boundaries of the study area. The geologic TINs were then “clipped” by the boundary
line of the site, yielding a geologic surface confined to the study area. The bottom
surface of each rock package was then activated and visually evaluated for accuracy in 3-
dimensions within GEMS 6.2®.
A geologic solid was created for each rock package by activating the bottom
surfaces of two adjacent rock packages and then “stitching” the two surfaces together
resulting in a solid “block” of material. These geologic solids are critical for mine
planning as they represent the volume of material within an area (reserves). Analytical
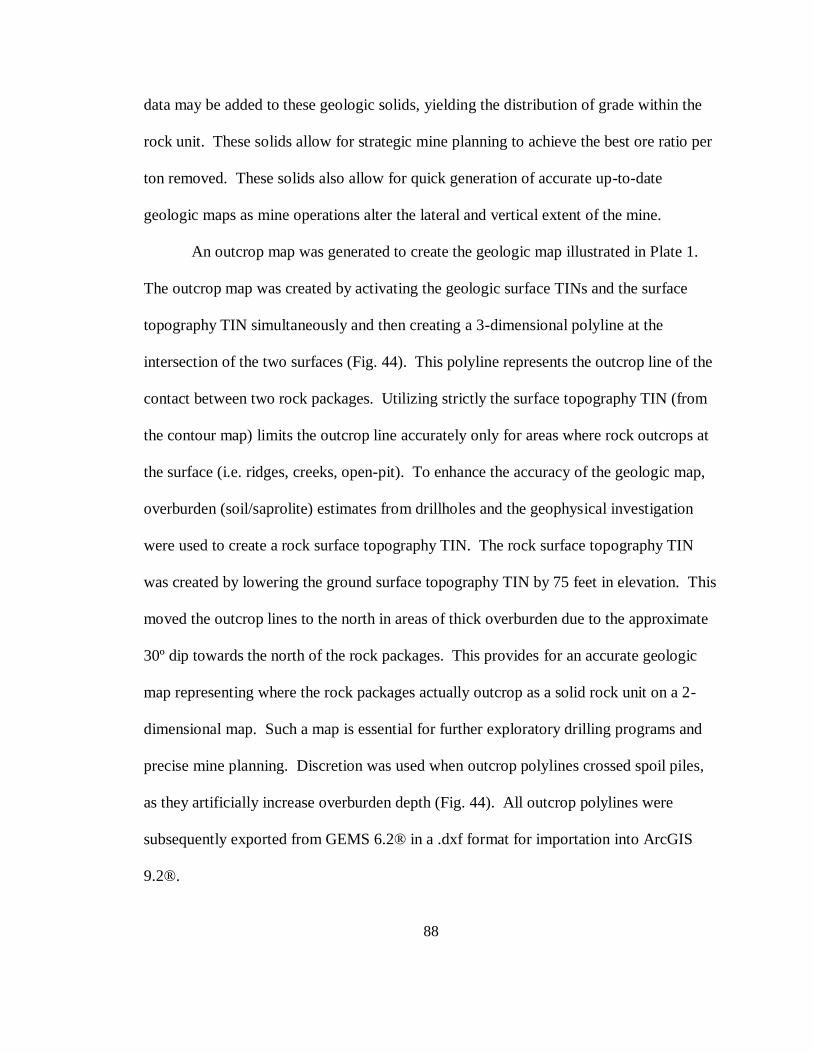
88
data may be added to these geologic solids, yielding the distribution of grade within the
rock unit. These solids allow for strategic mine planning to achieve the best ore ratio per
ton removed. These solids also allow for quick generation of accurate up-to-date
geologic maps as mine operations alter the lateral and vertical extent of the mine.
An outcrop map was generated to create the geologic map illustrated in Plate 1.
The outcrop map was created by activating the geologic surface TINs and the surface
topography TIN simultaneously and then creating a 3-dimensional polyline at the
intersection of the two surfaces (Fig. 44). This polyline represents the outcrop line of the
contact between two rock packages. Utilizing strictly the surface topography TIN (from
the contour map) limits the outcrop line accurately only for areas where rock outcrops at
the surface (i.e. ridges, creeks, open-pit). To enhance the accuracy of the geologic map,
overburden (soil/saprolite) estimates from drillholes and the geophysical investigation
were used to create a rock surface topography TIN. The rock surface topography TIN
was created by lowering the ground surface topography TIN by 75 feet in elevation. This
moved the outcrop lines to the north in areas of thick overburden due to the approximate
30º dip towards the north of the rock packages. This provides for an accurate geologic
map representing where the rock packages actually outcrop as a solid rock unit on a 2-
dimensional map. Such a map is essential for further exploratory drilling programs and
precise mine planning. Discretion was used when outcrop polylines crossed spoil piles,
as they artificially increase overburden depth (Fig. 44). All outcrop polylines were
subsequently exported from GEMS 6.2® in a .dxf format for importation into ArcGIS
9.2®.
89
Figure 44. Screen capture from GEMS 6.2® illustrating the intersection of RP3 geologic
rock solid and the topography surface TIN in 3-dimensions. The purple polylines
represent the outcrop lines of RP3. Note the anomalous outcrop lines (red arrows) where
the geologic solid intersects a spoil pile (false outcrop line) and two highwalls (true
outcrop line). View is to the east.
Highwalls
Spoil Pile
450 bench
500 bench
90
Geologic Map
A geologic map (Plate 1) for the study area was created based on the outcrop
polylines discussed above. The author notes that as mine operations expand in the future,
the geologic contacts will change position relative to their position depicted in Plate 1,
which was current in May 2008 when the orthotopographic map was generated. The rock
packages generally trend towards east-northeast and dip to the north. Two gentle
antiformal folds are indicated by metamorphic foliation (schistosity and gneissosity)
attitudes in the eastern half of the study area. Both folds trend in a northerly direction
and may be associated with a larger antiform. In the extreme northeastern corner of the
study area anomalous lithologies (black fine- to medium-grained amphibolite) were
exposed in outcrops (715,971 ft East, 768,848 ft North) along Sougahatchee Creek. No
drillholes intercepted this lithology within the RP1 through RP5 sequence. The
combination of atypical lithology (amphibolite) and proximity to the Ropes Creek
Amphibolite (Fig. 3) support the interpretation that this unit lies within the Dadeville
Complex. The contact between the amphibolite and RP4 is interpreted to be within the
creek valley trending approximately 330º, but it was not observed. The contact,
therefore, likely is the Stonewall Line, as discussed in Section II.
The bottom contact of RP1 was placed on the basis of the maximum drillhole
penetration within the unit and, therefore, should not be considered the true bottom of the
unit. Limited outcrop data exists south of the mapped area and east of Sougahatchee
Creek, but the unit probably continues some distance to the south as interpreted from
91
topography. RP3 thins in the area near the geophysical survey traverse. This is attributed
to the unit being an inherently weak lithology (biotite schist) bounded by the more
relatively competent RP2 (augen gneiss) and RP4 (metagranite). As plastic deformation
of the rock packages progressed under metamorphic conditions, zones of RP3 likely
pinched and swelled into large boudin-like pods. This explanation accounts for
anomalously thick and thin intervals encountered during the drilling program. RP5 is
exposed in the northwestern part of the map area; the finger-shaped protrusion reflects its
occurrence capping the crest of the ridge (along label “Rock Package 5” on Plate 1).
92
SECTION VI. CONCLUSIONS
1. Five distinct rock packages were determined within the immediate area of mining
operations. These packages were delineated based on the results of a diamond core
drilling program completed in the spring of 2008. Previous drillhole coverage was
limited both laterally and vertically. The 8,316 feet of diamond drillcore, along with the
open-pit mine, afforded the best exposure of Opelika Complex lithologies and structures
across the entire width of the complex.
2. Electrical resistivity was proven an effective method for the delineation of Rock
Package 3 (biotite schist). RP3 is considered an innerburden unit between two ore units
(RP4 and RP2) and spatial control of the unit is essential for economic mine operations
and design. Electrical resistivity may be used in the future as an exploratory method to
determine the thickness and extent of RP3-like units within similar granite ore bodies.
3. Seismic refraction was proven an effective method in the determination of overburden
thickness. The method provides for a quick, inexpensive, and noninvasive estimate of
overburden, allowing that it be avoided by informed mine design or be included in an
accurate budget prediction if removal is unavoidable for pit advancement.
93
4. Field mapping of joints and foliations coupled with their geomorphologic character
provides valuable information for future mine design with emphasis placed on ore
extraction and highwall stability.
5. Analysis of boudinage structures and metamorphic conditions aid in explaining the
morphology of the ore bodies and contribute to our understanding of the Opelika
Complex.
6. Gemcom GEMS 6.2® allows computer modeling of five geologic rock solids,
representing the five rock packages delineated within the study area. These computer-
generated solids can be enhanced with analytical data to provide future reserve estimates
and economic pit advancement.
7. An accurate geologic map generated for the study area can be used to guide future
exploration programs and mine design.
94
REFERENCES
Advanced Geosciences Inc., 2002, Instruction manual for EarthImager 2D, version 2.2.0,
resistivity and IP inversion software: Austin, Texas, 134 p.
Bentley, R.D., and Neathery, T.L., 1970, Geology of the Brevard fault zone and
related rocks of the Inner Piedmont of Alabama: Alabama Geological Society
8th Annual Field Trip Guidebook, p. 119.
Carmichael, D.R., 1969, On the mechanism of prograde metamorphic reactions in quartz-
bearing pelitic rocks. Contributions to Mineralogy and Petrology, v. 20, p. 244-
267.
Colberg, M.R., 1989, The origin of the Auburn Formation migmatites, Lee County,
Alabama [M.S. thesis]: Auburn, Alabama, Auburn University, 169 p.
Cook, R.B., Fousek, R.S., Bogdan, K.R., and Steltenpohl, M.G., 2007, Geology of the
Farmville Metagranite, Opelika Complex, Inner Piedmont at the Vulcan Materials
Company Notasulga Quarry, Lee County, Alabama in Fousek, R.S., ed., Locating,
permitting, and operation of construction aggregate mining operations in
Alabama: Alabama Geological Society 44th Annual Field Trip Guidebook, p. 93-
101.
Goldberg, S.A., and Burnell, J.R., 1987, Rubidium-strontium geochronology of the
Farmville granite, Alabama Inner Piedmont, in Drummond, M.S., and Green,
N.L., eds., Granites of Alabama: Geological Survey of Alabama, p. 251-258.
Goldberg, S.A., and Steltenpohl, M.G., 1990, Timing and characteristics of Paleozoic
deformation in the Alabama Inner Piedmont: American Journal of Science, v.
290, p. 1169-1200.
Grimes, J.E., 1993, Geology of the Piedmont rocks between the Dadeville Complex
and the Pine Mountain window in parts of Lee, Macon, and Tallapoosa
Counties, Alabama [M.S. thesis]: Auburn, Alabama, Auburn University,
129 p.
95
Grimes, J.E., and Steltenpohl, M.G., 1993, Geology of the crystalline rocks along
the fall line, on the Carrville, Notasulga, and Loachapoka quadrangles,
Alabama, in Steltenpohl, M.G., and Salpas, P.A., eds., Geology of the
southernmost exposed Appalachian Piedmont rocks along the fall line:
Geological Society of America, Southeastern Section 42nd Annual Meeting
Field Trip Guidebook, p. 67-94.
Grimes, J.E., Steltenpohl, M.G., Cook, R.B., and Keefer, W.D., 1993, New
geological studies of the most southern part of the Brevard zone, Alabama,
and their implications for southern Appalachian tectonostratigraphy, in
Hatcher, R.D., Jr., and Davis, T.L., eds., Studies of Inner Piedmont geology
with a focus on the Columbus Promontory: Carolina Geological Society
Annual Field Trip Guidebook, p. 95-116.
Gupta, A.S., and Rao, K.S., 2001, Weathering indices and their applicability for
crystalline rocks, Springer-Verlag, Bulletin of Engineering Geology and the
Environment, v. 60, no. 3, p. 201-221.
Hatcher, R.D., Jr., Osberg, P.H., Drake, A.A., Jr., Robinson, P., and Thomas, W.A.,
1990, Tectonic Map of the U.S. Appalachians: The Appalachian-Ouachita Orogen
in the United States, v. F-2 of The Geology of North America (GNA-F2).
Jackson, D., 1979, Rip instead of drilling and blasting, Coal Age, August 1979:
McGraw-Hill, Inc. 7 p.
Osborne, W.E., Szabo, M.W., Neathery, T.L., and Copeland, C.W., Jr., 1988,
Geologic map of Alabama, northeast sheet: Tuscaloosa, Alabama Geological
Survey.
Paterson, S.R. and Tobisch, O.T., 1988, Using pluton ages to date regional deformations:
problems with commonly used criteria: Geology, v. 16, 1108-1111.
Sears, J.W., Cook, R.B., and Brown, D.E., 1981, Tectonic evolution of the western
part of the Pine Mountain Window and adjacent Inner Piedmont province, in
Sears, J.W., ed., Contrasts in tectonic style between the Inner Piedmont
Terrane and the Pine Mountain Window: Alabama Geological Society 18th
Annual Field Trip Guidebook, p. 1-61.
Steltenpohl, M.G., 1988, Kinematics of the Towaliga, Bartletts Ferry, and Goat Rock
fault zones, Alabama: The late Paleozoic dextral shear system in the
southernmost Appalachians: Geology, v. 16, p. 852-855.
Steltenpohl, M.G., and Moore, W.B., 1988, Metamorphism in the Alabama Piedmont:
Alabama Geological Survey Circular 138, 29 p.
96
Steltenpohl, M.G., Neilson, M.J., Bittner, E.I., Colberg, M.R., and Cook, R.B.,
1990, Geology of the Alabama Piedmont terrane: Geological Survey of
Alabama Bulletin, v. 139, p. 1-80.
Steltenpohl, M.G., Heatherington, A., Mueller, P., and Miller, B.V., 2005, New isotopic
dates on crystalline rocks from Alabama and Georgia, in Steltenpohl, M.G., ed.,
Southernmost Appalachian terranes, Alabama and Georgia: Southeastern Section
of the Geological Society of America Field Trip Guide Book, p. 51-69.
Sterling, W., and Steltenpohl, M.G., 2004, Geologic map of the Notasulga quadrangle,
Lee and Macon counties, Alabama: Geological Survey of Alabama. Open-file
map.
United States Geological Survey, 1987, Digital elevation models, USGS data user’s field
guide 5, 38 p.
Vernon, R.H., 1991, Questions about myrmekite in deformed rocks. Journal of Structural
Geology, v. 13, 979-985.
White, W.W., 2007, Geology of the 1:24,000 Tallassee, Alabama, Quadrangle and its
implications for southern Appalachian tectonics [M.S. thesis]: Auburn, Alabama,
Auburn University, 89 p.
Winter, J.E., 2001, An introduction to igneous and metamorphic petrology, Prentice-Hall
Inc., Upper Saddle River, New Jersey. 697 p.