Embed Size (px)
Citation preview

Surname
Other Names
CentreNumber
1214
0100
01
CandidateNumber
2
JD*S11-1214-01
ADDITIONAL MATERIALS
In addition to this examination paper, you will need:• the Geological Map Extract (Clitheroe and Gisburn);• a hand-lens or magnifier to study the map (optional);• a calculator;• a protractor.
INSTRUCTIONS TO CANDIDATES
Use black ink or black ball-point pen.Write your name, centre number and candidate number in the spaces at the top of this page.Answer all questions.Write your answers in the spaces provided in this booklet.
INFORMATION FOR CANDIDATES
The number of marks is given in brackets at the end of each question or part-question.
Candidates are reminded that marking will take into account the quality of communication used in their answers.
GCE A level
1214/01
GEOLOGY - GL4INTERPRETING THE GEOLOGICAL RECORD
A.M. WEDNESDAY, 8 June 2011
2 hours Examiner only
Section A
1. 15
2. 15
3. 16
4. 14
Section B
5. 10
6. 14
7. 6
8. 10
Total 100

2 Examineronly
1214-01
SECTION A
Answer all questions in the spaces provided.
This section should take approximately 1 hour to complete.
1. Figures 1a and 1b show the variation in percentage of two minerals, augite (pyroxene) and plagioclase feldspar within a dolerite sill. Figure 1c shows the crystallisation temperature ranges of common silicate minerals in Bowen’s Reaction Series.
0
50
100
150
200
250
0.50
1.40
1.00
0.75
0.50
300Country rock
Top
Averagecrystal
size (mm)
Plagioclase and Augite (pyroxene)percentage weight
Base
Hei
ght a
bove
bas
e of
sill
(m)
Country Rock% weight
20 30 40 50 60 70
20 30 40 50 60 701400
Numbers (e.g. 3.2) referto relative density
Bowen’s Reaction Series
oliv
ine
augi
tebi
otite
mic
a
mus
covi
te m
ica
orth
ocla
se fe
ldsp
ar
plag
iocl
ase
feld
spar
quar
tz
horn
blen
de
(am
phib
ole)
(pyr
oxen
e)
Mg-rich(3.2)
Mg-rich(3.2)
Mg-rich(2.9)
Fe-rich(4.3)
Fe-rich(3.6)
Fe-rich(3.4)
Fe-rich(3.4) Na-rich
(2.6)
Fe-poor(2.8)
Ca-rich(2.7)
1200
1300
1100
1000
900
800
700
600
500
Aug
ite
appr
oxim
ate
tem
pera
ture
of
crys
talli
satio
n (°
C)
(pyr
oxen
e)
Plag
iocl
ase
Figure 1a Figure 1cFigure 1b
Height above base of sill (m)
Augite (pyroxene) (% weight)
Plagioclase Feldspar
(% weight)
Dominant Plagioclase composition
Top (300) • 48 Ca-rich
200 30 67 Na-rich
150 32 • Na-rich
50 • 52 Ca-rich
Base (zero) 50 48 Ca-rich
Table 1

Turn over.
3 Examineronly
1214
0100
03
1214-01
(a) Describe and account for the variation in average crystal size (Figure 1a) within the sill. [3]
Describe . . . . . . . . . . . . . . . . . . . . . . . . . . . . . . . . . . . . . . . . . . . . . . . . . . . . . . . . . . . . . . . . . . . . . . . . . . . . . . . . . . . . . . . . . . . . . . . . . . . . . . . . . . . . . . . . . . . . . . . . . . . . . . . . . . . . . . . . . . . . . . . . . . . . . . . . . . . . . . . . . . . . . . . . . . . . . . . . . . . . . . . . . . . .
Account . . . . . . . . . . . . . . . . . . . . . . . . . . . . . . . . . . . . . . . . . . . . . . . . . . . . . . . . . . . . . . . . . . . . . . . . . . . . . . . . . . . . . . . . . . . . . . . . . . . . . . . . . . . . . . . . . . . . . . . . . . . . . . . . . . . . . . . . . . . . . . . . . . . . . . . . . . . . . . . . . . . . . . . . . . . . . . . . . . . . . . . . . . . . . .
(b) (i) Complete Table 1 to show the variation in percentages of augite (pyroxene) and plagioclase at selected heights above the base of the sill. [3]
(ii) With reference to Figures 1b and 1c, explain the change from Ca-rich to Na-rich plagioclase in Table 1, between 50 and 200 metres above the base of the
sill. [3]
(c) (i) Olivine is another mineral found within this dolerite sill. Draw a horizontal line (labelled O) on Figure 1b to show the approximate height of an olivine-rich layer with a composition of 25 % olivine. [1]
(ii) On Figure 1a, mark with a labelled cross (+M) a location where the dolerite has a similar composition to the original magma. Explain your answer. [3]
(d) Using the data in Figure 1c, explain why dolerite is more likely to be prone to chemical weathering than granite. [2]
Total 15 marks
4 Examineronly
1214-01
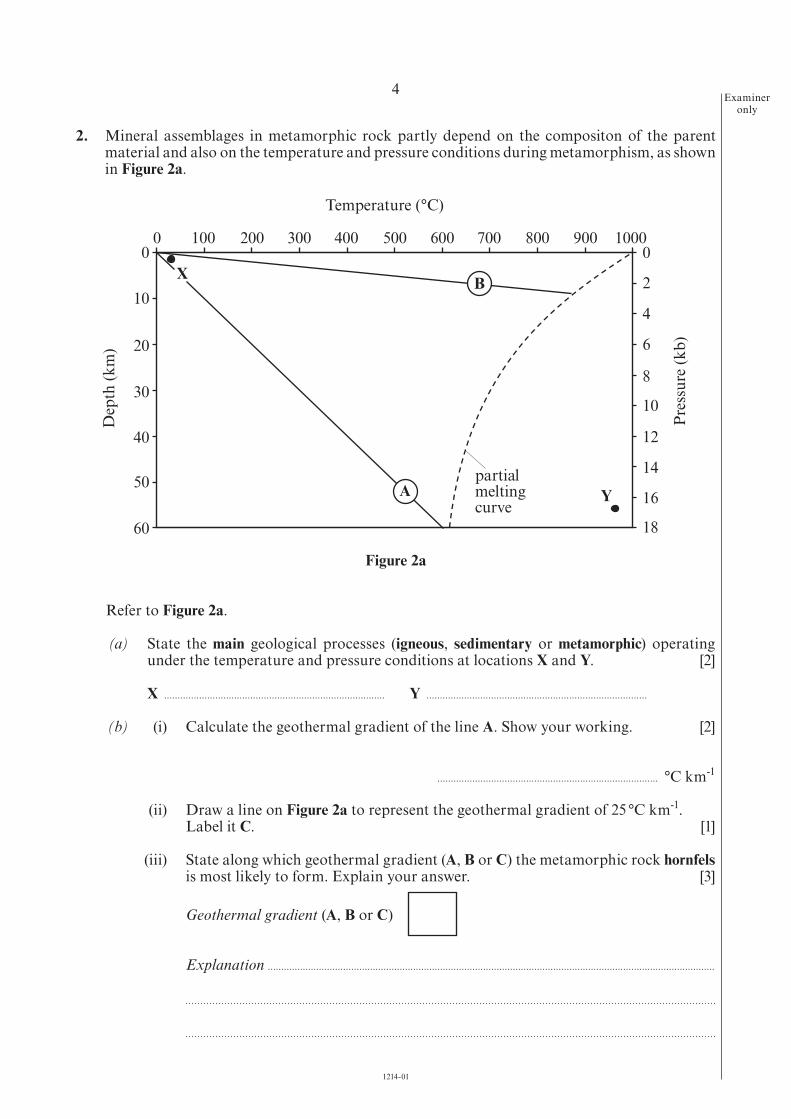
2. Mineral assemblages in metamorphic rock partly depend on the compositon of the parent material and also on the temperature and pressure conditions during metamorphism, as shown in Figure 2a.
X
Y
B
Apartialmeltingcurve
Temperature (°C)
00 100 200 300 400 500 600 700 800 900 1000
0
2
4
6
8
10
12
14
16
18
20
10
30
40
50
60
Dep
th (k
m)
Pres
sure
(kb)
Figure 2a
Refer to Figure 2a.
(a) State the main geological processes (igneous, sedimentary or metamorphic) operating under the temperature and pressure conditions at locations X and Y. [2]
X . . . . . . . . . . . . . . . . . . . . . . . . . . . . . . . . . . . . . . . . . . . . . . . . . . . . . . . . . . . . . . . . . . . . . . . . . . . . . . . . . . Y . . . . . . . . . . . . . . . . . . . . . . . . . . . . . . . . . . . . . . . . . . . . . . . . . . . . . . . . . . . . . . . . . . . . . . . . . . . . . . . . . .
(b) (i) Calculate the geothermal gradient of the line A. Show your working. [2]
. . . . . . . . . . . . . . . . . . . . . . . . . . . . . . . . . . . . . . . . . . . . . . . . . . . . . . . . . . . . . . . . . . . . . . . . . . . . . . . . . . °C km-1
(ii) Draw a line on Figure 2a to represent the geothermal gradient of 25 °C km-1. Label it C. [1]
(iii) State along which geothermal gradient (A, B or C) the metamorphic rock hornfels is most likely to form. Explain your answer. [3]
Geothermal gradient (A, B or C)
Explanation . . . . . . . . . . . . . . . . . . . . . . . . . . . . . . . . . . . . . . . . . . . . . . . . . . . . . . . . . . . . . . . . . . . . . . . . . . . . . . . . . . . . . . . . . . . . . . . . . . . . . . . . . . . . . . . . . . . . . . . . . . . . . . . . . . . . . . . . . . . . . . . . . . . . . . . . . . . . . . . . . . . . . .

Turn over.
5 Examineronly
1214
0100
05
Figure 2b is a diagram of a metamorphic rock with a porphyroblastic texture.
1214-01
0 5mm
garnet withinclusions
mica
quartz
inclusions
Figure 2b
(c) (i) On Figure 2b, label a porphyroblast with an arrow (← P). [1]
(ii) Use Figure 2b to explain the meaning of the term porphyroblastic texture. [3]
(d) (i) On Figure 2b, draw a line (labelled F) to show the most recent foliation direction. [1]
(ii) Outline the evidence from Figure 2b to suggest that the principal stress directions have changed during the metamorphism of this rock. [2]
Total 15 marks
inclusions represent grains of the original foliation trapped in
garnets during their growth
6 Examineronly
1214-01
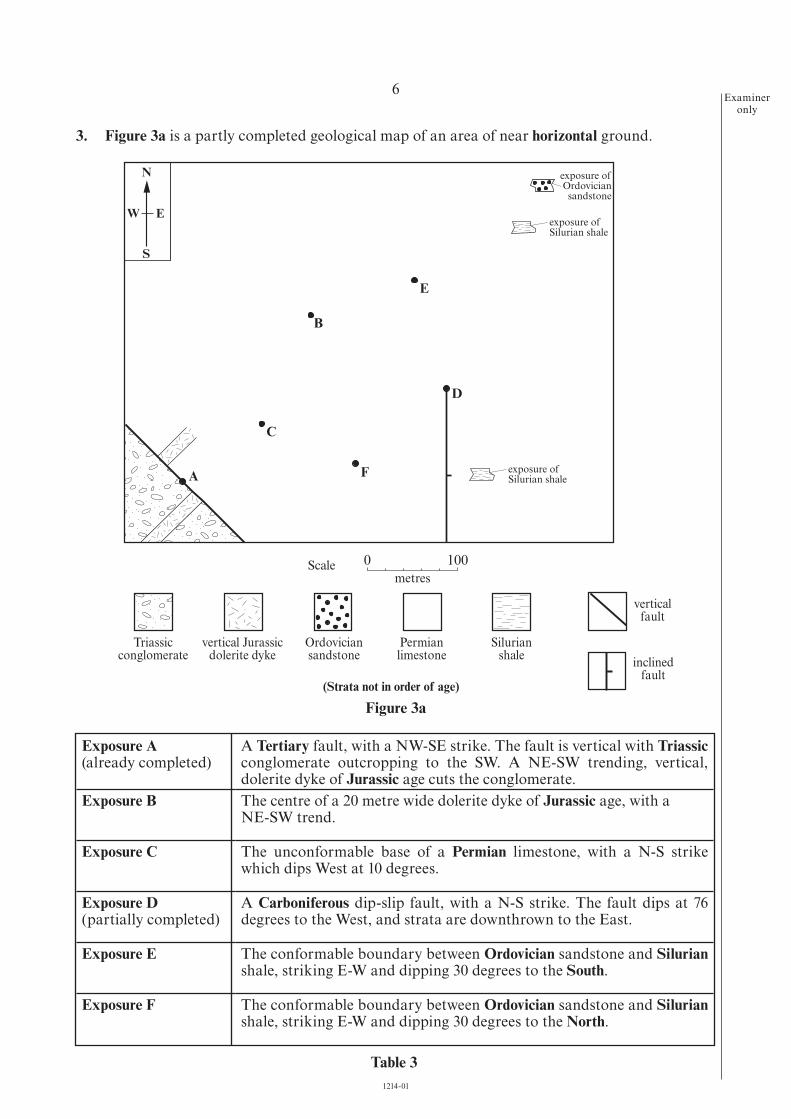
3. Figure 3a is a partly completed geological map of an area of near horizontal ground.
A
B
C
D
F
E
0 100
N
EW
S
exposure ofOrdoviciansandstone
exposure ofSilurian shale
exposure ofSilurian shale
metresScale
Triassicconglomerate
vertical Jurassicdolerite dyke
Ordoviciansandstone
Permianlimestone
(Strata not in order of age)
Silurianshale
verticalfault
inclinedfault
Figure 3a
Table 3
Exposure A(already completed)
A Tertiary fault, with a NW-SE strike. The fault is vertical with Triassic conglomerate outcropping to the SW. A NE-SW trending, vertical, dolerite dyke of Jurassic age cuts the conglomerate.
Exposure B The centre of a 20 metre wide dolerite dyke of Jurassic age, with aNE-SW trend.
Exposure C The unconformable base of a Permian limestone, with a N-S strike which dips West at 10 degrees.
Exposure D(partially completed)
A Carboniferous dip-slip fault, with a N-S strike. The fault dips at 76 degrees to the West, and strata are downthrown to the East.
Exposure E The conformable boundary between Ordovician sandstone and Silurian shale, striking E-W and dipping 30 degrees to the South.
Exposure F The conformable boundary between Ordovician sandstone and Silurian shale, striking E-W and dipping 30 degrees to the North.
7 Examineronly
1214-01
(a) Using information from the six exposures (A-F) in Table 3 and other map evidence, complete the geological map (Figure 3a). Use the appropriate shading provided in the key. The data have already been completed on the map for Exposure A and partially completed for Exposure D. [8]
(b) State the type of fault represented by the Carboniferous dip-slip fault at Exposure D. [1]
Fault type . . . . . . . . . . . . . . . . . . . . . . . . . . . . . . . . . . . . . . . . . . . . . . . . . . . . . . . . . . . . . . . . . . . . . . . . . . . . . . . . . . . . . . . . . . . . . . . . . . . . . . . . . . . . . . . . . . . . . . . . . . . . . . . . . . . . . . . . . . . . . . . . . . . . . . . . . . . . . . . . . . . . . . . . . . . . . . . . . . . . . . . . . .
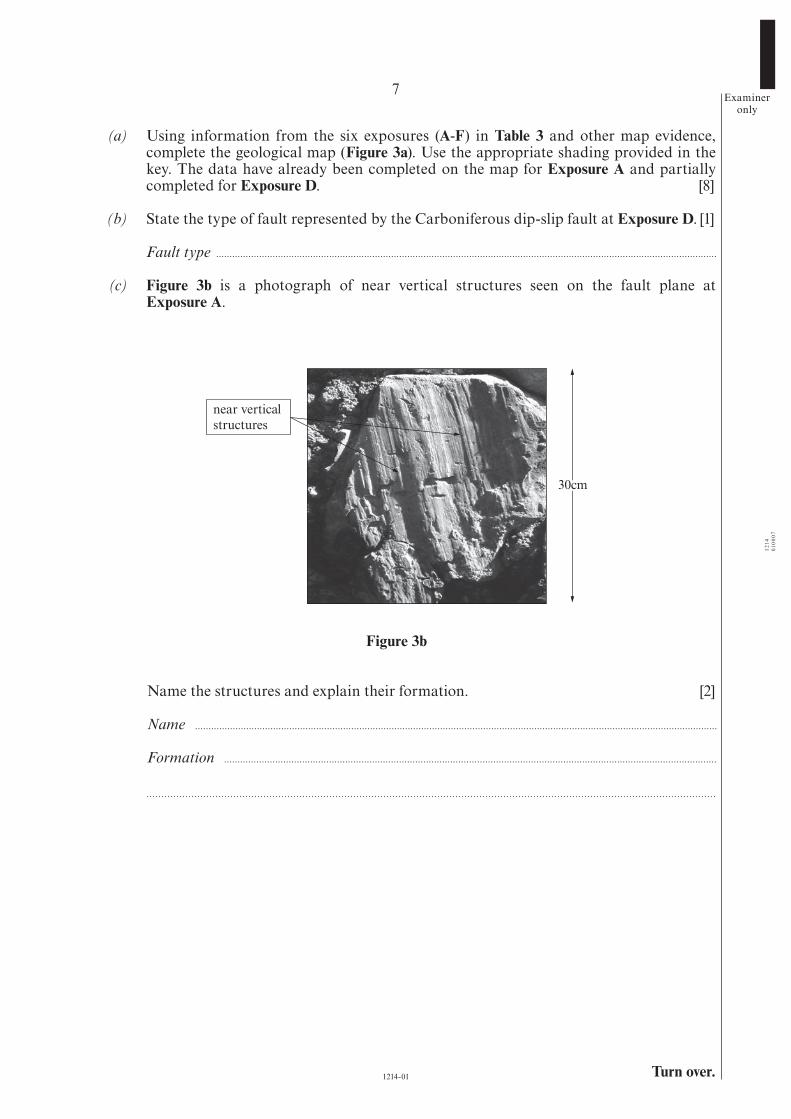
(c) Figure 3b is a photograph of near vertical structures seen on the fault plane at Exposure A.
30cm
near verticalstructures
Figure 3b
Name the structures and explain their formation. [2]
Name . . . . . . . . . . . . . . . . . . . . . . . . . . . . . . . . . . . . . . . . . . . . . . . . . . . . . . . . . . . . . . . . . . . . . . . . . . . . . . . . . . . . . . . . . . . . . . . . . . . . . . . . . . . . . . . . . . . . . . . . . . . . . . . . . . . . . . . . . . . . . . . . . . . . . . . . . . . . . . . . . . . . . . . . . . . . . . . . . . . . . . . . . . . . . . . . . .
Formation . . . . . . . . . . . . . . . . . . . . . . . . . . . . . . . . . . . . . . . . . . . . . . . . . . . . . . . . . . . . . . . . . . . . . . . . . . . . . . . . . . . . . . . . . . . . . . . . . . . . . . . . . . . . . . . . . . . . . . . . . . . . . . . . . . . . . . . . . . . . . . . . . . . . . . . . . . . . . . . . . . . . . . . . . . . . . . . . . . . . . . .
Turn over.
1214
0100
07
8 Examineronly
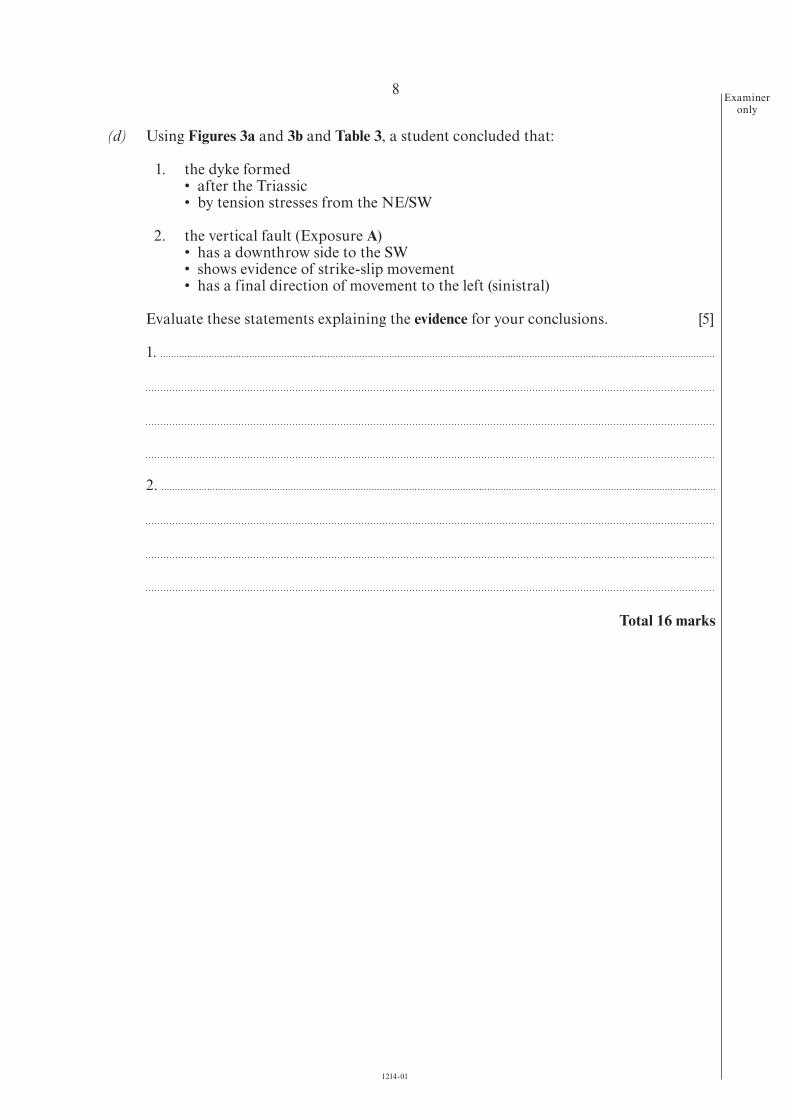
(d) Using Figures 3a and 3b and Table 3, a student concluded that:
1. the dyke formed • after the Triassic • by tension stresses from the NE/SW 2. the vertical fault (Exposure A) • has a downthrow side to the SW • shows evidence of strike-slip movement • has a final direction of movement to the left (sinistral)
Evaluate these statements explaining the evidence for your conclusions. [5]
1. . . . . . . . . . . . . . . . . . . . . . . . . . . . . . . . . . . . . . . . . . . . . . . . . . . . . . . . . . . . . . . . . . . . . . . . . . . . . . . . . . . . . . . . . . . . . . . . . . . . . . . . . . . . . . . . . . . . . . . . . . . . . . . . . . . . . . . . . . . . . . . . . . . . . . . . . . . . . . . . . . . . . . . . . . . . . . . . . . . . . . . . . . . . . . . . . . . . . . . . . . . . . . .
2. . . . . . . . . . . . . . . . . . . . . . . . . . . . . . . . . . . . . . . . . . . . . . . . . . . . . . . . . . . . . . . . . . . . . . . . . . . . . . . . . . . . . . . . . . . . . . . . . . . . . . . . . . . . . . . . . . . . . . . . . . . . . . . . . . . . . . . . . . . . . . . . . . . . . . . . . . . . . . . . . . . . . . . . . . . . . . . . . . . . . . . . . . . . . . . . . . . . . . . . . . . . . . .
Total 16 marks
1214-01

Turn over.
BLANK PAGE
9
1214
0100
09
1214-01

10 Examineronly
1214-01
4. Figure 4a shows the variation in 18O:16O ratios measured in marine sediments over the last 150,000 years. Figure 4b shows changes to atmospheric CO2, trapped in the Antarctic ice, over the same time period.
Increase in 16O
Increase in 18O
Increase in CO2
X
B
C
150,000
100,000
Year
s bef
ore
pres
ent
50,000
Present 0
150,000
100,000
Year
s bef
ore
pres
ent
50,000
Present 0
A
(a) Figure 4a shows evidence of three cycles (A, B and C) as predicted by Milankovitch. Complete Table 4 below to identify the approximate length and possible cause of each cycle. [3]
Figure 4a Figure 4b
Source: Earth’s Climate, Ruddiman (2008)
Cycle Cycle length (years) Possible cause of Milankovitch cycle
A •Eccentricity
(variations in the shape of Earth’s orbit)
B ∼41,000 •
C •Procession (variation
in the wobble of Earth’s axis)
Table 4

Turn over.
11 Examineronly
1214-01
(b) The variations in 18O:16O ratios are thought to indicate growth and decline of continental ice sheets.
(i) In the box labelled X on Figure 4a, mark with labelled arrows:
• the peak of one glacial period (← G) • the peak of one interglacial period (← I) [2]
(ii) Explain why the ratio of 18O:16O in marine sediments varies during glacial and interglacial periods. [3]
(c) From your knowledge, state one natural process that has been a major contributor in:
1. adding CO2 to the atmosphere throughout geological time;
2. removing CO2 from the atmosphere throughout geological time. [2]
1. . . . . . . . . . . . . . . . . . . . . . . . . . . . . . . . . . . . . . . . . . . . . . . . . . . . . . . . . . . . . . . . . . . . . . . . . . . . . . . . . . . . . . . . . . . . . . . . . . . . . . . . . . . . . . . . . . . . . . . . . . . . . . . . . . . . . . . . . . . . . . . . . . . . . . . . . . . . . . . . . . . . . . . . . . . . . . . . . . . . . . . . . . . . . . . . . . . . . . . . . . . . . . .
2. . . . . . . . . . . . . . . . . . . . . . . . . . . . . . . . . . . . . . . . . . . . . . . . . . . . . . . . . . . . . . . . . . . . . . . . . . . . . . . . . . . . . . . . . . . . . . . . . . . . . . . . . . . . . . . . . . . . . . . . . . . . . . . . . . . . . . . . . . . . . . . . . . . . . . . . . . . . . . . . . . . . . . . . . . . . . . . . . . . . . . . . . . . . . . . . . . . . . . . . . . . . . . .
(d) Refer to Figures 4a and 4b.
(i) Describe the correlation between the ratio of 18O:16O in marine sediments and atmospheric CO2 during the last 150,000 years. [2]
(ii) “Glacial and interglacial periods are a direct result of changes in the concentration of CO2 in the atmosphere during geological time.”
Critically evaluate this statement. [2]
Total 14 marks

12 Examineronly
1214-01
SECTION B
Questions 5-8 relate to the British Geological Survey 1:25 000 geological map extract from the Clitheroe and Gisburn Sheet.
Answer all questions in the spaces provided.
This section should take approximately 1 hour to complete.
5. (a) (i) State the type of superficial (drift) deposit overlying the Pendle Grit (PG) on Pendle Hill (grid square 7941). [1]
(ii) Account for the irregular outcrop pattern of this deposit in grid square 7940. [1]
(b) (i) Using the generalised geological column, calculate the maximum vertical thickness of the Pendleside Sandstone unit (PdS) within the Lower Bowland Shales (LBS). Show your working. [2]
Maximum vertical thickness . . . . . . . . . . . . . . . . . . . . . . . . . . . . . . . . . . . . . . . . . . . . . . . . . . . . . . m
(ii) Complete Table 5 below by calculating the width of outcrop of the Pendleside Sandstone (PdS) along the line of section (X–Y) on the geological map (between grid reference (GR) 812431 and GR 827419). Show your working. [2]
Pendleside Sandstone (PdS)
Maximum width of outcrop (m) within grid square 7841
Width of outcrop (m) between GR 812431 and GR 827419
310
Working
Answer . . . . . . . . . . . . . . . . . . . . . . . . . . . . . . . . . . . . . . . . . m
Table 5
Turn over.
13 Examineronly
1214-01
(iii) Suggest two possible factors responsible for the variation in outcrop widths identified in Table 5. [2]
Factor 1 . . . . . . . . . . . . . . . . . . . . . . . . . . . . . . . . . . . . . . . . . . . . . . . . . . . . . . . . . . . . . . . . . . . . . . . . . . . . . . . . . . . . . . . . . . . . . . . . . . . . . . . . . . . . . . . . . . . . . . . . . . . . . . . . . . . . . . . . . . . . . . . . . . . . . . . . . . . . . . . . . . . . . . . . . . . . . . . . .
Factor 2 . . . . . . . . . . . . . . . . . . . . . . . . . . . . . . . . . . . . . . . . . . . . . . . . . . . . . . . . . . . . . . . . . . . . . . . . . . . . . . . . . . . . . . . . . . . . . . . . . . . . . . . . . . . . . . . . . . . . . . . . . . . . . . . . . . . . . . . . . . . . . . . . . . . . . . . . . . . . . . . . . . . . . . . . . . . . . . . . .
(iv) Account for the “v shape” in the outcrop pattern of the Pendleside Sandstone (PdS) around GR 810 430. [2]
Total 10 marks

14 Examineronly
6. Table 6 and Figure 6a show the results of an investigation of three different rock samples from the map area.
1214-01
Sample characteristics Pendleside Sandstone (PdS) (within LBS)
Upper Bowland Shale (UBS)
Pendle Grit (PG)
Fossils groups trilobites goniatites, bivalves poor – some plant remains
Sedimentary structures bedding laminations
channels, erosion surfaces, flute and groove casts; some lateral and vertical grading of sediments
Sand percentage 60 0 •
Silt percentage 25 5 •
Clay percentage 15 95 10
Table 6
0
0
10
10
20
20
30
30
30
20
10
040
40
40
50
5050
60
60
60
70
70
70
80
80
80
90
90
90
100
100
100
Silt (100%)
Clay (100%)Sand (100%) % Sand
% Clay%
Silt
PendlesideSandstone(PdS)
Pendle Grit (PG)
Figure 6a
Grain size
Sand (2 116
) mm
Silt ( 116
) mm
Clay 1256
) m
–
–1256
! mm

Turn over.
15 Examineronly
1214-01
(a) Using Table 6 and Figure 6a as appropriate:
(i) complete Table 6 to show the percentage of sand, silt and clay in the Pendle Grit (PG); [2]
(ii) plot the percentage of sand, silt and clay in the Upper Bowland Shale (UBS) on Figure 6a. Label with an arrow (←UBS); [1]
(iii) state which of the three rock samples (Pendle Grit, Pendleside Sandstone or Upper Bowland Shale) is the most poorly-sorted. [1]
(b) Refer to the generalised geological column and data in Table 6 and Figure 6a. Describe and explain the evidence for the environments of deposition of the Upper Bowland Shale (UBS) and the overlying Pendle Grit (PG). [4]
Upper Bowland Shale . . . . . . . . . . . . . . . . . . . . . . . . . . . . . . . . . . . . . . . . . . . . . . . . . . . . . . . . . . . . . . . . . . . . . . . . . . . . . . . . . . . . . . . . . . . . . . . . . . . . . . . . . . . . . . . . . . . . . . . . . . . . . . . . . . . . . . . . . . . . . . . . . . . . . . . . . . . . . .
Pendle Grit . . . . . . . . . . . . . . . . . . . . . . . . . . . . . . . . . . . . . . . . . . . . . . . . . . . . . . . . . . . . . . . . . . . . . . . . . . . . . . . . . . . . . . . . . . . . . . . . . . . . . . . . . . . . . . . . . . . . . . . . . . . . . . . . . . . . . . . . . . . . . . . . . . . . . . . . . . . . . . . . . . . . . . . . . . . . . . . . . . . . . . .
(c) Explain why a spring has formed at Deep Clough (GR 805 405). [2]

16 Examineronly
1214-01
(d) Figure 6b illustrates one of the fossil groups identified in Table 6.
0 1cm
Figure 6b
(i) State the fossil group to which this specimen belongs. [1]
Fossil group . . . . . . . . . . . . . . . . . . . . . . . . . . . . . . . . . . . . . . . . . . . . . . . . . . . . . . . . . . . . . . . . . . . . . . . . . . . . . . . . . . . . . .
(ii) Assess how useful this fossil alone would be in determining the • mode of life of the original organism and • the environment of deposition of the rock in which it is found. [3]
Total 14 marks
Turn over.
17 Examineronly
1214-01
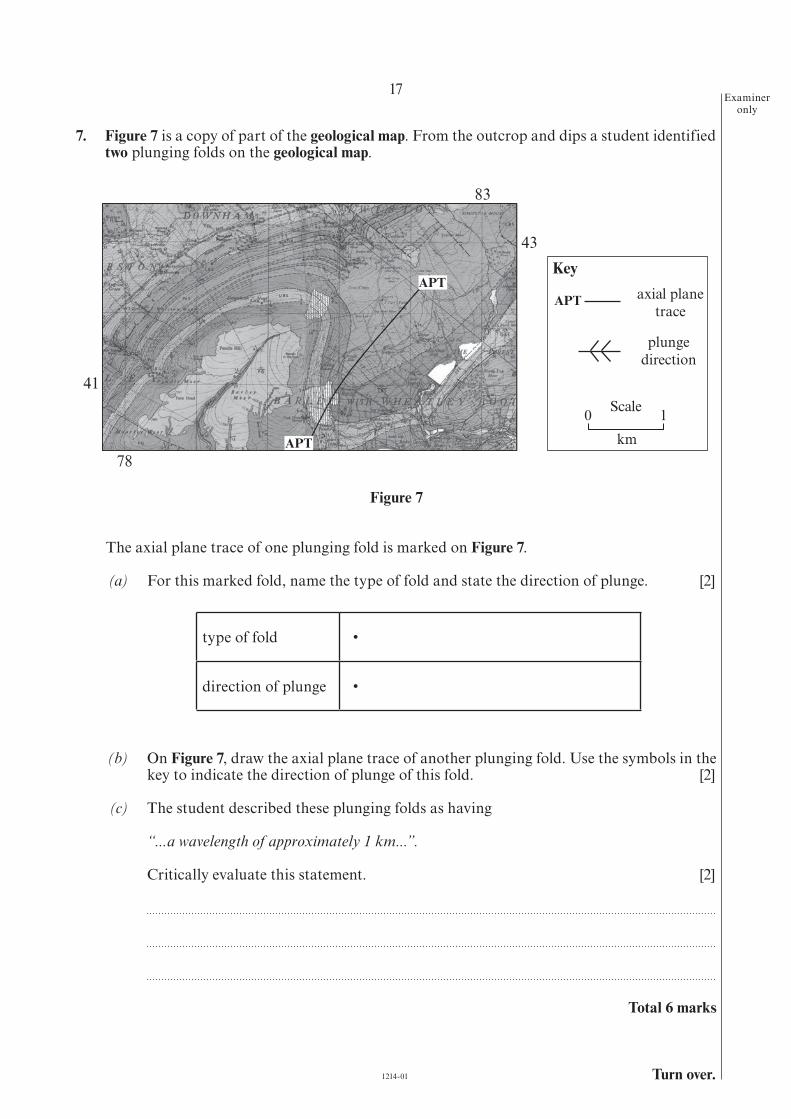
7. Figure 7 is a copy of part of the geological map. From the outcrop and dips a student identified two plunging folds on the geological map.
83
43
axial planetrace
plungedirection
Scale0 1km
78
41
KeyAPT
APT
APT
Figure 7
The axial plane trace of one plunging fold is marked on Figure 7.
(a) For this marked fold, name the type of fold and state the direction of plunge. [2]
(b) On Figure 7, draw the axial plane trace of another plunging fold. Use the symbols in the key to indicate the direction of plunge of this fold. [2]
(c) The student described these plunging folds as having
“...a wavelength of approximately 1 km...”.
Critically evaluate this statement. [2]
Total 6 marks
type of fold •
direction of plunge •

18 Examineronly
1214-01
8. (a) Suggest a probable geological explanation for the choice of location of the two reservoirs (shaded white) in grid square 8241. [3]
(b) Two landslips have developed on Pendle Hill. With reference to evidence from the geological map, evaluate the likelihood that the following factors were responsible for the landslides at these locations.
• Rock type • Dip (angle and direction) of beds • Steepness of the slope • Local groundwater conditions • Faulting [7]
Total 10 marks