Embed Size (px)
Citation preview

0361-0128/08/3759/957-24 957
Geology and Fluid Characteristics of the Mina Velha and Mandiocal Orebodies and Implications for the Genesis of the Orogenic Chega Tudo Gold Deposit,
Gurupi Belt, Brazil *
EVANDRO L. KLEIN, †
Geological Survey of Brazil, Av. Dr. Freitas, 3645, Belém-PA, Brazil, CEP: 66095-110
JOSÉ W. A. RIBEIRO,Newmont Overseas Exploration Limited, Surinam
CHRIS HARRIS,Department of Geological Sciences, University of Cape Town, Rondebosch 7700, South Africa
CANDIDO A. V. MOURA,Universidade Federal do Pará, Centro de Geociências, CP 1611, Belém-PA, Brazil, CEP: 66075-900
AND ANDRÉ GIRET
Université Jean Monnet, Département de Géologie. 23, rue du Docteur Paul Michelon, 42023, Saint Etienne, CEDEX 2, France
AbstractThe Chega Tudo gold deposit is located in the Gurupi belt of northern Brazil. Gold mineralization in the
Mina Velha (upper level) and Mandiocal (intermediate and lower levels) orebodies is hosted in highly strainedPaleoproterozoic (2148–2160 Ma) felsic to intermediate metavolcanic rocks and schists that record greenschistfacies metamorphism. The orebodies are broadly concordant with the regional northwest-oriented foliation,and mineralization comprises thick quartz vein sets and small quartz-carbonate-sulfide veinlets and enclosinghydrothermally altered host rocks. The hydrothermal mineral assemblage is postpeak metamorphism, syn- tolate tectonic, and includes quartz, calcite, chlorite, white mica, pyrite, subordinate chalcopyrite, and traces ofsphalerite and galena.
Free-milling gold occurs in sulfide-poor veins in the upper and lower zones of the deposit, whereas refrac-tory gold was deposited in fractures of pyrite and quartz in the more gold-enriched intermediate (±lower) level.Fluid inclusion and stable isotope (O, H, C, and S) data indicate that the two styles of gold deposition wereproduced by a combination of fluid immiscibility, fluid-rock reactions (sulfidation, carbonatization), and prob-ably mixing, occurring in two discrete stages within a single mineralizing event associated with fluid flow withinand around an active shear zone under fluctuating pressure conditions.
The refractory gold was deposited at 340° to 370°C from a CO2-CH4-H2O–NaCl fluid having salinity of 5.8± 2.7 wt percent NaCl equiv, variable CO2 contents (typically 12–22 mol %), and up to 6 mol percent CH4. Theδ18O and δD values of this fluid are 7.9 to 9.4 per mil and –29 to –37 per mil, respectively, indicating a meta-morphic origin. Carbon isotopes show contrasting values in fluid inclusion CO2 (δ13C = –24.1‰) and calcite(δ13C = of –3.8‰). The strongly negative value of fluid inclusion CO2 is interpreted to be an organic signatureacquired at the site of deposition by reaction of the deeply sourced ore-forming fluid with carbonaceous schistspresent in the deepest part of the deposit. The higher value for calcite probably records a crustal source. Oxy-gen fugacities calculated for the whole range of T-P-XCO2 conditions yielded log fO2 between –28.7 and –30.5,indicating reduced conditions for the fluid, which is in agreement with the mineral paragenesis, fluid inclusioncompositions, and sulfur isotope values.
The second fluid, responsible for the deposition of the free-milling gold in veins and probably part of thegold of the lower zone of the deposit, had a lower temperature (330°–340°C). This CO2-H2O–NaCl fluid hada salinity of 1.6 to 2.5 wt percent NaCl equiv and contained 11 to 13 mol percent CO2. The δ18O and δD val-ues of this fluid are 5.3 to 7.2 per mil and –12 to –30 per mil, respectively, also indicating a metamorphic source.The δ13C value of fluid inclusion CO2 is –6.9 per mil, likely representing a mantle-derived carbon source. LogfO2 values between –30.5 and –31.5 also indicate slightly more reduced conditions for this fluid. Both fluids hadnear-neutral pH, between 5 and 6.2, and δ34S values of H2S between –0.2 and –1.0 per mil, interpreted toreflect derivation of sulfur from magmatic sulfides.
† Corresponding author: e-mail, [email protected]*A digital supplement to this paper is available at <http://www.geoscience world.org/> or, for members and subscribers, on the SEG website, <http://
www.segweb.org>.
©2008 Society of Economic Geologists, Inc.Economic Geology, v. 103, pp. 957–980

IntroductionTHE GURUPI BELT in northern Brazil is a polyphase plutonic-metamorphic belt that contains a number of gold depositsand small undeveloped showings (Fig. 1). The exploitation ofalluvial ores by small miners (garimpo mining) started in the17th century, but reliable statistics on the historical produc-tion are not available. At least between 1965 and 1996, the cu-mulative garimpo production was about 16 tonnes (t) Au(Araujo Neto, 1998). This activity led to the recognition ofprimary ores, and after the 1980s several areas were devel-oped by mining companies, including the Cachoeira, ChegaTudo, Cipoeiro, Montes Áureos, and Serrinha deposits (Figs.1, 2) and a number of targets containing primary and paleo-placer gold. Chega Tudo and Cipoeiro are, so far, the mostimportant deposits in the Gurupi belt, containing resources ofabout 60 t of gold grading 1.4 g/t Au (Torresini, 2000),whereas the Cachoeira deposit holds resources of ~20 t Au(Klein et al., 2005a).
The gold deposits of the Gurupi belt have many commoncharacteristics (Torresini, 2000; Ribeiro, 2002; Yamagutiand Villas, 2003; Klein et al., 2005a, b, 2006a, 2007), whichinclude (1) ore-hosting shear zones developed in an accre-tionary and/or continental margin setting, (2) host rocksthat are dominantly greenschist facies volcanosedimentaryrocks, and subordinate, altered tonalites having an age of2148 to 2160 Ma, (3) a mineralization style characterized byabundant quartz-carbonate veins and surrounding perva-sive hydrothermal alteration, with gold occurring both inveins and disseminated in the altered host rocks, (4) latetiming with respect to granitic magmatism, metamorphism,and deformation, and (5) fluid inclusion and stable isotopecompositions that are consistent between deposits. Thesecharacteristics are also very similar to those of typicalgreenstone-hosted orogenic lode gold deposits (e.g.,Groves et al., 1998; McCuaig and Kerrich, 1998; Goldfarbet al., 2005).
Geologic and genetic aspects of the Cachoeira, Cipoeiro,Serrinha, and Montes Áureos deposits recently have been de-scribed by Torresini (2000), Ribeiro (2002), Yamaguti and Vil-las (2003), and Klein et al. (2005a, 2006a, 2007), and some ge-ologic and structural aspects of the Chega Tudo deposit alsohave been discussed (Torresini, 2000; Ribeiro, 2002). How-ever, no information is available concerning the genesis of theChega Tudo deposit.
This paper provides data on the petrography, fluid inclu-sion, and stable isotope (O, H, C, and S) composition of al-teration-related minerals from two parts of the Chega Tudodeposit, the upper Mina Velha, and intermediate and lowerMandiocal orebodies (Figs. 2, 3). Based on the results and onavailable field and structural information, genetic aspects ofthis deposit are discussed, including fluid composition, P-T-fO2-pH conditions of the hydrothermal system, mechanismsfor gold transport and deposition, and possible sources for thefluid and solutes.
Geologic OverviewLithostratigraphy
Two major Precambrian geotectonic units, namely, the SãoLuís craton and the Gurupi belt, along with minor sedimen-tary basins, are recognized in the studied region, cropping outas tectonic and erosive windows within large Phanerozoicsedimentary basins (Fig. 1). The São Luís craton is composedof subduction-related calc-alkaline granitoids, represented bythe Tromaí Intrusive Suite, that range in age from 2165 to2149 Ma (Klein and Moura, 2001; Klein et al., 2005c) (exceptwhere stated, all ages reported here are single zircon Pb evap-oration ages), and of younger muscovite-bearing, peralumi-nous granites, dated at 2086 ± 10 Ma (Palheta, 2001). Boththe calc-alkaline and the peraluminous granitoids are massiveto foliated and underwent low-grade metamorphism at a re-gional scale. Nevertheless, the primary igneous mineralogyand textures are largely preserved. The granitoids intrudedthe greenschist (± lower amphibolite) facies volcanosedimen-tary rocks of the 2240 Ma Aurizona Group (Klein and Moura,2001). These rocks are mostly schists of variable composi-tions, showing a penetrative schistosity and local folding. Thecratonic rocks have not been affected by any other thermalevent after about 1900 Ma, according to Rb-Sr and K-Ar evi-dence (see Klein and Moura, 2001, for review). The São Luíscraton has been interpreted as a Paleoproterozoic accre-tionary orogen, with the juvenile calc-alkaline granitoids andthe supracrustal rocks formed in intraoceanic settings,whereas the peraluminous granites record the collisionalphase of the orogen (Klein et al., 2005b), which is better rep-resented in the nearby Gurupi belt. Age, composition, tec-tonic setting, and paleogeographic reconstructions all favor acorrelation with the Eburnean granitoids and the Birimianvolcanosedimentary sequences of the West African craton(Torquato and Cordani, 1981; Klein et al., 2005c; Klein andMoura, 2008).
The Gurupi belt borders the south-southwestern boundaryof the São Luís craton (Fig. 1). It comprises north-north-west–south-southeast-trending volcanosedimentary and meta-sedimentary sequences that are tectonically intercalated withamphibolite facies gneisses and were intruded by differentgenerations of granitoids. The volcanosedimentary sequence(Chega Tudo Formation) consists of alternating felsic to maficvolcanic rocks and detrital (± chert) sedimentary rocks thatunderwent metamorphism under greenschist to lower-am-phibolite conditions (Yamaguti and Villas, 2003; Klein et al.,2005b). Most of the rocks show a well-developed schistosityand/or mylonitic fabric that dip at moderate to high angles,generally to the southwest. They are locally folded, especiallywithin the Tentugal shear zone. Felsic metavolcanic rockshave zircon ages of 2148 to 2160 Ma (Klein and Moura, 2001)interpreted as the crystallization ages of the volcanic pro-toliths, whereas Sm-Nd model ages (TDM) are in the 2.20 to2.28 Ga range, with positive εNd values (Klein et al., 2005b).This indicates a juvenile character for these volcanic rocks,
958 KLEIN ET AL.
0361-0128/98/000/000-00 $6.00 958
The Mina Velha and Mandiocal orebodies represent different mineralization styles of the Chega Tudodeposit, and the determined conditions of ore formation may be related to two distinct events or to a singleevent with sequential stages of hydrothermal alteration and gold mineralization. The corresponding fluid prop-erties, hydrothermal alteration, structural control, tectonic setting, geology, and metamorphism are analogousto those of orogenic gold deposits.

interpreted as having formed in arc-related systems associ-ated with the Paleoproterozoic calc-alkaline and supracrustalrocks of the São Luís craton. Two metasedimentary se-quences are considered here. The Gurupi Group is composedof detrital rocks of variable composition, including carbona-ceous phyllite and schist, and coarser-grained quartz-mica
schist, recording metamorphism under sub- to upper-green-schist conditions (Costa, 2000). The stratigraphic age of thissequence is still uncertain. It is tentatively considered olderthan 2159 Ma, based on inferred intrusive relationships(Costa, 2000; Palheta, 2001) with granitoids of this age. Thesecond sedimentary succession comprises amphibolite facies
THE OROGENIC CHEGA TUDO GOLD DEPOSIT, GURUPI BELT, BRAZIL 959
0361-0128/98/000/000-00 $6.00 959
Peraluminous granites
Calc-alkaline granitoids
Metavolcanosedimentary rocks
Metatonalite
Chega Tudo Formation
Metasedimentary rocks
Tonalite gneiss
Peraluminous granite
Nepheline syenite gneiss
Metasedimentary rocks
thrust zones
Tentugal shear zone
town / township
gold deposit
Archean
Paleoproterozoic
Neoproterozoic
Neoproterozoic / CambrianPhanerozoic cover
Sedimentary basins
2º00’ S
1º00’ S45º30’ W46º30’ W
2
N
Atlantic Ocean
Gurupi
20 km
River
Pará Maranhão
Bragança
Aurizona
Maracaçumé
Vizeu
Piriá
Riv
er
Mar
acaç
umé
Riv
er
São Luis craton
Gurupi belt
Gold deposits
1 - Cachoeira2 - Roxo3 - Firmino4 -5 - Cipoeiro6 - Serrinha7 - Montes Áureos8 - Cedral
Chega Tudo
1
23
45
67
8
FIG. 1. Simplified geologic map of the São Luís craton and Gurupi belt showing the location of the Chega Tudo and othergold deposits (adapted from Klein et al., 2005b).

schists and feldspathic to aluminous quartzites grouped in theMarajupema Formation. The youngest detrital zircon of thisunit, with an age of 1100 Ma, defines the maximum deposi-tional age for the sediments (Klein et al., 2005b).
Orthogneisses of the Itapeva Complex are tectonically in-tercalated with the supracrustal rocks (Fig. 1). The gneissesare middle to upper amphibolite facies, foliated and bandedrocks that show localized migmatization. A tonalite gneiss hasa zircon age of 2167 ± 2 Ma (U-Pb ID-TIMS), interpreted asthe age of crystallization of the igneous protolith of the gneiss(Klein et al., 2005b). Small lenses of granoblastic metatonaliteto gneiss have an Archean age of 2594 ± 3 Ma (Klein et al.,2005b).
Granitoids of variable chemical affinities and ages intrudedand/or were tectonically intercalated within the supracrustalsequences and the gneisses. Large wedges of the calc-alkaline
granitoids have been strongly affected by the Tentugal shearzone in the boundary zone between the São Luís craton andthe Gurupi belt and have been incorporated into the frame-work of the belt (Pastana, 1995; Ribeiro, 2002), showing in-tense mylonitic foliation. Peraluminous, muscovite-, and bi-otite-bearing granites are relatively widespread (Fig. 1). Theyshow variable effects of deformation, from a weak schistosityto a penetrative mylonitic fabric, depending on their positionrelative to deformation zones. Zircon ages of these granitesare 2100 to 2080 Ma, with inherited ages in the range of 2325to 2459 Ma and TDM model ages between 2.09 and 3.23 Ga,with weakly negative to positive εNd values indicating thatboth Paleoproterozoic and Archean crustal protoliths were in-volved in the origin of the granites (Palheta, 2001; Klein et al.,2005b). At least one of these granites shows field relationshipsthat indicate syntectonic emplacement (Klein et al., 2005b).
960 KLEIN ET AL.
0361-0128/98/000/000-00 $6.00 960
340 000 E 360 000 E 380 000 E
360 000 E 380 000 E340 000 E
976
000
0N
974
000
0N
972
000
0N
9720
000N
9740
000N
9760
000N
85º85º
85º85º
33º33º
80º80º47º47º
28º28º
85º85º
65º65º
25º25º
35º35º
25º25º
85º85º
68º68º
68º68º
,
Mar
acac
umé
river
,
Foliation and dip
Vertical foliation
Lineation and plunge
Fold axis and plunge
sense of displacement
Gold deposits
Shear zone, fault, fracture
15º15º
35º35º
75º75º
5 km
Chega Tudo Formation
Tromaí Suite (granodiorite)
Tromaí Suite (tonalite)
Itapeva Complex
Phanerozoiccover
Cipoeiro
Serrinha
Chega Tudo
Cedral
MontesÁureos
Gur
upi r
iver
FIG. 2. Geologic map of the southeastern Gurupi belt (adapted from Ribeiro, 2002).

The Ney Peixoto granite (Fig. 1) is similar to the peralumi-nous granitoids described above. However, zircon dating in-dicates that this granite was emplaced in the Neoproterozoicat 549 ± 4 Ma (Palheta, 2001). An isolated body of metamor-phosed nepheline-syenite is also of Neoproterozoic age andcrops out within the Phanerozoic sedimentary cover. Thisbody shows gneissic banding without any observed contact re-lationships (Fig. 1). A concordant zircon age of 732 ± 7 Ma(U-Pb, LAM-ICP-MS) was obtained by Klein et al. (2005b)and interpreted as the emplacement age of the nepheline
syenite. In addition to these two Neoproterozoic intrusions,most of the Paleoproterozoic units of the Gurupi belt showsome imprint of a Neoproterozoic event, recorded by mineralRb-Sr and K-Ar data, mostly in the range of 520 to 670 Ma(Almeida et al., 1968; Villas, 1982), in clear contrast to thecratonic area. Small sedimentary basins formed in depres-sions of both the São Luís craton and the Gurupi belt (Fig. 1)and likely represent postorogenic (molassic?) basins relatedto the final stages of Neoproterozoic events (Klein et al.2005b, c).
THE OROGENIC CHEGA TUDO GOLD DEPOSIT, GURUPI BELT, BRAZIL 961
0361-0128/98/000/000-00 $6.00 961
Gneisses
Tonalites
Metasedimentary rocks
Metavolcanic rocks
Che
gaTu
doF
orm
atio
n
1 km
Structures
Orebodies
Cross section
Sectors of the depositMD - MandiocalMV - Mina Velha
N
350000E
9750
000N
Tonalite
Volcanoclastic rocks
Dacite
Andesite
Carbonaceous schist
Ore bodies
DDH Drill holes
SW NE
50 m
+
A
A’
A)
B)
A - A’ MD
MV
Gabbro dikes+100 m
Saprolite
+50 m
+ 0 m
-50 m
-100 m
FIG. 3. A. Geologic map of the Chega Tudo deposit (after Torresini, 2000). B. Cross section of the Mandiocal orebody(modified from Torresini, 2000, and Ribeiro, 2002).

Integrated geologic and geochronologic data suggest thatthe rocks of Gurupi belt and of the nearby São Luís cratonhad a common orogenic evolution in the Paleoproterozoic(Rhyacian). Juvenile, arc- and subduction-related processesoccurred early in this period during the accretionary phase ofthe orogenesis between 2167 and 2150 Ma and are recordedin the widespread calc-alkaline magmatism represented bythe batholiths of the Tromaí Intrusive Suite and metavolcanicrocks present in the Aurizona Group and Chega Tudo For-mation. The Gurupi belt records the collisional phase of theorogenesis, probably along a continental margin, which wasthe locus of emplacement of peraluminous granitoids and ofextensive metamorphism and deformation between 2100 and2080 Ma. This evolution and the age intervals are largely co-incident with the Transamazonian and Eburnean orogeniesthat are widespread in the South American platform and WestAfrican craton, respectively. This crustal block amalgamatedin the Paleoproterozoic and was rifted in the Neoproterozoic,as indicated by the intrusion of the nepheline syenite at 732Ma. The newly formed rift probably evolved into a continen-tal margin that subsequently closed during theBrasiliano–Pan-African orogenies (Klein et al., 2005b, c).
Structural framework
Most of the gold deposits and showings of the Gurupi belt,including Chega Tudo, are hosted in structures associatedwith the strike-slip, sinistral Tentugal shear zone (Figs. 1, 2).This major structure consists of a ~15-km-long and 15- to 30-km-wide corridor of shear zones with variable structural as-pects developed under ductile-brittle and greenschist faciesconditions. Integrating structural and lithologic mapping withgeophysical and radar imagery information, Ribeiro (2002)recognized a corridor of highly strained rocks striking domi-nantly N 40° W and characterized by concentrated strain anddisplacements reflecting distinct rheology or competencycontrasts. The highly strained rocks correspond tometapelites and metavolcanic rocks of the Chega Tudo For-mation (Klein et al., 2005b), whereas the less deformed rockscorrespond to coarse-grained tonalites (Tromaí IntrusiveSuite) and quartz-feldspathic schists (Gurupi Group?) to thenortheast and southwest, respectively. Ribeiro (2002) also de-scribed a complex and protracted structural evolution for theregion, with the N 40° W-trending structures transposed bynorth-northwest–south-southeast–trending ductile struc-tures, along with the formation of a north-south–striking faultsystem and associated splays that have subsequently been re-activated and displaced by small-scale thrusts and east-west–oriented strike-slip faults.
A problem that stems from this complexity and from thepolycyclic evolution of the Gurupi belt is the difficulty in de-termining unequivocally whether the structural features havebeen produced during a single and progressive deformationalevent or whether they represent two or more events. Fromfield relationships and geochronologic information it is clearthat a metamorphic event and associated intrusion of at leastone syntectonic body of peraluminous granite occurred atabout 2080 to 2100 Ma (Klein et al., 2005b). However, inNeoproterozoic time, all these Paleoproterozoic rocks hadtheir Rb-Sr and K-Ar systems reset to some extent by theBrasiliano–Pan-African orogenies.
Metamorphism
The rocks of the Chega Tudo Formation, which hosts theChega Tudo deposit and most of the gold mineralization ofthe Gurupi belt, have been variably metamorphosed fromsubgreenschist to lower amphibolite, but predominantlygreenschist facies conditions. The metamorphic assemblagesconsist mostly of chlorite-sericite, chlorite-carbonate-epidote,chlorite-biotite-epidote-actinolite-muscovite-albite, and chlo-rite-biotite-plagioclase-amphibole, from the lowest to thehighest grades (Pastana, 1995; Ribeiro, 2002; Yamaguti andVillas, 2003). The peak metamorphic conditions attained tem-peratures and pressures of 420° to 450°C and 2 to 3 kbars, re-spectively (Yamaguti and Villas, 2003). This metamorphicevent is estimated to have occurred at about 2080 to 2100 Ma,based on the age of emplacement of the muscovite-bearing(collision-related) peraluminous granitoids (Palheta, 2001;Klein et al., 2005b).
Deposit Geology and Gold MineralizationThe Chega Tudo deposit comprises a series of discontinu-
ous orebodies that are confined to highly strained rocks re-lated to 50- to 150-m-wide shear zones developed over thevolcanosedimentary rocks of the Chega Tudo Formation atthe zone of contact between this formation and tonalites ofthe Tromaí Intrusive Suite (Fig. 2). This set of orebodies ex-tends to over 2,000 m in length and to at least 200 m in depth(Fig. 3). The orebodies are broadly conformable to the sub-vertical mylonitic foliation, parallel to the strike and having ir-regular to lens and cigar shapes (Torresini, 2000; Ribeiro,2002).
Gold mineralization occurred in two parallel domains, inmetavolcanic and metasedimentary rocks, that show somedifferences in the structural and mineralogical characteristics.In the metasedimentary domain the mineralization is hostedin schists composed of quartz, sericite, and millimeter-thicklayers of magnetite, and in subordinate carbonaceous andsericite-chlorite–bearing schists (Ribeiro, 2002). The miner-alized zone is rather restricted and discontinuous and consistsof small, fracture-filling veinlets of quartz, calcite, and pyritethat are concordant with the foliation. This style is similar tothat described for the Serrinha deposit (Klein et al., 2006a)located southeast of Chega Tudo. Hydrothermal magnetite isalso present and more abundant than pyrite, possibly derivedfrom remobilization of sedimentary magnetite of the hostrocks. Late-stage gabbro dikes are also hydrothermally al-tered, with the development of epidote, sericite, and espe-cially chlorite. This rock is only weakly mineralized and re-garded as waste (Torresini, 2000; Ribeiro, 2002).
This study is concentrated on the Mina Velha and Mandio-cal orebodies of the Chega Tudo deposit (Figs. 2, 3), whichare representative of the more important styles of mineraliza-tion of the metavolcanic domain.
Mina Velha orebody
The Mina Velha orebody is characterized by vein-style min-eralization and only the surface portion of the vein has beensampled. Gold is contained in a set of massive milky quartzveins (Fig. 4A), each approximately 50 cm in thickness and 20to 100 m in length. These veins have subvertical dips and
962 KLEIN ET AL.
0361-0128/98/000/000-00 $6.00 962

strike to N 35° W. Collectively, they form a set of en echelonveins that are broadly conformable with the regional foliationand the local mylonitic fabric (N 40°–45° W/80°–85° SW),corresponding to oblique shear veins, in the sense of Hodg-son (1989), that have been reoriented parallel to the shearzone walls during progressive deformation.
The host rock is a magnetite-bearing quartz-sericite schistwith interlayered tuffs and felsic to intermediate metavol-canic rocks. Narrow halos composed of seams of white micasurround the veins. Free gold is commonly visible (Fig. 4A),especially at the vein-wall rock contacts as aggregates or ir-regularly shaped particles of <1 mm, but this gold lacks anyclear association with concentrations of sulfide minerals.
Mandiocal orebody
In the Mandiocal orebody, diamond drilling attained adepth of ~140 m, intersecting several mineralized zones. Tworepresentative zones have been sampled for this study at level69-77m, grading >1 ppm (here referred to as the intermedi-ate zone), and at level 96-97m, grading ~0.5 ppm near thecontact with the metasedimentary domain (here referred toas the lower zone). In both the intermediate and lower zones,the mineralization consists of millimeter- to centimeter-thickquartz (±calcite, ±sulfide) veinlets and enclosing altered hostrocks. The gold-bearing veinlets are located mostly within thefoliation of the highly strained host dacite, but they also cutacross the foliation (Fig. 4B).
The host rock to the mineralization is predominantly daciteporphyry, along with minor rhyolite, andesite, and volcani-clastic rocks (Figs. 3B, 4B). The dacite contains porphyro-clastic quartz and more or less saussuritized plagioclase set ina fine-grained mylonitic matrix (Fig. 4C, D) composed ofquartz, plagioclase, K-feldspar, and minor biotite. Preservedprimary volcanic textures are found in less deformed lensesbetween highly strained zones. The metamorphism of the vol-canic rocks produced an assemblage composed essentially ofquartz, sericite, chlorite, carbonate, and epidote.
The pervasive hydrothermal alteration associated with thegold mineralization overprinted the metamorphic assem-blage. This is indicated by veining, syntectonic crystallizationof minerals in foliation planes, replacement and texturally de-structive alteration, an increase in modal proportions of alter-ation minerals, and development of bleached zones that ob-scure the metamorphic texture. In addition to gold, thehydrothermal assemblage is composed of variable propor-tions of quartz, chlorite, white mica, calcite, and sulfide min-erals, and the interpreted paragenesis is shown in Figure 5.
A complex brittle-ductile deformation history is indicated bychanges in the thickness of the veinlets, undulose extinction ofquartz of variable intensities, grain-size reduction, recrystal-lization, development of mosaics of hexagonal grains, and frac-turing. In places, quartz occurs as large crystals, more or lesspreserved from plastic deformation. Fibrous aggregates ofquartz, locally accompanied by chlorite, also are commonly
THE OROGENIC CHEGA TUDO GOLD DEPOSIT, GURUPI BELT, BRAZIL 963
0361-0128/98/000/000-00 $6.00 963
2 cm
A
C
0.2 mm
D
0.2 mm
py
qz qz-cc
py
pyB
FIG. 4. Images of vein and host rocks of the Chega Tudo deposit. A. Massive milky quartz vein with visible gold particlesand aggregates (arrows). B. Drill core slabs showing aspects of the mineralization and host rocks. Quartz and quartz-calciteveinlets hosted in deformed rhyodacite and dacite. Pyrite is distributed along fractures, foliation, and as disseminations. C.Photomicrograph of deformed dacite showing large porphyroclasts of quartz and plagioclase set in a sulfidized mylonite ma-trix. D. Photomicrograph of deformed dacite with quartz porphyroclasts set in sericite-rich mylonite matrix. Mineral abbre-viations: cc = calcite, py = pyrite, qz = quartz.

found in pressure shadows of large pyrite crystals (Fig. 6A, B).The development of these pressure shadows is ascribed to dif-fusional solute transport in a deforming rock at low metamor-phic grade, implying high fluid pressures with dissolution atthe high pressure side of pyrite and precipitation at the lowpressure side (Passchier and Trow, 1996). These features alsoindicate crystallization during the latest stages of deformationand foliation development (Witt, 1993). Moreover, the thick-ness of the quartz veinlets varies along strike, also suggesting arelationship between vein emplacement and the developmentof the hosting structure (Robert and Poulsen, 2001).
Chlorite occurs in a variety of textures and associations;most of the crystals have the longest dimension parallel to thefoliation planes, whereas other grains crystallized in fracturesof pyrite crystals and, in places, in association with quartz inpressure shadows of large pyrite crystals (Fig. 6A-D). Whitemica occurs mostly as aggregates of fine- to medium-grainedcrystals that define the foliation both in the host rock and inthe veinlets (Fig. 6C). Calcite is only a minor constituent ofthe veinlets (<5 vol %), occurring in association with chlorite,white mica, and sulfides.
Pyrite is by far the predominant sulfide mineral, occurringin all the studied samples. Two generations of pyrite havebeen recognized, and both contain traces of Au (±Bi, As, Sb,and Te) as detected by scanning electron microscope with
semiquantitative energy dispersive system analysis (SEM-EDS). Early pyrite (Fig. 6A, B) is made up of large subhedralto euhedral crystals disseminated in the host rocks. As notedabove, some crystals have fractures filled with chlorite (Fig.6D) and commonly quartz and chlorite in pressure fringes. Alater stage of pyrite is, in general, fine grained and has verysmall inclusions of ilmenite and rutile. It forms aggregatesand stringers within the foliation planes and within fracturesof the quartz veinlets, and disseminations in the host rocks,where it is associated with quartz, calcite, and white mica(Fig. 6C, E). It is possible that the later stage of pyrite formedat the expense of the early-stage pyrite through dissolutionand reprecipitation during deformation.
Sphalerite and galena have been recognized by SEM im-agery only as very fine inclusions (<60 µm) in pyrite or as in-dividual minerals in equilibrium with pyrite (Fig. 6F) in sam-ples of the intermediate zone. Chalcopyrite is also a verysubordinate phase and is more abundant in the lower zone.However, minor amounts of chalcopyrite precipitated in frac-tures in pyrite together with gold (Fig. 6G). Magnetite hasbeen observed in a few samples where it is spatially associatedwith sulfides, but only rarely in physical contact with the sul-fides, and it is much more abundant in the lower zone.
Gold occurs in association with sulfide concentrations asmicroscopic, irregularly shaped, and undeformed particlesthat precipitated in fractures in pyrite and quartz (Fig. 6G,H). Traces of gold also have been detected by SEM-EDSanalysis of pyrite and galena, and rarely in sphalerite of the in-termediate zone.
Locally, the hydrothermal alteration shows an asymmetriczoning at the centimeter scale (Fig. 6E). In this case, quartzveinlets are surrounded by proximal calcite (±pyrite), an in-termediate chlorite-rich zone composed of chlorite, quartz,calcite, white mica, and pyrite, and a distal zone composed ofwhite mica, quartz, pyrite, and minor calcite. As a whole, cal-cite contents increase and white mica contents decrease to-ward the vein.
Timing of Gold MineralizationThe petrographic and structural evidence suggest that the
hydrothermal alteration was syn- to late tectonic with respectto development of the hosting structures and occurred afterthe peak of metamorphism. The relative timing of gold min-eralization is constrained by the presence of undeformedgold particles in the vein-wall rock contacts at Mina Velha,and in fractures of quartz and pyrite crystals in the interme-diate and lower zones at Mandiocal. These features indicatethat mineralization was associated with a brittle episode thatoccurred late in the structural evolution of the host rocks.The relative timing of vein- and sulfide-hosted gold is, how-ever, uncertain.
The absolute timing of gold mineralization also is unknown.The minimum age of the host metavolcanic rocks is 2148 ± 1Ma (Klein and Moura, 2001). Preliminary step-leaching Pb-Pbdating of ore-related sulfides of the Cachoeira deposit (Kleinet al., 2006b), which is hosted in the same formation as ChegaTudo, does not record a Neoproterozoic event, and model andisochron ages are ~2000 Ma. Since the mineralization is post-metamorphic, the age of the Paleoproterozoic metamorphismin the Gurupi belt (2080–2100 Ma) is a maximum age for the
964 KLEIN ET AL.
0361-0128/98/000/000-00 $6.00 964
quartz
plagioclase
K-feldspar
biotite
epidote
calcite
white mica
chlorite
pyrite
chalcopyrite
sphalerite
galena
Au
rutile
ilmenite
magnetite
mineral - stage magmatic metamorphic hydrothermal
?
?
frac
turin
g
?
deformation
? ?
??
Fig. 5. Paragenetic sequences in distinct stages of the host rocks of theChega Tudo deposit. The thickness of the lines indicates the importance ofthe mineral in the hydrothermal paragenesis.

THE OROGENIC CHEGA TUDO GOLD DEPOSIT, GURUPI BELT, BRAZIL 965
0361-0128/98/000/000-00 $6.00 965
qz ccccchlser
1 cmE
0,1 mm
Au
Py
H
D
py
chl
chl
0.2 mm
B
py
0.2 mm
A
py
py
chl
qz
0.2 mm
C
py
chl
ser
F
0.02 mm
py
sph
chl
pypy AuAu
cpycpy
100mm100mm
qzqz
G
FIG. 6. Textural features of the host rocks and hydrothermal alteration of the Mandiocal orebody of the Chega Tudo de-posit. A. Large pyrite crystals (black) with pressure fringe composed of quartz and chlorite, set in a fine-grained hydrother-mal matrix. B. Seams of chlorite defining the foliation in an altered dacite. C. Deformed quartz veinlet (white) from level77m, with auriferous pyrite stringers and seams of sericite defining the foliation. D. Backscattered electron (BSE) imageshowing chlorite crystals at the margins and in fractures of a large pyrite grain. E. Polished slab from level 96.5m showingthe zoned alteration, with a quartz veinlet surrounded by a proximal calcite-rich zone, intermediate chlorite-rich zone, anddistal sericitic zone. F. BSE image showing coexisting pyrite and sphalerite. G. Photomicrograph of a pyrite crystal with afracture filled with gold and chalcopyrite. H. Gold and pyrite crystals in fractures of quartz. Mineral abbreviations: Au = gold,cc = calcite, chl = chlorite, cpy = chalcopyrite, py = pyrite, qz = quartz, ser = sericite (white mica), sph = sphalerite.

mineralizing episode. Assuming the probable correlation be-tween the Gurupi region and the Eburnean-Birimian se-quences of the West-African craton (Klein and Moura, 2008),this time interval is in reasonable agreement with the ages of2014 to 2098 Ma (Marcoux and Milési, 1993; Oberthür et al.,1998) estimated for other gold deposits in that craton.
Sampling and Analytical MethodsMicroprobe analysis of chlorite was carried out at the Uni-
versité Blaise Pascal in Clermont Ferrand, France, using aCameca SX-100 probe, coupled with a backscattered electron(BSE) system. Acceleration voltage was 15 kV, with 10 sec-onds counting time per element. Calibration was done withavailable natural and synthetic standards. FeO was consid-ered as total iron and H2O was calculated by stoichiometry.The analytical results were recalculated on the basis of 36 oxy-gen atoms (O, OH), 16 OH groups, and 8 atoms of Si + AlIV
(i.e., based on 28 atoms of oxygen equivalent). Fluid inclusion studies were carried out on quartz from
thick veins and small quartz ± carbonate veinlets. Samplepreparation and analytical procedures followed recommenda-tions of Roedder (1984) and Shepherd et al. (1985). After pet-rographic examination, the microthermometric work was per-formed using a Chaixmeca heating-freezing stage at theUniversidade Federal do Pará (UFPA), in Belém, Brazil. Cal-ibration was done with synthetic CO2 and H2O standards.Precision was estimated to be ±0.3°C for runs below 40°Cand ±3°C for runs above 40ºC. Raman analyses were carriedout at the Universidade Federal de Minas Gerais (UFMG), inBelo Horizonte, Brazil, using a Dilor XY spectrometerequipped with multiple collectors. The excitation source wasan Argon laser Ivanova 70-3 with a wavelength of 514.53 nmand 150 mW of power. Integration time was 10 seconds, with10 accumulations for each spectral line. Calibration was donewith mercury light and tests were performed for CO2, CH4,H2S, and N2.
Carbon, oxygen, and hydrogen isotope analyses were car-ried out at the Laboratoire des Isotopes Stables of the Uni-versité Jean Monnet (UJM) in Saint Etienne, France. Isotoperatios were measured using a Micromass-Isoprime gas-sourcemass spectrometer in dual-inlet mode. For carbonates, about5 to 10 mg of dry powders were used for isotopic determina-tions. The samples were reacted overnight in vacuum at25.2°C (McRae, 1950) with 2 ml of H3PO4 (100%). Analysisof duplicates produced differences of more than 0.2 per milfor both δ13C and δ18O, and the calcite-phosphoric acid frac-tionation factor of 1.01025 (Friedman and O’Neil, 1977) wasused in the correction procedure. Silicate minerals for oxygenand hydrogen analysis and sulfide minerals for sulfur analysiswere separated by conventional magnetic and heavy liquidstechniques and handpicked under binocular microscope.When carbonate minerals were present, they were removedby reaction with HCl. All mineral separates were estimated tobe >95 percent pure. For oxygen isotope analysis of silicateminerals, two methods were employed, both using BrF5 asreagent. The conventional fluorination method (Clayton andMayeda, 1963) was employed for hydrated minerals, and aCO2 laser fluorination system (Harris et al., 2000) was usedfor quartz analysis. In both methods oxygen was converted toCO2 by reaction with graphite. In the conventional method,
samples were loaded into Ni reaction vessels and degassed at250°C for about 2 hours. Oxygen was produced by reacting 5to 10 mg of samples with BrF5 at 550°C for 8 to 12 hours. Aninternal standard (MQ quartz, δ18O = +10.1‰) was analyzedto calibrate the data to the V-SMOW scale. The mean valuesobtained from repeated analyses MQ gave a difference of 0.3per mil from the accepted value. In the laser system oxygenwas produced by heating quartz grains weighing typically 2 to4 mg with a 40 W CO2 laser in atmosphere of BrF5. An inter-nal standard (MONGT, δ18O = +5.55‰) was analyzed to cal-ibrate the date to the V-SMOW scale. The technique of rapidheating using a defocused beam (Spicuzza et al., 1998) wasused to minimize sample loss during the reaction, and yieldswere on average 92 percent of the expected amount forquartz. Duplicates gave agreement within 0.2 per mil. Hy-drogen was produced by heating 10 to 30 mg of mineral con-centrates in vacuum, following procedures described in Ven-nemann and O’Neil (1993) and using a CuO furnace. Waterwas purified cryogenically and then reduced to H2 by reactionwith “Indiana Zinc” at 450°C, according to proceduresadapted from Coleman et al. (1982). An internal silicate stan-dard (AM muscovite, δD = –30‰) furnished a mean value of–30.5 per mil that was used to calibrate the data to the V-SMOW scale. Reproducibility is estimated to have been bet-ter than 4 per mil. Inclusion fluids (H2O, CO2) were liberatedby decrepitation of fluid inclusions during heating of 1 to 2 gof quartz (fragments <3 mm) at temperatures >800°C. Thequartz fragments were previously cleaned with HCl andHNO3 and degassed at 200° and 300°C. The obtained waterand CO2 were trapped cryogenically and analyzed for hydro-gen and carbon isotopes, respectively. Sulfur isotopes wereanalyzed in a Finnigan MAT 252 mass spectrometer at theStable Isotope and ICP/MS Laboratory of the Queen’s Uni-versity, Kingston, Canada. For sulfur analysis, SO2 was pro-duced from 3 to 5 mg of pyrite loaded into tin capsules andreacted with CuO at 1,400°C in a He stream, using the Ther-mal Conversion/Elemental Analyzer-Isotope Ratio MassSpectrometer technique. The analytical uncertainty for δ34Swas 0.5 per mil. The 13C/12C, 18O/16O, D/H, and 34S/32S ratiosare reported in the delta notation, normalized to the PDB(carbon), V-SMOW (oxygen and hydrogen), and CDT (sulfur)scales.
Chlorite GeochemistryThe chlorite chemical composition was determined in a
sample from the lower zone of the Chega Tudo deposit (Table1). All the analyzed crystals are classified as daphnite (Fig.7A) according to Hey (1954), with high iron content given byFe/(Fe + Mg) ratios in the 0.80 to 0.85 range. The AlIV valuesvary between 2.84 and 2.97 atoms per formula unit (a.p.f.u),and the Ca + Na + K sum is always lower than 0.05 a.p.f.u.Despite the small variation, the Fe/(Fe+Mg) and AlIV para-meters show positive correlation (figure not included). Theseresults, showing relatively homogeneous chemical composi-tion, indicate that the chlorite attained chemical equilibriumwith the hydrothermal fluid, but formation temperaturescould not be calculated because the chlorite analyses plotbelow the Al saturation line on the Al-Mg-Fe plot (Fig. 7B),which makes them unsuitable for geothermometry (Cathelin-eau, 1988; Kranidiotis and MacLean, 1987).
966 KLEIN ET AL.
0361-0128/98/000/000-00 $6.00 966

Fluid Inclusion StudiesThe fluid inclusion study covers different vertical portions
of the metavolcanic domain of the deposit. Analyses havebeen conducted on a gold-bearing, thick milky massivequartz vein from a surface exposure at Mina Velha and ongold-bearing quartz ± calcite veinlets from the intermediateand lower mineralized zones at Mandiocal. Fifteen polishedsections were examined under the microscope; of these, fivethat contained workable fluid inclusions were selected tocarry out the microthermometric study. Over 200 inclusionswere investigated by microthermometry, and the results areprovided in a digital supplement to this paper at <http://www.geoscienceworld.org/> (or, for members and sub-scribers, on the SEG website, <http://www.segweb.org>).Measurements were made of solid CO2 melting temperature(TmCO2), clathrate melting temperature (Tmclathrate), CO2 ho-mogenization temperature (ThCO2), temperature of first ob-served melting (~eutectic) (Te), ice melting temperature(Tmice), total homogenization temperature (Th L or V, whereL stands for liquid and V for vapor). In addition, VCO2 is thevolumetric proportion of the carbonic phase (vol CO2/voltotal, in percentage), and Vg is the vapor volume (vol H2Ovapor/vol total, in percentage) in aqueous inclusions. Fluidcompositions were calculated with the computer program
THE OROGENIC CHEGA TUDO GOLD DEPOSIT, GURUPI BELT, BRAZIL 967
0361-0128/98/000/000-00 $6.00 967
TABLE 1. Chemical Composition of the Hydrothermal Chlorite from the Lower Level of the Mandiocal Orebody of the Chega Tudo Deposit
Analysis 82 83 84 86 88 90 92 93 99 100 101 103 104
SiO2 (wt %) 22.53 22.28 22.34 22.44 22.29 21.92 22.41 22.40 22.72 22.56 22.30 22.74 22.43Al2O3 20.91 21.40 20.75 21.41 21.66 20.62 21.48 21.21 21.11 20.94 21.33 21.62 21.45FeO 39.18 38.16 38.67 39.74 39.95 40.48 40.38 40.33 38.49 38.37 39.36 39.05 39.13MnO 0.54 0.55 0.52 0.53 0.46 0.53 0.57 0.52 0.42 0.53 0.48 0.44 0.46MgO 5.44 4.99 5.13 4.13 4.39 4.24 3.99 4.20 5.33 5.30 4.64 4.88 4.48CaO <0.01 0.03 <0.01 0.03 0.02 0.03 0.03 <0.01 <0.01 0.05 0.02 0.05 0.06Na2O 0.02 <0.01 <0.01 <0.01 0.05 0.05 0.08 <0.01 0.02 <0.01 0.01 <0.01 0.04K2O 0.03 0.02 <0.01 0.01 <0.01 0.01 <0.01 0.02 0.03 0.01 0.02 0.04 0.06H2O 10.57 10.47 10.43 10.50 10.56 10.37 10.55 10.52 10.56 10.51 10.50 10.63 10.51Total 98.65 97.43 97.41 98.29 98.82 97.88 98.94 98.68 98.12 97.76 98.16 98.82 98.11
Si 5.11 5.10 5.14 5.12 5.06 5.07 5.10 5.11 5.16 5.15 5.09 5.13 5.12Al 5.59 5.77 5.62 5.76 5.79 5.62 5.75 5.70 5.65 5.63 5.74 5.75 5.76Fe 7.43 7.31 7.43 7.59 7.59 7.83 7.68 7.69 7.31 7.33 7.52 7.37 7.47Mn 0.10 0.11 0.10 0.10 0.09 0.10 0.11 0.10 0.08 0.10 0.09 0.08 0.09Mg 1.84 1.70 1.76 1.41 1.49 1.46 1.35 1.43 1.80 1.80 1.58 1.64 1.52Ca 0.00 0.01 0.00 0.01 0.01 0.01 0.01 0.00 0.00 0.01 0.01 0.01 0.02Na 0.01 0.00 0.00 0.00 0.02 0.02 0.04 0.00 0.01 0.00 0.00 0.00 0.02K 0.01 0.01 0.00 0.00 0.00 0.00 0.00 0.01 0.01 0.00 0.01 0.01 0.02AlIV 2.888 2.898 2.864 2.876 2.938 2.928 2.903 2.890 2.840 2.850 2.907 2.869 2.882AlVI 2.70 2.87 2.75 2.88 2.86 2.69 2.85 2.81 2.81 2.78 2.83 2.88 2.88Fe/(Fe+Mg) 0.802 0.811 0.809 0.844 0.836 0.843 0.850 0.843 0.802 0.802 0.826 0.818 0.830Si/Al 0.91 0.88 0.91 0.89 0.87 0.90 0.89 0.90 0.91 0.91 0.89 0.89 0.89Ca+Na+K 0.02 0.01 0.00 0.01 0.03 0.03 0.04 0.01 0.02 0.02 0.02 0.02 0.05Total cations 20.10 20.01 20.05 19.99 20.04 20.12 20.04 20.04 20.02 20.03 20.04 19.99 20.01
0
2
4
6
8
10
12
4 4.5 5 5.5 6 6.5 7 7.5 8Si (a.p.f.u)
Fe
(a.p
.f.u)
A)
Daphnite
AlIV
Mg Fe
B)
FIG. 7. A. Si versus Fe plot with the classification of chlorite from theMandiocal orebody of the Chega Tudo deposit (a.p.f.u = atoms per formulaunit). B. Ternary Al-Mg-Fe plot of the composition of the chlorite from theMandiocal orebody of the Chega Tudo deposit. The dotted line is the bound-ary between Al-saturated (above) and Al-undersaturated (below) chlorites.

developed by Bakker (2003), using the appropriate equationsof state for aqueous (Zhang and Frantz, 1987; Hall et al.,1988; Dubois and Marignac, 1997), aqueous-carbonic (Bow-ers and Helgeson, 1983; Duschek et al., 1990; Duan et al.,1992; Bakker, 1999), and carbonic fluid inclusions (Span andWagner, 1996).
Fluid inclusion types and distribution
The studied fluid inclusions show a variety of shapes, in-cluding irregular, ovoid, and negative crystal forms, and theirsizes vary between 5 and 12 µm, irrespective of the mineral-ized zone. Based on phase proportions at room and subzerotemperatures, textural relationships, and microthermometricand microRaman results, five compositional types of fluid in-clusions have been distinguished: (1) type 1: carbonic (rare,one-phase CO2-CH4 inclusions), (2) type 2a: aqueous-car-bonic (abundant, two-phase CO2-CH4-H2O-salt inclusions),(3) type 2b: aqueous-carbonic (subordinate two-phase CO2-H2O-salt inclusions), (4) type 3a: aqueous (abundant two-phase H2O-NaCl-MgCl2 inclusions), and (5) type 3b: aqueous(abundant two-phase H2O-NaCl-KCl inclusions).
In a thick vein from Mina Velha, medium- to coarse-grained quartz shows weakly to moderate undulose extinc-tion. Fluid inclusions are randomly distributed or form large,three-dimensional arrangements (Fig. 8A). Only a few aque-ous-carbonic inclusions of type 2b were identified with theCO2 bubble occupying between 20 and 40 percent of the totalvolume.
The majority of the inclusions at Mina Velha are two-phaseaqueous inclusions with a vapor bubble occupying <10 per-cent of the inclusion volume. Two petrographic subtypeshave been distinguished (Table 2); type 3a are isolated andrandomly distributed inclusions, whereas type 3b are sec-ondary trail-bound inclusions.
The quartz vein from level 77m (intermediate zone) con-tains stringers of pyrite along fractures parallel to the foliation(Fig. 6C) as well as small euhedral to subhedral crystals of cal-cite. Large crystals of quartz are abundant and show variableeffects of ductile deformation, such as subgrain development,deformation lamellae, and strong undulose extinction. How-ever, some large crystals have been preserved from deforma-tion and show straight extinction, allowing the fluid inclusionpetrographic and microthermometric work to be done (Figs.6H, 8 and 9). Fluid inclusions in these relics are distributedin several ways: in isolation, three-dimensional clusters, andplanes (Fig. 8B, C) and intergranular contacts.
Both CO2-bearing and aqueous inclusions were identifiedin the intermediate zone. The CO2-bearing inclusions includesubordinate one-phase carbonic (type 1) inclusions coexistingwith two-phase aqueous-carbonic inclusions (type 2a). Thetype 2a are abundant inclusions and show variable phase pro-portions, but the CO2 phase occupies 15 to 30 vol percent.
As in the surface vein, two populations of aqueous inclu-sions were also documented in the intermediate zone (Table2). However, only a few individuals of the type 3a inclusionsare spatially associated with the type 1 and 2a inclusions, and
968 KLEIN ET AL.
0361-0128/98/000/000-00 $6.00 968
A
50 mm
C
10 mm
B
20 mm
D
20 mm
FIG. 8. Photomicrographs showing types and distribution of fluid inclusions in quartz from the Chega Tudo deposit. PhotoA is from the Mina Velha vein and B to D photos are from the Mandiocal orebody. A. Discrete clusters of aqueous-carbonicfluid inclusions (black arrows) and aqueous inclusions distributed in clusters and trails (white arrow). B. Isolated carbonicand aqueous-carbonic inclusions. Note the trails in the left and right margins of the photograph with evidence of neckingdown. C. Random, three-dimensional distribution of aqueous-carbonic fluid inclusions. D. Random and trail-bound aque-ous inclusions.

type 3b is texturally late with respect to the other types, oc-curring in sharp trails.
In the lower zone (levels 96m–96.5m), quartz occurs in mil-limeter-thick veinlets, with variable grain sizes, serrated to
sharp contacts, weak to moderate undulose extinction, andminor subgrain development. The fluid inclusions are eitherrandomly distributed or they occur in healed microfracturesthat are mainly orthogonal to the vein walls. Type 2a aqueous-carbonic inclusions are subordinate, being observed only intwo clusters. Type 2a inclusions that have apparently not beenaffected by deformation have VCO2 typically in the 15 to 30percent range, but they are small (mostly <5 µm), whichmakes the observation of some phase changes difficult.
Type 3a aqueous inclusions are also very subordinate, hav-ing Vg of 5 to 10 vol percent. The predominant inclusions areaqueous type 3b inclusions with a small vapor phase (<5 vol%) that occurs either in trails or randomly distributed (Fig.8D). In some samples they are the only type present.
We can not unequivocally relate any specific fluid inclusiontype to gold mineralization, since we have not found gold par-ticles in fluid inclusion cavities. However, the fluid inclusionstudy was performed in gold-bearing samples that are repre-sentative of the gold-quartz vein of Mina Velha (Fig. 4A) andgold-pyrite-quartz veinlet of the Mandiocal orebody (Fig. 6H).Therefore, we consider that the trapped fluids are representa-tive of the evolution of the hydrothermal system (see below).
Microthermometry and Raman spectroscopic results
At Mina Velha, the melting of the solid CO2 phase in type 2binclusions was recorded at –56.6°C, indicating that the car-bonic phase is composed of pure CO2. The homogenization ofthe CO2 into liquid occurred between 13.4° and 14.2°C. Twomeasurements of the clathrate melting were recorded at 8.1°
THE OROGENIC CHEGA TUDO GOLD DEPOSIT, GURUPI BELT, BRAZIL 969
0361-0128/98/000/000-00 $6.00 969
TABLE 2. Summary of the Microthermometric Data of Fluid Inclusions and Calculated Fluid Composition for Distinct Mineralized Orebodies and Vein Styles of the Chega Tudo Deposit
Mina Velha Mandiocal
Upper level Intermediate level Lower level
Carbonic Type 1System - CO2-CH4 -Abundance Absent Rare Absent
Aqueous–carbonic Type 2b Type 2a Type 2a (2b?)System CO2-H2O-NaCl CO2-CH4-H2O-NaCl CO2-(± CH4)-H2O-NaClAbundance Rare Abundant SubordinateVCO2 % 20–40 15–30 15–30TmCO2 (°C) –56.6 –59.5 to –57.0 –57.6 to –56.6Tmclathrate (°C) 8.1–9.0 3.5–8.7 9.2–9.5wt % NaCl equiv 1.6–2.5 2.2–11.5 1.6ThCO2 (°C) 13.4–14.0 9–17.9 14.0–15.0CO2 density g/cm3 0.82–0.83 0.79–0.85 0.82–0.83bulk density g/cm3 0.93–0.96 0,83–0,86 0,93–0.96XCO2 0.11–0.21 0.12–0.59 0.11–0.13XCH4 - 0.01–0.06 0–0.02XH2O 0.78–0.88 0.40–0.88 0.86XNaCl 0.01 0.01–0.07 0.01Th (°C) 332–339 310–410 327–409
Aqueous Type 3a Type 3b Type 3a Type 3b Type 3a Type 3bSystem NaCl-MgCl2 NaCl-KCl NaCl-MgCl2 NaCl-KCl NaCl-MgCl2 NaCl-KClAbundance Abundant Abundant Rare Abundant Rare AbundantVg (%) 5–10 <5 15–20 <5 5–10 <5Te (°C) –34 –25 <–30 –22 <–34 –22 to –24Tmice °C –1.4 to –3.3 –0.1 to –2.6 –1.1 to –4.1 –2.1 to –8.5 –0.3 to –6.1 –0.3 to –7.6Wt % NaCl equiv 2.5–5.5 0.2–4.2 2.0–6.7 3.4–12.3 0.5–9.3 0.5–11.2Bulk density g/cm3 0.63–0.88 0.89–0.96 0.54–0.68 0.89–1.02 0.78–0.87 0.93–1.00Th (°C) 242–346 107–195 289–371 101–199 205–259 95–167
0.020 mm
Type 1Type 2aType 3aempty inclusions
grainboundary
FIG. 9. Sketch showing the distribution and textural relationships betweendifferent fluid inclusion types in a single quartz crystal. Note the scarcity ofinclusions and the presence of empty inclusions along grain boundaries. Sam-ple from level 77m.

and 9.0°C, and the final homogenization into the liquid phaseoccurred between 332° and 339°C (Fig. 10).
Type 3a aqueous inclusions homogenize into liquid be-tween 242° and 346°C, and the secondary type 3b inclusionshomogenized between 107° and 195°C, also into liquid. Bothsubtypes have broadly the same range of ice-melting temper-atures, from –1.4° to –3.4°C and –0.1° to –2.6°C, respectively(Fig. 10). However, ice first melting was observed at about–34°C in type 3a, and –25°C in type 3b, indicating distinctchemical systems for the two subtypes.
In the intermediate zone at Mandiocal, the TmCO2 in bothtype 1 and 2a inclusions was recorded between –59.5° and–57.0°C (Fig. 10A), whereas Th CO2 into liquid ranges from 9°to 17.9°C (Fig. 10B). Raman spectroscopic analysis confirmedthat the carbonic phase is composed dominantly of CO2, withsubordinate amounts of CH4 (up to 10% of the volatile phase).Clathrates melted between 3.5° and 8.7°C, with a sharp modeat 7.4°C (Fig. 10C). A spread in the Th data of these inclusionsis observed, with homogenization occurring both to the liquidand gaseous phases, from 250° to 460°C. However, most of thevalues concentrate in the 310° to 410°C range, and a well-defined mode is observed at 355°C (Fig. 10D).
In type 3a inclusions, Te is about –32°C, the vapor phaseoccupies 15 to 30 percent of the total volume, Tmice is in the–1.1° to –4.1°C range, and the Th into liquid varies from 289°to 371°C (Fig. 10D). Most of the aqueous inclusions, how-ever, are texturally late type 3b inclusions. They have a smallvapor bubble (Vg <5%), the eutectic melting temperature isabout –22°C, Tmice between –2.1° and –8.5°C, and the finalhomogenization into liquid occurred below 200°C.
In the lower zone at Mandiocal, the subordinate type 2a in-clusions show TmCO2 between –57.6° and –56.6°C, suggestingthe large predominance of CO2 in the carbonic phase. How-ever, the small depression of TmCO2 means that some CH4
may also be present in the volatile phase. ThCO2 was recordedat about 15°C into liquid. A few observed clathrates meltedbetween 9.2° and 9.5°C. The final homogenization, mostly tothe liquid phase, varies from 327° to 456°C, mainly between327° and 340°C (Fig. 10). Inclusions with VCO2 of 50 to 70percent have the highest homogenization temperatures(>400°C). They are located close to necked inclusions andhave probably been modified.
The few type 3a inclusions show Te <–34°C, final ice meltingfrom –0.3° to –6.1°C and Th(L) >205°C. Type 3b inclusions
970 KLEIN ET AL.
0361-0128/98/000/000-00 $6.00 970
frequ
ency
Tmclat (°C)
C)MV (Type 2b)
77m (Type 2a)
96m (Type 2b)
6 8 10 12 14 16 18 20
ThCO (°C)2
0
1
2
3
4
5
frequ
ency
B)MV (Type 2b)
77m (Type 2a)
96m (Type 2b)
77m (Type 1)
Th (°C)
MV (Type 2b)
MV (Type 3a)
77m (Type 2a)
77m (Type 3a)
96m (Type 2b)
D)
frequ
ency
-60,0 -59,0 -58,0 -57,0 -56,0TmCO (°C)2
A) MV (Type 2b)
77m (Type 2a)
96m (Type 2b)
77m (Type 1)
frequ
ency
96m (Type 3a)
3 4 5 6 7 8 9 10 200 250 300 250 400 450 500
8
7
6
5
4
1
2
3
0
14
12
10
8
6
4
2
0
6
5
4
1
2
3
0
FIG. 10. Frequency histograms of microthermometric data for aqueous-carbonic and aqueous fluid inclusions of the MinaVelha and Mandiocal orebodies of the Chega Tudo deposit. A. CO2 melting (TmCO2). B. Homogenization of CO2 (ThCO2).C. Clathrate melting (Tmclat). D. Final homogenization (Th).

show Te between –22° and –24°C, final ice melting in the–0.3° to –7.6°C range, and final homogenization into liquidbetween 95° and 167°C.
Interpretation of Fluid Inclusion Data
Fluid inclusion populations, composition, and density
The five types of fluid inclusions recognized at Chega Tudocorrespond to five compositional groups: (1) CO2-CH4 (type1), (2) CO2-CH4-H2O-NaCl (type 2a), (3) CO2-H2O-NaCl(type 2b), (4) H2O-MgCl2 (type 3a), and (5) H2O-NaCl-KCl(type 3b). These groups show some differences in their dis-tribution, association, and composition within distinct miner-alized zones, from surface down to 100 m in depth. A sum-mary of the microthermometric results and calculatedcompositional data for each type is presented in Table 2.
The assemblage formed by types 2b and 3a occurs in theupper zone of the Mina Velha vein. Modeled in the CO2-H2O-NaCl system (type 2b inclusions) this fluid is composed of 11 to21 mol percent of CO2 (mostly 11–13 mol %), 78 tp 88 mol per-cent of H2O, and has a salinity of 1.6 to 2.5 wt percent NaClequiv. CO2 density is 0.82 to 0.83 g/cm3, and the bulk density isbetween 0.93 and 0.96g/cm3. The aqueous (Type 3a) inclusionshave more variable salinity, between 2.0 and 6.7 weight percentNaCl equivalent. These aqueous inclusions contain other saltcomponents in addition to, or instead of, NaCl, which may beMgCl2, as suggested by eutectic temperatures around –34°C(Crawford, 1981; Dubois and Marignac, 1997).
The types 1 and 2a fluid inclusions occur in close associa-tion, showing the same volatile composition and form a singlefluid inclusion assemblage that is restricted to the intermedi-ate zone of the Mandiocal orebody, and that may or may notbe genetically associated with the few type 3a fluid inclusions.The composition of the fluid represented by these inclusions,modeled in the CO2-CH4-H2O-NaCl system, is 12 to 59 molpercent CO2 (typically lower than 22 mol %), 1 to 6 molpercent CH4, 40 to 88 mol percent H2O, and 1 to 7 mol per-cent NaCl (Table 2). A low salinity, averaging 5.8 ± 2.7 wt per-cent NaCl equiv, is estimated from Tmclathrate. Despite thepresence of CH4, which might cause the underestimation ofsalinity (Collins, 1979), the low molar proportion of CH4 sug-gests that the estimated values are a good approximation ofthe salinity of the fluid. The CO2 density varies between 0.79and 0.85 g/cm3, and the bulk density is moderate to high, inthe range of 0.83 to 0.96 g/cm3.
This CO2-CH4–bearing fluid also occurs in subordinateamounts in the lower zone, without the type 1 inclusions.However, it appears that the type 2a fluid in this zone is sim-ilar to the 2a and especially 2b types (Table 2), and probablywere trapped at the same time.
Type 3b inclusions are most likely composed of NaCl andKCl, as suggested by the eutectic melting temperatures of–22° and –25°C, respectively. This fluid was trapped late inthe hydrothermal history of the deposit and will not be con-sidered further.
Fluid behavior
When dealing with shear-zone hosted vein quartz gold de-posits, it is always important to consider the role of posten-trapment modifications on fluid inclusions (e.g., diffusion and
preferential removal of water induced by deformation: Hol-lister, 1990; Hall and Sterner, 1993; Huizenga and Touret,1999). Relict crystals exhibiting minimal effects of strain anda reduced number of workable but apparently unmodifiedfluid inclusions were chosen for microthermometric mea-surements in order to minimize possible effects of such mod-ifications. Nevertheless, postentrapment changes are still rec-ognized in some investigated inclusions. For example, boththe highest CO2(±CH4)/H2O ratios and final homogenizationtemperatures of some aqueous-carbonic inclusions (>400°C),and the vertical trends in the Th versus salinity plot (Fig. 11)may indicate partial leakage (e.g., Shepherd et al., 1985). Thepresence of dark, empty cavities close to grain boundaries insome microscopic domains (Fig. 9) may also indicate leakageduring deformation.
However, the variation in the composition of the volatilephase, especially the CH4 content, cannot be explained bypostentrapment modification. The enrichment of the fluid inCH4 could be caused by H2 diffusion into the fluid inclusion,according to the reaction,
CO2 + 4H2 = CH4 + 2H2O (1)
(Huizenga, 2001). This process could also explain some vari-ation in the δD values of the fluids (see the Stable Isotopessection below), but it does not explain the variation in the oxy-gen isotope composition. We interpret that the variation inthe composition of the volatile phase (and of the inclusion flu-ids as a whole) arises from the entrapment of distinct fluids orby the evolution of a single primary fluid.
A correlation between trapping temperatures and salinities(e.g., Cathelineau and Marignac, 1994) is expected if fluidshaving contrasting temperatures and/or salinities have mixed.Such relationship can be inferred for the aqueous-carbonic(type 2b) and the high-temperature aqueous (type 3a) inclu-sions present in samples from Mina Velha and the lower zoneof Mandiocal (Fig. 11). In this case, the trend could indicate
THE OROGENIC CHEGA TUDO GOLD DEPOSIT, GURUPI BELT, BRAZIL 971
0361-0128/98/000/000-00 $6.00 971
0
50
100
150
200
250
300
350
400
450
500
0 1 2 3 4 5 6 7 8 9 10 11 12 13
wt % NaCl equiv.
Th
(ºC
)
Type 2aType 2bType 3aType 3b
+
+
++++
FIG. 11. Final homogenization (Th) versus salinity (wt % NaCl equiv) di-agram. Vertical dashed lines indicate possible leakage or trends for neckingdown trends.

mixing of a hotter and more dilute CO2-bearing fluid with acolder and slightly more saline aqueous fluid.
During phase separation (fluid immiscibility) of a CO2-CH4-H2O-salt fluid, the CH4 content of the fluid decreasestoward the end of the process in response to the higher gasdistribution coefficient of the CH4 compared to CO2 (Drum-mond and Ohmoto, 1985). This may explain the CH4-bearingtype 2a fluid in deeper parts of the deposit.
At least some of the criteria used for the identification offluid immiscibility (Ramboz et al., 1982; Frantz et al., 1992)are satisfied. These include (1) the contemporaneous en-trapment of different fluid types, which is reflected in the co-existence of carbonic, aqueous-carbonic, and (subordinate)aqueous fluid inclusion in the intermediate zone, (2) homog-enization of the inclusions both to the liquid and vapor phasesover the same range of temperatures, (3) trapping of fluids inrandom proportions, which is observed to some extent, and(4) partitioning of salts into the aqueous-rich phase (Fig.12A). A fluid with the composition as determined at ChegaTudo (XCO2 < 22 mol %, ~5 wt % NaCl equiv) starts tounmix and enter the two-phase field at about 330° to 360°C
for pressures of 2 to 3 kbars (Bowers and Helgeson, 1983),which is in good agreement with the total homogenizationtemperatures of the fluid inclusions, and with the estimatedtrapping pressures (see below). Figure 12B shows that mostof the fluid inclusion pairs plot on or near the solvus of thesystem in the two-phase immiscibility field, thus supportingthe interpretation of fluid immiscibility occurring throughphase separation from a homogeneous original fluid.
Another possibility for the presence of CH4 at depth is thecontamination of a primary aqueous-carbonic fluid throughreaction with carbonaceous rocks that are part of the depositstratigraphy, according to the hydrolysis reaction,
C + 2H2O = CH4 + O2. (2)
This process is supported by the strongly negative δ13C valuesof the CO2 trapped in the fluid inclusions of the intermediatezone (Table 3). Alternatively, a CH4- or H2-bearing fluidcould have mixed with the CO2.
In summary, the different fluid inclusion types trapped inquartz of the Chega Tudo deposit show complex compositionalrelationships that may be interpreted as having been producedby one or a combination of the following processes: (1) trap-ping of an evolving CO2-CH4-H2O-NaCl fluid, with sporadicphase separation possibly affecting the CH4/CO2 ratio, (2) trap-ping of a CO2-CH4-H2O-NaCl fluid and of a CO2-H2O-NaClfluid in two discrete events or stages, also produced by immis-cibility, (3) trapping of an immiscible CO2-H2O-NaCl fluid thatacquired CH4 through reaction with carbon-bearing host rocks,and (4) mixing of aqueous-carbonic and aqueous fluids. Irre-spective of the process, fluid entrapment was accompanied byand/or followed by post-trapping modification.
Stable IsotopesThe results of stable isotope analyses are presented in Table
3. The quartz from mineralized veins has δ18O values of 11.2and 12.8 per mil in the Mina Velha vein, 14.2 per mil in theintermediate zone of Mandiocal, and +12.4 per mil in thelower zone of Mandiocal. In the barren alteration zone, theδ18O value of quartz is +11.2 per mil. White mica has a δ18Ovalue of +9.4 at Mina Velha and +10.7 and +8.2 per mil in theintermediate and lower zones, respectively, at Mandiocal.The δD values of these white mica samples are –39, –49 and–50 per mil, respectively. The chlorite sample from the lowerzone at Mandiocal has δ18O value of +9.3 per mil and δDvalue of –62 per mil. The water extracted from fluid inclu-sions has a δD value of –12 per mil at Mina Velha and –37 and–26 per mil in the intermediate and lower zones, respectively,of the Mandiocal orebody. The δ13C values of the CO2 ex-tracted from fluid inclusions are –6.9 per mil in the MinaVelha vein and –24.1 per mil in the intermediate zone of theMandiocal orebody. The calcite sample from the intermedi-ate zone has δ13C and δ18O values of –6.3 and +12.4 per mil,respectively. The pyrite from Mandiocal has a δ34S value of3.9 in a barren vein and values of 0.8 and 0.1 per mil in theintermediate and lower zones, respectively.
The oxygen isotope composition of the quartz is similar inMina Velha and in the barren and lower zones of the Man-diocal orebody (11.2–12.8‰), but it is distinct in the inter-mediate zone of Mandiocal (14.2‰). This variation mayimply that (1) fluids having different compositions but similar
972 KLEIN ET AL.
0361-0128/98/000/000-00 $6.00 972
10 20 30 40 50 60 70 80 90
90
80
H O2 CO2
NaCl
400°C2 kbars6 wt % NaCl
++
B)
+Type 1 (L)
Type 2b (L)
Type 2b (V)
Type 2a (L)
Type 2a (V)
Type 2 (L)
0 20 40 60 80 1000
1
2
3
4
5
6
7
XCO2
A)
XN
aCl
FIG. 12. Compositional relationships that may indicate fluid immiscibility.A. Calculated XCO2 versus XNaCl plot for type 2a and 2b aqueous-carbonicfluid inclusions. The arrow indicates a possible trend of decreasing salinity asXCO2 increases. B. Ternary diagram with the solvus for the CO2-H2O-NaClsystem at 350°C, 2 kbars, and 6 wt percent NaCl equiv (after Bowers andHelgeson, 1983). Liquid and vapor fields are linked by dashed tie lines, andthe diagram does not take into account the influence of CH4. The diagramshows pairs of type 2a and 2b fluid inclusions that homogenize to liquid (L)and vapor (V) in the same cluster or trail.
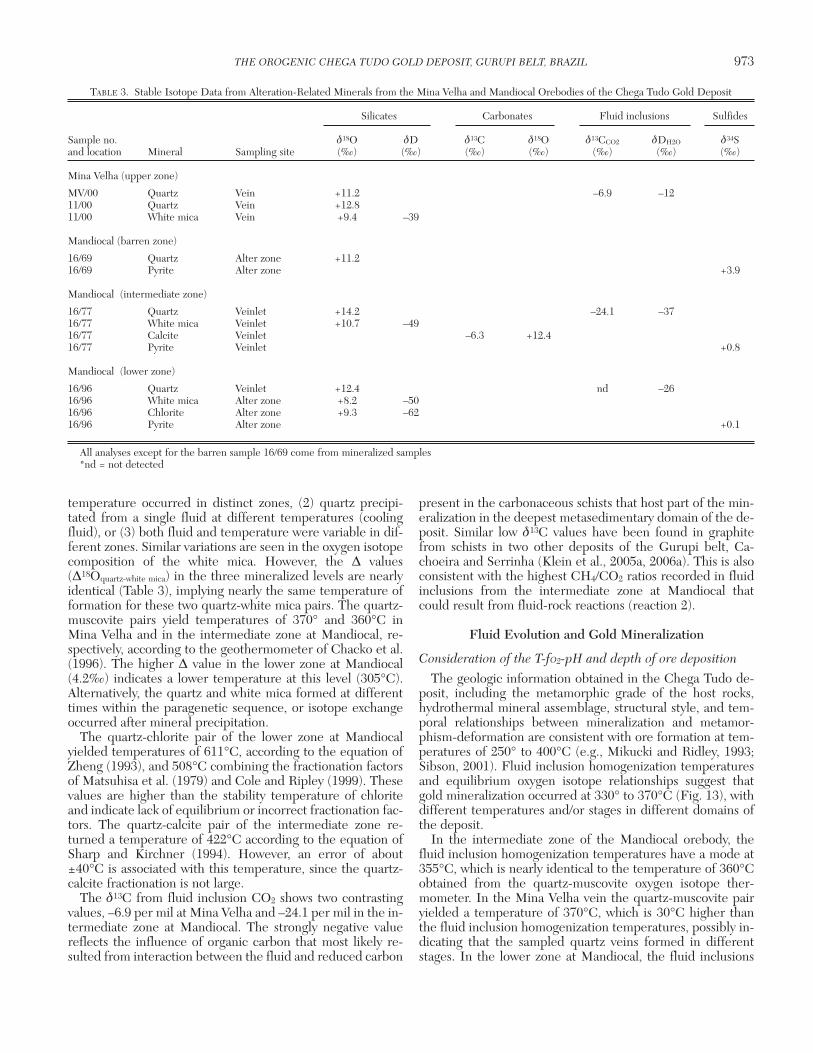
temperature occurred in distinct zones, (2) quartz precipi-tated from a single fluid at different temperatures (coolingfluid), or (3) both fluid and temperature were variable in dif-ferent zones. Similar variations are seen in the oxygen isotopecomposition of the white mica. However, the ∆ values(∆18Oquartz-white mica) in the three mineralized levels are nearlyidentical (Table 3), implying nearly the same temperature offormation for these two quartz-white mica pairs. The quartz-muscovite pairs yield temperatures of 370° and 360°C inMina Velha and in the intermediate zone at Mandiocal, re-spectively, according to the geothermometer of Chacko et al.(1996). The higher ∆ value in the lower zone at Mandiocal(4.2‰) indicates a lower temperature at this level (305°C).Alternatively, the quartz and white mica formed at differenttimes within the paragenetic sequence, or isotope exchangeoccurred after mineral precipitation.
The quartz-chlorite pair of the lower zone at Mandiocalyielded temperatures of 611°C, according to the equation ofZheng (1993), and 508°C combining the fractionation factorsof Matsuhisa et al. (1979) and Cole and Ripley (1999). Thesevalues are higher than the stability temperature of chloriteand indicate lack of equilibrium or incorrect fractionation fac-tors. The quartz-calcite pair of the intermediate zone re-turned a temperature of 422°C according to the equation ofSharp and Kirchner (1994). However, an error of about±40°C is associated with this temperature, since the quartz-calcite fractionation is not large.
The δ13C from fluid inclusion CO2 shows two contrastingvalues, –6.9 per mil at Mina Velha and –24.1 per mil in the in-termediate zone at Mandiocal. The strongly negative valuereflects the influence of organic carbon that most likely re-sulted from interaction between the fluid and reduced carbon
present in the carbonaceous schists that host part of the min-eralization in the deepest metasedimentary domain of the de-posit. Similar low δ13C values have been found in graphitefrom schists in two other deposits of the Gurupi belt, Ca-choeira and Serrinha (Klein et al., 2005a, 2006a). This is alsoconsistent with the highest CH4/CO2 ratios recorded in fluidinclusions from the intermediate zone at Mandiocal thatcould result from fluid-rock reactions (reaction 2).
Fluid Evolution and Gold Mineralization
Consideration of the T-fO2-pH and depth of ore deposition
The geologic information obtained in the Chega Tudo de-posit, including the metamorphic grade of the host rocks,hydrothermal mineral assemblage, structural style, and tem-poral relationships between mineralization and metamor-phism-deformation are consistent with ore formation at tem-peratures of 250° to 400°C (e.g., Mikucki and Ridley, 1993;Sibson, 2001). Fluid inclusion homogenization temperaturesand equilibrium oxygen isotope relationships suggest thatgold mineralization occurred at 330° to 370°C (Fig. 13), withdifferent temperatures and/or stages in different domains ofthe deposit.
In the intermediate zone of the Mandiocal orebody, thefluid inclusion homogenization temperatures have a mode at355°C, which is nearly identical to the temperature of 360°Cobtained from the quartz-muscovite oxygen isotope ther-mometer. In the Mina Velha vein the quartz-muscovite pairyielded a temperature of 370°C, which is 30°C higher thanthe fluid inclusion homogenization temperatures, possibly in-dicating that the sampled quartz veins formed in differentstages. In the lower zone at Mandiocal, the fluid inclusions
THE OROGENIC CHEGA TUDO GOLD DEPOSIT, GURUPI BELT, BRAZIL 973
0361-0128/98/000/000-00 $6.00 973
TABLE 3. Stable Isotope Data from Alteration-Related Minerals from the Mina Velha and Mandiocal Orebodies of the Chega Tudo Gold Deposit
Silicates Carbonates Fluid inclusions Sulfides
Sample no. δ18O δD δ13C δ18O δ13CCO2 δDH2O δ34Sand location Mineral Sampling site (‰) (‰) (‰) (‰) (‰) (‰) (‰)
Mina Velha (upper zone)
MV/00 Quartz Vein +11.2 –6.9 –1211/00 Quartz Vein +12.811/00 White mica Vein +9.4 –39
Mandiocal (barren zone)
16/69 Quartz Alter zone +11.216/69 Pyrite Alter zone +3.9
Mandiocal (intermediate zone)
16/77 Quartz Veinlet +14.2 –24.1 –3716/77 White mica Veinlet +10.7 –4916/77 Calcite Veinlet –6.3 +12.416/77 Pyrite Veinlet +0.8
Mandiocal (lower zone)
16/96 Quartz Veinlet +12.4 nd –2616/96 White mica Alter zone +8.2 –5016/96 Chlorite Alter zone +9.3 –6216/96 Pyrite Alter zone +0.1
All analyses except for the barren sample 16/69 come from mineralized samples*nd = not detected

also reflect the lower temperature (330°–340°C). Assumingimmiscibility, the homogenization temperatures representsthe true trapping temperature and that no pressure correc-tion is needed.
Oxygen fugacities have been calculated according to themethod of Huizenga (2001), taking into account the mainrange of XCO2, the range of temperatures and an assumedpressure of 3 kbars, which is in keeping with the structural ev-idence, yielding log fO2 values between –28.7 and –30.5(340°–370°C) and –30.5 to –31.5 (330°–340°C) (Fig. 14A).The estimated T-fO2 conditions plot within the pyrite andmagnetite stability fields, above the CO2-CH4 buffer andbelow the SO2/H2S buffer, indicating relatively reduced orefluids. These conditions are consistent with the δ34S values of
pyrite, the large predominance of CO2 over CH4 in fluid in-clusions, and the absence of pyrrhotite and oxidized minerals,such as hematite and sulfates, in the alteration assemblage.The presence of white mica, absence of K-feldspar, and thestability of calcite imply near-neutral conditions with pH val-ues between 5 and 6.2 (Fig. 14B).
Composition and sources of ore-forming fluid and solutes
The fluid inclusion study revealed two low-salinity (avg 2.0and 5.8 wt % NaCl equiv) aqueous-carbonic fluids. The CO2
content of the fluids is generally between 11 and 22 mol per-cent, and CH4 is present in small amounts (<6 mol %) only inone type of fluid inclusion. Such fluids are consistent with ametamorphic origin (e.g., Phillips and Powell, 1993; McCuaigand Kerrich, 1998). We cannot unequivocally link these fluidsto gold transport, but CO2-bearing fluids are the earliest flu-ids trapped in the fluid inclusions in each studied domain ofthe deposit and the CH4-bearing fluid is abundant in the in-termediate zone, which has the highest gold grades. Thesefluids are interpreted to be representative of the ore-bearingfluids in the studied orebodies of the Chega Tudo deposit.
Using the estimated temperatures in Figure 13, the fluidδ18O values were calculated by applying the quartz-water(Matsuhisa et al., 1979), muscovite-water (O’Neil and Taylor,1969), chlorite-water (Cole and Ripley, 1999), and calcite-water (Friedman and O’Neil, 1977) fractionation factors.Fluid δD values were measured directly from inclusion fluidsand calculated from the hydrous mineral data, using extrapo-lation of the chlorite-water (Graham et al., 1987) fractionation
974 KLEIN ET AL.
0361-0128/98/000/000-00 $6.00 974
280 300 320 340 360 380 400 420
T (°C)
x
upper
intermediate
lower
FIG. 13. Diagram showing the temperature variations obtained for dis-tinct domains of the Chega Tudo deposit. The thin and thick bars representthe whole and main range of fluid inclusion homogenization temperatures; Xindicates the modal value. Filled squares are temperatures obtained fromoxygen isotope thermometry of the quartz-muscovite pair.
FIG. 14. A. Aqueous solubility of gold as a function of temperature and oxygen fugacity. Dashed lines are for the bisul-fide complex [Au(HS)2–], dotted-dashed lines are for the chloride complex [AuCl2–]. The heavy solid lines represent the lim-its of the stability fields of Fe-oxides and sulfides, and the dotted lines represent other buffers (adapted from Romberger,1990, and Ohmoto and Goldhaber, 1997). B. Phase diagram showing the aqueous solubility of gold and chalcopyrite as bisul-fide complexes (Au(HS)2– and Cu(HS)2–, thin solid and dotted lines, respectively) as a function pH and oxygen fugacity atthe temperature-pressure conditions estimated for the Chega Tudo deposit. Heavy solid and dashed lines show the stabilityfields of oxide and sulfide minerals; calculated according to Romberger (1990) and Wood (1998). In both diagrams theshaded areas represent the estimated physicochemical conditions for the Chega Tudo deposit. The light gray area is for theCO2-CH4-H2O-NaCl fluid, and the dark gray field represents the CO2-H2O-NaCl fluid; both correspond to conditions wheregold and chalcopyrite are soluble. Mineral abbreviations: bn = bornite, cpy = chalcopyrite, hem = hematite, kf = K-feldspar,mag = magnetite, musc = muscovite, po = pyrrhotite, py = pyrite.
2 3 4 5 6 7 8 9 10pH
log
Of2
-20
-25
-30
-35
-40
2 kbars350°C
mus
ckf
calc
iteso
lubl
e
py
pomag
cpy
cpy
bn + py
bn + po
hem
SO4-2
HSO4-
H S2
100
ppb
1000
ppm
B)
Au(H
S)2
-
1000
ppb
HS-
1 ppb
0.1 ppb
0.001 ppb
0.00
1pp
b
1pp
b100
ppb
10pp
b
AuCl2-
Au(HS)2-
200 300 400 500T (°C)
-20
-25
-30
-35
-40
SO 2H
S2
CO 2
CH 4
pypo
10pp
b
1pp
b0.1pp
b
6% NaClpH 6320 ppm S
log
Of2
A)
hem
mag
Cu(
HS)
2-
100
ppm
100000ppb
1000
0pp
b

factor down to the estimated temperatures, and by applyingthe calibration of Bowers and Taylor (1985) for the mus-covite-water fractionation. The δ13C value of the fluid CO2
was obtained directly by measuring the δ13C of the CO2 ex-tracted from fluid inclusions, and by using the calcite-CO2
equation for isotope fractionation of Ohmoto and Rye (1979).The δ34S value of the fluid was calculated from the pyrite-H2Sfractionation factor of Ohmoto and Rye (1979), assuming H2Sas the main sulfur species in the fluid. The calculated compo-sitions are presented in Table 4.
The full range of δ18OH2O values is 5.3 to 9.7 per mil, butdifferences between different parts of the deposit (Fig. 15A)indicate fluid compositions consistent with the fluid inclusionresults. The intermediate zone has the highest δ18OH2O values(>7.9‰), whereas values lower than 7.2 per mil are restrictedto the lower and upper zones. The δ18OH2O values in equilib-rium with chlorite are distinctly different from those of quartzand muscovite from the same level, supporting the interpre-tation that chlorite is not in equilibrium with the other twominerals. The δD values of water extracted from fluid inclu-sions are similar in the intermediate and lower zones (–37 and–29‰, and –30 to –26‰, respectively) but much higher inthe upper zone (–12 to –19‰ at Mina Velha). The combinedoxygen and hydrogen isotope data (Fig. 15B) are consistentwith a metamorphic source for the fluids (e.g., produced bydevolatilization and dehydration reactions during the pro-grade metamorphism of a volcanosedimentary sequence, atmoderate depths in the crust: cf. Kerrick and Caldera, 1998;Yardley and Graham, 2002). This is consistent with the oro-genic scenario proposed for the São Luís craton and Gurupibelt in the Paleoproterozoic (Klein et al., 2005b, c) (Fig. 16).Similar fluids could have been produced by syntectonic mus-covite-bearing granitoids, followed by dilution by other fluidtypes (metamorphic, meteoric). The subtle trend in the δ18Oversus δD plot (Fig. 15B), showing decreasing δ18O and in-creasing δD values from the intermediate to the two other
levels, is consistent with the higher temperature of ore depo-sition in the intermediate zone. However, we cannot discountminor influx of meteoric water into the system (type 3a fluidinclusions?), possibly in the lower zone which has isotopicvalues between those found in the upper and intermediatezones.
The strongly negative δ13C value of inclusion CO2 (–24.1‰)comes from organic contribution. The value of –6.9 per miloverlaps the compositional fields of mantle-, magmatic-, andmetamorphic-derived carbon, as well as of mixed crustalsources (Ohmoto, 1986; McCuaig and Kerrich, 1998). Thefluid δ13C values calculated from the calcite-CO2 fractiona-tion are –3.8 to –3.9 per mil and could represent a distinctcarbon source, possibly a crustal source. It is likely that thecalcite did not precipitate from the same CO2 found in the in-clusions, and this may explain the lack of equilibrium be-tween quartz and calcite in this part of the deposit.
The δ34S values of H2S in the mineralized zones range from–0.2 to –1.0 per mil and indicate a reduced character for theore fluid (below the SO2/H2S boundary: Fig. 14) and consis-tent with the fluid inclusion evidence. These values also areconsistent with an igneous source of sulfur (Lambert et al.,1984; Kerrich, 1987).
Gold transport and deposition
At the estimated T-fO2-pH conditions, H2S is the predomi-nant sulfur species in the fluid (Fig. 14) and AuHS2– is likelyto have been the dominant gold-transporting complex(Hayashi and Ohmoto, 1991; Benning and Seward, 1996).These conditions are also consistent with high solubility ofgold and copper as bisulfide complexes (Fig. 14), which mayexplain the association of gold and chalcopyrite in the veins.The different styles of gold mineralization at Mina Velha(free-milling gold) and Mandiocal (refractory and free gold)could indicate different mechanisms for gold precipitation,differences in the extent of fluid-wall rock interaction, or twoseparate mineralizing events from distinct ore fluids.
The fluid inclusion study indicates that fluid immiscibilityand mixing were possible causes of gold deposition. Althoughfluid immiscibility has been documented at both Mina Velhaand Mandiocal, the following all indicate changing redox andpH of the fluid, which also may have contributed to gold pre-cipitation: (1) relatively large volume of altered wall rock, (2)sulfidation of the host rocks (reaction between sulfur andiron-rich minerals, such as magnetite, early pyrite and chlo-rite), (3) the presence of gold in fractures of pyrite, and (4)the low δ13C values of fluid inclusion CO2.
Concluding Remarks: A Fluid-Structural Model The Chega Tudo gold deposit is associated with the major
strike-slip Tentugal shear zone located at the boundary be-tween the São Luís craton and the Gurupi belt. The ore-bodies are hosted in 2160 to 2148 Ma greenschist facies vol-canosedimentary rocks, and are parallel to the subverticalstructural grain. The hydrothermal alteration associatedwith the gold mineralization includes silicification, chloriti-zation, carbonatization, sericitization, and sulfidation of thehost rocks. Alteration occurred at high fluid-to-rock ratios assuggested by extensive quartz ± carbonate veining and theminimal variation in the fluid isotope compositions within the
THE OROGENIC CHEGA TUDO GOLD DEPOSIT, GURUPI BELT, BRAZIL 975
0361-0128/98/000/000-00 $6.00 975
TABLE 4. Calculated Stable Isotope Compositions for Fluids in Equilibrium with Minerals of the Mina Velha and
Mandiocal Orebodies of the Chega Tudo Gold Deposit
Sample/ δ18OH2O δDH2O δ13CCO2 δ34SH2S
level Mineral (‰) (‰) (‰) (‰)
Mina Velha upper zone (T = 330–340°C)
MV/00 Quartz +5.3 to +6.4 –12 1 –6.9 1
11/00 Quartz +6.9 to +7.211/00 White mica +6.7 to +7.0 –19
Mandiocal intermediate zone (T = 340–370°C)
16/77 Quartz +8.6 to +9.4 –37 1 –24.1 1
16/77 White mica +8.3 to +8.8 –2916/77 Calcite +7.9 to +8.6 –3.8 to –3.916/77 Pyrite –0.2 to –0.3
Mandiocal lower zone (T = 330–340°C)
16/96 Quartz +6.5 to +6.8 –26 1
16/96 White mica +5.5 to +6.3 –3016/96 Chlorite +9.6 to +9.7 –2816/96 Pyrite –1.0
1 Fluid inclusion water and CO2

alteration zones. Preliminary evidence suggests a Paleopro-terozoic age (2060–2000 Ma) for mineralization, at the end ofa protracted regional orogenic evolution.
Integrated structural, mineralogical, fluid inclusion, and sta-ble isotope data suggest that deposition of auriferous quartzveins and stringers of auriferous pyrite occurred in dilatationalsites (fractures, foliation openings, vein-wall rock contacts)under fluctuating pressure conditions. The data also indicatethat mineralization at Chega Tudo occurred in response tocomplex and concurrent processes involving fluid immiscibil-ity, fluid-rock reactions, and possibly fluid mixing. Gold min-eralization in the intermediate zone of the Mandiocal orebodyand at Mina Velha formed from slightly different ore fluids.The main differences are the abundance of CO2-bearing in-clusions, the presence of CH4, and higher salinities in the in-termediate zone, the δ18O, δD, and δ13C values of the fluids,and the calculated fO2 values. The lower zone at Mandiocalrecords, at least in part, the two stages of mineralization.
A reasonable interpretation that might explain the differentphysicochemical characteristics of the fluids and the twostyles of gold mineralization involves (1) a deeply sourced,low-salinity CO2-H2O-NaCl–bearing metamorphic fluid thatmigrated through active structures related to the Tentugalshear zone under fluctuating pressure conditions (e.g., Mc-Cuaig and Kerrich, 1998; Sibson, 2001), (2) hydrothermal al-teration of the enclosing rocks and vein precipitation at highfluid pressures, (3) enrichment of this fluid in CH4 throughinteraction with C-bearing rocks in the proximity of the de-posit, and (4) a sudden drop in the fluid pressure caused fluidimmiscibility forcing the fluid back into the shear zone (e.g.,Cox et al., 1995) where it mixed with a deeply sourced CO2-H2O-NaCl fluid and a H2O-NaCl-MgCl2 fluid of metamor-phic (±meteoric?) origin or exchanged with metamorphicrocks (Figs. 17). The two parts of Chega Tudo have charac-teristics that are analogous to those of orogenic gold depositshosted in metamorphic belts elsewhere (Groves et al., 1998;
976 KLEIN ET AL.
0361-0128/98/000/000-00 $6.00 976
5 6 7 8 9 10
δ18O(H O per mil)2
chlorite
white mica
quartzcalcite
white mica
white mica
quartz
quartz
quartz
-20 -15 -10 -5 0 5 10 15 20 25 30-100
-90
-80
-70
-60
-50
-40
-30
-20
-10
0
10
20
δ18O H O (per mil)2
metamorphic water
magmatic water
+
ocean water
kaol
inite
line
(wea
ther
ing)
met
eoric
wat
ers +
+
quartz
white mica
chlorite
δDH
O(p
erm
il)2
upper lower interm.Mina Velha / MandiocalB)
MinaVelha(upper)
intermediate
lower
A)
Mandiocal
FIG. 15. Calculated oxygen and hydrogen isotope compositions of water from analyses of hydrothermal mineral and in-clusion fluids from the Mina Velha and Mandiocal orebodies of the Chega Tudo deposit. Fields of magmatic and metamor-phic waters in B are those defined by Sheppard (1986).

THE OROGENIC CHEGA TUDO GOLD DEPOSIT, GURUPI BELT, BRAZIL 977
0361-0128/98/000/000-00 $6.00 977
2240-2150 Ma
?
SSW NNE
A
2080-2000 Ma+.
Chega Tudo Formation
C
?
B
2100-2080 MaSSW NNE
Tentugal Shear Zone
Chega Tudo deposit
Cipoeiro deposit
+.
São Luís cratonGurupi belt
SSW NNE
astenosphere
oceanic crust
Archean crust
early volcano-sedimentary
late
sedimentary
volcano-sedimentary
calc-alkaline granitoids
calc-alkaline granitoids (arc reworking)
peraluminous granites
sinistral strike-slip shear zone
folds
gold deposits
+.
D
DChega Tudo deposit
Cipoeiro deposit
(Au?) CO2
S
S
NaCl-MgCl2H O - CO2 2
Au?Au?
NaClH O - CO2 2
? ? ?
C
C
FIG. 16. Schematic (not to scale) cross sections illustrating the Paleoproterozoic geodynamic evolution of the Gurupi beltand São Luís craton. A. Accretion phase: intra-oceanic arc construction, subduction, calc-alkaline magmatism, and concomi-tant reworking of the island arc. B. Collision phase: accretion of juvenile terranes to an Archean block, moderate crust thick-ening, metamorphism, crustal melting and peraluminous magmatism. C. Strike-slip shearing, parallelism of units, and goldmineralization (modified from Klein et al., 2005b). D. Detail of the mineralized portion of the Gurupi belt showing the po-sition of the Chega Tudo and Cipoeiro gold deposits and possible fluid and solute sources and paths.

McCuaig and Kerrich, 1998; Goldfarb et al., 2005) and likelyformed in a similar manner.
AcknowledgmentsThis study benefited from financial support provided by
CAPES (BEX 2020/02-05), CPRM/Geological Survey ofBrazil, and UFPA. The senior author acknowledges theBrazilian agency Conselho Nacional de DesenvolvimentoCientífico e Tecnológico (CNPq) for a research grant (process308994/2006-0). C. Torresini, G.M. Brandão, and S.J.C. Meloare gratefully acknowledged for field support and discussionson the geology of the deposit. R. Angélica (UFPA), C.Lamarão (UFPA), and K. Fuzikawa (CDTN/CNEN), kindlyhelped with the XRD, SEM, and Raman analyses, respec-tively. Assistance and discussions with C. Renac (UniversitéJean Monnet) were greatly appreciated. Steffen Hagemann isthanked for the suggestions made on an earlier version of themanuscript, which also benefited from valuable and incisivecomments and suggestions of the two Economic Geology re-viewers (Robert Kerrich and Peter Neumayr) and from theeditorial handling of Mark Hannington.
July 3, 2007; June 3, 2008
REFERENCESAlmeida, F.F.M., Melcher, G.C., Cordani, U.G., Kawashita, K., and Vandoros
P., 1968, Radiometric age determinations from northern Brazil: Boletim daSociedade Brasileira de Geologia, v. 17, p. 3–14.
Araujo Neto, H., 1998, Programa Nacional de Prospecção de Ouro – PNPO.Mapa de reservas e produção de ouro doBrasil. Brasília, Companhia dePesquisa de Recursos Minerai, scale 1:7.000.000.
Bakker, R.J., 1999, Adaptation of the Bowers and Helgeson (1983) equationof state to the H2O-CO2-CH4-N2-NaCl system: Chemical Geology, v. 154,p. 225–236.
——2003, Package FLUIDS 1. Computer programs for analysis of fluid in-clusion data and for modelling bulk fluid properties: Chemical Geology, v.194, p. 3–23.
Benning, L.G., and Seward, T.M., 1996, Hydrosulphide complexing of Au(I)in hydrothermal solutions from 150 to 400°C and 500 to 1500 bars:Geochimica et Cosmochimica Acta, v. 60, p. 1849–1871.
Bowers, T.S., and Helgeson, H.C., 1983, Calculation of the thermodynamicand geochemical consequences of nonideal mixing in the system H2O-CO2-NaCl on phase relations in geological systems: Equation of state for H2O-CO2-NaCl fluids at high pressures and temperatures: Geochimica et Cos-mochimica Acta, v. 47, p. 1247–1275.
Bowers, T.S., and Taylor, Jr., H.P, 1985, An integrated chemical and stable-isotope model of the origin of midocean ridge hot spring systems: Journalof Geophysical Research, v. 90, p. 12,583–12,606.
Cathelineau, M., 1988, Cation site occupancy in chlorites and illites as a func-tion of temperature: Clay Minerals, v. 23, p. 471–485.
Cathelineau, M., and Marignac, C., 1994, Use of fluid inclusions for a betterunderstanding of intracontinental geothermal activities, in De Vivo, B., andFrezzotti, M.L., eds., Fluid inclusions in minerals: Methods and applica-tions: Blacksburg, Virginia Polytechnic Institute and State University, p.309–326.
Chacko, T., Hu, X., Mayeda, T.K., Clayton, R.N., and Goldsmith, J.R., 1996,Oxygen isotope fractionations in muscovite, phlogopite, and rutile:Geochimica et Cosmochimica Acta, v. 60, p. 2595–2608.
Clayton, R.N., and Mayeda, T.K., 1963. The use of bromine pentafluoride inthe extraction of oxygen from oxides and silicates from isotopic analyses:Geochimica et Cosmochimica Acta, v. 27, p. 43–52.
978 KLEIN ET AL.
0361-0128/98/000/000-00 $6.00 978
dilatationalsite
A
infiltrating fluid
C
H O-NaCl-MgCl2 2
CO -H O-NaCl2 2 CO -CH -H O-NaCl2 4 2
wall-rock alteration(muscovite-chlorite-carbonate-sulfide)
B
quartz vein
musc
free gold
auriferous pyrite
reacted fluid
δδ
18O = +7.9 to +9.4 ‰D = -29 to -37‰
5.8 wt % NaCl12-22 % CO6 % CH340-370°C
2
4
δδ
18O = +5.3 to +7.2 ‰D = -12 to -30‰
2 wt % NaCl11-13 % CO330-340°C
2
FIG. 17. Schematic (not to scale) illustration of possible mechanisms of fluid migration responsible for the Chega Tudogold deposit (based on Cox et al., 1995). A. Prefault failure with upward and outward migration of a deeply sourced fluid,wall-rock alteration, vein formation, and deposition of free gold. B. Immediate postfault failure with upward migration of thedeeply sourced fluid and backward migration of the reacted fluid, with vein formation and precipitation of refractory gold.

Cole, D.R., and Ripley, E.M., 1999, Oxygen isotope fractionation betweenchlorite and water from 170 to 350°C: A preliminary assessment on partialexchange and fluid/rock experiments: Geochimica et Cosmochimica Acta,v. 63, p. 449–457.
Coleman, M.L., Shepherd, T.J., Durham, J.J., Rouse, J.E., and Moore, G.R.,1982, Reduction of water with zinc for hydrogen isotope analysis: Analyti-cal Chemistry, v. 54, p. 993–995.
Collins, P.L.F., 1979, Gas hydrates in CO2-bearing fluid inclusions and theuse of freezing data for estimation of salinity: ECONOMIC GEOLOGY, v. 74,p. 143–1444.
Costa, J.B.S., Pastana, J.M.N., Costa, E.J.S., and Jorge-João, X.S., 1988, Afaixa de cisalhamento Tentugal na Folha SA.23-Y-B: Congresso Brasileirode Geologia, 35th, Belém, Anals, v. 5, p. 2257–2266.
Costa, J.L., 2000, Programa Levantamentos Geológicos Básicos do Brasil,Programa Grande Carajás: Castanhal, Folha SA.23-V-C. Estado do Pará.Belém, Companhia de Pesquisa de Recursos Minerais (on CD-ROM).
Cox, S.F., Sun, S.S., Etheridge, M.A., Wall, V.J., and Potter, T.F., 1995, Struc-tural and geochemical controls on the development of turbidite-hostedgold quartz vein deposits, Wattle Gully mine, Central Victoria, Australia:ECONOMIC GEOLOGY, v. 90, p. 1722–1746.
Crawford, M.L., 1981, Phase equilibria in aqueous fluid inclusions, in Hollister,L.S., and Crawford, M.L., eds., Fluid inclusions: Applications in petrology:Mineralogical Association of Canada, Short Course Handbook, v. 6, p. 75–100.
Drummond, S.E., and Ohmoto, H., 1985, Chemical evolution and mineraldeposition in boiling hydrothermal systems: ECONOMIC GEOLOGY, v. 80, p.126–147.
Duan, Z., Möller, N., and Weare, J.H., 1992, An equation of state for theCH4-CO2-H2O system: II. Mixtures from 50 to 1000 °C and 0 to 1000 bar:Geochimica et Cosmochimica Acta, v. 56, p. 2619–2631.
Dubois, M., and Marignac, C., 1997, The H2O-NaCl-MgCl2 ternary phase di-agram with special application to fluid inclusion studies: ECONOMIC GEOL-OGY, v. 92, p. 114–119.
Duschek, W., Kleinrahm, R., and Wagner, W., 1990, Measurements and cor-relation of the (pressure, density, temperature) relation of carbon dioxide:II. Saturated-liquid and saturated-vapour densities and the vapour pressurealong the entire coexistence curve: Journal of Chemical Thermodynamics,v. 22, p. 841–864.
Frantz, J.D., Popp, R.K., and Hoering, T.C., 1992, The compositional limitsof fluid immiscibility in the system H2O-NaCl-CO2 as determined with theuse of synthetic fluid inclusions in conjunction with mass spectrometry:Chemical Geology, v. 98, p. 237–255.
Friedman, I., and O’Neil., J.R., 1977, Compilation of stable isotope fraction-ation factors of geochemical interest: U.S. Geological Survey ProfessionalPaper, v. 440-KK, p. 1–12.
Goldfarb, R.J., Baker, T., Dubé, B., Groves, D.I., Hart, C.J.R., and Gosselin, P.,2005, Distribution, character, and genesis of gold deposits in metamorphicterranes: ECONOMIC GEOLOGY 100TH ANNIVERSARY VOLUME, p. 407–450.
Graham, C.M., Viglino, J.A., and Harmon, R.S., 1987, Experimental study ofhydrogen-isotope exchange between aluminous chlorite and water and ofhydrogen diffusion in chlorite: American Mineralogist, v. 72, p. 566–579.
Groves, D.I., Goldfarb, R.J., Gebre-Mariam, M., Hagemann, S.G., andRobert, F., 1998, Orogenic gold deposits: A proposed classification in thecontext of their crustal distribution and relationships to other gold deposittypes: Ore Geology Reviews, v. 13, p. 7–27.
Hall, D.L., and Sterner, S.M., 1993, Preferential water loss from syntheticfluid inclusions: Contributions to Mineralogy and Petrology, v., 114, p.489–500.
Hall, D.L., Sterner, S.M., Bodnar, R.J., 1988, Freezing point depression ofNaCl–KCl–H2O solutions: ECONOMIC GEOLOGY, v. 83, p. 197–202.
Harris, C., Stuart Smith, H., and le Roex, A.P., 2000, Oxygen isotope compo-sition of phenocrysts from Tristan da Cunha and Gough island lavas: Varia-tion with fractional crystallization and evidence for assimilation: Contribu-tions to Mineralogy and Petrology, v. 138, p. 164–175.
Hayashi, K.I., and Ohmoto, H., 1991, Solubility of gold in NaCl- and H2S-bearing aqueous solutions at 250–350°C: Geochimica et CosmochimicaActa, v. 55, p. 2111–2126.
Hey, M. H., 1954, A new review of the chlorites: Mineralogical Magazine, v.30, p. 277–292.
Hodgson, C.J., 1989, The structure of shear-related, vein-type gold deposits:A review: Ore Geology Reviews, v. 4, p. 231–273.
Hollister, L.S., 1990. Enrichment of CO2 in fluid inclusions in quartz by re-moval of H2O during crystal-plastic deformation: Journal of Structural Ge-ology, v. 12, p. 895–901.
Huizenga, J.M., 2001, Thermodynamic modeling of C-O-H fluids: Lithos, v.55, p. 101–114.
Huizenga, J.M., and Touret, J.L.R., 1999, Fluid inclusions in shear zones, thecase of the Umwindsi shear zone in the Harare-Shamva-Bindura greenstonebelt, NE Zimbabwe: European Journal of Mineralogy, v. 11, p. 1079–1090.
Kerrich, R., 1987, The stable isotope geochemistry of Au-Ag vein deposits inmetamorphic rocks, in Kyser, T.K., ed., Stable isotope geochemistry of lowtemperature fluids: Mineralogical Association of Canada, Short CourseHandbook, v. 13, p. 287–336.
Kerrick, D.M., and Caldera, K., 1998, Metamorphic CO2 degassing fromorogenic belts: Chemical Geology, v. 145, p. 213–232.
Klein, E.L., and Moura, C.A.V., 2001, Age constraints on granitoids andmetavolcanic rocks of the São Luís craton and Gurupi belt, northern Brazil:Implications for lithostratigraphy and geological evolution: InternationalGeology Review, v. 43, p. 237–253.
——2008, São Luís craton and Gurupi belt (Brazil): Possible links with theWest-African craton and surrounding Pan-African belts, in Pankhurst, R.J.,Trouw, R.A.J., Brito Neves, B.B., and de Wit, M.J., eds., West Gondwana:Pre-Cenozoic correlations across the South Atlantic region: Geological So-ciety, London, Special Publications, v. 294, p. 137–151.
Klein, E.L., Harris, C., Giret, A., Moura, C.A.V., and Angélica, R.S., 2005a,Geology and stable isotope (O, H, C, S) constraints on the genesis of theCachoeira gold deposit, Gurupi belt, northern Brazil: Chemical Geology, v.221, p. 188–206.
Klein, E.L., Moura, C.A.V., Krymsky, R., and Griffin, W.L., 2005b, The Gu-rupi belt in northern Brazil: Lithostratigraphy, geochronology, and geody-namic evolution: Precambrian Research, v. 141, p. 83–105.
Klein, E.L., Moura, C.A.V., and Pinheiro, B.L.S., 2005c, Paleoproterozoiccrustal evolution of the São Luís craton, Brazil: Evidence from zircongeochronology and Sm-Nd isotopes: Gondwana Research, v. 8, p. 177–186.
Klein, E.L., Harris, C., Renac, C., Giret, A., Moura, C.A.V., and Fuzikawa,K., 2006a, Fluid inclusion and stable isotope (O, H, C, and S) constraintson the genesis of the Serrinha gold deposit, Gurupi belt, Northern Brazil:Mineralium Deposita, v. 41, p. 160–178.
Klein, E.L., Moura, C.A.V., and Harris, C., 2006b, Stable (O, H, C, S) and ra-diogenic (Pb) isotopes evidence for the genesis of orogenic gold deposits ofthe Gurupi belt, Brazil: Facultad de Agronomia y Facultad de Ciencias,Universidad de la Republica, South American Symposium on Isotope Ge-ology, 5th, Punta del Este, Uruguay, Short Papers, p. 500–503.
Klein, E.L., Harris, C., Giret, A., and Moura, C.A.V., 2007, The Cipoeiro golddeposit, Gurupi belt, Brazil: Chlorite geochemistry, and stable isotopestudy: Journal of South American Earth Sciences: Journal of South Ameri-can Earth Sciences, v. 23, p. 242–255.
Kranidiotis, P., and MacLean, W.H., 1987, Systematics of chlorite alterationat the Phelps Dodge massive sulfide deposit, Matagami, Quebec: ECO-NOMIC GEOLOGY, v. 82, p. 1898-1911.
Lambert, I.B., Phillips, G.N., and Groves, D.I., 1984, Sulfur isotope compo-sitions and genesis of Archaean gold mineralization, Australia and Zim-babwe, in Foster, R.P., ed., Gold’82: The geology, geochemistry and gene-sis of gold deposits: Geological Society of Zimbabwe Special Publication, v.1, p. 373–387.
Marcoux, E., and Milési, J.P., 1993, Lead isotope signature of Early Protero-zoic ore deposits in Western Africa: Comparison with gold deposits inFrench Guiana: ECONOMIC GEOLOGY, v. 88, p. 1862–1879.
Matsuhisa, Y., Goldschmit, J.R., and Clayton, R.N., 1979, Oxygen isotopefractionation in the system quartz-albite-anorthite-water: Geochimica etCosmochimica Acta, v. 43, p. 1131–1140.
McCuaig, T.C., and Kerrich, R., 1998, P-T-t-deformation-fluid characteris-tics of lode gold deposits: Evidence from alteration systematics: Ore Geol-ogy Reviews, v. 12, p. 381–453.
McRae, M., 1950, The isotopic chemistry of carbonates and a paleotemper-ature scale: Journal of Chemical Physics, v. 18, p. 849–857.
Mikucki, E.J., and Ridley, J.R., 1993, The hydrothermal fluid of Archaeanlode-gold deposits at different metamorphic grades: Compositional con-straints from ore and wallrock alteration assemblages: Mineralium De-posita, v. 28, p. 469–481.
Oberthür, T., Vetter, U., Davis, D.W., and Amanor, J. 1998, Age constraintson gold mineralization and Paleoproterozoic crustal evolution in theAshanti belt of southern Ghana: Precambrian Research, v. 89, p. 129–143.
Ohmoto, H., 1986, Stable isotope geochemistry of ore deposits, in Valley,J.W., Taylor Jr, H.P., and O’Neil, J.R., eds., Stable isotopes in high temper-ature geological processes: Mineralogical Society of America, Reviews inMineralogy, v. 16, p. 491–559.
THE OROGENIC CHEGA TUDO GOLD DEPOSIT, GURUPI BELT, BRAZIL 979
0361-0128/98/000/000-00 $6.00 979

Ohmoto, H., and Goldhaber, M.B., 1997, Sulfur and carbon isotopes, inBarnes H.L., ed., Geochemistry of hydrothermal ore deposits: John Wiley,p. 517–611.
Ohmoto, H., and Rye, R.O., 1979, Isotopes of sulfur and carbon, in BarnesH.L., ed., Geochemistry of hydrothermal ore deposits: Jon Wiley, p.509–567.
O’Neil, J.R., and Taylor, H.P. 1969, Oxygen isotope equilibrium betweenmuscovite and water: Journal of Geophysical Research, v. 74, p. 6012–6022.
Palheta, E.S.M., 2001, Evolução geológica da região nordeste do Estado doPará com base em estudos estruturais e isotópicos de granitoids: Unpub-lished MSc thesis, Belém, Brazil, Universidade Federal do Pará, 144 p. (inPortuguese).
Passchier, C.W., and Trow, R.A.J., 1996. Microtectonics: Springer, 289 p.Pastana, J.M.N., 1995, Programa Levantamentos Geológicos Básicos do
Brasil. Programa Grande Carajás. Turiaçu/Pinheiro, folhas SA.23-V-D/SA.23-Y-B. Estados do Pará e Maranhão: Companhia de Pesquisa de Re-cursos Minerais (CPRM), 205 p.
Phillips, G.N., and Powell, R., 1993, Link between gold provinces: ECO-NOMIC GEOLOGY, v., 88, p. 1084–1098.
Ramboz, C., Pichavant, M., and Weisbrod, A., 1982, Fluid immiscibility innatural processes: Use and misuse of fluid inclusion data. II. Interpretationof fluid inclusion data in terms of immiscibility: Chemical Geology, v. 37, p.29–48.
Ribeiro, J.W.A., 2002, O arcabouço estrutural da região de Chega Tudo e Ce-dral, NW do Maranhão, com base em sensores geofisicos: UnpublishedMSc thesis, Belém, Brazil, Universidade Federal do Pará, 155 p. (in Por-tuguese).
Robert, F., and Poulsen, K.H., 2001, Vein formation and deformation ingreenstone gold deposits: Reviews in Economic Geology, v. 14, p. 111–155.
Roedder, E., 1984, Fluid inclusions: Reviews in Mineralogy, v. 12, 644 p.Romberger, S.B., 1990, Transport and deposition of gold in hydrothermal
systems, in Robert, F., Sheahan, P.A., and Green, S.B., eds. Greenstonegold and crustal evolution: NUNA Conference Volume, Geological Associ-ation of Canada, p. 61–66.
Sharp, Z.D., and Kirchner, D.L., 1994, Quartz-calcite oxygen isotope ther-mometry: A calibration based on natural isotopic variations: Geochimica etCosmochimica Acta, v. 58, p. 4491–4501.
Shepherd, T.J., Rankin, A.H., and Alderton, D.H., 1985, A practical guide forfluid inclusion studies: Glasgow, Blackie, 239 p.
Sheppard, S.M.F., 1986, Characterization and isotopic variations in naturalwaters, in Valley, J.W., Taylor, H.P., and O’Neil, J.R., eds., Stable isotopesin high temperature geological processe: Mineralogical Society of America,Reviews in Mineralogy, v. 16, p. 165–183.
Sibson, R.H., 2001, Seismogenic framework for hydrothermal transport andore deposition: Reviews in Economic Geology, v. 14, p. 25–50.
Span, R., and Wagner, W., 1996, A new equation of state for carbon dioxidecovering the fluid region from the triple-point temperature to 1100 K atpressures up to 800 MPa: Journal of Physics and Chemical Reference Data,v. 25, p. 1509–1596.
Spicuzza, M.J., Valley, J.W., Kohn, M.J., Girard, J.P., and Fouillac, A.M.,1998, The rapid heating, defocused beam technique: A CO2-laser-basedmethod for highly precise and accurate determination of δ18O values ofquartz: Chemical Geology, v. 144, p. 195–203.
Torquato, J.R., and Cordani, U.G., 1981, Brazil-Africa geological links:Earth-Science Reviews, v. 17, p. 155–176.
Torresini, C., 2000, The Gurupi gold deposits (Cipoeiro and Chega Tudo),Gurupi belt, Pará, Brazil; geology and mineralization: Sociedade Peruanade Geologia International Gold Symposium, 4th, Lima, Peru, Anals. (onCD-ROM).
Vennemann, T.W., and O’Neil, J.R., 1993, A simple and inexpensive methodfor hydrogen isotope and water analyses of minerals and rocks based onzinc reagent: Chemical Geology, Isotope Geoscience Section, v. 103, p.227–234.
Villas, R.N.N., 1982, Geocronologia das intrusões ígneas na bacia do rioGuamá, nordeste do Estado do Pará: Sociedade Brasileira de Geologia-Nú-cleo Norte, Simpósio de Geologia da Amazônia, 2nd, Belém, Brazil, v. 1, p.233–247.
Witt, W.K., 1993, Lithological and structural controls on gold mineralizationin the Archaean Menzies-Kambalda area, Western Australia: AustralianJournal of Earth Sciences, v. 40, p. 65–86.
Wood, S.A., 1998, Calculation of activity-activity and log fO2-pH diagrams:Reviews in Economic Geology, v. 10, p. 81–96.
Yamaguti, H.S., and Villas, R.N.N., 2003, Estudo microtermométrico dos flu-idos hidrotermais relacionados com a mineralização aurífera de MontesÁureos, NW do Maranhão: Revista Brasileira de Geociências, v. 33, p.21–32.
Yardley, B.W.D., and Graham, J.T., 2002, The origins of salinity in metamor-phic fluids: Geofluids, v. 2, p. 249–256.
Zhang, Y.G., and Frantz, J.D., 1987, Determination of the homogenizationtemperatures and densities of supercritical fluids in the system NaCl-KCl-CaCl2-H2O using synthetic fluid inclusions: Chemical Geology, v. 64, p.335–350.
Zheng, Y.F., 1993, Calculation of oxygen isotope fractionation in hydroxyl-bearing silicates: Earth and Planetary Science Letters, v. 120, p. 247–263.
980 KLEIN ET AL.
0361-0128/98/000/000-00 $6.00 980