Embed Size (px)
Citation preview

Geological Hazard and Risk Assessment
Kabupaten Ende, Nusa Tenggara Timur
Departemen Energi dan Sumber Daya MineralMinistry for Energy and Mineral Resources
Badan GeologiGeological Agency
Jl. Diponegoro No. 57, Bandung 40122


First published in 2009
Reprinted 2012
All rights reserved
ISBN 978-602-9105-19-3
Also available in Indonesian: ISBN 978-602-9105-18-6
This document is produced under the auspices of the
German-Indonesian Technical Cooperation on
'Mitigation of Georisks'
between the Geological Agency of Indonesia under the Ministry for Energy and Mineral Resources (DESDM) and
the German Federal Institute for Geosciences and Natural Resources (BGR).
The project is jointly implemented with the German-IndonesianTechnical Cooperation project 'Good Local
Governance' of the Deutsche Gesellschaft für Technische Zusammenarbeit (GTZ) and the
Indonesian Ministry of Home Affairs (MoHA).


i
Geological Hazard and Risk Assessment Kabupaten Ende
Contributors
Dr. Djadjang Sukarna Sekretariat Badan Geologi, Secretariat of Geological Agency
Dr. A.D. Wirakusumah, Dipl. Seis.
Ir. Asdani Suhaemi, Dipl.-Seis.
Sukahar Eka A. Saputra
A. Santoso
Kamawan
Yayan Sopian
R. Setianegara
Badan Geologi, Pusat Survei Geologi Center for Geological Survey
Ir. Igan S. Sutawidjaja
Dr. Ir. Rosgandika Mulyana
Rudy D. Hadisantono
Yukni Arifianti
Yuanara D. Triana
Badan Geologi, Pusat Volcanologi dan Mitigasi Bencana Geologi Center for Volcanology and Geological Hazards Mitigation
Ir. Sugalang
Tigor Tobing
Dr. M. Wafid
Badan Geologi, Pusat Lingkungan Geologi Center for Environmental Geology
Farah Mulyasari, ST., MSc.
Aminah Kastuari, ST.
Ir. I Ketut Tissahadi
Dr. Stefan Jaeger
Georisk-Project
Georisk-Project Consultants,
Geomer GmbH Germany
Dr. Arne Hoffmann-Rothe
Dipl.- Ing. MSc. Bianca Pischke
Dipl.-Ing. Lothar Weiland
German Federal Institute for Geosciences and Natural Resources, Georisk Project
Contact / Hubungi
Dr. Ir. Djadjang Sukarna
Project Coordinator - Secretariat Badan Geologi
Tel: +62 22 720 6515
Fax: +62 22 721 8154
Dr. Ir. A. Djumarma Wirakusumah, Dipl. Seis.
Project Coordinator - Pusat Survei Geologi
Tel: +62 22 727 2601
Fax: +62 22 720 2669
Ministry of Energy and Mineral Resources
Badan Geologi (Geological Agency)
Jl. Diponegoro No 57, Bandung 40122, Indonesia
http://www.bgl.esdm.go.id/
Dr. Arne Hoffmann-Rothe, Dipl. Geol.
German Team Leader
Georisk-Project
http://www.georisk-project.org
Tel: +62 22 727 3198
Fax: +62 22 710 4932
[email protected], [email protected]
Badan Geologi (Geological Agency)
Pusat Lingkungan Gologi,
Jl. Diponegoro No 57, Bandung 40122, Indonesia
Bundesanstalt für Geowissenschaften und Rohstoffe
GEOZENTRUM HANNOVER
Stilleweg 2, 30655 Hannover, Germany
Tel: +49 511 643 0
Fax: +49 511 643 3661
http://www.bgr.bund.de


iii
Geological Hazard and Risk Assessment Kabupaten Ende
Content
Georisks in Kabupaten Ende ................................................................................................................................1 Introduction ........................................................................................................................................................... 1 Purpose of Risk Mapping on Kabupaten Level ...................................................................................................... 1 Intended Audience ................................................................................................................................................. 1 How to read this book? .......................................................................................................................................... 2
Hazards in Kabupaten Ende ................................................................................................................................3 General Remarks .................................................................................................................................................... 3 Types of hazards in Kabupaten Ende ..................................................................................................................... 3
Baseline Data .....................................................................................................................................................9 Administrative Areas ............................................................................................................................................ 10 Land use / Land Cover .......................................................................................................................................... 12 Infrastructure ....................................................................................................................................................... 14 Topography / Elevation ........................................................................................................................................ 16 Demographic data ................................................................................................................................................ 18
Hazard and Susceptibility Data ......................................................................................................................... 21 Landslide Susceptibility ........................................................................................................................................ 22 Volcanic Hazards – Ash fall .................................................................................................................................. 24 Earthquake Hazard – Macrozonation .................................................................................................................. 26 Earthquake Hazard – Microzonation of Ende City ............................................................................................... 28
Vulnerability / Capacity .................................................................................................................................... 31 Modified population density ............................................................................................................................... 32 Health facilities .................................................................................................................................................... 34
Exposure / Risk ................................................................................................................................................. 37 Multi-Hazard ........................................................................................................................................................ 38 Population Exposure to Landslides ...................................................................................................................... 40 Population Exposure to Volcanic Hazards ........................................................................................................... 42 Population Exposure to Earthquake Hazards ...................................................................................................... 44 Combined Population Exposure .......................................................................................................................... 46 Infrastructure Risk Exposure ............................................................................................................................... 48
Spatial Planning Recommendations .................................................................................................................. 51 Risk-sensitive Development Planning .................................................................................................................. 51 Recommendations for Coping with Landslide Hazard......................................................................................... 52 Recommendations for Coping with Volcanic Hazards ......................................................................................... 55 Recommendations for Coping with Earthquake Hazards .................................................................................... 59
Appendix.......................................................................................................................................................... 61 Results Population Exposure ............................................................................................................................... 63 Acronyms ............................................................................................................................................................. 66 Relevant Standar Nasional Indonesia (SNI) ......................................................................................................... 66 Seismotectonic Macrozonation Hazard Map ...................................................................................................... 67 Amplification factor and predominat period microzonation maps of Ende City ................................................ 68 National Institutions ............................................................................................................................................ 69 Institutions of NTT Province ................................................................................................................................ 73 Kabupaten Ende Institutions ............................................................................................................................... 75 Glossary ............................................................................................................................................................... 76


1
Georisk Project – Kerja Sama Indonesia - Jerman
Geological Hazard and Risk Assessment Kabupaten Ende
Ge
ori
sks
in K
abu
pat
en
En
de
Georisks in Kabupaten Ende
Introduction
The Indonesian process of decentralization led to a strengthening of local governments, placing the responsibility for disaster management on provincial and sub-provincial level. It is the obligation of local governments to safeguard the population, their belongings and their living and economic environment from the impact of natural disasters. Several laws passed in the last years, such as the Disaster Management Law (UU 24/2007) and its by-laws, constitute the framework for a new setup of governmental authorities and revised definition of tasks towards a more efficient disaster management in Indonesia.
Even if the executive and legal framework for disaster risk management is established, the process of analyzing risk is a new task for both the governmental authorities and the communities. Practical approaches for risk assessment, tailored to the Indonesian context and needs, have to be developed. Focusing on geological risks, as they are resulting from volcanic eruptions, landslides or earthquakes, the Geological Agency of Indonesia (Badan Geologi) and the German Federal Institute for Geosciences and Natural Resources (BGR) set up a project to elaborate and test practical georisk analysis processes, primarily based on existing hazard and vulnerability data.
The first publication describing the methodology developed by the project has been recently published and shows the application at a province scale for Central Java (Guidebook for Assessing the Risks to Natural Hazards, Case Study Central Java, Badan Geologi, June 2009)1. The present booklet now elaborates the methodology on a Kabupaten scale.
Purpose of Risk Mapping on Kabupaten Level
Contrary to national and provincial level, where mitigation of disaster risk commonly involves the general identification of priority areas on a broader scale, based on a comparable assessment throughout regions, disaster risk mitigation on local scales (Kabupaten and Kecamatan level) requires more detailed information and recommendations for spatial planning. These can include building codes or the delineation of especially hazardous areas that need to be dealt with by applying particular regulations or even by avoiding such areas completely for certain types of use.
Intended Audience
This document intends to support governmental authorities in Kabupaten Ende in coping with disaster risk management. It shall deliver practical insight into the steps necessary to undertake natural disaster risk assessment on Kabupaten level.
This document makes frequent references to the usage of digital Geo-Information Systems (GIS). However, it does not elaborate on the computational processes itself.
1 For details on the rational of risk assessment and mapping, as well as for the conceptual background and the relation of Disaster Risk Management to the principles of Good Governance please consult the mentioned guidebook.

2
Geological Hazard and Risk Assessment Kabupaten Ende
How to read this book?
The manual is arranged in sections, starting with short introductions. Each section comprises of a collection of maps representing the individual data sets and steps for the risk assessment process. On the left hand page, the contents of the maps and the methodology used for their creation is described, following the same set of headings for each map:
Map Contents: gives a brief description about the general aspects the map is showing.
Map Purpose with Respect to Disaster Risk Management: explains why the shown data are relevant in the context of Disaster Risk Management.
Data Source and Availability: describes where the data can be obtained, what costs, if any, have to be expected, and other aspects regarding the availability of the data. Alternative data sources may also be listed.
Remarks: contain any additional information that is important to be known for the users. This includes information on the scale of the map, references or any other relevant information.
Methodology: gives an overview about how the data have been produced or processed before visualizing them on the map.
How to Read this Map: gives more detail on how to interpret the map and which conclusions can be drawn from the map. Additional tables may be given as well as more detailed explanations of the legends.
Recommendations: relate to lessons learned during the process of data acquisition, preparation and visualization. Suggestions are made regarding mandates, roles and standards that shall help to improve and enhance the efficiency of disaster risk assessments and analyses.
The first sections describe the baseline and technical data and the way the maps were produced. The section about Spatial Planning Recommendations on page 51ff gives more specifics on how to deal with certain problems.
The Appendix on page 63 includes detailed tables for each village (desa).
Map notice / Disclaimer Due to the nature and the scale of most base maps the data derived from them cannot be viewed as a planning basis for individual sites or buildings. For that reason, each of the maps presented here carries a notice:
“This map was compiled from many sources. Use of this map’s information is under the user's risk. This map is part of a collection and should not be used without the accompanying explanatory notes. Badan Geologi and Bundesanstalt für Geowissenschaften und Rohstoffe give no warranty as to the quality or accuracy of the information supplied nor accept any liability in respect of loss, damage, injury or other occurrences, however caused.”
“Peta ini merupakan hasil kompilasi dari berbagai sumber. Penggunaan informasi dari peta-peta ini ada di bawah risiko pengguna. Peta ini merupakan bagian dari serangkaian peta dan tidak dapat digunakan tanpa adanya catatan penjelasan. Badan Geologi beserta and Bundesanstalt für Geowissenschaften und Rohstoffe tidak akan memberikan jaminan atas kualitas atau akurasi dari informasi yang diberikan maupun pertanggungjawaban dalam hal kehilangan, kerusakan, atau segala hal yang terjadi, bagaimanapun bentuknya.”

3
Georisk Project – Kerja Sama Indonesia - Jerman
Geological Hazard and Risk Assessment Kabupaten Ende
Haz
ard
s in
Kab
up
ate
n E
nd
e
Hazards in Kabupaten Ende
General Remarks
Indonesia is in a geographic position favoring natural hazards in many ways. Descriptions about this particular problem have been published in a great number of books and other media such as the recent publication from the Ministry of Research and Technology1 or the recently published National Atlas of BAKOSURTANAL2.
Kabupaten Ende is no exception to this special hazard situation. Located in Nusa Tenggara Timur Province on Flores Island, Kabupaten Ende is an extremely mountainous area with mountains exceeding 1700 m in height and only few plains of limited extent. Slopes are mostly very steep and with the beginning of the rainy season many types of landslides, such as rock falls, mud flows and debris flows are likely to occur. Additionally, Flores Island, as a segment of the volcanic inner Banda Arc, has several active volcanoes and with respect to earthquakes the region must also be considered an area with high levels of seismic activity. These geological hazards pose a serious threat not only to people’s life but also to the social and economic development of Kabupaten Ende.
Types of hazards in Kabupaten Ende
The data and maps of this book describe a multi-hazard/multi-risk - approach covering several hazards present in Kabupaten Ende. However, some data were not available (in particular no authorized tsunami hazard map has been published yet). Other data do not fall under the mandate of Badan Geologi, such as the hazards and risk caused by flooding, which fall in the realm of the Meteorology, Climatology, and Geophysics Agency (BMKG) and/or Public Works (Pekerjaan Umum).
The following paragraphs present some general introductory remarks and illustrative examples of natural hazard events that occurred in Kabupaten Ende. The intention is not to give exact scientific definitions and illustrations of taxonomic precision, but rather to show some aspects of the phenomena. It must be kept in mind that hazards often come in combination or are triggered by each other. Landslides and floods follow long and high intensity rainfall, or landslides may be triggered by earthquakes.
Kabupaten Ende with its only bigger city, the City of Ende, was frequently affected by natural disasters in the past:
In 1939 unusual heavy rainfall triggered landslides and floods and destroyed many houses,
In 1961 an earthquake shook Flores Island damaging many houses all over the Island, including Ende,
In 1969 Iya Volcano erupted and the City of Ende was close to a major disaster. On Iya Peninsula and on Ende Island, lahars (a mixture of volcanic material and water) claimed three lives and injured ten people. Two more people were seriously injured by hot air and gases on Ende Island. A total of 177 houses, 6 mosques, and 3 schools collapsed and several other buildings got severely damaged.
In 1988 heavy rainfall triggered floods, landslides and debris flows. A debris flow destroyed almost the whole village of Rowo Reke claiming 48 lives. Also Aeisa village 2km northwest of Ende was partly destroyed by a debris flow. The road between Ende and Detusoko was blocked in 11 places by landslides and debris flows.
In 1992 an earthquake hit the region. In Kabupaten Ende alone 25 people lost their lives in collapsing buildings.
1 Heru Sri Naryanto, Suryana Prawiradisastra, Lilik Kurniawan, 2007. Iptek sebagai Asas dalam Penanggulangan Bencana di Indonesia / Science and Technology as a Principle of Disaster Management in Indonesia. Published by Ministry of Research and Technology (www.ristek.go.id, www.pirba.ristek.go.id), ISBN 978-979-630-048-8.
2 Atlas Nasional Indonesia - Fisik dan Lingkungan Alam (Volume I). Penerbit Bakosurtanal 2008 (www.bakosurtanal.go.id).
4
Geological Hazard and Risk Assessment Kabupaten Ende
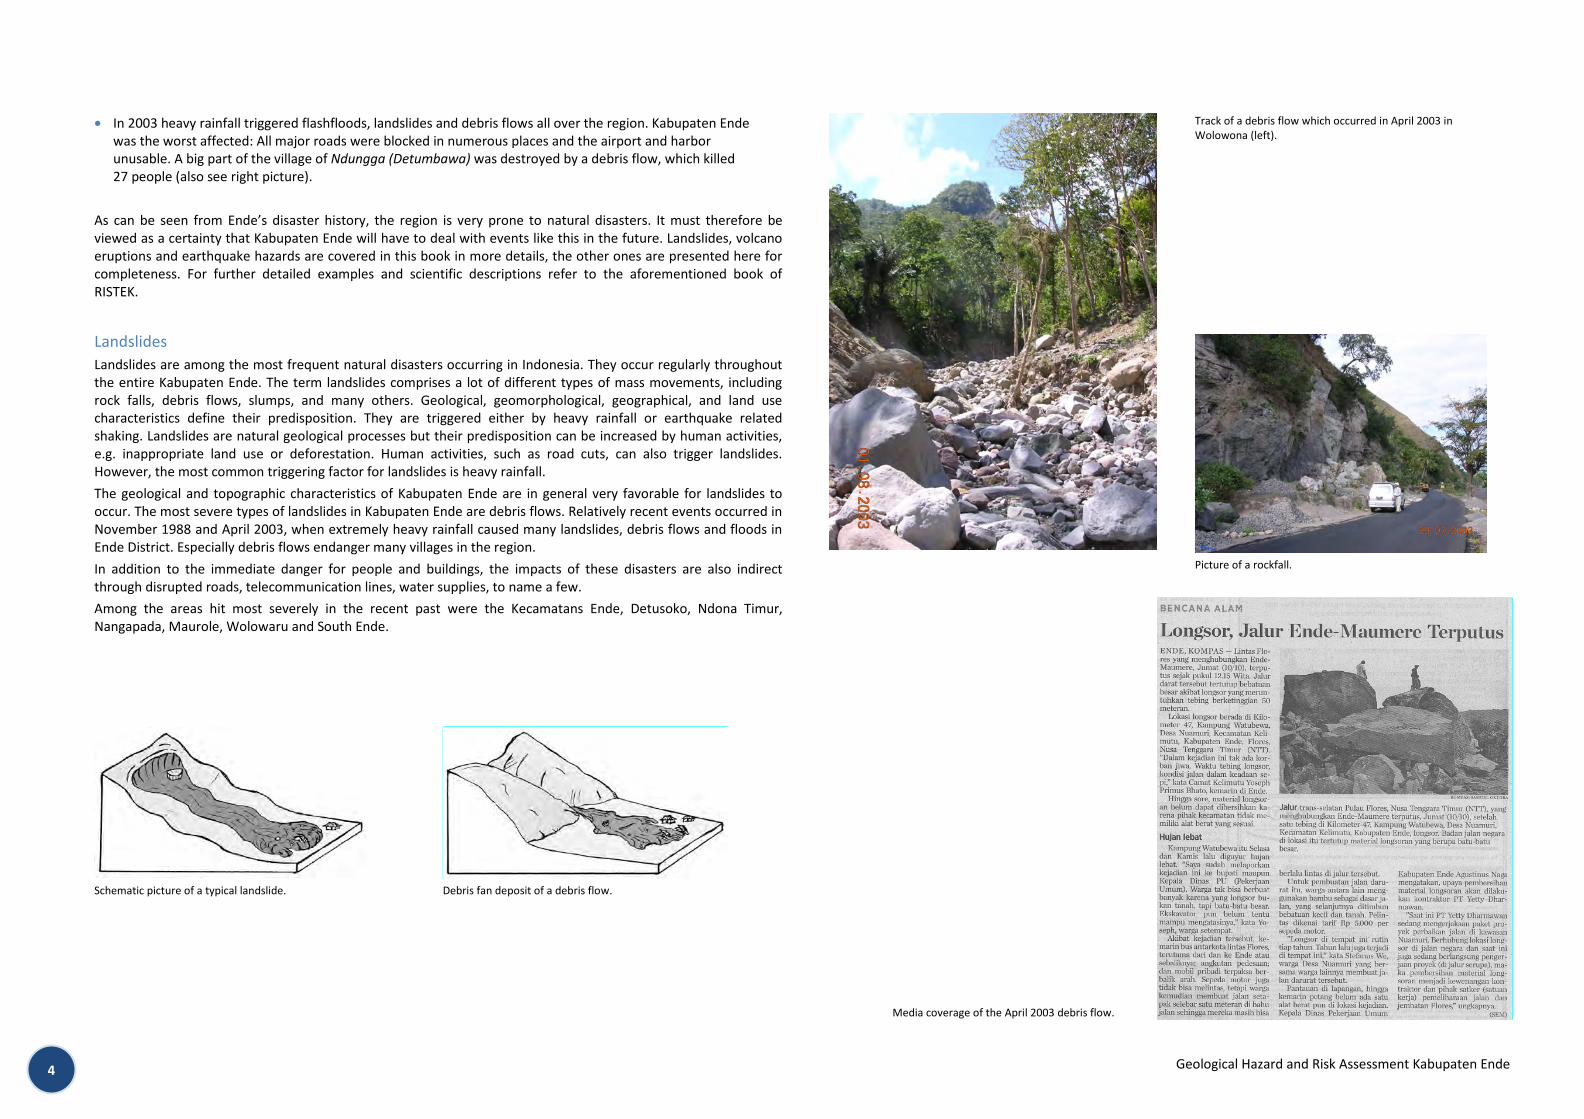
In 2003 heavy rainfall triggered flashfloods, landslides and debris flows all over the region. Kabupaten Ende was the worst affected: All major roads were blocked in numerous places and the airport and harbor unusable. A big part of the village of Ndungga (Detumbawa) was destroyed by a debris flow, which killed 27 people (also see right picture).
As can be seen from Ende’s disaster history, the region is very prone to natural disasters. It must therefore be viewed as a certainty that Kabupaten Ende will have to deal with events like this in the future. Landslides, volcano eruptions and earthquake hazards are covered in this book in more details, the other ones are presented here for completeness. For further detailed examples and scientific descriptions refer to the aforementioned book of RISTEK.
Landslides Landslides are among the most frequent natural disasters occurring in Indonesia. They occur regularly throughout the entire Kabupaten Ende. The term landslides comprises a lot of different types of mass movements, including rock falls, debris flows, slumps, and many others. Geological, geomorphological, geographical, and land use characteristics define their predisposition. They are triggered either by heavy rainfall or earthquake related shaking. Landslides are natural geological processes but their predisposition can be increased by human activities, e.g. inappropriate land use or deforestation. Human activities, such as road cuts, can also trigger landslides. However, the most common triggering factor for landslides is heavy rainfall.
The geological and topographic characteristics of Kabupaten Ende are in general very favorable for landslides to occur. The most severe types of landslides in Kabupaten Ende are debris flows. Relatively recent events occurred in November 1988 and April 2003, when extremely heavy rainfall caused many landslides, debris flows and floods in Ende District. Especially debris flows endanger many villages in the region.
In addition to the immediate danger for people and buildings, the impacts of these disasters are also indirect through disrupted roads, telecommunication lines, water supplies, to name a few.
Among the areas hit most severely in the recent past were the Kecamatans Ende, Detusoko, Ndona Timur, Nangapada, Maurole, Wolowaru and South Ende.
Schematic picture of a typical landslide. Debris fan deposit of a debris flow.
Track of a debris flow which occurred in April 2003 in Wolowona (left).
Picture of a rockfall.
Media coverage of the April 2003 debris flow.
5
Georisk Project – Kerja Sama Indonesia - Jerman
Geological Hazard and Risk Assessment Kabupaten Ende
Haz
ard
s in
Kab
up
ate
n E
nd
e
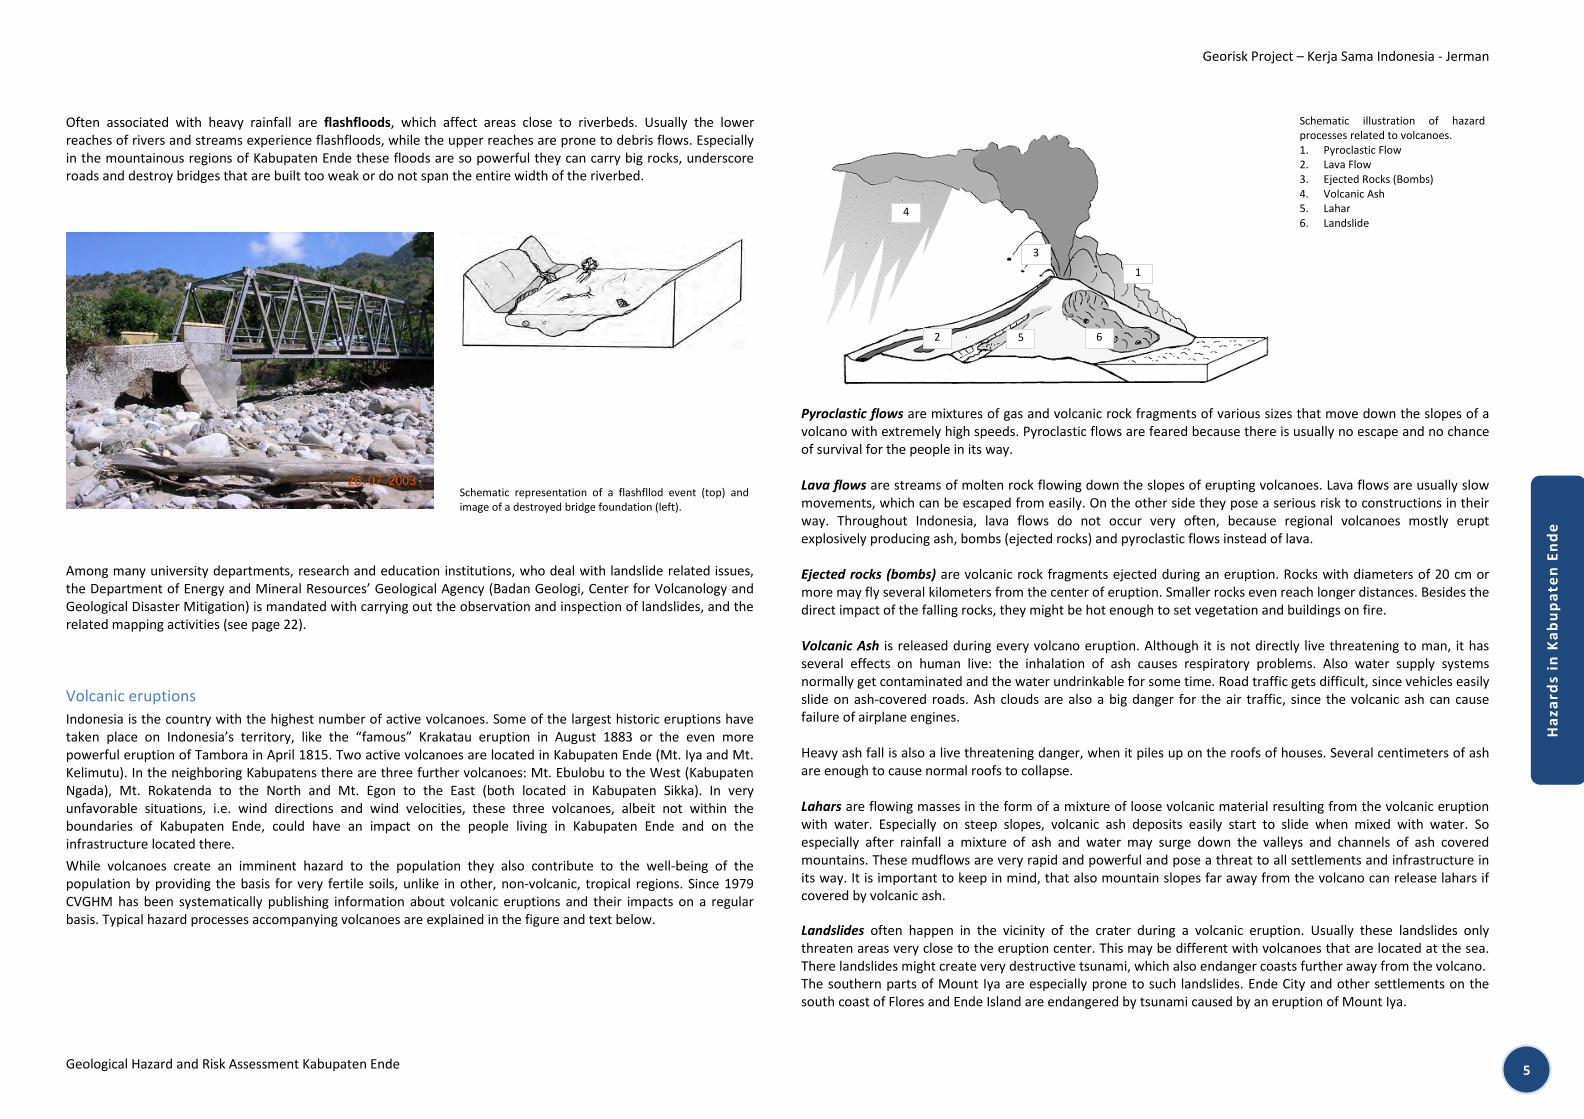
Often associated with heavy rainfall are flashfloods, which affect areas close to riverbeds. Usually the lower reaches of rivers and streams experience flashfloods, while the upper reaches are prone to debris flows. Especially in the mountainous regions of Kabupaten Ende these floods are so powerful they can carry big rocks, underscore roads and destroy bridges that are built too weak or do not span the entire width of the riverbed.
Schematic representation of a flashfllod event (top) and image of a destroyed bridge foundation (left).
Among many university departments, research and education institutions, who deal with landslide related issues, the Department of Energy and Mineral Resources’ Geological Agency (Badan Geologi, Center for Volcanology and Geological Disaster Mitigation) is mandated with carrying out the observation and inspection of landslides, and the related mapping activities (see page 22).
Volcanic eruptions Indonesia is the country with the highest number of active volcanoes. Some of the largest historic eruptions have taken place on Indonesia’s territory, like the “famous” Krakatau eruption in August 1883 or the even more powerful eruption of Tambora in April 1815. Two active volcanoes are located in Kabupaten Ende (Mt. Iya and Mt. Kelimutu). In the neighboring Kabupatens there are three further volcanoes: Mt. Ebulobu to the West (Kabupaten Ngada), Mt. Rokatenda to the North and Mt. Egon to the East (both located in Kabupaten Sikka). In very unfavorable situations, i.e. wind directions and wind velocities, these three volcanoes, albeit not within the boundaries of Kabupaten Ende, could have an impact on the people living in Kabupaten Ende and on the infrastructure located there.
While volcanoes create an imminent hazard to the population they also contribute to the well-being of the population by providing the basis for very fertile soils, unlike in other, non-volcanic, tropical regions. Since 1979 CVGHM has been systematically publishing information about volcanic eruptions and their impacts on a regular basis. Typical hazard processes accompanying volcanoes are explained in the figure and text below.
Schematic illustration of hazard processes related to volcanoes. 1. Pyroclastic Flow 2. Lava Flow 3. Ejected Rocks (Bombs) 4. Volcanic Ash 5. Lahar 6. Landslide
Pyroclastic flows are mixtures of gas and volcanic rock fragments of various sizes that move down the slopes of a volcano with extremely high speeds. Pyroclastic flows are feared because there is usually no escape and no chance of survival for the people in its way. Lava flows are streams of molten rock flowing down the slopes of erupting volcanoes. Lava flows are usually slow movements, which can be escaped from easily. On the other side they pose a serious risk to constructions in their way. Throughout Indonesia, lava flows do not occur very often, because regional volcanoes mostly erupt explosively producing ash, bombs (ejected rocks) and pyroclastic flows instead of lava. Ejected rocks (bombs) are volcanic rock fragments ejected during an eruption. Rocks with diameters of 20 cm or more may fly several kilometers from the center of eruption. Smaller rocks even reach longer distances. Besides the direct impact of the falling rocks, they might be hot enough to set vegetation and buildings on fire. Volcanic Ash is released during every volcano eruption. Although it is not directly live threatening to man, it has several effects on human live: the inhalation of ash causes respiratory problems. Also water supply systems normally get contaminated and the water undrinkable for some time. Road traffic gets difficult, since vehicles easily slide on ash-covered roads. Ash clouds are also a big danger for the air traffic, since the volcanic ash can cause failure of airplane engines. Heavy ash fall is also a live threatening danger, when it piles up on the roofs of houses. Several centimeters of ash are enough to cause normal roofs to collapse. Lahars are flowing masses in the form of a mixture of loose volcanic material resulting from the volcanic eruption with water. Especially on steep slopes, volcanic ash deposits easily start to slide when mixed with water. So especially after rainfall a mixture of ash and water may surge down the valleys and channels of ash covered mountains. These mudflows are very rapid and powerful and pose a threat to all settlements and infrastructure in its way. It is important to keep in mind, that also mountain slopes far away from the volcano can release lahars if covered by volcanic ash. Landslides often happen in the vicinity of the crater during a volcanic eruption. Usually these landslides only threaten areas very close to the eruption center. This may be different with volcanoes that are located at the sea. There landslides might create very destructive tsunami, which also endanger coasts further away from the volcano. The southern parts of Mount Iya are especially prone to such landslides. Ende City and other settlements on the south coast of Flores and Ende Island are endangered by tsunami caused by an eruption of Mount Iya.
1
2
3
4
5 6

6
Geological Hazard and Risk Assessment Kabupaten Ende
Earthquakes In addition to the high volcanic activity, Indonesia’s geotectonic setting on or close to major tectonic plate boundaries is the reason for a very high earthquake hazard, which affects almost the entire country. Consequently, the history of destructive earthquake events is long and the death toll is very high. According to CVGHM there are 17 earthquake zones to be distinguished in Indonesia. The most recent earthquakes are still in most people’s memories: the Great Aceh Earthquake in December 2004, the Nias Earthquake in March 2005, and the Yogyakarta Earthquake in May 2006. All of them have experienced a great deal of worldwide news attention. For further historic events also see the map on page 12f. Badan Geologi has published a variety of maps at different scales showing the hazard distribution. In addition to high figures of casualties, earthquake damages usually affect all aspects of human activity. In many cases, the high number of casualties caused by earthquakes can be related to the collapse or damage of non‐earthquake‐resistant structures, mainly individual homes. It could be safely assumed that the biggest part of these deaths occur among the poor people who do not have access to knowledge about earthquake‐resistant structures and resources to construct these. From the literature it can be learned that figures of fatalities are inversely proportional to the level of per‐capita income.
Kabupaten Ende in East Nusatenggara Province is also one of Indonesia earthquakes prone areas. This region develops rapidly in population and infrastructure, especially in the capital Ende City and surroundings. Recently, several destructive earthquakes hit the region (Maumere earthquake 1989 and 1992). Earthquakes in this region usually are caused by ruptures along the subduction zones or by active faults. The maximum destructive earthquake intensity that has been recorded in the region is between VIII and IX on the Modified Mercalli Intensity (MMI) Scale (also see explanations and map on page 28f.
House showing typical earthquake related damages.
Additional Existing Hazards in Ende District Apart from the hazard mentioned above, Kabupaten Ende is also exposed to other potential natural hazards. However, they have not been analyzed by the project because they do not fall within the responsibility of Badan Geologi. Nevertheless some descriptions are given below.
Tsunami After the devastating Indian Ocean Tsunami of Dec. 26th 2004, the term tsunami became familiar to almost everyone. It has since been used even as a metaphoric term for many non‐geologic events of a sudden and unexpected nature. However, Indonesia’s coasts have a long history of tsunamis, perhaps less devastating but still of a noteworthy dimension. Tsunamis in most cases are triggered by offshore earthquakes but they can also be caused by other triggering mechanism, such as volcanic eruptions or flank collapses, rock falls or undersea landslides. However, the latter causes don’t play an important role in Indonesia. For further details on tsunamis please refer to the book of RISTEK mentioned on page 3.
After the 2004 Indian Ocean tsunami many activities were carried out to produce tsunami hazard maps for various areas in Indonesia, as well as establishing an early warning system. However, up to date there is no officially published and mandated tsunami hazard map for the NTT province.
The region of Flores island has been hit by tsunamis several time. The most recent one occurred along the northern coast of Flores island on 12th December 1992. Almost 2 200 people were killed, approximately 18 000 houses destroyed, and about 90 000 people left homeless, most of them in the City of Maumere, the capital of the neighboring Kabupaten Sikka. The tsunami was generated by a 7.7 Richter magnitude earthquake, the epicenter of which was about 25 km northwest of Maumere. Run‐up heights were reported of being up to 26 m at locations in the far NE of Flores and around 2‐5 m around Maumere. More then 500 people were killed on Lomlen Island by a tsunami, which was triggered by a landslide on July 18th 1979. More tsunami events are known for the area dating back until 1820.
A preliminary map for Kabupaten Ende showing low‐lying coastal areas up to five m above sea level has been produced by the Georisk‐Project. Currently this must be seen merely as an indication of potential coast line flooding (e.g. by tsunami). The map is based solely on elevation analysis.

7
Georisk Project – Kerja Sama Indonesia - Jerman
Geological Hazard and Risk Assessment Kabupaten Ende
Haz
ard
s in
Kab
up
ate
n E
nd
e
Kabupaten Ende should be aware of a tsunami hazard in the area of Ende City. A very special threat could arise from Iya Volcano south of Ende City, where large cracks surrounding the mountain can be observed. A landslide originating at this location could create a very dangerous situation, leaving the City of Ende and adjacent sections of the coast with almost no warning time. Modeling has revealed a volume of approximately 70 million m³ that could slide to the sea, what would almost certainly create a massive tsunami. Please refer to page 55f for more details and recommendations.
Fumarole activity along crack at Mt. Iya
The figures on the right shows a simulation of the unstable area around Iya Volcanoe (red line), which is likely to cause a tsunami wave, should the mass eventually slide to the sea.
River Flooding River flooding occurs after long heavy rainfall and often is accompanied by landslides and debris flows. In order to indicate the general threat for that hazard, BMKG issues maps for every region on a monthly basis. For NTT, they can be accessed under this link: http://iklim.bmg.go.id/banjir/ntt1.jpg. An example is shown below.


9
Georisk Project – Kerja Sama Indonesia - Jerman
Geological Hazard and Risk Assessment Kabupaten Ende
Bas
eli
ne
Dat
a
Baseline Data This section describes spatial and non-spatial data that are essential for any study on risk exposure to natural hazards. These data form the backbone of any disaster risk assessment though the link may not always be obvious. Most of the data presented here are not collected having disaster risk assessments in mind, so they need special treatment to be further used in risk studies.
Baseline data are an important source of information for any development and planning purposes of local governments. Therefore these data are commonly collected and provided in the context of entire administrative entities, such as provinces (propinsi), regencies (kabupaten), municipalities (kota) or districts (kecamatan) and even down to village level (Desa/Kelurahan)1. Accordingly, hazard and risk assessments should ideally also make statements about risk exposure for the complete administrative entity.
Baseline data must be collected and generated in a reproducible manner following standards agreed upon. This is important as the data form the basis for strategic and development decisions that may affect many people. Therefore, commonly government authorities and their respective line agencies are commissioned with collecting and providing these data.
The usefulness and viability of baseline data to be used in risk assessment always needs to be scrutinized. Data can be outdated or they can vary in quality throughout the area to be investigated, jeopardizing the principle that the assessments are comparable and based on the same criteria for everyone. The baseline data used in this guidebook reflect the availability at the time of writing. Many assessments can currently not been made based on up to date information, as surveys, such as for land use and land cover, have been conducted many years ago.
Baseline data in this document include the following layers:
Administrative division (areas and boundaries)
Land use or land cover data
Infrastructure (road network)
Topographic data
Population statistics (demography, population density)
1 Please note, that there is no uniform English translation of the names of the administrative entities in Indonesia: 'Kecamatan', for example, is often also referred to as 'sub-district'. To avoid confusion the use of the Indonesian words is favored throughout this book.

10
Geological Hazard and Risk Assessment Kabupaten Ende
Administrative Areas
Map Contents This map shows the administration boundaries of Kabupaten Ende. Shown are the boundaries of Desas and Kelurahans (Villages) and Kecamatans. The data presented here were compiled by using baseline data from BAKOSURTANAL and a substantial amount of manual editing based on maps and information available from local authorities (see picture on the right side).
Map Purpose with Respect to Disaster Risk Management Decision making processes within the disaster management cycle always affect entire administrative entities (Province, Regency, District, Village), as do official management, development, or planning documents (e.g. RPJM, RTRW, RDTRK). Therefore, it is mandatory for those carrying out disaster risk assessments as input to decision making authorities to cover the entire administrative area in their responsibility, not only parts of it.
Data Source and Availability In Indonesia, there are two major data sources for administrative boundaries or areas in the country:
• BAKOSURTANAL The national mapping authority provides a seamless administration boundaries product. This spatial dataset on a scale of 1:25 000 to 1:50 000 is provided in ESRI‐GIS format (shp) and is available upon request and for free (at the time of writing). BPS codes are included for province and and regency levels only.
• Badan Pusat Statistik (BPS), National Level BPS delivers a data product that corresponds to the most current administrative division from province to desa level, it includes the hierarchical administrating coding system (for details see page 18). The GIS data are distributed digitally in ESRI‐ format (shp) and are accompanied by the so‐called Master File Desa which provides the complete hierarchical coding system in a database‐ready format (www.bps.go.id/mstkab/index.shtml). Costs for obtaining the data depend on the size of the region to be studied, for a province it is in the range of a few million IDR, for the entire country the costs are approximately 10 million IDR.
Statistical data collected by BPS, such as demographic data or 'Pendataan Potensi Desa' that hold valuable information for the risk analysis, are categorized according to the administrative codes. Therefore, usage of the BPS codes in GIS allows for easy linkage of statistical data to spatial entities in the subsequent risk analysis. Linking just by names would lead to errors because villages can have the same name.
Remarks The administrative division of Indonesia in general is still subject to very dynamic changes. These changes are not immediately reflected in the spatial data that are available from the sources mentioned above, making it difficult to keep the attributes of the spatial data in line with the statistical data available from BPS.
This can lead to inaccuracies in results, affecting those areas, where there is a discrepancy between the spatial data and other data that they will be related to (e.g. demographic data). On a local level, this problem can be overcome by manual input or correction of data. However, on regional and national levels, this must be a task of the respective line agencies.
At the time of writing the database used for the analysis contains 20 Kecamatans and 211 Desas and Kelurahans for Kabupaten Ende. However, both BPS and Bakosurtanal data for 2009 do not reflect correct up to date administrative division on Kabupaten Ene.
Number of administrative entities in Kabupaten Ende
Year 2005 (BPS)
Year 2009 (BPS)
Year 2009 (Bakosurtanal)
No of Districts/Kecamatan
16 20 7
No of Villages /Desa
172 211 124
Methodology • BAKOSURTANAL
In NTT, administrative data are partly based on the 1:25 000 topographic map data, dating back to the 1990s. The BPS coding is maintained only for Kabupaten level. On Kecamatan and Desa level the assignment of the coding needs to be done manually. The spatial accuracy of the data is good in those places, where it is available.
• BPS While the administrative areas available from BPS are precise with respect to the coding, the spatial accuracy is of rather sketchy quality. This data has not been produced with high accuracy mapping projects in mind, albeit in many projects it is being utilized for such purposes due to the lack of other data sources.
This figure illustrates the differences between the two datasets. The map shows in yellow color the BPS data representing districts (Kecamatans) with their administrative codes. The sketchy quality is clearly visible. In red color the BAKOSURTANAL data is depicted.
Georisk‐Project has cross‐checked the course of administrative boundaries using secondary data as exemplary shown above.
How to Read this Map The map represents the hierarchical coding system of BPS for Kabupaten Ende (code 5311) in graphical form. The GIS also provides the area (in m²) of each Kecamatan and each Desa, which is of importance for many of the subsequent steps in the risk analysis. For example Desa Wolotopo in Kecamatan Ndona (BPS code 5311040) has the code 5311040004 and an area of 10 545 878 m² or 10.546 km². See also the results tables in the Appendix (page 63 f).
Recommendations • A well structured administrative dataset is important as all subsequent data and risk analysis steps rely on it. It
is recommended to spend a good deal of time on establishing a proper dataset suitable for a Geographic Information System.
• The spelling of the names of the administrative entities in Indonesia often differs from source to source. Using the number codes to address administrative entities in GIS solves this problem, as well as problems arising from duplicate names.
• It is recommended that the usage of the BPS administrative code becomes obligatory for all digital mapping purposes by government authorities throughout Indonesia. BNPB also relies on and recommends usage of the BPS coding system.
• The dataset of boundaries prepared by the Georisk‐Project for this booklet has been given to BAPPEDA Kabupaten Ende for approval.

11
Georisk Project – Kerja Sama Indonesia - Jerman
Geological Hazard and Risk Assessment Kabupaten Ende
Bas
eli
ne
Dat
a

12
Geological Hazard and Risk Assessment Kabupaten Ende
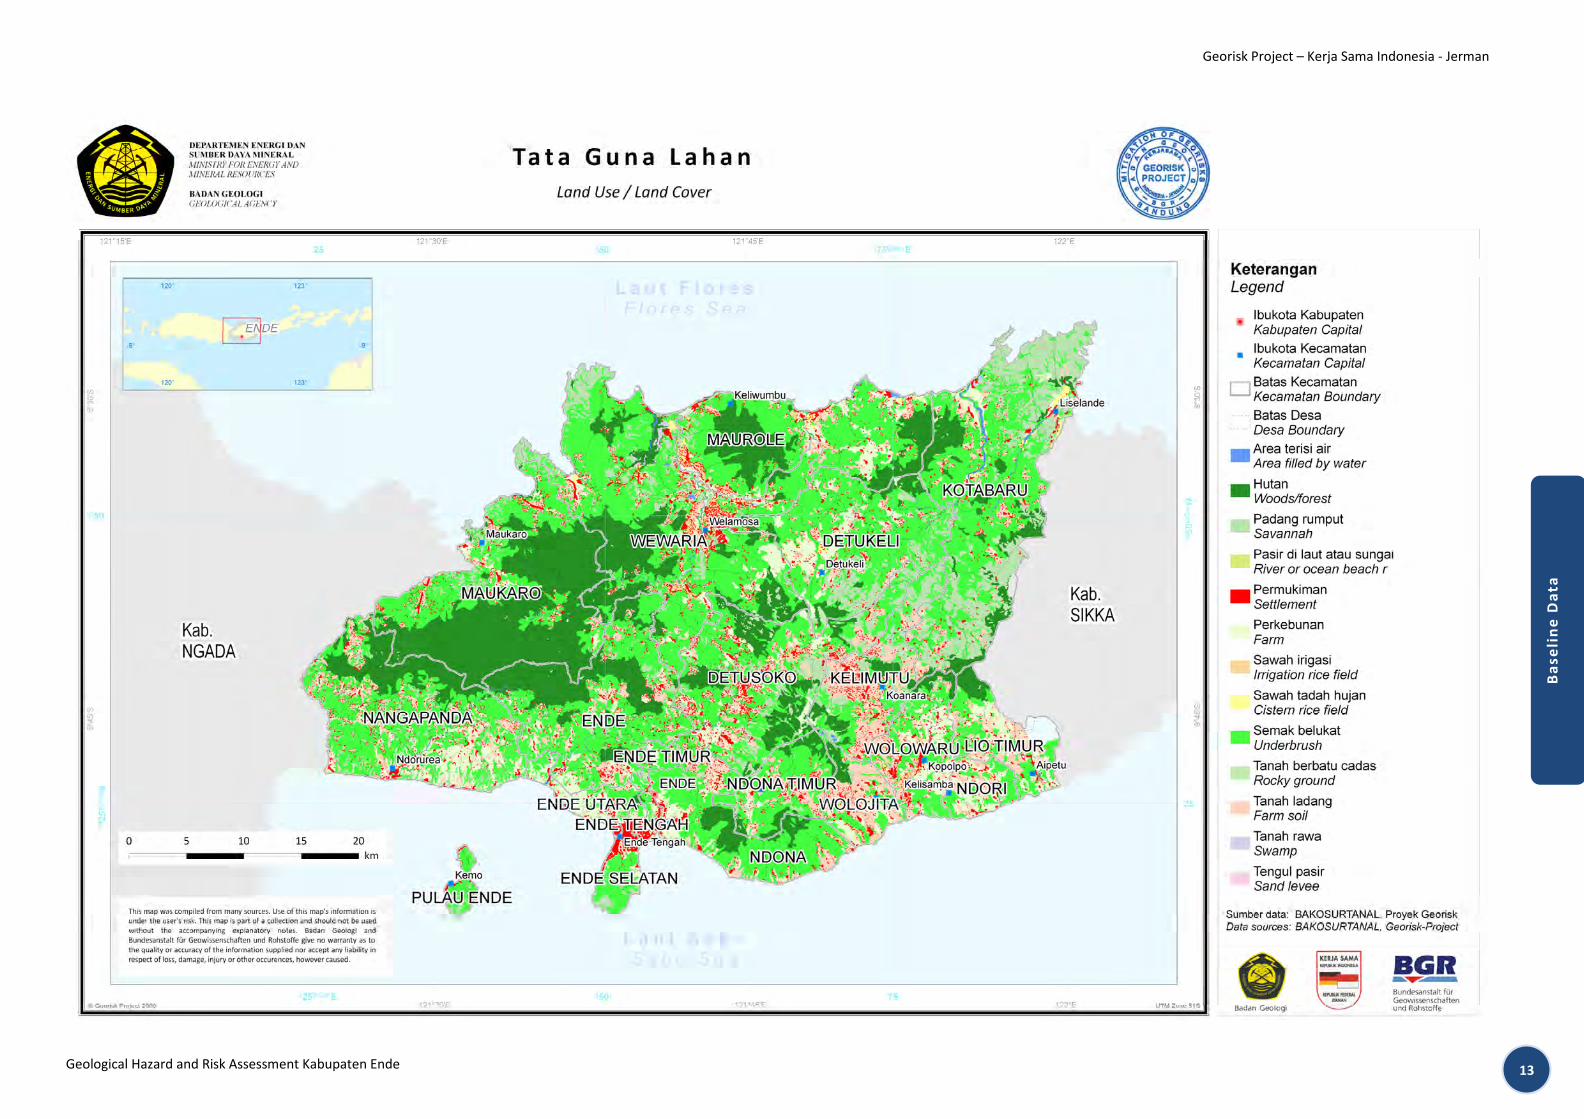
Land use / Land Cover
Map Contents The map shows the land cover classes as provided by BAKOSURTANAL. For settlement areas two additional data sources have been utilized:
Point data from BAKOSURTANAL representing residential and other buildings (code 1214).
Settlement areas derived from satellite imagery have been merged to that dataset for a better coverage. For that step a recent LANDSAT image was processed using remote sensing software.
All three datasets finally were merged in to one single GIS data layer.
Map Purpose with Respect to Disaster Risk Management In any risk assessment study and in any spatial planning process, land use and/or land cover data play an important role. Land use patterns reflect the type of activity that takes place at a specific location and thus determines whether this activity is exposed to a hazard or not. Land use data, when intersected with administrative data, allow for spatially analyzing statistical data, such as demographic or economic key data. Furthermore, they also contribute to the susceptibility of a landscape to certain types of hazard. It has been shown, as an example, that in many areas the removal of a forest cover increases the landslide hazard.
Data Source and Availability Badan Pertanahan Nasional (BPN)
Land use data produced by BPN are a compilation of data mainly directed towards agricultural use. Data are provided on a scale of 1: 500 000. The geospatial quality of the data is poor and data need to be manually corrected. However, the usually comes for entire provinces in GIS format and thus are easily usable. BPN does not have a pricing policy. The data quality for NTT was too poor to be used for a Kabupaten level assessment.
BAKOSURTANAL As part of the data packages for topographic base maps, land use data is included as polygon feature data in ESRI-format (shp). They are thus easily usable in almost any GIS application. The data are based on aerial photographs taken in the 1990s and are provided at 1:25 000 scale, but not all regions of the country are covered at that scale. The costs for topographic base data is regulated under Peraturan Pemerintahan 57/2007 and are around 3000 IDR/km². That means the entire digital topographic base map for the NTT Province costs around 6 million IDR.
Sample of a digitally prepared land use map from BAKOSURTANAL data.
Area terisi AirHutanHutan BakauPadang RumputPasir di Laut atau SungaiPemukimanPengisi area AirPerkebunan
Sawah irigasiSawah tadah hujanSemak BelukarTanah Berbatu (Cadas)Tanah LadangTanah RawaTengul Pasir
LAPAN The national space agency applies remote sensing techniques for various purposes. It is at the moment unknown if LAPAN has a land use data product usable at Kabupaten scale and whether it is accessible for other institutions.
Remarks The age of land use data, respectively the date when the aerial or satellite images were taken on which the land use map is based, plays a crucial role in the risk assessment. Ideally, the data shall be as recent as possible. For risk assessment on province level some discrepancy between actual land use and the data available is acceptable, on Kabupaten level it should be as recent as possible. The more detailed the map scale of risk assessment, the more precise the land use information has to be. Commonly, new land use data are generated to facilitate recovery and rehabilitation after a natural disaster has occurred.
Methodology Various methods exist for creating land use or land cover maps. In most cases some sort of remote sensing techniques is involved, either satellite based or aerial. Subsequently, the imagery data is being converted to vector based formats.
How to Read this Map The map shows the land use classes as defined by BAKOSURTANAL (see table below).
Code Description(Bahasa Indonesia)
Description (English)
1214 Bangunan Buiding
1224 Area Pemukiman Settlement area
3354 Pasir di Laut atau Sungai Sand, beach or river
3364 Tengul Pasir Sand levee
5214 Sawah irigasi Irrigated rice field
5224 Sawah tadah hujan Cistern rice field
5234 Tanah Ladang Farm soil
5244 Padang Rumput Savannah
5254 Perkebunan Farm
5264 Semak Belukar Underbrush
5274 Hutan Woods/forest
5284 Hutan Bakau Mangrove forest
5294 Tanah Berbatu (Cadas) Rocky ground
6214/6264 Aree terisi Air Water body
6314 Tanah Rawa Swamp
Recommendations Data from BAKOSURTANAL for the region of NTT are based on maps of the 1990s. They are thus not quite up to date. For more current data, analysis of more recent satellite imagery or aerial photography is strongly recommended for the future.
13
Georisk Project – Kerja Sama Indonesia - Jerman
Geological Hazard and Risk Assessment Kabupaten Ende
Bas
eli
ne
Dat
a

14
Geological Hazard and Risk Assessment Kabupaten Ende
Infrastructure
Map Contents This maps shows the most important infrastructure features:
roads (only major roads),
airports,
hospitals,
police stations,
power stations.
Due to scale reasons, additional infrastructure features (such as minor roads, bridges, hospitals, utility and life lines etc.) are not shown here, but they are included in the digital data set that was used for producing this book.
Map Purpose with Respect to Disaster Risk Management Comparable to land use/land cover data, infrastructure data also serve as an important parameter in assessing risk. Infrastructure elements are on one hand affected by hazard events, e.g. destroyed by a landslide or submerged by a flood. On the other hand, they play an important role in the preparedness component of the risk management cycle (e.g. hospitals) as well as in the capacity issue (e.g. escape routes).
Data Source and Availability BAKOSURTANAL
As part of the data packages for topographic base maps, infrastructure data are included as line and point data. They come in GIS ready formats (ESRI shape file, shp) and can thus easily be integrated in a GIS based disaster risk analysis.
Remarks Due to the time of the data preparation (1990s), the data (from BAKOSURTANAL) may not reflect the most recent situation. The data do not provide more information than just the type and location of an object, for example no information is given about the capacity of a hospital. However, on a regional scale the data provide a rapid and spatially accurate overview about the locations of many types of infrastructure objects and their basic characteristics.
Methodology The BAKOSURTANAL data which were used in this study are being created during the regular base mapping process for topographic maps at 1:25 000 scale. The consistent coding of the features for all maps from BAKOSURTANAL makes quick assessments and regional comparisons easily possible.
How to Read this Map The map only depicts linear infrastructure features and airports. There are many more object types represented in the data. As an example, a more detailed section of the data is shown below.
This exsample illustrates the point infrastructure objects that can be extracted from the topographic data set of BAKOSURTANAL. In addition to point objects, there are also linear objects, e.g. power lines, pipelines and other, included in the data set. All of them are not shown here.
Recommendations If such data are to be used for local scale assessments, it is recommended to improve their quality by assigning more properties to the individual objects (for example the size of a hospital, the capacity of a bridge, etc.). For detailed studies even a field survey may be appropriate, possibly in the framework of surveying vulnerability and capacity of a community.

15
Georisk Project – Kerja Sama Indonesia - Jerman
Geological Hazard and Risk Assessment Kabupaten Ende
Bas
eli
ne
Dat
a

16
Geological Hazard and Risk Assessment Kabupaten Ende
Topography / Elevation
Map Contents The map shows a shaded relief representation of the terrain of Kabupaten Ende. Although terrain information has not been used here for the direct assessment of risks, it was of course used during the hazard mapping activities. The digital elevation data was derived from digital BAKOSURTANAL contour data.
Map Purpose with Respect to Disaster Risk Management Terrain information plays an important role in many aspects of disaster risk assessment. For most of the exogenic hazards, like floods, landslides, lahars, the terrain surface defines the path along which the hazard propagates. Digital elevation models (DEM) are indispensible for either directly modeling these processes or for deriving factors leading to their onset (e.g. by deriving a slope map from the elevation data as part of landslide susceptibility assessment).
Data Source and Availability BAKOSURTANAL
The most important authority for this type of data is the National Mapping Agency BAKOSURTANAL. They provide topographic base data at different scales, depending on the region of interest. The availability of the data for different regions changes rapidly due to enormous efforts of BAKOSURTANAL to establish a National Spatial Data Infrastructure. The price for the data is calculated on a per-area basis and regulated under Peraturan Pemerintahan (PP) 57/2007. Currently approximately 500 000 IDR must be paid for the size of a 1:25 000 map sheet. The data come in a well organized structure that provides thematic layers, which are equipped with a numerical feature coding system.
The data are the same that are used for producing the printed paper map product and have a very high spatial accuracy. However, since the data production process is based on aerial photography, the data reflects the situation as it was when the photographs were taken. This date usually is printed on the maps. In a rapidly changing landscape, in particular in areas subject to rapid urbanization this can be a problem.
SRTM-Data For larger scale assessments, with reduced demands on spatial precision, the NASA Shuttle Radar Topographic Mission (SRTM) has provided digital elevation data (DEMs) for over 80% of the globe. The data were taken in the year 2000 and are distributed free of charge by USGS (edc.usgs.gov/srtm/data/ obtainingdata.html). The SRTM data are available at a spatial resolution of 3 arc seconds, which approximates to a 90m resolution of the DEM near the equator. The vertical error of the DEM is reported to be less than 16m.
Remarks In some areas of Indonesia efforts lead by BAKOSURTANAL are ongoing in order to derive more precise elevation data by using airborne laser scanning technologies. This technique produces DEMs with a much higher horizontal and vertical accuracy. However, data amounts are tremendously high and demand high end hard- and software products for processing.
Methodology The data used for this map was derived from aforementioned SRTM. The shaded relief representation can be derived using a GIS capable of raster data processing.
How to Read this Map The shaded relief representation of terrain provides a quick impression of the general geomorphological situation.
Recommendations It is recommended to use better DEM data if available. The topographic base data from BAKOSURTANAL also
includes contour lines and elevation features from which DEMs can be derived in a better quality than SRTM.
From high quality digital elevation data also further terrain parameters can be derived, such as a slope gradient map (see below for an example). Such parameter can be used for example landslide hazard assessments or road planning.
Section of the slope gradient map of Kabupaten Ende.

17
Georisk Project – Kerja Sama Indonesia - Jerman
Geological Hazard and Risk Assessment Kabupaten Ende
Bas
eli
ne
Dat
a

18
Geological Hazard and Risk Assessment Kabupaten Ende
Demographic data
Map Contents The map shows a geographic representation of population density figures on district (Kecamatan) level. Population densities have been derived from number of inhabitants as given in BPS Potensi Desa-Data (PoDes) and from the area size information of the GIS data layer. Data are from 2007.
Map Purpose with Respect to Disaster Risk Management Assessing the risk exposure of the population is one of the most important tasks of any risk assessment project. Therefore, having demographic data at hand is an indispensable necessity. Demographic data also provide important information on the demographic structure (e.g. the percentage of elderly people or the portion of children) of a community or society and thus provide indirect information on the capacity of a community to cope with hazards.
Data Source and Availability Demographic data are provided from BPS offices on all administrative levels. These data come in various formats, though the most common format are PDF compilations called 'Kabupaten Ende Dalam Angka/ Kabupaten Ende in Figures', for example. Some of the data can also be directly downloaded from the respective BPS websites. These data are updated on a yearly basis.
Population data with increased spatial resolution can also be derived from the census data called 'Potensi Desa’, which are collected, alongside with other data, and updated by BPS every five years, using a standardized questionnaire format.
Remarks The map shown here actually represents just one variable of the demographic data package, which contains far
more variables on the living and economic environment of a society than just the population.
For the purpose of risk assessment, the bulk population figures for the administrative entities need to be linked to the actual settlement areas. Please refer to the chapter on Modified population density on page 32.
Methodology Indonesia’s provinces, cities and villages are all based on a hierarchical numbering system. The smallest unit is a Desa (in rural areas) or a Kelurahan (in urban areas) and has a 10-digit code.
53 2 digit Province code (33 Provinces
5311 4 digit Kabupaten code (~ 400 Kabupatens)5311032 7 digit Kecamatan code (~ 5000 Kecamatans)
5311032003 10 digit Desa/Kelurahan code (~ 75000 Desas and Kelurahans)
In many publications of the national or regional BPS, this code is not used explicitly, but is of course implicitly integrated in the data. Thus, this code can be assigned to any data extracted from BPS data books. BPS Jakarta therefore provides the so called 'Master File Desa' (see page 10), which lists the code and the name for each Indonesian village (see example below). This Master File provides the best basis for systematically, reproducibly and unambiguously addressing the administrative entities in Indonesia.
PROVNO KABNO KECNO DESANO ID2007_2 NM2007_2 This small section is taken from the
original Master File Desa as provided by BPS in dBase fromat.
53 00 000 000 3300000000 NTT (Province) 53 11 000 000 3311000000 ENDE (Kabupaten) 53 11 032 000 3311032000 ENDE TENGAH (Kecamatan) 53 11 032 003 3301032003 KEL. KELIMUTU (Desa/Kelurahan)
How to Read this Map The density figures shown here were derived by dividing the total population of each individual district (Kecamatan) by its area size (area as defined by the GIS, see page 10). Clearly, the City of Ende shows highest population densities. For a complete list of codes for the Kecamatans refer to the table on page 63).
Recommendations The data used for a risk assessment study should be as recent as possible in order to reflect the most current
situation. In order to easily access, update and analyze the data it is recommended to store them in a relational database system (e.g. MS Access). Using such a system also would make it comparatively easy to analyze the effects of demographic change.
Ideally, BPS should distribute the data in spread sheets or in digital database format ready to use for GIS.

19
Georisk Project – Kerja Sama Indonesia ‐ Jerman
Geological Hazard and Risk Assessment Kabupaten Ende
Base
line D
ata


21
Georisk Project – Kerja Sama Indonesia - Jerman
Geological Hazard and Risk Assessment Kabupaten Ende
Haz
ard
an
d S
usc
ep
tib
ilit
y D
ata
Hazard and Susceptibility Data Hazard data are the most important 'ingredient' for any risk analysis. Without hazard there is no risk. In Indonesia several government agencies are mandated with producing hazard information. These products commonly show zones of different intensity or probability of a certain hazard.
Hazards maps can be applied in many ways:
as information for the public about threats in their living environment,
as input for land use, strategic and business planning,
as a basis for civil engineers for construction projects and retrofitting (building codes, hill stability, etc) or among others,
as a basis for insurance companies to calculate insurance rates.
Practitioners of hazard and risk assessment usually differentiate between 'susceptibility maps' and 'hazard maps':
A susceptibility map provides spatial information on whether a certain terrain is prone to the occurrence of a hazardous event. The term is particularly common for landslide studies, where 'static' parameters such as topography/slope, soil condition and average rainfall can be used to indicate the potential for mass movements.
A hazard map additionally takes into account the temporal probability that a hazardous event may occur. As an example, a flood hazard map is commonly based on the return period of river flooding levels.
In many cases the temporal probability of a certain hazard cannot be easily expressed in numerical figures. Recurrence intervals need to be known, which requires good databases spanning long time intervals. The differentiation of these terms is also blurred, where information on past hazard events, such as on earthquakes or landslides, enter the analysis for a hazard map, without quantitatively calculating the temporal probability. For this reason, this book does not strictly and systematically differentiate between hazard and susceptibility data or maps. To avoid further confusion those terms are used that are currently in place for the products provided by the Indonesian agencies.
The hazard maps presented in this section were all produced by Badan Geologi being the mandated Indonesian agency for landslide, volcano and earthquake hazard maps.

22
Geological Hazard and Risk Assessment Kabupaten Ende
Landslide Susceptibility
Map Contents The map is a simplified representation of landslide susceptibility zones in Kabupaten Ende. Additionally, landslide locations recorded during the latest mapping campaign in the northern and western part are plotted. The landslide susceptibility zones are underlain by a shaded relief representation to better visualize the terrain.
Map Purpose with Respect to Disaster Risk Management The map represents the technical input regarding landslide hazard within the risk assessment process. It shows the spatial distribution of landslide susceptibility zones that can be overlaid with vulnerability data in subsequent steps. It serves as input for spatial planners as well as for civil engineers for estimating slope stabilities relevant for construction projects.
Particularly in regions, where expensive slope stabilization measures are not an option, hazard and susceptibility maps play an important role. They help to avoid hazardous areas and should thus be integrated in the spatial planning process.
Data Source and Availability The data have been mapped and published by the Center for Volcanology and Geological Hazard Mitigation, CVGHM (Pusat Vulkanologi dan Mitigasi Bencana Geologi, PVMBG) of Badan Geologi. Badan Geologi is mandated with evaluating and mapping landslide hazards on national, provincial and local scale. The original map used as a basis for this analysis, is titled Peta Zona Kerentanan Gerakan Tanah Kabupaten Ende, Provinsi Nusa Tenggara Timur by Yukni Arifianti, Yunara Dasa Triana & Gasid, 2009 (Landslide Susceptibility Zone Map of Kabupaten Ende, Nusa Tenggara Timur Province), scale 1: 75 000, CVGHM. For the southern part the Landslide Susceptibility Map, Ende District (Sugalang & Tigor Tobing, 2004) has been integrated.
Remarks Landslide maps published by CVGHM contain additional information such as recommendations about
mitigating landslide risks.
CVGHM in cooperation with BMKG compiles monthly reports with maps on areas with high potential of landslide occurrences based on rainfall projections and landslide susceptibility ('Prakiraan Potensi Kejadian Tanah Longsor dan Banjir Bandang di Beberapa Provinsi di Indonesia'). This information can also be found on the CVGHM webside (www.vsi.esdm.go.id).
Example of the landslide forecast map of CVGHM and BMKG for NTT.
Methodology The landslide susceptibility map was produced according to standards documented in SNI 13-6982.1-2004, SNI 13-6982.2-2004, and SNI 13-7124-2005 and the combination of empirical and analytical approach. Geographical Information System analysis using Map Info and ILWIS1 was used to support the spatial-empirical analysis.
The method used is based on indirect mapping, which implies the statistical analysis of parameters contributing to slope instability. However, direct landslide mapping was used in the field. More than 180 landslides were mapped and the data was used to for test the empirical model for the indirect mapping procedure in the GIS. As parameters geomorphology (slope gradient), geology, structure, and others were used.
Mapping was carried out for the northern part. In order to have a complete map for Kabupaten Ende, the map already produced in 2004 for the southern part was joined.
How to Read this Map The map indicates, in “traffic light” colors the relative susceptibility of the region to landslides, or in other words, the generalized tendency for mass movements. Additionally, potential debris flow tracks (lahar) are shown. A condensed description of the susceptibility classes according to SNI 13-7124-2005 is listed below.
very low The susceptibility to landslides is very low. The zone was rarely or has never been subjected to landslides. No land mark of old or new landslides have been found in this zone, except on small areas on the riversides. (The value of the safety factor is above 2.0).
low The zone has low susceptibility to landslides. Landslides rarely occur unless the slope is disturbed, and old landslides have been stabilized during the past period. (The value of the safety factor is 1.7-2.0).
moderate The zone generally has a moderate susceptibility to landslides. Landslides may occur in this zone, especially along river sides, scarps, road cuts, and disturbed slopes. Old landslides may be activated especially due to heavy rainfall. (The value of the safety factor is 1.2-1.7).
high The zone generally has a high susceptibility to landslides. Landslides frequently occur. (The value of the safety factor is smaller than 1.2).
Non-SNI zone:
debris flow Debris flow may occur if there are barrage by lahar accumulation and landslide materials at upstream and triggered by strong erosion and high rainfall.
Recommendations For more details about this map and the description of the susceptibility zones it is recommended to consult the original map from Badan Geologi (Center for Volcanology and Geological Hazard Mitigation), which also includes some general recommendations for construction and other activities in the individual zones.
1 MapInfo is a GIS of Pitney Bowes Software Inc., ILWIS is an open-source GIS

23
Georisk Project – Kerja Sama Indonesia ‐ Jerman
Geological Hazard and Risk Assessment Kabupaten Ende
Haza
rd and Susceptibility Data

24
Geological Hazard and Risk Assessment Kabupaten Ende
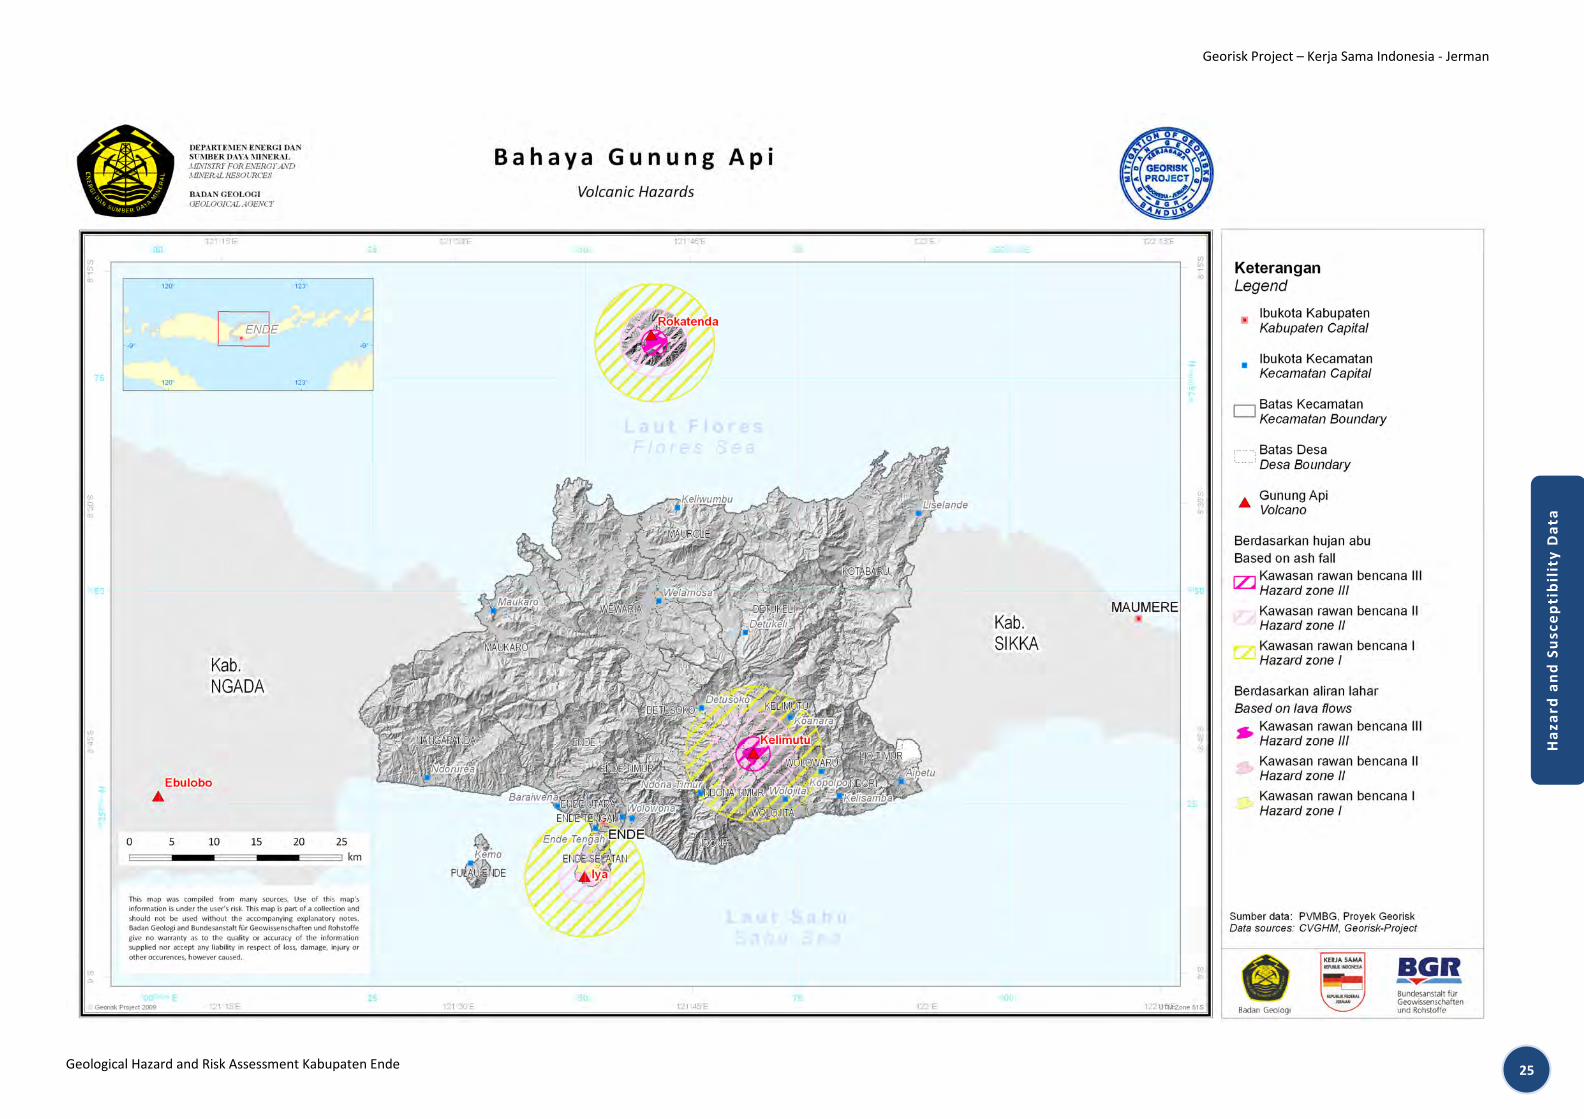
Volcanic Hazards – Ash fall
Map Contents This map is compilation of four volcanic hazard maps available for Kabupaten Ende and Sikka (listed below). It shows the circular ash fall hazard zones as extracted from these maps. More detail about the other volcano related hazard can be seen on the individual maps at 1:50 000 scale.
Map Purpose with Respect to Disaster Risk Management Like the landslide susceptibility map, the volcanic hazard map represents input from the technical side and serves as a guidance map, which identifies the degree of hazard of an area when an eruption/activity occurs. The map details also the kind and types of volcanic hazard, hazard zones, evacuation direction, as well as locations of evacuation and disaster relief posts.
Data Source and Availability The following published Volcanic Hazard Maps at a scale of 1: 125 000 and 1: 25 000 have been used for this study:
Volcanic Hazard Map of Kabupaten Ende (Peta Kawasan Bencana Gunungapi Kabupaten Ende, Provinsi Nusa Tenggara Timur, 2009, by Igan S. Sutawijaya, Rudy Dalimin et al.), scale 1: 125 000.
Volcanic Hazard Map of Iya Volcano (Peta Kawasan Bencana Gunungapi Iya, Kabupaten Ende, Provinsi Nusa Tenggara Timur, 2009, by Igan S. Sutawijaya, Rudy Dalimin, et al.), scale 1: 25 000.
Volcanic Hazard Map of Kelimutu Volcano (Peta Kawasan Bencana Gunungapi Kelimutu, Kabupaten Ende, Provinsi Nusa Tenggara Timur, 2009, by Igan S. Sutawijaya, Rudy Dalimin, et al.), scale 1: 25 000.
Volcanic Hazard Map of Rokatenda Volcano (Peta Kawasan Bencana Gunungapi Rokatenda, Kabupaten Ende, Provinsi Nusa Tenggara Timur, 2009, by Igan S. Sutawijaya, Rudy Dalimin, et al.), scale 1: 25 000.
Remarks The map contains information of volcanic hazard zonation based on the potential volcanic hazards that are indicated by the ash fall distribution and incandescent ejected rock fragments.
All three volcanoes shown on the map are of type A.
Methodology The maps are produced according to the Indonesian Standard described in the SNI 13-4689-1998 (see page 66). This SNI is currently under review. Descriptions of volcano types in Indonesia given in the tables below follow the revised version. As temporal probability of volcanic eruptions is not assessed, the products provided by Badan Geologi are strictly speaking susceptibility maps.
volcano type description
A volcanoes which had undergone magmatic eruption or other related processes, at least once after the 1600 A.D. (a total of 80 in Indonesia)
B volcanoes in solfataric and fumarolic stages and no magmatic eruptions known since the year 1600 A.D. (a total of 28 in Indonesia)
C volcanoes, which had no eruption registered/known since 1600 A.D., at present in the form of solfataric and fumarolic fields (a total of 21 in Indonesia)
How to Read this Map This map presents a part of the volcanic hazard map zone, namely the zones indicating ash fall hazard and potential incandescent ejected rock fragments.
symbol zone description
high Always threatened by heavy ash fall and incandescent ejected rock fragments
moderate Potentially affected by heavy ash fall
low Potentially affected by heavy ash fall and possibly affected by incandescent ejected rock fragments
Name of Volcano Distance 1 (inner ring, high)
Distance 2 (middle ring, moderate)
Distance 3 (outer ring, low)
Iya 3 km 7 km
Kelimutu 2 km 5 km 8 km
Rokatenda (Kab. Sikka)
1.5 km 4 km 7 km
Further zones shown on the printed maps but not used for analysis include the following:
Frequently affected by pyroclastic flows, lava flows, rock falls, toxic gases, and glowing ejected rock fragments.
Potentially affected by pyroclastic flows, toxic gases, glowing rock falls and lahars.
Potentially affected by lahar or stream flow (flood) and possibly affected by overflowing of pyroclastic flows.
Reduced section of the volcanic hazard map of Gunung Kelimutu showing the various hazard zones.
The lahar hazard zones shown here in yellow color are also incorporated in the landslide susceptibility map (on page 22). The risk exposure analysis therefore has been included in the landslide section (page 40).
Recommendations For detailed local studies it is recommended to consult the detailed maps mentioned above.
25
Georisk Project – Kerja Sama Indonesia - Jerman
Geological Hazard and Risk Assessment Kabupaten Ende
Haz
ard
an
d S
usc
ep
tib
ilit
y D
ata

26
Geological Hazard and Risk Assessment Kabupaten Ende
Earthquake Hazard – Macrozonation
Map Contents The map shows a division of Kabupaten Ende into five earthquake hazard zones. This division is based on analyzing seismotectonics (morphology, geological and tectonic conditions, active and historical fault lines, present and historical seismicity) combined with Probabilistic Seismic Hazard Analysis (PSHA) for which the response characteristics of the rock types and soil conditions in Kabupaten Ende have been measured. The earthquake hazard macrozonation is an expert classification of the susceptibility of specific regions to earthquake damage.
Additionally, the map shows isolines for the probabilistic peak ground acceleration (10 % probability of exceedance in 100 years). Also depicted are the pattern and magnitude (mb) of recorded seismicity (1963-2009). The symbol mb stands for body wave magnitude.
Map Purpose with Respect to Disaster Risk Management This map provides important information for construction purposes in regions susceptible to earthquakes. Peak ground acceleration (PGA) is proportional to the force a building is exposed to during short term ground motion. It is an important design parameter in many building codes and is particularly important for smaller, i.e. one or two storey buildings.
Data Source and Availability Fieldwork, desk-study and analysis for this map has been conducted by A. Soehaimi, Sukahar Eka, Robby Setianegara and Yayan Sopian - Geological Agency, Center for Geological Survey (Badan geologi, Pusat Survei Geologi, 2009). It has been prepared according to SNI 13-6010-1999 (see page 66 in the appendix).
Remarks The original map contains detailed descriptions about the susceptibility zones, the seismotectonic setting, and the geological and lithological conditions. Please refer to the large map accompanying this book and to the reduced copy in the appendix (page 67).
Methodology The earthquake hazard macrozonation map was produced according to SNI 13-6010-1999 (seismotectonic map) and SNI 1726-2002 (seismic hazard). The probabilistic peak ground acceleration analysis was done using the SEISRISK III program (earthquake.usgs.gov/research/hazmaps/publications/Legacy_Code/index.php) using the attenuation function of Fukusima and Tanaka (1990).
For a thorough account of the applied methodology, please refer to the field report 'Seismotektonik makrozonasi dan mikrozonasi potensi bencana gempa di Kabupaten Ende, Provinsi Nusa Tenggara Timur (Seismotectonic and potential earthquake hazard macrozonation of Kabupaten Ende and microzonation of Ende City, East Nusatenggara Province)' by A. Soehaimi, Santoso, Kamawan, Sukahar Eka A. Saputra, Yayan Sopian and R. Setianegara, Badan Geologi, Pusat Survei Geologi, 2009.
How to Read this Map The colored zones on the map represent five classes of earthquake hazard, as described in the table below. Each class comprises of a set of parameters describing geomorphologic, lithologic and neotectonic conditions that may make earthquakes and resulting damages more likely. Additionally, the zones correspond to maximum ground
motions that may be reached in the areas. All the data are jointly interpreted in form of a Maximum Modified Mercalli Intensity (MMI) that may be expected for a given region. Furthermore, the above parameters can be correlated to building code recommendations, such as the Uniform Building Code (1985). For the entire set of parameters please refer to the 'Seismotectonic and Potential Hazard Map' of Badan Geologi, which is also reproduced in the Appendix on page 67.
Earthquake hazard zone Maximum MMI Earthquake hazard
Very high earthquake hazard (VHEH)
IX Very heavy ground shaking, earthquake fault, landslide (rock and soil fall), ground rupture, liquefaction.
High earthquake hazard (HEH)
VIII Heavy ground shaking, earthquake fault, landslide (rock and soil fall, debris fall, and debris slump), ground rupture, liquefaction.
Intermediate earthquake hazard (IEH)
VI – VII Moderately ground shaking, ground rupture and earthquake fault,liquefaction.
Intermediate - low earthquake hazard (ILEH)
V Ground shaking, landslide (soil and rock fall) soil creep, debris slide.
Low earthquake hazard (LEH) IV Ground shaking, ground rupture, and landslide.
The Modified Mercalli scale is based on the effects felt during an earthquake (taken from the USGS: earthquake.usgs.gov/learning/topics/mercalli.php):
IV Felt indoors by many, outdoors by few during the day. At night, some awakened. Dishes, windows, doors disturbed; walls make cracking sound.
V Felt by nearly everyone; many awakened. Some dishes, windows broken. Unstable objects over-turned. Pendulum clocks may stop.
VI Felt by all, many frightened. Some heavy furniture moved; a few instances of fallen plaster. Damage slight.
VII Damage negligible in buildings of good design and construction; slight to moderate in well-built ordinary structures; considerable damage in poorly built or badly designed structures; some chimneys broken.
VIII Damage slight in specially designed structures; considerable damage in ordinary substantial buildings with partial collapse. Damage great in poorly built structures. Fall of chimneys, factory stacks, columns, monuments, walls. Heavy furniture overturned.
IX Damage considerable in specially designed structures; well-designed frame structures thrown out of plumb. Damage great in substantial buildings, with partial collapse. Buildings shifted off foundations.
The isolines on the map show ground motion values (PGA) that have a 10% probability of being exceeded during a time period of 100 years. In other words, there is a 90% chance that these ground motions will not be exceeded following an earthquake within 100 years. This is equivalent to saying that the return period of an earthquake causing more shaking than indicated by the isolines occurs once in 950 years of the probabilistic peak ground acceleration
Recommendations For detailed planning we recommend to consult the original reports and maps accompanying this book. At the time of writing it was not clear, which Indonesian institution will be authorized to produce seismic hazard maps. However, it is recommended that this task remains with Badan Geologi, who has long time experience in working out such maps at national, regional, and local levels.

27
Georisk Project – Kerja Sama Indonesia - Jerman
Geological Hazard and Risk Assessment Kabupaten Ende
Haz
ard
an
d S
usc
ep
tib
ilit
y D
ata

28
Geological Hazard and Risk Assessment Kabupaten Ende
Earthquake Hazard – Microzonation of Ende City
Map Contents The map shows a classification of the Ende City region into zones of very high, high, medium and low earthquake susceptibility. Additionally shown are the locations of the microtremor measurements on which this map is based.
Map Purpose with Respect to Disaster Risk Management This map provides important information for construction purposes. Each of the earthquake susceptibility zones requires different precaution measures in order to construct more earthquake resistant buildings.
Data Source and Availability This map has been prepared and analyzed by A. Soehaimi, Sukahar Eka, Robby Setianegara, Yayan Sopian - Badan Geologi, Pusat Survei Geologi (Geological Agency, Center for Geological Survey) in 2009. It is based on microtremor measurements conducted throughout the city in 2009.
Remarks The original maps discussed here contain additional information and are reproduced in the appendix on page 67ff.
Methodology Throughout the City of Ende, recordings at 45 microtremor measurement points give site characteristic information regarding the behavior of rocks and soils during the passage of a seismic shock wave. Two parameters were derived:
the factor of amplification of surface ground motions during passage of seismic waves, and
the predominant period of ground shaking of the rock/soil type.
For these two parameters individual maps were produced by interpolating between the monitoring locations (see reduced maps on the right hand side and on page 68 in the appendix). Commonly, high amplification factors indicate soft rock/soil conditions. Likewise, long predominant periods refer to soft and/or thicker layers of a given rock/soil.
The combination of high amplification factor and long predominant period result in an increased damage potential on the surface. Using an approach described by Yutaka Nakamura1, amplification factor and predominant period are therefore used to calculate a vulnerability index for each measurement site that helps to identify ground conditions likely to cause severe damage in case of an earthquake. These index values are spatially interpolated, classified and represented as four earthquake hazard zones on the map.
For a thorough account of the methodology applied, please refer to the field report 'Seismotektonik makrozonasi dan mikrozonasi potensi bencana gempa di Kabupaten Ende, Provinsi Nusa Tenggara Timur (Seismotectonic and potential earthquake hazard macrozonation of Kabupaten Ende and microzonation of Ende City, East Nusatenggara Province)' by A. Soehaimi, Santoso, Kamawan, Sukahar Eka A. Saputra, Yayan Sopian and R. Setianegara, Badan Geologi, Pusat Survei Geologi, 2009.
How to Read this Map The zones represent four classes describing the susceptibility to earthquake ground shaking. The higher the index, the higher the likelihood of earthquake triggered ground shaking and possible collapse of buildings.
Earthquake Hazard Susceptibility Zones Index value
Very High Susceptibility Zone > 24
High Susceptibility Zone 16 – 24
Medium Susceptibility Zone 8 – 16
Low Susceptibility Zone < 8
Recommendations For detailed planning we recommend to consult the original reports and maps accompanying this book. At the time of writing it was not clear, which Indonesian institution will be authorized to produce seismic hazard maps. However, it is recommended that this task remains with Badan Geologi, who has long time experience in working out such maps at national, regional, and local levels.
1 Yutaka Nakamura (2000): Clear Identification of Fundamental Idea of Nakamura’s Technique and Its Application. 12th World Conference of Earthquake Engineering, WCEE.

29
Georisk Project – Kerja Sama Indonesia ‐ Jerman
Geological Hazard and Risk Assessment Kabupaten Ende
Haza
rd and Susceptibility Data


31
Georisk Project – Kerja Sama Indonesia - Jerman
Geological Hazard and Risk Assessment Kabupaten Ende
Vu
lne
rab
ilit
y /
Cap
aci
ty
Vulnerability / Capacity Vulnerability expresses the likelihood of individuals, systems (such as communities or economies), structures or assets to be stressed by the impact of natural hazards. In combination with the hazard itself the vulnerability defines the risk: the higher the vulnerability the higher the risk.
The capacity describes the resources and capabilities of an individual, a community or a even of structures when being faced with hazards and risk. Increasing the (coping) capacity reduces the vulnerability and thus reduces the risk itself. Both, vulnerability and capacity can depend on the particular hazard at which one is looking. A building may not be vulnerable to flooding but may well be vulnerable to structural damage caused by earthquakes. Improving the capacity of a building through structural reinforcement may reduce its vulnerability to earthquake induced shaking but in a flood prone are this may not help to prevent damages caused by inundation.
In another example, educating pupils about the threats posed by volcano eruptions increases their capacity to judge their living environment and to behave correctly during a volcano crisis. This makes them less vulnerable of being affected by volcano hazards. However, a different set of knowledge is needed to understand the threats posed by tsunamis. This means, measures to be taken to reduce the vulnerability vary depending on the type of hazard.
The matter of vulnerability and capacity is complex and there is no single answer as to how an appropriate assessment should be made. Measuring vulnerability and capacity strongly depends on the scale at which an assessment is carried out. Tools appropriate for assessing the vulnerability and capacity of a single building are certainly not appropriate for the assessment of an entire community or region. On a regional scale, the focus lies on providing figures describing the general vulnerability or capacity- figures that need to be comparable and reproducible over the entire region.
The maps presented in this book were created with the regional perspective in mind. Following the ideas of keeping assessments simple at first and of applying ready-to-use or easily accessible data, emphasis is put on analyzing the general vulnerability of the population, the infrastructure and economic potential. It is shown how settlement areas, roads and other infrastructure areas are distributed throughout NTT, without diving into the complexity of looking at how vulnerabilities may differ for example with the level of education or with gender. Note that no further processing is needed to prepare vulnerability of infrastructure - the map on page 14f already shows all relevant information.
Capacity is exemplified using a relatively simple measure that depicts the availability of community health facilities.

32
Geological Hazard and Risk Assessment Kabupaten Ende
Modified population density
Map Contents The maps shows the modified population density, defined as the population divided by the settlement area.
Map Purpose with Respect to Disaster Risk Management The purpose of calculating a modified value for the population density is to better estimate the people potentially affected by hazards (see page 40ff for more details). It can thus be seen as a direct measure for the community’s vulnerability.
Data Source and Availability The data sources used here are:
land use map (see section on land use, page 12),
the population statistics (page 18),
and the administrative boundaries of Kecamatans (see page 10).
Remarks The methodology is sensitive to precise area size estimates for settlement areas. If the land use area in the land use or land cover map is too small compared to the real situation, density figures derived will be largely overestimated. The probability of introducing errors is higher in rural areas when settlement area sizes are underestimated.
Please refer to the maps on pages 40ff for a better understanding of how these data can be utilized to determine exposure and risk.
Methodology The estimate shown in this map is based on a GIS based intersection of the aforementioned input data. Through this intersecting process a combined geospatial dataset is being created holding all the attributes of all input data.
The sketch below illustrates the calculation method in more detail. From the numbers given we can estimate that both communities have a “regular” population density of 1 667 (5 000 people / 3 km²). The modified population density in Community A, however, is lower because the area on which people actually live is larger (40% compared to 10%). Thus, for Community A we get a modified population density of 16 667 (5 000 people / 0.3 km²) and for B this value is only 4 167 (5 000 people / 1.2 km²). All these numbers can easily be derived by a GIS and a database system.
Sketch illustrating the concept of 'modified population density'. The grey area represents the areal extent of Community A, the yellow area the extent of Community B. Actual settlement areas of these communities are shown in red.
How to Read this Map In the GIS database the calculation of the modified density figures is done on a Kecamatan basis. However, in the map to the right only the areas designated as settlement in the land use map are shown for better understanding and illustration of the methodology.
It can be seen from this map, that population density figures in the urban areas remain high (compared to the map on page 18) but it also can be seen, that there can be high population density figures even in rural areas.
The two figures above illustrate population density in two ways for the Desas of Kecamatan Ndona Timur. On the left, population density interpolated for the entire desa is shown (i.e. population divided by the total area). Population density based on the settlement area is shown on the right. Due to the rural nature of this Kabupaten the figures are much higher when estimated for settlement areas only.
This modified population density will later be used for estimating the number of people living in particular hazard zones (see page 40ff).
Recommendations A good base map reflecting settlement land cover realistically is important. The smaller a study area, the more important this recommendation becomes.

33
Georisk Project – Kerja Sama Indonesia - Jerman
Geological Hazard and Risk Assessment Kabupaten Ende
Vu
lne
rab
ilit
y /
Cap
aci
ty

34
Geological Hazard and Risk Assessment Kabupaten Ende
Health facilities
Map Contents The map shows the presence or non-presence of (PusKesMas) or hospitals, per Desa.
Map Purpose with Respect to Disaster Risk Management To cope with natural disasters requires, among many other things, a good health system, particularly during and after a crisis. But also in terms of preparedness the data are an important indicator for the capacity of a region or a community to deal with potential disasters. The maps representation of public access to health facilities allows decision makers to easily identify where capacity improvements in the health sector are necessary. Increasing the capacity in these Desas would in turn reduce their vulnerability of being ill-prepared in case of a crisis due to a lack of public health services.
Data Source and Availability Data for this map was taken from the Potensi Desa Data set of 2005 (PoDes, Village Potential Data, also refer to page 10) prepared by the National Statistics Agency BPS (Badan Pusat Statistic). Similar data are published by the BPS offices of the Provinces and Kabupatens. PoDes data can be purchased for each province from the BPS office in Jakarta. The costs are in the range of one million IDR per province.
Remarks The most recent dataset for PoDes was published just before finalizing this booklet and comprises data for
2008. However, it could not be included in this book for analysis due to time constraints.
PoDes data are collected by representatives from BPS based on direct interviews with Desa/Kelurahan-Officials. This secures coverage, reliability and comparability of the data collection process and of the data itself.
In addition to the health facility data the PoDes data set provides some three hundred indicators on variables collected on Desa level. The indicators include variables on the topics geographic location, population and labor,housing situation and environment, natural hazard anticipation and impact, health and education, social and cultural facilities, recreation facilities, communication and information, agriculture, economy, administration.
A further survey providing valuable data that can be used as capacity indicators is SUSENAS (national socio-economic survey / survei sosial economi nasional).
There might be discrepancies between this map and the infrastructure map on page 14. This can be due to the fact, that BAKOSURTANAL data is older and that there is now distinction between hospitals and community health centers.
An additional map showing the health system capacity on Kecamatan level has also been produced and included here for information (right).
Methodology The map was derived by analyzing the PoDes data for the presence of a community health center (PusKesMas) or Hospital for each Desa. Since most Desas only have either one or no health center at all, no count is given here.
It should be taken into account that the accuracy of the health system capacity map depends on the number of community health centers listed in the PoDes dataset.
How to Read this Map Orange color indicates the presence of a community health center, light brown the absence. The data
Recommendations The indicator map shown here is a relatively simple one. The aforementioned data sources (e.g. PoDes) provide
more possibilities to derive additional indicator maps. The choice of a set of indicators depends on the particular hazard one addresses.
Other general capacity proxy indicators could include the number of doctors available (health capacity), the distribution and size of schools (educational capacity), the number of earthquake, tsunami, volcano eruption drills conducted (awareness), or the number of shelters available (preparedness).
The '… Dalam Angka' books published by BPS give figures on the Human Development Index - HDI (Indeks Pembangunan Manusia - IPM) and distribution of poverty (penduduk miskin) with respect to various poverty lines. Such figures can be interpreted with respect to the capacity of the population to cope with potential disaster. In risk assessment, particular attention has to be given to those regions of increased hazard that coincide with areas having a high percentage of poor inhabitants.
Map showing the health system capacity on Kecamatan level: Greener colors indicate that fewer people have to share one community health center whereas red colors may indicate poor coverage with health facilities. Where more people have to share one health center, there is an increased likelihood of worse quality of treatment and longer travels necessary to reach the center. From the map it can be seen that there is a wide range regarding the way the population is being provided with health services.

35
Georisk Project – Kerja Sama Indonesia - Jerman
Geological Hazard and Risk Assessment Kabupaten Ende
Vu
lne
rab
ilit
y /
Cap
aci
ty

37
Georisk Project – Kerja Sama Indonesia - Jerman
Geological Hazard and Risk Assessment Kabupaten Ende
Exp
osu
re /
Ris
k
Exposure / Risk Hazard exposure and risk maps form the synthesis of the information collected and compiled in the previous chapters in this book. No 'new' data is added. In a way, risk maps are simply a different form of representing the compiled data to answer a set of specific questions such as:
Who or what is exposed to natural hazards and to what extent?
How does the exposure to natural hazards in one region compare to the conditions in other regions?
Which regions/areas do have to be prioritized for reducing disaster risks?
How would the level of risk change, if one could influence the input parameters (e.g. by reducing vulnerability)?
A multitude of possibilities exist, to bring together basic data, hazard data (H), vulnerability (V) and capacity (C) information in order to produce a statement regarding the risk (R) that the population, the society or its economy is exposed to. Approaches of various levels of complexity exist. In one way or the other they focus on the often cited equation R = (H*V)/C. All of these approaches have one thing in common: assessing the risk is a subjective venture that will always need someone to decide, what level of risk a society is willing to accept. And to answer this question, one needs to clarify beforehand the (development) goals that this society pursues. In this respect, risk assessment involves socio-economic and political perspectives and input and cannot be tackled by purely technical standard operation procedures. In general, the following risk assessment approaches can be distinguished:
1. Exposure Map: Natural hazards and the vulnerability parameter to be assessed (e.g. population, infra structure, economy) are represented as overlays. No further analysis is involved. The map may focus on a single hazard or depict several hazards (multi hazard). An example for the latter is shown on page 38f.
2. Risk Map1: The elements at risk are 'counted' in the hazard zones. The risk exposure is represented with a color scheme, typically ranging from red (high exposure/risk) to yellow (low exposure/risk). Having a provincial perspective in mind, the risk information is condensed at Desa level. To keep the risk analysis simple at first, this guidebook focuses at examples of this type. Maps on pages 40 to 48 show the exposure of the population and infrastructure to single hazards. An example for multi-hazard analysis can be found on page 48.
The analyses shown on the following pages are the first step towards more detailed risk analyses that also incorporate the temporal distribution of hazards (i.e. the probability of occurrence) and the related costs of events. The Georisk Project’s database on natural hazard events and other data collections (e.g. by BNPB) could be a basis for this envisaged improvement.
The maps rely heavily on GIS and database technology. This concept allows the creation of new maps relatively fast by simply replacing input data. Such an approach provides important perspectives, particularly for planning purposes: It can be used in order to develop scenarios based on changed population figures or to test “what-if”-scenarios as a basis for cost-benefit comparisons (e.g. the costs for mitigation to reduce future disaster impact vs. the money saved that is otherwise spent for reconstruction and rehabilitation after a disaster happened).
1 Strictly speaking, all maps presented here are exposure maps as they are based on susceptibility data instead of hazard data that would also include the temporal probability of occurrence of events. See page 21.

38
Geological Hazard and Risk Assessment Kabupaten Ende
Multi-Hazard
Map Contents This map shows the synthesis of the three hazard maps (pages 22ff) used for the analyses presented in this book. It contains additional data showing the designated settlement land use. For information purposes also low-lying areas (up to 5 m a.s.l.) are shown. The latter may be influenced by tidal flooding and/or tsunami.
Map Purpose with Respect to Disaster Risk Management Overlaying hazard and elements at risk is a first and easy method to evaluate the degree of exposure of studied elements to natural hazards. By intersecting hazards and settlement areas, as done here, the exposure of the population to hazards becomes evident. Regions, where more than one hazard threatens the wellbeing of people and their socio-economy can be easily identified.
Data Source and Availability This map is based on administrative data (page 10), land use data (page 12) as well as the individual hazard maps (pages 22ff).
Remarks The original map at a scale of 1:100 000 contains more details than can be shown here in this reduced copy.
Methodology This map is the result of a geometric intersection of the input maps mentioned before using GIS. In such representations, particularly for multi-hazard maps, usually not all hazard zones are depicted. The focus lies on the zones of high and moderate hazard in order to provide a clearer representation and a clearer message. The regions of high hazard are the once that deserve most attention for mitigation efforts.
How to Read this Map The map shows the intersection of three hazard maps: landslide, volcanic ash fall and seismic hazard. From each of these maps, the highest level has been chosen, except for the volcanic hazard map.
As an example a small section of the intersection of the landslide, the earthquake, and the volcanic hazard map is shown here. The selected polygons represent a settlement area of a particular Kecamatan inside a high landslide susceptibility zone and in a second order distance zone around the Kelimutu volcano. The data layers shown on this map also contain additional data for administration and population density.
Id_desa: 5311070038: BPS-Code of the Desa Wolotai Tengah in Kecamatan Detusoko
KODE_UNSUIR: 1224 BAKOSURTANAL code for settlement
Id_eq 1 VHEHS Zonation (intensity: VIII-IX)
Id_landlide: 5 debris flow hazard
area_m²: 3429 aea in m²
popdens_corrected: 4809 modified population density
popdens_uncorrected: 89 regular population density
Recommendations The intersection of data by GIS techniques is an essential step in exposure and risk analysis. Since the
correctness of settlement areas has great influence on the subsequent results, it is recommended to look for the most recent data sources, whenever possible.
Hazard exposure maps, whether they are based on a single hazard or multi-hazards, provide indispensable information for professionals to judge, which threats a region and its elements at risk are facing and what counter measures could be taken to reduce the risks. They should therefore always accompany risk maps of the kind presented on the following pages.

3939
Georisk Project – Kerja Sama Indonesia ‐ Jerman
Geological Hazard and Risk Assessment Kabupaten Ende
Exp
osu
re / Risk

40
Geological Hazard and Risk Assessment Kabupaten Ende
Population Exposure to Landslides
Map Contents The map shows the estimated number of people living in high landslide hazard (susceptibility) zones. These numbers are shown on Kecamatan level and thus do no longer show the residential areas or any other land use.
Map Purpose with Respect to Disaster Risk Management The risk exposure of the population is considered the most important analysis result of a disaster risk assessment.
Data Source and Availability This map has been compiled by intersecting the landslide hazard map (on page 22f) and administrative areas (on page 10f). This intersection has been subsequently combined with the population figures described on page 18 and 32).
Remarks The methodology described here is also applicable for future land use planning or population projections. It is thus very valuable for comparisons or if-then scenarios.
Methodology To estimate the number of people exposed in a particular hazard zone on Kecamatan level, two “ingredients” are required:
the modified population density (i.e. the population density projected to settlement areas only, see page 32)
the area size of a community’s settlement area (in our case a Kecamatan) that is lying inside a particular hazard zone
Additionally, the assumption is made that the population lives on the areas designated as residential and/or settlement area.
This illustrative sketch is taken from page 32 from the chapter on Modified population density and shows an overlay of a hazard zonation map.
By multiplying the modified density (in people/km²) with the area size within a particular zone (in km²) the result will be the number of people in this zone. Let us have a look at the two communities again. In community A, the complete designated settlement area is in the red zone, i.e. 0.3 km², thus the complete population of 5000 is at risk, in Community B the size of the area in the red zone is about 50% of the settlement area (= 0.6 km², exact figures are given by the GIS), giving an estimate of 0.6 km² * 4167 p/km² = 2505 people in the high risk zone.
How to Read this Map The intention of this map is to give a quick overview for decision makers on a Province or Kabupaten level about the risk exposure of the population in high landslide hazard or susceptibility zones. See also page 63 for tabular results.
Recommendations In regions where more detailed maps are available, it is recommended to do this analysis with these maps. Please consult Badan Geologi for the availability of individual sheets.

4141
Georisk Project – Kerja Sama Indonesia - Jerman
Geological Hazard and Risk Assessment Kabupaten Ende
Exp
osu
re /
Ris
k

42
Geological Hazard and Risk Assessment Kabupaten Ende
Population Exposure to Volcanic Hazards
Map Contents The map shows the estimated number of people living in volcanic hazard zones. These numbers are shown on Kecamatan level and thus do no longer show the residential areas or any other land use.
Map Purpose with Respect to Disaster Risk Management The risk exposure of the population is considered the most important analysis result of a disaster risk assessment.
Data Source and Availability This map has been compiled by intersecting the volcanic hazard map (on page 24f) and the administrative areas (on page 10f). This intersection has been subsequently combined with the population figures described on page 18 and page 32).
Remarks The methodology described here is also applicable for future land use planning or population projections. It is thus very valuable for comparisons or if-then scenarios.
Mt. Rokatenda, which is included in the hazard map on page 24, has not been analyzed here. It belongs to Kabupaten Sikka.
Methodology To estimate the number of people who are exposed in a particular hazard zone for each Desa, two numeric figures are required:
the modified population density of the Kecamatan, i.e. the population density based merely on the settlement area (see page 32),
the size of each Kecamatan’s settlement area that is lying inside the particular hazard zone.
The inherent assumption made here, is that the population lives in the areas designated in the land use data set as residential and/or settlement areas. The modified population density (in people/km²) needs to be multiplied with the area size of the settlement area that overlaps within a particular hazard zone (in km²). The result is the number of people living in this zone, i.e. the number of people exposed to the particular hazard (for more detailed information refer to the explanations regarding population exposure to landslides on page 40.)
How to Read this Map The intention of this map is to give a quick overview for decision makers on Kabupaten level about the risk exposure of the population in volcanic hazard zones. Unlike the map for the landslide exposure, this map indicates the exposure in all ash fall hazard zones (not only the zone of highest risk). Detailed analysis has shown that the inner zone usually does not overlap with settlement areas. Therefore, these inner zones are shown with a small white circle beneath the volcano symbol. The respective diameters are listed in the table on page 24.
The classification used here runs from yellow (few people exposed) to red (many people exposed). The class width of the yellow-to-red division has been chosen to best visually represent the variability of values obtained in the assessment. Results of this assessment are listed in absolute numbers in the appendix tables on page 63.
Recommendations Ash fall hazard creates certain types of risks to buildings and people. Heavy ash fall in combination with
prolonged rainfall may lead to the collapse of roofs due to accumulated weight. The map can therefore be used for more detailed capacity monitoring: in regions of increased risk it should be checked, whether roofs are constructed according to recommended building codes, and whether sufficient shelter facilities for people exist to protect them from direct impact of hot ashes during an eruption.
Risks from volcano eruptions are typically concentrated locally. This suggests, forming inter-local cooperations to jointly mitigate the risks. 'Forum Merapi' constitutes a good example (www.merapi.or.id).
The level of acceptable risk expressed in this map is reflected in the class width of the population exposure color code. This color code needs to be adjusted so that the maps and assessments reflect the level of acceptable risk agreed upon by society and in accordance with the development goals of the regions government.

4343
Georisk Project – Kerja Sama Indonesia - Jerman
Geological Hazard and Risk Assessment Kabupaten Ende
Exp
osu
re /
Ris
k

44
Geological Hazard and Risk Assessment Kabupaten Ende
Population Exposure to Earthquake Hazards
Map Contents The map shows the estimated number of people living in zones of very high and high seismic hazards. These numbers are shown on Desa level and thus do no longer reveal the residential areas or any other land use.
Map Purpose with Respect to Disaster Risk Management This form of representing population exposure to seismic hazards allows for easy comparison of the level of risk on Desa level throughout NTT. Regions at higher risk and areas where administrative entities could join forces to mitigate risks become evident.
Data Source and Availability This map has been compiled by intersecting the earthquake hazard map (on page 25f) and the administrative areas (on page 10f). This intersection has been subsequently combined with the population figures described on page 18 and 32).
Remarks Since the seismic hazard zones used for this analysis (page 25f) show the uncorrected peak ground acceleration values, i.e. without lithological corrections, the figures would change slightly if these corrections would be made. However, the general analysis result would not look completely different.
Methodology To estimate the number of people that are exposed in a particular hazard zone for each Kecamatan, two information are required:
the modified population density of the Kecamatan, i.e. the population density based on merely on the settlement area (see page 32);
the size of the Kecamatan settlement area that is lying inside the particular hazard zone.
The inherent assumption made here, is that the population lives in the areas designated in the land use data set as residential and/or settlement areas. The modified population density (in people/km²) needs to be multiplied with the area size of the settlement area that overlaps within a particular hazard zone (in km²). The result is the number of people living in this zone, i.e. the number of people exposed to the particular hazard (for more detailed information refer to the explanations regarding population exposure to landslides on page 40.)
How to Read this Map The intention of this map is to give a quick overview for decision makers on Province or Kabupaten level about the risk exposure of the population in zones of very high seismic hazard. The classification used here runs from yellow (few people exposed) to red (many people exposed). The class width of the yellow-to-red division has been chosen to best visually represent the variability of values obtained in the assessment. The results of this assessment are listed in absolute numbers in the appendix tables on page 63.
Recommendations Earthquake/seismic hazard and risk are directly linked to the resistance of structures and buildings to
earthquake shaking and the potential of the subsurface for liquefaction. Detailed building ground suitability analysis cannot be done a large scale, covering entire provinces. The information obtained from seismic hazard and risk maps can be used to identify areas where in-depth monitoring of building ground condition needs to be done for relevant construction projects. Building codes give standards for earthquake resistant structures based on the peak ground accelerations to be expected.
The level of acceptable risk expressed in this map is reflected in the class width of the population exposure color code. This color code needs to be adjusted so that the maps and assessments reflect the level of acceptable risk agreed upon by society and in accordance with the development goals of the regions government.
Please consult the detailed macro and micro seismic hazard maps provided by Badan Geologi for more detail.

4545
Georisk Project – Kerja Sama Indonesia - Jerman
Geological Hazard and Risk Assessment Kabupaten Ende
Exp
osu
re /
Ris
k

46
Geological Hazard and Risk Assessment Kabupaten Ende
Combined Population Exposure
Map Contents The map shows the estimated number of people living in high landslide hazard (susceptibility) zones and/or in a volcanic hazard (ash fall) zone and/or in the very high seismic hazard zone. These numbers are shown on Kecamatan level and thus do no longer show the residential areas or any other land use.
Map Purpose with Respect to Disaster Risk Management This form of representing population exposure to multi-hazards allows for easy comparison of the level of risk on Desa level throughout Kabupaten Ende. Regions at higher risk and areas where administrative entities could join forces to mitigate risks become evident.
Data Source and Availability This map is based on a combination of the data used for the single hazard risk maps presented on pages 40 to 44.
Remarks Currently this map does not consider any temporal aspect of the hazards it is based upon. That means the temporal probability or the recurrence information was not considered.
Methodology The figures upon which the map is based are derived by adding up the numbers of exposed people in the previous maps:
Population exposure to landslides (page 40f),
Population exposure to ash fall hazards (page 42f),
Population exposure to very high seismic hazards (page 44f).
No weighting scheme for the three hazards has been used here. That means, every hazard contributes in the same way to the resulting risk. This makes sense as long as no temporal probability for the occurrence of the individual hazards has been introduced.
If the landslide, volcanic ash fall and seismic hazard zones overlap then people are exposed to more than one hazard. In these overlapping regions individuals will therefore be counted twice or three times. It can thus happen that the count can be higher than the actual number of residents. Because of that, the values of people exposed can be considered a relative measure of population risk and this type of risk map as the simplest form of 'indexed' risk map.
How to Read this Map The intention of this map is to give a quick overview for decision makers on Kecamatan or Desa level about the risk exposure of the population to a combination of hazards. The classification used here runs from yellow (few people exposed) to red (many people exposed). The class width of the yellow-to-red division has been chosen to best visually represent the variability of values obtained in the assessment. Note, that the values of people exposed represent a relative measure of risk, as individuals exposed to more than one hazard in their settlement area will counted twice or three times, accordingly. The results for the single hazard exposure are listed in absolute numbers in the appendix tables on page 63.
Recommendations This map synthesizes the information of three different risk exposure maps. It should be used in combination with these maps for the individual hazards. However, it provides also on a stand-alone basis a quick and comprehensive overview of the risk exposure situation of the population, which could be an important help, when making decisions in spatial planning.

4747
Georisk Project – Kerja Sama Indonesia - Jerman
Geological Hazard and Risk Assessment Kabupaten Ende
Exp
osu
re /
Ris
k

48
Geological Hazard and Risk Assessment Kabupaten Ende
Infrastructure Risk Exposure
Map Contents The map shows for each Desa the sum of road kilometers that are exposed to high landslide or debris flow hazards.
Map Purpose with Respect to Disaster Risk Management As explained in the section on Infrastructure on page 14 knowledge about the locations of critical infrastructure as well as the amount of individual objects or their economic values at risk are important factors. Both maps (the small one on this page and the larger one on the opposite page) provide information about how roads are exposed to landslide hazards. While the first one indicates the exposure by coloring the road sections with the color of the landslide hazard zone (compare to map on page 22), the large map on the opposite page summarizes the data on Desa level. The latter allows comparing regions more easily.
Data Source and Availability The road data presented in this map was chosen from the BAKOSURTANAL topographic data (see page 14). Administrative boundaries were taken from BPS (see page 10), landslide data were taken from CVGHM (see page 22).
Remarks Altogether there are 1993 km of roads present in the high and moderate landslide hazard zone. Further improvement could be achieved by qualifying the road data with more detailed attributes, such as the width of a road, or by specifying cost for construction.
This photograph illustrates quite well how exposure of infrastructure objects in hazard zones creates risks. In addition to the direct damage repair costs also the indirect economic impact from the road disruption contributes to the risk.
Methodology The map was derived by intersecting the following data layers:
road network,
administrative boundaries,
landslide susceptibility.
How to Read this Map The reduced map below shows the base data from which the large map was derived. It shows as an example a small section of a road running through a high landslide hazard zone.
The pop-up dialog shows the values of the datasets used for the intersection process. The total length of the section (given by the GIS and indicated in yellow) is 3916 m and has a designated road type 102, which is a collector road. The landslide code 1 indicates that this section is running through a high landslide hazard zone.
Recommendations Similar risk assessment can be done with additional infrastructure elements, such as power transmission lines, pipelines, railroad lines, etc.
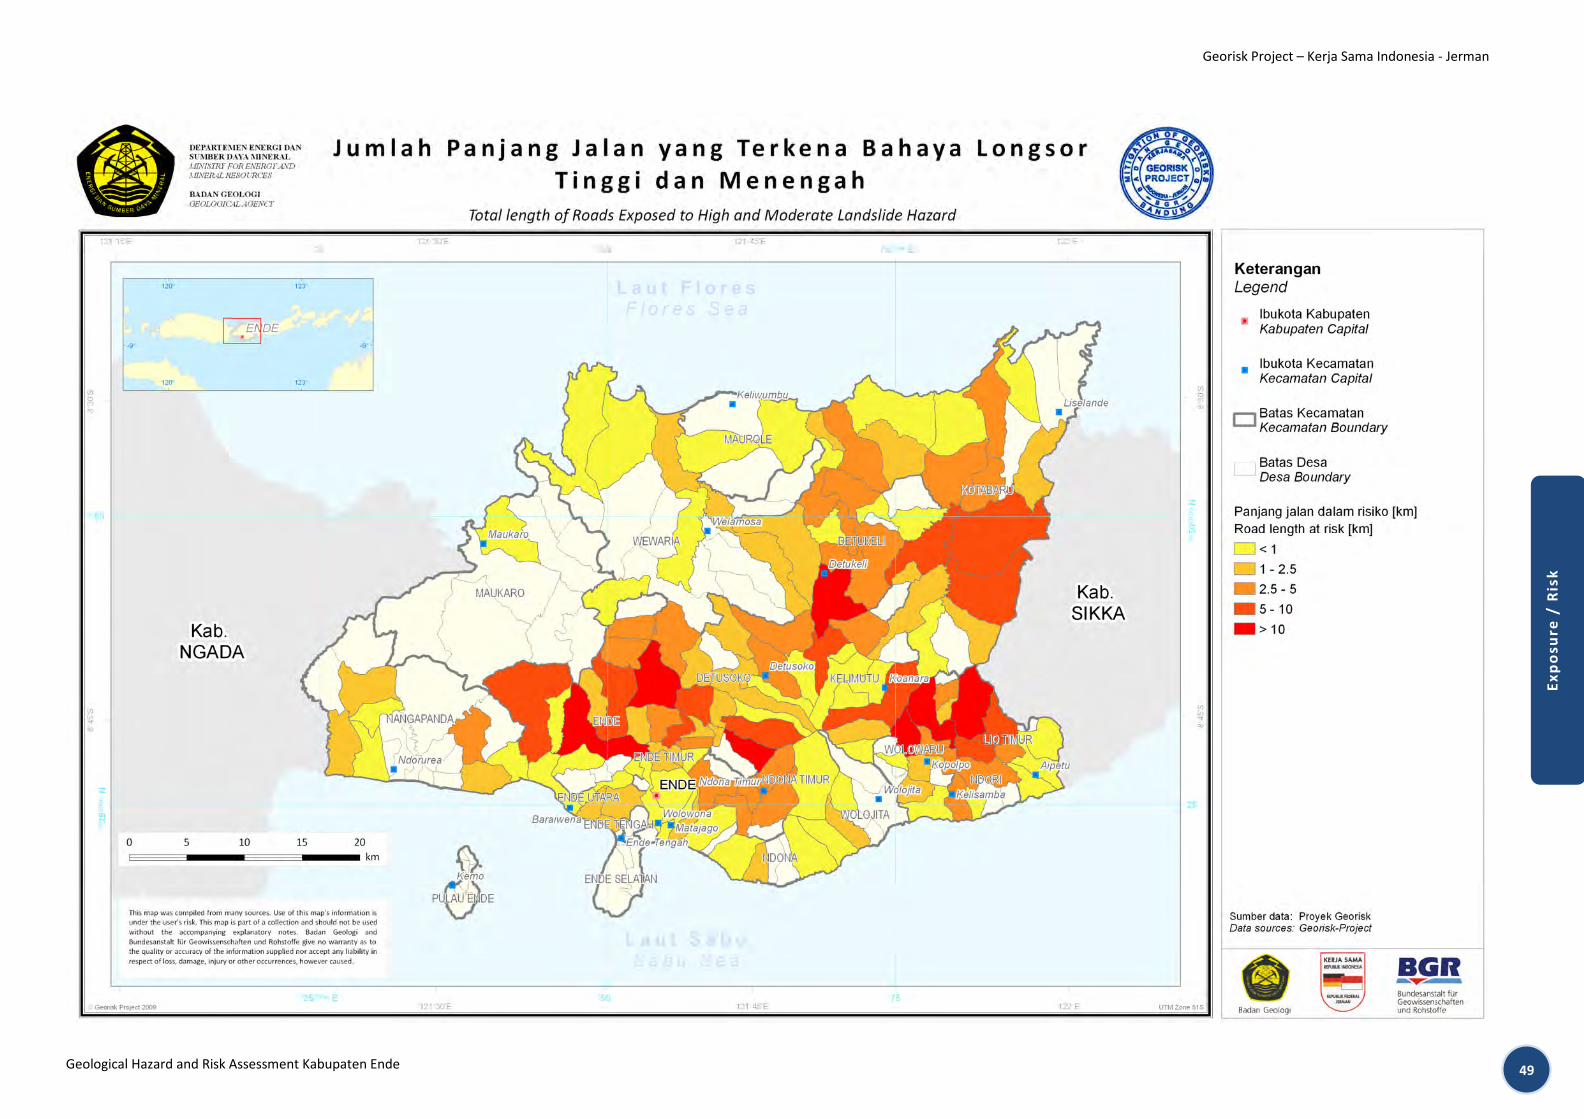
4949
Georisk Project – Kerja Sama Indonesia - Jerman
Geological Hazard and Risk Assessment Kabupaten Ende
Exp
osu
re /
Ris
k

5151
Georisk Project – Kerja Sama Indonesia - Jerman
Geological Hazard and Risk Assessment Kabupaten Ende
Spat
ial
Pla
nn
ing
Re
com
me
nd
atio
ns
Spatial Planning Recommendations
Risk-sensitive Development Planning
A main purpose for the elaboration of a standardized risk mapping procedure is its importance for risk-sensitive development planning. The newly enacted Law on Spatial Planning (UU 26, 2007) accentuates the need and significance for spatial planning to assure a safe, productive and sustainable environment. According to this law, in Indonesia, given the geographically exposition to numerous natural hazards, disaster mitigation is an indispensable tool to increase the security and comfort of the living space.
National and local development, land use, and disaster risks can be regarded as inter-dependent factors that need to be considered as a whole in order to promote the best and safest options for development. Development planning that takes into account disaster risk reduction will hence decrease potential future losses to physical assets, environmental capital, institutional assets, and human life but requires standardized planning processes.
This booklet focuses on the first step, assessing natural hazards (here: geological hazards) as well as the community’s vulnerability and capacity to withstand a disaster. Consequently, local governments need to analyse the impact of these risk variables on their spatial planning. Findings then need to be integrated and balanced with other parameters of land use. This balancing process is part of the strategic spatial planning as mentioned in Law No. 24. On one hand this represents a big challenge for local governments, but on the other hand helps them to fulfil their responsibility to safeguard and promote the general welfare of their citizens by e.g. promoting urban growth without generating new risks. Risk-sensitive land use planning moreover helps in identifying and mitigating the root causes of disaster risks embedded in existing land development practices (e.g. deforestation, unapproved settlements in flood zones). Furthermore, risk-sensitive planning shows the focal points of action to reduce vulnerable conditions for people and places, in turn strengthening the trust in local governments.
This chapter gives an overview about the measures the local government, its institutions and the civil society can take in order to minimize the impact of landslides associated with heavy rainfall, volcano eruptions, and earthquakes. Generally all measures have to be carried out long before the disaster happens. This also holds true for emergency measures, which will only yield success if practiced before.
Generally, for all types of disasters the best mitigation strategy is simply not to build settlements and infrastructure in the hazard areas. Unfortunately, there are already many settlements within those areas. For these, other alternative strategies are proposed, which will make the lives of the people safer.
The areas endangered by landslides, debris flows and flashfloods are indicated in the Landslide Susceptibility Map by the Georisk Project (page 22). The volcanic hazards around Mt. Iya and Kelimutu are displayed in the Volcanic Hazard Map on page 24, and also in more detail on the large format maps accompanying this booklet. Generally, the whole Kabupaten is prone to earthquakes (see page 26). Therefore all houses and especially critical infrastructure should be constructed following the general guidelines for earthquake resistant buildings, particularly in the high and very high hazard zone. For the city of Ende recommendations based on the microzonation map (page 28) are given.
Major parts of this section are based on the Guidelines for Geohazard Mitigation in the Kabupaten Ende, NTT (published in 2004 by the predecessor project and authored by Sugalang, Igan S. Sutawidjaja, Engkon Kertapati and Andreas Manhart).

52
Geological Hazard and Risk Assessment Kabupaten Ende
Recommendations for Coping with Landslide Hazard
General Considerations Generally, all mountainous parts of Kabupaten Ende might experience landslides.
Especially steep slopes and the areas just below these slopes should strictly be avoided for the construction of new houses and infrastructure. In the landslide hazard map these areas are indicated with red color.
Other mountainous, but less steep areas might also experience landslides. In the landslide hazard map these zones are indicated with yellow color.
A rough estimation if a slope is prone to landslides is its steepness: If it is steeper than 20°, the slope itself and the area below it should not be used for settlements. However, there is no general or strict rule and local geological conditions should always be considered.
Slopes in general are more prone to landslides then ridges and should therefore be avoided for settlements. The figures below give an example where a village should not (right) and should be (left) located in a mountainous environment.
Dense forests significantly reduces (but not eliminates) the probability of landslides. Therefore all villages, which are already located in an area endangered by landslides should protect the forests and natural vegetation on the slopes above their village.
Sometimes a slope develops well visible cracks in the days and weeks before it starts sliding. The cracks in the soil are normally located in the area where the landslide later sets off. Villagers should therefore frequently check the slopes above their villages. If they find such cracks, the people should fill them with clay to prevent further water infiltration and abandon the houses below the slope. This is especially important during the rainy season because most landslides are triggered by heavy rainfall.
Mitigation Measures To prevent landslide disasters, particularly in the area of moderate and high susceptibility, several alternative mitigation measures are possible, such as:
Avoidance of development planning in regions that have moderate and high susceptibility to landslides and in as well as close to the area of debris flow hazard and surrounding. Buildings should be located away from steep slopes, streams and rivers, intermittent-stream channels and the mouths of mountain channel.
If development of settlements needs to be done in the above mentioned areas, seek recommendation from experts for evaluating landslide hazards or designing corrective techniques to reduce the probability of landslides. If possible carry out a detailed investigation on the slope stability.
Replant damaged soil or bare land as soon as possible since soil loss can increase the probability of debris flows and other mass movements.
If possible, avoid adding additional water on slopes by gardening or irrigation.
Consider relocation of individual buildings or settlements, if other options are not available.
Remove blockages of streams if possible, they can increase the hazard for debris flows, should removal be impossible, put people living downstream on alert and evacuate during heavy rainfall.
During heavy rainstorms evacuate people
living close to steep stream beds, gorges or channels to neighboring houses

5353
Georisk Project – Kerja Sama Indonesia - Jerman
Geological Hazard and Risk Assessment Kabupaten Ende
Spat
ial
Pla
nn
ing
Re
com
me
nd
atio
ns
Special attention is recommended for the following Desas:
� Kecamatan. DETUKELI DETUKELI, DETUMBEWA, KANGANARA, KEBESANI, MAUROLE SELATAN, NDIKOSAPU, NGGESA, NGGESA BIRI, NIDA, UNGGU, WATUNGGERE, WOLOMUKU
� Kecamatan. DETUSOKO DETUSOKO BARAT, DILE, GOLULADA, KEL. DETUSOKO, NDITO, NGGUMBELAKA, NIOWULA, NUAONE, RANDORIA, RANGA, RATERORU, ROA, SAGA, SIPIJENA, TURUNALU, WOLOFEO, WOLOGAI, WOLOGAI TENGAH, WOLOGAI TIMUR, WOLOMASI, WOLOTOLO, WOLOTOLO TENGAH
� Kecamatan ENDE EMBURIA, JAMOKEASA, MBOTUTENDA, NAKURAMBA, RABURIA, RANDOTONDA, RIARAJA, RUKURAMBA, TINABANI, TOMBERABU I, TOMBERABU II, TONGGOPAPA, UZURAMBA, WOLOGAI, WOLOKARO
� Kecamatan ENDE SELATAN KEL. TETANDARA
� Kecamatan ENDE TIMUR KEL. MAUTAPAGA, KEL. REWARANGGA, NDUNGGA, TIWUTEWA
� Kecamatan ENDE UTARA GHEOGHOMA, KEL. ROWORENA, WATUSIPI
� Kecamatan KELIMUTU KOANARA, KURU, NDUARIA, NUAMURI, NUAMURI BARAT, WOLOARA
� Kecamatan KOTABARU: DETUARA, HANGALANDE, KOTABARU, LOBONIKI, NDONDO, NIOPANDA, TANALANGI, TIWUSORA, TOU, TOU BARAT, TOU TIMUR
� Kecamatan LIO TIMUR DETUPERA, FATAMARI, HOBATUWA, KEL. WATUNESO, LIABAKE, WOLOLELE A, WOLOSAMBI
� Kecamatan MAUKARO NABE
� Kecamatan MAUROLE AEWORA, DETUWULU, KELIWUMBU, MAUROLE, MAUSAMBI, OTOGEDU, RANOKOLO, WATUKAMBA
� Kecamatan NANGAPANDA
� RAPORENDU, RAPOWAWO, TENDAREA, TIWE REA
� Kecamatan NDONA KEL. LOKOBOKO, KEL. ONELAKO, MANULONDO, NANGANESA, NGALUPOLO, NGALUROGA, PUUTUGA, REKA, WOLOKOTA, WOLOTOPO
� Kecamatan NDONA TIMUR DOMULAKA, KURULIMBU, KURULIMBU SELATAN, NGGUWA, ROGA, SOKORIA
� Kecamatan NDORI KELISAMBA, MAUBASA TIMUR, WONDA
� Kecamatan WEWARIA AEMURI, DETUBELA, FATAATU TIMUR, MAUTENDA, MAUTENDA BARAT, MBOTULAKA, MUKUSAKI, NUANGENDA, NUMBA, WEWARIA
� Kecamatan WOLOJITA NGGELA, NUAMULI, WIWIPEMO
� Kecamatan WOLOWARU BOKASAPE, LIKANAKA, LISEDETU, LISELOWOBORA, MBULILOO, MBULIWARALAU, MBULIWARALAU UTARA, NAKAMBARA, NUALISE, WOLOSOKO
Notice Please see the table on page 54 for details on roads exposed to high landslide hazard.

54
Geological Hazard and Risk Assessment Kabupaten Ende
Roads exposed to high landslide hazard
Kecamatan Desa Desa-Code Total length of roads [km]
DETUKELI DETUKELI 5311062004 4.82 DETUKELI 5311062004 0.07 DETUMBEWA 5311062002 2.68 KANGANARA 5311062006 4.49 KANGANARA 5311062006 0.83 KEBESANI 5311062005 14.43 KEBESANI 5311062005 0.84 MAUROLE SELATAN 5311062010 2.91 NDIKOSAPU 5311062007 6.3 NDIKOSAPU 5311062007 0.61 NGGESA 5311062003 0.64 NGGESA BIRI 5311062012 2.65 UNGGU 5311062011 0.03 WATUNGGERE 5311062009 0.69 WOLOMUKU 5311062001 2.26DETUSOKO DETUSOKO BARAT 5311070035 0.29 DILE 5311070024 1.4 DILE 5311070024 4.21 GOLULADA 5311070022 1.15 KEL. DETUSOKO 5311070036 3.29 NDITO 5311070031 6.59 NDITO 5311070031 1.92 NGGUMBELAKA 5311070040 1.98 NGGUMBELAKA 5311070040 0.11 NIOWULA 5311070032 0.5 NIOWULA 5311070032 0.89 NUAONE 5311070019 3.74 RANDORIA 5311070028 0.69 RANGA 5311070020 2.29 RATERORU 5311070023 7.17 RATERORU 5311070023 3.22 ROA 5311070025 1.8 SAGA 5311070030 10.21 SIPIJENA 5311070034 1.05 TURUNALU 5311070041 4.01 WOLOFEO 5311070033 1.14 WOLOFEO 5311070033 3.73 WOLOGAI 5311070037 0.57 WOLOGAI TENGAH 5311070038 8.59 WOLOGAI TENGAH 5311070038 3.61 WOLOGAI TIMUR 5311070039 0.16 WOLOTOLO 5311070026 1.82 WOLOTOLO 5311070026 3.17 WOLOTOLO TENGAH 5311070027 3.02ENDE JAMOKEASA 5311020012 7.13 MBOTUTENDA 5311020011 1.82 NAKURAMBA 5311020018 9.35 NDETUNDORA I 5311020004 0.5 RABURIA 5311020006 1.43 RABURIA 5311020006 0.59 RANDOTONDA 5311020005 0.94 RIARAJA 5311020015 0.49 RUKURAMBA 5311020017 0.57 TINABANI 5311020009 13.92 TOMBERABU I 5311020007 4.4 TOMBERABU I 5311020007 1.25 TOMBERABU II 5311020008 5.08 TOMBERABU II 5311020008 5.01 TONGGOPAPA 5311020020 3.29 WOLOGAI 5311020010 3.01
Kecamatan Desa Desa-Code Total length of roads [km]
WOLOKARO 5311020016 10.89ENDE TIMUR KEDEBODU 5311031003 0.01 KEL. REWARANGGA 5311031002 0.99 KEL. REWARANGGA 5311031002 10.62 NDUNGGA 5311031004 1.08 NDUNGGA 5311031004 1.54 TIWUTEWA 5311031005 1.46 TIWUTEWA 5311031005 1.28ENDE UTARA BOROKANDA 5311033005 0.3 GHEOGHOMA 5311033004 1.71 KEL. KOTARATU 5311033002 1.3 KEL. ROWORENA 5311033003 2.26 WATUSIPI 5311033006 0.39KELIMUTU KOANARA 5311053003 6.09 KOANARA 5311053003 2.09 KURU 5311053007 1.18 KURU 5311053007 0.15 NDUARIA 5311053006 0.35 NUAMURI 5311053004 0.84 NUAMURI 5311053004 0.07 NUAMURI BARAT 5311053005 0.26 PEMO 5311053001 0.43 WOLOARA 5311053002 2.28 WOLOARA 5311053002 0.02KOTABARU DETUARA 5311061003 2.49 HANGALANDE 5311061005 7.83 HANGALANDE 5311061005 0.8 KOTABARU 5311061011 0.01 LOBONIKI 5311061009 0.85 LOBONIKI 5311061009 0.53 NDONDO 5311061010 3.35 NDONDO 5311061010 0.21 NIOPANDA 5311061008 2.85 NIOPANDA 5311061008 1.06 TANALANGI 5311061001 0.82 TIWUSORA 5311061004 6.48 TIWUSORA 5311061004 1.27 TOU 5311061007 3.21 TOU 5311061007 0.45 TOU BARAT 5311061013 0 TOU TIMUR 5311061006 1.28LIO TIMUR DETUPERA 5311052006 8.58 DETUPERA 5311052006 3.94 FATAMARI 5311052008 0.48 HOBATUWA 5311052001 0.6 KEL. WATUNESO 5311052002 0.14 KEL. WATUNESO 5311052002 1.43 LIABAKE 5311052004 9.13 WOLOLELE A 5311052005 12.82 WOLOLELE A 5311052005 1.92 WOLOSAMBI 5311052003 3.07 WOLOSAMBI 5311052003 3.19MAUKARO MAGEKAPA 5311012005 0.45MAUROLE AEWORA 5311060022 0.7 AEWORA 5311060022 2.8 DETUWULU 5311060024 1.91 DETUWULU 5311060024 2.37 KELIWUMBU 5311060018 0.01 MAUROLE 5311060020 1.94 MAUSAMBI 5311060019 0.54
Kecamatan Desa Desa-Code Total length of roads [km]
OTOGEDU 5311060023 0.76RANOKOLO 5311060017 0.7WATUKAMBA 5311060021 2.83
NANGAPANDA BHERAMARI 5311010007 0.09ONDOREA 5311010001 0.33ONDOREA BARAT 5311010012 1.81RAPORENDU 5311010005 1.54RAPOWAWO 5311010006 3.09TENDAREA 5311010009 1.26TIWE REA 5311010013 0.03
NDONA KEL. LOKOBOKO 5311040015 0.13KEL. LOKOBOKO 5311040015 0.82KEL. ONELAKO 5311040002 0.83MANULONDO 5311040003 2.04NANGANESA 5311040001 0.53NGALUPOLO 5311040006 0.55NGALUROGA 5311040009 0.97NILA 5311040008 0.33PUUTUGA 5311040014 2.62REKA 5311040017 1.19WOLOTOPO 5311040004 0.37
NDONA TIMUR DOMULAKA 5311041003 3.05KURULIMBU 5311041001 3.36NGGUWA 5311041006 3.9ROGA 5311041004 0.89ROGA 5311041004 1.1SOKORIA 5311041002 4.37
NDORI KELISAMBA 5311054005 3.5SERANDORI 5311054001 0.1WONDA 5311054004 4.79
WEWARIA AEMURI 5311071005 0.2DETUBELA 5311071014 0FATAATU 5311071009 1.04MAUTENDA 5311071008 0.38MBOTULAKA 5311071001 0.14MUKUSAKI 5311071004 0.21NUMBA 5311071015 2.59WEWARIA 5311071007 1.56
WOLOJITA NUAMULI 5311051001 2.46NUAMULI 5311051001 1.99WIWIPEMO 5311051006 0.37
WOLOWARU BOKASAPE 5311050017 2.07BOKASAPE 5311050017 3.27LIKANAKA 5311050036 2.26LIKANAKA 5311050036 0.68LISEDETU 5311050026 4.61LISEDETU 5311050026 0.78LISELOWOBORA 5311050033 14.33LISELOWOBORA 5311050033 0.77MBULILOO 5311050024 0.07MBULIWARALAU 5311050006 0.78MBULIWARALAU UTARA 5311050005 2.36NAKAMBARA 5311050037 3.24NAKAMBARA 5311050037 0.4NUALISE 5311050027 13.44NUALISE 5311050027 0.7WOLOSOKO 5311050015 3.38

5555
Georisk Project – Kerja Sama Indonesia ‐ Jerman
Geological Hazard and Risk Assessment Kabupaten Ende
Spatial Planning Reco
mmendations
Recommendations for Coping with Volcanic Hazards
Mount Iya Mount Iya is a highly active volcano only few kilometers from Ende City. Its last eruption in 1969 showed that ash fall and lahars are severe hazards that not only threaten the flanks of the mountain, but also can have impacts in places more than 10 km away from the crater. Although the Iya Peninsula and Ende Island were most seriously affected by ash fall, also the city of Ende itself could be exposed to a similar event in the future. Research done by the Center for Volcanology and Geological Hazard Mitigation (CVGHM, 2004 and 2008) showed that a future eruption might cause a giant landslide into the sea, causing a tsunami, which would hit the nearby coastal areas. The following paragraphs are describing mitigation measures that should be undertaken long before an eruption as well as an evacuation plan, which gives guidance for the case of an eruption. Also these evacuation measures should be discussed and trained long before Mount Iya shows signs of activity.
General Considerations In the case of a big eruption of Mount Iya as in 1969, the volcano would release an eruption column of ash, gas and smoke of several kilometers in height. This would make it impossible for any airplane to fly in or out of Ende.
• Pyroclastic flows and rock avalanches would be released from the crater and surge down the flanks of the volcano. Fortunately, there is currently no settlement or infrastructure in their way and they would fall into the sea or the valleys between Mount Iya and Mount Roja without causing damages. The village of Rate is an exception, as it would be destroyed by pyroclastic flows.
• Rocks will be ejected from the crater during explosions. Stones as big as tennis‐balls or even bigger will be thrown as far as Kampungbaru. Smaller rocks will fall into the southern parts of Ende City. Although most of this material is not much bigger than the size of a table tennis ball, it might have the power to crash through thin roofs. Roofs built with palm leaves or straw would be set on fire, which could spread quickly in densely populated areas. The people who live in the inner ring circle should be evacuated immediately to the designated safe area.
• Huge amounts of ash would fall in the downwind direction, covering the area with half a meter or even more of ash.
• Wind from the south would be the worst case: All of Ende City and the mountains north of the city would be covered by thick layers of ash. This ash would not only collapse many houses, but would surge down the mountains as lahars once mixed with rainwater. This would threaten the region even weeks or months after the eruption until most ash is eroded. Depending on the ash distribution lahars could surge through all big and small streambeds and channels descending from ash covered mountains.
• In any case, even when the wind comes from the north, there would be some ash fall in Ende City. Only a few millimeters of ash will contaminate the city's water supply system and cause respiratory problems for the citizen. Also road transport will be difficult because volcanic ash makes roads very slippery.
• During an eruption a huge portion of Mount Iya may slide into the sea. This could create big tsunami waves that would travel as far as Ende Island, Ende City and the coasts east and west of Ende. The waves, which may arrive in one single event or distributed over days will smash many buildings close to shore in these places. Also both ports, the fuel depot of Pertamina and the airport of Ende City are likely to be destroyed by these waves.
• The situation in Ende City will turn dramatic if the eruption lasts several days: Because air traffic will be impossible and road and sea access difficult, the population will face severe shortages of water, food and medical treatment.
• Only Rate village (Kelurahan Paupanda, Kecamatan Ende Selatan) is threatened by pyroclastic flows during an eruption. Therefore in Rate and all areas south of Rate, no further development should take place.
• All parts of Ende City are likely to be subject to heavy ash fall that could make houses collapse if the ash accumulates on roofs. It was calculated that only 8 to 10 cm of ash cover are too heavy for most buildings if it gets mixed with rainwater. One solution is to construct roofs so steep, that the ash cannot remain on it. This is the case for roofs that are at least 45º steep. Additionally they should be made from corrugated iron, a material that especially facilitates sliding and that is not inflammable. Also attention should be drawn to the strength of the beams supporting the roof:
A roof design for houses in ash fall hazard zones: 1. The roof should be inclined 45° or steeper.
2. The supporting beams should be spaced close together and diagonal beams give additional strength.
3. The roof shoud be constructed of corrugated iron, which is not inflammable and facilitates the sliding of the volcanic ash.
4. One extra pillar in the centre additionally supports the roof.
Recommendations
• The coastal villages east and west of Ende City, the villages on Ende Island and the coastal areas in the eastern and western of Ende City are endangered by tsunami that can follow an eruption of Mount Iya. The people living in these areas should be informed about their risk. They should also be made aware, that they would eventually have to evacuate the area in case of an eruption. The areas this socialization should be carried out are:
o the western parts of Ende City:
the area between Jalan Pasar and the beach
the area between Jalan Soekarno and the beach
Kelurahan Kotaratu (the houses close to the beach)
o the eastern parts of Ende City:
the area between Jalan Gatot Subroto and the beach (Ipi, Koponggena, Mautapage Bawah, Mbuu)
Arubara (the houses close to the beach)
o Ende Island:
all coastal settlements
45º

56
Geological Hazard and Risk Assessment Kabupaten Ende
� To theWest of Ende City: Mbomba (Desa Gheoghoma, Kec. Ende Utara)
Maumunda (Desa Gheoghoma, Kec. Ende Utara)
Baraiwena (Desa Borokanda, Kec. Ende Utara)
Puumbara (Desa Borokanda, Kec. Ende Utara)
Raba (Desa Rukuramba, Kec. Ende)
Nangakeo (Desa Bheramari, Kec. Nangapanda)
Numba (Desa Raporendu, Kec. Nangapanda)
Maunggora (Desa Nggorea, Kec. Nangapanda)
Anaraja (Desa Nggorea, Kec. Nangapanda)
In the coastal area threatened by such a volcanic tsunami some crucial infrastructure like ports, the fuel depots and the airport are located. Especially the fuel depots should be protected with massive walls from the sea.
Houses (schools, public buildings, campsites) in safe areas have to be identified before crises so they can be used as evacuation destinations. It has to be considered, that in a major volcanic crisis, several thousand people have to be relocated for about two weeks or longer.
Kelurahan Onekore, Wolowona (both in Kecamatan Ende Selatan) and Wolonio (Kelurahan Roworena, Kecamatan Ende Selatan) are such safe areas and can function as shelter destination for the population of Ende City.
Relocated citizens would also need water, food and medical treatment. This supply has to be guaranteed especially because the normal water supply systems may soon be contaminated with ash. Also road, ship and air transport may be severely hindered and cannot be counted on.
All people living in a danger zone should regularly be informed about the hazard they are exposed to. This also includes information on building recommendations (steep roofs), the need to store sufficient drinking water at the beginning of a crisis and where eventually to evacuate to.
Mount Kelimutu Mount Kelimutu is a volcano located 18 km northeast of Ende City and is famous for its three colored crater lakes. Although no big eruptions were experienced in historic times, there is a chance that Kelimutu will erupt and release pyroclastic flows, ash and rocks. This would endanger several villages on its flanks. Kelimutu is also a threat to tourists who leave the marked trails in the summit area and try to climb down to one of the lakes. There, poisonous gases repeatedly claimed lives.
General Considerations In order to avoid deaths by poisonous gases in the summit area, the entry to the summit should be prohibited during nighttime. Also tourists should be informed not to leave the official paths in the summit area.
Recommendations In case of an eruption of Mount Kelimutu, the following villages may be exposed to pyroclastic flows:
� Nuabaru, Manukako, Pemo (Desa Wolowara, Kec. Wolowaru)
� Waturaka (Desa Koanara, Kec. Kelimutu)
� Toba (Desa Roga, Kec. Ndona Timur).
In order to minimize the disaster risks, no further development should be carried out in these areas close to the summit.
The area within a radius of 5 km from the summit might be subject to expect ejected rocks bigger as 6 cm in size. This includes the following settlements:
� Wolokelo, Niraola, Nuanggao, Detubu, Wolonio, Ndoko, Tedhonaka (Desa Nduaria, Kec. Kelimutu)
� Kolorongo, Waturaka, Saoria, Kombobewa, Watugana, Liasembe, Koahara, Wulu (Desa Koanara, Kec. Kelimutu)
� Nuabaru, Manukako, Kopobhoke, Mboti, Sigo, Kopoone, Pemo, Woloki, Woloara, Nuaguta, Nuaone (Desa Woloara, Kec. Kelimutu)
� Wololahu, Binara, Woloojo, Holokamba, Watubewo, Koposod, Woloboa (Desa Mbuliloo, Kec. Wolowaru)
� Liakamba (Desa Tenda, Kec. Wolojita)
� Mbuja (Desa Wolojita, Kec. Wolojita)
� Toba, Kururawa (Desa Roga, Kec. Ndona Timur)
In order to prevent damages from volcanic ash and glowing rocks, roofs should be constructed from corrugated iron with a minimal steepness of 45º and sufficient strength A proposal for these types of roofs is given in the chapter on Mount Iya (see above).
After heavy ash fall especially the following settlements are endangered by lahars:
� Kombobawa (Desa Koanara, Kec. Kelimutu)
� Woloara (Desa Woloara, Kec. Kelimutu)
� Koruoka, Serusue,Wolonawa (Desa Bokapse, Kec. Wolowaru)
� Aipadak, Wolobeto, Jopu, Wolopuse, Ranggase (Desa Jopu, Kec. Wolowaru)
� Ana (Desa Mbuliwaralau, Kec. Wolowaru)
Lahars may also surge down the southern flanks of Mount Kelimutu using the riverbed of Ae Bari River. There settlements would not be directly affected, but all bridges destroyed.
In all these places, no further development should take place inside or close to the stream valleys. Bridges should be constructed wide and high enough in order to leave enough room for lahars to pass underneath.
Houses (schools, public buildings, campsites) in safe areas have to be identified before crises so they can be used as evacuation destinations. It has to be considered, that in a major volcanic crises, several thousand people have to be relocated for about two weeks or longer. Desa Bokasape (Kec. Wolowaru), Desa Detusoko (Kec. Detusoko), Desa Nuamuri (Kec. Klimutu), Desa Sokoria (Kec. Ndona Timur), and Desa Nggela (Kec. Wolojita) are such safe areas and can function as evacuation destination for the population from the flanks of Kelimutu volcano. But especially Nuamuri, Koden (Sokoria) and Nggela should not be overcharged since their isolated location makes hinder the supply of food, medicine and water. If the situation in the area worsens and the supply of medicine, food and water gets too difficult, Ende and Maumere should serve as evacuation destinations.
Notice Please see also the table on page 57 for critical infrastructure potentially exposed to ash fall.

5757
Georisk Project – Kerja Sama Indonesia - Jerman
Geological Hazard and Risk Assessment Kabupaten Ende
Spat
ial
Pla
nn
ing
Re
com
me
nd
atio
ns
Infrastruktur exposed to ash fall Critical Infrastructure exposed to ash fall in case of an eruption. Data for infrastructure locations were taken from BAKOSURTANAL (see page 14)
Kecamatan Desa-Code
Desa Name Infrastructure- code Kode infra-struktur
Jenis gedung Building type Amount
ENDE SELATAN
5311030001 KEL. PAUPANDA
1405 Rumah Ibadat, tdk terklasifikasi House of worship, unclassified 1
1615 Sekolah School 1
5311030002 KEL. RUKUNLIMA
1615 Sekolah School 1
5311030004 KEL. TETANDARA
1375 Gedung Pemerintahan, Desa Government office, village 1
1405 Rumah Ibadat, tdk terklasifikasi House of worship, unclassified 1
1415 Rumah Ibadat, Masjid House of worship, Mosque 1
1615 Sekolah School 1
1715 Pom Bensin Gas station 6
ENDE TIMUR
5311031001 KEL. MAUTAPAGA
1615 Sekolah School 2
ENDE TENGAH
5311032002 KEL. ONEKORE
1425 Rumah Ibadat, Gereja House of worship, Church 1
5311032003 KEL. KELIMUTU
1615 Sekolah School 1
NDONA TIMUR
5311041002 SOKORIA
1365 Gedung Pemerintahan, Kelurahan
Government office, Kelurahan 1
1425 Rumah Ibadat, Gereja House of worship, Church 1
1615 Sekolah School 1
5311041003 DOMULAKA
1615 Sekolah School 1
1625 Rumah Sakit Hospital 1
5311041004 ROGA
1425 Rumah Ibadat, Gereja House of worship, Church 2
1615 Sekolah School 3
WOLOWARU
5311050017 BOKASAPE
1415 Rumah Ibadat, Masjid House of worship, Mosque 1
1425 Rumah Ibadat, Gereja House of worship, Church 1
1615 Sekolah School 3
5311050019 JOPU
1425 Rumah Ibadat, Gereja House of worship, Church 1
1615 Sekolah School 1
5311050025 RINDIWAWO
1415 Rumah Ibadat, Masjid House of worship, Mosque 2
1425 Rumah Ibadat, Gereja House of worship, Church 2
1615 Sekolah School 1

58
Geological Hazard and Risk Assessment Kabupaten Ende
Kecamatan Desa-Code
Desa Name Infrastructure- code Kode infra-struktur
Jenis gedung Building type Amount
5311050026 LISEDETU
1615 Sekolah School 2
5311050027 NUALISE
1425 Rumah Ibadat, Gereja House of worship, Church 1
WOLOJITA
5311051001 NUAMULI
1425 Rumah Ibadat, Gereja House of worship, Church 1
1615 Sekolah School 1
1625 Rumah Sakit Hospital 1
5311051003 PORA
1415 Rumah Ibadat, Masjid House of worship, Mosque 1
1615 Sekolah School 1
5311051004 KEL. WOLOJITA
1425 Rumah Ibadat, Gereja House of worship, Church 3
1615 Sekolah School 2
5311051006 WIWIPEMO
1615 Sekolah School 1
KELIMUTU
5311053002 WOLOARA
1425 Rumah Ibadat, Gereja House of worship, Church 2
1425 Rumah Ibadat, Gereja House of worship, Church 2
1615 Sekolah School 6
1635 Kantor Polisi Police office 4
5311053004 NUAMURI
1625 Rumah Sakit Hospital 1
5311053005 NUAMURI BARAT
1615 Sekolah School 2
5311053006 NDUARIA
1615 Sekolah School 1
DETUSOKO
5311070033 WOLOFEO
2625 Jembatan Kaki Footbridge 2
5311070037 WOLOGAI
1425 Rumah Ibadat, Gereja House of worship, Church 1
1615 Sekolah School 1
5311070038 WOLOGAI TENGAH
1425 Rumah Ibadat, Gereja House of worship, Church 1
1625 Rumah Sakit Hospital 1
5311070039 WOLOGAI TIMUR
1615 Sekolah School 1

5959
Georisk Project – Kerja Sama Indonesia - Jerman
Geological Hazard and Risk Assessment Kabupaten Ende
Spat
ial
Pla
nn
ing
Re
com
me
nd
atio
ns
Recommendations for Coping with Earthquake Hazards
The recommendations of earthquake hazard in Kabupaten Ende are divided into regional recommendation and local recommendation.
Regional level Regional recommendations are based on the earthquake macrozonation that is assessed for the whole Kabupaten Ende(see pages 26 and 44). The following recommendations are mainly given to the local authorities:
1. Developing Regional Plan (RTRW): building construction should be based on the earthquake hazard parameters, such as the maximum peak ground acceleration and intensity (see return period and basic acceleration table below), as well as on the local geological condition, such as lithological properties and slope stability (see Correction factor for rock / soil table).
Return Period
T (Year)
Ac (g)
Ende Detosuko Ropa Wolowaru Watumeso Marole Detukeli Nanggapanda Tomali Makaro Kotabaru
50 0.167 0.111 0.11 0.96 0.097 0.187 0.16 0.243 0.096 0.96 0.402
100 0.173 0.12 0.119 0.117 0.121 0.195 0.169 0.249 0.122 0.117 0.406
250 0.188 0.176 0.166 0.178 0.175 0.207 0.18 0.258 0.179 0.179 0.412
Return period and basic acceleration
Type of Rock / Soil Standard Of
Predominant Period Ts (second)
Local Predominant period Ts (second)
Correction Factor (v)
Rock Ts < 0.25 Ts < 0.20 0.80
Diluvium 0.25 < Ts < 0.50 0.20 < Ts 0.50 1.00
Alluvium 0.50 < Ts 0.75 0.50 < Ts <.70 1.10
Soft Alluvium Ts > 0.75 0.70 < Ts < 1.40 1.20
Correction factor for rock / soil
2. Before building important infrastructure, such as power plants, airports, hospitals, and important offices, evaluation of geotechnical and engineering geology aspects should be done first, especially in the intermediate until low earthquake hazard zone.
3. Additional mitigation measures should be planned for the main road that connects Ende City and Kecamatan Watuneso. This important road is partly situated in a high landside hazard zone, that could be affected by earthquake triggered landslides and rockfalls.
4. Building earthquake resistant houses in all Kecamatans of Kabupaten Ende is strongly recommended; nevertheless priorities should be put for areas within very high until intermediate earthquake hazard zones.
5. Keep away from the steep slopes with high landslide potential within the intermediate until low earthquake hazard zone, especially near the Kelimutu Volcano Complex.
6. Develop tsunami hazard buffer zones, especially in the north coast and selected south coast areas.
7. Development of areas is recommended within the intermediate and low earthquake hazard zones. In other earthquake hazard zones additional structural mitigation countermeasures are required, such as engineering technology applications.
8. Development of a Disaster Risk Reduction Program, including community awareness raising, capacity building, and disaster management training for local authorities.
The following table summarized the Kecamatans within the earthquake hazard zones, for the Desa level see the map on page 44f. Zonation Kecamatan Description of the earthquake hazard
Very high earthquake hazard
Ende, Ndona, Detusoko, Wewaria, Maurole, Detukeli, Kotabaru Very high ground shaking, earthquake fault, landslide (rock and soil fall), ground rupture, liquefaction
High earthquake hazard
Nanggapanda, Moukaro, Ende, Ende Utara Heavy ground shaking, landslides (rock and soil fall, debris fall, and debris slump), ground rupture, liquefaction
Intermediate earthquake hazard susceptibility
Moukaro, Ende, Detusoko, Wewaria, Maurole, Detukeli, Kotabaru Moderately ground shaking, ground rupture, and earthquake fault liquefaction
Intermediate – Low earthquake hazard
Ende Utara, Ende Timur, Ende Tengah, Ende Selatan, Ndona, Ndona Timur, Wolowaru, Wolojita, Lio Timur, Ndori, Detusoko, Kelimutu,, Wewaria, Maurole, Detukeli, Kotabaru
Ground shaking, landslides (soil and rock fall), soil creep, debris slide
Low earthquake hazard
Nanggapanda, Moukaro, Ende, Ende Utara, Ende Timur, Ende Tengah, Ende Selatan, Ndona, Ndona Timur, Wolowaru, Wolojita, Detusoko, Kelimutu,, Wewaria, Maurole, Detukeli, Kotabaru
Ground shaking, ground rupture and landslides
Kecamatan within earthquake hazard susceptibility zonation
Local level Local Recommendation is based on the earthquake microzonation that is assessed for Ende city only. The following recommendations are mainly for the local authorities of the city of Ende:
1. Development Spatial Plan for Ende City, i.e. buildings should be based on the main earthquake hazard parameters, such as predominant period, amplification, and susceptibility index, the higher the values, the higher the earthquake risk index will be. All of that will incorporate earthquake risk mitigation for the city.
2. The calculated peak ground acceleration and maximum intensity of the earthquake hazard susceptibility zone can be used as the basic parameter in designing earthquake resistant buildings (see example below).
3. Especially for those areas, having high earthquake hazard, such as Onewatu, Onekore, and Titandara, earthquake resistant buildings must be constructed, obeying the appropriate building codes. Nevertheless, for other regions it is suggested to implement the same countermeasures.
4. Before developing important infrastructures and critical facilities in high earthquake hazard regions, evaluation of geotechnical and engineering geological aspects should be done first.
5. Government Regulation 26/2008 on spatial planning stipulates the formulation of zoning regulations. The microzonation map (see page 28f) should be used as an input to this process. The figure below serves as an example for how these regulations could be substantiated by requiring specific construction provisions.
6. Additional to the Disaster risk Reduction program mentioned before, preparation of contingency planning is strongly advised.


6161
Georisk Project – Kerja Sama Indonesia - Jerman
Geological Hazard and Risk Assessment Kabupaten Ende
Ap
pe
nd
ix
Appendix


6363
Georisk Project – Kerja Sama Indonesia - Jerman
Geological Hazard and Risk Assessment Kabupaten Ende
Ap
pe
nd
ix
Results Population Exposure
This table summarizes – on desa level – the risk exposure of the population to the hazards dealt with in this booklet (see also the maps on page 40ff). Desas with population exposed to two hazards are shown in orange color, desas with population exposed to three hazards are shown in red color. No weighting has been apllied.
Kecamatan Desa Desa code high landslide
hazard volcanic ash fall hazard
very high and high earthquake hazard
total
DETUKELI DETUKELI 5311062004 44 0 458 502
DETUMBEWA 5311062002 60 0 0 60
KANGANARA 5311062006 77 0 618 695
KEBESANI 5311062005 75 0 556 631
MAUROLE SELATAN 5311062010 30 0 6 36
NDIKOSAPU 5311062007 153 0 493 646
NGGESA 5311062003 17 0 0 17
NGGESA BIRI 5311062012 43 0 183 226
NIDA 5311062008 4 0 553 557
UNGGU 5311062011 8 0 387 395
WATUNGGERE 5311062009 47 0 676 723
WATUNGGERE MARILONGA 5311062013 0 0 320 320
WOLOMUKU 5311062001 25 0 0 25
DETUSOKO DETUSOKO BARAT 5311070035 15 51 445 511
DILE 5311070024 360 0 524 884
GOLULADA 5311070022 13 0 0 13
KEL. DETUSOKO 5311070036 403 297 149 849
MUKUREKU 5311070042 0 0 509 509
NDITO 5311070031 35 78 661 774
NGGUMBELAKA 5311070040 2 0 360 362
NIOWULA 5311070032 16 135 465 616
NUAONE 5311070019 207 0 382 589
RANDORIA 5311070028 16 0 0 16
RANGA 5311070020 34 0 73 107
RATERORU 5311070023 213 0 504 717
ROA 5311070025 137 0 473 610
SAGA 5311070030 16 18 866 900
SIPIJENA 5311070034 65 0 526 591
TURUNALU 5311070041 2 14 264 280
WOLOFEO 5311070033 79 159 567 805
WOLOGAI 5311070037 216 402 35 653
WOLOGAI TENGAH 5311070038 436 499 145 1080
WOLOGAI TIMUR 5311070039 13 420 0 433
WOLOMAGE 5311070021 0 0 356 356
WOLOMASI 5311070029 2 2 461 465
WOLOTOLO 5311070026 356 0 469 825
WOLOTOLO TENGAH 5311070027 76 0 8 84
ENDE EMBURIA 5311020014 9 0 159 168
JAMOKEASA 5311020012 225 0 1010 1235
MBOTUTENDA 5311020011 6 0 1235 1241
NAKURAMBA 5311020018 224 0 1164 1388
RABURIA 5311020006 128 0 33 161
Kecamatan Desa Desa code high landslide hazard
volcanic ash fall hazard
very high and high earthquake hazard
total
ENDE RANDOTONDA 5311020005 10 0 0 10
RIARAJA 5311020015 8 0 778 786
RUKURAMBA 5311020017 16 0 1178 1194
TINABANI 5311020009 350 0 106 456
TOMBERABU I 5311020007 584 0 408 992
TOMBERABU II 5311020008 148 0 467 615
TONGGOPAPA 5311020020 76 0 0 76
UZURAMBA 5311020021 174 0 0 174
WOLOGAI 5311020010 147 0 0 147
WOLOKARO 5311020016 311 0 510 821
ENDE SELATAN KEL. MBONGAWANI 5311030003 0 2629 0 2629
KEL. PAUPANDA 5311030001 0 4977 0 4977
KEL. RUKUNLIMA 5311030002 0 5195 0 5195
KEL. TETANDARA 5311030004 4 7264 0 7268
ENDE TENGAH KEL. KELIMUTU 5311032003 0 4618 0 4618
KEL. ONEKORE 5311032002 0 6162 0 6162
KEL. PAUPIRE 5311032004 0 504 0 504
KEL. POTULANDO 5311032001 0 3556 0 3556
ENDE TIMUR KEL. MAUTAPAGA 5311031001 3 5920 0 5923
KEL. REWARANGGA 5311031002 3994 0 0 3994
NDUNGGA 5311031004 232 0 0 232
TIWUTEWA 5311031005 42 0 0 42
ENDE UTARA BOROKANDA 5311033005 0 0 850 850
GHEOGHOMA 5311033004 31 0 0 31
KEL. KOTARAJA 5311033001 0 3241 0 3241
KEL. KOTARATU 5311033002 0 3466 0 3466
KEL. ROWORENA 5311033003 273 0 0 273
WATUSIPI 5311033006 77 0 0 77
KELIMUTU KOANARA 5311053003 360 1623 0 1983
KURU 5311053007 5 45 472 522
NDENGGARONGGE 5311053008 0 14 414 428
NDUARIA 5311053006 6 1205 0 1211
NUAMURI 5311053004 74 1018 0 1092
NUAMURI BARAT 5311053005 24 1074 0 1098
PEMO 5311053001 0 525 0 525
WOLOARA 5311053002 8 1358 0 1366
KOTABARU DETUARA 5311061003 6 0 333 339
HANGALANDE 5311061005 60 0 736 796
KOTABARU 5311061011 38 0 1359 1397
LISELANDE 5311061012 0 0 528 528
LOBONIKI 5311061009 64 0 1472 1536
NDONDO 5311061010 45 0 987 1032

64
Geological Hazard and Risk Assessment Kabupaten Ende
Kecamatan Desa Desa code high landslide hazard
volcanic ash fall hazard
very high and high earthquake hazard
total
KOTABARU NIOPANDA 5311061008 28 0 417 445
RANGALAKA 5311061014 0 0 409 409
TANALANGI 5311061001 2 0 671 673
TANIWODA 5311061002 0 0 611 611
TIWUSORA 5311061004 21 0 398 419
TOU 5311061007 62 0 907 969
TOU BARAT 5311061013 7 0 288 295
TOU TIMUR 5311061006 4 0 1356 1360
LIO TIMUR DETUPERA 5311052006 412 0 0 412
FATAMARI 5311052008 60 0 0 60
HOBATUWA 5311052001 105 0 0 105
KEL. WATUNESO 5311052002 155 0 0 155
LIABAKE 5311052004 429 0 0 429
WOLOLELE A 5311052005 212 0 0 212
WOLOSAMBI 5311052003 837 0 0 837
MAUKARO NABE 5311012006 1 0 0 1
MAUROLE AEWORA 5311060022 118 0 5 123
DETUWULU 5311060024 163 0 0 163
KELIWUMBU 5311060018 2 0 0 2
MAUROLE 5311060020 64 0 0 64
MAUSAMBI 5311060019 64 0 0 64
OTOGEDU 5311060023 48 0 0 48
RANOKOLO 5311060017 2 0 0 2
WATUKAMBA 5311060021 129 0 0 129
NANGAPANDA BHERAMARI 5311010007 0 0 773 773
JEGHARANGGA 5311010018 0 0 1081 1081
KEL. NDORUREA 5311010002 0 0 1647 1647
KERIREA 5311010008 0 0 1140 1140
NDETUREA 5311010015 0 0 951 951
NDORUREA I 5311010014 0 0 1038 1038
NGGOREA 5311010004 0 0 1299 1299
ONDOREA 5311010001 0 0 602 602
ONDOREA BARAT 5311010012 0 0 827 827
PENGGAJAWA 5311010017 0 0 663 663
RAPORENDU 5311010005 19 0 2152 2171
RAPOWAWO 5311010006 59 0 1728 1787
SANGGARHORHO 5311010016 0 0 614 614
TENDAREA 5311010009 15 0 1133 1148
TIWE REA 5311010013 3 0 655 658
WATUMITE 5311010010 0 0 211 211
ZOZOZEA 5311010003 0 0 812 812
NDONA KEL. LOKOBOKO 5311040015 434 0 0 434
KEL. ONELAKO 5311040002 151 0 0 151
MANULONDO 5311040003 75 0 0 75
NANGANESA 5311040001 188 0 0 188
NGALUPOLO 5311040006 97 0 0 97
NDONA NGALUROGA 5311040009 92 39 0 131
PUUTUGA 5311040014 16 0 0 16
Kecamatan Desa Desa code high landslide hazard
volcanic ash fall hazard
very high and high earthquake hazard
total
REKA 5311040017 387 0 0 387
WOLOKOTA 5311040018 18 0 0 18
WOLOTOPO 5311040004 7 0 0 7
NDONA TIMUR DOMULAKA 5311041003 161 483 0 644
KURULIMBU 5311041001 29 0 0 29
KURULIMBU SELATAN 5311041005 209 0 0 209
NGGUWA 5311041006 393 0 0 393
ROGA 5311041004 70 1502 0 1572
SOKORIA 5311041002 581 1998 0 2579
NDORI KELISAMBA 5311054005 427 0 0 427
MAUBASA TIMUR 5311054003 429 0 0 429
WONDA 5311054004 188 0 0 188
PULAU ENDE AEJETI 5311011004 0 0 1568 1568
NDORIWOY 5311011001 0 0 1175 1175
PUDERAPE 5311011003 0 0 1007 1007
PUUTARA 5311011005 0 0 1636 1636
REDORORI 5311011007 0 0 1094 1094
RENDORATERUA 5311011002 0 0 1007 1007
RORURANGGA 5311011006 0 0 1038 1038
WEWARIA AEMURI 5311071005 12 0 0 12
DETUBELA 5311071014 9 0 0 9
FATAATU TIMUR 5311071010 1 0 0 1
MAUTENDA 5311071008 194 0 0 194
MAUTENDA BARAT 5311071002 2 0 0 2
MBOTULAKA 5311071001 9 0 0 9
MUKUSAKI 5311071004 7 0 0 7
NUANGENDA 5311071011 1 0 0 1
NUMBA 5311071015 39 0 0 39
WEWARIA 5311071007 12 0 0 12
WOLOJITA KEL. WOLOJITA 5311051004 0 1371 0 1371
NGGELA 5311051002 3 0 0 3
NUAMULI 5311051001 240 543 0 783
PORA 5311051003 0 1058 0 1058
TENDA 5311051005 0 1030 0 1030
WIWIPEMO 5311051006 21 779 0 800
WOLOWARU BOKASAPE 5311050017 338 2521 0 2859
JOPU 5311050019 0 1570 0 1570
LIKANAKA 5311050036 382 0 0 382
LISEDETU 5311050026 332 530 0 862
LISELOWOBORA 5311050033 360 157 0 517
MBULILOO 5311050024 9 1010 0 1019
MBULIWARALAU 5311050006 113 0 0 113
MBULIWARALAU UTARA 5311050005 45 298 0 343
NAKAMBARA 5311050037 36 0 0 36
NUALISE 5311050027 510 994 0 1504
RINDIWAWO 5311050025 0 721 0 721
WOLOKOLI 5311050018 0 1581 0 1581
WOLOSOKO 5311050015 77 0 0 77
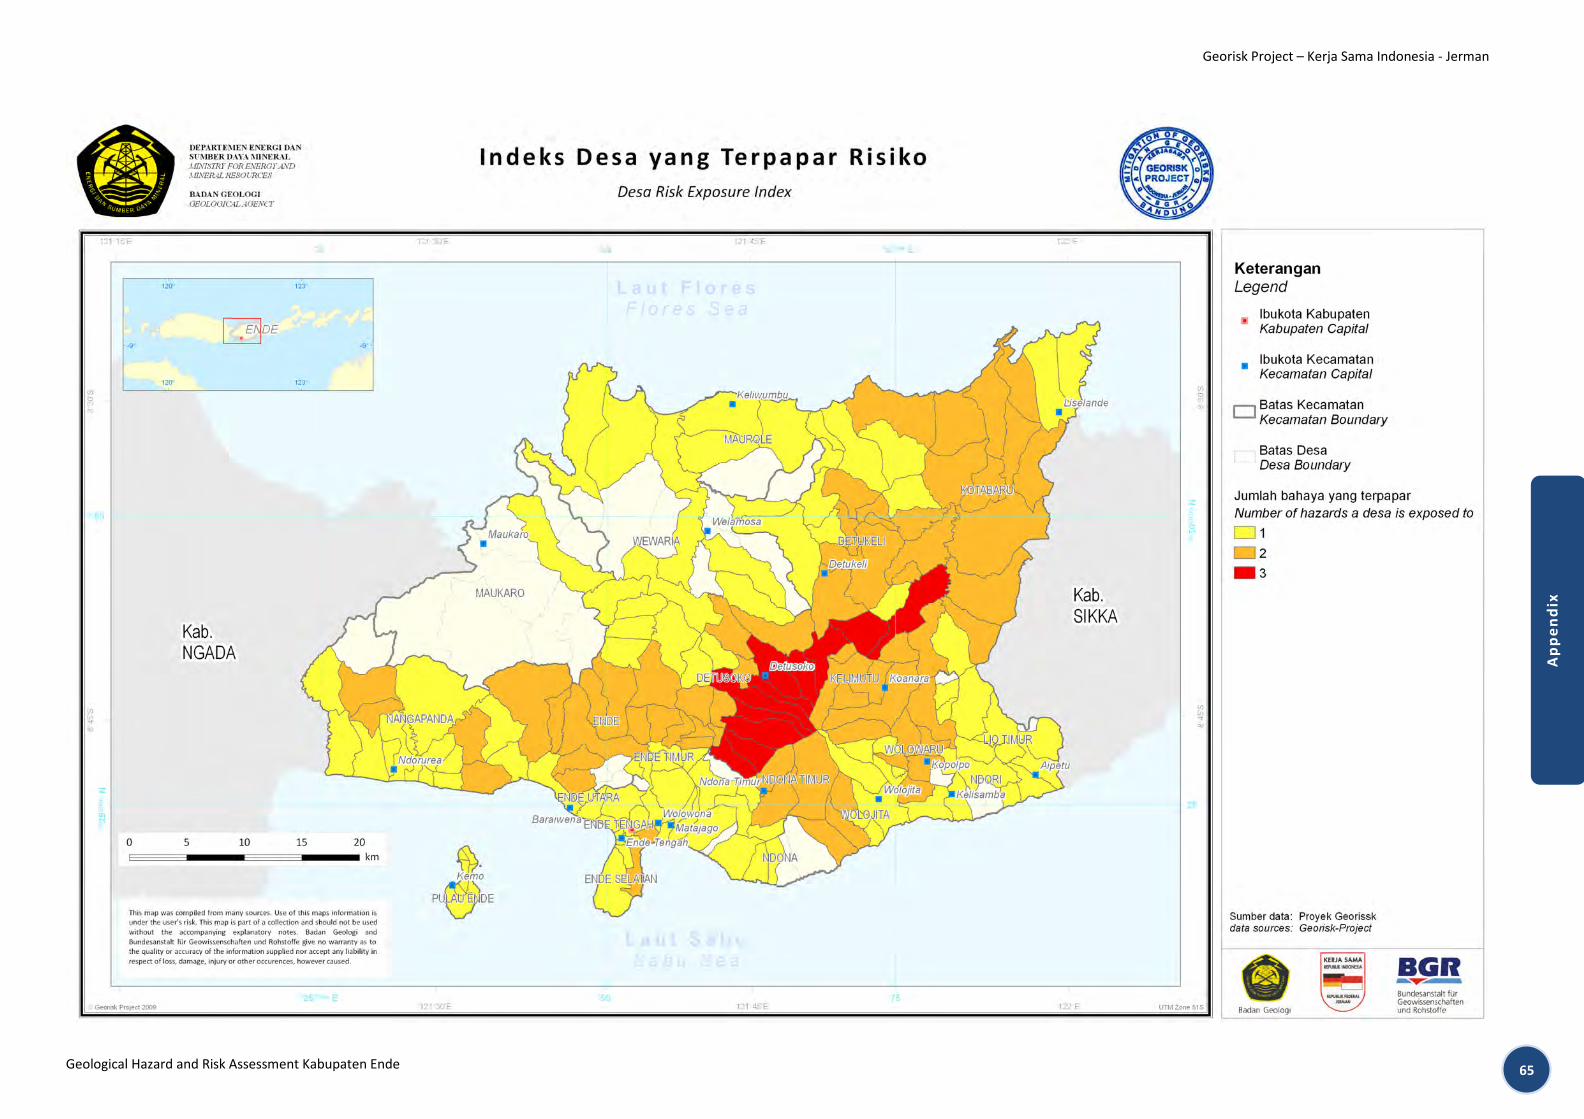
6565
Georisk Project – Kerja Sama Indonesia - Jerman
Geological Hazard and Risk Assessment Kabupaten Ende
Ap
pe
nd
ix

66
Geological Hazard and Risk Assessment Kabupaten Ende
Acronyms
DEM Digital Elevation Model
DLR Deutsches Zentrum für Luft- und RaumfahrtGerman Aerospace Center
GIS Geographic Information System
GITEWS German Indonesian Tsunami Early Warning System Project
GRDP Gross Regional Domestic Product
GTZ Deutsche Gesellschaft für Technische Zusammenarbeit GmbH, German Technical Development Cooperation
IDR Indonesian Rupiah
ISDR International Strategy for Disaster Reduction
NASA National Aeronautics and Space Administration, USA
PDRB see GRDP
PoDes Potensi Desa, Dataset from BPS
PusKesMas Puskas Kesehatan Masyarakat Community Health Center
RDTRK Rencana Detil Tata Ruang Kota
Detailed Municipality Spatial Planning
RPJM Rencana Pembangunan Jangka Menengah
Mid-Term Development Planning
RTRW Rencana Tata Ruang Wilayah
Regional Spatial Planning
SHP Filename extension for ESRI GIS shape-files
SNI Standar Nasional Indonesia Indonesian National Standard
SRTM Shuttle Radar Topographic Mission
UNU-EHS United Nations University – Institute for Environment and Human Security
USGS United States Geological Survey
Relevant Standar Nasional Indonesia (SNI)
SNI 03-1726-20021 Standar perencanaan ketahanan gempa untuk struktur bangunan gedung
Standard for the earthquake resistant planning of building structures
SNI 13-6010-1999 Persiapan peta-peta seismotektonik
Preparation of seismotectonic maps
SNI 13-4689-1998 Persiapan peta-peta wilayah yang terganggu bencana gunung api
Preparation of maps of volcano disaster disturbance area
SNI 13-4728-1998 Penyusunan peta geologi gunung api
Preparation of geological maps of volcanoes
SNI 13-6182-1999
Legenda umum peta zona kerentanan gerakan tanah Indonesia skala 1:100 000
Common legend of susceptibility zone map of land movements in Indonesia, scale 1:100 000
SNI 13-7124-2005 Penyusunan peta zona kerentanan gerakan tanah
Preparation of landslide susceptibility maps
SNI 13-6982.1-2004 Penyelidikan dari lokasi bencana gerakan tanah Bagian 1: Kode Penyelidikan
The investigation of disaster location of land movements - Part 1: Investigation codes
SNI 13-6982.2-2004 Penyelidikan dari lokasi bencana gerakan tanah Bagian 2: Kode pelaporan dari hasil penyelidikan
The investigation of disaster location of land movements - Part 2: Codes of reporting of investigation results
1 also see the document 'Peta zona gempa Indonesia sebagai acuan dasar perencanaan dan perancangan bangunan / Earthquake zonation map of Indonesia as basic reference for planning and building design', Departemen Pekerjaan Umum, 2004; download at pustaka.pu.go.id

6767
Georisk Project – Kerja Sama Indonesia - Jerman
Geological Hazard and Risk Assessment Kabupaten Ende
Ap
pe
nd
ix
Seismotectonic Macrozonation Hazard Map
Redu
ced
copy
oft
the
Seis
mot
ecto
nic
and
Pote
ntia
l Ear
thqu
ake
Haz
ard
and
Mac
rozo
natio
n M
ap o
f Kab
upat
en E
nde

68
Geological Hazard and Risk Assessment Kabupaten Ende
Amplification factor and predominat period microzonation maps of Ende City

6969
Georisk Project – Kerja Sama Indonesia - Jerman
Geological Hazard and Risk Assessment Kabupaten Ende
Ap
pe
nd
ix
National Institutions
Listed here are national government institutions and agencies that are important in the broader context of disaster risk management by either formulating the regulatory framework, providing relevant data or being responsible for implementation. Tasks and functions are taken from the respective web pages. Institutions are listed alphabetically with reference to their abbreviations, as these are most commonly used.
Nama Lembaga Name
Alamat / Address Tugas dan Fungsi Task and function
BADAN GEOLOGI BADAN GEOLOGI
Geological Agency
Jl. Diponegoro No. 57 Bandung 40122 Tel: +62 22 7212834 +62 22 7215297 Fax: +62 22 7216444 www.bgl.esdm.go.id
1. Melaksanakan penelitian dan pelayanan di bidang geologi.2. Merumusan di bidang geologi. 3. Pembinaan dan pelaksanaan penelitian dan pelayanan. 4. Pelayanan survei geologi, serta penelitian dan pelayanan dibidang sumber daya
geologi, vulkanologi dan mitigasi bencana geologi dan geologi lingkungan. 5. Pemberian rekomendasi serta penyajian informasi hasil survei, penelitian dan
pelayanan.
1. To implement research and services in geology.2. To implement the definition in geology. 3. To give guidance and implementation of research and services. 4. To serve geological survey and research as well as for geological resources, volcanoes
and geological hazards mitigation and also environmental geology. 5. To give recommendation and information of results of survey and research.
PVMBG
Pusat Vulkanologi dan Mitigasi Bencana Geologi
CVGHM
Center for Volcanology and Geological Hazards Mitigation
Jl. Diponegoro No. 57 Bandung 40122 Tel: +62 22 7272606 Fax: +62 22 7202761 www.vsi.esdm.go.id
1. Menyelenggarakan penelitian, penyelidikan dan pelayanan bidang vulkanologi dan mitigasi bencana geologi.
2. Penyelenggaraan penelitian dan penyelidikan, serta rancang bangun, pemodelan, dan rekayasa teknologi.
3. Pengamatan vulkanologi dan mitigasi bencana geologi, serta penetapan status kegiatan dan peringatan dini gunungapi.
4. Pemetaan tematik kawasan rawan bencana gunungapi, gempabumi, tsunami dan gerakan tanah, serta sesar aktif.
5. Pemberian rekomendasi penanggulangan bencana gunung api, gempabumi, tsunami dan gerakan tanah.
1. To implement the research, investigation and services in volcanoes and geological hazards mitigation.
2. To carry out research and investigation, design, modeling and technological engineering.
3. Volcanoes monitoring and geological hazards mitigation, as well as to define the status of activity and volcano early warning.
4. Thematic mapping of volcano vulnerable area, earthquake, tsunami, land movement and active fault.
5. To give recommendation of volcano hazards mitigation, earthquake, tsunami and land movement.
PLG
Pusat Lingkungan Geologi
CEG
Center for Environmental Geology
Jl. Diponegoro No. 57 Bandung 40122 Tel: +62 22 7274705 Fax: +62 22 7206167 www.dgtl.esdm.go.id
1. Menyelenggarakan penelitian, penyelidikan dan pelayanan bidang lingkungan geologi.
2. Penyelenggaraan penelitian dan penyelidikan, rekayasa teknologi, rancang bangun dan pemodelan untuk lingkungan geologi, geologi teknik dan airtanah.
3. Inventarisasi airtanah dan penyusunan neraca airtanah, serta pemetaan tematik lingkungan geologi, geologi teknik dan airtanah.
4. Pemberian rekomendasi konservasi kawasan lindung geologi dan airtanah, dan pengelolaan tata ruang.
1. To implement the research, investigation and services in environmental geology.2. To implement the research and investigation, technological engineering, design and
modeling for environmental geology, engineering geology and groundwater. 3. Groundwater inventory and preparation of groundwater balance, environmental
geology thematic mapping. 4. To give recommendation for conservation of geological protected area and
groundwater and spatial management.
PSG
Pusat Survei Geologi
CGS
Center for Geological Survey
Jl. Diponegoro No. 57 Bandung 40122 Tel: +62 22 7272601 Fax: +62 22 7202669 www.grdc.esdm.go.id
1. Menyelenggarakan survei serta penelitian, penyelidikan dan pelayanan bidang geologi.
2. Penyelenggaraan penelitian dan penyelidikan, rekayasa teknologi, rancang bangun dan pemodelan untuk survei geologi.
3. Pemetaan geologi, geofisika, geokimia, tektonik, geomorfologi dan geologi kuarter secara bersistem atau bertema.
1. To implement the survey, research, investigation and services in geology.2. To implement the research, investigation, technological engineering, design and
modeling for geological survey. 3. Thematic and systematic geological mapping, geophysics, geochemical, tectonic, geo-
morphology and quarter geology.
BAKOSURTANAL
Badan Koordinas Survei dan Pemetaan Nasional
BAKOSURTANAL
National Coordinating Agency for Surveys and Mapping
Jl. Raya Jakarta-Bogor Km.46 Cibinong 16911 Tel: +62 21 8752062 Fax: +62 21 8753067 [email protected] www.bakosurtanal.go.id
1. Melaksanaakan tugas pemerintahan di bidang survei dan pemetaan sesuai dengan ketentuan dan peraturan yang berlaku.
2. Pengkajian dan penyusunan kebijakan nasional di bidang survei dan pemetaan. 3. Pemantauan, pemberian bimbingan dan pembinaan terhadap kegiatan instansi
pemerintah di bidang survei dan pemetaan nasional.
1. To execute government task in surveys and mapping in accordance with prevailing legislation.
2. To assess and prepare national policy in surveys and mapping. 3. To monitor, guide the government institution activities in surveys and national
mapping.
BAPPENAS
Badan Perencanaan dan Pembangunan Nasional
BAPPENAS
National Development and Planning Agency
Jl. Taman Suropati No. 2 Jakarta 10310 Tel: +62 21 3905650 www.bappenas.go.id
Melaksanakan perumusan kebijakan dan pelaksanaan penyusunan rencana pembangunan nasional di bidang: sumber daya manusia dan kebudayaan, politik, pertahanan, keamanan, hukum dan aparatur negara, otonomi daerah dan pengembangan regional, ekonomi, sumber daya alam dan lingkungan hidup, sarana dan prasarana, pendanaan pembangunan nasional.
To execute the definition of policy and implementation of preparation of the national development plan in: human resources and culture, politic, defense, security, law and government apparatus, regional autonomy and development, economy, natural resources and living environment, equipment and infrastructure, national development funding.

70
Geological Hazard and Risk Assessment Kabupaten Ende
Nama Lembaga Name
Alamat / Address Tugas dan Fungsi Task and function
BMKG
Badan Meteorologi, Klimatologi dan Geofisika
BMKG
Meteorology, Climatology, and Geophysics Agency
Jl. Angkasa 1 No.2 Kemayoran, Jakarta Pusat – Indonesia Tel: +62 21 4246321 www.bmg.go.id
BMKG mempunyai status sebuah Lembaga Pemerintah Non Departemen (LPND), dipimpin oleh seorang Kepala Badan yang mempunyai tugas sebagai berikut: Melaksanakan tugas pemerintahan di bidang Meteorologi, Klimatologi, Kualitas Udara, dan Geofisika sesuai dengan ketentuan perundang-undangan yang berlaku. Dalam melaksanakan tugas sebagaimana dimaksud diatas, Badan Meteorologi, Klimatologi dan Geofisika menyelenggarakan beberapa fungsi: 1. Pengkajian dan penyusunan kebijakan nasional di bidang meteorologi, klimatologi,
kualitas udara dan geofisika. 2. Koordinasi kegiatan fungsional di bidang meteorologi, klimatologi, kualitas udara dan
geofisika. 3. Fasilitasi dan pembinaan terhadap kegiatan instansi pemerintah dan swasta di bidang
meteorologi, klimatologi, kualitas udara dan geofisika. 4. Penyelenggaraan pengamatan, pengumpulan dan penyebaran, pengolahan dan
analisis serta pelayanan di bidang meteorologi, klimatologi, kualitas udara dan geofisika.
5. Penyelenggaraan kegiatan kerjasama di bidang meteorologi, klimatologi, kualitas udara dan geofisika.
6. Penyelenggaraan pembinaan dan pelayanan administrasi umum di bidang perencanaan umum, ketatausahaan, organisasi dan tatalaksana, kepegawaian, keuangan, kearsipan, hukum, persandian, perlengkapan dan rumah tangga.
BMKG has the status as non-department governmental institution, headed by Head of an Agency, with the tasks as follow: To implement governmental duties in meteorology, climatology, air quality and geophysics in accordance with legislation regulation currently in effect. To implement its task, BMKG has several functions: 1. To assess and develop national policy in meteorology, climatology, air quality and
geophysics. 2. To facilitate and construct government and non-government institution activities in
meteorology, climatology, air quality and geophysics. 3. To organize the observation, collection, and dissemination, as well as the processing,
analyzing and implementing public service for meteorology, climatology, air quality and geophysics.
4. To organize cooperation activities in meteorology, climatology, air quality and geo-physics.
5. To maintain and implement public service for general administration in general planning, administration, organization and implementation, labor, finance, document filing, law, coding, equipment, and in house affairs.
BNPB
Badan Nasional Penanggulangan Bencana
BNPB
National Disaster Management Agency
Jl. Ir. H. Djuanda No. 36 Jakarta Pusat Tel: +62 21 3442734 Fax: +62 21 3458500 www.bakornaspb.go.id
1. Menetapkan pedoman dan pengarahan sesuai dengan kebijakan pemerintah daerah dan BNPB terhadap usaha penanggulangan bencana yang mencakup pencegahan bencana, penanganan darurat, rehabilitasi, serta rekonstruksi secara adil dan setara.
2. Menetapkan standardisasi serta kebutuhan penyelenggaraan penanggulangan bencana berdasrkan peraturan perundang-undangan .
3. Menyusun, menetapkan dan menginformasikan peta rawan bencana. 4. Menyusun, menetapkan prosedur tetap penanganan bencana. 5. Melaksanakan penyelenggaraan penanggulangan bencana pada wilayahnya. 6. Melaporkan penyelenggaraan penanggulangan bencana kepada kepala daerah setiap
sebulan sekali dalam kondisi normal dan setiap saat dalam kondisi darurat bencana. 7. Mengendalikan pengumpulan dan penyaluran uang dan barang. 8. Mempertanggungjawabkan penggunaan anggaran yang diterima dari anggaran
pendapatan belanja daerah.
1. To give guidance and direction in accordance with the local government policy and BNPB in the efforts of disaster mitigation including disaster prevention, emergency response, rehabilitation and reconstruction in fair and non-discriminative manners.
2. To define standardization and needs in disaster mitigation based on regulation. 3. To prepare, define and inform the hazard disaster map. 4. To prepare, define the permanent procedure in disaster mitigation. 5. To implement the disaster mitigation in its own region. 6. To give a report of disaster mitigation activity to the head of region once a month in
normal condition and every time in the emergency situation. 7. To control in collecting and distributing money and goods. 8. Responsibility in the use of budget that received from the regional revenue and
expenditure.
BPN
Badan Pertanahan Nasional
BPN
National Land Agency of the Republic of Indonesia
Pusat Data dan Informasi PertanahanGedung Badan Pertanahan Nasional Lantai V Jalan Sisingamangaraja No. 2, Kebayoran Baru Jakarta 12110 Kotak Pos Nomor 1403/Jks. Jakarta 12014 Tel: +62 21 7393939 www.bpn.go.id
1. Melaksanakan tugas pemerintahan di bidang pertanahan secara nasional, regional dan sektoral.
2. Perumusan kebijakan nasional di bidang pertanahan. 3. Perumusan kebijakan teknis di bidang pertanahan. 4. Koordinasi kebijakan, perencanaan dan program di bidang pertanahan. 5. Pembinaan dan pelayanan administrasi umum di bidang pertanahan. 6. Penyelenggaraan dan pelaksanaan survei, pengukuran dan pemetaan di bidang
pertanahan. 7. Pelaksanaan penatagunaan tanah, reformasi agraria dan penataan wilayah-wilayah
khusus. 8. kerja sama dengan lembaga-lembaga lain. 9. Penyelenggaraan dan pelaksanaan kebijakan, perencanaan dan program di bidang
pertanahan. 10. Pengelolaan data dan informasi di bidang pertanahan.
1. To implement government’s task in land national, regional and sector levels.2. To define national policy in land. 3. To define technical policy in land. 4. To coordinate policy, planning and program in land. 5. To give a guidance and public administration service in land matters. 6. To implement the survey, measurement and mapping. 7. To implement the land use, land reform and special regional preparation. 8. To establish cooperation with other institutions. 9. To implement policy, planning and program of land. 10. To manage the data and information of land matters.
BPS
Badan Pusat Statistik Indonesia
BPS
Indonesian Statistics Agency
Jl. Dr. Sutomo No. 6-8 Jakarta 10710 Tel: +62 21 350-7057 +62 21 381-0291 Fax: +62 21 385-7046 www.bps.go.id
1. Melaksanakan tugas pemerintahan di bidang kegiatan statistik sesuai dengan ketentuan peraturan perundang-undangan yang berlaku.
2. Pengkajian dan penyusunan kebijakan nasional di bidang kegiatan statistik. 3. Penyelenggaraan statistik dasar. 4. Fasilitasi pembinaan terhadap kegiatan instansi pemerintah di bidang kegiatan
statistik.
1. To implement the government’s task in statistical activity in accordance with the prevailing legislation.
2. To assess and prepare the national policy in statistical activity. 3. To implement the basic statistics. 4. To facilitate in guiding the government institution for statistical activity.

7171
Georisk Project – Kerja Sama Indonesia - Jerman
Geological Hazard and Risk Assessment Kabupaten Ende
Ap
pe
nd
ix
Nama Lembaga Name
Alamat / Address Tugas dan Fungsi Task and function
BSN
Badan Standardisasi Nasional Indonesia
BSN
National Standardization Agency of Indonesia
Gedung Manggala Wanabakti, Blok IV lantai 3-4. Jl. Gatot Subroto. Senayan akarta 10270 Tel: +62 21 5747043 Fax : +62 21 5747045 [email protected] www.bsn.go.id
Fungsi BSN1. Pengkajian dan penyusunan kebijakan nasional di bidang standardisasi nasional. 2. Koordinasi kegiatan fungsional dalam pelaksanaan tugas BSN. 3. Fasilitasi dan pembinaan terhadap kegiatan instansi pemerintah di bidang
standardisasi nasional. 4. Penyelenggaraan kegiatan kerjasama dalam negeri dan internasional di bidang
standardisasi. 5. Penyelenggaraan pembinaan dan pelayanan administrasi umum di bidang
perencanaan umum, ketatausahaan, organisasi dan tatalaksana, kepegawaian, keuangan, kearsipan, hukum, persandian, perlengkapan dan rumah tangga.
Kewenangan BSN: Dalam menyelenggarakan fungsi tersebut, BSN mempunyai kewenangan: 1. Penyusunan rencana nasional secara makro di bidangnya. 2. Perumusan kebijakan di bidangnya untuk mendukung pembangunan secara makro. 3. Penetapan sistem informasi di bidangnya. 4. Kewenangan lain sesuai dengan ketentuan peraturan perundang-undangan yang
berlaku yaitu: a) perumusan dan pelaksanaan kebijakan tertentu di bidang standardisasi nasional; b) perumusan dan penetapan kebijakan sistem akreditasi lembaga sertifikasi,
lembaga inspeksi dan laboratorium; c) penetapan Standar Nasional Indonesia (SNI); d) pelaksanaan penelitian dan pengembangan di bidangnya; e) penyelenggaraan pendidikan dan pelatihan di bidangnya.
Function of BSN: 1. Assessment and development of national policy in department of national
standardization. 2. Coordinating functional activities in the implementation of BSN function. 3. Facilitation and training for governmental institutions in the department of national
standardization. 4. Implementation of cooperation activates at national as well as international level in
the department of standardization. 5. Implementation of training and general administration service in the department of
general planning, administration, organization and implementation, finance, archive filing, law, encoding, equipment, and in house affairs.
In the implementation of the task and function, BSN has mandates in: 1. Development of macro national plan in their department. 2. Formulating policy in their department to support the macro development. 3. Establishment of information system in their department. 4. Other mandates in accordance with the legislation regulation currently in effect:
f) Formulating and implementation of certain policy in national standardization. g) Formulating and establishment of certification institution accreditation system
policy, inspection institution, and laboratory. h) Establishment of national Standard of Indonesia (SNI). i) Implementation of research and development in their department. j) Implementation of education and training in their department.
DEPDAGRI Departemen Dalam Negeri
Direktorat Jenderal Pemerintahan Umum
Manajemen Pencegahan dan Penanggulangan Bencana
DEPDAGRI Ministry of Home Affairs (MoHA)
Directorate General of Administration
Management of Disaster Prevention and Mitigation
Jl. Kebon Sirih No. 31 JAKARTA 10340 Tel: +62 21 2300024 Fax: +62 21 3143426 www.ditjenpum.go.id
1. Penyiapan perumusan kebijakan departemen di bidang pelaksanaan dekonsentrasi dan kerjasama daerah, pembinaan wilayah administrasi dan perbatasan, penciptaan ketenteraman, ketertiban, dan perlindungan masyarakat, pelaksanaan kewenangan di wilayah kawasan dan otoritas, serta manajemen pencegahan dan penanggulangan bencana.
2. Pelaksanaan kebijakan di bidang pelaksanaan dekonsentrasi dan kerjasama daerah, pembinaan wilayah administrasi dan perbatasan, penciptaan ketentraman, ketertiban, dan perlindungan masyarakat, pelaksanaan kewenangan di wilayah kawasan dan otoritas, serta manajemen pencegahan dan penanggulangan bencana.
3. Perumusan standar, norma, pedoman, kriteria dan prosedur di bidang pelaksanaan dekonsentrasi dan kerjasama daerah, pembinaan wilayah administrasi dan perbatasan, penciptaan ketentraman, ketertiban dan perlindungan masyarakat, pelaksanaan kewenangan di wilayah kawasan dan otorita, serta manajemen pencegahan dan penanggulangan bencana.
4. Pemberian bimbingan teknis dan evaluasi. 5. Pelaksanaan administrasi direktorat jenderal.
1. To prepare the policy formulation of the department in the implementation of de-concentration and regional cooperation, boundary and administrative area, creating peaceful, impeccable, and protection, implementation of the authority in certain spatial areas, as well as disaster prevention and management.
2. The implementation of policy in de-concentration area and regional cooperation, boundary and administrative area, creating peaceful, impeccable, and protection, implementation of the authority in certain spatial areas, as well as disaster prevention and management.
3. Formulation of standard, norms, guidelines, criterion and procedure in the implementation of de-concentration area and regional cooperation, boundary and administrative area, creating peaceful, impeccable, and protection, implementation of the authority in certain spatial areas, as well as disaster prevention and management.
4. To give technical guidance and evaluation. 5. To implement of the administration within directorate general.
LAPAN
Lembaga Penerbangan dan Antarika Nasional
LAPAN
National Institute of Aeronautics and Space of the Republic of Indonesia
Jl. Pemuda Persil No. 1 Jakarta 13220 Tel: +62 21 4892802 Fax: +62 21 4892815 www.lapan.go.id
1. Melaksanakan tugas pemerintah dibidang penelitian dan pengembangan kedirgantaraan dan pemanfaatannya sesuai peraturan perundang-undangan.
2. Penelitian, pengembangan dan pemanfaatan bidang penginderaan jauh, serta pengembangan bank data penginderaan jauh nasional dan pelayanannya.
3. Penelitian, pengembangan dan pemanfaatan sain atmosfer, iklim antariksa dan lingkungan antariksa, pengkajian perkembangan kedirgantaraan, pengembangan informasi kedirgantaraan serta pelayanannya.
1. To implement the government’s task in research and aeronautics development and its utilization in accordance with the prevailing regulation.
2. To carry out research, development and utilization of remote sensing as well as national remote sensing data bank development and its services.
3. To carry out research, development and utilization of atmosphere sciences, space climate and environment, assessment of aeronautics development, aeronautics information development and its services.
PU
Departemen Pekerjaan Umum
PU
Department of Public Works
Jl. Pattimura No. 20 Kebayoran Bar Jakarta 12110 Tel: +62 21 7392262 pusdata.pu,go.id www.pu.go.id
Tugas: Membantu Presiden dalam menyelenggarakan sebagian urusan pemerintahan di bidang pekerjaan umum.
Fungsi: 1. Merumuskan kebijakan nasional, kebijakan pelaksanaan dan kebijakan teknis di
bidang pekerjaan umum dan permukiman. 2. Pelaksanaan urusan pemerintahan sesuai dengan bidang tugasnya. 3. Mengelola barang milik atau kekayaan negara yang menjadi tanggung jawabnya. 4. Pengawasan atas pelaksanaan tugasnya. 5. Penyampaian laporan hasil evaluasi, saran, dan pertimbangan di bidang tugas dan
fungsinya kepada Presiden.
Tasks: Support the President in the implementation of public works as part of governmental affairs.
Function: 1. Formulating the national policy, implementation and technical policy in the
department of public works and settlement. 2. Implementation of governmental affairs according to the tasks and function. 3. Management of national treasure that belongs to the responsibility. 4. Monitoring of the implementation of the tasks. 5. Reporting of evaluation results, suggestions, and considerations of the task and
duties to the President

72
Geological Hazard and Risk Assessment Kabupaten Ende
Nama Lembaga Name
Alamat / Address Tugas dan Fungsi Task and function
LIPI
Lemabaga Ilmu Pengetahuan Indonesia
LIPI
Indonesian Institute of Sciences
Jl. Jend. Gatot Subroto No. 10 Gedung Widya Sarwono Jakarta 12710 Tel: +62 21 5225641 Fax: +62 21 5207226 www.lipi.go.id Research Center for Geotechnology Dr. Herryal Z. Anwar LIPI Campus - Jl. Sangkuriang Bandung 40135 Tel: +62 22 2503654 Fax: +62 22 2504593
Tugas: LIPI mempunyai tugas melaksanakan tugas pemerintahan di bidang penelitian ilmu pengetahuan sesuai dengan ketentuan peraturean perundang-undangan yang berlaku. Fungsi: 1. Pengkaji dan penyusunan kebijakan nasional di bidang penelitian ilmu pengetahuan. 2. Penyelenggaraan riset keilmuan bersifat dasar. 3. Penyelenggaraan riset inter dan multi disiplin terfokus. 4. Pemantauan, evaluasi kemajuan dan penelaahan kecenderungan ilkmu pengetahuan
dan teknologi. 5. Koordinasi kegiatan fungsional dalam pelaksanaan tugas LIPI. 6. Pelancaran dan pembinaan terhadap kegiatan instansi pemerintah di bidang
penelitian ilmu pengetahuan. 7. Penyelenggaraan pembinaan dan pelayanan administrasi umum di bidang
perencanaan umum, ketatausahaan, organisasi dan tata laksana, kepegawaian, keuangan, kearsipan, hukum, persandian, perlengkapan dan rumah-tangga.
Kewenangan: 1. Penyusunan rencana nasional secara makro di bidangnya. 2. Perumusan kebijakan di bidangnya untuk mendukung pembangunan secara makro. 3. Penetapan sistem informasi di bidangnya. 4. Kewenangan lain yang melekat dan telah dilaksanakan sesuai dengan ketentuan
peraturan perundang-undangan yang berlaku, yaitu : 5. Perumusan dan pelaksanaan kebijakan tertentu di bidang penelitian ilmu
pengetahuan. 6. Penetapan pedoman dan penyelenggaraan riset ilmu pengetahuan dasar. 7. Penetapan pedoman etika ilmiah, kedudukan dan kriteria kelembagaan ilmiah. 8. Pemberian ijin Peneliti Asing. 9. Pemegang kewenangan ilmiah dalam keanekaragaman hayati.
Task: LIPI has the responsibility in implementing the governmental task in research of sciences in accordance with the legal regulation that is currently in effect. Function: 1. Assess and develop national policy in research of sciences. 2. Implementation of basic science research. 3. Implementation of inter and multi-disciplinary focused research. 4. Implementation of monitoring, progress evaluation and science and technology-
based study. 5. Coordination of functional activities in the implementation of LIPI’s task. 6. Speed up the process and training to governmental institutions activities in research
of sciences. 7. Implementation of training and general administration service in general planning,
administration, organization, finance, developing archive, coding, equipment and internal affairs.
Mandate: 1. Develop macro national plan in research and sciences. 2. Formulating policy and in research of sciences in order to support the macro
development. 3. Establishing the information system in research of sciences. 4. Other mandates that are attached to and already implemented in accordance with
the legal regulation currently in effect. 5. Formulation and implementation of certain policy in research of sciences 6. Establishment of guidelines and implementation of basic science research. 7. Establishment of science ethic guideline, position and science-based institution
criteria. 8. Issuing license for Foreign Researchers 9. As the science-based mandate holder for biodiversities.
RISTEK
Kementrian Riset dan Teknologi
RISTEK
State Ministry of Research and Technology
Jl. MH Thamrin No. 8 Gedung II BPP Teknologi Lt. 5,6,7,8,23 dan 24 Jakarta 10340 PO.Box 3110 JKP 10031 Tel: +62 21 316-9119, 316-9127 Fax: +62 21 310-1952 www.ristek.go.id
Tugas: Kementerian Negara Riset dan Teknologi mempunyai tugas membantu Presiden dalam merumuskan kebijakan dan koordinasi di bidang riset, ilmu pengetahuan dan teknologi.
Fungsi: 1. Perumusan kebijakan nasional di bidang riset, ilmu pengetahuan dan teknologi; 2. Koordinasi pelaksanaan kebijakan di bidang riset, ilmu pengetahuan dan teknologi; 3. Pengelolaan barang milik/kekayaan negara yang menjadi tanggung jawabnya; 4. Pengawasan atas pelaksanaan tugasnya; 5. Penyampaian laporan hasil evaluasi, saran, dan pertimbangan di bidang tugas dan
fungsinya kepada Presiden.
Task: The State Ministry of Research and Technology has the responsibility to assist the President of the Republic Indonesia in formulating national policies and implementing coordination in t he field of research, science and technology.
Function: 1. To formulate the national policy in research, science and technology. 2. To coordinate the implementation of national policy in research, science and
technology. 3. To manage national treasure as the responsibility. 4. To monitor the implementation of the task and responsibility. 5. To deliver evaluation, suggestions and consideration results report of the task,
responsibility and function to the President of the Republic of Indonesia.

7373
Georisk Project – Kerja Sama Indonesia - Jerman
Geological Hazard and Risk Assessment Kabupaten Ende
Ap
pe
nd
ix
Institutions of NTT Province
Listed here are provincial government institutions and agencies that are important in the broader context of disaster risk management by either formulating the regulatory framework, providing relevant data or being responsible for implementation. Tasks and functions are taken from the respective web pages. Institutions are listed alphabetically with reference to their abbreviations, as these are most commonly used.
Nama Lembaga Name
Alamat / Address Tugas dan Fungsi Task and function
BALITBANG Provinsi
Badan Penelitian dan Pembangunan NTT
BALITBANG Province
Research and Development Agency of NTT
Jl. Fetor Foenay Kupang Tel: +62 380 827569
Badan Penelitian dan Pengembangan Provinsi NTT mempunyai Tugas Pokok membantu Gubernur dalam penyelenggaraan Pemerintah Daerah di bidang Penelitian dan Pengembangan. Didalam menyelenggarakan tugas pokok tersebut, Badan Penelitian dan Pengembangan Provinsi Jawa Tengah mempunyai fungsi yaitu :
1. Pelaksanaan perumusan kebijakan teknis di Bidang Penelitian dan Pengembangan. 2. Pelaksanaan pelayanan penunjang dalam penyelenggaraan Pemerintahan Daerah di
Bidang Penelitian dan Pengembangan. 3. Pelaksanaan penyusunan rencana dan program, monitoring, evaluasi dan pelaporan
di Bidang Penelitian dan Pengembangan. 4. Pelaksanaan koordinasi, fasilitasi, perencanaan, pelaksanaan penelitian dan
pengembangan. 5. Pelaksanaan penelitian dan pengembangan hasil penelitian. 6. Pelaksanaan pengelolaan urusan perpustakaan, organisasi dan tatalaksana serta
umum dan perlengkapan.
The Research and Development Board of NTT Province has main task to assist Governor in the implementation of local government in the field of research and development. In order to execute such a main task, the Research and Development Board has the following functions:
1. Giving formulation in technical policy for research and development. 2. Acting as supporting services in the running of local government for research and
development. 3. Support in the preparation of plan and program, monitoring, evaluation and
reporting in research and development. 4. Coordinating, facilitating, planning, implementation of research and development. 5. To implement research and develop the results of research 6. To manage library, organization and administration as well as facilities.
BAPPEDA Provinsi
Badan Perencanaan dan Pembangunan Daerah Provinsi NTT
BAPPEDA Province
Regional Development and Planning Board of NTT Province
Jl. Polisi Militer No.2 Kupang Tel: +62 380 831712 Fax: +62 380 833462
Membantu Gubernur dalam penyelenggaraan Pemerintah Daerah di bidang Perencanaan Pembangunan Daerah. Fungsi:
1. Pelaksanaan perumusan kebijakan teknis di bidang Perencanaan Pembangunan Daerah.
2. Pelaksanaan Pelayanan penunjang dalam penyelenggaraan Pemerintah Daerah bidang perencanaan Pembangunan Daerah.
3. Pelaksanaan penyusunan rencana dan program, monitoring, evaluasi dan pelaporan di bidang Perencanaan Pembangunan Daerah.
4. Pelaksanaan penyusunan kebijakan Perencanaan Pembangunan Daerah dalam jangka panjang dan jangka menengah serta perencanaan operasional tahunan.
5. Pelaksanaan koordinasi Perencanaan Pembangunan Daerah di lingkungan Perangkat Daerah, Instansi Vertikal, Lintas kabupaten/Kota dan aspirasi pelaku pembangunan.
6. Pelaksanaan monitoring dan evaluasi hasil pelaksanaan Pembangunan Daerah. 7. Pelaksanaan fasilitas perencanaan dan pengendalian Pembangunan Regional secara
makro. 8. Pelaksanaan penyusunan rencana Anggaran Pembangunan Daerah. 9. Pelaksanaan pengelolaan urusan Program, Kepegawaian, Keuangan, Hukum,
Hubungan masyarakat, Organisasi dan Tatalaksana serta Umum dan Perlengkapan.
To assist Governor in the implementation of local governance in planning and development with the following functions :
1. To define formula in technical policy of local planning and development 2. Supporting services in the implementation of local governance in planning and
development. 3. Preparing plan and program, monitoring, evaluation and reporting in local
development plan. 4. Preparing policy in local development plan both for short and medium term as well as
annual operational plan. 5. Coordination in local development plan within local institutions, vertical institution,
across kabupaten/kota levels and aspiration of development maker. 6. Monitoring and evaluation of implementation in local development. 7. Facilitate in planning and management of macro regional development. 8. Facilitate in preparing budget plan for local development. 9. Management on program, personnel, financial, law, public relation organization and
working procedure, general and facilities.
BPS Propinsi
Badan Pusat Statistik Propinsi NTT
BPS Province
Indonesian Statistics Agency of NTT Province
Jl. R. Suprapto No. 5 Kupang Tel: +62 380 826289
Perwakilan BPS di tingkat daerah adalah BPS Provinsi dan BPS Kabupaten/Kota. BPS Provinsi terdiri dari Bagian Tata Usaha, Statistik Sosial, Statistik Produksi, Statistik Distribusi, Neraca Wilayah dan Analisis Statistik, Integrasi Pengolahan dan Diseminasi Statistik.
Uraian Tugas adalah keterangan atau penjelasan segala kegiatan pekerjaan, kewajiban, dan kewenangan yang menjadi tanggung jawab setiap satuan organisasi, yang mana pada hal ini adalah organisasi BPS Provinsi NTT.
Uraian tugas bagian, bidang, sub bagian, dan seksi perwakilan BPS di Daerah dapat dilihat di Keputusan Kepala Badan Pusat Statistik No. 003 Tahun 2002.
The representatives of BPS at Regional level are BPS Province and BPS Kabupaten/Kota. BPS Province is divided into 6 Divisions: Administrative, Social Statistic, Production Statistic, Distribution Statistic, Area Balance and Statistic Analysis, as well as Processing integration and Statistic Dissemination.
Tasks descriptions are the information or explanation of all working activities, mandatory, or the authority that shall be the responsibility of each organization units (respectively BPS Province and BPS Kabupaten/Kota).
Task Description of Division, sub-division, and sections of BPS representatives in the Region (Province and Kabupaten/Kota) could be seen in the Decision of Head of BPS No. 003 Year 2002.

74
Geological Hazard and Risk Assessment Kabupaten Ende
Nama Lembaga Name
Alamat / Address Tugas dan Fungsi Task and function
DINAS ESDM Provinsi
Dinas Energi dan Sumber Daya Mineral NTT
DINAS ESDM Province
Energy and Mineral Resources Service of NTT
Jl. Polisi Militer No. 3 Kupang Tel: +62 380 839428 Fax: +62 380 822641
Tugas Pokok:
1. Melaksanakan kewenangan desentralisasi di bidang geologi, Pertambangan, energi dan air bawah tanah yang diserahkan kepada Pemerintah Daerah .
2. Melaksanakan kewenangan di bidang geologi, pertambangan, energi dan air bawah tanah yang bersifat lintas kabupaten / kota.
3. Melaksanakan kewenangan kabupaten / kota di bidang geologi, pertambangan, energi dan air bawah tanah yang diserahkan kepada atau dikerjasamakan dengan Provinsi sesuai dengan peraturan perundang - undangan yang berlaku.
4. Melaksanakan kewenangan dekonsentrasi yang diserahkan kepada Gubernur dan tugas pembantuan di bidang geologi, energi dan air bawah tanah sesuai dengan peraturan perundang - undangan yang berlaku.
Fungsi:
1. Pelaksanaan perumusan kebijakan teknis di bidang Geologi, Pertambangan, Energi, Dan Air Bawah Tanah sesuai kebijakan yang ditetapkan oleh Gubernur;
2. Pelaksanaan penyusunan rencana dan program, pelaksanaan fasilitasi, monitoring, evaluasi dan pelaporan di bidang Geologi, Pertambangan, Energi, Dan Air Bawah Tanah;
3. Pelaksanaan penyelenggaraan dan fasilitasi penelitian dan pemetaan di bidang Geologi, Pertambangan, Energi, Dan Air Bawah Tanah;
4. Pelaksanaan penyelenggaraan dan fasilitasi penataan wilayah dan lingkungan di bidang Geologi, Pertambangan, Energi, Dan Air Bawah Tanah;
5. Pelaksanaan pengembangan potensi dan teknologi di bidang Geologi, Pertambangan, Energi, Dan Air Bawah Tanah;
6. Pelaksanaan pengelolaan perizinan usaha pertambangan, ketenagalistrikan dan pengambilan air bawah tanah;
7. Pelaksanaan penyelenggaraan dan fasilitasi bimbingan, penyuluhan, pelatihan dan bantuan teknis di bidang Geologi, Pertambangan, Energi, Dan Air Bawah Tanah;
8. Pelaksanaan penyediaan informasi dan promosi di Geologi, Pertambangan, Energi, Dan Air Bawah Tanah;
9. Pelaksanaan pengawasan, pengendalian Geologi, Pertambangan, Energi, Dan Air Bawah Tanah;
10. Pelaksanaan pengelolaan urusan kepegawaian, keuangan, hukum, hubungan masyarakat, organisasi dan tata laksana serta umum dan perlengkapan
Main Task:
1. To implement the authority of decentralization in geology, mining, energy, and ground water that is handed over to local government.
2. To implement the authority in geology, mining, energy, and ground water that is inter district / municipality cooperation.
3. To implement the authority of kabupaten / kota in geology, mining, energy, and ground water that is handed over to the cooperation with Province in accordance with legislation regulations currently in effect.
4. To implement the authority of de-concentration that is handed over to Governor and supporting task in geology, mining, energy, and ground water in accordance with legislation regulation currently in effect.
Main Function:
1. To implement the technical policy in geology, mining, energy, and ground water in accordance with the policy that is established by Governor.
2. To implement the development plan and program, facilitation, monitoring, evaluation in geology, mining, energy, and ground water.
3. To implement and facilitate research and mapping in geology, mining energy, and ground water.
4. To implement and facilitate the regional spatial plan in geology, mining, energy, and ground water.
5. To implement the potential development and technology in geology, mining, energy, and ground water.
6. To implement the mining permit management, electricity, and ground water withdrawal.
7. To implement and facilitate guidance, training and technical assistance in geology, mining, energy, and ground water.
8. To provide information and promotion in geology, mining, energy, and ground water. 9. To implement monitoring and control of geology, mining, energy, and ground water. 10. To implement the management of personnel, finance, law, procedure, and facilities.
DINAS PU Provinsi
Dinas Pekerjaan Umum Provinsi NTT
Dinas PU Province
Dinas of Public Works of NTT Province
Jl. W. J. Lalamentik No. 20 Kupang Tel: +62 380 826553
Tugas Pokok:
1. Dinas Pekerjaan Umum mempunyai tugas melaksanakan kewenangan Provinsi di bidang pekerjaan umum serta pelaksanaan tugas dekonsentrasi dan tugas pembantuan sesuai dengan lingkup tugasnya.
Fungsi: 1. Penyusunan program di bidang pekerjaan umum ; 2. Pembinaan dan pengendalian di bidang pekerjaan umum ; 3. Perumusan kebijakan teknis, fasilitasi, koordinasi serta pembinaan teknis di bidang
pembinaan dan pengendalian ; 4. Perumusan kebijakan teknis, fasilitasi, koordinasi serta pembinaan teknis di bidang
sumber daya air ; 5. Perumusan kebijakan teknis, fasilitasi, koordinasi serta pembinaan teknis di bidang
bina marga ; 6. Perumusan kebijakan teknis, fasilitasi, koordinasi serta pembinaan teknis di bidang
cipta karya ; 7. Pelaksanaan pemberian perijinan dan pelaksanaan pelayanan umum di bidang
pekerjaan umum ; 8. Pengelolaan administrasi kepegawaian, organisasi, tatalaksana, keuangan, umum dan
perlengkapan; 9. Pelaksanaan tugas lain di bidang pekerjaan umum yang diserahkan oleh Gubernur.
Main Tasks:
1. Dinas of Public Works has a task to implement provincial authority in public works activities as well as the implementation of deconcentration and assist tasks according to its scope.
Function:
1. To develop program of public works; 2. To conduct training and controlling for public works; 3. To formulate the technical policy, coordination as well as conducting technical
support in training and controlling; 4. To formulate the technical policy, coordination as well as conducting technical
training in water resources; 5. To formulate the technical policy, coordination as well as conducting technical
training in bina marga; 6. To formulate the technical policy, coordination as well as conducting technical
training in cipta karya 7. To implement issuing permits for public workks service; 8. To implement the management of personnel, finance, law, procedure, and facilities. 9. To implement other tasks for public works, which is handover by the Governor.

7575
Georisk Project – Kerja Sama Indonesia - Jerman
Geological Hazard and Risk Assessment Kabupaten Ende
Ap
pe
nd
ix
Kabupaten Ende Institutions
Listed here are Kabupaten Ende government institutions and agencies that are important in the broader context of disaster risk management by either formulating the regulatory framework, providing relevant data or being responsible for implementation. Tasks and functions are taken from the respective web pages. Institutions are listed alphabetically with reference to their abbreviations, as these are most commonly used.
Nama Lembaga Name
Alamat / Address Tugas dan Fungsi Task and function
BAPPEDA Kabupaten
Badan Perencanaan dan Pembangunan Daerah Kabupaten Ende
BAPPEDA Kabupaten
Regional Development and Planning Board of Kabupaten Ende
Jl. EL Tari No. 6 Ende Tel: +62 381 22103 Fax: +62 381 21008, 22370
Membantu Kepala Daerah dalam menentukan kebijaksanaan di bidang perencanaan pembangunan daerah serta penilaian atas pelaksanaannya dengan fungsi sebagai berikut:
1. Penyusunan Pola Dasar Pembangunan Daerah yang terdiri dari pola umum jangka panjang dan pola umum perencanaan pembangunan daerah dalam kurun waktu satu sampai lima tahun.
2. Penyusunan Rencana Strategis Pembangunan Tahunan Daerah (Renstra Petada) dan Rencana Strategis Pembangunan Lima Tahunan Daerah (Renstra Pelitada).
3. Penyusunan program-program tahunan sebagai pelaksanaan rencana-rencana yang dibiayai oleh Pemerintah Provinsi Jawa Tengah dan atau diusulkan kepada Pemerintah Pusat atau diusulkan melalui program Tahunan Nasional.
4. Pengkoordinasian perencanaan di antara dinas-dinas, satuan organisasi perangkat daerah lain dalam lingkungan Pemerintah Kota Semarang.
5. Penyusunan RAPBD Kota Semarang bersama-sama dengan Bagian Keuangan dan Bagian Pembangunan dengan koordinasi Sektretariat Daerah.
6. Penyiapan dan Pengembangan pelaksanaan rencana pembangunan di daerah untuk penyempuranaan rencana lebih lanjut.
7. Pelaksanaan pemantauan dan evaluasi pelaksanaan pembangunan serta pelaporan hasil pelaksanaan.
8. Pelaksanaan administratif meliputi ketatausahaan, kepegawaian, keungang perlengkapan dan peralatan lingkup BAPPEDA.
9. Pengelelolaan dan pembinaan UPT di bidang BAPPEDA. 10. Pelaksanaan tugas lain yang dilimpahkan dan atau didelegasikan oleh Kepala Daerah
sesuai dengan bidang tugasnya.
To assist the Municipal to define policy in local development plan and giving assessment in the implementation with the function as follows:
1. Preparing basic design of local development which consists of: general long term and long term plan of local development for 5 years period.
2. Preparing of annual strategic development plan and 5 years strategic development plan.
3. Preparing annual program as the implementation of program plan that financed by the NTT government and or that proposed by central government through national annual program.
4. Coordinating plan among service offices, other local organization units within government of Semarang municipality.
5. Preparing local budget and revenue of Semarang Municipality together with Financial Division and Development Division coordinated by secretariat of local government.
6. Preparation and extends the development plan in the region to perfecting further plan.
7. Monitoring and evaluation the implementation of development as well as reporting of implementation results.
8. Administrative matters including personnel administration, financial, facility and equipment within Bappeda.
9. Management and Development of UPT of Bappeda. 10. To execute other tasks that assigned and or delegated by the Municipal according to
the task.
BPS Kabupaten
Badan Pusat Statistik Kabupaten Ende
BPS Kabupaten
Indonesian Statistics Agency of Kabupaten Ende
Jl. EL Tari Ende - Flores Tel: +62 381 21335 [email protected]
Perwakilan BPS di tingkat daerah adalah BPS Provinsi dan BPS Kabupaten/Kota. BPS Provinsi terdiri dari Bagian Tata Usaha, Statistik Sosial, Statistik Produksi, Statistik Distribusi, Neraca Wilayah dan Analisis Statistik, Integrasi Pengolahan dan Diseminasi Statistik.
Uraian Tugas adalah keterangan atau penjelasan segala kegiatan pekerjaan, kewajiban, dan kewenangan yang menjadi tanggung jawab setiap satuan organisasi, yang mana pada hal ini adalah organisasi BPS Kabupaten Ende.
Uraian tugas bagian, bidang, sub bagian, dan seksi perwakilan BPS di Daerah dapat dilihat di Keputusan Kepala Badan Pusat Statistik No. 003 Tahun 2002.
The representatives of BPS at Regional level are BPS Province and BPS Kabupaten/Kota. BPS Province is divided into 6 Divisions: Administrative, Social Statistic, Production Statistic, Distribution Statistic, Area Balance and Statistic Analysis, as well as Processing integration and Statistic Dissemination.
Tasks descriptions are the information or explanation of all working activities, mandatory, or the authority that shall be the responsibility of each organization units (respectively BPS Province and BPS Kabupaten/Kota).
Task Description of Division, sub-division, and sections of BPS representatives in the Region (Province and Kabupaten/Kota) could be seen in the Decision of Head of BPS No. 003 Year 2002.

76
Geological Hazard and Risk Assessment Kabupaten Ende
Glossary
This list contains the most recent terminological definitions of terms related to risk assessment. These definitions were taken from ISDR’s website (www.unisdr.org/eng/library/UNISDR-terminology-2009-eng.pdf).
The UNISDR Terminology aims to promote common understanding and common usage of disaster risk reduction concepts and to assist the disaster risk reduction efforts of authorities, practitioners and the public.
Acceptable Risk The level of potential losses that a society or community considers acceptable given existing social, economic, political, cultural, technical and environmental conditions.
Comment: In engineering terms, acceptable risk is also used to assess and define the structural and non-structural measures that are needed in order to reduce possible harm to people, property, services and systems to a chosen tolerated level, according to codes or “accepted practice” which are based on known probabilities of hazards and other factors.
Building Code A set of ordinances or regulations and associated standards intended to control aspects of the design, construction, materials, alteration and occupancy of structures that are necessary to ensure human safety and welfare, including resistance to collapse and damage.
Comment: Building codes can include both technical and functional standards. They should incorporate the lessons of international experience and should be tailored to national and local circumstances. A systematic regime of enforcement is a critical supporting requirement for effective implementation of building codes.
Capacity The combination of all the strengths, attributes and resources available within a community, society or organization that can be used to achieve agreed goals.
Comment: Capacity may include infrastructure and physical means, institutions, societal coping abilities, as well as human knowledge, skills and collective attributes such as social relationships, leadership and management. Capacity also may be described as capability. Capacity assessment is a term for the process by which the capacity of a group is reviewed against desired goals, and the capacity gaps are identified for further action.
Capacity Development The process by which people, organizations and society systematically stimulate and develop their capacities over time to achieve social and economic goals, including through improvement of knowledge, skills, systems, and institutions.
Comment: Capacity development is a concept that extends the term of capacity building to encompass all aspects of creating and sustaining capacity growth over time. It involves learning and various types of training, but also continuous efforts to develop institutions, political awareness, financial resources, technology systems, and the wider social and cultural enabling environment.
Coping Capacity The ability of people, organizations and systems, using available skills and resources, to face and manage adverse conditions, emergencies or disasters.
Comment: The capacity to cope requires continuing awareness, resources and good management, both in normal times as well as during crises or adverse conditions. Coping capacities contribute to the reduction of disaster risks.
Corrective Disaster Risk Management * Management activities that address and seek to correct or reduce disaster risks which are already present.
Comment: This concept aims to distinguish between the risks that are already present, and which need to be managed and reduced now, and the prospective risks that may develop in future if risk reduction policies are not put in place. See also “Prospective risk management”.
Critical Facilities The primary physical structures, technical facilities and systems which are socially, economically or operationally essential to the functioning of a society or community, both in routine circumstances and in the extreme circumstances of an emergency.
Comment: Critical facilities are elements of the infrastructure that support essential services in a society. They include such things as transport systems, air and sea ports, electricity, water and communications systems, hospitals and health clinics, and centers for fire, police and public administration services.
Disaster A serious disruption of the functioning of a community or a society involving widespread human, material, economic or environmental losses and impacts, which exceeds the ability of the affected community or society to cope using its own resources.
Comment: Disasters are often described as a result of the combination of: the exposure to a hazard; the conditions of vulnerability that are present; and insufficient capacity or measures to reduce or cope with the potential negative consequences. Disaster impacts may include loss of life, injury, disease and other negative effects on human physical, mental and social well-being, together with damage to property, destruction of assets, loss of services, social and economic disruption and environmental degradation.
Disaster Risk The potential disaster losses, in lives, health status, livelihoods, assets and services, which could occur to a particular community or a society over some specified future time period.
Comment: The definition of disaster risk reflects the concept of disasters as the outcome of continuously present conditions of risk. Disaster risk comprises different types of potential losses which are often difficult to quantify. Nevertheless, with knowledge of the prevailing hazards and the patterns of population and socio-economic development, disaster risks can be assessed and mapped, in broad terms at least.
Disaster Risk Management The systematic process of using administrative directives, organizations, and operational skills and capacities to implement strategies, policies and improved coping capacities in order to lessen the adverse impacts of hazards and the possibility of disaster.
Comment: This term is an extension of the more general term “risk management” to address the specific issue of disaster risks. Disaster risk management aims to avoid, lessen or transfer the adverse effects of hazards through activities and measures for prevention, mitigation and preparedness.
Disaster Risk Reduction The concept and practice of reducing disaster risks through systematic efforts to analyze and manage the causal factors of disasters, including through reduced exposure to hazards, lessened vulnerability of people and property, wise management of land and the environment, and improved preparedness for adverse events.
Comment: A comprehensive approach to reduce disaster risks is set out in the United Nations-endorsed Hyogo Framework for Action, adopted in 2005, whose expected outcome is “The substantial reduction of disaster losses, in lives and the social, economic and environmental assets of communities and countries.” The International Strategy for Disaster Reduction (ISDR) system provides a vehicle for cooperation among Governments, organizations and civil society actors to assist in the implementation of the Framework. Note that while the term “disaster reduction” is

7777
Georisk Project – Kerja Sama Indonesia - Jerman
Geological Hazard and Risk Assessment Kabupaten Ende
Ap
pe
nd
ix
sometimes used, the term “disaster risk reduction” provides a better recognition of the ongoing nature of disaster risks and the ongoing potential to reduce these risks.
Early Warning System The set of capacities needed to generate and disseminate timely and meaningful warning information to enable individuals, communities and organizations threatened by a hazard to prepare and to act appropriately and in sufficient time to reduce the possibility of harm or loss.
Comment: This definition encompasses the range of factors necessary to achieve effective responses to warnings. A people-centered early warning system necessarily comprises four key elements: knowledge of the risks; monitoring, analysis and forecasting of the hazards; communication or dissemination of alerts and warnings; and local capabilities to respond to the warnings received. The expression “end-to-end warning system” is also used to emphasize that warning systems need to span all steps from hazard detection through to community response.
Environmental Degradation The reduction of the capacity of the environment to meet social and ecological objectives and needs.
Comment: Degradation of the environment can alter the frequency and intensity of natural hazards and increase the vulnerability of communities. The types of human-induced degradation are varied and include land misuse, soil erosion and loss, desertification, wildland fires, loss of biodiversity, deforestation, mangrove destruction, land, water and air pollution, climate change, sea level rise and ozone depletion.
Exposure People, property, systems, or other elements present in hazard zones that are thereby subject to potential losses.
Comment: Measures of exposure can include the number of people or types of assets in an area. These can be combined with the specific vulnerability of the exposed elements to any particular hazard to estimate the quantitative risks associated with that hazard in the area of interest.
Geological Hazard Geological process or phenomenon that may cause loss of life, injury or other health impacts, property damage, loss of livelihoods and services, social and economic disruption, or environmental damage.
Comment: Geological hazards include internal earth processes, such as earthquakes, volcanic activity and emissions, and related geophysical processes such as mass movements, landslides, rockslides, surface collapses, and debris or mud flows. Hydrometeorological factors are important contributors to some of these processes. Tsunamis are difficult to categorize; although they are triggered by undersea earthquakes and other geological events, they are essentially an oceanic process that is manifested as a coastal water-related hazard.
Hazard A dangerous phenomenon, substance, human activity or condition that may cause loss of life, injury or other health impacts, property damage, loss of livelihoods and services, social and economic disruption, or environmental damage.
Comment: The hazards of concern to disaster risk reduction as stated in footnote 3 of the Hyogo Framework are “… hazards of natural origin and related environmental and technological hazards and risks.” Such hazards arise from a variety of geological, meteorological, hydrological, oceanic, biological, and technological sources, sometimes acting in combination. In technical settings, hazards are described quantitatively by the likely frequency of occurrence of different intensities for different areas, as determined from historical data or scientific analysis.
Hydrometeorological Hazard Process or phenomenon of atmospheric, hydrological or oceanographic nature that may cause loss of life, injury or other health impacts, property damage, loss of livelihoods and services, social and economic disruption, or environmental damage.
Comment: Hydrometeorological hazards include tropical cyclones (also known as typhoons and hurricanes), thunderstorms, hailstorms, tornados, blizzards, heavy snowfall, avalanches, coastal storm surges, floods including
flash floods, drought, heatwaves and cold spells. Hydrometeorological conditions also can be a factor in other hazards such as landslides, wildland fires, locust plagues, epidemics, and in the transport and dispersal of toxic substances and volcanic eruption material
Land Use Planning The process undertaken by public authorities to identify, evaluate and decide on different options for the use of land, including consideration of long term economic, social and environmental objectives and the implications for different communities and interest groups, and the subsequent formulation and promulgation of plans that describe the permitted or acceptable uses.
Comment: Land-use planning is an important contributor to sustainable development. It involves studies and mapping; analysis of economic, environmental and hazard data; formulation of alternative land-use decisions; and design of long-range plans for different geographical and administrative scales. Land-use planning can help to mitigate disasters and reduce risks by discouraging settlements and construction of key installations in hazard-prone areas, including consideration of service routes for transport, power, water, sewage and other critical facilities.
Mitigation The lessening or limitation of the adverse impacts of hazards and related disasters.
Comment: The adverse impacts of hazards often cannot be prevented fully, but their scale or severity can be substantially lessened by various strategies and actions. Mitigation measures encompass engineering techniques and hazard-resistant construction as well as improved environmental policies and public awareness. It should be noted that in climate change policy, “mitigation” is defined differently, being the term used for the reduction of greenhouse gas emissions that are the source of climate change.
National Platform for Disaster Risk Reduction A generic term for national mechanisms for coordination and policy guidance on disaster risk reduction that are multi-sectoral and inter-disciplinary in nature, with public, private and civil society participation involving all concerned entities within a country.
Comment: This definition is derived from footnote 10 of the Hyogo Framework. Disaster risk reduction requires the knowledge, capacities and inputs of a wide range of sectors and organizations, including United Nations agencies present at the national level, as appropriate. Most sectors are affected directly or indirectly by disasters and many have specific responsibilities that impinge upon disaster risks. National platforms provide a means to enhance national action to reduce disaster risks, and they represent the national mechanism for the International Strategy for Disaster Reduction.
Natural Hazard Natural process or phenomenon that may cause loss of life, injury or other health impacts, property damage, loss of livelihoods and services, social and economic disruption, or environmental damage.
Comment: Natural hazards are a sub-set of all hazards. The term is used to describe actual hazard events as well as the latent hazard conditions that may give rise to future events. Natural hazard events can be characterized by their magnitude or intensity, speed of onset, duration, and area of extent. For example, earthquakes have short durations and usually affect a relatively small region, whereas droughts are slow to develop and fade away and often affect large regions. In some cases hazards may be coupled, as in the flood caused by a hurricane or the tsunami that is created by an earthquake.
Preparedness The knowledge and capacities developed by governments, professional response and recovery organizations, communities and individuals to effectively anticipate, respond to, and recover from, the impacts of likely, imminent or current hazard events or conditions.

78
Geological Hazard and Risk Assessment Kabupaten Ende
Comment: Preparedness action is carried out within the context of disaster risk management and aims to build the capacities needed to efficiently manage all types of emergencies and achieve orderly transitions from response through to sustained recovery. Preparedness is based on a sound analysis of disaster risks and good linkages with early warning systems, and includes such activities as contingency planning, stockpiling of equipment and supplies, the development of arrangements for coordination, evacuation and public information, and associated training and field exercises. These must be supported by formal institutional, legal and budgetary capacities. The related term “readiness” describes the ability to quickly and appropriately respond when required.
Prevention The outright avoidance of adverse impacts of hazards and related disasters.
Comment: Prevention (i.e. disaster prevention) expresses the concept and intention to completely avoid potential adverse impacts through action taken in advance. Examples include dams or embankments that eliminate flood risks, land-use regulations that do not permit any settlement in high risk zones, and seismic engineering designs that ensure the survival and function of a critical building in any likely earthquake. Very often the complete avoidance of losses is not feasible and the task transforms to that of mitigation. Partly for this reason, the terms prevention and mitigation are sometimes used interchangeably in casual use.
Prospective Disaster Risk Management * Management activities that address and seek to avoid the development of new or increased disaster risks.
Comment: This concept focuses on addressing risks that may develop in future if risk reduction policies are not put in place, rather than on the risks that are already present and which can be managed and reduced now. See also Corrective disaster risk management.
Public Awareness The extent of common knowledge about disaster risks, the factors that lead to disasters and the actions that can be taken individually and collectively to reduce exposure and vulnerability to hazards.
Comment: Public awareness is a key factor in effective disaster risk reduction. Its development is pursued, for example, through the development and dissemination of information through media and educational channels, the establishment of information centers, networks, and community or participation actions, and advocacy by senior public officials and community leaders.
Recovery The restoration, and improvement where appropriate, of facilities, livelihoods and living conditions of disaster-affected communities, including efforts to reduce disaster risk factors.
Comment: The recovery task of rehabilitation and reconstruction begins soon after the emergency phase has ended, and should be based on pre-existing strategies and policies that facilitate clear institutional responsibilities for recovery action and enable public participation. Recovery programs, coupled with the heightened public awareness and engagement after a disaster, afford a valuable opportunity to develop and implement disaster risk reduction measures and to apply the “build back better” principle.
Residual Risk The risk that remains in unmanaged form, even when effective disaster risk reduction measures are in place, and for which emergency response and recovery capacities must be maintained.
Comment: The presence of residual risk implies a continuing need to develop and support effective capacities for emergency services, preparedness, response and recovery together with socio-economic policies such as safety nets and risk transfer mechanisms.
Resilience The ability of a system, community or society exposed to hazards to resist, absorb, accommodate to and recover from the effects of a hazard in a timely and efficient manner, including through the preservation and restoration of its essential basic structures and functions.
Comment: Resilience means the ability to “resile from” or “spring back from” a shock. The resilience of a community in respect to potential hazard events is determined by the degree to which the community has the necessary resources and is capable of organizing itself both prior to and during times of need.
Response The provision of emergency services and public assistance during or immediately after a disaster in order to save lives, reduce health impacts, ensure public safety and meet the basic subsistence needs of the people affected.
Comment: Disaster response is predominantly focused on immediate and short-term needs and is sometimes called “disaster relief”. The division between this response stage and the subsequent recovery stage is not clear-cut. Some response actions, such as the supply of temporary housing and water supplies, may extend well into the recovery stage.
Retrofitting Reinforcement or upgrading of existing structures to become more resistant and resilient to the damaging effects of hazards.
Comment: Retrofitting requires consideration of the design and function of the structure, the stresses that the structure may be subject to from particular hazards or hazard scenarios, and the practicality and costs of different retrofitting options. Examples of retrofitting include adding bracing to stiffen walls, reinforcing pillars, adding steel ties between walls and roofs, installing shutters on windows, and improving the protection of important facilities and equipment.
Risk The combination of the probability of an event and its negative consequences.
Comment: This definition closely follows the definition of the ISO/IEC Guide 73. The word “risk” has two distinctive connotations: in popular usage the emphasis is usually placed on the concept of chance or possibility, such as in “the risk of an accident”; whereas in technical settings the emphasis is usually placed on the consequences, in terms of “potential losses” for some particular cause, place and period. It can be noted that people do not necessarily share the same perceptions of the significance and underlying causes of different risks.
See other risk-related terms in the Terminology: Acceptable risk; Corrective disaster risk management; Disaster risk; Disaster risk management; Disaster risk reduction; Disaster risk reduction plans; Extensive risk; Intensive risk; Prospective disaster risk management; Residual risk; Risk assessment; Risk management; Risk transfer.
Risk Assessment A methodology to determine the nature and extent of risk by analyzing potential hazards and evaluating existing conditions of vulnerability that together could potentially harm exposed people, property, services, livelihoods and the environment on which they depend.
Comment: Risk assessments (and associated risk mapping) include: a review of the technical characteristics of hazards such as their location, intensity, frequency and probability; the analysis of exposure and vulnerability including the physical social, health, economic and environmental dimensions; and the evaluation of the effectiveness of prevailing and alternative coping capacities in respect to likely risk scenarios. This series of activities is sometimes known as a risk analysis process.

7979
Georisk Project – Kerja Sama Indonesia - Jerman
Geological Hazard and Risk Assessment Kabupaten Ende
Ap
pe
nd
ix
Risk Management The systematic approach and practice of managing uncertainty to minimize potential harm and loss.
Comment: Risk management comprises risk assessment and analysis, and the implementation of strategies and specific actions to control, reduce and transfer risks. It is widely practiced by organizations to minimize risk in investment decisions and to address operational risks such as those of business disruption, production failure, environmental damage, social impacts and damage from fire and natural hazards. Risk management is a core issue for sectors such as water supply, energy and agriculture whose production is directly affected by extremes of weather and climate.
Risk Transfer The process of formally or informally shifting the financial consequences of particular risks from one party to another whereby a household, community, enterprise or state authority will obtain resources from the other party after a disaster occurs, in exchange for ongoing or compensatory social or financial benefits provided to that other party.
Comment: Insurance is a well-known form of risk transfer, where coverage of a risk is obtained from an insurer in exchange for ongoing premiums paid to the insurer. Risk transfer can occur informally within family and community networks where there are reciprocal expectations of mutual aid by means of gifts or credit, as well as formally where governments, insurers, multi-lateral banks and other large risk-bearing entities establish mechanisms to help cope with losses in major events. Such mechanisms include insurance and re-insurance contracts, catastrophe bonds, contingent credit facilities and reserve funds, where the costs are covered by premiums, investor contributions, interest rates and past savings, respectively.
Socio-Natural Hazard * The phenomenon of increased occurrence of certain geophysical and hydrometeorological hazard events, such as landslides, flooding, land subsidence and drought, that arise from the interaction of natural hazards with overexploited or degraded land and environmental resources.
Comment: This term is used for the circumstances where human activity is increasing the occurrence of certain hazards beyond their natural probabilities. Evidence points to a growing disaster burden from such hazards. Socio-natural hazards can be reduced and avoided through wise management of land and environmental resources.
Structural and Non-Structural Measures Structural measures: Any physical construction to reduce or avoid possible impacts of hazards, or application of engineering techniques to achieve hazard-resistance and resilience in structures or systems;
Non-structural measures: Any measure not involving physical construction that uses knowledge, practice or agreement to reduce risks and impacts, in particular through policies and laws, public awareness raising, training and education.
Comment: Common structural measures for disaster risk reduction include dams, flood levies, ocean wave barriers, earthquake-resistant construction, and evacuation shelters. Common non-structural measures include building codes, land use planning laws and their enforcement, research and assessment, information resources, and public awareness programs. Note that in civil and structural engineering, the term “structural” is used in a more restricted sense to mean just the load-bearing structure, with other parts such as wall cladding and interior fittings being termed non-structural.
Sustainable Development Development that meets the needs of the present without compromising the ability of future generations to meet their own needs.
Comment: This definition coined by the 1987 Brundtland Commission is very succinct but it leaves unanswered many questions regarding the meaning of the word development and the social, economic and environmental processes involved. Disaster risk is associated with unsustainable elements of development such as environmental degradation, while conversely disaster risk reduction can contribute to the achievement of sustainable development, through reduced losses and improved development practices.
Vulnerability The characteristics and circumstances of a community, system or asset that make it susceptible to the damaging effects of a hazard.
Comment: There are many aspects of vulnerability, arising from various physical, social, economic, and environmental factors. Examples may include poor design and construction of buildings, inadequate protection of assets, lack of public information and awareness, limited official recognition of risks and preparedness measures, and disregard for wise environmental management. Vulnerability varies significantly within a community and over time. This definition identifies vulnerability as a characteristic of the element of interest (community, system or asset) which is independent of its exposure. However, in common use the word is often used more broadly to include the element’s exposure.
* Emerging new concepts that are not in widespread use but are of growing professional relevance; the definition of these terms remain to be widely consulted upon and may change in future.


8181
Georisk Project – Kerja Sama Indonesia - Jerman
Geological Hazard and Risk Assessment Kabupaten Ende
Ap
pe
nd
ix
Georisk-Project Summary
The Georisk-Project (Mitigation of Georisks) is a technical cooperation of the Geological Agency of Indonesia (Badan Geologi) and the German Federal Institute for Geosciences and Natural Resources (BGR). Its objective is to develop and test practical georisk assessment methodologies and to support the implementation of findings in national, provincial and local disaster risk mitigation strategies, both for short term and in the long run. The project is commissioned by the German Federal Ministry for Economic Cooperation and Development and implemented as part of the Good Local Governance project of GTZ.