Embed Size (px)
Citation preview
Emirates Journal for Engineering Research, 12 (3), 95-107 (2007) (Regular Paper)
95
GEOLOGICAL, GEOCHEMICAL AND HYDROGEOLOGICAL INVESTIGATION OF MIOCENE–PLEISTOCENE AQUIFER, KUWAIT
F.M. Al-Ruwaih1, K.M. Hadi2and M. Shehata3 1Dept. of Earth & Environmental Sciences, Kuwait University, PO Box 5969, Safat, Kuwait
E-mail: [email protected] 2Water Resources Division, Kuwait Institute of Scientific Research, PO Box - 24885, Safat, Kuwait
E-mail: [email protected] 3Department of Geology, Faculty of Science, Zagazig University, Egypt E-mail: [email protected]
(Received June 2007 and accepted November 2007)
وتستخرج المياه الجوفية . اه الجوفية قليلة الملوحةتعتبر منطقة الدراسة ، أم قدير أحد حقول المياه التي تزود دولة الكويت بالميشبه محصور ، والخزان السفلي ، تكوين الدمام خزان الخزان العلوي لمجموعة الكويت الفتاتية وھو : من خزانين رئيسيين ھما
، وقد تناول ھذا البحث دراسة الطبقات والتراكيب الصخرية. الجيري ، وھو خزان مائي محصور إلى شبه محصوروقد أُعتمد في ھذا البحث . الباليستوسين-جيوكيميائية والخصائص الھيدرولوجية لخزان مجموعة الكويت من عصر الميوسين
على عينات صخرية لبعض آبار المياه الجوفية لحقل أم قدير ، حيث تم تعيين التركيب المعدني والكيميائي للصخور باستخدام لقياس درجة WATEQ4Fكما تم استخدام برنامج . XRFية االنكسار الفلوروسينسي وتقن XRDتقنيات االنكسار اإلشعاعي
كما تم استخدام تقنية االتزان الكتلي باستعمال برنامج . تشبع المياه الجوفية من عدمه بالنسبة إلى بعض المعادن الشائعةWATEVAL وينات الصخرية لمجموعة الكويت ولقد اتضح من الدراسة أن التك. لتتبع نشأة صخور خزان مجموعة الكويت
كما وجد أن التركيب المعدني لھذه . مكونة من فتات السيليكا غير المتماسك بالتبادل مع طبقات من الرمل ، الطين والحصىأما المياه الجوفية . معادن طينية %6فلدسبار و % 2دولوميت ، %5كوارتز ، %41كالسيت ، %46الصخور ھو عبارة عن
كبريت ، –لتر ، والمياه من نوع كلوريد / ملجم 4009قليلة الملوحة حيث يبلغ متوسط مجموع األمالح الذائبة فھي مياه كما اتضح من دراسة نشأة صخور . كالسيوم –ماغنسيوم وكلوريد –كما تتميز بأنھا من أصل كلوريد . صوديوم –وكالسيوم
كما أن مصدر ثاني . الجوفية ھو ذوبان صخور كلوريد الصوديوممجموعة الكويت أن مصدر الكلور والصوديوم في المياه كما دلت نتائج قياس درجة تشبع المياه ، على أن المياه الجوفية لمجموعة الكويت في . أكسيد السيليكون ھو عملية تجوية السيليكا
كما . ايت ، الدولوميت ، الجبس والھاليتوأنھا غير مشبعة بالنسبة لألنھيدر. حالة اتزان بالنسبة إلى معادن الكالسيت والكوارتز. تبين من حساب متوسط الضغط الجزئي لثاني أكسيد الكربون على أن الخزان المائي لمجموعة الكويت يمثل بيئة ترسيبية مغلقة
لخزان مجموعة وأن عملية إعادة الدلمتة تعتبر من العمليات الجيوكيميائية الرئيسية التي تؤثر في جيوكيميائية المياه الجوفية . اليوم/2م 212 ( T )ودلت نتائج تحاليل ضخ اآلبار على أن الخزان المائي شبه محصورة وأن متوسط معامل الناقلية . الكويت
كما اتضح وجود طبقة متصلة من صخور الطين والصوان تفصل . اليوم/م 2 (K)وأن متوسط معامـل توصيل المياه الجوفية . كويت العلوي عن تكوين الدمام السفليالخزان المائي لمجموعة ال
The study area, Umm Gudair is one of the water well fields of Kuwait, which supplies brackish groundwater. The groundwater resources are mainly derived from two aquifers. These are the upper, leaky clastic Kuwait Group aquifer, and the lower, confined to semi-confined carbonate Dammam limestone aquifer. In this study, the stratigraphy, petrology, geochemistry and hydrogeological properties of the Kuwait Group aquifer of Miocene-Pleistocene age will be investigated. The work is based on core samples from selected wells in Umm Gudair field, where the samples have been analyzed by XRD and XRF to determine their mineralogical and chemical composition, respectively. WATEQ4F program has been used to determine the degree of saturation of groundwater with respect to some minerals. WATEVAL program has been utilized to deduce source-rock of the aquifer. However, the current study revealed that the Kuwait Group Formations are composed of unconsolidated, siliciclastic sediments of alternating sand, silt, gravel and mud. The modal mineralogical composition is 46% calcite, 41% quartz, 5% dolomite, 2% feldspars and 6% clay minerals. The groundwater is of brackish type, where the average TDS is 4009 mg/l, shows chloride-sulphate anion facies and calcium-sodium cation facies and characterized by Cl-Mg and Cl-Ca genetic types. Groundwater source –rock deduction indicated that the halite dissolution is the source of Cl- and Na+. Weathering silica is the source of SiO2. Results of thermodynamic speciation showed that the groundwater is generally in an equilibrium condition with calcite and quartz. Groundwater is undersaturated with respect to anhydrite, dolomite, gypsum, halite and palygorskite. The mean PCO2 is 1.34 x 10⁻³ atm., which suggested a deep closed environment. The geochemical evolution of the groundwater demonstrates that the dedolomitization is a major geochemical process affecting the chemistry of the aquifer. The analysis of the pumping test data indicated that the aquifer is acting as semi-confined with an average transmissivity of 212 m2/d, and average hydraulic conductivity (K) of 2 m/d. The aquifer is underlain by a continuous aquitard layer of basal clay and chert that separates the Kuwait Group aquifer from the underlying Dammam limestone aquifer. Keywords: Kuwait Group aquifer / petrology / source-rock / dedolomitization / transmissivity
F.M. Al-Ruwaih, K.M. Hadi and M. Shehata
96 Emirates Journal for Engineering Research, Vol. 12, No.3, 2007
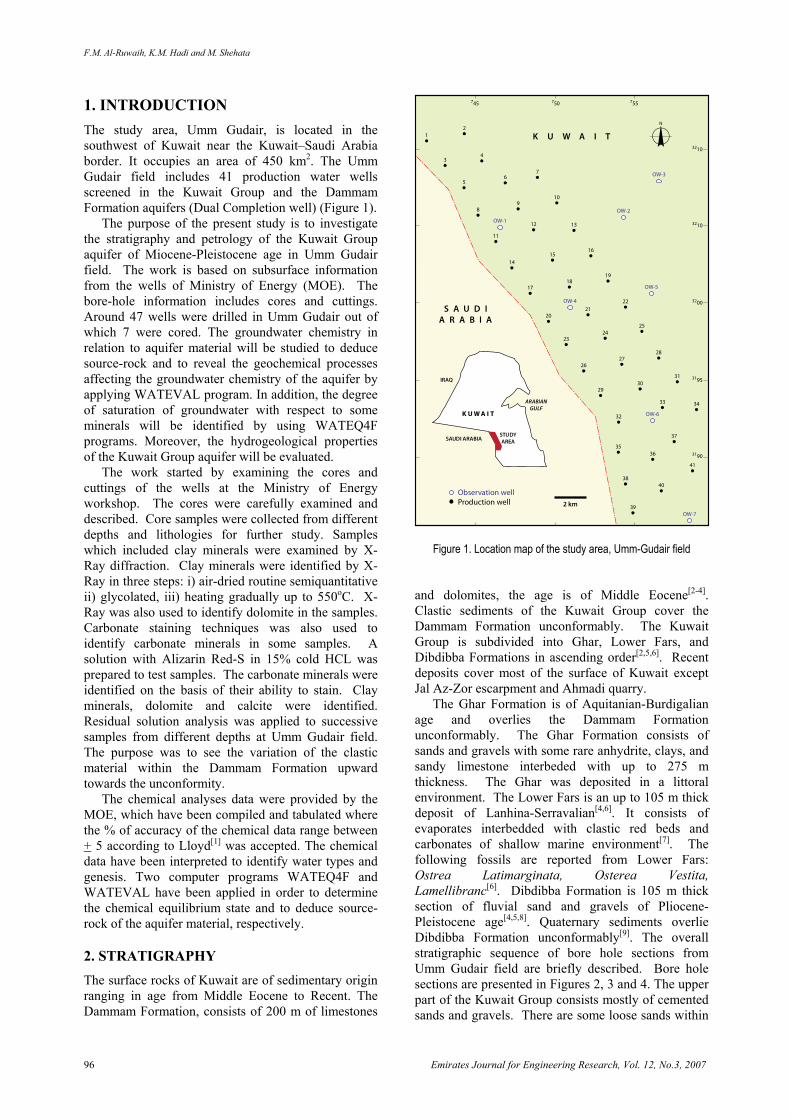
1. INTRODUCTION The study area, Umm Gudair, is located in the southwest of Kuwait near the Kuwait–Saudi Arabia border. It occupies an area of 450 km2. The Umm Gudair field includes 41 production water wells screened in the Kuwait Group and the Dammam Formation aquifers (Dual Completion well) (Figure 1).
The purpose of the present study is to investigate the stratigraphy and petrology of the Kuwait Group aquifer of Miocene-Pleistocene age in Umm Gudair field. The work is based on subsurface information from the wells of Ministry of Energy (MOE). The bore-hole information includes cores and cuttings. Around 47 wells were drilled in Umm Gudair out of which 7 were cored. The groundwater chemistry in relation to aquifer material will be studied to deduce source-rock and to reveal the geochemical processes affecting the groundwater chemistry of the aquifer by applying WATEVAL program. In addition, the degree of saturation of groundwater with respect to some minerals will be identified by using WATEQ4F programs. Moreover, the hydrogeological properties of the Kuwait Group aquifer will be evaluated.
The work started by examining the cores and cuttings of the wells at the Ministry of Energy workshop. The cores were carefully examined and described. Core samples were collected from different depths and lithologies for further study. Samples which included clay minerals were examined by X-Ray diffraction. Clay minerals were identified by X-Ray in three steps: i) air-dried routine semiquantitative ii) glycolated, iii) heating gradually up to 550oC. X-Ray was also used to identify dolomite in the samples. Carbonate staining techniques was also used to identify carbonate minerals in some samples. A solution with Alizarin Red-S in 15% cold HCL was prepared to test samples. The carbonate minerals were identified on the basis of their ability to stain. Clay minerals, dolomite and calcite were identified. Residual solution analysis was applied to successive samples from different depths at Umm Gudair field. The purpose was to see the variation of the clastic material within the Dammam Formation upward towards the unconformity.
The chemical analyses data were provided by the MOE, which have been compiled and tabulated where the % of accuracy of the chemical data range between + 5 according to Lloyd[1] was accepted. The chemical data have been interpreted to identify water types and genesis. Two computer programs WATEQ4F and WATEVAL have been applied in order to determine the chemical equilibrium state and to deduce source-rock of the aquifer material, respectively.
2. STRATIGRAPHY The surface rocks of Kuwait are of sedimentary origin ranging in age from Middle Eocene to Recent. The Dammam Formation, consists of 200 m of limestones
2 km
o12
34
56
7
89
10
11
12 13
1415
16
1718
19
2021
22
2524
23
2627
28
3130
29
32
33 34
37
3635
3840
41
39
745 750 755
3210
3210
3200
3195
3190
OW-7
OW-5
OW-2
OW-3
OW-1
OW-4
OW-6
Observation wellProduction well
S A U D IA R A B I A
K U W A I T
IRAQ
K UWA I T
SAUDI ARABIA
ARABIANGULF
STUDYAREA
Figure 1. Location map of the study area, Umm-Gudair field and dolomites, the age is of Middle Eocene[2-4]. Clastic sediments of the Kuwait Group cover the Dammam Formation unconformably. The Kuwait Group is subdivided into Ghar, Lower Fars, and Dibdibba Formations in ascending order[2,5,6]. Recent deposits cover most of the surface of Kuwait except Jal Az-Zor escarpment and Ahmadi quarry.
The Ghar Formation is of Aquitanian-Burdigalian age and overlies the Dammam Formation unconformably. The Ghar Formation consists of sands and gravels with some rare anhydrite, clays, and sandy limestone interbeded with up to 275 m thickness. The Ghar was deposited in a littoral environment. The Lower Fars is an up to 105 m thick deposit of Lanhina-Serravalian[4,6]. It consists of evaporates interbedded with clastic red beds and carbonates of shallow marine environment[7]. The following fossils are reported from Lower Fars: Ostrea Latimarginata, Osterea Vestita, Lamellibranc[6]. Dibdibba Formation is 105 m thick section of fluvial sand and gravels of Pliocene-Pleistocene age[4,5,8]. Quaternary sediments overlie Dibdibba Formation unconformably[9]. The overall stratigraphic sequence of bore hole sections from Umm Gudair field are briefly described. Bore hole sections are presented in Figures 2, 3 and 4. The upper part of the Kuwait Group consists mostly of cemented sands and gravels. There are some loose sands within
Geological, Geochemical and Hydrogeological Investigation of Miocene–Pleistocene Aquifer, Kuwait
Emirates Journal for Engineering Research, Vol. 12, No.3, 2007 97
SAND; light grey, coarse, loose, calcareous
SANDY LIMESTONE; white, hard
SANDY MUDSTONE; mottled, reddishborwnish patches
SANDSTONE; light brown, coarse,calcareous
SAND; fine, loose
SAND; red, fine, loose, clayey
SAND; whitish grey, fine, loose, calcareousSAND; yellowish, brown, fine, loose
SANDSTONE; buff, coarse
FRAGMENTED CHERTY ZONE
FOSSILIFEROUS DOLOMITE
FOSSILIFEROUS DOLOMITE
FOSSILIFEROUS DOLOMITE
GRANULAR DOLOMITE
265
345
354
360
450
585
610612
614
626
635
645
651
670
750
760
768
865
890 890
850
750
650
600
570
450
350
250
Lithology Core Discription
Sam
ple
No.
Dep
th (f
t)
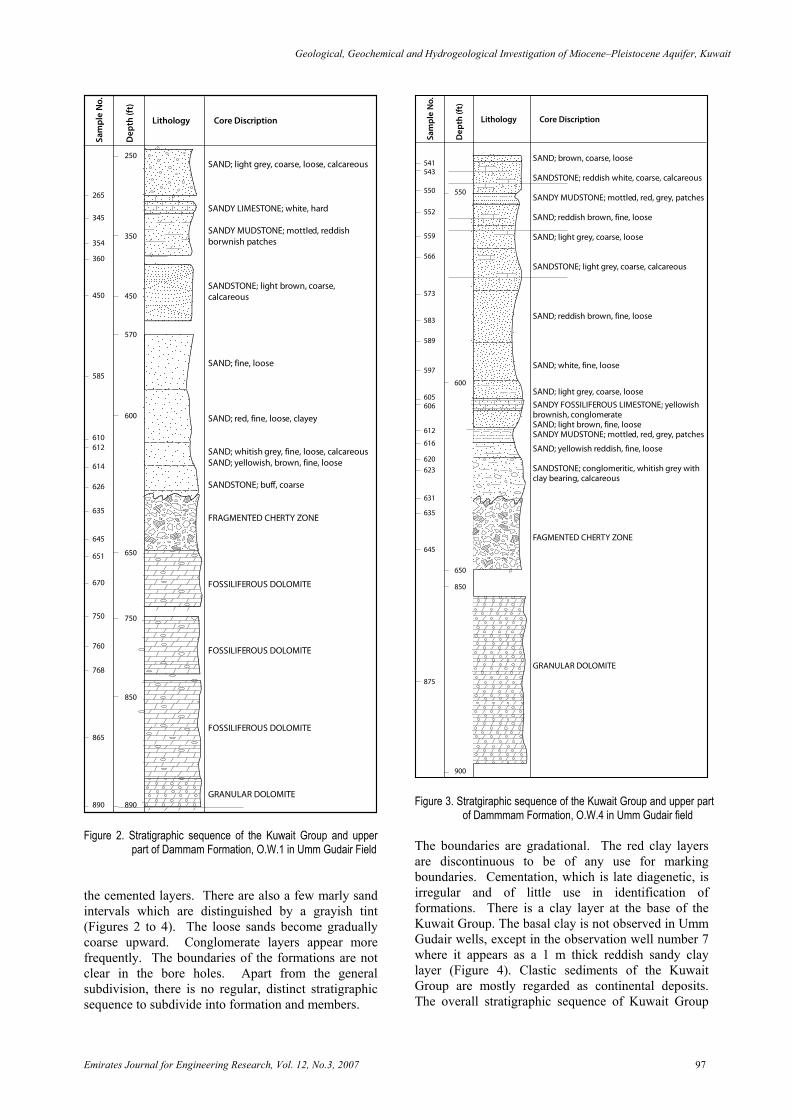
Figure 2. Stratigraphic sequence of the Kuwait Group and upper
part of Dammam Formation, O.W.1 in Umm Gudair Field the cemented layers. There are also a few marly sand intervals which are distinguished by a grayish tint (Figures 2 to 4). The loose sands become gradually coarse upward. Conglomerate layers appear more frequently. The boundaries of the formations are not clear in the bore holes. Apart from the general subdivision, there is no regular, distinct stratigraphic sequence to subdivide into formation and members.
SAND; brown, coarse, loose
SANDSTONE; reddish white, coarse, calcareous
SANDY MUDSTONE; mottled, red, grey, patches
SAND; reddish brown, fine, loose
SAND; light grey, coarse, loose
SANDSTONE; light grey, coarse, calcareous
SAND; reddish brown, fine, loose
SAND; white, fine, loose
SAND; light grey, coarse, looseSANDY FOSSILIFEROUS LIMESTONE; yellowishbrownish, conglomerateSAND; light brown, fine, looseSANDY MUDSTONE; mottled, red, grey, patches
SAND; yellowish reddish, fine, loose
SANDSTONE; conglomeritic, whitish grey withclay bearing, calcareous
FAGMENTED CHERTY ZONE
GRANULAR DOLOMITE
550
543541
552
559
566
597
589
583
573
606605
612
616
620623
635
631
645
875
900
850
650
600
550
Lithology Core Discription
Sam
ple
No.
Dep
th (f
t)
Figure 3. Stratgiraphic sequence of the Kuwait Group and upper part
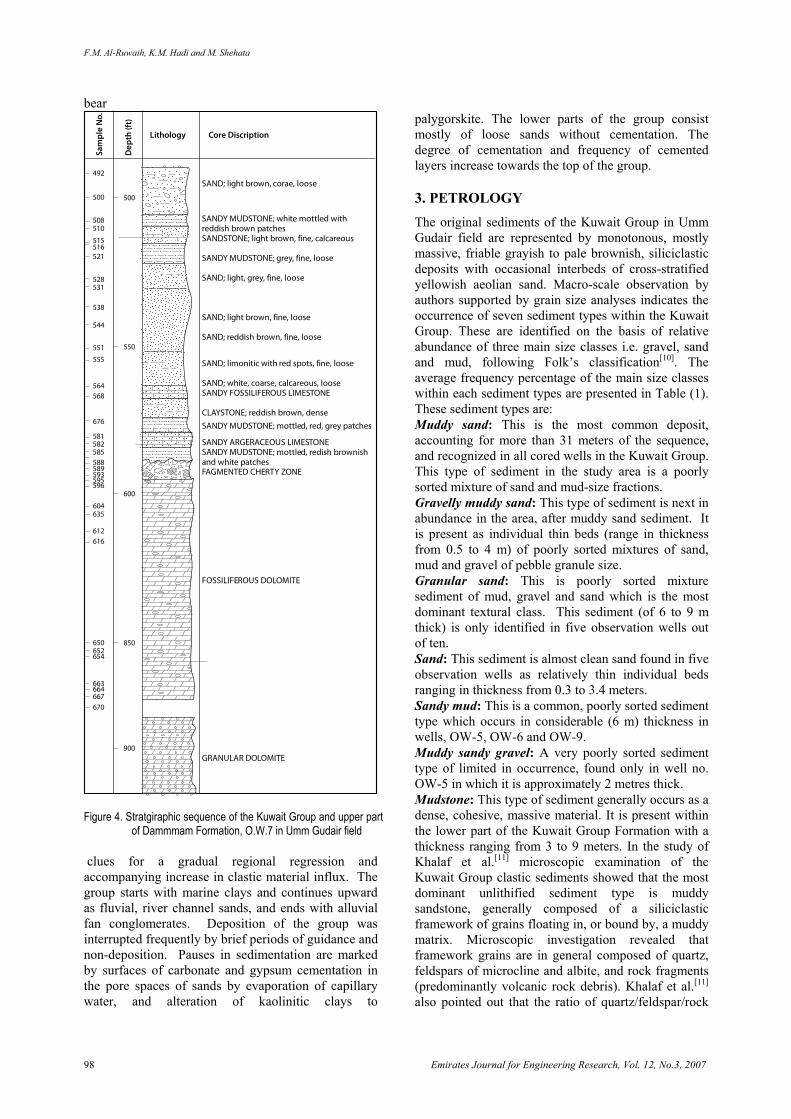
of Dammmam Formation, O.W.4 in Umm Gudair field The boundaries are gradational. The red clay layers are discontinuous to be of any use for marking boundaries. Cementation, which is late diagenetic, is irregular and of little use in identification of formations. There is a clay layer at the base of the Kuwait Group. The basal clay is not observed in Umm Gudair wells, except in the observation well number 7 where it appears as a 1 m thick reddish sandy clay layer (Figure 4). Clastic sediments of the Kuwait Group are mostly regarded as continental deposits. The overall stratigraphic sequence of Kuwait Group
F.M. Al-Ruwaih, K.M. Hadi and M. Shehata
98 Emirates Journal for Engineering Research, Vol. 12, No.3, 2007
bear
SAND; light brown, corae, loose
SANDY MUDSTONE; white mottled withreddish brown patchesSANDSTONE; light brown, fine, calcareous
SANDY MUDSTONE; grey, fine, loose
SAND; light, grey, fine, loose
SAND; light brown, fine, loose
SAND; reddish brown, fine, loose
SAND; limonitic with red spots, fine, loose
SAND; white, coarse, calcareous, looseSANDY FOSSILIFEROUS LIMESTONE
CLAYSTONE; reddish brown, denseSANDY MUDSTONE; mottled, red, grey patches
SANDY ARGERACEOUS LIMESTONESANDY MUDSTONE; mottled, redish brownishand white patchesFAGMENTED CHERTY ZONE
FOSSILIFEROUS DOLOMITE
GRANULAR DOLOMITE
508
500
492
510
515516521
564568
555
551
538
544
528531
676
581582585588589593595596
635
612616
604
650652654
663664667670
900
850
600
550
500
Lithology Core Discription
Sam
ple
No.
Dep
th (f
t)
Figure 4. Stratgiraphic sequence of the Kuwait Group and upper part
of Dammmam Formation, O.W.7 in Umm Gudair field clues for a gradual regional regression and accompanying increase in clastic material influx. The group starts with marine clays and continues upward as fluvial, river channel sands, and ends with alluvial fan conglomerates. Deposition of the group was interrupted frequently by brief periods of guidance and non-deposition. Pauses in sedimentation are marked by surfaces of carbonate and gypsum cementation in the pore spaces of sands by evaporation of capillary water, and alteration of kaolinitic clays to
palygorskite. The lower parts of the group consist mostly of loose sands without cementation. The degree of cementation and frequency of cemented layers increase towards the top of the group.
3. PETROLOGY The original sediments of the Kuwait Group in Umm Gudair field are represented by monotonous, mostly massive, friable grayish to pale brownish, siliciclastic deposits with occasional interbeds of cross-stratified yellowish aeolian sand. Macro-scale observation by authors supported by grain size analyses indicates the occurrence of seven sediment types within the Kuwait Group. These are identified on the basis of relative abundance of three main size classes i.e. gravel, sand and mud, following Folk’s classification[10]. The average frequency percentage of the main size classes within each sediment types are presented in Table (1). These sediment types are: Muddy sand: This is the most common deposit, accounting for more than 31 meters of the sequence, and recognized in all cored wells in the Kuwait Group. This type of sediment in the study area is a poorly sorted mixture of sand and mud-size fractions. Gravelly muddy sand: This type of sediment is next in abundance in the area, after muddy sand sediment. It is present as individual thin beds (range in thickness from 0.5 to 4 m) of poorly sorted mixtures of sand, mud and gravel of pebble granule size. Granular sand: This is poorly sorted mixture sediment of mud, gravel and sand which is the most dominant textural class. This sediment (of 6 to 9 m thick) is only identified in five observation wells out of ten. Sand: This sediment is almost clean sand found in five observation wells as relatively thin individual beds ranging in thickness from 0.3 to 3.4 meters. Sandy mud: This is a common, poorly sorted sediment type which occurs in considerable (6 m) thickness in wells, OW-5, OW-6 and OW-9. Muddy sandy gravel: A very poorly sorted sediment type of limited in occurrence, found only in well no. OW-5 in which it is approximately 2 metres thick. Mudstone: This type of sediment generally occurs as a dense, cohesive, massive material. It is present within the lower part of the Kuwait Group Formation with a thickness ranging from 3 to 9 meters. In the study of Khalaf et al.[11] microscopic examination of the Kuwait Group clastic sediments showed that the most dominant unlithified sediment type is muddy sandstone, generally composed of a siliciclastic framework of grains floating in, or bound by, a muddy matrix. Microscopic investigation revealed that framework grains are in general composed of quartz, feldspars of microcline and albite, and rock fragments (predominantly volcanic rock debris). Khalaf et al.[11] also pointed out that the ratio of quartz/feldspar/rock

Geological, Geochemical and Hydrogeological Investigation of Miocene–Pleistocene Aquifer, Kuwait
Emirates Journal for Engineering Research, Vol. 12, No.3, 2007 99
fragments in the framework grains about 10:3 <1 on average. In addition, flakes of muscovite, chlorite and biotite, with coarser crystals of sparry calcite, are present in the muddy matrix of the unlithified sediments.
Seven samples from different depths of the muddy matrix of unlithified sediments in the Kuwait Group Formations were analyzed by the authors using X-ray diffraction (XRD). The results revealed that they are mainly composed of montmorillonite (Al2Si4O10 (OH)4), kaolinite (Al2Si2O5(OH)4) and palygorskite (Mg2(H4SiO4)3) of different percentages (Table 2).
Table 1. Average percentage of main grain size classes in the unlithified sediment of the Kuwait Group in the Umm Gudair field.
Sediment type Size Class Gravel % Sand % Mud %
Muddy sand Gravelly muddy sand Granular sand Sand Sandy mud Muddy sandy gravel
1 13 10 0.5 1 32
76 70 83 92 46 60
23 17 7
7.5 53 8
Table 2. Relative percentage of clay minerals in the unlithified sediments of the Kuwait Group in the Umm Gudair field as indicated by XRD analysis.
Well
No.
Sam
ple d
epth
[m
(a.m
.s.l)]
Mont
mor
illoni
te %
Palyg
orsk
ite %
Kaol
inite
%
OW-5 OW-6 OW-2 OW-8 OW-9 OW-9 OW-4
88 68 40 40 22 34 -1
80 90 70 70 65 85 80
20 10 10 20 5 15 5
0 0 20 10 30 0 15
4. LITHIFIED SEDIMENTS The clastic sequence of the Kuwait Group in the Umm Gudair field is characterized by the occurrence of lithified horizons of host sediment as a result of cementing by carbonates, mostly calcite. Khalaf et al.[11] used the term “calcrete” to represent the siliciclastic sediments of the Kuwait Group that are partially, or completely cemented by calcite (calcretization process), and also refer to the particular part of the clastic sequence affected by calcretization and which therefore contains calcrete nodules as “calcrete profile”. Calcrete profiles in the study area can include any of the gradational stages between unlithified host sediment and completely calcretized
horizons. These stages have been defined by Khalaf et al.[11] as: - Incipient - Nodular calcrete - Nodular hard calcrete - Massive hard calcrete - Concretionary calcrete, and - Chalky massive calcrete
Calcrete profiles vary in thickness between 0.6 m and 36 m in the study area. These differences are either due to local variations in the diagenetic environment, or perhaps to partial or complete subaerial erosion of some zones. X-ray analysis was applied to different calcrete profile stage samples. The displayed results in Table 3 show that the average mineralogical composition is dominated by quartz as a host sediment with subordinate feldspar and clay minerals (palygorskite, montmorillonite, and kaolinite), and where the dominant cement is calcite and dolomite. Microscopic investigation by Khalaf et al.[11] showed that barite also occurs as a cavity filling cement within some calcrete nodules. The next stages developed when the calcite crystals continued their growth, pushing quartz crystal aside, and occupying their places, causing the calcrete to change in chemical composition and physical characteristics through the more advanced calcrete stages from nodular hard to massive hard to become concretionary calcrete and then finally to a mature chalky massive calcrete.
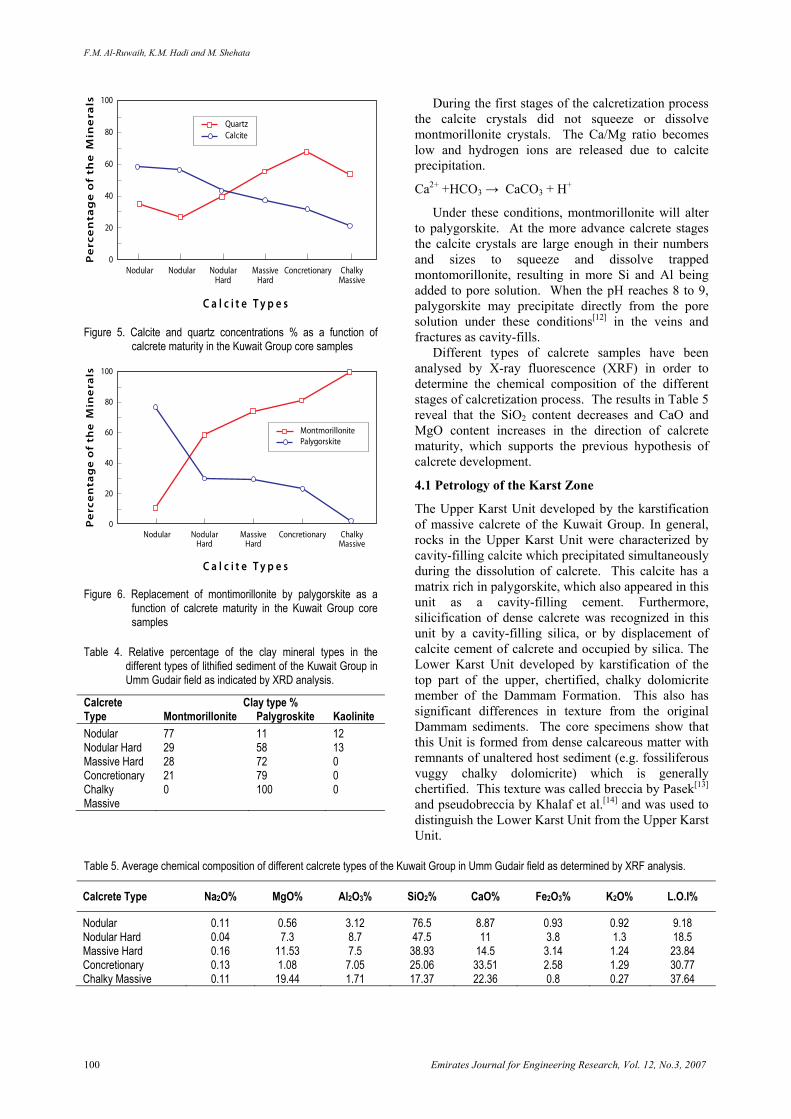
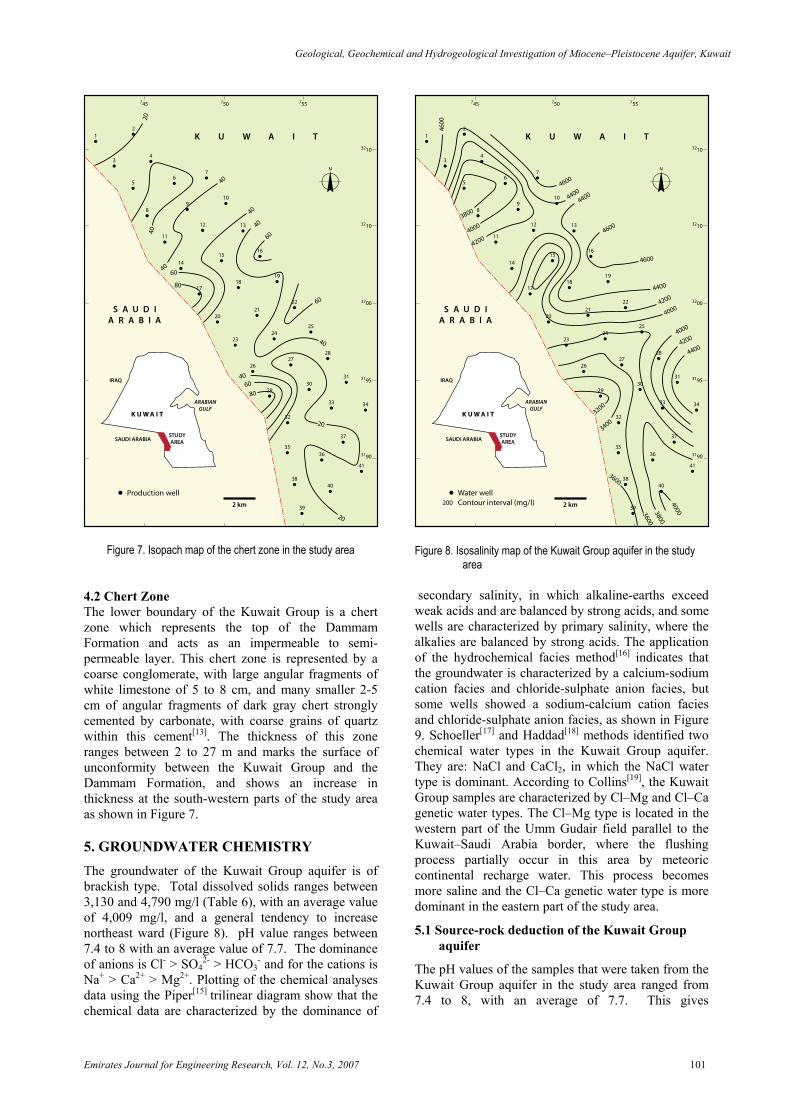
However, in the current study, XRD analysis results in Table 3 shows how the core samples mineralogical composition changes with degrees of calcrete maturity, where the calcite increases and quartz decreases with the same direction of the calcrete maturity (Figure 5).
Table 3. Average mineralogical composition of different types of calcrete from lithified sediments of the Kuwait Group in Umm Gudair field as determined by XRD analysis.
Calcrete Type
Mineral % Quartz Feldspar Calcite Clay Dolomite
Incipient 59 6 35 0 0 Nodular 57 2 27 9 4 Nodular Hard 43 3 39 3 12 Massive Hard 37 1 55 5 2 Concretionary 31 0 67 2 0 Chalky Massive 20 1 53 12 14
Similarly, clay minerals also respond to the
calcretization processes by increasing the % of palygorskite content and decreasing the % of montmorillonite in the same direction of the calcrete maturity, as demonstrated in Table 4 and shown in Figure 6. It is here suggested that palygorskite may have formed either by alteration of montmorillonite and/or by direct precipitation from pore solution.
F.M. Al-Ruwaih, K.M. Hadi and M. Shehata
100 Emirates Journal for Engineering Research, Vol. 12, No.3, 2007
Pe
rce
nta
ge
of
the
Min
era
ls
QuartzCalcite
Nodular Nodular NodularHard
MassiveHard
Concretionary ChalkyMassive
C a l c i t e T y p e s
100
80
60
40
20
0
Figure 5. Calcite and quartz concentrations % as a function of
calcrete maturity in the Kuwait Group core samples
Pe
rce
nta
ge
of
the
Min
era
ls
MontmorillonitePalygorskite
Nodular NodularHard
MassiveHard
Concretionary ChalkyMassive
C a l c i t e T y p e s
100
80
60
40
20
0
Figure 6. Replacement of montimorillonite by palygorskite as a
function of calcrete maturity in the Kuwait Group core samples
Table 4. Relative percentage of the clay mineral types in the different types of lithified sediment of the Kuwait Group in Umm Gudair field as indicated by XRD analysis.
Calcrete Type
Clay type % Montmorillonite Palygroskite Kaolinite
Nodular 77 11 12 Nodular Hard 29 58 13 Massive Hard 28 72 0 Concretionary 21 79 0 Chalky Massive
0 100 0
During the first stages of the calcretization process the calcite crystals did not squeeze or dissolve montmorillonite crystals. The Ca/Mg ratio becomes low and hydrogen ions are released due to calcite precipitation.
Ca2+ +HCO3 → CaCO3 + H+
Under these conditions, montmorillonite will alter to palygorskite. At the more advance calcrete stages the calcite crystals are large enough in their numbers and sizes to squeeze and dissolve trapped montomorillonite, resulting in more Si and Al being added to pore solution. When the pH reaches 8 to 9, palygorskite may precipitate directly from the pore solution under these conditions[12] in the veins and fractures as cavity-fills.
Different types of calcrete samples have been analysed by X-ray fluorescence (XRF) in order to determine the chemical composition of the different stages of calcretization process. The results in Table 5 reveal that the SiO2 content decreases and CaO and MgO content increases in the direction of calcrete maturity, which supports the previous hypothesis of calcrete development.
4.1 Petrology of the Karst Zone
The Upper Karst Unit developed by the karstification of massive calcrete of the Kuwait Group. In general, rocks in the Upper Karst Unit were characterized by cavity-filling calcite which precipitated simultaneously during the dissolution of calcrete. This calcite has a matrix rich in palygorskite, which also appeared in this unit as a cavity-filling cement. Furthermore, silicification of dense calcrete was recognized in this unit by a cavity-filling silica, or by displacement of calcite cement of calcrete and occupied by silica. The Lower Karst Unit developed by karstification of the top part of the upper, chertified, chalky dolomicrite member of the Dammam Formation. This also has significant differences in texture from the original Dammam sediments. The core specimens show that this Unit is formed from dense calcareous matter with remnants of unaltered host sediment (e.g. fossiliferous vuggy chalky dolomicrite) which is generally chertified. This texture was called breccia by Pasek[13] and pseudobreccia by Khalaf et al.[14] and was used to distinguish the Lower Karst Unit from the Upper Karst Unit.
Table 5. Average chemical composition of different calcrete types of the Kuwait Group in Umm Gudair field as determined by XRF analysis.
Calcrete Type Na2O% MgO% Al2O3% SiO2% CaO% Fe2O3% K2O% L.O.I%
Nodular 0.11 0.56 3.12 76.5 8.87 0.93 0.92 9.18 Nodular Hard 0.04 7.3 8.7 47.5 11 3.8 1.3 18.5 Massive Hard 0.16 11.53 7.5 38.93 14.5 3.14 1.24 23.84 Concretionary 0.13 1.08 7.05 25.06 33.51 2.58 1.29 30.77 Chalky Massive 0.11 19.44 1.71 17.37 22.36 0.8 0.27 37.64
Geological, Geochemical and Hydrogeological Investigation of Miocene–Pleistocene Aquifer, Kuwait
Emirates Journal for Engineering Research, Vol. 12, No.3, 2007 101
2 km
o
12
34
56
7
89
10
11
12 13
1415
16
1718
19
2021
22
2524
23
2627
28
3130
29
32
33 34
37
3635
3840
41
39
745 750 755
3210
3210
3200
3195
3190
Production well
S A U D IA R A B I A
K U W A I T
IRAQ
K UWA I T
SAUDI ARABIA
ARABIANGULF
STUDYAREA
6040
40
40
20
40
40
60
40
20
20
60
80
8060
40
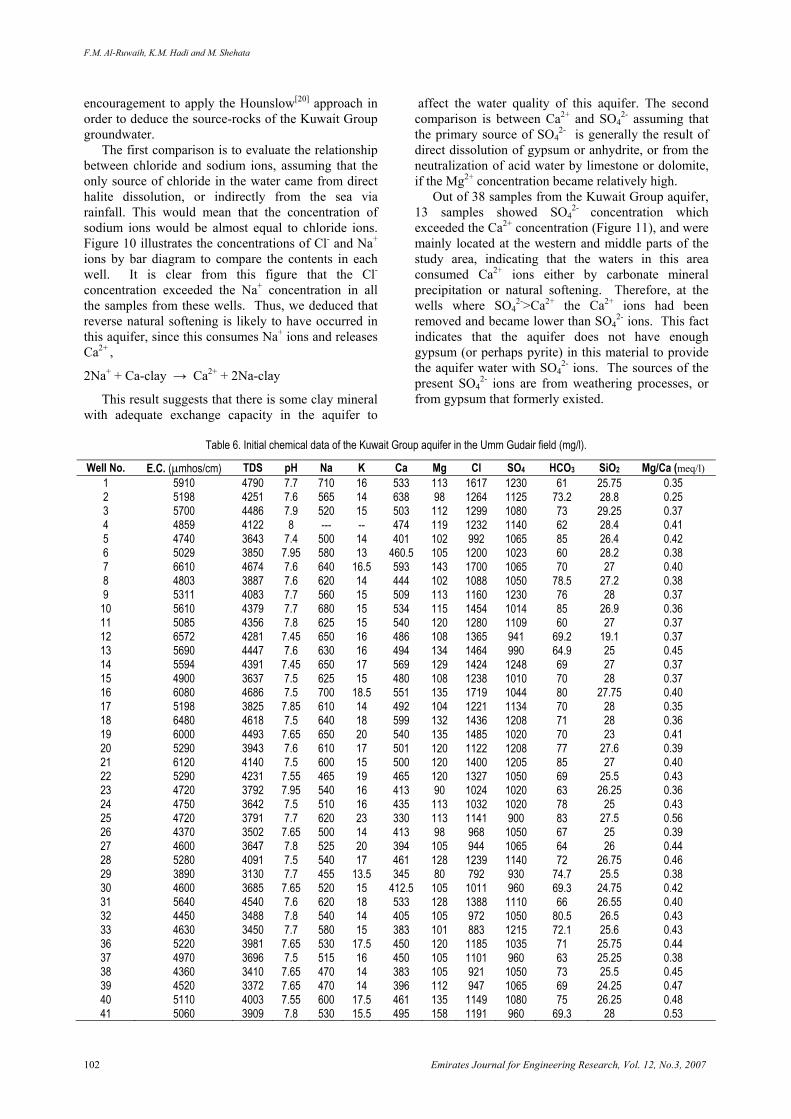
Figure 7. Isopach map of the chert zone in the study area 4.2 Chert Zone The lower boundary of the Kuwait Group is a chert zone which represents the top of the Dammam Formation and acts as an impermeable to semi-permeable layer. This chert zone is represented by a coarse conglomerate, with large angular fragments of white limestone of 5 to 8 cm, and many smaller 2-5 cm of angular fragments of dark gray chert strongly cemented by carbonate, with coarse grains of quartz within this cement[13]. The thickness of this zone ranges between 2 to 27 m and marks the surface of unconformity between the Kuwait Group and the Dammam Formation, and shows an increase in thickness at the south-western parts of the study area as shown in Figure 7.
5. GROUNDWATER CHEMISTRY The groundwater of the Kuwait Group aquifer is of brackish type. Total dissolved solids ranges between 3,130 and 4,790 mg/l (Table 6), with an average value of 4,009 mg/l, and a general tendency to increase northeast ward (Figure 8). pH value ranges between 7.4 to 8 with an average value of 7.7. The dominance of anions is Cl- > SO4
2- > HCO3- and for the cations is
Na+ > Ca2+ > Mg2+. Plotting of the chemical analyses data using the Piper[15] trilinear diagram show that the chemical data are characterized by the dominance of
2 km
o
12
34
56
7
89
10
11
12 13
1415
16
1718
19
2021
22
2524
23
2627
28
3130
29
32
33 34
37
3635
3840
41
39
745 750 755
3210
3210
3200
3195
3190
Water wellContour interval (mg/l)
S A U D IA R A B I A
K U W A I T
IRAQ
K UWA I T
SAUDI ARABIA
ARABIANGULF
STUDYAREA
4600
4600
42004000
3800
4600
4600
4400
4200
4000
4000
40003800
3600
3600
34003200
4200
4400
44004400
200
Figure 8. Isosalinity map of the Kuwait Group aquifer in the study
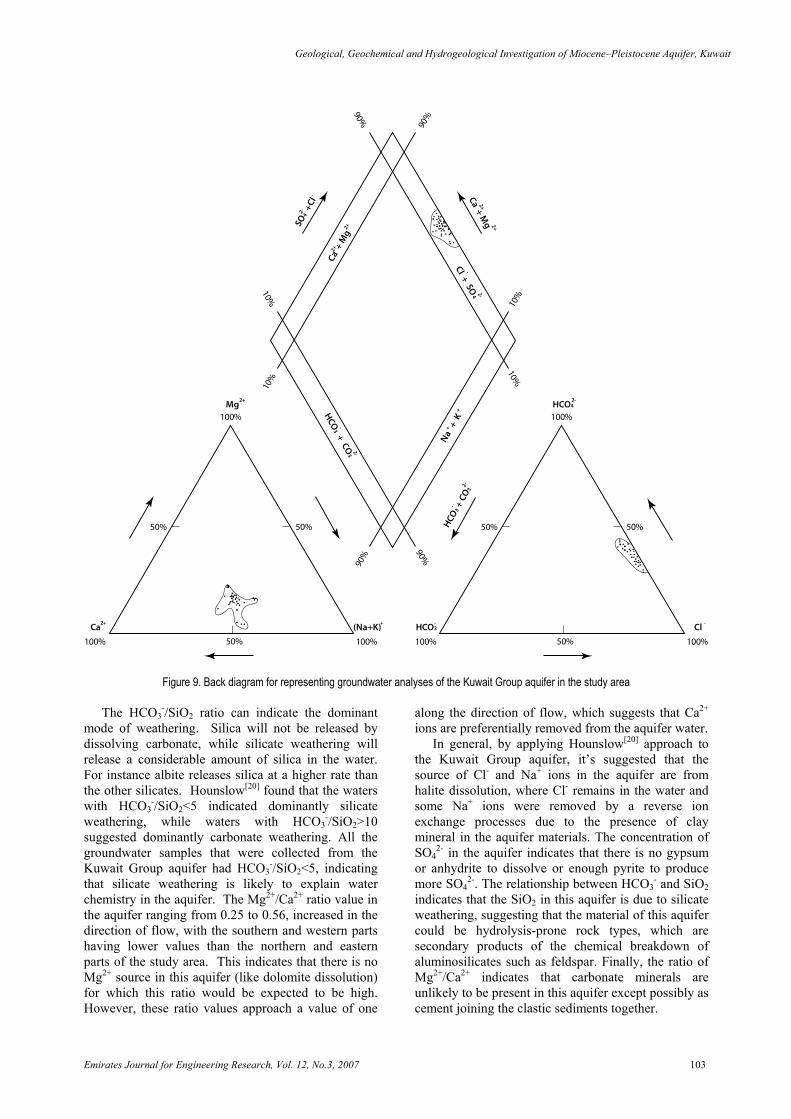
area secondary salinity, in which alkaline-earths exceed weak acids and are balanced by strong acids, and some wells are characterized by primary salinity, where the alkalies are balanced by strong acids. The application of the hydrochemical facies method[16] indicates that the groundwater is characterized by a calcium-sodium cation facies and chloride-sulphate anion facies, but some wells showed a sodium-calcium cation facies and chloride-sulphate anion facies, as shown in Figure 9. Schoeller[17] and Haddad[18] methods identified two chemical water types in the Kuwait Group aquifer. They are: NaCl and CaCl2, in which the NaCl water type is dominant. According to Collins[19], the Kuwait Group samples are characterized by Cl–Mg and Cl–Ca genetic water types. The Cl–Mg type is located in the western part of the Umm Gudair field parallel to the Kuwait–Saudi Arabia border, where the flushing process partially occur in this area by meteoric continental recharge water. This process becomes more saline and the Cl–Ca genetic water type is more dominant in the eastern part of the study area.
5.1 Source-rock deduction of the Kuwait Group aquifer
The pH values of the samples that were taken from the Kuwait Group aquifer in the study area ranged from 7.4 to 8, with an average of 7.7. This gives
F.M. Al-Ruwaih, K.M. Hadi and M. Shehata
102 Emirates Journal for Engineering Research, Vol. 12, No.3, 2007
encouragement to apply the Hounslow[20] approach in order to deduce the source-rocks of the Kuwait Group groundwater.
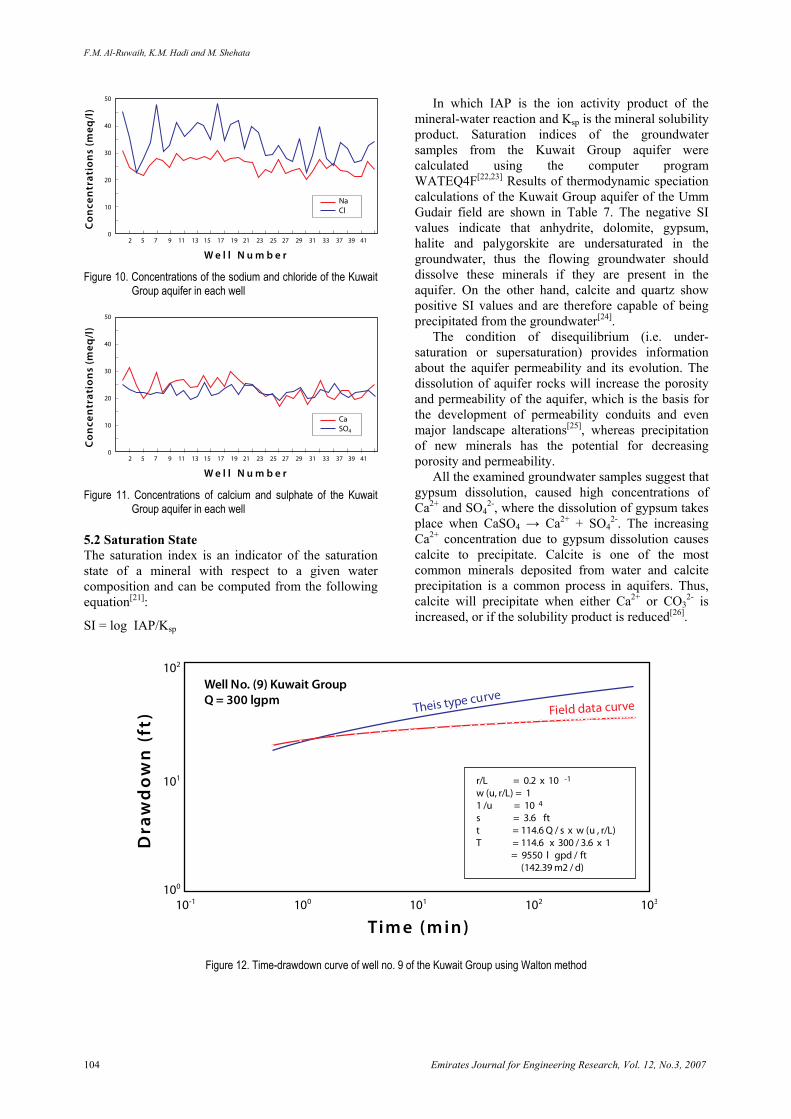
The first comparison is to evaluate the relationship between chloride and sodium ions, assuming that the only source of chloride in the water came from direct halite dissolution, or indirectly from the sea via rainfall. This would mean that the concentration of sodium ions would be almost equal to chloride ions. Figure 10 illustrates the concentrations of Cl- and Na+ ions by bar diagram to compare the contents in each well. It is clear from this figure that the Cl- concentration exceeded the Na+ concentration in all the samples from these wells. Thus, we deduced that reverse natural softening is likely to have occurred in this aquifer, since this consumes Na+ ions and releases Ca2+ ,
2Na+ + Ca-clay → Ca2+ + 2Na-clay
This result suggests that there is some clay mineral with adequate exchange capacity in the aquifer to
affect the water quality of this aquifer. The second comparison is between Ca2+ and SO4
2- assuming that the primary source of SO4
2- is generally the result of direct dissolution of gypsum or anhydrite, or from the neutralization of acid water by limestone or dolomite, if the Mg2+ concentration became relatively high.
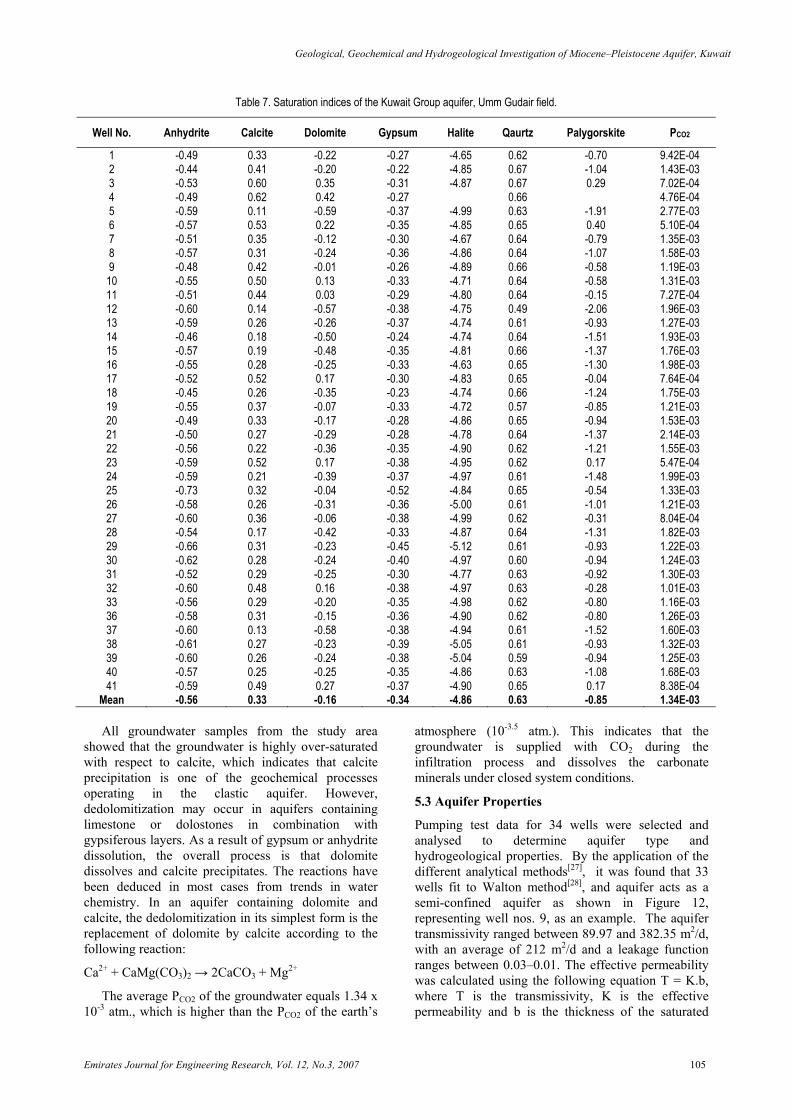
Out of 38 samples from the Kuwait Group aquifer, 13 samples showed SO4
2- concentration which exceeded the Ca2+ concentration (Figure 11), and were mainly located at the western and middle parts of the study area, indicating that the waters in this area consumed Ca2+ ions either by carbonate mineral precipitation or natural softening. Therefore, at the wells where SO4
2->Ca2+ the Ca2+ ions had been removed and became lower than SO4
2- ions. This fact indicates that the aquifer does not have enough gypsum (or perhaps pyrite) in this material to provide the aquifer water with SO4
2- ions. The sources of the present SO4
2- ions are from weathering processes, or from gypsum that formerly existed.
Table 6. Initial chemical data of the Kuwait Group aquifer in the Umm Gudair field (mg/l).
Well No. E.C. (μmhos/cm) TDS pH Na K Ca Mg Cl SO4 HCO3 SiO2 Mg/Ca (meq/l) 1 2 3 4 5 6 7 8 9 10 11 12 13 14 15 16 17 18 19 20 21 22 23 24 25 26 27 28 29 30 31 32 33 36 37 38 39 40 41
5910 5198 5700 4859 4740 5029 6610 4803 5311 5610 5085 6572 5690 5594 4900 6080 5198 6480 6000 5290 6120 5290 4720 4750 4720 4370 4600 5280 3890 4600 5640 4450 4630 5220 4970 4360 4520 5110 5060
4790 4251 4486 4122 3643 3850 4674 3887 4083 4379 4356 4281 4447 4391 3637 4686 3825 4618 4493 3943 4140 4231 3792 3642 3791 3502 3647 4091 3130 3685 4540 3488 3450 3981 3696 3410 3372 4003 3909
7.7 7.6 7.9 8
7.4 7.95 7.6 7.6 7.7 7.7 7.8 7.45 7.6 7.45 7.5 7.5 7.85 7.5 7.65 7.6 7.5 7.55 7.95 7.5 7.7 7.65 7.8 7.5 7.7 7.65 7.6 7.8 7.7 7.65 7.5 7.65 7.65 7.55 7.8
710 565 520 ---
500 580 640 620 560 680 625 650 630 650 625 700 610 640 650 610 600 465 540 510 620 500 525 540 455 520 620 540 580 530 515 470 470 600 530
16 14 15 -- 14 13
16.5 14 15 15 15 16 16 17 15
18.5 14 18 20 17 15 19 16 16 23 14 20 17
13.5 15 18 14 15
17.5 16 14 14
17.5 15.5
533 638 503 474 401
460.5 593 444 509 534 540 486 494 569 480 551 492 599 540 501 500 465 413 435 330 413 394 461 345
412.5 533 405 383 450 450 383 396 461 495
113 98 112 119 102 105 143 102 113 115 120 108 134 129 108 135 104 132 135 120 120 120 90 113 113 98 105 128 80 105 128 105 101 120 105 105 112 135 158
1617 1264 1299 1232 992 1200 1700 1088 1160 1454 1280 1365 1464 1424 1238 1719 1221 1436 1485 1122 1400 1327 1024 1032 1141 968 944 1239 792 1011 1388 972 883 1185 1101 921 947 1149 1191
1230 1125 1080 1140 1065 1023 1065 1050 1230 1014 1109 941 990 1248 1010 1044 1134 1208 1020 1208 1205 1050 1020 1020 900 1050 1065 1140 930 960 1110 1050 1215 1035 960 1050 1065 1080 960
61 73.2 73 62 85 60 70
78.5 76 85 60
69.2 64.9 69 70 80 70 71 70 77 85 69 63 78 83 67 64 72
74.7 69.3 66
80.5 72.1 71 63 73 69 75
69.3
25.75 28.8 29.25 28.4 26.4 28.2 27
27.2 28
26.9 27
19.1 25 27 28
27.75 28 28 23
27.6 27
25.5 26.25
25 27.5 25 26
26.75 25.5 24.75 26.55 26.5 25.6 25.75 25.25 25.5 24.25 26.25
28
0.35 0.25 0.37 0.41 0.42 0.38 0.40 0.38 0.37 0.36 0.37 0.37 0.45 0.37 0.37 0.40 0.35 0.36 0.41 0.39 0.40 0.43 0.36 0.43 0.56 0.39 0.44 0.46 0.38 0.42 0.40 0.43 0.43 0.44 0.38 0.45 0.47 0.48 0.53
Geological, Geochemical and Hydrogeological Investigation of Miocene–Pleistocene Aquifer, Kuwait
Emirates Journal for Engineering Research, Vol. 12, No.3, 2007 103
50%50%
100%
10%
10%
90%
10%
90%
10%
90%
90%
100%100% 50%
HCO3-
HCO42-
Cl -
50%50%
100%
100%100% 50%
Ca2+
Mg
SO4
+Cl
2-
Ca +
Mg
Na +
KHCO
3 +CO
3
Ca + Mg
Cl + SO4
HCO3 +
CO3
2+
2+
2-
2-
-
-
2+
2-
-+
+
2+
-
2+
(Na+K)+
Figure 9. Back diagram for representing groundwater analyses of the Kuwait Group aquifer in the study area
The HCO3-/SiO2 ratio can indicate the dominant
mode of weathering. Silica will not be released by dissolving carbonate, while silicate weathering will release a considerable amount of silica in the water. For instance albite releases silica at a higher rate than the other silicates. Hounslow[20] found that the waters with HCO3
-/SiO2<5 indicated dominantly silicate weathering, while waters with HCO3
-/SiO2>10 suggested dominantly carbonate weathering. All the groundwater samples that were collected from the Kuwait Group aquifer had HCO3
-/SiO2<5, indicating that silicate weathering is likely to explain water chemistry in the aquifer. The Mg2+/Ca2+ ratio value in the aquifer ranging from 0.25 to 0.56, increased in the direction of flow, with the southern and western parts having lower values than the northern and eastern parts of the study area. This indicates that there is no Mg2+ source in this aquifer (like dolomite dissolution) for which this ratio would be expected to be high. However, these ratio values approach a value of one
along the direction of flow, which suggests that Ca2+ ions are preferentially removed from the aquifer water.
In general, by applying Hounslow[20] approach to the Kuwait Group aquifer, it’s suggested that the source of Cl- and Na+ ions in the aquifer are from halite dissolution, where Cl- remains in the water and some Na+ ions were removed by a reverse ion exchange processes due to the presence of clay mineral in the aquifer materials. The concentration of SO4
2- in the aquifer indicates that there is no gypsum or anhydrite to dissolve or enough pyrite to produce more SO4
2-. The relationship between HCO3- and SiO2
indicates that the SiO2 in this aquifer is due to silicate weathering, suggesting that the material of this aquifer could be hydrolysis-prone rock types, which are secondary products of the chemical breakdown of aluminosilicates such as feldspar. Finally, the ratio of Mg2+/Ca2+ indicates that carbonate minerals are unlikely to be present in this aquifer except possibly as cement joining the clastic sediments together.
F.M. Al-Ruwaih, K.M. Hadi and M. Shehata
104 Emirates Journal for Engineering Research, Vol. 12, No.3, 2007
Co
nce
ntr
atio
ns
(meq
/l)
W e l l N u m b e r
50
40
30
20
10
02 5 7 9 11 13 15 17 19 21 23 25 27 29 31 33 37 39 41
NaCl
Figure 10. Concentrations of the sodium and chloride of the Kuwait
Group aquifer in each well
Co
nce
ntr
atio
ns
(meq
/l)
W e l l N u m b e r
50
40
30
20
10
02 5 7 9 11 13 15 17 19 21 23 25 27 29 31 33 37 39 41
CaSO4
Figure 11. Concentrations of calcium and sulphate of the Kuwait
Group aquifer in each well 5.2 Saturation State The saturation index is an indicator of the saturation state of a mineral with respect to a given water composition and can be computed from the following equation[21]:
SI = log IAP/Ksp
In which IAP is the ion activity product of the mineral-water reaction and Ksp is the mineral solubility product. Saturation indices of the groundwater samples from the Kuwait Group aquifer were calculated using the computer program WATEQ4F[22,23] Results of thermodynamic speciation calculations of the Kuwait Group aquifer of the Umm Gudair field are shown in Table 7. The negative SI values indicate that anhydrite, dolomite, gypsum, halite and palygorskite are undersaturated in the groundwater, thus the flowing groundwater should dissolve these minerals if they are present in the aquifer. On the other hand, calcite and quartz show positive SI values and are therefore capable of being precipitated from the groundwater[24].
The condition of disequilibrium (i.e. under-saturation or supersaturation) provides information about the aquifer permeability and its evolution. The dissolution of aquifer rocks will increase the porosity and permeability of the aquifer, which is the basis for the development of permeability conduits and even major landscape alterations[25], whereas precipitation of new minerals has the potential for decreasing porosity and permeability.
All the examined groundwater samples suggest that gypsum dissolution, caused high concentrations of Ca2+ and SO4
2-, where the dissolution of gypsum takes place when CaSO4 → Ca2+ + SO4
2-. The increasing Ca2+ concentration due to gypsum dissolution causes calcite to precipitate. Calcite is one of the most common minerals deposited from water and calcite precipitation is a common process in aquifers. Thus, calcite will precipitate when either Ca2+ or CO3
2- is increased, or if the solubility product is reduced[26].
Theis type curveField data curve
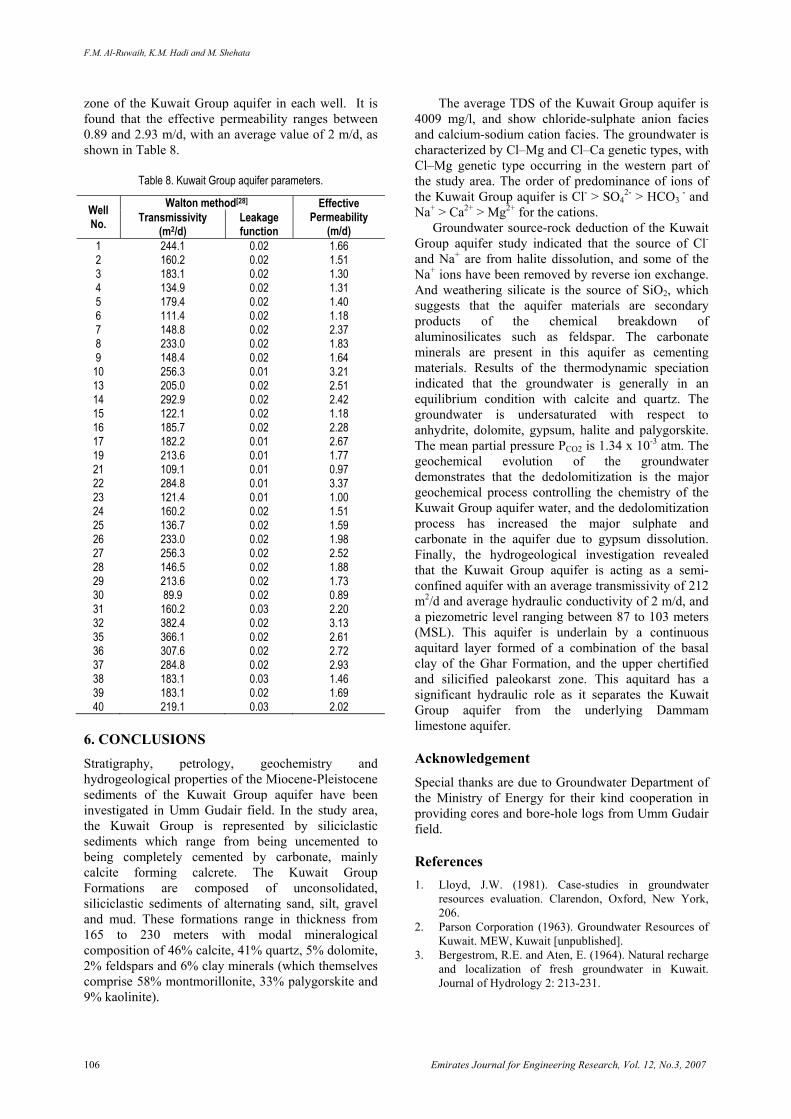
Well No. (9) Kuwait GroupQ = 300 lgpm
r/L = 0.2 x 10 -1
w (u, r/L) = 11 /u = 10 4
s = 3.6 ftt = 114.6 Q / s x w (u , r/L)T = 114.6 x 300 / 3.6 x 1 = 9550 l gpd / ft (142.39 m2 / d)
10-1 100100
101
102
101 102 103
Dra
wd
ow
n (
ft)
T im e (m in )
Figure 12. Time-drawdown curve of well no. 9 of the Kuwait Group using Walton method
Geological, Geochemical and Hydrogeological Investigation of Miocene–Pleistocene Aquifer, Kuwait
Emirates Journal for Engineering Research, Vol. 12, No.3, 2007 105
Table 7. Saturation indices of the Kuwait Group aquifer, Umm Gudair field.
Well No. Anhydrite Calcite Dolomite Gypsum Halite Qaurtz Palygorskite PCO2
1 -0.49 0.33 -0.22 -0.27 -4.65 0.62 -0.70 9.42E-04 2 -0.44 0.41 -0.20 -0.22 -4.85 0.67 -1.04 1.43E-03 3 -0.53 0.60 0.35 -0.31 -4.87 0.67 0.29 7.02E-04 4 -0.49 0.62 0.42 -0.27 0.66 4.76E-04 5 -0.59 0.11 -0.59 -0.37 -4.99 0.63 -1.91 2.77E-03 6 -0.57 0.53 0.22 -0.35 -4.85 0.65 0.40 5.10E-04 7 -0.51 0.35 -0.12 -0.30 -4.67 0.64 -0.79 1.35E-03 8 -0.57 0.31 -0.24 -0.36 -4.86 0.64 -1.07 1.58E-03 9 -0.48 0.42 -0.01 -0.26 -4.89 0.66 -0.58 1.19E-03 10 -0.55 0.50 0.13 -0.33 -4.71 0.64 -0.58 1.31E-03 11 -0.51 0.44 0.03 -0.29 -4.80 0.64 -0.15 7.27E-04 12 -0.60 0.14 -0.57 -0.38 -4.75 0.49 -2.06 1.96E-03 13 -0.59 0.26 -0.26 -0.37 -4.74 0.61 -0.93 1.27E-03 14 -0.46 0.18 -0.50 -0.24 -4.74 0.64 -1.51 1.93E-03 15 -0.57 0.19 -0.48 -0.35 -4.81 0.66 -1.37 1.76E-03 16 -0.55 0.28 -0.25 -0.33 -4.63 0.65 -1.30 1.98E-03 17 -0.52 0.52 0.17 -0.30 -4.83 0.65 -0.04 7.64E-04 18 -0.45 0.26 -0.35 -0.23 -4.74 0.66 -1.24 1.75E-03 19 -0.55 0.37 -0.07 -0.33 -4.72 0.57 -0.85 1.21E-03 20 -0.49 0.33 -0.17 -0.28 -4.86 0.65 -0.94 1.53E-03 21 -0.50 0.27 -0.29 -0.28 -4.78 0.64 -1.37 2.14E-03 22 -0.56 0.22 -0.36 -0.35 -4.90 0.62 -1.21 1.55E-03 23 -0.59 0.52 0.17 -0.38 -4.95 0.62 0.17 5.47E-04 24 -0.59 0.21 -0.39 -0.37 -4.97 0.61 -1.48 1.99E-03 25 -0.73 0.32 -0.04 -0.52 -4.84 0.65 -0.54 1.33E-03 26 -0.58 0.26 -0.31 -0.36 -5.00 0.61 -1.01 1.21E-03 27 -0.60 0.36 -0.06 -0.38 -4.99 0.62 -0.31 8.04E-04 28 -0.54 0.17 -0.42 -0.33 -4.87 0.64 -1.31 1.82E-03 29 -0.66 0.31 -0.23 -0.45 -5.12 0.61 -0.93 1.22E-03 30 -0.62 0.28 -0.24 -0.40 -4.97 0.60 -0.94 1.24E-03 31 -0.52 0.29 -0.25 -0.30 -4.77 0.63 -0.92 1.30E-03 32 -0.60 0.48 0.16 -0.38 -4.97 0.63 -0.28 1.01E-03 33 -0.56 0.29 -0.20 -0.35 -4.98 0.62 -0.80 1.16E-03 36 -0.58 0.31 -0.15 -0.36 -4.90 0.62 -0.80 1.26E-03 37 -0.60 0.13 -0.58 -0.38 -4.94 0.61 -1.52 1.60E-03 38 -0.61 0.27 -0.23 -0.39 -5.05 0.61 -0.93 1.32E-03 39 -0.60 0.26 -0.24 -0.38 -5.04 0.59 -0.94 1.25E-03 40 -0.57 0.25 -0.25 -0.35 -4.86 0.63 -1.08 1.68E-03 41 -0.59 0.49 0.27 -0.37 -4.90 0.65 0.17 8.38E-04
Mean -0.56 0.33 -0.16 -0.34 -4.86 0.63 -0.85 1.34E-03 All groundwater samples from the study area
showed that the groundwater is highly over-saturated with respect to calcite, which indicates that calcite precipitation is one of the geochemical processes operating in the clastic aquifer. However, dedolomitization may occur in aquifers containing limestone or dolostones in combination with gypsiferous layers. As a result of gypsum or anhydrite dissolution, the overall process is that dolomite dissolves and calcite precipitates. The reactions have been deduced in most cases from trends in water chemistry. In an aquifer containing dolomite and calcite, the dedolomitization in its simplest form is the replacement of dolomite by calcite according to the following reaction:
Ca2+ + CaMg(CO3)2 → 2CaCO3 + Mg2+
The average PCO2 of the groundwater equals 1.34 x 10⁻³ atm., which is higher than the PCO2 of the earth’s
atmosphere (10-3.5 atm.). This indicates that the groundwater is supplied with CO2 during the infiltration process and dissolves the carbonate minerals under closed system conditions.
5.3 Aquifer Properties
Pumping test data for 34 wells were selected and analysed to determine aquifer type and hydrogeological properties. By the application of the different analytical methods[27], it was found that 33 wells fit to Walton method[28], and aquifer acts as a semi-confined aquifer as shown in Figure 12, representing well nos. 9, as an example. The aquifer transmissivity ranged between 89.97 and 382.35 m2/d, with an average of 212 m2/d and a leakage function ranges between 0.03–0.01. The effective permeability was calculated using the following equation T = K.b, where T is the transmissivity, K is the effective permeability and b is the thickness of the saturated
F.M. Al-Ruwaih, K.M. Hadi and M. Shehata
106 Emirates Journal for Engineering Research, Vol. 12, No.3, 2007
zone of the Kuwait Group aquifer in each well. It is found that the effective permeability ranges between 0.89 and 2.93 m/d, with an average value of 2 m/d, as shown in Table 8.
Table 8. Kuwait Group aquifer parameters.
Well No.
Walton method[28] Effective Permeability
(m/d) Transmissivity
(m2/d) Leakage function
1 2 3 4 5 6 7 8 9 10 13 14 15 16 17 19 21 22 23 24 25 26 27 28 29 30 31 32 35 36 37 38 39 40
244.1 160.2 183.1 134.9 179.4 111.4 148.8 233.0 148.4 256.3 205.0 292.9 122.1 185.7 182.2 213.6 109.1 284.8 121.4 160.2 136.7 233.0 256.3 146.5 213.6 89.9 160.2 382.4 366.1 307.6 284.8 183.1 183.1 219.1
0.02 0.02 0.02 0.02 0.02 0.02 0.02 0.02 0.02 0.01 0.02 0.02 0.02 0.02 0.01 0.01 0.01 0.01 0.01 0.02 0.02 0.02 0.02 0.02 0.02 0.02 0.03 0.02 0.02 0.02 0.02 0.03 0.02 0.03
1.66 1.51 1.30 1.31 1.40 1.18 2.37 1.83 1.64 3.21 2.51 2.42 1.18 2.28 2.67 1.77 0.97 3.37 1.00 1.51 1.59 1.98 2.52 1.88 1.73 0.89 2.20 3.13 2.61 2.72 2.93 1.46 1.69 2.02
6. CONCLUSIONS Stratigraphy, petrology, geochemistry and hydrogeological properties of the Miocene-Pleistocene sediments of the Kuwait Group aquifer have been investigated in Umm Gudair field. In the study area, the Kuwait Group is represented by siliciclastic sediments which range from being uncemented to being completely cemented by carbonate, mainly calcite forming calcrete. The Kuwait Group Formations are composed of unconsolidated, siliciclastic sediments of alternating sand, silt, gravel and mud. These formations range in thickness from 165 to 230 meters with modal mineralogical composition of 46% calcite, 41% quartz, 5% dolomite, 2% feldspars and 6% clay minerals (which themselves comprise 58% montmorillonite, 33% palygorskite and 9% kaolinite).
The average TDS of the Kuwait Group aquifer is 4009 mg/l, and show chloride-sulphate anion facies and calcium-sodium cation facies. The groundwater is characterized by Cl–Mg and Cl–Ca genetic types, with Cl–Mg genetic type occurring in the western part of the study area. The order of predominance of ions of the Kuwait Group aquifer is Cl- > SO4
2- > HCO3 - and
Na+ > Ca2+ > Mg2+ for the cations. Groundwater source-rock deduction of the Kuwait
Group aquifer study indicated that the source of Cl- and Na+ are from halite dissolution, and some of the Na+ ions have been removed by reverse ion exchange. And weathering silicate is the source of SiO2, which suggests that the aquifer materials are secondary products of the chemical breakdown of aluminosilicates such as feldspar. The carbonate minerals are present in this aquifer as cementing materials. Results of the thermodynamic speciation indicated that the groundwater is generally in an equilibrium condition with calcite and quartz. The groundwater is undersaturated with respect to anhydrite, dolomite, gypsum, halite and palygorskite. The mean partial pressure PCO2 is 1.34 x 10⁻³ atm. The geochemical evolution of the groundwater demonstrates that the dedolomitization is the major geochemical process controlling the chemistry of the Kuwait Group aquifer water, and the dedolomitization process has increased the major sulphate and carbonate in the aquifer due to gypsum dissolution. Finally, the hydrogeological investigation revealed that the Kuwait Group aquifer is acting as a semi-confined aquifer with an average transmissivity of 212 m2/d and average hydraulic conductivity of 2 m/d, and a piezometric level ranging between 87 to 103 meters (MSL). This aquifer is underlain by a continuous aquitard layer formed of a combination of the basal clay of the Ghar Formation, and the upper chertified and silicified paleokarst zone. This aquitard has a significant hydraulic role as it separates the Kuwait Group aquifer from the underlying Dammam limestone aquifer.
Acknowledgement Special thanks are due to Groundwater Department of the Ministry of Energy for their kind cooperation in providing cores and bore-hole logs from Umm Gudair field.
References 1. Lloyd, J.W. (1981). Case-studies in groundwater
resources evaluation. Clarendon, Oxford, New York, 206.
2. Parson Corporation (1963). Groundwater Resources of Kuwait. MEW, Kuwait [unpublished].
3. Bergestrom, R.E. and Aten, E. (1964). Natural recharge and localization of fresh groundwater in Kuwait. Journal of Hydrology 2: 213-231.

Geological, Geochemical and Hydrogeological Investigation of Miocene–Pleistocene Aquifer, Kuwait
Emirates Journal for Engineering Research, Vol. 12, No.3, 2007 107
4. Burdon, D.J. and Al-Sharhan, A. (1968). The problem of the paleokarstic Dammam Limestone aquifer in Kuwait. Journal of Hydrology 6(4): 385-404.
5. Owen, R.M. and Nasr, S.N. (1958). Stratigraphy of the Kuwait-Basrah area. In: Habitat of Oil. American Association of Petroleum Geologists 42: 1252-1278.
6. Lababidi, M.M. and Hamdan, A.N. (1985). Preliminary lithostratigraphic correlation study in OAPEC member countries [unpublished].
7. Beydoun, Z.R. (1984). The geological setting and Tectonic Framework of the Middle East. In: Proceedings of the Seminar on source and Habitat of Petroleum in the Middle East arab Countries. Department of Geology, American University of Beirut, 7-72.
8. Milton, D.I. (1967). Geology of Arabian Peninsula, Kuwait. USGS, USA Prof. Paper: 560-F7.
9. Salman, A.M. (1979). Geology of the Jal Azzor – Aliyah area, Kuwait. M.Sc. Thesis, Kuwait University.
10. Folk, R.L. (1974). Petrology of sedimentary rocks. Hemphery Publication, Austin, Texas.
11. Khalaf, F., Mukhopadhyay, A., and Naji, M. (1989). Geological assessment of the Eocene and Post-Eocene aquifers of Umm-Gudair, Kuwait. KISR Report – 3176, Kuwait [unpublished].
12. Weaver, C.E. (1989). Clays, Muds and Shales. Elsevier, New York, USA, 819.
13. Pasek, J. (1986). A lithological and stratigraphical study of the Eocene and post-Eocene deposits in the Umm-Gudair area in Kuwait. MEW, Kuwait [unpublished].
14. Khalaf, F., Mukhopadhyay, A., Siwek, Z., Naji, M., and Al-Otaibi, M. (1987). Collection and review of available geological data and materials for the Eocene and Post-Eocene aquifers of Umm Gudair, Kuwait. KISR Report 2440, Kuwait [unpublished].
15. Piper, A.M. (1953). A Graphic procedure in the geochemical interpretation of water-analyses. US Geological Survey, Groundwater Note 12.
16. Back, W., 1966. Hydrochemical facies and groundwater flow patterns in north part of Atlantic Coastal Plain. US
17. Schoeller, H. (1962). Les eaux souterraines, Masson & Cie, Paris, 642.
18. Haddad, R.H. (1982). A proposed numerical approach to the classification of groundwater. Journal of the Gulf and Arabian Peninsula Studies 2: 47-68.
19. Collins, A.G. (1975). Geochemistry of oilfield waters. Development in Petroleum Science 1, Elseveir Scientific Publishing Company.
20. Hounslow, A.W. (1995). Water quality data: Analysis and interpretation. CRC Lewis, 397 pp.
21. Deutsh, W. (1997). Groundwater Geochemistry: Fundamentals and applications to contamination. Lewis Publishers, New York, 232.
22. Wigley, T.M.L. (1977). WATSPEC: a computer program for determining the equilibrium speciation of aqueous solutions. Br. Geomorphol. Res. Group Tech. Bulletin 20: 48.
23. Ball, J.W. and Nordstrom, D.K. (1992). User’s manual for WATEQ4F, with revised thermodynamic data base and test case for calculating speciation of major, trace and redox elements in natural waters. USGS, USA. Open-file Report: 91-183.
24. Al-Ruwaih, F.M. and Shehata, M. (1998). The chemical evolution and hydrogeology of Al-Shagaya Field-B, Kuwait. Water International 23: 75-83.
25. Freeze, R. and Cherry, J. (1979). Groundwater. Prentice-Hall, Englewood Cliffs, NJ, 604.
26. Appelo, C.A.J. and Postma, D. (1994). Geochemistry, groundwater and pollution. AA Balkema, Rotterdam.
27. Kruseman, G.P. and De Ridder, N.A. (1990). Analyses and evaluation of pumping test data. 2nd Edition, International Institute for Land Reclamation and Improvement, Wageningen, The Netherlands, 370.
28. Walton, W.C. (1962). Selected analytical methods for well and aquifer evaluation. Illinois State Water Survey Bulletin 49: 81.