Embed Size (px)
Citation preview

Geologic and anthropogenic sources ofcontamination in settled dust of a historicmining port city in northern Chile: healthrisk implications
Joseline S. Tapia1, Jorge Valdes2,3, Rodrigo Orrego2,Andrei Tchernitchin4,5, Cristina Dorador6,7, Aliro Bolados5 andChris Harrod2,8
1 Instituto de Ciencias de la Tierra, Universidad Austral de Chile, Valdivia, Chile2 Instituto de Ciencias Naturales Alexander von Humboldt, Universidad de Antofagasta,
Antofagasta, Chile3 Laboratorio de Sedimentologıa y Paleoambientes LASPAL, Universidad de Antofagasta,
Antofagasta, Chile4 Laboratorio de Endocrinologıa Experimental y Patologıa Ambiental ICBM, Facultad de
Medicina, Universidad de Chile, Santiago, Chile5 Departamento de Medio Ambiente, Colegio Medico de Chile, Santiago, Chile6 Departamento de Biotecnologıa and Instituto Antofagasta, Universidad de Antofagasta,
Antofagasta, Chile7 Centre for Biotechnology and Bioengineering (CeBiB), Antofagasta, Chile8 Nucleo Milenio INVASAL, Concepcion, Chile
ABSTRACTChile is the leading producer of copper worldwide and its richest mineral
deposits are found in the Antofagasta Region of northern Chile. Mining activities
have significantly increased income and employment in the region; however,
there has been little assessment of the resulting environmental impacts to
residents. The port of Antofagasta, located 1,430 km north of Santiago, the capital of
Chile, functioned as mineral stockpile until 1998 and has served as a copper
concentrate stockpile since 2014. Samples were collected in 2014 and 2016 that show
elevated concentrations of As, Cu, Pb, and Zn in street dust and in residents’ blood
(Pb) and urine (As) samples. To interpret and analyze the spatial variability and
likely sources of contamination, existent data of basement rocks and soil
geochemistry in the city as well as public-domain airborne dust were studied.
Additionally, a bioaccessibility assay of airborne dust was conducted and the
chemical daily intake and hazard index were calculated to provide a preliminary
health risk assessment in the vicinity of the port. The main conclusions indicate that
the concentrations of Ba, Co, Cr, Mn, Ni, and V recorded from Antofagasta dust
likely originate from intrusive, volcanic, metamorphic rocks, dikes, or soil within the
city. However, the elevated concentrations of As, Cd, Cu, Mo, Pb, and Zn do not
originate from these geologic outcrops, and are thus considered anthropogenic
contaminants. The average concentrations of As, Cu, and Zn are possibly the highest
in recorded street dust worldwide at 239, 10,821, and 11,869 mg kg-1, respectively.
Furthermore, the contaminants As, Pb, and Cu exhibit the highest bioaccessibilities
and preliminary health risk indices show that As and Cu contribute to elevated
health risks in exposed children and adults chronically exposed to dust in
How to cite this article Tapia et al. (2018), Geologic and anthropogenic sources of contamination in settled dust of a historic mining port
city in northern Chile: health risk implications. PeerJ 6:e4699; DOI 10.7717/peerj.4699
Submitted 5 February 2018Accepted 12 April 2018Published 24 April 2018
Corresponding authorJoseline S. Tapia,
Academic editorTodd Anderson
Additional Information andDeclarations can be found onpage 23
DOI 10.7717/peerj.4699
Copyright2018 Tapia et al.
Distributed underCreative Commons CC-BY 4.0
Antofagasta, whereas Pb is considered harmful at any concentration. Therefore,
an increased environmental awareness and greater protective measures are
necessary in Antofagasta and possibly other similar mining port cities in developing
countries.
Subjects Coupled Natural andHuman Systems, Environmental Contamination and Remediation,
Environmental Impacts
Keywords Copper concentrate, Mining, Polymetallic ores stockpiles, Contaminant source, City
dust, Risk strategies, Hazard index, Human health
INTRODUCTIONThe process of economic development often results in large-scale anthropogenic impacts
to the environment and inhabitants of developing countries. Previous well-reported
examples of environmental pollution caused by industrial activities include: (i) the 1984
Bhopal incident in India after more than 40 tons of methyl isocyanate gas leaked from a
pesticide plant (Broughton, 2005), (ii) Chernobyl, Ukraine, in 1986, after the nuclear
energy plant explosion of Reactor 4 (Devell et al., 1986; Gale, 1987), (iii) the Baia Mare
spill, Romania, in 2000, where nearly 100,000 m3 of cyanide and metal-rich liquid
waste was released into the river system near this city (Lucas, 2001; Soldan et al., 2001), and
(iv) Sukinda, India, where the most harmful form of chromium (Cr[VI]) pollutes water
and inhabitants due to mining activities (Dubey, Sahoo & Nayak, 2001). As such,
industrial incidents have been related to severe health issues and fatalities
(Khan & Abbasi, 1999).
Despite harmful consequences that industry and uncontrolled anthropogenic
activities have caused and are still contributing to (Reddy & Yarrakula, 2016), an
awareness of the environmental impact of these activities is growing in many developing
countries. Chile, a developing country located along the western border of southern
South America, is one example where an environmental awareness has increased with
time on a national scale. Among its developing characteristics is the fact that the country
predominantly relies on the exploration, exploitation, and exportation of mineral
resources as one of its main economic activities (De Solminihac, Gonzales & Cerda,
2017). Although often associated with environmental degradation, these activities
support an elevated gross domestic product (GDP) that has allowed Chile to be included
in the Organization for Economic Co-operation and Development (OECD;
Ruiz-Rudolph et al., 2016).
Antofagasta Region backgroundCopper (Cu) is the most significant metallic resource of Chile: the country has
contributed approximately 28% of the world’s Cu production since 1985 (COCHILCO,
2014). This element is naturally distributed in northern Chile, principally in the
Antofagasta Region (Fig. 1A; Aroca, 2001), where large-to-giant porphyry copper deposits
are found (e.g., Chuquicamata, La Escondida, and Radomiro Tomic, among others;
Tapia et al. (2018), PeerJ, DOI 10.7717/peerj.4699 2/30

Fig. 1B). As such, numerous large-scale mining operations and mineral deposits in the
Antofagasta Region have supported the economic development of the region to the point
where the per capita GDP is the highest in the country.
Following the War of the Pacific (1879–1884), Chile and Bolivia signed a trade
agreement in 1904 which allowed Bolivian products to be exported from the Train
Station and Port of Antofagasta, where resultantly, unprotected stockpiles
containing metals (mainly Pb) became common at those facilities (Sepulveda, Vega
& Delgado, 2000).
It is also important to consider other natural and anthropogenic sources of
contamination in Antofagasta that accompanied heightened mining and a related
increase in population (by a factor of nearly 6.5 between 1895 (13,530 inhabitants;
Censo, 1895) and 1960 (87,860 inhabitants; Censo, 1960)): (i) of the sparse fresh
water sources in the region, the Toconce and Holajar rivers were naturally enriched
in As, resulting in chronic contamination of drinking water until 1970 (Marshall et al.,
2007), and (ii) in the late 1970s, La Negra Industrial Complex was established 33 km
southeast of Antofagasta which included cement production (Industria Nacional de
Cemento SA, Antofagasta, Chile and Inacesa, Antofagasta, Chile), lithium (Li)
processing (Sociedad Chilena del Litio, Antofagasta, Chile and SQM, Antofagasta,
Figure 1 Antofagasta location. Location maps with features, at varying scales. (A) Location of the
Antofagasta Region in northern Chile; (B) Main mineral deposits and mining activities within Anto-
fagasta Region (1, Mantos de la Luna Mine; 2, Michilla Mine; 3, Juanita Mine; 4, Mantos Blancos Mine;
5, La Negra Industrial Complex; 6, Pedro de Valdivia (ex-nitrate mine); 7, El Abra Mine; 8, Radomiro
Tomic, Chuquicamata, and Ministro Hales Mines; 9, Faride, Spence, Sierra Gorda Mines, and Acon-
cagua treatment plant; 10, Esperanza Mine; 11, Zaldıvar and La Escondida Mines; 12, Francke Mine),
and Antofagasta city (black square); (C) Downtown Antofagasta. 1, Port gate; 2, Clınica Antofagasta
(health institution); 3, Parque Brasil (Children’s playground); 4, Commercial center; 5 and 6, Schools
(Liceo de Hombres and Liceo de Ninas, respectively); 7, Housing complex; 8, City Mall; 9, Municipal
square; 10, Hospital (health institution); 11, Fruit and vegetable market; 12, Supermarket. The red circle
represents an area with a 1 km distance (radius) from the port gate.
Full-size DOI: 10.7717/peerj.4699/fig-1
Tapia et al. (2018), PeerJ, DOI 10.7717/peerj.4699 3/30

Chile), and a smelter (Refimet, currently Altonorte of Xstrata Copper;
Minerıa Chilena, 2013).
At the end of 1980s, elevated Pb levels in blood were reported in children attending
schools and living close to the Antofagasta Port and Antofagasta Train Station facilities
(Sepulveda, Vega & Delgado, 2000; Tchernitchin et al., 2006). As a result, in the early 1990s,
the stockpiles of Pb-rich materials originating from Bolivia were transferred to Portezuelo,
18 km southeast of downtown Antofagasta, in close proximity to La Negra Industrial
Complex. Protective measures related to the transport and deposition of concentrate from
Portezuelo to Antofagasta Port were not known to be established prior to 2010 (Chilean
Ministry of Transport and Telecommunications (MTT), 2015).
Combined lung and bladder cancer mortality rates in the Antofagasta Region were
the highest reported for the whole country between 1992 and 1994 (153 and 50 per
100,000 men and women, respectively), attributable to the chronic ingestion of As
between 1958 and 1970 (Marshall et al., 2007). In 2014, despite documented adverse
health impacts to the population of Antofagasta and relocation of the Bolivian
stockpiles, the development of Cu, Mo, and Ag exploitation in the Sierra Gorda
district, 140 km northeast of the city of Antofagasta (Fig. 1B; Minerıa Chilena, 2014),
led to the construction of a holding facility inside the Antofagasta Port called the
galpon (warehouse), located close to the center of the city, which currently stores
Chilean Cu concentrate. Aside from Cu (nearly 32%), the concentrate contains other
elements such as S, Fe, Zn, As, Pb, Mo, Sb, and Cd (Table 1 in Fuentes, Vinals &
Herreros, 2009). As port operations continued, local inhabitants noticed the increase
of dust on buildings etc., which led to criticism of the operations associated with
the galpon and the port. As a result, social organizations were established, such as
Este polvo te mata (“This dust kills you”), leading to ongoing environmental conflicts
within the city.
Currently, the city of Antofagasta has 361,873 inhabitants (Instituto Nacional de
Estadısticas (INE), 2017), which is nearly four times greater than the 1960 population
(Censo, 1960). The city has grown and developed around the port (Fig. 1C); as a result,
5.7% of the national state load and 17.3% of all regional transport passes through the port
(Chilean Ministry of Transport and Telecommunications (MTT), 2015). Important
locations situated near the Antofagasta Port include the downtown area of Antofagasta,
hospitals, schools, preschools, the municipal square, the city shopping mall, and
commercial centers (Fig. 1C).
Previous sampling campaignsDue to increased social pressure associated with the Antofagasta dust, in 2014, the
Chilean State sampled city dust and human blood and urine from locations in close
proximity to, and up to 9 km distance from the Antofagasta Port (Table 1).
Contaminant concentrations were quantified in the <63 mm size fraction by the Chilean
Public Health Institute (Instituto de Salud Publica (ISP), 2014). Elevated levels of
Pb in blood and of As in urine were found in children attending preschools close to
Tapia et al. (2018), PeerJ, DOI 10.7717/peerj.4699 4/30

the Antofagasta Port, and elevated concentrations of a number of elements were also
reported in street dust, including As, Cu, Pb, and Zn (Vergara, 2015). More recently, the
Chilean College of Physicians (CM-Colegio Medico) undertook another sampling
campaign in 2016 to compare concentrations with the values from 2014 for determining
which contaminants were still present in the <63 mm size fraction of dust (Tchernitchin
& Bolados, 2016). Details regarding the methodologies used in these previous studies are
found in Table 2.
Table 1 Sampling sites.
Sample Location Year Institution UTM E UTM N Elevation (m.a.s.l) AP (km)
1 Grecia/Salvador Reyes 2014 ISP 356925 7382802 10 0.62
2 Grecia/Salvador Reyes 2014 ISP 356925 7382802 10 0.62
3 Grecia 1816/21 Mayo 2014 ISP 356973 7383725 8 0.31
4 Grecia/21 Mayo 2014 ISP 357075 7383834 11 0.45
5 Uribe/Balmaceda Pabellon 1 2014 ISP 357008 7384065 9 0.65
6 Uribe/Balmaceda Pabellon 1 2014 ISP 357008 7384065 9 0.65
7 Uribe/Pabellon 2 2014 ISP 357025 7384049 10 0.64
8 Uribe/Pabellon 2 2014 ISP 357025 7384049 10 0.64
9 Uribe/Pabellon 3 2014 ISP 357049 7384024 10 0.62
10 Uribe/Pabellon 3 2014 ISP 357049 7384024 10 0.62
11 Uribe/Washington Pabellon 4 2014 ISP 357062 7384012 10 0.61
12 Uribe/Washington Pabellon 4 2014 ISP 357062 7384012 10 0.61
13 MOP building in front of the Port 2014 ISP 356969 7383667 7 0.26
14 MOP building inside in front of the Port 2014 ISP 356988 7383637 8 0.24
15 Liceo Tecnico in front of the Port 2014 ISP 357027 7383797 11 0.40
16 Colegio Tecnico, frontis 2014 ISP 356996 7383771 10 0.37
17 Edificio Colectivo Argentina 2014 ISP 357023 7383850 10 0.45
21 Edificio Colectivo Peru 1er piso 2014 ISP 357027 7383967 10 0.56
22 Edificio Colectivo Peru 2o piso 2014 ISP 357017 7384003 10 0.59
23 14 de Febrero/Edmundo Perez Zujovic 2014 ISP 357560 7386404 12 3.10
24 Av. Edmundo Perez Zujovic 7344 2014 ISP 357968 7389089 14 5.77
25 Av. Edmundo Perez Zujovic 8126-9114 2014 ISP 357562 7389860 13 6.47
26 Colegio San Agustın 2014 ISP 357568 7390407 8 7.02
27 Condominio Jardines del Norte VI 2014 ISP 357514 7392555 18 9.15
AF-1 Jardın Infantil Semillita 2016 CM 357072 7383698 9 0.33
AF-2 Jardın Infantil Semillita 2016 CM 357072 7383698 9 0.33
AF-3 Ex Liceo Tecnico A14 2016 CM 356986 7383759 9 0.35
AF-4 Lice Tecnico A14 2016 CM 357071 7383760 10 0.38
AF-5 Lice Tecnico A14 2016 CM 357071 7383790 11 0.41
AF-6 Liceo Marta Narea A1 2016 CM 357128 7383791 12 0.44
AF-7 Liceo Marta Narea A1 2016 CM 357156 7383822 12 0.48
Notes:Summary of street dust sampling locations: name of streets, sampling years, sampling institutions, UTM coordinates (WGS-84), and elevations (m.a.s.l.). AP, distance tothe Antofagasta Port in kilometers (km).
Tapia et al. (2018), PeerJ, DOI 10.7717/peerj.4699 5/30

Study objectivesDespite the recent 2014 and 2016 sampling events, no analyses were conducted to evaluate
and understand the spatial distribution, variation, and sources associated with health risks
by exposure to these metallic and metalloid (As) contaminants apart from their
bioaccessibility. Also, regardless of well-reported improvements in the technology used to
transport and store material inside the Antofagasta Port (Chilean Ministry of Transport
and Telecommunications (MTT), 2015), currently there is little evidence that the
environmental issues and negative health impacts on Antofagasta residents have
improved, and regulations have not been put into effect to control the contamination.
Therefore, considering the need to better understand and establish (i) the spatial-
temporal variability of the present contaminants, (ii) the likely source of contamination
through the comparison of natural background concentrations, (iii) human health risk
standards associated with exposure to the dust from the Antofagasta Port, and (iv) the
bioaccessibility of the contaminant elements, a health risk assessment and
bioaccessibility assay were conducted, and raw data collected in 2014 (ISP, 2014) and
2016 (Tchernitchin & Bolados, 2016) was further interpreted and analyzed to improve
the understanding of pollution in Antofagasta and better inform regulators and
interested parties in the support of new environmental policies and regulations.
METHODOLOGYData compilationInformation related to the elemental concentrations of metals was compiled from
previous studies of (i) street dust and (ii) the composition of geologic outcrops, weathered
products, and soil in the area of Antofagasta.
Table 2 Summary of analytical methodologies utilized in previous studies.
Detection limit (mg · kg-1) Instrument Laboratory
As Ba Cd Co Cr Cu Mn Mo Ni Pb V Zn
Antofagasta Dust
ISP (2014) 1.0 1.0 1.0 1.0 1.0 1.0 1.0 1.0 1.0 1.0 1.0 1.0 ICP ISP, Chile
Tchernitchin & Bolados
(2016)
1.7 2.1 1.0 0.8 1.8 2.1 2.5 0.9 2.2 2.1 0.7 3.2 ICP-OES CENMA, Chile
Rocks of Antofagasta
Lucassen & Franz (1994) N/A Major elements XRF and
trace element ICP
TU-Berlin
Oliveros et al. (2007) 1.0 3.0 0.4 0.2 4.0 0.2 3.9 0.5 4.0 1.2 1.5 8.0 ICP-AES and ICP-MS CRPG, France
Rogers & Hawkesworth
(1989)
N/A Major elements ED XRF and
trace elements WD XRF
Open University and
Nottingham University
Soil/sediments
CENMA (2014) 14.6 8.9 1.8 2.4 4.6 1.0 8.5 8.3 1.4 3.7 1.5 2.7 ICP-OES CENMA, Chile
De Gregori et al. (2003) N/A FAAS (Cu), HG-AFS (As) N/A
Notes:Antofagasta dust, ISP (2014) and Tchernitchin & Bolados (2016); rocks, Lucassen & Franz (1994), Oliveros et al. (2007), and Rogers & Hawkesworth (1989); soil andsediments, CENMA (2014) and De Gregori et al. (2003); N/A, information not provided.
Tapia et al. (2018), PeerJ, DOI 10.7717/peerj.4699 6/30
Antofagasta street dustStarting 1993, leaded fuels were banned by law in Santiago, Chile (Faiz, Weaver & Walsh,
1996), as well as in other regions of the country thereafter. In medium- to low-size coastal
cities of Chile, such as Tocopilla, located at 175 km north of Antofagasta, it has been
shown that vehicle emissions do not significantly contribute to ambient particulate matter
(PM) concentrations in the city (Jorquera, 2009). Therefore, street dust in urban areas
of Antofagasta is considered to be an indicator of metal and metalloid contamination
from atmospheric deposition, and public dust samples from a number of key city
locations were compiled from ISP (2014) and CM (Tchernitchin & Bolados, 2016)
(Tables 1 and 2). These sampling data are simply reported from those sources and
reinterpreted in the context of other factors such as the background geology, which
depending on the host rock mineral composition, can weather and contribute to increased
concentrations of the same contaminant elements.
Geologic outcrops, weathered products, and soil
The main geologic formations of Antofagasta correspond to Jurassic volcanic basic to
intermediate rocks of the La Negra Formation and Neogene marine sedimentary rocks of
La Portada Formation, constituted by sandstones and coquinas, of which the latter is a
form of limestone represented by an agglomerate of shells (National Service of Geology and
Mining Service (SERNAGEOMIN), 2003). Concentrations of As, Ba, Cd, Co, Cr, Cu, Fe,
Mn, Mo, Ni, Pb, V, and Zn of volcanic, intrusive, metamorphic rocks, and dikes of
Antofagasta were compiled from Lucassen & Franz (1994), Oliveros et al. (2007), and
Rogers & Hawkesworth (1989) (Fig. 2A). In addition, unpublished data (As and Mo) from
Oliveros et al. (2007) was utilized. Element concentrations from sedimentary rocks of the
La Portada Formation were not available, however the composition of soil, an exogenous
matrix associated with the weathering of parent rocks, was obtained from De Gregori et al.
(2003; two soils around Antofagasta) and CENMA (2014; 15 background samples and two
contaminated samples from Antofagasta). A brief summary of the methodologies used in
these studies is presented in Table 2.
Data analysisSpatial distribution of the geologic outcrops and dust samplesThe spatial distribution of regional volcanic, intrusive, metamorphic rocks, dikes, and
soils was plotted using the Geographic Information System QGIS (2.6.1 Brighton)
software (Fig. 2A). Local-scale surficial geology (1:50,000), provided by the program
Geologıa para el Ordenamiento Territorial de Antofagasta of the National Service of Geology
and Mining (Servicio Nacional de Geologıa y Minerıa National Service of Geology and
Mining Service (SERNAGEOMIN), 2014), was used to plot the distribution of Antofagasta
dust samples and their corresponding relationship to the geologic outcrops (Fig. 2B).
Metal and metalloid statisticsTo determine basic characteristics of the As, Ba, Cd, Cr, Cu, Mn, Mo, Ni, Pb, V, and
Zn data, univariate statistics (e.g., mean, standard deviation, median, minimum,
maximum, lower, and upper limit of confidence interval (95%)) were calculated in
Tapia et al. (2018), PeerJ, DOI 10.7717/peerj.4699 7/30
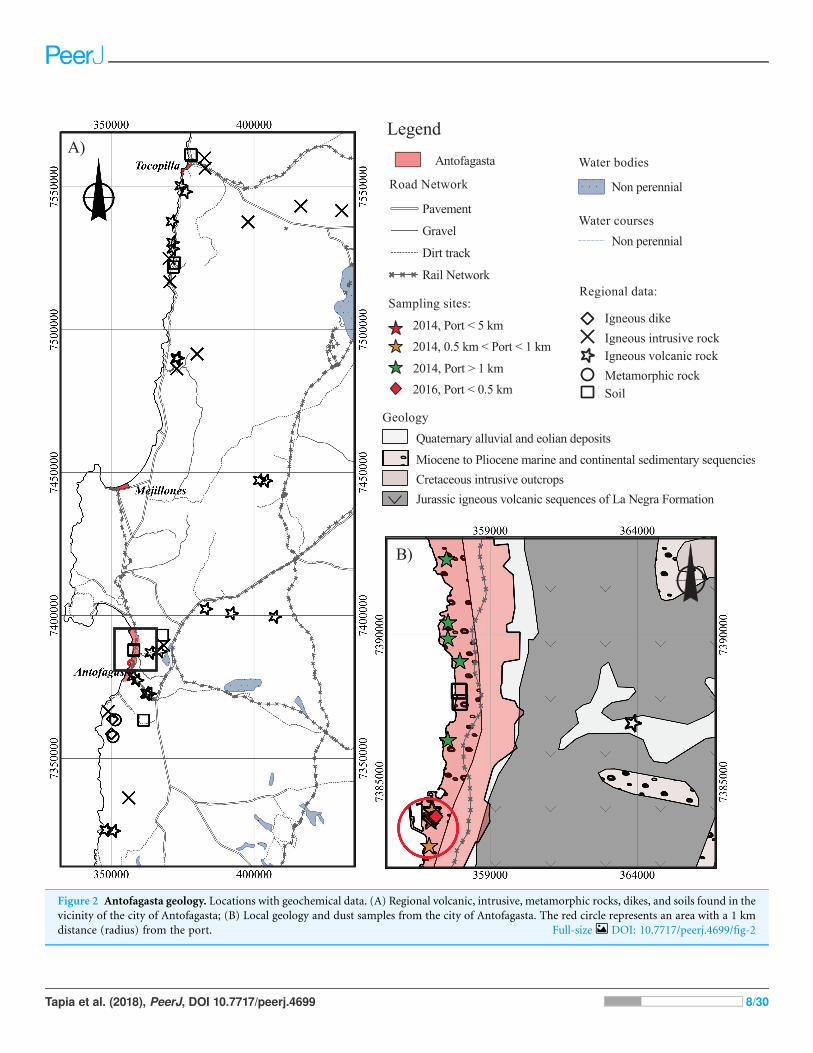
Figure 2 Antofagasta geology. Locations with geochemical data. (A) Regional volcanic, intrusive, metamorphic rocks, dikes, and soils found in the
vicinity of the city of Antofagasta; (B) Local geology and dust samples from the city of Antofagasta. The red circle represents an area with a 1 km
distance (radius) from the port. Full-size DOI: 10.7717/peerj.4699/fig-2
Tapia et al. (2018), PeerJ, DOI 10.7717/peerj.4699 8/30

SYSTAT (Systat Software, San Jose, CA, USA). Principal component analysis (PCA) was
conducted on loge(x + 1)-transformed, normalized data in PRIMER 7 (Clarke & Gorley,
2006). In addition, comparisons to the upper continental crust (UCC; from Rudnick &
Gao, 2003) are also presented.
Geo-accumulation index and enrichment factor
To infer contaminant elements and sources of street dust, numerous studies have utilized
the geoaccumulation index (Igeo; Eq. (1); e.g., Lu et al., 2009; Li et al., 2013) and
enrichment factor (EF; Eq. (2); e.g., Zoller, Gladney & Duce, 1974; Lu et al., 2009),
respectively.
Igeo ¼ log2Cn
1:5� Bn
� �(1)
In Eq. (1), Cn corresponds to the measured concentration of metal n in the sediment and
Bn is the local background value of the metal n. A factor of 1.5 was used for possible
variations of the local background due to variable lithologies (Muller, 1979; Nowrouzi &
Pourkhabbaz, 2014). The local background value (Bn) of each metal was obtained from
volcanic, intrusive, metamorphic rocks, dikes, and soils in the region. Specific values of
the Igeo index indicate the following:
Igeo � 0, the sample is not contaminated;
0 < Igeo � 1, the sample is non- to slightly contaminated;
1 < Igeo � 2, the sample is moderately contaminated;
2 < Igeo � 3, the sample is moderately to highly contaminated;
3 < Igeo � 4, the sample is highly contaminated;
4 < Igeo � 5, the sample is highly to extremely contaminated;
Igeo > 5, the sample is extremely contaminated.
Enrichment factors (Eq. (2)) were calculated using the geochemical composition
of basement rocks and soil of Antofagasta, with Fe as the normalizing
element.
EF ¼ M1
Eref1=M2
Eref2(2)
In Eq. (2), EF is equivalent to the Enrichment Factor (Zoller, Gladney & Duce, 1974).
M1 is the metal or metalloid concentration in the sample, Eref1 is the reference element
in the sample (Fe), M2 is the background concentration of the metal or metalloid, and
Eref2 is the background concentration of the reference element (Fe in intrusive, volcanic,
metamorphic rocks, dikes, and soil of Antofagasta). Fe, Al, or Ti have been used as
reference elements in previous studies (Rule, 1986; Ergin et al., 1991; Tapia et al., 2012);
however, Fe was chosen as the reference element here because it was the only conservative
element present in all of the utilized data sets.
Tapia et al. (2018), PeerJ, DOI 10.7717/peerj.4699 9/30

Health risk assessmentTo obtain a preliminary health risk assessment associated with exposure to Antofagasta
dust, the chemical daily intake (CDI; Eq. (3)) of the studied elements was calculated
by ingestion exposure while considering the start of the galpon and chronic exposure as
two and 70 years, respectively. Dust consumption and body weight were obtained from
the United States Environmental Protection Agency (1989a).
CDIingestion ¼ C � IngR� Efreq � Edur
BW� AT(3)
In Eq. (3), CDIingestion corresponds to the chemical daily intake (in mg · kg-1 · day-1),while C is the 95% confidence upper limit of the metal or metalloid concentration (in
mg · kg-1), IngR is the dust ingestion rate (200 mg · day-1 for children under six and
100 mg · day-1 for adults), Efreq is the exposure frequency (days · year-1), Edur is theexposure duration (years), BW is the average body weight, and AT is the average time of
exposure (ED� 365 days for non-chronic exposure; 70� 365 days for chronic exposure).
As suggested by the United States Environmental Protection Agency (1989a) the hazard
index by oral ingestion (HIingestion; Eq. (4)) of the Antofagasta dust was preliminarily
obtained using the CDIingestion and reference doses (RfD) from literature (As: United
States Environmental Protection Agency (1991a); Ba: Dallas & Williams (2001); Cd: United
States Environmental Protection Agency (1989b); Co: Finley et al. (2012); Cr(VI): United
States Environmental Protection Agency (1998); Mo: United States Environmental
Protection Agency (1992); Ni (soluble salts of Ni): United States Environmental Protection
Agency (1991a); V: Risk Assessment Information System (RAIS) (1991); Zn: United States
Environmental Protection Agency (2005)). For Cu, the HIingestion was obtained with the
minimal risk level (MRL; ATSDR, 2004), and for Pb, the HIingestion was not calculated
because the RfDPb (Pb reference dose) does not exist given that Pb is considered toxic at
any concentration (United States Environmental Protection Agency, 2004).
HIingestion¼CDIingestion
RfD(4)
In Eq. (4), HIingestion is the hazard index (by ingestion), CDIingestion is the chemical
daily intake (by ingestion), and RfD is the reference dose (United States Environmental
Protection Agency, 1989a). The greater the value of HI above unity (1), the greater the level
of concern. Therefore HI � 1 suggests unlikely adverse health effects whereas HI > 1
suggests the probability of adverse health effects (Luo et al., 2012; Massey, Kulshrestha &
Taneja, 2013). For As, in the case of HI > 1, health effects have been related to cellular
necrosis and cancer (United States Environmental Protection Agency, 1991b).
Bioaccessibility assayHealth effects caused by exposure to the different components of dust mainly occur by
ingestion of small-sized PM. Fine and ultrafine particles (smaller than 2.5mm in diameter;
�PM2.5) present a health risk due to their entrance into the bloodstream from lung
alveoli, whereas larger particles (>PM2.5) are momentarily retained in the bronchi and
Tapia et al. (2018), PeerJ, DOI 10.7717/peerj.4699 10/30
bronchiole and are then expelled from the cilia of epithelial cells in the respiratory tract.
Subsequently, these particles are swallowed, and once in the stomach, gastric hydrochloric
acid at pH 2.0 partially solubilize components which constitute the bioaccessible fraction
of the dust used to estimate the amount available for absorption across the gastrointestinal
barrier (Bradham et al., 2017). Therefore, a higher bioaccessibility of a contaminant
element signifies that a larger fraction will enter the human bloodstream.
To compliment the health risk assessment, a bioaccessibility assay was performed at three
sites close to the Antofagasta Port. Following existent methodologies (Cortes et al., 2015),
this assay was performed in the dust fraction of a diameter less than 63 mm (mesh #230).
Dust was digested with chloridric acid at a pH of 2 and a temperature of 37 �C, for 2 hours,in order to resemble the digestive conditions of the human stomach. Three replicates were
used for every sample and the standard recovery varied between 82% and 98%. Elements
within the digested residue were quantified by ICP-OES.
RESULTSStatistical summary and spatial variationCompared to the UCC mean concentrations (Rudnick & Gao, 2003; Table 3),
Antofagasta dust concentrations of Co, Cr, Mn, and V from 2014 and 2016 were similar,
whereas Ba and Ni were lower. These elements also exhibited a lower relative standard
deviation (s O mean � 100) when compared to the mean concentration of all considered
data. This variability ranged from 21% to 69% for V and Ba, respectively (Table 3).
Comparing concentrations from 2014 and 2016 at locations within a 0.5 km distance from
the Antofagasta Port, mean values of Ba (+96%), Co (+71%), Ni (+33%), and V (+32%)
increased, and Cr (-3%) and Co (-3%) showed a slight decrease.
The elements As, Cd, Cu, Mo, Pb, and Zn showed mean concentrations that were 2 (As,
Mo, and Pb) and 3 (Cd, Cu, and Zn) orders of magnitude higher than the UCC. They also
displayed the highest relative standard deviations when all data were considered, ranging
from 91% for Cu and Zn to 120% for Pb (Table 3). Concentrations of As (-49%), Cu
(-17%), and Pb (-87%) showed a significant decrease in their mean values between 2014
and 2016, while Cd (+44%), Mo (+72%), and Zn (+56%) showed increased mean
concentrations within a 0.5 km radius of the Antofagasta Port (Table 3). Despite the high
observed variability in element concentrations of the Antofagasta dust, the highest
concentration values of As, Cd, Cu, Mo, Pb, and Zn were evident near the facility (Fig. 3).
Negative Pearson correlations between these elements and distance to the Antofagasta
Port range between -0.28 and -0.43 (considering all data), indicating that the element
concentrations decreased with distance from the port (Table 3). The elements Co, Ni, and
V showed slightly higher values near Antofagasta Port that are different from Ba, Cr, and
Mn which tended to increase as a function of distance from the port. However, all
concentrations are within the same order of magnitude. For these elements, Pearson
correlations are lower than 0.57 (Table 3).
Finally, the PCA of the data identified two main associations. These were related to
samples located less than 0.5 km and greater than 0.5 km away from the Antofagasta Port
(Fig. 4).
Tapia et al. (2018), PeerJ, DOI 10.7717/peerj.4699 11/30

Table
3Basic
statisticalsummaryofAntofagasta
dust.
Distance
toAP
(km)
nMean
(mg·kg-1)
s (mg·kg-1)
Relative
s%
Median
(mg·kg-1)
Ran
ge
(mg·kg-1)
95%
confidence
limits
(mg·k
g-1)
Correlation
todistance
toAP
2016–2014
(mg·k
g-1)
UCC
(mg·kg-1)
Element/
UCC
As
<0.5
14
376
347
92
272
127
1492
175
577
-0.46
-186
4.8
78
0.5–1
12
148
99
67
117
42
350
81
194
-0.63
–31
>1
577
14
18
72
68
101
40
94
0.18
–16
<0.5
to>1
31
239
269
112
175
42
1492
141
338
-0.28
–50
Ba
<0.5
14
216
136
63
234
27
418
137
294
0.33
207
624
0.3
0.5–1
12
112
71
63
113
30
264
67
157
-0.71
–0.2
>1
5293
132
45
225
198
510
129
457
0.50
–0.5
<0.5
to>1
31
188
129
69
181
27
510
141
236
0.39
–0.3
Cd
<0.5
14
81
37
46
77
22
151
59
102
-0.25
35
0.09
895
0.5–1
12
20
13
68
18
452
11
28
-0.48
–221
>1
56
117
64
74
7-0
.56
–63
<0.5
to>1
31
45
42
93
28
4151
30
60
-0.43
–500
Co
<0.5
14
22
14
61
21
964
15
30
0.00
16
17.3
1.3
0.5–1
12
12
434
11
620
914
0.01
–0.7
>1
515
18
15
13
15
13
16
-0.76
–0.8
<0.5
to>1
31
17
11
62
15
664
13
21
-0.13
–1.0
Cr
<0.5
14
62
12
19
62
47
82
55
69
-0.68
-292
0.7
0.5–1
12
46
12
25
43
28
76
38
53
-0.04
–0.5
>1
594
15
16
93
71
110
76
112
-0.95
–1.0
<0.5
to>1
31
61
20
33
55
28
110
53
68
0.57
0.7
Cu
<0.5
14
17914
9897
55
16114
6725
46898
12199
23628
-0.62
-3044
28
640
0.5–1
12
6103
5059
83
4735
1103
17047
2889
9317
-0.61
–218
>1
52287
187
82188
2153
2601
2054
2519
-0.06
–82
<0.5
to>1
31
10821
9816
91
7874
1103
46898
7221
14422
-0.40
–386
Mn
<0.5
14
540
183
34
550
20
771
435
646
-0.20
-18
774
0.7
0.5–1
12
475
98
21
485
280
643
412
537
0.28
–0.6
>1
5675
66
10
683
590
761
594
756
0.70
–0.9
<0.5
to>1
31
537
153
28
545
20
771
481
593
0.40
–0.7
Mo
<0.5
14
128
70
55
147
12
227
88
169
-0.11
93
1.1
117
0.5–1
12
35
48
135
15
5156
566
-0.74
–32
>1
522
29
22
19
24
19
25
0.87
–20
<0.5
to>1
31
75
74
98
31
5227
48
102
-0.33
–68
(Continued
)
Tapia et al. (2018), PeerJ, DOI 10.7717/peerj.4699 12/30

Table
3(continued
).
Distance
toAP
(km)
nMean
(mg·kg-1)
s (mg·kg-1)
Relative
s%
Median
(mg·kg-1)
Ran
ge
(mg·kg-1)
95%
confidence
limits
(mg·k
g-1)
Correlation
todistance
toAP
2016–2014
(mg·k
g-1)
UCC
(mg·kg-1)
Element/
UCC
Ni
<0.5
14
33
929
37
44
17
27
38
0.01
11
47
0.7
0.5–1
12
23
11
49
20
11
46
16
30
-0.50
–0.5
>1
532
516
30
26
38
26
39
-0.61
–0.7
<0.5
to>1
31
29
11
36
30
11
46
25
33
0.06
–0.6
Pb
<0.5
14
1071
1091
102
739
28
3968
441
1700
-0.71
-936
17
63
0.5–1
12
518
481
93
412
109
1924
212
824
-0.49
–30
>1
5164
31
19
165
125
209
125
203
-0.87
–10
<0.5
to>1
31
710
852
120
486
28
3968
398
1023
-0.30
–42
V<0.5
14
104
23
22
106
57
138
91
117
0.21
33
97
1.1
0.5–1
12
86
17
20
87
58
113
75
97
0.01
–0.9
>1
590
89
93
77
97
80
100
0.86
–0.9
<0.5
to>1
31
95
20
21
94
57
138
87
102
-0.07
–1.0
Zn
<0.5
14
20351
10378
51
18320
4792
40062
14359
26343
-0.15
11392
67
304
0.5–1
12
6022
3943
65
4721
2029
15868
3517
8527
0.04
–90
>1
52155
653
30
2102
1513
3149
1344
2965
-0.46
–32
<0.5
to>1
31
11869
10743
91
6543
1513
40062
7929
15810
-0.41
–177
Notes:Number
ofdata(n),mean,standarddeviation(s),relative
s(s
Omean�
100),median,range,lower
andupper
95%
confidence
interval.Allvalues
arein
mg·kg-
1.AP,Antofagastaport;
Antofagastadustdatafrom
CM
(Tchernitchin
&Bolados,2016)andISP(2014);UCC,upper
continentalcrustvalues
(Rudnick&
Gao,2003).
Tapia et al. (2018), PeerJ, DOI 10.7717/peerj.4699 13/30

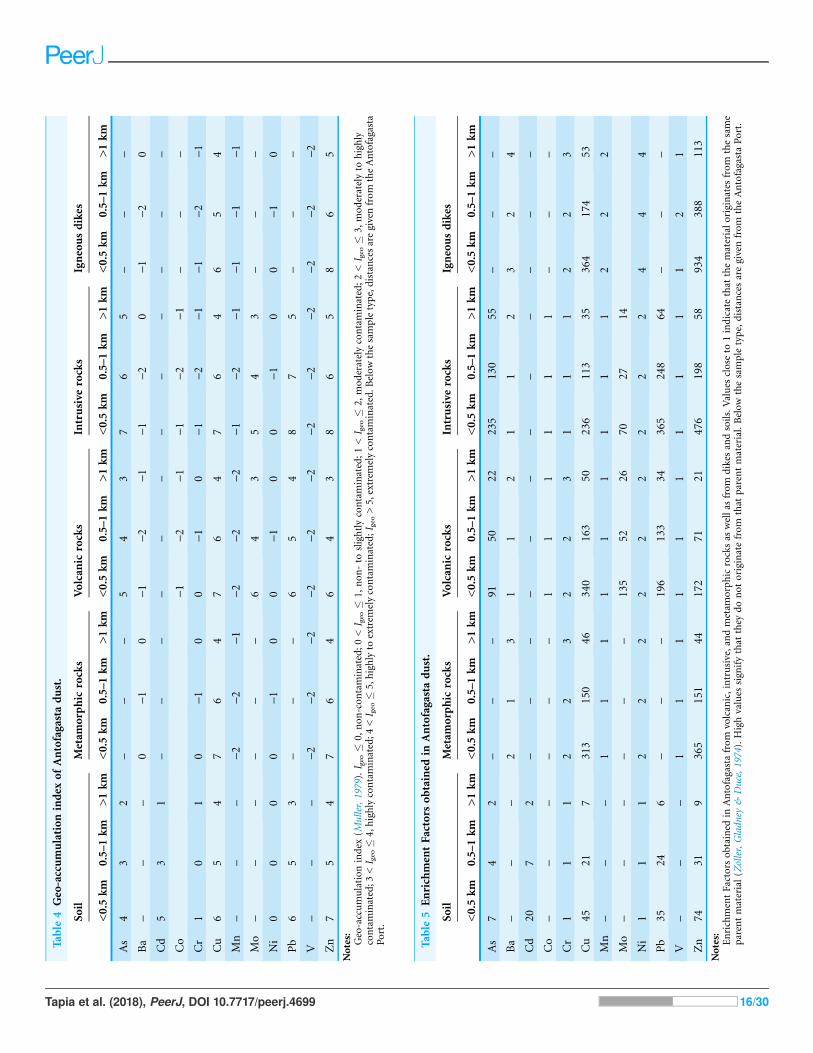
Contaminants and sourcesResults for the Igeo index (Muller, 1979) are shown in Table 4. Two groups are clearly
observed: the non-contaminants, including Ba, Co, Cr, Mn, Ni, and V, and the
contaminants, which include As, Cd, Cu, Mo, Pb, and Zn. With the exception of As indices
calculated with a soil background, all elements classified as contaminants are considered
extreme contaminants within a 0.5 km distance from the Antofagasta Port (Table 4).
The EF results are summarized in Table 5. The same elements classified as non-
contaminants exhibit low EFs (generally lower than 3), indicating that they likely originate
from volcanic, intrusive, metamorphic rocks, dikes, or soils within the immediate areas of
Antofagasta. Conversely, contaminant elements exhibit higher EFs near the port, which
G)
< 0.5 0.5 – 1 > 1
102
103
104
As (
mg
kg-1)
H = 15.7, P = 0.0004
101
102
103
104
Pb (m
g kg
-1)
< 0.5 0.5 – 1 > 1
J)H = 12.7, P = 0.0018
K)
102
103
Mo
(mg
kg-1)
< 0.5 0.5 – 1 > 1
H = 12.3, P = 0.002E)
101
102
Ni (
mg
kg-1)
< 0.5 0.5 – 1 > 1
H = 4.8, P = 0.09
D)
102
103
Mn
(mg
kg-1)
< 0.5 0.5 – 1 > 1
H = 10.1, P = 0.006
102
103
Ba (m
g kg
-1)
< 0.5 0.5 – 1 > 1
A) H = 8.4, P = 0.014
H)
101
102
103
Cd
(mg
kg-1)
< 0.5 0.5 – 1 > 1
H = 21.7, P = 0.00002B)
101
102
Co
(mg
kg-1)
< 0.5 0.5 – 1 > 1
H = 9.2, P = 0.01
101
102
103
Cr (m
g kg
-1)
< 0.5 0.5 – 1 > 1
C) H = 18.1, P = 0.0001
Distance from port (km)
F)
102
V (m
g kg
-1)
< 0.5 0.5 – 1 > 1
H = 5.3, P = 0.07
Distance from port (km)
I)
103
104
105
Cu
(mg
kg-1)
< 0.5 0.5 – 1 > 1
H = 18.8, P = 0.00008
Distance from port (km)
L)
104
105
Zn (m
g kg
-1)
< 0.5 0.5 – 1 > 1
H = 20.7, P = 0.00003
Distance from port (km)
Figure 3 Box plots of Antofagasta dust. Element concentrations versus distance from the Antofagasta Port (AP). The box–whisker plots show the
variation in metal concentrations in street dust samples collected at various locations in Antofagasta based on their relative distance from the Port of
Antofagasta (nb: in the box–whisker plots, the center vertical line shows the median value, while the length of each box shows the range within
which the central 50% of the values fall, with the box edges showing the first and third quartiles (the interquartile range). Whiskers show values that
the range of observed values that fall within 1.5 the interquartile range. The y-axis shows a log10-scale which differs between individual figures).
Test statistics reflect results of the Kruskal–Wallis non-parametric ANOVA. (A) barium; (B) cobalt; (C) chromium; (D) manganese; (E) nickel;
(F) vanadium; (G) arsenic; (H) cadmium; (I) copper; (J) lead; (K) molybdenum; (L) zinc. Full-size DOI: 10.7717/peerj.4699/fig-3
Tapia et al. (2018), PeerJ, DOI 10.7717/peerj.4699 14/30

suggests that the source is not related to the geology of Antofagasta and is more
concentrated close to this facility (Table 5).
Health risk assessment and bioaccessibility of dustThe CDIs and HIs related to Antofagasta dust ingestion are summarized in Table 6.
As previously defined, if a child between zero and six years of age ingests 200 mg · day-1 ofAntofagasta dust, on average, during two years of exposure (or from the start of operation
of the galpon), the HIs related to As and Cu are elevated at all sampling points, even 3 km
away from the Antofagasta Port. Conversely, Cd and Zn represent a low hazard 1 and
0.5 km from the port, respectively (Table 6B). For adults living in Antofagasta with a mean
body mass of 70 kg that consume 100 mg · day-1 of dust, on average, over 70 years
(signifying chronic exposure), As and Cu are moderately hazardous elements within
0.5 km of the port and slightly hazardous within 1 km of the facility (Table 6B). With the
exception of Pb, which does not have a RfD value, given that it is highly hazardous at any
concentration (United States Environmental Protection Agency, 2004), the elements Ba, Co,
Cr, Mn, Mo, Ni, and V are not considered harmful to infants and adults.
Results of the mean bioaccessibility of contaminant elements at three sites close to the
port are presented in Table 7. It is apparent that As has the highest bioaccessibility (50%),
signifying that it can more readily enter the human bloodstream in comparison to the
< 0.5 km0.5 – 1 km
> 1 km
Distance from port:
-6 -4 -2 0 2 4 6PC1 (50 % of variation)
-4
-2
0
2
4
As
Ba
Cd
Co
Cu
Cr
Mn
MoNi
Pb
V
Zn
PC2
(19
% o
f var
iatio
n)
Figure 4 Principal component analysis of Antofagasta dust. Principal component analysis (PCA)
ordination including vectors showing relative correlation strength between principal components (PCs)
and concentrations of different metals in street dust collected in Antofagasta. The circles are filled with
distinct colors to show their relative proximity to the main gate of the Port of Antofagasta.
Full-size DOI: 10.7717/peerj.4699/fig-4
Tapia et al. (2018), PeerJ, DOI 10.7717/peerj.4699 15/30
Table
5EnrichmentFactors
obtained
inAntofagasta
dust.
Soil
Metam
orphic
rocks
Volcan
icrocks
Intrusive
rocks
Igneousdikes
<0.5
km
0.5–1km
>1km
<0.5
km
0.5–1km
>1km
<0.5
km
0.5–1km
>1km
<0.5
km
0.5–1km
>1km
<0.5
km
0.5–1km
>1km
As
74
2–
––
91
50
22
235
130
55
––
–
Ba
––
–2
13
11
21
12
32
4
Cd
20
72
––
––
––
––
––
––
Co
––
––
––
11
11
11
––
–
Cr
11
12
23
22
31
11
22
3
Cu
45
21
7313
150
46
340
163
50
236
113
35
364
174
53
Mn
––
–1
11
11
11
11
22
2
Mo
––
––
––
135
52
26
70
27
14
Ni
11
12
22
22
22
22
44
4
Pb
35
24
6–
––
196
133
34
365
248
64
––
–
V–
––
11
11
11
11
11
21
Zn
74
31
9365
151
44
172
71
21
476
198
58
934
388
113
Notes:EnrichmentFactorsobtained
inAntofagastafrom
volcanic,intrusive,andmetam
orphicrocksas
wellas
from
dikes
andsoils.Values
close
to1indicatethat
thematerialoriginates
from
thesame
parentmaterial(Zoller,Gladney
&Duce,1974).Highvalues
signifythat
they
donotoriginatefrom
that
parentmaterial.Belowthesampletype,distancesaregivenfrom
theAntofagastaPort.
Table
4Geo-accumulationindex
ofAntofagasta
dust.
Soil
Metam
orphic
rocks
Volcan
icrocks
Intrusive
rocks
Igneousdikes
<0.5
km
0.5–1km
>1km
<0.5
km
0.5–1km
>1km
<0.5
km
0.5–1km
>1km
<0.5
km
0.5–1km
>1km
<0.5
km
0.5–1km
>1km
As
43
2–
––
54
37
65
––
–
Ba
––
–0
-10
-1-2
-1-1
-20
-1-2
0
Cd
53
1–
––
––
––
––
––
–
Co
-1-2
-1-1
-2-1
––
–
Cr
10
10
-10
0-1
0-1
-2-1
-1-2
-1Cu
65
47
64
76
47
64
65
4
Mn
––
–-2
-2-1
-2-2
-2-1
-2-1
-1-1
-1Mo
––
––
––
64
35
43
––
–
Ni
00
00
-10
0-1
00
-10
0-1
0
Pb
65
3–
––
65
48
75
––
–
V–
––
-2-2
-2-2
-2- 2
-2-2
-2-2
-2-2
Zn
75
47
64
64
38
65
86
5
Notes:Geo-accumulationindex
(Muller,1979).I geo
�0,non-contaminated;0<I geo
�1,non-to
slightlycontaminated;1<I geo
�2,moderatelycontaminated;2<I geo
�3,moderatelyto
highly
contaminated;3<I geo�
4,highlycontaminated;4<I geo�
5,highlyto
extrem
elycontaminated;I geo>5,extrem
elycontaminated.Belowthesampletype,distancesaregivenfrom
theAntofagasta
Port.
Tapia et al. (2018), PeerJ, DOI 10.7717/peerj.4699 16/30

other contaminant elements. The highest bioaccessibility of As is followed by Pb (26%),
Cu (20%), Zn (16%), and Cd (10%), whereas Mo does not present a heightened potential
of bioaccessibility (Table 7).
Table 6 Chemical daily intake and Hazard Index of Antofagasta dust.
(A) CDI: chemical daily intake (ingestion)
95% confidence upper limit
(mg · kg-1)Two year exposure Lifetime exposure
CDI CDI CDI CDI CDI CDI
(mg · kg-1day-1) (mg · kg-1day-1)
<0.5 km 0.5–1 km >1 km <0.5 km 0.5–1 km >1 km <0.5 km 0.5–1 km >1 km
As 577 194 94 0.007 0.002 0.001 0.001 0.000 0.000
Ba 294 157 457 0.004 0.002 0.006 0.000 0.000 0.001
Cd 102 28 7 0.001 0.000 0.000 0.000 0.000 0.000
Co 30 14 16 0.000 0.000 0.000 0.000 0.000 0.000
Cr 69 53 112 0.001 0.001 0.001 0.000 0.000 0.000
Cu 23628 9317 2519 0.295 0.116 0.031 0.034 0.013 0.004
Mn 646 537 756 0.008 0.007 0.009 0.001 0.001 0.001
Mo 169 66 25 0.002 0.001 0.000 0.000 0.000 0.000
Ni 38 30 39 0.000 0.000 0.000 0.000 0.000 0.000
Pb 1700 824 203 0.021 0.010 0.003 0.002 0.001 0.000
V 117 97 100 0.001 0.001 0.001 0.000 0.000 0.000
Zn 26343 8527 2965 0.329 0.107 0.037 0.038 0.012 0.004
(B) HI: hazard index (ingestion)
RfD
(mg · kg-1day-1)Two year exposure Lifetime exposure
HI HI HI HI HI HI
<0.5 km 0.5–1 km >1 km <0.5 km 0.5–1 km >1 km
As RfD 0.0003 24 9 4 3 1 0
Ba RfD 0.0700 0 0 0 0 0 0
Cd RfD 0.0010 1 1 0 0 0 0
Co RfD 0.0300 0 0 0 0 0 0
Cr RfD [Cr(VI)] 0.0030 0 0 0 0 0 0
Cu MRL 0.0100 30 12 3 3 1 0
Mn RfD 0.1400 0 0 0 0 0 0
Mo RfD 0.0050 0 0 0 0 0 0
Ni RfD 0.0200 0 0 0 0 0 0
Pb – – – – – – – –
V RfD 0.0070 0 0 0 0 0 0
Zn RfD 0.3000 1 0 0 0 0 0
Notes:Chemical daily intake and Hazard Index. Values above 1 indicate health issue risks (Luo et al., 2012). RfD: reference dose(references of RfD values are in the text).
Tapia et al. (2018), PeerJ, DOI 10.7717/peerj.4699 17/30

DISCUSSIONSComparison to worldwide city dustThe results of this analysis of existing street dust data from Antofagasta indicate that
As, Cd, Cu, Mo, Pb, and Zn are contaminants and their notably high concentrations
are not related to the geochemistry of outcrops or soil of the city. To compare these
results in a national and international context, the mean and standard deviation of these
contaminants and the non-contaminant elements (Ba, Co, Cr, Mn, Ni, and V) were
compared to: (i) dust accumulated in Platanus orientalis leaves of the main east–west
highway of Santiago (Alameda), the capital of Chile (13 sites, Tapia et al., 2009),
(ii) resuspended dust from Fushun, China (17 dust samples collected from unfrequently
cleaned windowsills or plat floors), a coal-based city (Kong et al., 2011), (iii) street dust
from Baoji, an important industrial city in Northwest China which has experienced a
rapid urbanization and industrialization during the last decades (Lu et al., 2009),
(iv) street dust from Zhuzhou, a heavily industrialized city in central China
(Li et al., 2013), (v) dust from the industrial area of Qingshan district (QS) in Wuhan,
China, one of the largest metropolises in that country (Zhu et al., 2013), and (vi) road dust
Table 7 Bioaccessibility of Antofagasta dust.
AFA-237 AFA-238 AFA-239 Mean
bioaccessibility (%)
Detection
limit
(mg · kg-1)
Quantification
limit (mg · kg-1)Reference
material
recovery (%)
Port Gate Window in
front of the
galpon
Building
Coordinates UTM E 356907 356899 357208
UTM N 7383395 7383305 7384279
As Total (mg · kg-1) 243 92 85 50 1.7 5.5 81.6
Bioaccessible (mg · kg-1) 27 58 65
% of bioaccessibility 11 63 76
Cd Total (mg · kg-1) 62 34 17 10 1.0 3.4 83.2
Bioaccessible (mg · kg-1) 2 2 3
% of bioaccessibility 3 6 21
Cu Total (mg · kg-1) 15246 4157 3737 20 2.1 6.9 95.4
Bioaccessible (mg · kg-1) 78 1024 1342
% of bioaccessibility 1 25 36
Mo Total (mg · kg-1) 197 31 14 0 0.9 3.0 87.8
Bioaccessible (mg · kg-1) 0 0 0
% of bioaccessibility 0 0 0
Pb Total (mg · kg-1) 666 371 335 26 2.1 7.0 89.4
Bioaccessible (mg · kg-1) 4 127 146
% of bioaccessibility 1 34 44
Zn Total (mg · kg-1) 19692 8821 3021 16 3.2 10.6 98.1
Bioaccessible (mg · kg-1) 49 941 1135
% of bioaccessibility 0 11 38
Note:Bioaccessibility assay of three dust samples located in close proximity to the Antofagasta Port.
Tapia et al. (2018), PeerJ, DOI 10.7717/peerj.4699 18/30

from the Islamabad Expressway (Faiz et al., 2009), one of the busiest roads in the capital of
Pakistan (Table 8).
The concentrations of the contaminants As, Cu, and Zn in Antofagasta dust are
strikingly high in comparison to street or urban dusts from heavily industrialized cities
of Chile, China, or Pakistan. Mn and Mo concentrations are similar to Santiago city
dust, while Pb and Cd concentration values are lower and comparable, respectively, to
Zhouzhou dust. On the contrary, resuspended dust from the coal-based city of Fushun
contains the highest values of Co, Cr, and Ni, and dust from the industrial QS district
presents the highest concentrations of Ba (Table 8).
Anthropogenic sources of contaminationBased on the results of this study, there exists a strong correlation in Antofagasta between
elevated concentrations of several key contaminants and their proximity to the
Antofagasta Port. This indicates that materials stored in the port represent a source of As,
Cd, Cu, Mo, Pb, and Zn that is measurable in Antofagasta city dust. In Table 4, these
contaminants show higher Igeo values near the port; therefore, contamination increases
close to the facility. In addition, their EFs were higher near the port (Table 5). This
relationship is not shown by the non-contaminant elements (Tables 4 and 5), as some of
their EFs are equal to 1, indicating that Ba might originate from volcanics, Co from
volcanics or intrusives, Cr from intrusives or soil, Mn from metamorphic, volcanic, or
intrusive rocks, Ni from soil, and V from all rocks of the city (Table 5). Conversely, EFs
obtained for As, Cd, Cu, Mo, Pb, and Zn were generally greater than 20, indicating that
their sources cannot be from rocks and soil present in the city (Table 5). To support this
conclusion, other studies conducted in marine environments of the Bay of Antofagasta
have showed that enrichment of metals such as Cu, Pb, and Zn in coastal waters, bottom
Table 8 City dust from Antofagasta.
Chile China Pakistan
Antofagasta
(mg · kg-1)Santiago (mg · kg-1) Fushun (mg · kg-1) Baoji (mg · kg-1) Zhuzhou (mg · kg-1) QS (mg · kg-1) Islamabad
(mg · kg-1)
As 239 ± 269 12 ± 1.9 – – 89 ± 183 32 ± 20 –
Ba 188 ± 129 411 ± 124 – – – 1,610 ± 984 –
Cd 45 ± 42 0.8 ± 0.19 – – 41 ± 117 2.8 ± 1.8 5.0 ± 1.0
Co 17 ± 11 11 ± 2.3 139 ± 179 – 13 ± 11 20 ± 12 –
Cr 61 ± 20 38 ± 11 5,334 ± 10,667 – 125 ± 54 172 ± 96 –
Cu 10,821 ± 9,816 669 ± 567 149 ± 177 123 ± 43 139 ± 148 213 ± 180 52 ± 18
Mn 573 ± 153 619 ± 109 – – – – –
Mo 75 ± 74 73 ± 27 – – 6.4 ± 12.4 7.2 ± 3.9 –
Ni 29 ± 11 24 ± 6.4 302 ± 555 49 ± 30 40 ± 16 38 ± 14 23 ± 6
Pb 710 ± 852 127 ± 50 – 408 ± 296 956 ± 2,815 336 ± 191 104 ± 29
V 95 ± 20 54 ± 11 14.6 ± 4.1 – – – –
Zn 11,869 ± 10,743 943 ± 411 – 715 ± 320 2,379 ± 5,145 1,250 ± 889 116 ± 35
Notes:City dust from Antofagasta (ISP, 2014; Tchernitchin & Bolados, 2016) and Santiago (Tapia et al., 2009), Chile; Fushun (Kong et al., 2011), Baoji (Lu et al., 2009), Zhuzhou(Li et al., 2013), and the Qingshan district (QS) in Wuhan (Zhu et al., 2013), China; and the Islamabad Expressway in Pakistan (Faiz et al., 2009).
Tapia et al. (2018), PeerJ, DOI 10.7717/peerj.4699 19/30

sediments, and benthic organisms are related to industrial activities developed along the
coastal border of the bay (Salamanca et al., 2000; Lepez, Furet & Aracena, 2001; Salamanca,
Jara & Rodrıguez, 2004; Valdes et al., 2010, 2011, 2014, 2015; Calderon & Valdes, 2012).
As potential sources of anthropogenic contamination, Chilean Cu concentrates and
Bolivian stockpiles are addressed individually in the two following subsections.
Cu concentrate
Chilean Cu concentrates are notably rich in As, containing on average from 1% or
10,000 mg · kg-1 (Cantallopts, 2015) to 2.5% or 25,000 mg · kg-1 (Herreros et al., 2003) ofthis metalloid, indicating that the Cu concentrate stored in the Antofagasta Port
represents an important source of As. Indeed, the average As in Antofagasta dust
(239 mg · kg-1) represents only 2.4% of the average As concentration of Chilean Cu
concentrate (10,000 mg · kg-1).The Sierra Gorda Mine, which is situated within a Cu–Mo porphyry deposit (Brunetti,
2011), produces 120,000 tons of Cu, 50 million pounds of Mo, and 10 million pounds of
Au each year (Sierra Gorda website), meaning that the Cu concentrates of this mine
(and the materials stored in the galpon) are rich in Mo. This is supported by the fact that
many of the most important porphyry copper deposits of Chile exploit Mo as a
byproduct; for instance, there has been an average of (i) 9,212 tons every year, since 1997,
of Mo in the concentrate of Chuquicamata and Radomiro Tomic and (ii) 8,572 tons, since
2000, in the concentrate of Los Pelambres (COCHILCO, 2016). Chilean porphyries can
also be related to Zn anomalies (e.g., La Escondida; Garza, Titley & Pimentel, 2001).
Therefore, Cu concentrate stored in the Antofagasta Port likely also acts as a source of the
high concentrations of As, Mo, and Zn recorded in street dust.
Bolivian stockpilesThe elementary concentrations of stockpiles from Bolivia that were stored in the port until
the 1990s are unknown, yet they contained Pb and Zn (El Mercurio, 2010). This reflects the
fact that Bolivian mineral deposits are typically polymetallic. For instance, Cerro Rico
from Potosı was the largest silver (Ag) deposit known and is associated with base minerals
such as cassiterite (SnO2), sphalerite ((Zn,Fe)S), and galena (PbS); the San Cristobal
District contains 2.0 oz · t-1 Ag, 1.67% Zn, and 0.58% Pb with minerals such as galena,
sphalerite, pyrite (FeS2), and chalcopyrite (CuFeS2); and Pulacayo hosts minerals such as
sphalerite, tetrahedrite ((Cu,Fe)12Sb4S13), freibergite ((Ag,Cu,Fe)12(Sb,As)4S13),
argentiferous galena, and chalcopyrite (Kamenov, Macfarlane & Riciputi, 2002). These
polymetallic mineral ores are related to Pb, Zn, and Cu, which could explain the presence
of these elements in dust sampled in close proximity to the Antofagasta Port. In addition,
minerals containing Zn, Pb, and Cu are natural sources of Cd (ATSDR, 2012), which could
explain its enrichment near the Antofagasta Port.
Health riskThe bioaccessibility of dust components was investigated in solid materials (i.e., mud and
sediment) of Chanaral, Atacama Region (300 km south of Antofagasta), an environment
similar to Antofagasta, revealing that the bioaccessibility percentages of some
Tapia et al. (2018), PeerJ, DOI 10.7717/peerj.4699 20/30
contaminant elements range from: 26% to 49% for As, 24% to 84% for Cu, 67% to 96%
for Pb, and 19% to 79% for Zn (Cortes et al., 2015). In the case of the three sites studied in
relation to dust of the Antofagasta Port (Table 7), As is highly bioaccessible (50%),
followed by Pb (26%) and Cu (20%). These significant bioaccessibilities are supported by
the fact that As and Cu show the highest HIs in the street dust (Table 6B).
The health effects of chronic exposure to toxic metals and metalloids are well-known.
For example, following chronic exposure of 30 or more years to As, the probability of
mortality increases dramatically due to lung and bladder cancers. In addition, prenatal or
infant exposure to low levels of these elements, through the mechanism of epigenetic
imprinting, can cause irreversible biochemical changes that promote the development of
various organic diseases or neurobehavioral alterations in later years (Tchernitchin et al.,
2013; Tchernitchin & Gaete, 2015). Also, the prenatal exposure to As increases the
probability of mortality due to bronchiectasis between the ages of 30–49 years (Smith &
Steinmaus, 2009); prenatal or infant exposure to Pb affects reproductive functions,
decreases intelligence, and causes serious neurobehavioral changes in later stages of life
(Tchernitchin et al., 2013).
Recommendations and considerationsStreet dust from Antofagasta likely represents the highest recorded concentrations of As,
Cu, and Zn in city dust worldwide. This result is not surprising, given that Chile is the
most important producer of Cu, Chilean ores, and concentrates, acting as a plentiful
source of As, Mo, and to a lesser extent Zn. Mining development in Chile continues to be
predominant; for example, La Negra Industrial Complex has grown to 200 ha and 120
companies, including a Cu smelter. Previous studies, such as Ruiz-Rudolph et al. (2016),
show that Chilean communes with this type of facility suffer higher mortality rates.
Although the Antofagasta Port is an important employer in the city, storing Cu
concentrate and polymetallic stockpiles there for long-term periods is not appropriate due
to health concerns. These materials have caused disease in children in the past (Sepulveda,
Vega & Delgado, 2000) and continue to cause elevated concentrations of pollutants in
children’s blood and urine (Vergara, 2015). The results of sampling show that street dust
contains concentrations of dangerous contaminants that are high enough to threaten the
health of people (especially children) living and working in close proximity to Antofagasta
Port. A precautionary measure previously undertaken as of 2010 for some concentrates
stored in Portezuelo is that they have been and are now transported to the Antofagasta
Port by hermetically sealed and cleaned trucks (Chilean Ministry of Transport and
Telecommunications (MTT), 2015). Nonetheless, once stationary in Antofagasta,
concentrates could be displaced by wind that moves preferentially in the SW direction;
hence, special attention must be paid to the dispersion of contaminants from concentrates
and stockpiles to the NE, especially during windy days.
As seen in resuspended dust from Fushun, China, some elements can be highly
accumulated in dust (e.g., Cr 5,334 ± 10,667 mg · kg-1; Kong et al., 2011), especially whenit is from long-term uncleaned surfaces. Antofagasta is located within the world’s driest
desert, and as such, there is a very low probability for rain to remove dusts. Cleaning
Tapia et al. (2018), PeerJ, DOI 10.7717/peerj.4699 21/30

surfaces with wet mops twice a month and frequently washing children’s hands in locations
close to the port are precautionary measures that can be taken on an individual level to
prevent the ingestion of city dust, lowering Pb values in blood (Charney et al., 1983).
As a long-term goal, existing, and prospective developments located in close proximity to
the port should consider the high risk of contamination and develop relevant strategies to
minimize exposure to contaminated dust. Operations within the port itself should be
modified (through regulations, safety guidelines, and practical measures). Additionally, it
will be important for the regional and national governments to invest in suitable health care
(e.g., the training of specialists and development of suitable medical facilities).
The future management and prevention of contamination in Antofagasta could also be
strengthened by the implementation of a local high-quality geochemistry laboratory that
allows for fast, efficient, and accurate measurements of contaminants through the
utilization of specific environmental matrices where pollutant speciation can be efficiently
determined. Considering that the mining industry will continue to be a profitable venture
in Chile that provides jobs and income as other commodities become extensively
exploited in this region (e.g., Li), the implementation and management of a laboratory of
this type is necessary in this growing and highly contaminated city and region.
Finally, it is important to note that the contamination and problems described are
likely not restricted to Antofagasta, or to Chile. Wherever metals are extracted, stored, and
transported, there is a risk that workers and the public can be exposed to contamination
and it is important that this is recognized by all parties. Chile is rapidly moving toward the
status of a developed country, however environmental protection measures have not yet
developed at the same rate as its economy. Industrial regulations must ensure safe levels of
pollutants as is defined in the Constitution of Chile which states that Chilean citizens
“have the right to live in a contamination-free environment” (Gobierno de Chile, 1980).
CONCLUSIONSMain conclusions related to Antofagasta dust contamination are summarized below while
considering the local geology, health risks, and bioaccessibility of the contaminant elements.
These items are followed by potential short- and long-term recommendations and
considerations that could reduce associated adverse health impacts to Antofagasta residents.
1. Street dust from the city of Antofagasta in northern Chile contains Ba, Co, Cr, Mn,
Ni, and V that likely originate from intrusive, volcanic, metamorphic rocks, dikes, or
soil of the city.
2. Antofagasta city dust is contaminated with As, Cd, Cu, Mo, Pb, and Zn, and
this contamination likely originates from the Antofagasta Port (an anthropogenic
source).
3. The mean concentrations of As (239 mg · kg-1), Cu (10,821 mg · kg-1), and Zn
(11,869 mg · kg-1) are likely the highest in street dust worldwide.
4. Heightened bioaccessibility in Antofagasta dust was found for As, Cu, and Pb,
indicating that comparatively high fractions could be absorbed into the human
bloodstream.
Tapia et al. (2018), PeerJ, DOI 10.7717/peerj.4699 22/30

5. The bioaccessibility and hazard indices indicate that As, Cu, and Pb in dust represent a
health risk to children or adults chronically exposed to Antofagasta dust.
Potential recommendations and considerations include:
1. Short term:
○ Discussions with regulators and relevant parties in industry regarding the
significance of the results in relation to the city’s occupants. Prospective
developments and businesses in close proximity to the Antofagasta Port should be
fully aware of the risk of contamination.
○ Houses and children living in close proximity to the Antofagasta Port should be
constantly cleaned to avoid dust ingestion.
2. Long term:
○ Stricter regulations on a national or regional level should be adopted to reduce dust-
borne contamination. Also, businesses, schools, and prospective developments in
close proximity to the port should develop relevant long-term strategies to minimize
exposure to contaminated dust.
○ Polymetallic stockpiles and Cu concentrates should not be kept in the Antofagasta
Port for long-term periods.
○ Investments should be made in medical training and infrastructure to properly
remedy potential health impacts.
○ The implementation of a real-time monitoring program and high-quality
geochemistry laboratory should be considered to improve the quantification of
contaminant elements and their speciation in Antofagasta dust.
ACKNOWLEDGEMENTSThis study would have not been possible without help from the following: Veronica
Oliveros and collaborators for facilitating the access to unpublished data (from Oliveros
et al., 2007), Mario Pereira Acevedo and Manuel Arenas of the Servicio Nacional de
Geologıa y Minerıa for providing 1:50,000 Antofagasta maps (National Service of Geology
and Mining Service (SERNAGEOMIN), 2014), the Instituto de Salud Publica and Colegio
Medico for providing dust data (ISP, 2014; Tchernitchin & Bolados, 2016), Brandon
Schneider for English improvement, and Isel Cortes and CENMA for laboratory quality
control information. We also thank David Massey and two anonymous reviewers for their
valuable comments and suggestions.
ADDITIONAL INFORMATION AND DECLARATIONS
FundingJ. Tapia benefited from the CONICYT “Programa de Insercion en la Academia”
(PAI-79150070). C. Harrod is supported by Nucleo Milenio INVASAL funded by Chile’s
Tapia et al. (2018), PeerJ, DOI 10.7717/peerj.4699 23/30

government program, Iniciativa Cientıfica Milenio from Ministerio de Economıa,
Fomento y Turismo. The funders had no role in study design, data collection and analysis,
decision to publish, or preparation of the manuscript.
Grant DisclosuresThe following grant information was disclosed by the authors:
CONICYT “Programa de Insercion en la Academia”: PAI-79150070.
Nucleo Milenio INVASAL.
Chile’s government program, Iniciativa Cientıfica Milenio from Ministerio de Economıa,
Fomento y Turismo.
Competing InterestsThe authors declare that they have no competing interests.
Author Contributions� Joseline S. Tapia conceived and designed the experiments, analyzed the data,
contributed reagents/materials/analysis tools, prepared figures and/or tables, authored
or reviewed drafts of the paper, approved the final draft.
� Jorge Valdes analyzed the data, authored or reviewed drafts of the paper, approved the
final draft.
� Rodrigo Orrego analyzed the data, authored or reviewed drafts of the paper, approved
the final draft.
� Andrei Tchernitchin conceived and designed the experiments, performed the experiments,
analyzed the data, contributed reagents/materials/analysis tools, prepared figures and/or
tables, authored or reviewed drafts of the paper, approved the final draft, sampling.
� Cristina Dorador analyzed the data, authored or reviewed drafts of the paper, approved
the final draft.
� Aliro Bolados conceived and designed the experiments, performed the experiments,
analyzed the data, contributed reagents/materials/analysis tools, authored or reviewed
drafts of the paper, approved the final draft, sampling.
� Chris Harrod conceived and designed the experiments, analyzed the data, contributed
reagents/materials/analysis tools, prepared figures and/or tables, authored or reviewed
drafts of the paper, approved the final draft.
Data AvailabilityThe following information was supplied regarding data availability:
Tapia, Joseline; Valdes, Jorge; Orrego, Rodrigo; Tchernitchin, Andrei; Dorador,
Cristina; Bolados, Aliro; Harrod, Chris (2018): Raw_data.ods. figshare. Dataset. https://
doi.org/10.6084/m9.figshare.5844366.v1.
Supplemental InformationSupplemental information for this article can be found online at http://dx.doi.org/
10.7717/peerj.4699#supplemental-information.
Tapia et al. (2018), PeerJ, DOI 10.7717/peerj.4699 24/30

REFERENCESAroca P. 2001. Impacts and development in local economies based on mining: the case of the
Chilean II region. Resources Policy 27(2):119–134 DOI 10.1016/S0301-4207(01)00013-7.
ATSDR. 2004. ATSDR—toxicological profile: copper. Available at https://www.atsdr.cdc.gov/
ToxProfiles/tp.asp?id=206&tid=37 (accessed 22 March 2018).
ATSDR. 2012. ATSDR—public health statement: cadmium. Available at https://www.atsdr.cdc.gov/
phs/phs.asp?id=46&tid=15 (accessed 29 January 2018).
Bradham KD, Nelson CM, Kelly J, Pomales A, Scruton K, Dignam T, Misenheimer JC, Li K,
Obenour DR, Thomas DJ. 2017. Relationship between total and bioaccessible lead on
children’s blood lead levels in urban residential Philadelphia soils. Environmental Science &
Technology 51(17):10005–10011 DOI 10.1021/acs.est.7b02058.
Broughton E. 2005. The Bhopal disaster and its aftermath: a review. Environmental Health
4(1):6 DOI 10.1186/1476-069X-4-6.
Brunetti P. 2011. Geologıa, Alteracion y Mineralizacion del Yacimiento Tipo Porfido Cuprıfero
Pampa Lina, Distrito Sierra Gorda, Region Antofagasta. Memoria para optar al tıtulo de geologa
Thesis. Santiago: Universidad de Chile. Available at http://repositorio.uchile.cl/handle/2250/
104305 (accessed 10 September 2016).
Calderon C, Valdes J. 2012. Contenido de metales en sedimentos y organismos bentonicos de la
bahıa San Jorge, Antofagasta, Chile. Revista de biologıa marina y oceanografıa 47(1):121–133
DOI 10.4067/S0718-19572012000100011.
Cantallopts J. 2015. Chile en el mercado de los concentrados de cobre: Elementos para un analisis
estrategico. Available at http://www.revistaquimica.cl/wp-content/uploads/2015/12/Chile-en-el-
mercado-de-concentrados-de-cobre.-J-Cantallopts1.pdf (accessed 25 June 2016).
CENMA. 2014. Diagnostico regional de suelos abandonados con potencial presencia de
contaminantes. Available at http://www.cenma.cl/Pagina%20web-LQA/4-Gesti%C3%B3n%20de%
20SPPC/2014-FNDR%20Antofagasta-INFORME%20FINAL.pdf (accessed 15 March 2016).
Censo. 1895. Sesto censo jeneral de la poblacion de Chile. Available at http://www.memoriachilena.
cl/602/w3-article-82450.html (accessed 12 April 2016).
Censo. 1960. Poblacion del paıs, Caracterısticas basicas de la poblacion. Available at http://www.
memoriachilena.cl/602/w3-article-86206.html (accessed 12 April 2016).
Charney E, Kessler B, Farfel M, Jackson D. 1983. Childhood lead poisoning.New England Journal
of Medicine 309(18):1089–1093 DOI 10.1056/NEJM198311033091804.
Clarke KR, Gorley RN. 2006. PRIMER v6: User Manual/Tutorial. Plymouth: Plymouth Marine
Laboratory.
Chilean Ministry of Transport and Telecommunications (MTT). 2015. Comision especial
investigadora de la actuacion de los organismos publicos encargados de la salud y medio
ambiente en la Comuna de Antofagasta. Available at https://www.camara.cl/pdf.aspx?
prmID=32851&prmTIPO=DOCUMENTOCOMISION (accessed 15 December 2017).
COCHILCO. 2014. Estadısticas—Produccion Minera. Available at http://www.cochilco.cl:4040/
boletin-web/ (accessed 8 July 2016).
COCHILCO. 2016. Anuario de estadısticas del cobre y otros minerales 1997-2016. Available at
https://www.cochilco.cl/Paginas/Estadisticas/Publicaciones/Anuario.aspx (accessed 10
September 2017).
Cortes I, Rıos J, Gaete L, Tchernitchin A. 2015. Metales pesados en muestras ambientales de la
Region de Atacama. Situacion postaluviones. In: Abstracts XIV Chilean Geological Conference:
Tapia et al. (2018), PeerJ, DOI 10.7717/peerj.4699 25/30

Geology for the 21st century, La Serena, Chile, 302–305. Available at http://biblioteca.sernageomin.
cl/opac/DataFiles/14905_v3_pp_302_305.pdf.
Dallas CE, Williams PL. 2001. Barium: rationale for a new oral reference dose. Journal of
Toxicology and Environmental Health Part B: Critical Reviews 4(4):395–429
DOI 10.1080/109374001753146216.
De Gregori I, Fuentes E, Rojas M, Pinochet H, Potin-Gautier M. 2003. Monitoring of copper,
arsenic and antimony levels in agricultural soils impacted and non-impacted by mining
activities, from three regions in Chile. Journal of Environmental Monitoring 5(2):287–295
DOI 10.1039/b211469k.
De Solminihac H, Gonzales LE, Cerda R. 2017. Copper mining productivity: lessons from Chile.
Journal of Policy Modeling 40(1):182–193 DOI 10.1016/j.jpolmod.2017.09.001.
Devell L, Tovedal H, Bergstrom U, Appelgren A, Chyssler J, Andersson L. 1986. Initial
observations of fallout from the reactor accident at Chernobyl. Nature 321(6067):192–193
DOI 10.1038/321192a0.
Dubey CS, Sahoo BK, Nayak NR. 2001. Chromium (VI) in waters in parts of Sukinda Chromite
Valley and health hazards, Orissa, India. Bulletin of Environmental Contamination and
Toxicology 67(4):541–548 DOI 10.1007/s001280157.
El Mercurio. 2010. Urgentes medidas por contaminacion en “Ruta del Plomo” en Antofagasta. El
Mercurio de Antofagasta. Available at http://www.mercurioantofagasta.cl/prontus4_noticias/site/
artic/20100729/pags/20100729000523.html (accessed 8 July 2016).
Ergin M, Saydam C, Basturk O, Erdem E, Yoruk R. 1991. Heavy metal concentrations in
surface sediments from the two coastal inlets (Golden Horn Estuary and Izmit Bay) of the
northeastern Sea of Marmara. Chemical Geology 91(3):269–285
DOI 10.1016/0009-2541(91)90004-B.
Faiz Y, Tufail M, Javed M, Chaudhry M, Naila-Siddique. 2009. Road dust pollution of Cd, Cu,
Ni, Pb and Zn along Islamabad Expressway, Pakistan. Microchemical Journal 92(2):186–192
DOI 10.1016/j.microc.2009.03.009.
Faiz A, Weaver C, Walsh M. 1996. Air Pollution from Motor Vehicles Standards and Technologies for
Controlling Emissions. Washington, D.C.: The World Bank. Available at http://documents.
worldbank.org/curated/en/606461468739185298/Air-pollution-from-motor-vehicles-standards-
and-technologies-for-controlling-emissions (accessed 15 March 2018).
Finley BL, Monnot AD, Paustenbach DJ, Gaffney SH. 2012. Derivation of a chronic oral
reference dose for cobalt. Regulatory Toxicology and Pharmacology 64(3):491–503
DOI 10.1016/j.yrtph.2012.08.022.
Fuentes G, Vinals J, Herreros O. 2009. Hydrothermal purification and enrichment of
Chilean copper concentrates. Part 2: the behavior of the bulk concentrates. Hydrometallurgy
95(1–2):113–120 DOI 10.1016/j.hydromet.2008.05.004.
Gale R. 1987. Immediate medical consequences of nuclear accidents: lessons from Chernobyl.
JAMA 258(5):625–628 DOI 10.1001/jama.1987.03400050067029.
Garza RAP, Titley SR, Pimentel F. 2001. Geology of the Escondida porphyry copper deposit,
Antofagasta Region, Chile. Economic Geology 96(2):307–324 DOI 10.2113/gsecongeo.96.2.307.
Gobierno de Chile. 1980. Constitucion de la Republica de Chile. Artıculo 19, N�8 el derecho a viviren un ambiente libre de contaminacion. Available at https://www.camara.cl/camara/media/docs/
constitucion_politica.pdf.
Herreros O, Fuentes G, Quiroz R, Vinals J. 2003. Lixiviacion de concentrados de cobre con alto
contenido de arsenico en medio cloro-cloruro. Revista de metalurgia 39(2):90–98
DOI 10.3989/revmetalm.2003.v39.i2.319.
Tapia et al. (2018), PeerJ, DOI 10.7717/peerj.4699 26/30

Instituto de Salud Publica (ISP). 2014. Informe de ensayo de polvo sedimentable. Available at http://
www.timeline.cl/2014/11/antofagasta-revisa-el-informe-completo-de-metales-pesados/.
Instituto Nacional de Estadısticas (INE). 2017. Cantidad de personas por sexo y edad: total
Comunal Antofagasta. Available at http://www.censo2017.cl/mapa-resultados-comunas/
(accessed 15 January 2018).
Jorquera H. 2009. Source apportionment of PM10 and PM2.5 at Tocopilla, Chile (22�05’S,70�12’W). Environmental Monitoring and Assessment 153(1–4):235–251
DOI 10.1007/s10661-008-0352-0.
Kamenov G, Macfarlane AW, Riciputi L. 2002. Sources of lead in the San Cristobal, Pulacayo, and
Potosı Mining districts, Bolivia, and a reevaluation of regional ore lead isotope provinces.
Economic Geology 97(3):573–592 DOI 10.2113/gsecongeo.97.3.573.
Khan FI, Abbasi SA. 1999. Major accidents in process industries and an analysis of causes and
consequences. Journal of Loss Prevention in the Process Industries 12(5):361–378
DOI 10.1016/S0950-4230(98)00062-X.
Kong S, Lu B, Ji Y, Zhao X, Chen L, Li Z, Han B, Bai Z. 2011. Levels, risk assessment and sources
of PM10 fraction heavy metals in four types dust from a coal-based city. Microchemical Journal
98(2):280–290 DOI 10.1016/j.microc.2011.02.012.
Lepez I, Furet L, Aracena O. 2001. Poblacion de Emerita Analoga (Stimpson 1857) en playas
Amarilla y Rinconada, Antofagasta: Aspectos abioticos, bioticos y concentracion de cobre.
Gayana (Concepcion) 65(1):55–76 DOI 10.4067/S0717-65382001000100008.
Li Z, Feng X, Li G, Bi X, Zhu J, Qin H, Dai Z, Liu J, Li Q, Sun G. 2013. Distributions, sources and
pollution status of 17 trace metal/metalloids in the street dust of a heavily industrialized city of
central China. Environmental Pollution 182:408–416 DOI 10.1016/j.envpol.2013.07.041.
Lu X, Wang L, Lei K, Huang J, Zhai Y. 2009. Contamination assessment of copper, lead,
zinc, manganese and nickel in street dust of Baoji, NW China. Journal of Hazardous Materials
161(2–3):1058–1062 DOI 10.1016/j.jhazmat.2008.04.052.
Lucas C. 2001. Baia Mare and Baia Borsa accidents: cases of severe transboundary water pollution.
Environmental Policy and Law 31:106.
Lucassen F, Franz G. 1994. Arc related Jurassic igneous and meta-igneous rocks in the
Coastal Cordillera of northern Chile/Region Antofagasta. Lithos 32(3–4):273–298
DOI 10.1016/0024-4937(94)90044-2.
Luo X-S, Ding J, Xu B, Wang Y-J, Li H-B, Yu S. 2012. Incorporating bioaccessibility into human
health risk assessments of heavy metals in urban park soils. Science of the Total Environment
424:88–96 DOI 10.1016/j.scitotenv.2012.02.053.
Marshall G, Ferreccio C, Yuan Y, Bates MN, Steinmaus C, Selvin S, Liaw J, Smith AH. 2007.
Fifty-year study of lung and bladder cancer mortality in Chile related to arsenic in drinking
water. Journal of the National Cancer Institute 99(12):920–928 DOI 10.1093/jnci/djm004.
Massey DD, Kulshrestha A, Taneja A. 2013. Particulate matter concentrations and their related
metal toxicity in rural residential environment of semi-arid region of India. Atmospheric
Environment 67:278–286 DOI 10.1016/j.atmosenv.2012.11.002.
Minerıa Chilena. 2013. Barrio Industrial La Negra se consolida como eje estrategico de servicios.
Available at http://www.mch.cl/2013/07/11/barrio-industrial-la-negra-se-consolida-como-eje-
estrategico-de-servicios/ (accessed 28 July 2016).
Minerıa Chilena. 2014. Empezo produccion de cobre en la mina de Sierra Gorda. Available at
http://www.mch.cl/2014/07/31/empezo-produccion-de-cobre-en-la-mina-de-sierra-gorda/
(accessed 2 August 2016).
Tapia et al. (2018), PeerJ, DOI 10.7717/peerj.4699 27/30

Muller G. 1979. Schwermetalle in den Sedimenten des Rheins—Veranderungen seit. Umschau
79:778–783.
Nowrouzi M, Pourkhabbaz A. 2014. Application of geoaccumulation index and enrichment
factor for assessing metal contamination in the sediments of Hara Biosphere Reserve, Iran.
Chemical Speciation & Bioavailability 26(2):99–105 DOI 10.3184/095422914X13951584546986.
Oliveros V, Morata D, Aguirre L, Feraud G, Fornari M. 2007. Magmatismo asociado a
subduccion del Jurasico a Cretacico Inferior en la Cordillera de la Costa del norte de Chile
(18�30’-24�S): geoquımica y petrogenesis. Revista geologica de Chile 34(2):209–232
DOI 10.4067/S0716-02082007000200003.
Reddy K, Yarrakula K. 2016. Analysis of accidents in chemical process industries in the period
1998–2015. International Journal of ChemTech Research 9:177–191.
Risk Assessment Information System (RAIS). 1991. Formal toxicity summary for VANADIUM.
Available at https://rais.ornl.gov/tox/profiles/vanadium_f_V1.html (accessed 10 August 2016).
Rogers G, Hawkesworth CJ. 1989. A geochemical traverse across the North Chilean Andes:
evidence for crust generation from the mantle wedge. Earth and Planetary Science Letters
91(3–4):271–285 DOI 10.1016/0012-821X(89)90003-4.
Rudnick RL, Gao S. 2003. 3.01—composition of the continental crust A2—Holland, Heinrich D.
In: Turekian KK, ed. Treatise on Geochemistry. Oxford: Pergamon, 1–64.
Ruiz-Rudolph P, Arias N, Pardo S, Meyer M, Mesıas S, Galleguillos C, Schiattino I,
Gutierrez L. 2016. Impact of large industrial emission sources on mortality and morbidity in
Chile: a small-areas study. Environment International 92–93:130–138
DOI 10.1016/j.envint.2016.03.036.
Rule JH. 1986. Assessment of trace element geochemistry of Hampton Roads harbor and lower
Chesapeake Bay area sediments. Environmental Geology and Water Sciences 8(4):209–219
DOI 10.1007/BF02524948.
Salamanca MA, Camano A, Jara B, Rodrıguez T. 2000. Distribucion de Cu, Pb y Zn en aguas
costeras de Bahıa San Jorge en el norte de Chile. Gayana (Concepcion) 64:195–204
DOI 10.4067/S0717-65382000000200009.
Salamanca MA, Jara B, Rodrıguez T. 2004. Niveles de Cu, Pb y Zn en agua y Perumytilus
Purpuratus en Bahıa San Jorge, Norte de Chile. Gayana (Concepcion) 68(1):53–62
DOI 10.4067/S0717-65382004000100005.
Sepulveda V, Vega J, Delgado I. 2000. Exposicion severa a plomo ambiental en una
poblacion infantil de Antofagasta, Chile. Revista medica de Chile 128(2):221–232
DOI 10.4067/S0034-98872000000200014.
National Service of Geology and Mining Service (SERNAGEOMIN). 2003. Mapa geologico
de Chile: version digital. Available at http://www.ipgp.fr/~dechabal/Geol-millon.pdf
(accessed 15 July 2017).
National Service of Geology and Mining Service (SERNAGEOMIN). 2014. Geologıa para el
ordenamiento territorial: area Antofagasta. Available at http://biblioteca.sernageomin.cl/opac/
DataFiles/CGCH_SGA_19_text.pdf (accessed 10 November 2017).
Smith AH, Steinmaus CM. 2009. Health effects of arsenic and chromium in drinking
water: recent human findings. Annual Review of Public Health 30(1):107–122
DOI 10.1146/annurev.publhealth.031308.100143.
Soldan P, Pavonic M, Boucek J, Kokes J. 2001. Baia Mare accident—brief ecotoxicological
report of Czech experts. Ecotoxicology and Environmental Safety 49(3):255–261
DOI 10.1006/eesa.2001.2070.
Tapia et al. (2018), PeerJ, DOI 10.7717/peerj.4699 28/30
Tapia J, Arriagada C, Nacif D, Luca R. 2009. Estudio piloto utilizando propiedades magneticas de
partıculas de polvo depositado en hojas de Platanus orientalis L. para determinar
contaminacion atmosferica. XII Chilean Geologic Conference, S1 024. Available at
http://biblioteca.sernageomin.cl/opac/DataFiles/12993_v1_S1_024.pdf.
Tapia J, Audry S, Townley B, Duprey JL. 2012. Geochemical background, baseline and origin of
contaminants from sediments in the mining-impacted Altiplano and Eastern Cordillera of
Oruro, Bolivia. Geochemistry: Exploration, Environment, Analysis 12(1):3–20
DOI 10.1144/1467-7873/10-ra-049.
Tchernitchin A, Bolados A. 2016. Informe sobre material particulado sedimentable
(MPS) en colegios cercanos al puerto de Antofagasta, muestras 2016. Available at
http://www.colegiomedico.cl/wp-content/uploads/2016/05/MaCM16a5doc-AFB-MPS-colegios-
Antof-Informe-27-10-2015.pdf (accessed 10 July 2016).
Tchernitchin AN, Gaete L. 2015. Prenatal exposures to environmental agents or drugs
promote the development of diseases later in life. Biology and Medicine 7:236
DOI 10.4172/0974-8369.1000236.
Tchernitchin A, Gaete L, Bustamante R, Sorokin Y, eds. 2013. Adulthood prenatally
programmed diseases: health relevance and methods of study. In: Protein Purification and
Analysis I. Methods and Applications. Hong Kong: iConcept Press, 217–258.
Tchernitchin AN, Lapin N, Molina L, Molina G, Tchernitchin NA, Acevedo C, Alonso P. 2006.
Human exposure to lead in Chile. In: George WW, Herbert NN, Daniel RD, eds. Reviews of
Environmental Contamination and Toxicology. New York: Springer, 93–139.
United States Environmental Protection Agency. 1989a. Risk assessment guidance for superfund
Volume I human health evaluation manual (Part A). Available at https://www.epa.gov/risk/risk-
assessment-guidance-superfund-rags-part (accessed 2 November 2016).
United States Environmental Protection Agency. 1989b. Cadmium CASRN 7440-43-9 | IRIS |
US EPA, ORD. Available at https://cfpub.epa.gov/ncea/iris2/chemicalLanding.cfm?substance_
nmbr=141 (accessed 10 August 2016).
United States Environmental Protection Agency. 1991a. Nickel, soluble salts. Available at https://
cfpub.epa.gov/ncea/iris2/chemicalLanding.cfm?substance_nmbr=271 (accessed 10 August 2016).
United States Environmental Protection Agency. 1991b. Arsenic, inorganic CASRN 7440-38-2 |
IRIS | US EPA, ORD. Available at https://cfpub.epa.gov/ncea/iris2/chemicalLanding.cfm?
substance_nmbr=278 (accessed 9 August 2016).
United States Environmental Protection Agency. 2004. Lead and compounds (inorganic)
CASRN 7439-92-1 | IRIS | US EPA, ORD. Available at https://cfpub.epa.gov/ncea/iris2/
chemicalLanding.cfm?substance_nmbr=0277 (accessed 9 August 2016).
United States Environmental Protection Agency. 1992. Molybdenum CASRN 7439-98-7 | IRIS |
US EPA, ORD. Available at https://cfpub.epa.gov/ncea/iris2/chemicalLanding.cfm?substance_
nmbr=425 (accessed 10 August 2016).
United States Environmental Protection Agency. 1998. Chromium (VI) CASRN 18540-29-9 |
IRIS | US EPA, ORD. Available at https://cfpub.epa.gov/ncea/iris2/chemicalLanding.cfm?
substance_nmbr=144 (accessed 10 August 2016).
United States Environmental Protection Agency. 2005. Zinc and Compounds CASRN 7440-66-6
| IRIS | US EPA, ORD. Available at https://cfpub.epa.gov/ncea/iris2/chemicalLanding.cfm?
substance_nmbr=426 (accessed 10 August 2016).
Valdes J, Guinez M, Castillo A, Vega SE. 2014. Cu, Pb, and Zn content in sediments and benthic
organisms from San Jorge Bay (northern Chile): accumulation and biotransference in subtidal
coastal systems. Ciencias Marinas 40(1):45–58 DOI 10.7773/cm.v40i1.2318.
Tapia et al. (2018), PeerJ, DOI 10.7717/peerj.4699 29/30
Valdes J, Roman D, Guinez M, Rivera L, Avila J, Cortes P, Castillo A. 2015. Trace metal variability
in coastal waters of San Jorge Bay, Antofagasta, Chile: an environmental evaluation and
statistical approach to propose local background levels. Marine Pollution Bulletin
100(1):544–554 DOI 10.1016/j.marpolbul.2015.08.035.
Valdes J, Roman D, Guinez M, Rivera L, Morales T, Avila J, Cortes P. 2010. Distribution and
temporal variation of trace metal enrichment in surface sediments of San Jorge Bay, Chile.
Environmental Monitoring and Assessment 167(1–4):185–197 DOI 10.1007/s10661-009-1041-3.
Valdes J, Roman D, Rivera L, Avila J, Cortes P. 2011.Metal contents in coastal waters of San Jorge
Bay, Antofagasta, northern Chile: a base line for establishing seawater quality guidelines.
Environmental Monitoring and Assessment 183(1–4):231–242 DOI 10.1007/s10661-011-1917-x.
Vergara P. 2015. Contaminacion de arsenico y plomo: Un conflicto que crece en Antofagasta.
Available at http://www.cooperativa.cl/noticias/pais/region-de-antofagasta/contaminacion-plomo/
contaminacion-de-arsenico-y-plomo-un-conflicto-que-crece-en-antofagasta/2015-02-04/140741.
html (accessed 27 July 2016).
Zhu Z, Sun G, Bi X, Li Z, Yu G. 2013. Identification of trace metal pollution in urban dust from
kindergartens using magnetic, geochemical and lead isotopic analyses. Atmospheric
Environment 77:9–15 DOI 10.1016/j.atmosenv.2013.04.053.
Zoller WH, Gladney ES, Duce RA. 1974. Atmospheric concentrations and sources of trace metals
at the South Pole. Science 183(4121):198–200 DOI 10.1126/science.183.4121.198.
Tapia et al. (2018), PeerJ, DOI 10.7717/peerj.4699 30/30