Embed Size (px)
Citation preview

1
Sreeja S. NairSreeja S. NairAssistant Professor, NIDMAssistant Professor, NIDM
GEOINFORMATICS IN DISASTER MANAGEMENT:
Scope, Examples & Advancements
Training Workshop on Use of Space Technology
for Disaster Risk Reduction
GEOINFORMATICS TECHNOLOGYGEOINFORMATICS TECHNOLOGY
• Remote Sensing
• Geographic Information Systems (GIS)
• Global Positioning System (GPS)
• Information Technology
• Communication Technology
DISASTER MANAGEMENTDISASTER MANAGEMENT
Disaster Management
comprises all forms of activities
including structural and non-
structural measures to avoid
(prevention) or to limit (mitigation
and preparedness) adverse
effects of disasters in the pre-
disaster phase and post
disaster stage (Response, Relief
, Recovery, Reconstruction).
GEOGEO--INFO APPLICATIONS IN DMINFO APPLICATIONS IN DM
Pre disasterExamples: hazard mapping, Vulnerability and Risk Assessment, Preparedness Plans; Early Warning and monitoring, Risk Modelling etc
During Disaster Examples: public warning systems; emergency operations; search and rescue, evacuation planning, distribution of relief
Post Disaster Examples: damage assessment, temporary shelters; claims, processing and grants; reconstruction
REMOTE SENSINGREMOTE SENSING
Remote Sensing means deriving information about objects from measurements made from distance
i.e. without actually coming into contact with them.
Such measurements require a medium of
interaction. Medium of interaction is Electromagnetic radiation
Visible, infrared, and microwave portions of the spectrum are used for remote sensing
2
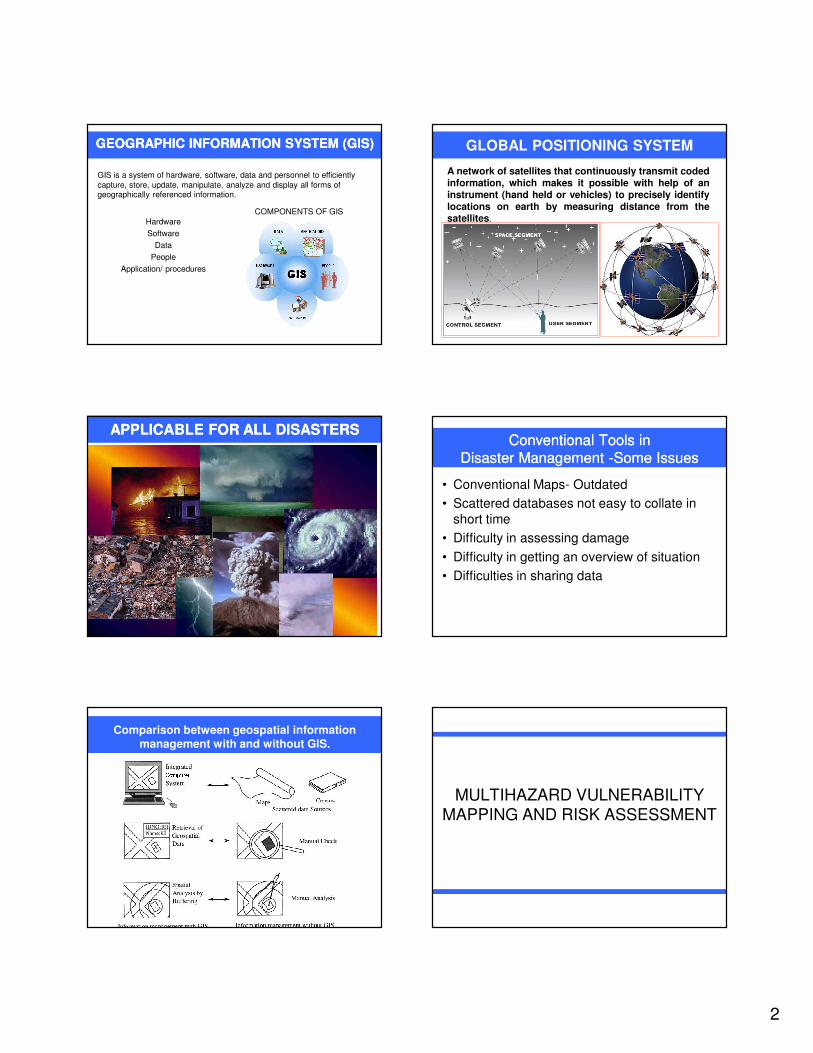
GEOGRAPHIC INFORMATION SYSTEM (GIS)GEOGRAPHIC INFORMATION SYSTEM (GIS)
GIS is a system of hardware, software, data and personnel to efficiently
capture, store, update, manipulate, analyze and display all forms of geographically referenced information.
Hardware
Software
Data
People
Application/ procedures
COMPONENTS OF GIS
GLOBAL POSITIONING SYSTEM
A network of satellites that continuously transmit codedinformation, which makes it possible with help of aninstrument (hand held or vehicles) to precisely identifylocations on earth by measuring distance from thesatellites.
APPLICABLE FOR ALL DISASTERSAPPLICABLE FOR ALL DISASTERSConventional Tools in Conventional Tools in
Disaster Management Disaster Management --Some IssuesSome Issues
• Conventional Maps- Outdated
• Scattered databases not easy to collate in
short time
• Difficulty in assessing damage
• Difficulty in getting an overview of situation
• Difficulties in sharing data
Comparison between geospatial information
management with and without GIS.
MULTIHAZARD VULNERABILITY MAPPING AND RISK ASSESSMENT
3
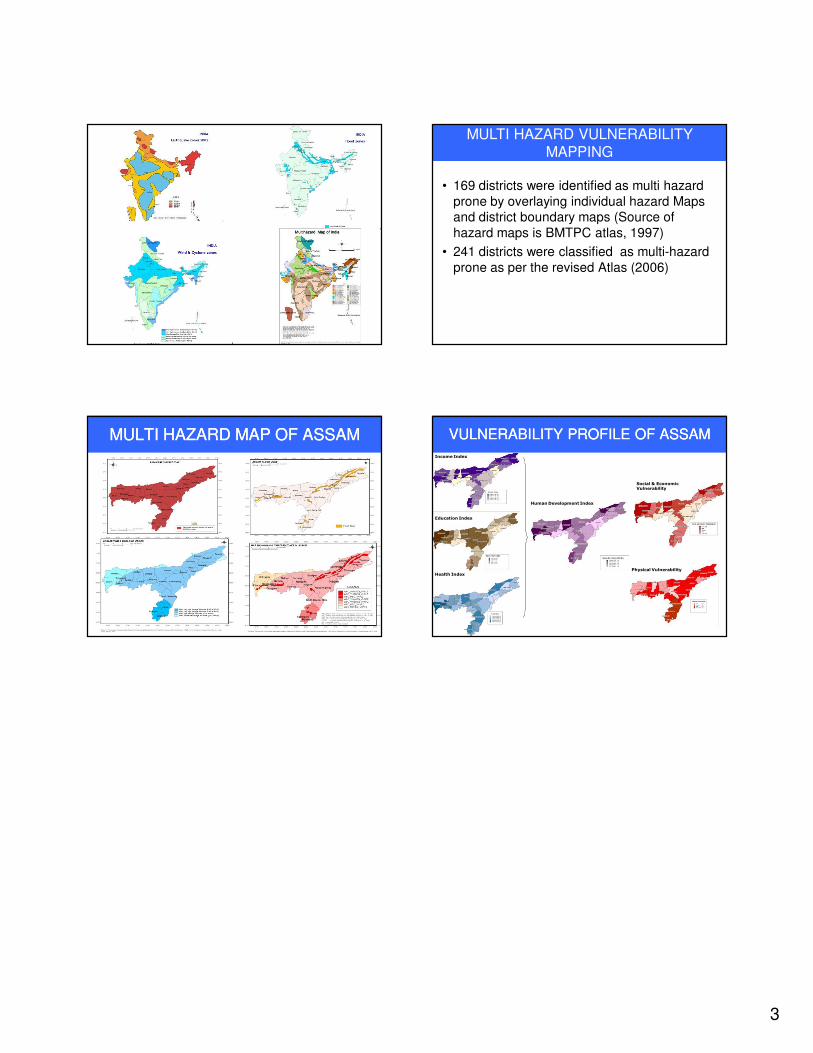
• 169 districts were identified as multi hazard
prone by overlaying individual hazard Maps and district boundary maps (Source of
hazard maps is BMTPC atlas, 1997)
• 241 districts were classified as multi-hazard
prone as per the revised Atlas (2006)
MULTI HAZARD VULNERABILITY
MAPPING
MULTI HAZARD MAP OF ASSAM MULTI HAZARD MAP OF ASSAM VULNERABILITY PROFILE OF ASSAMVULNERABILITY PROFILE OF ASSAM
Education Index
Income Index
Human Development Index
Physical Vulnerability
Social & Economic Vulnerability
Health Index
1
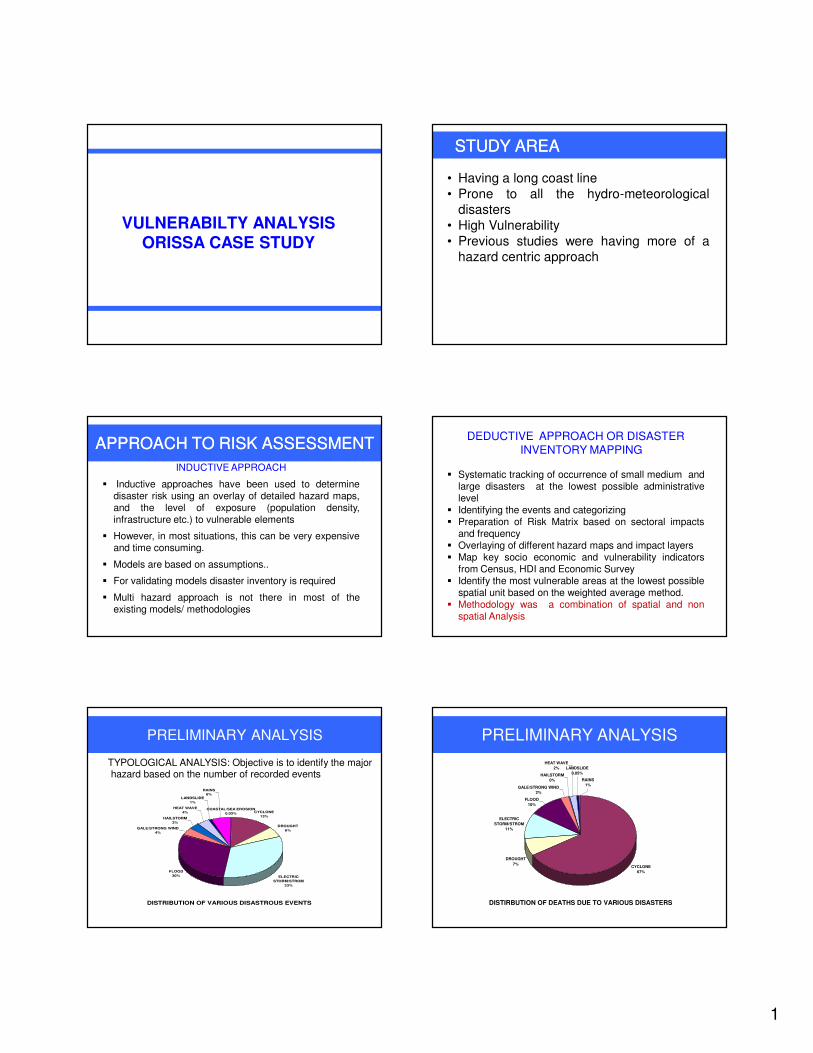
VULNERABILTY ANALYSISORISSA CASE STUDY
STUDY AREASTUDY AREA
• Having a long coast line
• Prone to all the hydro-meteorologicaldisasters
• High Vulnerability
• Previous studies were having more of ahazard centric approach
APPROACH TO RISK ASSESSMENTAPPROACH TO RISK ASSESSMENT
INDUCTIVE APPROACH
� Inductive approaches have been used to determinedisaster risk using an overlay of detailed hazard maps,and the level of exposure (population density,infrastructure etc.) to vulnerable elements
� However, in most situations, this can be very expensiveand time consuming.
� Models are based on assumptions..
� For validating models disaster inventory is required
� Multi hazard approach is not there in most of theexisting models/ methodologies
DEDUCTIVE APPROACH OR DISASTER INVENTORY MAPPING
� Systematic tracking of occurrence of small medium andlarge disasters at the lowest possible administrativelevel
� Identifying the events and categorizing� Preparation of Risk Matrix based on sectoral impacts
and frequency� Overlaying of different hazard maps and impact layers� Map key socio economic and vulnerability indicators
from Census, HDI and Economic Survey� Identify the most vulnerable areas at the lowest possible
spatial unit based on the weighted average method.� Methodology was a combination of spatial and non
spatial Analysis
PRELIMINARY ANALYSIS
TYPOLOGICAL ANALYSIS: Objective is to identify the majorhazard based on the number of recorded events
DISTRIBUTION OF VARIOUS DISASTROUS EVENTS
CYCLONE
13%
DROUGHT
6%
ELECTRIC
STORM/STROM
33%
FLOOD
30%
GALE/STRONG WIND
4%
HAILSTORM
3%
HEAT WAVE
4%
LANDSLIDE
1%
COASTAL/SEA EROSION
0.03%
RAINS
6%
PRELIMINARY ANALYSIS
DISTIRBUTION OF DEATHS DUE TO VARIOUS DISASTERS
CYCLONE
67%
DROUGHT
7%
ELECTRIC
STORM/STROM
11%
FLOOD
10%
GALE/STRONG WIND
2%
HAILSTORM
0%
HEAT WAVE
2%
RAINS
1%
LANDSLIDE
0.05%

2
DAMAGE TO CROPS DUE TO DISASTERS(in Hect.)
CYCLONE
11.650%
DROUGHT
59.237%
ELECTRIC
STORM/STROM
0.035%
FLOOD
25.538%
HAILSTORM
0.202%
HEAT WAVE
0.000%
COASTAL/SEA EROSION
0.231%
RAINS
3.096%
LANDSLIDE
0.001%
GALE/STRONG WIND
0.008%
PROPERTY LOSSES DUE TO VARIOUS DISASTERS
CYCLONE
61.972%
ELECTRIC
STORM/STROM
1.456%
FLOOD
31.791%
GALE/STRONG WIND
0.852%
HAILSTORM
0.527%
HEAT WAVE
0.000%
LANDSLIDE
0.000%
RAINS
3.403%
0.000%
PEOPLE AFFECTED DUE TO VARIOUS DISASTERS
CYCLONE
16.806%
GALE/STRONG WIND
0.300%
DROUGHT
4.252%
ELECTRIC
STORM/STROM
0.022%
FLOOD
73.948%
HAILSTORM
0.071%
HEAT WAVE
0.000%
LANDSLIDE
0.000%
RAINS
4.590%
PRELIMINARY ANALYSIS
TEMPORAL ANALYSIS: To identify the frequency andimpact of various disasters over a period of 30 years
IDENTYING MAJOR HAZRADS
Based on the preliminary analysis the followinghydro-meteorological hazards were taken for
detailed analysis
• Cyclone
• Floods and Heavy Rain
• Thunderstorms and Lightening
• Drought
SPATIAL ANALYSIS
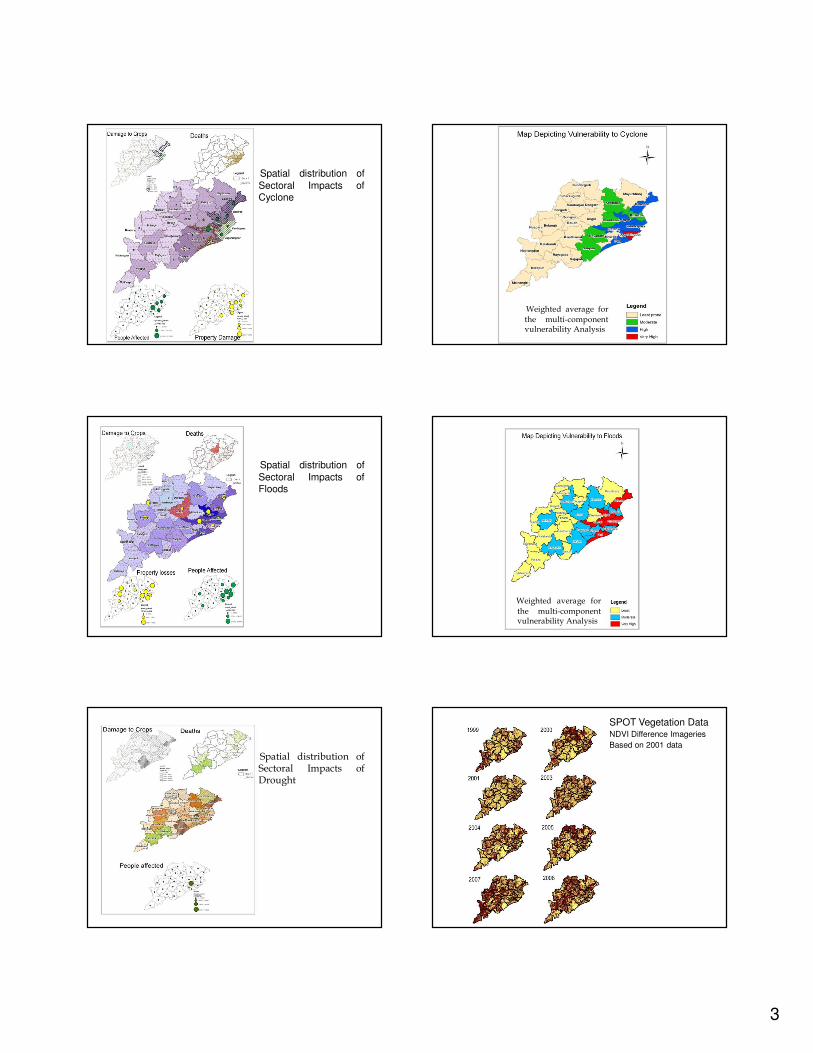
3
Spatial distribution of
Sectoral Impacts ofCyclone
Weighted average for
the multi-componentvulnerability Analysis
Spatial distribution of
Sectoral Impacts ofFloods
Weighted average for
the multi-componentvulnerability Analysis
Spatial distribution ofSectoral Impacts ofDrought
SPOT Vegetation DataNDVI Difference Imageries
Based on 2001 data
4
Spatial distribution of
Sectoral Impacts ofThunderstorms
Weighted average for
the multi-componentvulnerability Analysis
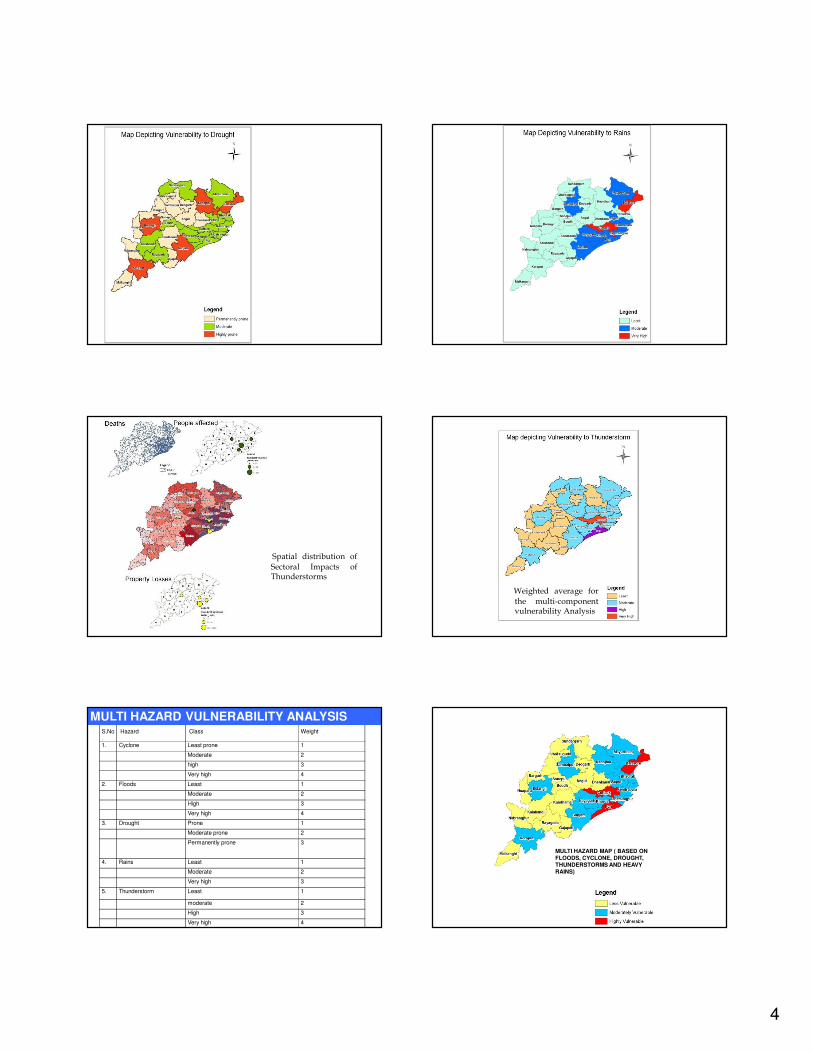
S.No.
Hazard Class Weight
1. Cyclone Least prone 1
Moderate 2
high 3
Very high 4
2. Floods Least 1
Moderate 2
High 3
Very high 4
3. Drought Prone 1
Moderate prone 2
Permanently prone 3
4. Rains Least 1
Moderate 2
Very high 3
5. Thunderstorm Least 1
moderate 2
High 3
Very high 4
MULTI HAZARD VULNERABILITY ANALYSIS
MULTI HAZARD MAP ( BASED ON FLOODS, CYCLONE, DROUGHT, THUNDERSTORMS AND HEAVY RAINS)
5
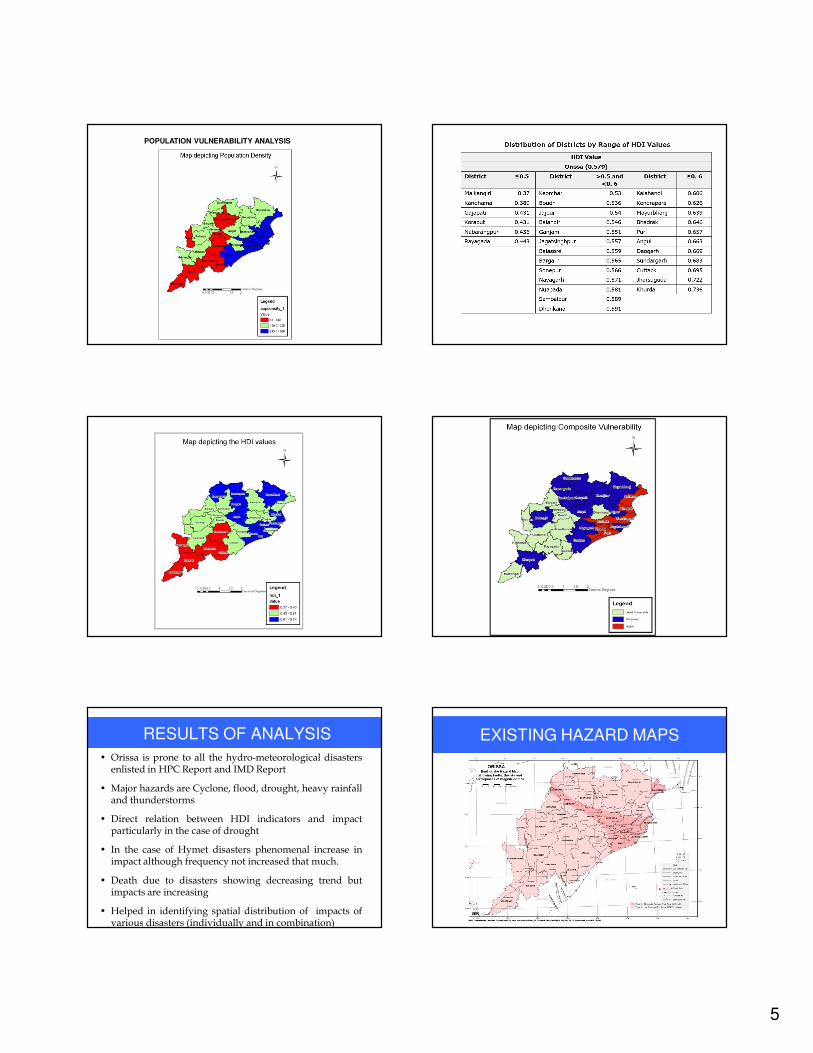
POPULATION VULNERABILITY ANALYSIS
RESULTS OF ANALYSIS
• Orissa is prone to all the hydro-meteorological disastersenlisted in HPC Report and IMD Report
• Major hazards are Cyclone, flood, drought, heavy rainfalland thunderstorms
• Direct relation between HDI indicators and impactparticularly in the case of drought
• In the case of Hymet disasters phenomenal increase inimpact although frequency not increased that much.
• Death due to disasters showing decreasing trend butimpacts are increasing
• Helped in identifying spatial distribution of impacts ofvarious disasters (individually and in combination)
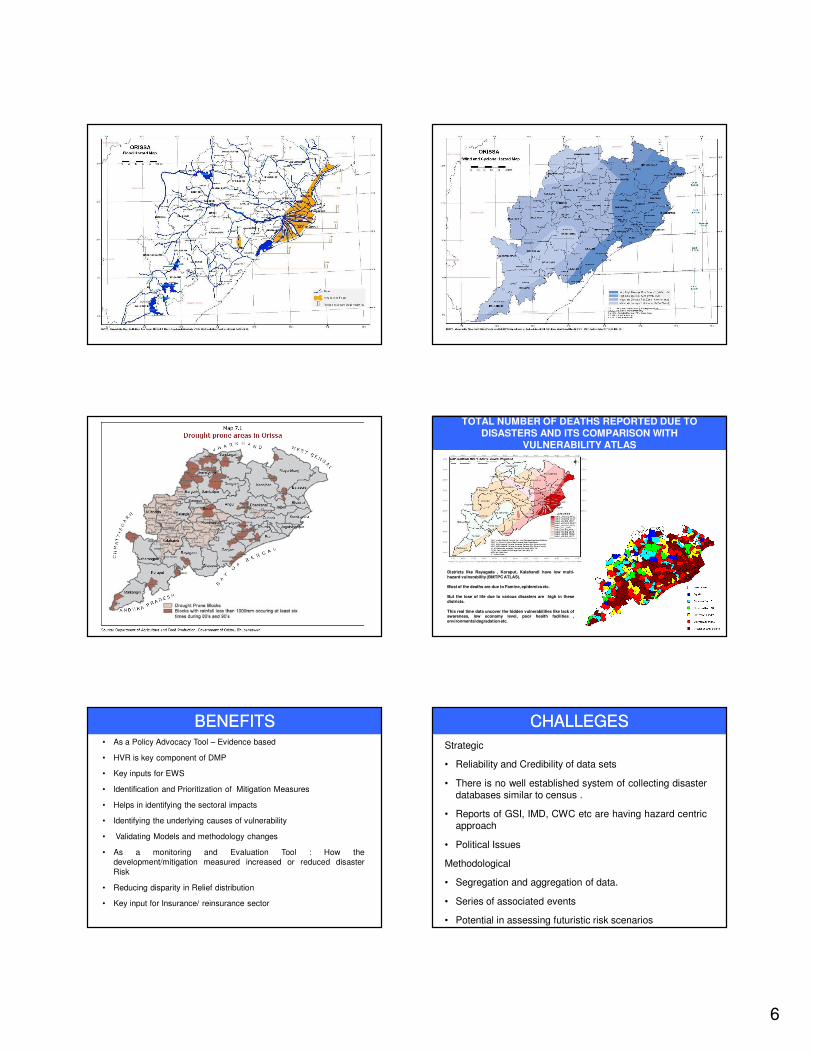
EXISTING HAZARD MAPS
6
TOTAL NUMBER OF DEATHS REPORTED DUE TO DISASTERS AND ITS COMPARISON WITH
VULNERABILITY ATLAS
Districts like Rayagada , Koraput, Kalahandi have low multi-hazard vulnerability (BMTPC ATLAS).
Most of the deaths are due to Famine, epidemicsetc.
But the lose of life due to various disasters are high in thesedistricts.
This real time data uncover the hidden vulnerabilities like lack ofawareness, low economy level, poor health facilities ,environmental degradation etc.
BENEFITSBENEFITS• As a Policy Advocacy Tool – Evidence based
• HVR is key component of DMP
• Key inputs for EWS
• Identification and Prioritization of Mitigation Measures
• Helps in identifying the sectoral impacts
• Identifying the underlying causes of vulnerability
• Validating Models and methodology changes
• As a monitoring and Evaluation Tool : How thedevelopment/mitigation measured increased or reduced disaster
Risk
• Reducing disparity in Relief distribution
• Key input for Insurance/ reinsurance sector
CHALLEGESCHALLEGES
Strategic
• Reliability and Credibility of data sets
• There is no well established system of collecting disasterdatabases similar to census .
• Reports of GSI, IMD, CWC etc are having hazard centricapproach
• Political Issues
Methodological
• Segregation and aggregation of data.
• Series of associated events
• Potential in assessing futuristic risk scenarios
1
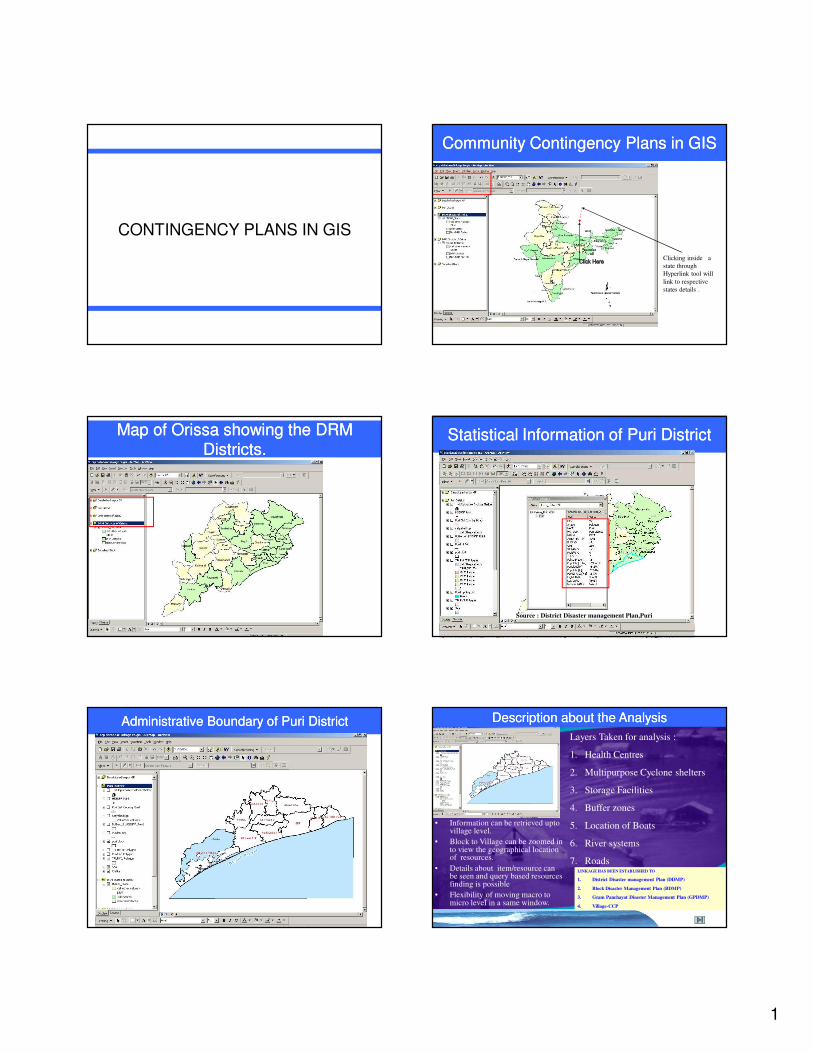
CONTINGENCY PLANS IN GIS
Community Contingency Plans in GISCommunity Contingency Plans in GIS
Map Showing Natural Disaster Risk Management
Programme States of India
Clicking inside a
state through
Hyperlink tool will
link to respective
states details .
Map of Orissa showing the DRM Map of Orissa showing the DRM Districts.Districts.
Statistical Information of Puri DistrictStatistical Information of Puri District
Source : District Disaster management Plan,Puri
Administrative Boundary of Puri DistrictAdministrative Boundary of Puri DistrictLayers Taken for analysis :
1. Health Centres
2. Multipurpose Cyclone shelters
3. Storage Facilities
4. Buffer zones
5. Location of Boats
6. River systems
7. Roads
• Information can be retrieved upto village level.
• Block to Village can be zoomed in to view the geographical location of resources.
• Details about item/resource can be seen and query based resources finding is possible
• Flexibility of moving macro to micro level in a same window.
LINKAGE HAS BEEN ESTABLISHED TO
1. District Disaster management Plan (DDMP)
2. Block Disaster Management Plan (BDMP)
3. Gram Panchayat Disaster Management Plan (GPDMP)
4. Village-CCP
Description about the AnalysisDescription about the Analysis

2
N
E
X
T
Next Slide: Map extent zoomed further to a scale of 1: 1,50,000 and greater to obtain
location of health centres in the GP Level
Location of Health Centres [Block Level]Location of Health Centres [Block Level] Zoomed in to a scale of Zoomed in to a scale of Zoomed in to a scale of Zoomed in to a scale of N
E
X
T
Next Slide: Map extent zoomed further to a scale of 1: 40,000 or greater to obtain
location of health centres in the Village Level
Location of Health Centres [GP Level]Location of Health Centres [GP Level]
N
E
X
T
Location of Health Centres [Village Level]Location of Health Centres [Village Level]Location of Multipurpose Cyclone Shelters [Block Level]
N
E
X
T
One can view the location of
existing resources in the block by
clicking the layers ONON.
N
E
X
T
Location of Multipurpose Cyclone Shelters [ GP Level]
N
E
X
T
Location of Multipurpose Cyclone Shelters [Village Level]
Particular resource can be viewed from District to Village level by changing the scale in
the same window. In case to obtain more than one resource select the desired layers as
shown in the next slides.
3
N
E
X
T
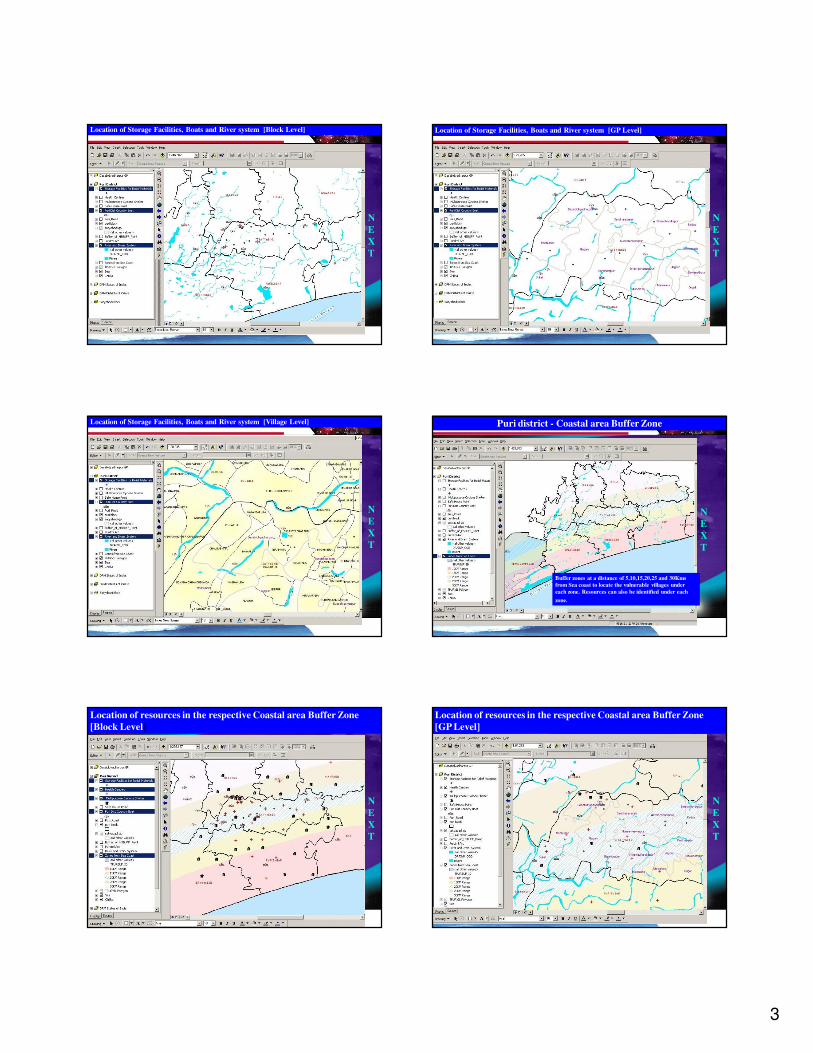
Location of Storage Facilities, Boats and River system [Block Level]
N
E
X
T
Location of Storage Facilities, Boats and River system [GP Level]
N
E
X
T
Location of Storage Facilities, Boats and River system [Village Level]
N
E
X
T
Puri district - Coastal area Buffer Zone
Buffer zones at a distance of 5,10,15,20,25 and 30Kms
from Sea coast to locate the vulnerable villages under
each zone. Resources can also be identified under each
zone.
N
E
X
T
Location of resources in the respective Coastal area Buffer Zone
[Block Level]
N
E
X
T
Location of resources in the respective Coastal area Buffer Zone
[GP Level]
4
N
E
X
T
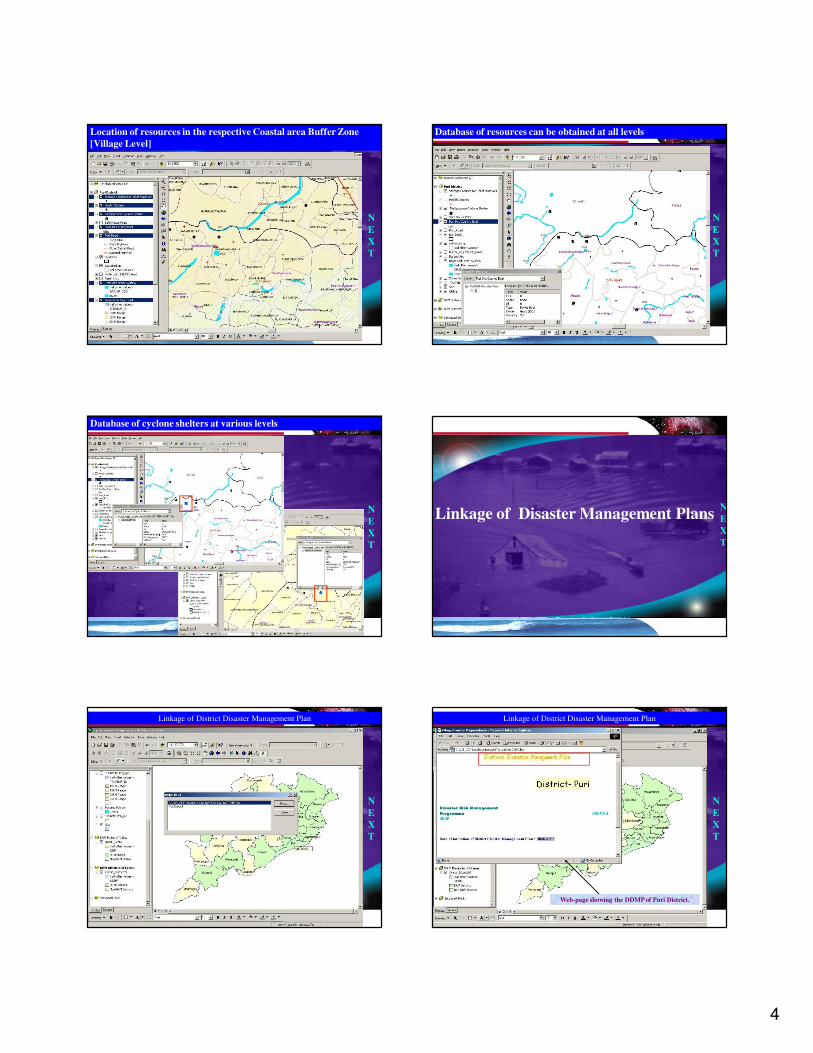
Location of resources in the respective Coastal area Buffer Zone
[Village Level]
N
E
X
T
Database of resources can be obtained at all levels
N
E
X
T
Database of cyclone shelters at various levels
Linkage of Disaster Management PlansN
E
X
T
Linkage of District Disaster Management Plan
N
E
X
T
Linkage of District Disaster Management Plan
Web-page showing the DDMP of Puri District.
N
E
X
T
5
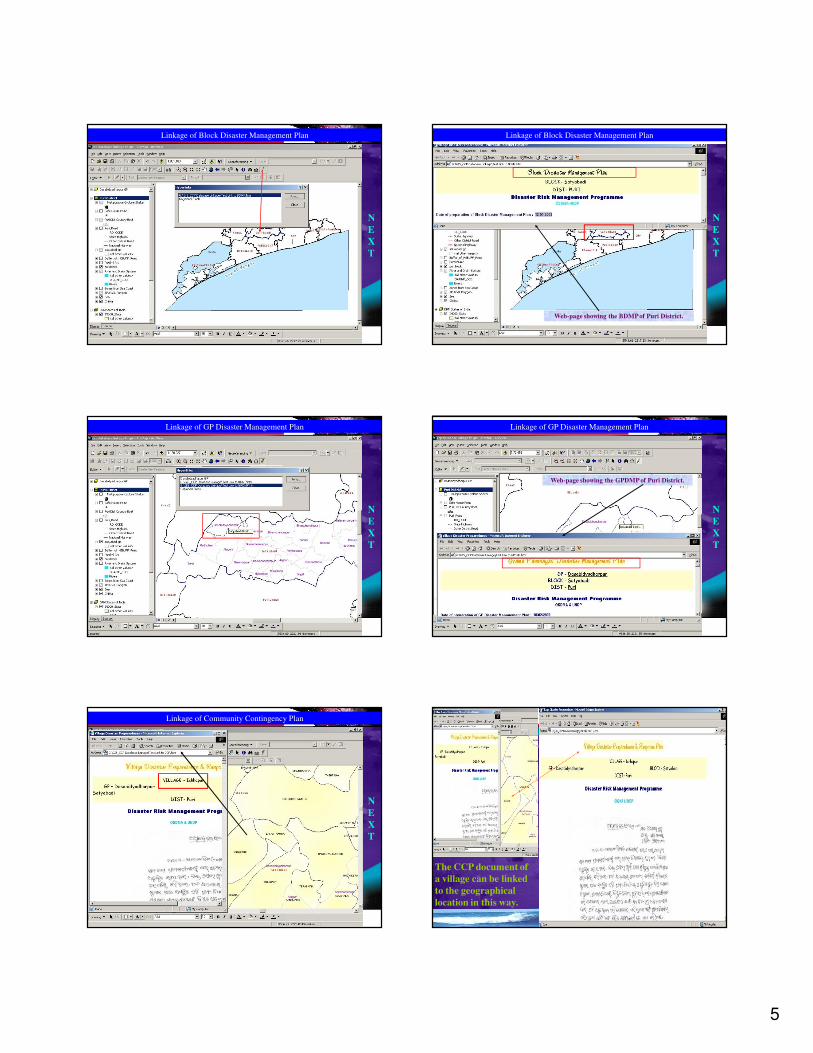
Linkage of Block Disaster Management Plan
N
E
X
T
Linkage of Block Disaster Management Plan
Web-page showing the BDMP of Puri District.
N
E
X
T
Linkage of GP Disaster Management Plan
N
E
X
T
Linkage of GP Disaster Management Plan
Web-page showing the GPDMP of Puri District.
N
E
X
T
Linkage of Community Contingency Plan
N
E
X
T
The CCP document of
a village can be linked
to the geographical
location in this way.