Embed Size (px)
Citation preview

UPDATED RESEARCH PAPER 3/2015
Australian geography of innovative entrepreneurshipSamira Hassan, Francy Bulic, Stan Bucifal, Paul Drake and Luke Hendrickson
November 2016
AbstractThis updated paper explores the patterns of innovative entrepreneurship in Australia, showing the distribution and concentration of business creation, research and development (R&D), patenting and trademark activity across various regions of Australia. The paper finds that during the period 2008–15 these activities are concentrated in the major metropolitan areas of Australia, Sydney in particular. Innovation and entrepreneurship go hand in hand. There are no regions in Australia where high intellectual property- generation does not occur in tandem with high entrepreneurship. It was found that an increase in the number of patents and trademarks in a given region was positively associated with an increase in the number of business entries. In addition, for every 1 per cent increase in R&D expenditure, a 0.35 per cent increase was observed in patent applicant counts and a 0.40 per cent increase in trademark applicant counts. Significant convergence of high levels of innovation activity and business creation was observed in areas of New South Wales and Queensland, where large numbers of businesses were generated in the Professional, Scientific and Technical Services industry. The presence of publicly funded research organisations in a region, particularly those hosting Centres of Excellence and Cooperative Research Centres, produced levels of patenting and trademarking; three and a half times higher than the national average. Regions that host these research centres were also found to have twice as many businesses in the Professional, Scientific and Technical Services industry.
JEL Codes: L26, O34, R30Keywords: Innovation geography, patent, trademark, geographical cluster, entrepreneurship


For further information on this research paper please contact:
Manager
Innovation Research
Department of Industry, Innovation and Science
GPO Box 9839
Canberra ACT 2601
Phone : +61 2 6213 6000
Email: [email protected]
Disclaimer
The views expressed in this report are those of the author(s) and do not necessarily reflect those
of the Australian Government or the Department of Industry, Innovation and Science.
Commonwealth of Australia 2016.
This work is copyright. Apart from use under Copyright Act 1968, no part may be reproduced or
altered by any process without prior written permission from the Australian Government.
Requests and inquiries concerning reproduction and rights should be addressed to
[email protected]. For more information on Office of the Chief Economist
research papers please access the Department’s website at: www.industry.gov.au/OCE
Creative Commons Licence
With the exception of the Coat of Arms, this publication is licensed under a Creative Commons
Attribution 3.0 Australia Licence.
Creative Commons Attribution 3.0 Australia Licence is a standard form license agreement that
allows you to copy, distribute, transmit and adapt this publication provided that you attribute the
work. A summary of the licence terms is available from
http://creativecommons.org/licenses/by/3.0/au/deed.en. The full licence terms are available from
http://creativecommons.org/licenses/by/3.0/au/legalcode.
The Commonwealth’s preference is that you attribute this publication (and any material sourced
from it) using the following wording:
Source: Licensed from the Commonwealth of Australia under a Creative Commons Attribution
3.0 Australia Licence. The Commonwealth of Australia does not necessarily endorse the content
of this publication.
Acknowledgments
Roger Smith and Alex Aitkin (for assistance with research and analysis); Matthew Johnson,
Joachim Schoen and Anton Kriz (for peer-reviewing); Razib Tuhin and Bilal Rafi (for assistance
with econometrics); Rifat Majumder and Lisa Cornish for interactive web-based accompanying
visualisation.

Key points The paper examines trends in R&D expenditure, patent and
trademark activity, taking these measures as proxies for innovation, while new business entries are considered to represent entrepreneurial activity.
Innovative entrepreneurship in Australia, measured by expenditure on research and development (R&D), innovation activities generating significant intellectual property (IP), and business entries, occurs at more intense levels in the large metropolitan cities, taking population size into account.
Increased business creation in a region is positively associated with increases in patent and trademark applicants.
However, creative destruction (where more productive firms replace or take market share from less productive ones) caused by innovation can also lower the survival rate of businesses and increase the churn of businesses in regions of high innovative entrepreneurship.
Regions of high innovative entrepreneurship were found in New South Wales and Queensland, where a high number of businesses were created in the IP-intensive Professional, Scientific and Technical Services industry. Queensland has the widest regional spread of innovative entrepreneurship.
The presence of research organisations with known industry collaboration (such as Cooperative Research Centres) was positively linked with significant increases in innovation activity in that region (by an average 350 per cent above the national average) and business entries in the Professional, Scientific and Technical Services industry.
In support of this paper, an updated interactive map of innovation activities and entrepreneurship is provided at the National Innovation Map.

1. IntroductionA considerable amount of economic geography research recognises that proximity to areas of dense economic activity and natural resource endowments may have a significant impact on productivity both within and across countries.1 This proximity induces stronger competition between firms that encourages innovation and resource efficiency.2 Access to larger consumer and supplier markets allows increasing returns to scale to be realised. Access to a large pool of workers, localised knowledge spillovers and access to public infrastructure also drives economies of scale. Distance from dense economic activity (high transport or communication costs) also reduces the scope for specialisation according to inherent innovation-driven comparative advantage.3
Clusters are a geographic concentration of related firms and associated institutions in a particular field, linked by spillovers and complementarities.4 Clustering builds trust and cooperation, thereby reducing transaction costs and increasing knowledge spillovers.5 Clusters may benefit national economies because they raise a firm’s profitability and operational efficiency which is influenced by local assets and the presence of like firms, institutions and infrastructure surrounding it.6 Casares & Khan7 examined US business dynamics from 1987 to 2013 across all US states and found that business density had a positive and statistically significant effect on regional growth. As globalisation makes capital and labour more mobile and lowers the costs of communication and transport “the enduring competitive advantages in a global economy lie increasingly in local things — knowledge, relationships, motivation — that distant rivals cannot match” or access.8
Increasingly, these competitiveness-enhancing assets that clustered firms are accessing are intangible capital assets. Intangible capital assets are mostly created through research and development, education, training, innovation and networking activities and include assets such as intellectual property (IP) and brand equity.9 Firms tend to cluster because these economically useful intangible assets are ‘sticky’ i.e. they are hard to identify, difficult to get access to, and demanding and costly to absorb.10 Aharonson et al.11 show that clustered firms are eight times more innovative than non-clustered firms.
Innovation drives firm creation, survival and growth and is often clustered in firms geographically.12 It is therefore important to establish where business entrepreneurship and innovation intersect geographically in order to begin to
1 OECD (2007)2 Soames et al. (2011)3 OECD (2007)4 Ketels (2011)5 Enright & Roberts (2001)6 Institute for Strategy and Competitiveness (2015)7 Casares & Khan (2016)8 Porter (1998)9 For a definition of intangible capital assets and a discussion of their economic significance in
Australia, see Australian Government (2014) pp.19–21.10 von Hippel (1994); Griffith et al. (2006); Fagerberg (2013)11 Aharonson et al. (2014)12 Fallah et al. (2014); Braunerhjelm et al. (2010); Acs (2005); Acs & Armington (2004);
Audretsch (2003); Feldman & Audretsch (1999)
Australian geography of innovative entrepreneurshipAustralian geography of innovative
entrepreneurship

understand where and how clusters of innovative entrepreneurship form. The innovation economy has an inherent tendency toward geographical clustering.13 Cluster formation is most effective when it involves complementary actors in the innovation process beyond businesses. In this regard, universities, vocational education and training providers and other research organisations perform an especially vital role in the diffusion of knowledge that is valuable to the region, acting as a focus for localised experimentation, learning and innovation.14
Rigorous studies of economic geography and clustering in Australia were conducted in the late 1990s and early 2000s and focused on case studies and policies. Little new research has appeared since then until a major 2014 study finding that Adelaide has emerged, with little government support or university involvement, as a significant cluster and the dominant location of Australia’s high technology electronics industry.15 Notwithstanding a recent map of incubators and accelerators published by The Australian,16 knowledge is still lacking as to the state of clustering more broadly across Australia and how it has trended over time.
This research paper takes a quantitative and graphic visualisation approach to the clustering of innovative and entrepreneurial activities in regions across Australia. For the purposes of this paper we adopt the Organisation for Economic Co-operation and Development (OECD) definition of innovative entrepreneurship: that sphere of activity where innovative businesses intersect with young and high-growth businesses and small and medium-sized enterprises (SMEs).17 This paper aims to understand the intersection of innovation-related activity and firm creation and survival in Australia, mapping the extent to which these activities are regionally clustered. Using the definitions and methodology outlined in Appendix A, the paper attempts to answer the following research questions:
1. Does high innovation activity overlap with high levels of firm creation in Australia? If so, in which regions does this innovative entrepreneurship occur?
2. Do research organisations or specific industry sectors significantly alter the distribution and levels of innovative entrepreneurship in different regions of Australia?
13Rothwell et al. (2013)14 Rodrigues-Pose & Comptour (2012).15Grill (2014)16 http://www.theaustralian.com.au/business/the-deal-magazine/the-deal-startup-guide, accessed
29 June 2015.17 OECD (2013), Innovative Entrepreneurship, Paris, Final Report, unpublished, p.4.
Australian geography of innovative entrepreneurshipAustralian geography of innovative
entrepreneurship

Box 1.1: Defining regions of Australia
This paper uses the statistical geography definitions of the Australian Bureau of Statistics Australian Statistical Geography Standard18 to identify regions of innovative entrepreneurship. We use two complementary regional definitions in this research paper:
SA3 regions provide a standardised regional breakup of Australia that clusters areas with similar regional characteristics. The population in each SA3 region is between 30,000 and 130,000 persons. SA3s are often the functional areas of regional towns and cities with a population in excess of 20,000 or clusters of related suburbs around urban commercial and transport hubs within major urban areas. SA3s do not cross state and territory borders. There are 333 SA3 spatial units. In aggregate, they cover the whole of Australia without gaps or overlaps.
Greater Capital City Statistical Areas (GCCSAs) comprise a number of Statistical Area Level 3 (SA3) regions. The number of SA3 regions contained in a GCCSA varies substantially from one GCCSA to the next, depending on the population density. For instance, the Greater Sydney area contains 47 individual SA3 regions while the Greater Darwin area contains only 4 (See Appendix A Table A3 for full details of the composition of all GCCSAs). To facilitate comparison, results shown in Figures 2.1 to 2.4 are reported at the GCCSA level, but in all other figures and tables results are shown at the level of SA3 regions.
18 ABS (2011) Australian Statistical Geography Standard (ASGS): Volume 1 - Main Structure and Greater Capital City Statistical Areas, cat. no. 1270.0.55.001
Australian geography of innovative entrepreneurshipAustralian geography of innovative
entrepreneurship

2. ResultsAn online tool has been published on www.industry.gov.au/innovationreport that visually maps all business entry, R&D, patents and trademark applications to SA3 regions of Australia. This map tool is the basis for the following analyses. The raw data set is also published on www.data.gov.au. Over the period 2009 to 2015 there were nearly 77,000 patent applicants and nearly 440,000 trademark applicants across Australia Over the period 2009-2014 over 1.7 million businesses were created. All indicators of innovation activity have some degree of skewness in part attributable to the location of companies’ head offices or the location of offices where the IP or R&D is being registered in major cities.
2.1 Business expenditure on Research and Development (R&D)
Business expenditure on research and development (BERD) is often linked to the generation of intellectual property (IP) by firms and individuals. The analysis presented here is based on data for the firms that have registered for the R&D Tax Incentive and does not include R&D performing firms that may not be claiming this tax offset. Firms may register for the tax offset if their claim is more than $20,000. Approximately 28 per cent of total active businesses in any given region meet this threshold.
Analysis of the correlation between BERD and IP innovation proxies showed that overall, for every 1 per cent increase in R&D expenditure, a 0.35 per cent increase was observed in the number of patent applications and a 0.40 per cent increase in the number of trademark applications (Table 2.1). Every 1 per cent increase in the number of business entries was accompanied by a 2.3 per cent increase in expenditure on R&D. Appendix Figure B1 also confirms the positive relationship between time-averaged patent and trademark statistics and median R&D expenditure, with a stronger correlation between trademarks and R&D expenditure compared to patent applications and R&D expenditure.
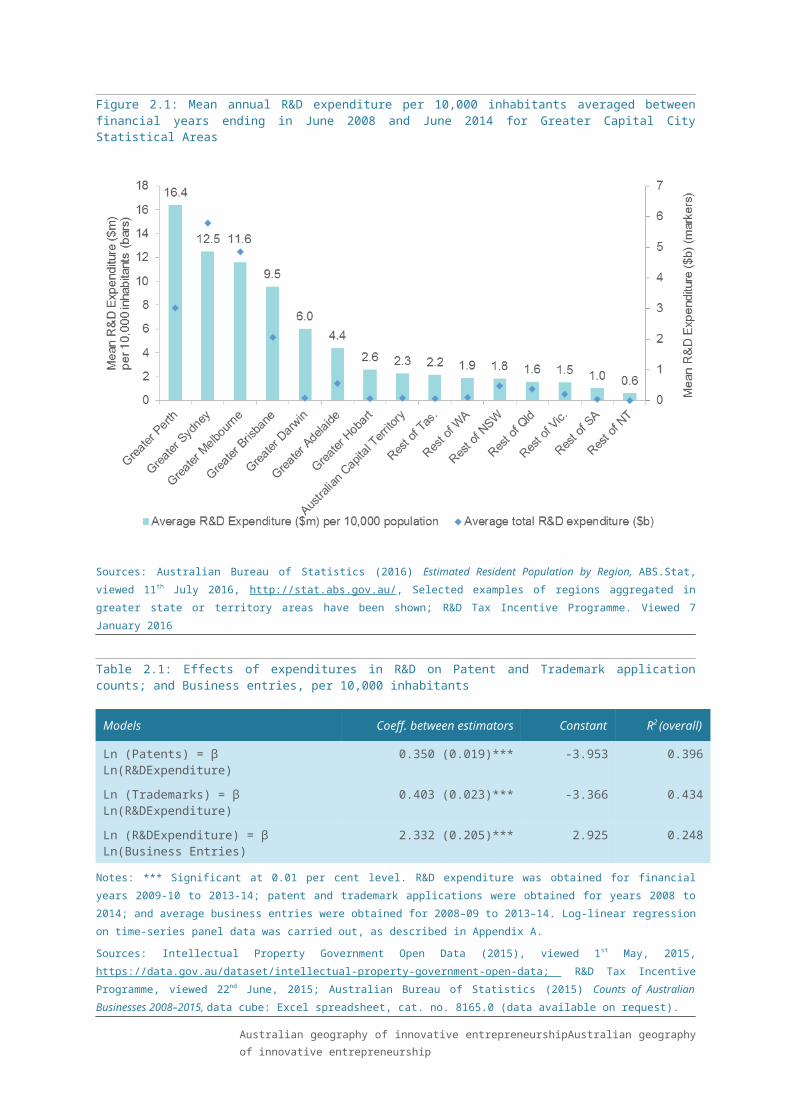
Figure 2.1 shows the mean annual R&D expenditures between 2008–09 and 2012–13 for each Greater Capital City Statistical Area (GCCSA) in both absolute dollar terms and in population-adjusted terms. In absolute dollar terms, mean R&D expenditures were concentrated in Greater Perth ($3.0 b), Greater Sydney ($5.8b), Greater Melbourne ($4.8b), and to a lesser extent in the Greater Brisbane area ($2.1b).
The highest mean annual expenditure per 10,000 inhabitants was observed in Greater Perth ($16.4m) followed by Greater Sydney ($12.5m), Greater Melbourne ($11.6m), Greater Brisbane ($9.5m) and Greater Darwin ($6.0m). A percentile map showing the distribution of the annual median R&D expenditure around Australia is shown in Map B1.
Australian geography of innovative entrepreneurshipAustralian geography of innovative
entrepreneurship

Figure 2.1: Mean annual R&D expenditure per 10,000 inhabitants averaged between financial years ending in June 2008 and June 2014 for Greater Capital City Statistical Areas
Sources: Australian Bureau of Statistics (2016) Estimated Resident Population by Region, ABS.Stat, viewed 11th July 2016,
http://stat.abs.gov.au/, Selected examples of regions aggregated in greater state or territory areas have been shown; R&D Tax
Incentive Programme. Viewed 7 January 2016
Table 2.1: Effects of expenditures in R&D on Patent and Trademark application counts; and Business entries, per 10,000 inhabitants
Models Coeff. between estimators Constant R2 (overall)
Ln (Patents) = β Ln(R&DExpenditure) 0.350 (0.019)*** -3.953 0.396
Ln (Trademarks) = β Ln(R&DExpenditure) 0.403 (0.023)*** -3.366 0.434
Ln (R&DExpenditure) = β Ln(Business Entries)
2.332 (0.205)*** 2.925 0.248
Notes: *** Significant at 0.01 per cent level. R&D expenditure was obtained for financial years 2009-10 to 2013-14; patent and
trademark applications were obtained for years 2008 to 2014; and average business entries were obtained for 2008–09 to
2013–14. Log-linear regression on time-series panel data was carried out, as described in Appendix A.
Sources: Intellectual Property Government Open Data (2015), viewed 1st May, 2015, https://data.gov.au/dataset/intellectual-
property-government-open-data ; R&D Tax Incentive Programme, viewed 22nd June, 2015; Australian Bureau of Statistics
(2015) Counts of Australian Businesses 2008–2015, data cube: Excel spreadsheet, cat. no. 8165.0 (data available on request).
2.2 Patenting
Patents are a form of intellectual property that give owners an exclusive and legally enforceable right to exploit the value of an invention. Due partly to a head office effect (patents filed by the head office rather than where the patent generation activity actually takes place), patent filing activity in
Australian geography of innovative entrepreneurshipAustralian geography of innovative
entrepreneurship

Australia is predominantly undertaken by firms and organisations in the major metropolitan areas. Overall patent applicants,19 as reported by IP Australia, have declined since 2008.
Figure 2.2 shows patent applicants between 2008 and 2014 for each GCCSA in both the absolute number of applicants registered as well as the population adjusted averages of patent applicants. In absolute terms, patent applicants were overwhelmingly concentrated in the Greater Sydney and Greater Melbourne areas. On a population adjusted basis, the highest concentration was found in the Australian Capital Territory area followed by the Greater Sydney and Greater Melbourne areas. The data shows that on a per capita basis the Australian Capital Territory recorded 21 per cent more patent applicants than any other Greater Capital city.
With the exception of Tasmania, where patent applicants in the rest of Tasmania were 20 per cent higher than the Greater Hobart area, all other capital cities recorded a higher proportion of patent applicants compared to the rest of the state or territory. In the Greater Sydney area, the numbers of applicants for patents were 2.2 times higher, per head of population, than the rest of New South Wales. The difference was higher in Victoria where applications in the Greater Melbourne area were approximately 2.6 times higher than the rest of Victoria. In Queensland, the difference between Greater Brisbane and the rest of Queensland was only a factor of 1.4, whereas differences in South Australia (Greater Adelaide and rest of South Australia), Western Australia (Greater Perth and rest of Western Australia) and Northern Territory (Greater Darwin and rest of Northern Territory) were 3.0, 2.5 and 2.6 times, respectively. A percentile map showing the distribution of annual patent applications around Australia is shown in Map B2.
19 Total patent aapplicants included National and PCT direct phase applications (Appendix B).
Australian geography of innovative entrepreneurshipAustralian geography of innovative
entrepreneurship

Figure 2.2: Annual number of patent applicants per 10,000 inhabitants averaged between 2008–2015 for Greater CITY Capital City Statistical Area
Sources: Intellectual Property Government Open Data (2016), viewed 24th May 2016, https://data.gov.au/dataset/intellectual-property-government-open-data; Australian Bureau of Statistics (2016) Estimated Resident Population by Region, ABS.Stat, viewed 11th July 2016, http://stat.abs.gov.au/
2.3 Trademarking
Trademark applicants in Australia have a similar regional distribution to patent applications.
Trademarks serve to reinforce businesses’ IP strategies and can constitute a complementary indicator of innovation performance. Figure 2.3 shows trademark applicants between 2008 and 2015 for each GCCSA in both the absolute number of applicants lodged as well as the population adjusted averages of trademark applicants. In absolute terms, trademark applicants were again overwhelmingly concentrated in the Greater Sydney and Greater Melbourne areas, similar to patents. On a population adjusted basis, Greater Sydney had the highest concentration of trademark applicants per 10,000 inhabitants. All other capital cities also registered a higher number of trademark applicants per 10,000 inhabitants compared to the surrounding areas in the respective state or territory. Trademark applicants originating in the Greater Sydney and Greater Melbourne area were 3.3 times higher than the rest of New South Wales and the rest of Victoria. The Greater Brisbane area’s trademark applicants were, on average, only 1.4 times greater than for the rest of Queensland. Trademark applicants originating in Greater Adelaide area were 2.1 times higher than the rest of South Australia and Greater Perth had 2.5 times more applicants filed compared to the rest of Western Australia. The Greater Hobart area’s trademark applicants were on average 1.6 times greater compared to rest of Tasmania, however in the Northern
Australian geography of innovative entrepreneurshipAustralian geography of innovative
entrepreneurship
Territory, applicants in Greater Darwin area were 3.4 times more than in the rest of the Northern Territory. A map showing the distribution of the annual trademark applications around Australia is shown in Map B3.
Figure 2.3: Annual number of trademark applicants per 10,000 inhabitants averaged 2008–2015, by Greater Capital City Statistical Area (GCCSA)
Sources: Intellectual Property Government Open Data (2015), viewed 24th May 2016, https://data.gov.au/dataset/intellectual-property-government-open-data; Australian Bureau of Statistics (2016) Estimated Resident Population by Region, ABS.Stat, viewed 11th July 2016, http://stat.abs.gov.au/
2.4 Entrepreneurship
For the purpose of this study, new business entry is used as a proxy measure of entrepreneurial activity.20 A geographical distribution of new business entries around Australia is shown in Figure 2.4 and Map 2.1. In absolute terms, business entries were highest in the Greater Sydney and Greater Melbourne areas, with the Rest of Queensland and Greater Brisbane areas not far behind. The average annual business entries per 10,000 inhabitants were higher in most capital cities compared to the rest of the states or territory with the exception of Queensland. Regions outside of the Greater Darwin area (i.e. the rest of Northern Territory) recorded the lowest level of entrepreneurship. In absolute terms, both Queensland and Tasmania had regions outside the greater capital city areas (the rest of Queensland and the
20 According to a World Bank group entrepreneurship survey analysis (WBGES, available at
http://siteresources.worldbank.org/INTFR/Resources/475459-1222364030476/
FP_Ent08_RR_11Nov08.final.pdf) registration of new businesses to a business registry such
as the Australian Business Registry (ABR) is a quick and efficient proxy for entrepreneurial
activity.
Business entries as counted by the ABS comprises new registrations, reactivations and
businesses that have recommenced remitting.
Australian geography of innovative entrepreneurshipAustralian geography of innovative
entrepreneurship

rest of Tasmania) that showed a higher number of business entries compared to the capital city (Figure 2.4).
Average annual business entries per 10,000 inhabitants in New South Wales and Victoria were similarly distributed, with Greater Sydney and Greater Melbourne recording 1.6 and 1.4 times higher business entries compared to rest of the state. Business entries in Greater Adelaide, Greater Perth and Greater Darwin were 1.2, 1.3 and 2.2 times higher, respectively, than the rest of the state or territory (Figure 2.4). This spatial variation is visualised in Map 2.1.
Average annual business entries by industry division are shown in Figure B2. Over the period examined Construction and Professional, Scientific and Technical Services had the highest entry rates in Australia.
A business survival analysis using panel data shows an overall three-year survival rate of 49.3 per cent (Table 2.2). The states and territories were ranked according to their annual survival rates and Tasmania was found to have the highest rates of survival, whereas in Queensland more businesses failed to survive three years after entering the market (Table 2.3). Business survival was also analysed by ANZSIC industry division (Table B1). (While survival varied by ANZSIC division, no statistically significant difference from the national average was observed for the period under consideration.
Figure 2.4: Annual business entries per 10,000 inhabitants averaged over financial years ending in 2009–2014 for Greater Capital City Statistical Areas
Sources: Australian Bureau of Statistics (2015) Counts of Australian Businesses 2008–2015, data cube: Excel spreadsheet, cat. no. 8165.0 (data available on request). Australian Bureau of Statistics (2016) Estimated Resident Population by Region, ABS.Stat, viewed 11th July 2016, http://stat.abs.gov.au/, http://www.abs.gov.au/AUSSTATS/[email protected]/DetailsPage/3235.02011
Australian geography of innovative entrepreneurshipAustralian geography of innovative
entrepreneurship

Map 2.1: Business entries per 10,000 inhabitants averaged 2009–2014, by SA3 region
Notes: Map shows five quintiles with 70–71 SA3 regions each.
Sources: Australian Bureau of Statistics (2015) Counts of Australian Businesses 2008–2015, data cube: Excel spreadsheet,
cat. no. 8165.0 (data available on request) and Department of Industry, Industry and Science (2016) National Innovation Map
Australian geography of innovative entrepreneurshipAustralian geography of innovative
entrepreneurship

Table 2.2: Survival rates for businesses born between 2009 and 2012
Overall
Births 2009–10
(per cent)
Births 2010–11
(per cent)
Births 2011–12
(per cent)
1 year survival 73.54 75.50 74.26
2 year survival 59.15 60.19 ..
3 year survival 49.34 .. ..
Notes: Slope is calculated with 100 per cent survival for the year of business entry.
Source: Australian Bureau of Statistics (2015) Counts of Australian Businesses 2008–2015, data cube: Excel spreadsheet, cat.
no. 8165.0 (data available on request)
Table 2.3: Business survival rates (per cent) by state or territory for businesses that entered in 2009–10 financial year
State1 year survival
(per cent)2 year survival
(per cent)3 year survival
(per cent)
Rate of change (per centper year) R2
Tasmania 78.0 66.4 57.3 -14.0 0.956
Australian Capital Territory 76.8 64.3 54.9 -14.8 0.956
South Australia 75.7 62.2 52.7 -15.5 0.955
Victoria 75.3 61.0 51.2 -16.1 0.957
Western Australia 75.1 59.3 49.3 -16.8 0.962
New South Wales 73.4 58.3 48.2 -17.1 0.954
Northern Territory 72.3 57.9 46.6 -17.5 0.955
Queensland 73.4 57.4 47.1 -17.5 0.958
Notes: Slope is calculated with 100 per cent survival for the year of business entry. R2 values indicate how well the data fits the
statistical model i.e. slope of regression.
Source: Australian Bureau of Statistics (2015) Counts of Australian Businesses 2008–2015, data cube: Excel spreadsheet, cat.
no. 8165.0 (data available on request)
2.5 Business creation and R&D by sector
The distribution of Australia’s Business Expenditure on R&D (BERD) since 2008 (ABS 2013) across industry divisions was compared with the distribution of new business entries in the same industries (Figure 2.5). The highest proportion of BERD occurred in the Manufacturing and Mining sectors. However, these relatively high BERD shares were not accompanied by correspondingly high proportions of business entry. No statistical significant relationship was found between R&D expenditure and business entries (see section 2.5).
The highest proportion of business entries was observed in Construction, however less than 5 per cent of national BERD occurred in this industry, as it does not have a high propensity to undertake R&D. The industries with both high BERD and high business entry shares in the national economy were found to be Professional, Scientific and Technical Services and Wholesale Trade.
Australian geography of innovative entrepreneurshipAustralian geography of innovative
entrepreneurship

A regional summary according to SA421 boundaries is shown in Table B2. The industries most likely to generate IP, such as Professional, Scientific and Technical Services were generally located in major cities. New business entries were high in regions in close proximity to or within the major metropolitan cities where the majority of Australia’s population resides. Agriculture, Forestry and Fishing-related businesses are located primarily in the regional areas where farming lands exist. Mining-related businesses are mostly based in Perth, but this most likely represents head offices located in the city closest to the regions where mining activity takes place. Business entries in the Manufacturing sector were also concentrated in the major cities, although Manufacturing entries on the Gold Coast were the highest of any other SA4 region in Australia (See Table B2).
Figure 2.5: Average annual shares of both business expenditure on R&D (BERD) and new business entries, by ANZSIC industry division
Notes: BERD data was averaged for financial years ending in 2009–2012, Business entries was averaged for financial years
ending in 2009–2014
Sources: Australian Bureau of Statistics (2013) Research and Experimental Development, Businesses, Australia, 2011–12, data cube: Excel spreadsheet, cat. no. 8104.0 and Australian Bureau of Statistics (2015) Counts of Australian Businesses 2008–2015, data cube: Excel spreadsheet, cat. no. 8165.0 (data available on request)
21 The SA4 regions are the largest sub-state regions in the main structure of the Australian
Statistical Geography Standard (ASGS). They are designed for the output of labour force data
and reflect labour markets in each state and territory within the population limits imposed by the
Labour Force Survey sample. SA4s provide the best sub-state socio-economic breakdown in
the ASGS.
Australian geography of innovative entrepreneurshipAustralian geography of innovative
entrepreneurship

2.6 Innovation and creative destruction
Innovation activities such as patenting and trademarking announce the market arrival of new technologies and products. In this study, we investigated whether such innovation is correlated with the number of businesses created in the different regions (at SA3 level) around Australia.
Figure 2.6 compares the incidence of patents, trademarks and business entries in regions where research organisations were present with the general incidence of patents, trademarks and business entries for regions across Australia as a whole. It finds that the presence of research organisations in a given SA3 region is generally correlated with a significantly higher incidence of innovative activities above all other regions. Different types of research organisations had different degrees of correlation. Most notably, universities hosting the Centres of Excellence funded by the Australian Research Council or the National Health and Medical Research Council had the strongest positive association with the number of patent and trademark applications within each region, 3.5 times above the national average.
Australian geography of innovative entrepreneurshipAustralian geography of innovative
entrepreneurship

Figure 2.6: Average annual patent, trademark and business entry counts in SA3 regions with or without research organisations, per 10,000 inhabitants, averaged for 2009–2014
Notes: Bars are standard errors [for SA3 regions]. Numbers in parentheses are the count of qualifying SA3s. One-way ANOVA
with Tukey-Kramer Multiple comparison test between all of Australian regions and regions with research organisations was
performed. ** Significant at one per cent level, *** Significant at 0.1 per cent level. Research organisations include University
campuses, the Commonwealth Scientific and Industrial Research Organisation (CSIRO), private Research Service Providers
(RSPs), Cooperative Research Centres (CRCs) and currently active Centres of Excellence (CoEs) funded by the Australian
Research Council or the National Health and Medical Research Council. CRCs and CoEs are subsets of their host institutions
which are Universities and the CSIRO.
Sources: Australian Bureau of Statistics (2011) Population by Age and Sex, Regions of Australia, 2011cat. no. 3235.0, viewed
8th May 2015, http://www.abs.gov.au/AUSSTATS/[email protected]/DetailsPage/3235.02011; business.gov.au; Intellectual Property
Government Open Data (2015), viewed 1st May 2015, https://data.gov.au/dataset/intellectual-property-government-open-data;
Australian Bureau of Statistics (2015) Counts of Australian Businesses 2008–2015, cat. no. 8165.0 (data available on request);
Universities Australia.
Figure B3 further investigates the impact of research organisations on entrepreneurship in selected sectors. The results show that the strength of the correlation varies by industry sector. Regions with a research organisation actually contain fewer new entries in Agriculture, Forestry and Fishing. There was virtually no relationship with new entries in Mining or Manufacturing. But regions with research organisations were more likely to be correlated with the presence of new entries in Information, Media and Telecommunications, Healthcare and Social Assistance services, and Professional, Scientific and Technical services. The relationship with the
Australian geography of innovative entrepreneurshipAustralian geography of innovative
entrepreneurship

latter was particularly pronounced and, as for all new entries, was accentuated in the case of universities with CRCs and Centres of Excellence. Business entries within the Professional, Scientific and Technical Services industry were found to increase by 250 per cent in regions where a Centre of Excellence was present and 233 per cent in a region where a Cooperative Research Centre was present. It is also worth noting here that many Research Service Providers are firms in the Professional, Scientific and Technical Services industry and that they consume a large fraction (more than $27 billion) of their own intermediate services in production.22
When modelling the changes in business entries against innovation proxies, the data indicates that every 1 per cent increase in the number of business entries for a region was associated with an increase in numbers of both patent applications (0.12 per cent) and trademark applications (0.21 per cent) (Table B3). In contrast to Table 2.1, Table B3 shows that once the variance of patenting and trademarking are taken into account the correlation between R&D and business entry is not significant. The Table 2.1 correlation ignores the influence of other innovation output activities such as patenting or trademarking.
For comparison, a fixed effects regression model was also tested on the data (Table B3). It assumes that there are significant geographical differences across Australia, but that these are constant over the six-year time period investigated in this study. Analysis using this model also confirms that patents are significantly positively associated with the number of business entries. However, the fixed effects model has a lower level of precision, as has the first difference model. The first difference model is an estimation of the year-on-year changes in business entries on the one-year changes in patenting and trademarking. Given the relatively short time span of the data, it was no surprise that this model did not yield any significant results (Table B3).
Regression analysis also showed (Table B4) that every 1 per cent increase in the number of business exits for a region was associated with an increase in both patent applications (0.13 per cent) and trademark applications (0.17 per cent). Of course regions with higher exit rates are also likely to have higher entry rates. As long as the net entry rate is positive we would expect to find a positive relationship with patents and trademarks. Expenditure on R&D was not significantly correlated with business exit. Not surprisingly, business churn (entry and exit) activity was also statistically significantly and positively associated with regions of high innovation activity (Table B5).
Spatial analysis of IP generation and business entries
Each region was assessed to see if its entrepreneurship activity (i.e. business entries) and innovation activities (patents and trademarks) were higher than the average of its neighbouring regions. We used spatial autocorrelation analysis. Spatial autocorrelation tests the relationship between the value of a variable at one location in space and nearby values of the same variable. It is
22 ABS (2015) Australian National Accounts: Input-output tables, 2012–13, cat. no.
5209.0.55.001
Australian geography of innovative entrepreneurshipAustralian geography of innovative
entrepreneurship

the geographic version of conventional serial correlation.23 Maps 2.2 and 2.3 show similar patterns between patent and trademark applications correlated with business entries. Significant overlaps were found in areas around Sydney, Canberra, Brisbane, Gold Coast and Sunshine Coast. More detailed charts of the Brisbane and Sydney regions are provided at Maps B4 and B5 respectively. A sectoral analysis of business entries showed that the increases in Sydney, Canberra, Brisbane, Gold Coast and the Sunshine Coast were mainly attributable to Professional, Scientific and Technical Services. Figure 2.7 shows weighted average business entry rates by industry division in the regions of high innovative entrepreneurship identified in Maps 2.2 and 2.3. Business entry is significantly higher for manufacturing and business services divisions, except Transport, Postal and Warehousing in regions of high innovation activity. Healthcare and Social Assistance and Arts and Recreation Services were similarly affected. The positive association between firm entry and innovation activity was strongest in the Information, Media and Telecommunications and Professional, Scientific and Technical Services industries.
Many regions of New South Wales and southern Queensland showed significant spatial autocorrelation where new businesses were created in the absence of patents and trademarks (Maps 2.2 and 2.3). These may be areas where firms are acquiring technology from cluster centres, or more likely industries that are not IP-intensive. Many of these businesses are found in Agriculture, Forestry and Fishing or Construction, industries which invest a disproportionately low amount of R&D compared to its rate of business entry (Figure 2.5).
23 Griffith DA, Spatial Autocorrelation. Department of Geography, Syracuse University.
Australian geography of innovative entrepreneurshipAustralian geography of innovative
entrepreneurship

Map 2.2: Spatial autocorrelation analysis with average patenting per 10,000 inhabitants and average business entries per 10,000 inhabitants
Notes: Significance calculated at five per cent level or less.
Sources: Australian Bureau of Statistics (2015) Counts of Australian Businesses 2008–2015, cat. no. 8165.0 (data available on
request) and Intellectual Property Government Open Data 2015 (IP Australia)
Australian geography of innovative entrepreneurshipAustralian geography of innovative
entrepreneurship

Map 2.3: Spatial autocorrelation analysis with average trademark applications per 10,000 inhabitants and average business entries per 10,000 inhabitants
Note: Significance calculated at five per cent or less.
Sources: Australian Bureau of Statistics (2015) Counts of Australian Businesses 2008–2015, cat. no. 8165.0 (data available on
request) and Intellectual Property Government Open Data 2015 (IP Australia).
Australian geography of innovative entrepreneurshipAustralian geography of innovative
entrepreneurship

Figure 2.7: Population-weighted average business entries, by industry, by selected region, 2008–2015
Notes: Each column represents the average business entries for a specific industry division per 10,000 population. Regions
were selected from Map 2.2 (regions identified as having both high patenting and high firm entry) and Map 2.3 (regions
identified as having both high trademarking and high firm entry). Asterisks indicate a significant difference from the All other
regions category using One Way ANOVA Tukey-Kramer multiple comparisons test. ** Significant at five per cent level, ***
Significant at one per cent level.
Sources: Australian Bureau of Statistics (2015) Counts of Australian Businesses 2008–2015, data cube: Excel spreadsheet,
cat. no. 8165.0 (data available on request) and Intellectual Property Government Open Data 2015 (IP Australia)
Australian geography of innovative entrepreneurshipAustralian geography of innovative
entrepreneurship
3. DiscussionThis empirical study aimed to identify the geographical location of innovation activity in Australia and its links with entrepreneurship. We found that across all regions of Australia, IP generation is statistically significantly correlated with entrepreneurial churn, which in turn would be expected to lead to economic and wage growth.24 The results show that there was a 0.35 per cent increase in patent applications and a 0.40 per cent increase in trademark applications for every 1 per cent increase in R&D expenditure nationally. These findings confirm industry-specific studies showing that firms with greater R&D expenditure apply for more IP.25 Further to this there is a statistically significant positive association between innovation activity and business creation, although the strength of the association between R&D and business creation depends on whether innovation output activities are included in the analysis. These results support the findings of other smaller scale studies where such relationships were found.26 The literature on economic geography shows that spatial proximity encourages firm interactions and knowledge exchange within industrial clusters. Flows of local knowledge and the networks they sustain support a region’s capacity to innovate and boost its economic growth.27 The geographical concentration of industries also generates markets for skilled labour and specialised inputs.28 A recent study even found that firms may be eight times more innovative when located in clusters.29 Our paper identifies a number of regions where the degree of innovative entrepreneurship is significantly higher than surrounding regions. Interestingly these regions do not always occur in areas where high absolute rates of innovation activity exist, such as Greater Melbourne.
Innovation drives creative destruction as innovative firms enter markets and compete with incumbents, forcing out less productive firms.30 This reallocation of resources causes higher levels of business churn through an industry with the new, innovative firms an important new source of economic growth.31 The data presented in this paper are consistent with this theory. Churn rates are statistically significantly and positively associated with innovation activity. Many regions where there is high business churn (high firm entry and exit) also exhibit high innovation activity and vice versa. The strength of these effects may be underestimated in this study. Firms with a similar technological focus are likely to benefit disproportionately from clustering. The data for innovation indicators (R&D expenditure, patent and trademark application counts) are not collected according to ANZSIC divisions, so sectoral analysis harmonised with business creation could not be performed.
Healthcare and social assistance is the largest employing industry in Australia and the number of businesses has grown strongly in recent years, 24 Casares & Khan (2016).25 Greenhalgh and Rogers (2006)26 Baptista and Swann (1999); Aharonson et al. (2013)27 Autant-Bernard et al. (2013).28 Krugman (1990)29 Aharonson et al. (2013)30 Schumpeter (1942).31 See OECD (2015)
Australian geography of innovative entrepreneurshipAustralian geography of innovative
entrepreneurship

as Australia’s ageing population has been reflected in increasing demand for health services, aged care and disability support.32 Our analysis also showed that Healthcare and social assistance had the highest start-up survival rate, consistent with the start-up survival rates reported nationally by Hendrickson et al.33 The Healthcare and social assistance industry has not shown a high propensity for undertaking R&D itself. However, the industry has a high degree of sustained collaboration with universities, hospitals and medical research institutes. It was therefore not surprising to see a remarkably consistent correlation between high business entry in this sector in regions where research organisations are present, although future research should assess the influence of hospitals and medical research institutes on activity of this sector.
The Mining industry recorded the strongest employment growth during the years 2009–201334 and has superior post survival start-up growth outcomes.35 Mining is an export-oriented industry which makes much higher investments in R&D than most other Australian industries. The higher survival rate of businesses in this industry confirms previous findings showing that many new firms thrive in innovative industries.36
Our results show that innovative entrepreneurship is typically a city phenomenon consistent with other recent US research.37 There is a significant clustering of R&D expenditure, IP generation and entrepreneurship in metropolitan Australia with some notable exceptions such as the Sunshine Coast of Queensland and the Southern Highlands in New South Wales. In regional and remote centres where agriculture is the dominant industry, innovative entrepreneurship is not apparent. However, the way in which R&D and IP generation is undertaken in many agricultural industries (through levy generated Rural Research and Development Corporations) combined with a strong head/registration office effect may understate the way in which innovative entrepreneurship occurs in this industry division.
The corridor of industries stretching from the Sunshine Coast, through Brisbane to the Gold Coast results in Queensland having a more even spread of innovative entrepreneurship than any other state in Australia. Along with the high per capita business entries in less populous central and western Queensland (Map 2.1) and the lowest business survival rate of any state or territory (Table 2.3), it might be said that Queensland is the most ‘entrepreneurial’ state in Australia.
The results of this work show that in absolute terms the majority of innovation activity is occurring in Greater Sydney and Melbourne areas. Once adjusted for population, however, areas such as Greater Adelaide and the Australian Capital Territory emerge as areas of high innovation activity. An interesting result of our analysis is the finding that on a population-adjusted basis the Australian Capital Territory is performing well on patenting and trademarking. The high levels of R&D expenditure cannot be attributed directly to the presence in the Australian Capital Territory of research organisations such as
32 AWPA (2014a)33 Hendrickson et al. (2015)34 AWPA (2014b)35 Hendrickson et al. (2015)36 Jensen et al. (2008)37 Florida & Mellander (2014)
Australian geography of innovative entrepreneurshipAustralian geography of innovative
entrepreneurship

universities and CSIRO, since these institutions are not registered for the R&D Tax Incentive, a programme for promoting business innovation, from which the data is sourced. The Australian Capital Territory has the highest Higher Education R&D expenditure intensity in Australia. The Australian Capital Territory’s performance may also be attributable to the presence of a significant number of companies, such as Boeing, BAE and Electro Optic Systems among others, selling R&D-intensive services to Australia’s defence industry (Grill 2014). Future research would benefit from incorporating private non-profit R&D, government R&D and higher education R&D data by region to develop an intensity measure of public sector research.
All indicators of innovation activity also had some degree of skewness in part attributable to the location of companies’ head offices or the location of offices where the IP or R&D is being registered in major cities. This effect was most pronounced for the R&D expenditure data where R&D is highly skewed towards large firms. Current data reporting practices limit our ability to analyse clustering of innovative entrepreneurship. While weighting the results by population removes some of the bias associated with the indicators, it does not address the characteristics of different regions such as socio-economic status of the population, access to labour, geographic features and cultural differences. Future research should account for these factors where possible.
Universities and other research organisations are frequently the source of knowledge that underpins new frontier technologies which is then protected by intellectual property. They can also be a source of educated entrepreneurs (in the case of universities) and spin off their own firms. Es-Sadki & Arundel38 show that in Europe the clustering of research organisations with higher shares of technology-intensive manufacturing and knowledge-intensive services has a positive effect on knowledge diffusion and start-ups in a region. Our data suggests that Australian research organisations, particularly those that emphasise formal industry collaborations such as CRCs, have a strong effect on a region’s entrepreneurial activity. The National Survey of Research Commercialisation shows that CRCs have a relatively high degree of commercialisation outcomes per dollar of R&D investment.39 Further research is needed to disentangle any possible causal mechanisms driving such activity. A good start would be to assess the sectoral effect by research organisations that have a specific industry focus.
The data suggests that these research hubs have specific industry effects rather than stimulating a general lift in entrepreneurship. For instance, business entries in the Professional, Scientific and Technical Services industry was statistically significantly and positively correlated with the presence of these research centres, but the Agricultural, Forestry and Fishery and Mining sectors (activity predominantly occurring in regional and remote areas of Australia) was negatively correlated. Future research needs to assess these industry specific effects against the focus of the research and the reach of the centres, i.e. does CRC for Mining drive up innovative entrepreneurship in the mining sector across Australia or does it have specific and local regional influence? Future research should also be 38 Es-Sadki & Arundel (2015)39 http://www.industry.gov.au/innovation/reportsandstudies/Pages/Summary-of-selected-CRC-
commercialisation-for-2005-06-to-2012-13.aspx, accessed 19 August 2015.
Australian geography of innovative entrepreneurshipAustralian geography of innovative
entrepreneurship

extended to include vocational education and training organisations which are an important source of knowledge for entrepreneurs.40
Our results also show that the presence of research organisations particularly those with specific industry collaborations e.g. Cooperative Research Centres, also lifted the degree of innovative entrepreneurship in a region. Research organisations themselves will be influencing the IP results as they make a substantial contribution to total patent applications in Australia. In the period 1990-2013 CRCs, medical research institutes, publicly funded research organisations and universities accounted for 9 per cent of firm standard and innovation patent applications in Australia.41
Our analysis suggests that the presence of Professional, Scientific and Technical Services is an important industry for a region’s innovative entrepreneurship (see Figure 2.6). High business entry for this sector coincides with high R&D or high IP generation. This sector has the highest concentration of researchers and engineers in the private sector.42 The sector is widely distributed throughout the economy with almost 20 other subdivisions consuming more than $1 billion worth of Professional, Scientific and Technical Services in 2009–10. Businesses seeking ideas for innovation are more likely to approach consultants in the Professional, Scientific and Technical Services industry than they are to seek ideas from research organisations.43 R&D in this sector is also less concentrated in large firms. In this context we suggest that Professional, Scientific and Technical Services acts as a transformative service industry for innovative entrepreneurship across regions of Australia.
40 Department of Industry (2013)41 IP Australia data request.42 Department of Industry and Science (2014)43 Ibid.
Australian geography of innovative entrepreneurshipAustralian geography of innovative
entrepreneurship

Appendix A Definitions and methodology
A.1 Data sources and definitions
The paper examines trends in R&D expenditure, patent and trademark activity, taking these measures as proxies for innovation, while new business entries are considered to represent entrepreneurial activity. Expenditure on R&D is considered an input indicator for innovation while patents and trademarks are intermediate output indicators of innovation (Medonca et al. 2004). For the purpose of this study, the expenditure in R&D was captured through the R&D Tax Incentive (formerly the R&D Tax Concession), which is the Australian Government’s major programme for promoting innovation. It is jointly administered by AusIndustry (on behalf of Innovation Australia) and the Australian Tax Office and provides targeted tax offsets to encourage more firms to engage in R&D.
Although care was taken to check for accuracy, there may be discrepancies due to the year of reporting by firms claiming this tax benefit. To minimise these effects, the median expenditure spanning financial years ending in June 2009 till June 2013 was taken for each SA3 region for mapping purposes. With the transition from the R&D Tax Concession to the R&D Tax Incentive programme in 2011, companies are no longer required to report where their R&D activity takes place and this has biased reporting of R&D as taking place in head office locations.
A patent is a codified form of knowledge that is a legally enforceable right to exploit an invention and to protect any potential loss of its value from other users, such as rival businesses copying the distinctive features of the invention. National phase patent applications allow the applicant protection nationally. Patent Cooperation Treaty (PCT) applications are administered by the World Intellectual Property Organization. These types of applications take automatic effect in 148 countries and allows the applicant further time to decide whether they want to pursue patent protection and in which countries
Patents have a number of significant economic effects. They effectively confer a monopoly on an invention for a finite period, in Australia for twenty years. Patents therefore shield their owners from competition for the life of the patent, or the economic life of the products that are developed from the patent. The promise of monopoly rights to exploit knowledge then encourages further innovation which can lift economic growth.
Patent counts included in this analysis comprised of standard, innovation, and provisional, non-practicing entity patent applications. All patent types were aggregated to study the geography of innovation in Australia (See Tables A1 and A2).
A standard patent gives long-term protection and control over an invention. This invention has a high novelty threshold and is significantly different from existing technology. Standard patents accounts for approximately 27 per cent of the total patent application counts in this analysis. Conversely, innovation patents have a ‘lower inventive threshold’ and lasts for a shorter period of time. These are easily granted if the applicant shows innovative incremental
Australian geography of innovative entrepreneurshipAustralian geography of innovative
entrepreneurship

advances in an existing technology. Approximately 12 per cent of the total patent application counts comprised of innovation patents. Finally, the provisional patents account for approximately 60 per cent of the cumulative patent application counts in our analysis. Provisional patents are not enforceable, but allow the applicants in a competitive industry to establish a priority date. A standard or innovation patent is filed within 12 months to acquire enforceable IP protection.
Patent records cover a long time span and their comprehensive nature allows for a detailed overview of technical knowledge over long periods. The regional segregation of this data also permits geographical comparisons; however this can be difficult to assess for very large firms. Patent counts are one of the preferred ways of measuring innovation, however it should be noted that patenting propensity varies across industry depending on its technology intensity and the relative cost of patenting versus imitation of the technology. Firms that collaborate on research and development (R&D) also patent more intensively to protect their IP rights.44
Table B4: Breakdown of the subcomponents of total domestic patent application counts used in the analysis
Year Australian Patent applications, total
Standard Patent share (per cent)
Innovation patent share (per cent)
Provisional patent share (per
cent)
NPE patent share (per cent)
2008 9,884 13.2 9.3 65.1 12.4
2009 9,472 14.2 10.5 63.6 11.6
2010 8,866 14.3 11.4 62.1 12.1
2011 8,597 14.8 12.6 60.7 11.9
2012 8,966 16.4 12.3 59.5 11.8
2013 8,943 19.8 11.8 54.1 14.2
2014 7,764 13.1 12.0 65.1 9.9
2015 7,598 8.6 12.1 67.3 12.0
Source: Intellectual Property Government Open Data (2016), viewed 24 th May 2016, https://data.gov.au/dataset/intellectual-
property-government-open-data
A trademark is a distinctive trade name, design or other expression that serves to reinforce the identity or brand of its owner. As such, trademarks are a more generic form of intellectual property (IP), and are more widely used in the economy than patents. Trademarks are considered a broader measure of innovation than patents.
Patents have been described as indicators of a firm’s technical knowledge and a signal of the firm’s intention to protect its inventions. Trademarks, on the other hand, convey information about a firm’s marketing strategy and its willingness to protect its marketing assets.45 Patents are generally concentrated in technology related industries, whereas trademarks can be registered for the entire product and service space.46 There are informational overlaps between patents and trademarks which together may signal the 44 Kleinknecht et al. 200245 Sandner & Block 201146 Greenhalgh & Rogers 2010
Australian geography of innovative entrepreneurshipAustralian geography of innovative
entrepreneurship
firm’s engagement in product innovation or the emergence of businesses in new geographical markets.
Trademark-based indicators also carry a number of sources of bias.47 For example, the existence of multiple trademark protection rights for a single brand can pose difficulties in the consolidation of counts data. International trademark registrations are based on product characteristics rather than industry classification, making sectoral comparisons challenging. There are other weaknesses in international comparability, where differences in export markets and niche targeting by firms from different countries can have a significant difference that may not directly be related to a country’s innovation status.
While no perfect indicators exist, patents and trademarks are nevertheless considered an effective proxy output indicator of innovation. For the purpose of this analysis, patent count and trademark counts for each SA3 region was obtained from years 2009 till 2015 from IP Australia.48 The limitations of patents and trademarks should be noted when interpreting the results of this analysis. One advantage these IP indicators offer is that they are geographically coded, allowing us to identify regions with high innovation activity and correlate this with a region’s business entries and exits.
47 Mendonça et al. 200448 IPGOD 2016
Australian geography of innovative entrepreneurshipAustralian geography of innovative
entrepreneurship

Table B5: Breakdown of total standard and innovation patents by source, 1990-2014
Source Applications
Percentage of Australian
firm applications
Percentage of Australian applications
Percentage of total
Total CRC, MRI, PFRO and University applications 3,445 9 5 0.70
Cooperative Research Center 71 0 0 0.00
Medical Research Institute 398 1 1 0.10
Publically Funded Research Organisation 1,134 3 2 0.20
University 1,842 5 3 0.40
Australian Entities 39,159 100 62 8
Australian Private Inventors 24,046 38 5
Australian filers 63,205 100 12
Non-resident filers 446,081 88
Total 509,286 100
Note: Applications are assigned to Universities, CRCs, MRIs and PFROs with regard to co-applicants, so if there are two applicants each is assigned 0.5 applications. Spin-off firm applications are assigned according to ownership.
Source: Intellectual Property Government Open Data (2014), viewed 1st May 2015, https://data.gov.au/dataset/intellectual-
property-government-open-data; National Survey of Research Commercialisation; Department of Health; and Department of
Industry and Science data.
A.2 Methodology
The paper uses data from the Counts of Australian Businesses (Australian Bureau of Statistics, ABS), Intellectual Property Government Open Data 2016 (IP Australia) and R&D Tax Incentive Programme and Estimated Resident Population (ABS.Stat 2016, Australian Bureau of Statistics). The counts of patent and trademark applications as well as expenditure on research and development were used as indicators of innovative activities. The regions have been separately examined at the Statistical Area Level 3 (SA3) levels according to the Australian Statistical Geography Standard 2011 (ABS 2011b). However, the results shown in Figures 2.1–2.4 of this paper are reported at Greater Capital City Statistical Areas (GCCSA), which is a higher level of aggregation as defined by the ASGS. The GCCSA separates major metropolitan city from the rest of state or territory and allows for dispersal effects from the major cities to be identified. SA3 regions aggregate into GCCSAs as shown in the Table A3.
Australian geography of innovative entrepreneurshipAustralian geography of innovative
entrepreneurship

Table B3: Australian Statistical Geography Standard — Greater Capital Statistical Area structures
State Greater Capital City Statistical Area (GCCSA) Number of SA3 regions
New South WalesGreater Sydney 47
Rest of New South Wales 44
VictoriaGreater Melbourne 40
Rest of Victoria 25
Australian Capital Territory Australian Capital Territory 9
QueenslandGreater Brisbane 39
Rest of Queensland 41
South AustraliaGreater Adelaide 19
Rest of South Australia 9
Western AustraliaGreater Perth 21
Rest of Western Australia 12
TasmaniaGreater Hobart 6
Rest of Tasmania 9
Northern TerritoryGreater Darwin 4
Rest of Northern Territory 5
Source: Australian Statistical Geography Standard (2011), cat. no. 1270.0.55.001
http://www.abs.gov.au/AUSSTATS/[email protected]/Lookup/1270.0.55.001Main+Features1July%202011
The data for business entries and expenditure on R&D was geocoded at the SA3 level and spanned from 2008–09 till 2013–14 financial years. The SA3 levels of aggregation provide a standard framework for analysis of data according to regions where the population is between 30,000 and 130,000 persons (ABS 2011b). The data for trademarks and patents from years 2003 till 2015 were geocoded by street address or suburb and converted to SA3 regions. (ABS 2011a).
The data was mapped using GeoDa v.1.6.7 (www.geoda.com) and QGIS v.2.14.2 (http://www.qgis.org) open source mapping platform. The Statistical Area Level 3 (SA3) ASGS Ed 2011 Digital Boundaries in MapInfo Interchange format was used to define SA3 regional boundaries. (ABS 2011) Maps were created according to five percentiles for each variable.
To examine the regional innovative activities by patenting, trademark and R&D expenditure and its effect on business entries, it was important to weight the data by population. The 2016 Estimated Resident Population dataset on ABS.Stat provided population counts at the SA3 region.
To understand the relationship between new firm creation and innovative activities, the population adjusted data was first normalised using a logarithmic transformation. This satisfied the condition that variables must follow a Gaussian distribution for ordinary least square (OLS) estimates. To understand the effects between different regions, we used OLS estimation with time-averaged dependent variable on the time-averaged regressors for
Australian geography of innovative entrepreneurshipAustralian geography of innovative
entrepreneurship

each individual area. Equation (1) estimates the coefficients between regressors.
While normalising with population removes some of the bias, it does not address the characteristics of different regions such as socio-economic status of the population, access to labour, geographic features and cultural differences. These factors may have profound effects on the coefficients of change and must be taken in to account in the analysis.
To address these issues, we have used the fixed effects model which assumes that all the region-specific effects do not vary over time (Equation 2). We have used this model to investigate the coefficients over a six-year time period and region specific intercept α̂ (Equation 3). The Hausman test was carried out to validate if a fixed effects model is more suitable than a random effects model. The assumption for a random effects model (Equation 4) is that the region-specific effects are distributed independently of the regressors.
The time-invariant regional effects could also be removed from the models by taking the first differences of the variables. This removes those individual region specific effects as it cancels out in the equation. The first difference model estimates the change in Y for a given change in X (Equation 5).
(1) Y i=α+x 'i β+(α i−α+ui)
(2) Y ¿=α i+ x '¿ β+u¿
(3) α̂= y i−xi' β̂
(4) Y ¿=x '¿ β+(u¿+α i )
(5) Y ¿−Y t−1=(x¿¿¿−x¿−1) ' β+ (u¿−u¿−1 )¿
∆Y i=β ∆x i+∆ui
Where:
Y i=Time averaged dependent variableobserved for individual ix i=Timeaveraged independent variable (s )observed for individuali α i∧α=Individual specific intercepts∧meaninterceptβ=Regression slopeY ¿=Dependent variable observed of individual iat timetx i=Independent variable ( s )observed of individual i at time t ui∧u¿=Individual specific error∧time specific error for iα̂=Individual specific effects afterestimation that cannot beexplained by theregressors
As the variables were log transformed the change in percentage of x predicts the change in Y by β per cent.
(6) ∆%Y i=β ∆% x i+∆ui
A spatial autocorrelation analysis was carried out to identify clusters in the data where the rates are above or below the random distribution. The Moran’s I was calculated as equation (7).
Australian geography of innovative entrepreneurshipAustralian geography of innovative
entrepreneurship

(7) I i=
NS0∑iW i , jZ iZ j
∑iZ i2
Where:
I=Moran ' s I as ameasureof spatial autocorrelationZi=Deviationof variable i ¿mean
W ij=Binary ¿weights specifying ones whenthe observationi is
aneighbour of observation j∧zerootherwise .S0=∑i∑jW ij
GeoDa was used to calculate bivariate “Local indicators of spatial association
(LISA)” to evaluate if the distribution of variable i in the neighbourhood of
variable j was significantly different from random (Anselin 1995). The Moran’s
I value was calculated as an index of dispersion (negative I values), random
distribution where no spatial autocorrelation exists (I equates to zero) and
clustering (positive I values).
Australian geography of innovative entrepreneurshipAustralian geography of innovative
entrepreneurship
Appendix B Supplementary data
Figure B8: Relationships between Median R&D Expenditure and Patents (A) and Trademarks (B) per 10,000 inhabitants
A
B
Notes: Median R&D expenditure was calculated for financial years ending June 2008–June 2014. Averages of Patents and
trademarks were calculated from 2008–2015.
Source: Australian R&D Tax Incentive Programme and Intellectual Property Government Open Data 2016 (IP Australia)
Australian geography of innovative entrepreneurshipAustralian geography of innovative
entrepreneurship
Map B4: Mean annual expenditure in R&D per 10,000 inhabitants between financial years ending in June 2008 to June 2014, by SA3 regions
Note: Map shows five quintiles with 70–71 SA3 regions each.
Sources: Australian Government R&D Tax Incentive (formerly R&D Tax concessions) Programme, Viewed 22nd June 2015
and Department of Industry, Innovation and Science (2016), National Innovation Map.
Australian geography of innovative entrepreneurshipAustralian geography of innovative
entrepreneurship

Map B5: Annual patent application counts per 10,000 inhabitants averaged 2008–2015, by SA3 regions
Note: Map shows five quintiles with 70–71 SA3 regions each.
Sources: Intellectual Property Government Open Data 2016 (IP Australia) and Department of Industry, Innovation and Science
(2016) National Innovation Map
Australian geography of innovative entrepreneurshipAustralian geography of innovative
entrepreneurship

Map B6: Annual trademark application counts per 10,000 inhabitants averaged 2008–2015, by SA3 regions
Note: Map shows five quintiles with 70–71 SA3 regions each.
Sources: Intellectual Property Government Open Data 2016 (IP Australia) and Department of Industry, Innovation and Science
(2016) National Innovation Map
Australian geography of innovative entrepreneurshipAustralian geography of innovative
entrepreneurship

Table B6: National business survival rates by ANZSIC division and year of entry
Entered 2009–10 Entered 2010–11 Entered 2011–12
ANZSIC Division
1 year survival
(per cent)
2 year survival
(per cent)
3 year survival
(per cent)
Rate of change
(per cent per
year)
1 year survival
(per cent)
2 year survival
(per cent)
Rate of change
(per cent per
year)
1 year survival
(per cent)
Rate of change
(per cent per
year)
A 75.8 64.0 55.1 -14.7 79.5 66.8 -16.6 80.2 -19.8
B 81.6 68.4 59.1 -13.6 81.3 67.5 -16.2 79.7 -20.3
C 76.1 60.1 49.0 -16.9 76.7 59.8 -20.1 76.5 -23.5
D 78.1 63.4 53.3 -15.5 71.8 57.1 -21.5 77.7 -22.3
E 73.3 55.4 43.9 -18.6 73.7 55.3 -22.4 72.2 -27.8
F 75.2 58.8 47.4 -17.4 76.7 59.2 -20.4 75.6 -24.4
G 75.2 58.6 46.7 -17.7 76.5 59.0 -20.5 74.9 -25.1
H 76.8 60.0 47.2 -17.5 76.9 59.3 -20.4 76.3 -23.7
I 72.2 55.2 44.6 -18.3 72.9 55.3 -22.3 72.3 -27.7
J 75.0 58.1 45.7 -18.0 77.1 58.6 -20.7 74.9 -25.1
K 78.0 65.8 57.9 -13.8 80.2 68.5 -15.7 81.4 -18.6
L 79.4 66.4 58.8 -13.7 78.4 65.8 -17.1 78.7 -21.3
M 76.4 60.0 48.6 -17.1 77.7 60.3 -19.8 77.0 -23.0
N 70.4 52.8 41.1 -19.4 71.8 51.8 -24.1 70.3 -29.7
O 69.9 51.1 40.2 -19.8 69.2 51.7 -24.1 71.5 -28.5
P 74.9 58.5 47.1 -17.5 76.4 57.7 -21.2 75.8 -24.2
Q 83.8 72.4 63.9 -12.0 84.4 72.2 -13.9 83.4 -16.6
R 72.0 55.4 45.0 -18.1 76.3 58.3 -20.9 74.8 -25.2
S 76.2 59.3 47.9 -17.3 75.6 58.4 -20.8 75.4 -24.6
X 37.4 25.8 20.3 -25.1 63.9 46.2 -26.9 53.2 -46.8
Mean 73.5 59.2 49.3 -16.6 75.5 60.2 -19.9 74.26 -25.7
Notes: Slope is calculated with 100 per cent survival for the year of business entry. ANZSIC Division X refers to businesses that
were not classified in the existing system. Agriculture (A), Mining (B), Manufacturing (C), Electricity, gas, water and waste
services (D), Construction (E), Wholesale (F), Retail trade (G), Accommodation and food services (H), Transport, postal and
warehousing (I), Information and telecommunications (J), Financial and insurance services (K), Rental hiring and real estate
services (L), Professional, scientific and technical service (M), Administration support services (N), Public administration and
safety (O), Education (P), Health care and social assistance (Q), Arts and recreation services (R), Other services (S).
Source: Australian Bureau of Statistics (2015) Counts of Australian Businesses 2008–2015, cat. no. 8165.0 (data available on
request)
Australian geography of innovative entrepreneurshipAustralian geography of innovative
entrepreneurship

Table B2: Annual business entries by ANZSIC divisions, averaged financial years ending in June 2009 to June 2014, by state and SA4 regions
Australian geography of innovative entrepreneurshipAustralian geography of innovative entrepreneurship39

Agric
ultu
re, F
ores
try
and
Fish
ing
Min
ing
Man
ufac
turin
g
Elec
trici
ty, G
as,
Wat
er a
nd W
aste
Se
rvic
es
Con
stru
ctio
n
Who
lesa
le T
rade
Ret
ail T
rade
Acco
mm
odat
ion
and
Food
Ser
vice
s
Tran
spor
t, P
osta
l an
d W
areh
ousi
ng
Info
rmat
ion
Med
ia
and
Tele
com
mun
icat
ions
Fina
ncia
l and
In
sura
nce
Serv
ices
Ren
tal,
Hiri
ng a
nd
Rea
l Est
ate
Ser
vice
s
Prof
essi
onal
, Sc
ient
ific
and
Tech
nica
l Ser
vice
s
Adm
inis
trativ
e an
d Su
ppor
t Ser
vice
s
Publ
ic A
dmin
istra
tion
and
Saf
ety
Educ
atio
n an
d Tr
aini
ng
Hea
lth C
are
and
Soci
al A
ssis
tanc
e
Arts
and
Rec
reat
ion
Serv
ices
Oth
er S
ervi
ces
Region (State-SA4) A B C D E F G H I J K L M N O P Q R S
Australian Capital Territory 59.3 6.5 66.2 14.7 826.8 61.2 216.8 226.2 235.0 43.7 251.2 265.0 622.0 205.8 26.2 70.3 189.0 57.7 148.2
Australian Capital Territory 57.8 6.5 64.0 14.2 822.2 59.7 208.7 213.8 231.7 42.3 246.0 260.8 615.0 202.8 25.7 68.8 184.7 56.2 144.3
Special Purpose Codes SA4 (ACT) 1.5 0.0 2.2 0.5 4.7 1.5 8.2 12.3 3.3 1.3 5.2 4.2 7.0 3.0 0.5 1.5 4.3 1.5 3.8
New South Wales 4398.8 260.8 2759.7 336.8 15234.8 3553.7 6650.8 4880.7 5680.7 1268.7 8040.8 7266.5 12534.3 4949.3 571.8 1344.0 3965.0 1372.8 3860.7
Capital Region 353.0 8.5 60.0 9.5 451.5 42.3 140.2 137.3 126.8 13.3 108.3 128.5 188.5 83.8 11.3 26.7 61.8 33.0 89.7
Central Coast 53.5 7.0 98.8 11.2 665.7 81.2 208.2 150.7 144.2 30.7 215.2 195.0 366.2 146.7 19.7 49.2 128.8 43.8 145.3
Central West 432.0 12.8 65.2 8.0 297.5 41.0 123.8 113.0 119.5 10.0 94.8 115.7 126.7 62.7 9.7 18.3 68.2 22.3 96.8
Coffs Harbour — Grafton 145.5 5.0 42.0 4.2 215.8 26.5 88.3 75.7 62.8 12.2 74.0 84.7 89.2 49.5 5.0 13.5 61.8 19.5 60.2
Far West and Orana 338.7 11.8 23.2 7.2 163.5 25.2 62.8 77.2 71.8 6.2 58.2 71.5 56.0 33.8 5.0 12.7 51.5 11.2 56.0
Hunter Valley exc Newcastle 210.0 14.8 82.2 8.3 343.0 45.5 139.0 123.0 121.7 14.0 180.7 154.2 190.7 112.2 12.0 28.0 69.3 33.3 135.5
Illawarra 67.2 7.8 70.3 9.2 441.2 62.2 171.7 130.3 116.8 19.3 180.2 166.2 261.7 103.2 13.7 43.8 127.2 35.7 120.3
Mid North Coast 212.0 6.0 52.0 7.2 324.2 37.5 127.7 112.2 101.5 11.8 94.3 109.0 124.3 66.3 10.0 20.2 95.7 24.5 94.0
Murray 251.2 5.5 38.0 39.5 181.0 25.7 69.7 67.7 67.7 6.2 79.2 93.5 75.7 35.3 6.3 12.5 47.3 13.7 55.0
New England and North West 510.7 8.5 47.5 5.5 271.5 42.3 113.0 93.5 105.3 12.3 100.0 125.3 117.7 57.8 9.2 18.5 71.3 25.7 90.8
Newcastle and Lake Macquarie 38.7 14.3 90.7 12.2 533.8 79.8 212.2 165.5 165.0 25.3 327.5 242.5 403.7 149.2 14.7 51.7 201.8 54.0 149.2
Richmond — Tweed 251.3 7.8 91.3 5.8 440.3 70.7 185.2 149.2 115.5 32.7 148.3 181.5 253.8 109.0 9.3 39.3 128.5 44.8 110.5
Riverina 371.7 5.3 59.8 6.2 238.5 42.0 90.3 80.2 93.2 5.8 123.3 107.2 84.0 54.5 7.0 12.8 64.2 16.2 70.3
Southern Highlands and Shoalhaven 87.2 4.7 49.5 5.3 252.7 35.7 118.0 90.2 61.2 11.7 98.2 99.2 134.2 52.2 6.5 20.5 54.3 20.5 57.2
Special Purpose Codes SA4 (NSW) 207.7 7.5 37.2 4.7 71.0 55.2 61.3 48.2 44.0 14.3 54.7 64.8 73.3 30.8 3.0 11.7 39.3 21.7 27.5
Australian geography of innovative entrepreneurshipAustralian geography of innovative entrepreneurship40

Table B2 continued: Annual business entries by ANZSIC divisions, averaged financial years ending in June 2009 to June 2014, by state and SA4 regions
Agric
ultu
re, F
ores
try a
nd
Fish
ing
Min
ing
Man
ufac
turin
g
Elec
trici
ty, G
as, W
ater
an
d W
aste
Ser
vice
s
Con
stru
ctio
n
Who
lesa
le T
rade
Ret
ail T
rade
Acco
mm
odat
ion
and
Food
Ser
vice
s
Tran
spor
t, P
osta
l and
W
areh
ousi
ng
Info
rmat
ion
Med
ia a
nd
Tele
com
mun
icat
ions
Fina
ncia
l and
Insu
ranc
e Se
rvic
es
Ren
tal,
Hiri
ng a
nd R
eal
Esta
te S
ervi
ces
Prof
essi
onal
, Sci
entif
ic
and
Tech
nica
l Ser
vice
s
Adm
inis
trativ
e an
d Su
ppor
t Ser
vice
s
Publ
ic A
dmin
istra
tion
and
Safe
ty
Educ
atio
n an
d Tr
aini
ng
Hea
lth C
are
and
Soc
ial
Assi
stan
ce
Arts
and
Rec
reat
ion
Serv
ices
Oth
er S
ervi
ces
Region (State-SA4) A B C D E F G H I J K L M N O P Q R S
Sydney — Baulkham Hills and Hawkesbury 93.5 5.0 89.8 12.2 577.3 167.0 239.2 110.8 132.7 40.0 354.0 304.5 541.2 150.8 19.0 59.7 149.3 42.5 122.2
Sydney — Blacktown 38.3 3.5 98.2 10.0 558.8 121.5 227.5 121.3 414.0 23.2 159.0 140.5 307.8 199.8 35.5 35.0 105.5 32.0 154.7
Sydney — City and Inner South 93.8 64.3 255.0 28.8 863.5 452.2 715.8 712.2 302.2 269.5 1429.8 1051.7 1862.7 622.5 53.0 135.3 305.0 187.3 301.2
Sydney — Eastern Suburbs 63.7 6.8 76.0 6.5 482.2 168.2 277.5 224.5 102.0 153.7 447.2 401.3 895.8 216.3 17.8 80.3 255.7 130.5 155.5
Sydney — Inner South West 40.7 6.5 254.3 25.3 1612.8 382.3 669.0 403.8 915.0 52.3 466.2 586.5 754.3 491.3 84.3 86.8 287.2 61.5 346.0
Sydney — Inner West 54.3 4.5 115.8 9.7 647.3 208.0 348.8 298.7 200.0 85.2 382.0 456.7 797.7 306.0 19.8 72.2 250.7 89.5 154.3
Sydney — North Sydney and Hornsby 125.0 18.2 127.8 15.5 509.2 304.8 401.2 301.8 133.7 164.7 1038.0 614.3 1704.8 324.3 20.5 133.8 399.2 106.5 188.5
Sydney — Northern Beaches 61.7 2.0 109.3 9.5 590.0 145.3 249.5 149.7 93.5 80.2 437.5 327.0 795.2 185.2 14.7 75.8 141.8 74.0 134.8
Sydney — Outer South West 55.7 4.5 92.0 9.8 526.8 76.0 166.2 82.8 234.7 14.7 162.3 132.7 224.5 132.0 22.7 36.3 87.0 36.8 128.0
Sydney — Outer West and Blue Mountains 63.2 5.0 94.2 14.8 646.5 85.2 190.7 114.5 216.2 26.2 171.2 163.0 293.3 134.7 19.2 48.3 88.3 41.5 155.7
Sydney — Parramatta 40.3 5.5 220.3 23.8 1465.2 337.5 545.0 323.8 709.5 50.7 352.5 439.7 668.0 485.8 62.8 75.0 246.3 45.2 247.5
Sydney — Ryde 31.2 2.0 48.0 4.3 294.3 118.8 181.8 134.3 87.8 31.5 237.8 214.3 440.7 152.2 8.8 36.3 133.7 28.7 74.8
Sydney — South West 73.5 2.5 188.5 13.2 1028.7 178.7 353.2 179.3 513.3 24.7 208.8 267.8 315.8 281.5 40.8 43.0 137.0 34.7 224.7
Sydney — Sutherland 33.8 3.0 82.7 9.5 541.0 95.5 174.2 109.3 109.2 26.5 257.7 227.8 387.0 119.8 10.5 46.7 107.2 42.3 114.5
Northern Territory 119.0 16.5 65.2 11.3 508.0 41.5 108.5 104.3 180.8 20.5 115.0 188.3 187.3 124.7 18.7 34.3 101.0 37.7 114.5
Darwin 55.7 11.0 46.8 7.8 400.3 30.2 70.2 63.0 128.3 12.3 87.7 139.2 146.2 91.0 12.5 21.7 73.7 21.8 79.8
Northern Territory — Outback 52.7 5.0 16.3 3.0 98.5 9.5 32.3 35.5 48.5 7.2 24.8 44.2 38.2 31.5 4.7 12.2 24.8 14.0 31.7
Special Purpose Codes SA4 (NT) 10.7 0.5 2.0 0.5 9.2 1.8 6.0 5.8 4.0 1.0 2.5 5.0 3.0 2.2 1.5 0.5 2.5 1.8 3.0
Australian geography of innovative entrepreneurshipAustralian geography of innovative entrepreneurship41

Table B2 continued: Annual business entries by ANZSIC divisions, averaged financial years ending in June 2009 to June 2014, by state and SA4 regions
Agric
ultu
re, F
ores
try a
nd
Fish
ing
Min
ing
Man
ufac
turin
g
Elec
trici
ty, G
as, W
ater
an
d W
aste
Ser
vice
s
Con
stru
ctio
n
Who
lesa
le T
rade
Ret
ail T
rade
Acco
mm
odat
ion
and
Food
Ser
vice
s
Tran
spor
t, P
osta
l and
W
areh
ousi
ng
Info
rmat
ion
Med
ia a
nd
Tele
com
mun
icat
ions
Fina
ncia
l and
Insu
ranc
e Se
rvic
es
Ren
tal,
Hiri
ng a
nd R
eal
Esta
te S
ervi
ces
Prof
essi
onal
, Sci
entif
ic
and
Tech
nica
l Ser
vice
s
Adm
inis
trativ
e an
d Su
ppor
t Ser
vice
s
Publ
ic A
dmin
istra
tion
and
Safe
ty
Educ
atio
n an
d Tr
aini
ng
Hea
lth C
are
and
Soc
ial
Assi
stan
ce
Arts
and
Rec
reat
ion
Serv
ices
Oth
er S
ervi
ces
Region (State-SA4) A B C D E F G H I J K L M N O P Q R S
Queensland 3732.2 343.0 1941.3 222.2 10731.3 1663.2 3760.0 2625.0 3915.5 513.5 4299.7 4886.2 6656.8 3050.8 309.5 850.7 2474.5 779.3 2848.5
Brisbane — East 49.3 7.5 100.5 10.7 580.8 94.7 169.8 85.2 155.7 17.2 173.3 208.0 350.8 137.5 16.2 38.8 100.5 31.2 127.3
Brisbane — North 35.8 8.8 64.7 9.7 387.5 72.3 157.7 88.2 217.0 23.8 144.2 169.2 307.0 128.3 14.0 36.0 99.0 37.0 99.3
Brisbane — South 79.7 12.0 138.7 17.8 672.5 184.0 332.2 269.5 503.8 46.7 335.5 404.0 617.7 345.8 28.7 71.7 272.0 63.3 186.0
Brisbane — West 56.3 10.8 47.0 6.0 248.7 60.3 125.0 76.3 83.8 25.5 205.0 158.0 454.2 89.3 10.5 39.0 133.0 31.5 68.3
Brisbane Inner City 116.0 76.7 126.8 17.3 661.5 161.8 318.8 289.3 215.8 83.3 973.0 635.8 1119.2 327.7 21.3 94.0 325.8 97.3 180.3
Cairns 270.0 16.0 89.5 10.5 520.2 56.7 165.7 164.7 194.3 22.7 157.0 237.2 236.8 151.2 15.2 42.8 113.2 34.8 141.5
Darling Downs — Maranoa 616.5 13.3 56.2 8.0 249.3 34.8 86.7 58.7 118.3 6.5 77.5 132.0 77.7 53.5 8.3 12.5 33.7 15.8 81.3
Fitzroy 371.5 24.5 66.0 9.5 438.2 30.7 122.0 93.7 167.3 10.0 108.3 183.0 156.2 98.7 8.7 34.5 88.0 24.5 155.2
Gold Coast 161.7 30.7 344.7 26.8 1873.0 362.0 676.7 473.7 470.8 107.2 745.5 917.3 1117.0 522.3 60.3 135.8 361.0 143.7 440.3
Ipswich 154.5 10.3 117.2 13.0 471.7 61.7 172.7 95.7 273.8 17.8 103.7 151.2 240.8 145.7 14.2 34.8 90.8 32.8 144.7
Logan — Beaudesert 86.8 8.2 151.7 17.2 838.7 102.0 224.5 108.3 345.0 22.2 157.3 204.0 301.8 175.8 21.3 37.2 88.7 34.0 188.5
Mackay 293.0 30.3 67.3 5.3 408.7 35.5 98.8 85.2 143.0 11.8 110.3 193.5 152.2 103.3 10.2 35.2 77.0 22.7 166.2
Moreton Bay — North 84.2 10.2 93.5 13.8 560.3 59.5 143.3 72.7 183.3 14.8 98.3 152.5 184.2 114.3 15.2 31.5 68.7 25.0 123.8
Moreton Bay — South 45.0 7.2 74.7 7.7 405.3 50.5 119.8 53.5 112.7 17.0 122.0 121.5 261.8 96.0 10.5 30.8 77.2 27.0 103.0
Queensland — Outback 305.7 12.0 24.0 5.0 119.7 15.8 43.7 45.7 54.2 4.5 26.0 57.5 30.5 29.7 6.5 7.3 13.7 12.2 41.5
Special Purpose Codes SA4 (Qld) 126.3 10.8 21.5 3.5 69.7 21.7 49.8 45.5 27.3 5.3 42.7 54.0 45.3 23.2 2.8 6.7 31.2 9.7 29.0
Sunshine Coast 149.2 17.3 162.0 16.7 1022.8 139.0 349.3 228.7 205.0 45.3 376.7 437.7 538.7 228.0 19.0 75.7 209.0 70.0 214.3
Toowoomba 122.0 8.0 49.2 5.0 297.5 33.7 104.5 59.8 112.5 7.8 108.7 120.0 137.7 69.2 5.0 19.3 65.5 18.2 85.5
Townsville 195.7 14.3 61.3 5.7 459.7 37.3 126.0 100.3 174.7 9.0 102.3 172.8 176.8 102.5 10.5 37.8 117.2 24.5 138.3
Wide Bay 413.0 14.0 85.0 13.0 445.7 49.2 173.0 130.5 157.0 15.0 132.3 177.0 150.5 108.8 11.2 29.2 109.5 24.2 134.0
Australian geography of innovative entrepreneurshipAustralian geography of innovative entrepreneurship42

Table B2 continued: Annual business entries by ANZSIC divisions, averaged financial years ending in June 2009 to June 2014, by state and SA4 regions
Agric
ultu
re, F
ores
try a
nd
Fish
ing
Min
ing
Man
ufac
turin
g
Elec
trici
ty, G
as, W
ater
an
d W
aste
Ser
vice
s
Con
stru
ctio
n
Who
lesa
le T
rade
Ret
ail T
rade
Acco
mm
odat
ion
and
Food
Ser
vice
s
Tran
spor
t, P
osta
l and
W
areh
ousi
ng
Info
rmat
ion
Med
ia a
nd
Tele
com
mun
icat
ions
Fina
ncia
l and
Insu
ranc
e Se
rvic
es
Ren
tal,
Hiri
ng a
nd R
eal
Esta
te S
ervi
ces
Prof
essi
onal
, Sci
entif
ic
and
Tech
nica
l Ser
vice
s
Adm
inis
trativ
e an
d Su
ppor
t Ser
vice
s
Publ
ic A
dmin
istra
tion
and
Safe
ty
Educ
atio
n an
d Tr
aini
ng
Hea
lth C
are
and
Soc
ial
Assi
stan
ce
Arts
and
Rec
reat
ion
Serv
ices
Oth
er S
ervi
ces
Region (State-SA4) A B C D E F G H I J K L M N O P Q R S
South Australia 1342.7 82.7 571.2 72.5 2727.2 538.5 1120.5 836.8 1203.2 138.2 1560.3 1497.2 1710.3 799.3 76.3 195.3 738.7 191.3 733.0
Adelaide — Central and Hills 185.7 28.0 130.7 16.7 570.2 166.5 304.0 291.7 204.8 60.5 875.8 617.7 713.8 201.5 18.0 66.0 299.8 62.0 163.8
Adelaide — North 150.8 8.5 115.8 13.8 659.0 104.0 226.5 127.3 361.8 17.0 137.3 178.7 230.5 199.2 17.3 34.2 114.8 31.2 169.3
Adelaide — South 88.8 10.2 100.5 9.8 630.8 88.0 197.8 121.3 169.0 25.8 196.3 204.2 355.8 132.8 15.0 43.0 133.8 33.0 136.3
Adelaide — West 44.3 8.2 99.3 8.2 389.5 99.7 168.8 119.0 270.5 19.2 140.7 213.2 215.0 153.0 10.3 23.5 86.3 30.7 108.8
Barossa — Yorke — Mid North 258.2 7.7 41.0 8.8 136.0 22.2 63.0 56.2 55.2 4.0 50.8 87.0 56.0 29.8 4.0 10.2 26.7 9.7 46.7
South Australia — Outback 137.5 9.8 17.5 4.0 96.0 13.2 47.8 29.8 48.2 1.0 49.8 60.7 32.0 24.7 4.3 5.0 28.3 4.5 36.3
South Australia — South East 433.2 7.7 58.3 9.2 231.5 37.5 104.7 85.2 86.5 8.2 100.2 123.5 96.0 53.7 6.3 11.5 43.0 18.2 68.5
Special Purpose Codes SA4 (SA) 44.2 2.7 8.0 2.0 14.2 7.5 7.8 6.3 7.2 2.5 9.3 12.3 11.2 4.7 1.0 2.0 5.8 2.2 3.2
Tasmania 402.3 25.5 156.2 26.5 684.3 105.3 316.2 281.2 291.2 44.7 292.2 332.3 404.7 146.0 27.2 55.2 205.3 64.7 189.8
Hobart 67.3 6.0 67.7 12.7 313.0 45.2 138.2 126.5 148.8 24.8 144.2 133.2 218.5 63.7 17.2 25.8 105.8 34.5 77.2
Launceston and North East 143.8 6.0 42.5 4.8 194.3 34.7 88.7 69.8 73.0 7.2 73.8 103.3 96.7 42.7 6.5 14.7 52.5 13.8 52.5
South East 60.0 4.5 15.2 2.0 46.5 6.5 18.5 24.7 18.7 3.5 16.0 19.2 30.8 10.7 0.5 4.5 11.8 7.3 10.7
Special Purpose Codes SA4 (Tas.) 7.5 2.0 1.5 2.0 3.7 2.0 2.8 3.2 2.3 1.3 3.0 4.2 2.0 2.5 0.0 1.5 1.5 0.5 1.5
West and North West 123.7 7.0 29.3 5.0 126.8 17.0 68.0 57.0 48.3 7.8 55.2 72.5 56.7 26.5 3.0 8.7 33.7 8.5 48.0
Victoria 3370.2 133.0 2348.0 247.0 12862.5 2796.3 5186.5 3879.5 4908.5 785.5 6050.2 5725.3 9372.8 3329.5 333.5 987.0 3014.5 1034.8 2913.2
Ballarat 137.7 6.0 57.0 6.8 322.7 36.3 97.5 80.8 86.3 11.2 130.3 113.0 130.0 49.8 6.0 18.5 64.8 23.5 66.8
Bendigo 130.5 7.3 48.8 6.5 267.0 35.7 102.0 75.3 66.5 11.3 88.5 89.2 136.0 45.5 7.0 19.5 54.3 23.0 64.0
Geelong 119.0 4.5 89.3 9.7 590.2 64.5 188.5 151.0 136.2 18.7 203.2 223.3 284.5 96.5 11.0 36.5 120.7 42.3 115.3
Hume 320.0 6.7 65.0 11.8 314.3 38.7 105.0 116.3 99.3 8.3 88.8 107.3 124.8 52.8 6.3 19.8 50.8 23.7 80.5
Australian geography of innovative entrepreneurshipAustralian geography of innovative entrepreneurship43

Table B2 continued: Annual business entries by ANZSIC divisions, averaged financial years ending in June 2009 to June 2014, by state and SA4 regions
Agric
ultu
re, F
ores
try a
nd
Fish
ing
Min
ing
Man
ufac
turin
g
Elec
trici
ty, G
as, W
ater
an
d W
aste
Ser
vice
s
Con
stru
ctio
n
Who
lesa
le T
rade
Ret
ail T
rade
Acco
mm
odat
ion
and
Food
Ser
vice
s
Tran
spor
t, P
osta
l and
W
areh
ousi
ng
Info
rmat
ion
Med
ia a
nd
Tele
com
mun
icat
ions
Fina
ncia
l and
Insu
ranc
e Se
rvic
es
Ren
tal,
Hiri
ng a
nd R
eal
Esta
te S
ervi
ces
Prof
essi
onal
, Sci
entif
ic
and
Tech
nica
l Ser
vice
s
Adm
inis
trativ
e an
d Su
ppor
t Ser
vice
s
Publ
ic A
dmin
istra
tion
and
Safe
ty
Educ
atio
n an
d Tr
aini
ng
Hea
lth C
are
and
Soc
ial
Assi
stan
ce
Arts
and
Rec
reat
ion
Serv
ices
Oth
er S
ervi
ces
Region (State-SA4) A B C D E F G H I J K L M N O P Q R S
Latrobe — Gippsland 402.3 11.2 84.3 11.7 495.0 43.0 169.2 138.2 121.2 15.7 158.2 176.8 168.7 83.5 9.8 25.5 77.8 26.7 111.7
Melbourne — Inner 208.3 36.2 295.3 32.7 1269.7 560.0 887.0 919.2 397.5 290.2 1554.5 1292.5 2569.3 587.2 50.8 202.3 654.8 293.2 399.2
Melbourne — Inner East 113.3 6.0 109.8 11.0 642.8 274.5 409.5 341.0 158.2 68.7 734.3 593.5 998.2 234.7 15.5 82.7 364.2 70.7 155.5
Melbourne — Inner South 117.0 8.2 183.7 13.3 815.2 280.2 449.5 281.8 222.2 79.0 656.7 575.7 1064.5 257.3 17.0 100.0 280.5 97.5 209.3
Melbourne — North East 86.3 5.0 178.5 16.0 1246.8 184.2 380.8 223.2 493.5 44.8 359.2 351.7 589.3 255.7 28.5 71.5 218.0 65.0 222.0
Melbourne — North West 62.8 2.0 170.7 18.8 943.3 164.0 272.3 162.5 505.8 27.2 243.3 276.0 334.3 215.3 35.5 42.2 120.5 38.8 194.5
Melbourne — Outer East 146.0 5.7 231.7 20.0 1327.7 233.2 405.8 241.3 233.5 52.8 431.3 350.3 737.0 253.7 19.8 86.5 188.2 68.0 248.7
Melbourne — South East 171.5 7.7 330.2 29.3 1702.7 399.3 658.0 416.7 969.8 50.8 520.0 560.2 847.0 500.5 43.0 99.0 277.0 78.3 385.3
Melbourne — West 113.0 6.5 230.0 26.8 1422.7 270.2 557.3 346.0 1027.0 56.2 377.2 450.3 771.8 421.7 50.8 97.5 274.3 88.2 331.5
Mornington Peninsula 80.2 4.5 114.0 9.7 856.2 97.0 208.3 132.8 142.8 27.5 223.8 222.2 344.3 136.5 10.3 44.7 112.0 45.2 134.8
North West 461.0 6.2 42.3 7.0 190.5 37.3 99.0 85.7 89.2 6.0 96.2 110.2 74.5 50.5 7.2 13.2 44.8 15.2 67.3
Shepparton 292.2 4.5 54.7 6.8 223.8 29.8 92.7 68.8 82.5 6.7 80.5 109.8 87.3 45.0 7.8 11.0 53.8 13.0 62.8
Special Purpose Codes SA4 (Vic.) 60.8 2.5 22.5 3.7 45.5 25.3 34.0 27.3 18.8 4.7 31.2 32.7 45.3 13.0 3.2 4.8 17.2 7.5 14.2
Warrnambool and South West 348.2 2.5 40.2 5.3 186.5 23.2 70.0 71.5 58.2 5.8 73.0 90.7 65.8 30.3 3.8 11.8 40.7 15.2 49.7
Western Australia 1560.8 394.0 981.3 105.3 6364.5 833.7 1747.5 1221.5 1937.0 234.0 2516.8 2424.8 3643.8 1377.2 121.3 392.2 1139.2 353.7 1360.2
Bunbury 206.5 8.5 67.2 6.7 418.2 36.3 118.7 82.7 77.0 9.5 118.5 146.0 149.5 69.8 4.2 20.0 64.0 19.2 92.5
Mandurah 29.8 3.5 28.7 4.0 235.8 19.0 57.8 29.5 60.2 3.0 51.2 56.8 74.7 36.7 4.0 11.0 29.3 11.2 48.3
Perth — Inner 117.5 179.5 88.8 13.7 483.8 116.0 214.2 215.3 101.5 55.5 722.8 498.3 784.5 171.3 12.2 58.8 254.3 48.2 106.2
Perth — North East 76.2 15.8 120.5 10.5 614.3 84.2 180.2 109.5 242.8 18.8 175.5 194.0 336.0 129.2 13.5 33.7 76.8 35.7 166.3
Perth — North West 146.8 45.2 185.2 18.2 1786.3 188.5 358.0 213.3 388.5 48.5 502.3 460.0 833.0 312.3 25.7 87.8 229.0 77.3 283.3
Perth — South East 123.5 50.0 195.7 20.7 1144.3 187.3 331.0 224.7 588.0 38.0 395.2 396.3 649.2 314.7 25.0 67.2 173.3 65.8 258.0
Perth — South West 123.8 31.8 171.5 14.3 943.8 134.8 261.0 170.2 228.5 41.5 349.8 368.7 588.8 176.5 19.0 67.5 206.0 63.0 195.2
Australian geography of innovative entrepreneurshipAustralian geography of innovative entrepreneurship44

Table B2 continued: Annual business entries by ANZSIC divisions, averaged financial years ending in June 2009 to June 2014, by state and SA4 regions
Agric
ultu
re, F
ores
try a
nd
Fish
ing
Min
ing
Man
ufac
turin
g
Elec
trici
ty, G
as, W
ater
an
d W
aste
Ser
vice
s
Con
stru
ctio
n
Who
lesa
le T
rade
Ret
ail T
rade
Acco
mm
odat
ion
and
Food
Ser
vice
s
Tran
spor
t, P
osta
l and
W
areh
ousi
ng
Info
rmat
ion
Med
ia a
nd
Tele
com
mun
icat
ions
Fina
ncia
l and
Insu
ranc
e Se
rvic
es
Ren
tal,
Hiri
ng a
nd R
eal
Esta
te S
ervi
ces
Prof
essi
onal
, Sci
entif
ic
and
Tech
nica
l Ser
vice
s
Adm
inis
trativ
e an
d Su
ppor
t Ser
vice
s
Publ
ic A
dmin
istra
tion
and
Safe
ty
Educ
atio
n an
d Tr
aini
ng
Hea
lth C
are
and
Soc
ial
Assi
stan
ce
Arts
and
Rec
reat
ion
Serv
ices
Oth
er S
ervi
ces
Region (State-SA4) A B C D E F G H I J K L M N O P Q R S
Special Purpose Codes SA4 (WA) 26.2 13.2 9.3 1.8 25.2 5.2 11.5 6.8 9.2 2.5 10.0 12.7 18.8 8.3 0.5 3.3 5.0 2.0 7.8
Western Australia — Outback 258.8 35.7 62.8 10.2 469.2 30.2 122.0 100.5 158.5 10.5 117.8 168.0 123.3 114.3 11.8 29.7 66.0 20.8 129.5
Western Australia — Wheat Belt 451.7 10.8 51.7 5.3 243.5 32.2 93.2 69.0 82.8 6.2 73.7 124.0 86.0 44.0 5.5 13.2 35.3 10.5 73.0
Other Territories 9.2 4.2 26.2 1.0 8.3 38.0 9.0 2.5 7.2 5.8 6.3 9.7 36.0 5.3 1.0 3.3 8.5 53.2 3.7
Other Territories 1.0 0.5 0.5 0.0 2.0 1.0 0.5 0.5 1.0 0.0 2.5 0.5 2.5 0.5 0.5 0.0 1.5 0.5 0.0
Special Purpose Codes SA4 (OT) 8.2 3.7 25.7 1.0 6.3 37.0 8.5 2.0 6.2 5.8 3.8 9.2 33.5 4.8 0.5 3.3 7.0 52.7 3.7
Grand Total 14994.5 1266.2 8915.2 1037.3 49947.8 9631.3 19115.8 14057.7 18359.0 3054.5 23132.5 22595.3 35168.2 13988.0 1485.5 3932.3 11835.7 3945.2 12171.7
Notes: Data for ANZSIC Division X are not shown. Division X refers to businesses that were not classified in the existing system; hence their exact industry classification is unknown. Agriculture (A),
Mining (B), Manufacturing (C), Electricity, gas, water and waste services (D), Construction (E), Wholesale (F), Retail trade (G), Accommodation and food services (H), Transport, postal and
warehousing (I), Information and telecommunications (J), Financial and insurance services (K), Rental hiring and real estate services (L), Professional, scientific and technical service (M),
Administration support services (N), Public administration and safety (O), Education (P), Health care and social assistance (Q), Arts and recreation services (R), Other services (S).
Source: Australian Bureau of Statistics (2015) Counts of Australian Businesses 2008–2015, cat. no. 8165.0 (data available on request)
Australian geography of innovative entrepreneurshipAustralian geography of innovative entrepreneurship45

Figure B9: Business entries per 10,000 inhabitants averaged over 2008–2013 financial years, by ANZSIC Division
Sources: Australian Bureau of Statistics (2011) Population by Age and Sex, Regions of Australia, 2011, cat. no. 3235.0, viewed
8th May 2015, http://www.abs.gov.au/AUSSTATS/[email protected]/DetailsPage/3235.02011 and Australian Bureau of Statistics (2015)
Counts of Australian Businesses 2008–2015, cat. no. 8165.0 (data available on request)
Australian geography of innovative entrepreneurshipAustralian geography of innovative
entrepreneurship

Figure B10: Annual business entries in SA3 regions with research institutions, by selected sector per 10,000 inhabitants averaged for 2009–2014
Notes: Bars are standard errors [for SA3 regions]. One-way ANOVA with Tukey-Kramer Multiple comparison test between all of Australian regions and regions with research organisations was performed. ** Significant at one per cent level, *** Significant at 0.1 per cent level. Research organisations include University campuses, the Commonwealth Scientific and Industrial Research Organisation (CSIRO), private Research Service Providers (RSPs), Cooperative Research Centres (CRCs) and currently active Centres of Excellence (CoEs) funded by the Australian Research Council or the National Health and Medical Research Council. CRCs and CoEs are subsets of their host institutions which are Universities and the CSIRO. Sources: Australian Bureau of Statistics (2011) Population by Age and Sex, Regions of Australia, 2011, cat. no. 3235.0, viewed 8th May 2015, http://www.abs.gov.au/AUSSTATS/[email protected]/DetailsPage/3235.02011 Intellectual Property Government Open Data (2015), viewed 1st May 2015, https://data.gov.au/dataset/intellectual-property-government-open-data and Australian Bureau of Statistics (2015) Counts of Australian Businesses 2008–2015, cat. no. 8165.0 (data available on request)
Australian geography of innovative entrepreneurshipAustralian geography of innovative
entrepreneurship

Table B3: Regression coefficients (and standard error) of change in business entries by patents, trademarks and R&D expenditure according to different estimation models
Ln (Business entries)
Mean Coeff. Between estimators
Coeff. Fixed effects Coeff. First differences
4.78 (0.41)
Ln (Patents) 0.95 (0.88) 0.123 (0.032) *** 0.086 (0.012) *** 0.026 (0.010)***
Ln (Trademarks) 2.27 (0.98) 0.207 (0.027) *** 0.021 (0.017) 0.028 (0.013)*
Ln (R&D Expenditure) 14.07 (1.67) -0.001 (0.013) -0.019 (0.009) * -0.022 (0.008)***
Constant 4.204 (0.152) 4.925 (0.132)
R2 0.500 (overall) 0.370 (overall) 0.015
α̂ (Std. dev.) -4.03e-11 (0.33)
Notes: Panel data analysed for years 2008–2014 to obtain a balanced design. Data for expenditure on R&D was only available
for financial years ending in June 2009 –June 2013. * Significant at five per cent ** Significant at one per cent, *** Significant at
0.1 per cent.
Source: Intellectual Property Government Open Data (2015), viewed 1st May, 2015, https://data.gov.au/dataset/intellectual-
property-government-open-data ; R&D Tax Incentive Programme, viewed 22nd June, 2015; Australian Bureau of Statistics
(2015) Counts of Australian Businesses 2008–2015, cat. no. 8165.0 (data available on request).
Table B4: Regression coefficients (and standard error) of change in business exits by patents, trademarks and R&D expenditure according to different estimation models
Ln (Business exits)
Mean(Overall Std. dev.)
Coeff. Between estimators
Coeff. Fixed effects Coeff. First differences
4.77 (0.37)
Ln (Patents) 0.95 (0.88) 0.129 (0.032) *** 0.039 (0.007) *** 0.007 (0.008)
Ln (Trademarks) 2.27 (0.98) 0.165 (0.027) *** 0.003 (0.010) 0.001 (0.010)
Ln (R&D Expenditure) 14.07 (1.67) -0.008 (0.013) 0.000 (0.005) 0.000 (0.006)
Constant 4.424 (0.151)*** 4.767 (0.079)***
R2 0.459 (overall) 0.389 (overall) 0.001
α̂ (Std. dev.) -4.14e-10 (0.313)
Notes: Panel data analysed for years 2008–2014 to obtain a balanced design. Data for expenditure on R&D was only available
for financial years ending in June 2009–June 2013. * Significant at five per cent ** Significant at one per cent, *** Significant at
0.1 per cent.
Source: Intellectual Property Government Open Data (2015), viewed 1st May, 2015, https://data.gov.au/dataset/intellectual-
property-government-open-data ; R&D Tax Incentive Programme, viewed 22nd June, 2015; Australian Bureau of Statistics
(2015) Counts of Australian Businesses 2008–2015, cat. no. 8165.0 (data available on request).
Australian geography of innovative entrepreneurshipAustralian geography of innovative
entrepreneurship

Table B5: Regression coefficients (and standard error) of change in business churn by patents, trademarks and R&D expenditure according to different estimation models
Ln (Business churn)
Mean(Overall Std. dev.)
Coeff. Between estimators
Coeff. Fixed effects Coeff. First differences
5.47(0.38)
Ln (Patents) 0.95 (0.88) 0.13 (0.031)*** 0.061 (0.007) *** 0.016 (0.004)***
Ln (Trademarks) 2.27 (0.98) 0.18 (0.026)*** 0.011 (0.010) 0.014 (0.005)*
Ln (R&D Expenditure) 14.07 (1.67) -0.01 (0.012) -0.010 (0.005) -0.010 (0.003)***
Constant 5.01 (0.149)*** 5.546 (0.077)***
R2 0.512 (overall) 0.405 (overall) 0.023
α̂ (Std. dev.) -8.48e-11 (0.317)
Notes: Panel data analysed for years 2008–2014 to obtain a balanced design. Data for expenditure on R&D was only available
for financial years ending in June 2009 –June 2013. * Significant at five per cent ** Significant at one per cent, *** Significant at
0.1 per cent.
Source: Intellectual Property Government Open Data (2015), viewed 1st May, 2015, https://data.gov.au/dataset/intellectual-
property-government-open-data ; R&D Tax Incentive Programme, viewed 22nd June, 2015; Australian Bureau of Statistics
(2015) Counts of Australian Businesses 2008–2015, data cube: Excel spreadsheet, cat. no. 8165.0 (data available on request).
Australian geography of innovative entrepreneurshipAustralian geography of innovative
entrepreneurship

Map B4: Geography of IP generation, R&D expenditure and business entries in greater Brisbane region per 10,000 inhabitants
Notes: Quintiles and source as described in Maps 2.1 and B1–B3
Source: Department of Industry, Innovation and Science (2016) National Innovation Map
Australian geography of innovative entrepreneurshipAustralian geography of innovative
entrepreneurship

Map B5: Geography of IP generation, R&D expenditure and business entries in greater Sydney region per 10,000 inhabitants
Notes: Quintiles and source as described in Maps 2.1 and C2–C4
Source: Department of Industry, Innovation and Science (2016) National Innovation Map
Australian geography of innovative entrepreneurshipAustralian geography of innovative
entrepreneurship

References
Ács Z (2005) Innovation and the growth of cities, Contributions to Economic Analysis 266: 635–58
Ács Z & Armington C (2004) Employment growth and entrepreneurial activity in cities, Regional Studies 38: 911–27
Ács ZJ, Autio, E and Szerb, L (2014) National Systems of Entrepreneurship: Measurement issues and policy implications, Research Policy, 43, pp. 476–494
Aharonson BS, Baum, JAC and Feldman MP (2014) Industrial Clustering and Innovative Output, in Rowe F and Te’Eni D (eds), Innovation and IT in an International Context, Palgrave Macmillan, pp. 65–85
Anselin L (1995) Local Indicators of Spatial Association-LISA Geographical Analysis 27, pp. 93–115
Audretsch DB (2003) Innovation And Spatial Externalities, International Regional Science Review 26: 167–74
Australian Bureau of Statistics (2014a) Innovation in Australian Business,2012–13, cat. no. 8158.0
Australian Bureau of Statistics (2014b) Regional Population Growth, Australia, cat. no. 3218.0
Australian Bureau of Statistics (2013) Research and Experimental Development, Businesses, Australia, BERD 2011–12, data cube: Excel spreadsheet, cat. no. 8104.0
Australian Bureau of Statistics (2011a) Australian Standard Geographical Classification (ASGC) Digital Boundaries, cat. no. 1259.0.30.001, viewed 1 May 2015, http://www.abs.gov.au/ausstats/[email protected]/mf/1259.0.30.001
Australian Bureau of Statistics (2011b) Australian Statistical Geography Standard (ASGS): Volume 1—Main Structure and Greater Capital CityStatistical Area, cat. no. 1270.0.55.006, viewed 1 May 2015, http://www.abs.gov.au/AUSSTATS/[email protected]/DetailsPage/1270.0.55.001July%202011
Australian Workforce and Productivity Agency (AWPA 2014a), Industry snapshot: Healthcare and social assistance, viewed 17 June 2015 http://www.awpa.gov.au/our-work/Workforce%20development/national-workforce-development-strategy/2013-workforce-development-strategy/Documents/2013%20Industry%20Snapshots/Q-Health-care-and-social-assistance.pdf
Australian Workforce and Productivity Agency (AWPA 2014b), Industry snapshot: Mining, viewed 17 June 2015
Australian geography of innovative entrepreneurshipAustralian geography of innovative
entrepreneurship

http://www.awpa.gov.au/our-work/Workforce%20development/national-workforce-development-strategy/2013-workforce-development-strategy/Documents/2013%20Industry%20Snapshots/B-Mining.pdf
Autant-Bernard C, Fadairo, M and Massard, N (2013) Knowledge diffusion and innovation policies within the European regions: Challenges based on recent empirical evidence, Research Policy, 42(1), pp. 196–210
Baptista R and Swann GP (1999) A comparison of clustering dynamics in the US and UK computer industries. Journal of Evolutionary Economics, 9(3),pp. 373–399.
Braunerhjelm P et al. (2010) The missing link: Knowledge diffusion and entrepreneurship in endogenous growth, Small Business Economics 34: 105–25
Casares M & Khan HU (2016) Business dynamism and economic growth: US regional evidence, Carleton Economic Papers 16-03.
Coy P and Lu W (2015) The Bloomberg Innovation Index, http://www.bloomberg.com/graphics/2015-innovative-countries/ , viewed 15 May 2015
Department of Industry (2013) Australian Innovation System Report—2013, Canberra
Department of Industry and Science (2014) Australian Innovation System Report 2014, Canberra
Department of Infrastructure and Regional Development (2013) State of Australian Cities 2013, Canberra
Enright MJ and Roberts BH (2001) Regional Clustering in Australia, Australian Journal of Management, 26, Special Issue
Es-Sadki N and Arundel A (2015) The impact of the regional environment on the knowledge transfer outcomes of public research organisations: preliminary results for Europe, Maastricht Economic and Social Research Institute on Innovation and Technology (UNU Merit), working paper #2015–017
Fagerberg J (2013) Innovation—a New Guide, University of Oslo, TIK Working Papers on Innovation Studies No. 20131119
Fallah B, Partridge MD & Rickman DS (2014) Geography and high-tech employment growth in US counties, Journal of Economic Geography 14: 683-720
Feldman MP & Audretsch DB (1999) Innovation in cities: Science-based diversity, specialization and localized competition, European Economic Review 43: 409–29
Florida R & Mellander C (2014) Rise of the startup city: The changing geography of the venture capital financed innovation, Center of Excellence for Science and Innovation Studies, CENSIS Working Paper No. 377
Australian geography of innovative entrepreneurshipAustralian geography of innovative
entrepreneurship

Greenhalgh C & Rogers M (2010) Innovation, intellectual property, and economic growth, Princeton University Press
Greenhalgh C & Rogers M (2006) The value of innovation: The interaction of competition, R&D and IP, Research Policy, 35(4), pp. 562–580
Grill R (2014) Interpreting the emergence and development of high technology industry clusters in selected second tier global regions, PhD thesis, The University of Adelaide, July
Hendrickson L, Balaguer A, Bucifal S and Hansell D (2015) The employment dynamics of Australian entrepreneurship, Department of Industry and Science, Research Paper, forthcoming
Institute for Strategy and Competitiveness, Harvard Business School, viewed1 June 2015 http://www.isc.hbs.edu/competitiveness-economic-development/frameworks-and-key-concepts/Pages/clusters.aspx
Jensen PH, Webster, E and Buddelmeyer H (2008) Innovation, technological conditions and new firm survival. The Economic Record, 84(267), pp. 434–448
Ketels CHM (2011) Clusters and competitiveness: Porter's contribution, In Huggins R and Izushi H (eds), Competition, Competitive Advantage, and Clusters: The Ideas of Michael Porte r , Oxford University Press, pp. 173–192
Kleinknecht A, Van Montfort, K and Brouwer, E (2002) The non-trivial choice between innovation indicators, Economics of Innovation and new technology, 11(2) 109–121
Krugman P (1990) Increasing returns and economic geography, National Bureau of Economic Research, paper no. w3275
Lentz R and Mortensen DT (2008) An empirical model of growth through product innovation. Econometrica 76(6) pp. 1317–1373
Marsh I and Shaw B (2000) Australia's wine industry: collaboration and learning as causes of competitive success, Australian Business Foundation, Sydney
McGlade A (2014) Why South Korea Will Be The Next Global Hub For Tech Startups. Forbes, http://www.forbes.com/sites/alanmcglade/2014/02/06/why-south-korea-will-be-the-next-global-hub-for-tech-startups/ , viewed 5 May 2015
Mendonça S, Pereira TS and Godinho MM (2004) Trademarks as an indicator of innovation and industrial change. Research Policy 33(9) pp. 1385–1404
Nguyen T and Hansell D (2014) Firm dynamics and productivity growth in Australian manufacturing and business services, Australian Bureau ofStatistics research paper, October, http://apo.org.au/node/41800, viewed16 June 2015
Australian geography of innovative entrepreneurshipAustralian geography of innovative
entrepreneurship

OECD (2007) The contribution of economic geography to GDP per capita, Organisation for Economic Co-operation and Development, Paris ECO/CPE/WP1(2007)12
OECD (2013) OECD Regions at a Glance 2013, Organisation for EconomicCo-operation and Development, Paris
OECD (2016) OECD Innovation Strategy 2016, http://www.oecd.org/sti/OECD-Innovation-Strategy-2015-CMIN2015-7.pdf, accessed 29 June 2015.
Porter ME (1998) Clusters and the New Economics of Competition, Harvard Business Review, November–December
Porter ME (1998) Clusters and the New Economics of Competition, Harvard Business Review, November–December
Rodrigues-Pose A and Comptour F (2012) Do Clusters Generate Greater Innovation and Growth? An Analysis of European Regions, The Professional Geographer, 64(2).
Rothwell J, Lobo, J, Strumsky, D and Muro, M (2013) Patenting Prosperity: Invention and Economic Performance in the United States and its Metropolitan Areas, Brookings Institution
Sandner PG and Block J (2011) The market value of R&D, patents, and trademarks, Research Policy, 40(7), pp. 969–985
Santarelli E and Vivarelli M (2007) Entrepreneurship and the process of firms’ entry, survival and growth, Industrial and Corporate Change, 16(3), pp. 455–488
Schumpeter J (1942) Capitalism, socialism, and democracy, Harper & Bros. New York
Smith R (2013) Economic geography and innovation clusters, DIICSRTE Working Paper 2012–01
Soames L, Brunker D and Talgaswatta T (2011) Competition, innovation and productivity in Australian businesses. Productivity Commission and Australian Bureau of Statistics
von Hippel EA (1994) ‘Sticky information’ and the locus of problem solving: Implications for innovation, Management Science 40(4): 429–439
Australian geography of innovative entrepreneurshipAustralian geography of innovative
entrepreneurship