Embed Size (px)
Citation preview
Geography 312 (Natural Hazards)
Instructor: Ian Hutchinson (RCB7226)ph: 778-782-3232 email: [email protected]
Course email: [email protected]: Elizabeth Baird & Andrew
Perkins
Geography 312 - Lecture 1 Course outline
- schedule, lectures, assignments, - text, grades
Term project
Course themes
Lecture schedule The course schedule and all the Powerpoint
lecture slides are available on the web. Go to:
http://www.sfu.ca/~ianh/geog312/
“Thumbnail” versions are available for purchase.
The lectures are NOT taped.
Tutorials/Assignments To preview the assignments go to the course
web site. Printed versions of each assignment will be handed out prior to each tutorial.
Suggested readings for each tutorial are available on the web site as pdf’s
Tutorial grades are based on participation in workshops and discussion groups. Assignments are for educational purposes; they are not graded.
Text, Grading….
• Text - Keller, E.A., Blodgett, R.H. & Clague, J.J. 2008. “Natural Hazards”. Pearson Canada
• Grading Tutorial participation: 20% Term project 30% Midterm exam 20% Final exam 30%*
Term project
Choose a topic (check with TA); Keep a journal (notes, lists of
sources, etc.); Prepare a poster in Powerpoint; Copy the poster to a CD (along
with your journal)
The concept of “natural” hazards
Definition:“Events associated with normal*geophysical and biological processes that cause death, injury or loss of home, property or income”.
* the intensity of the hazard may be influenced by human modifications of the landscape (e.g. deforestation and urbanization influence flood frequency and magnitudes) or climate (e.g. heat waves in urban areas).
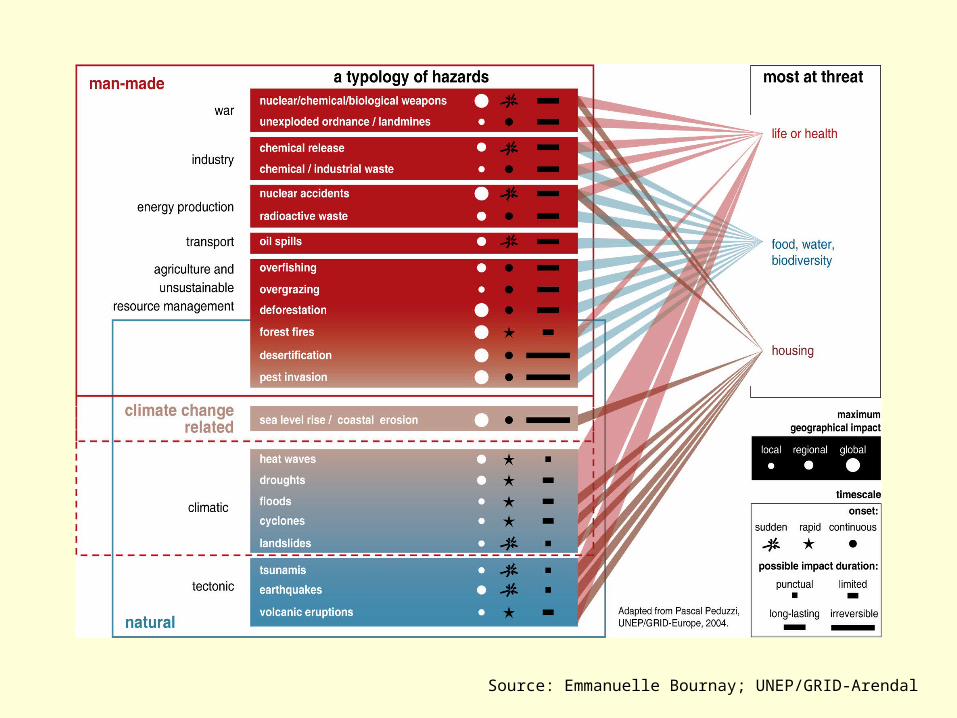
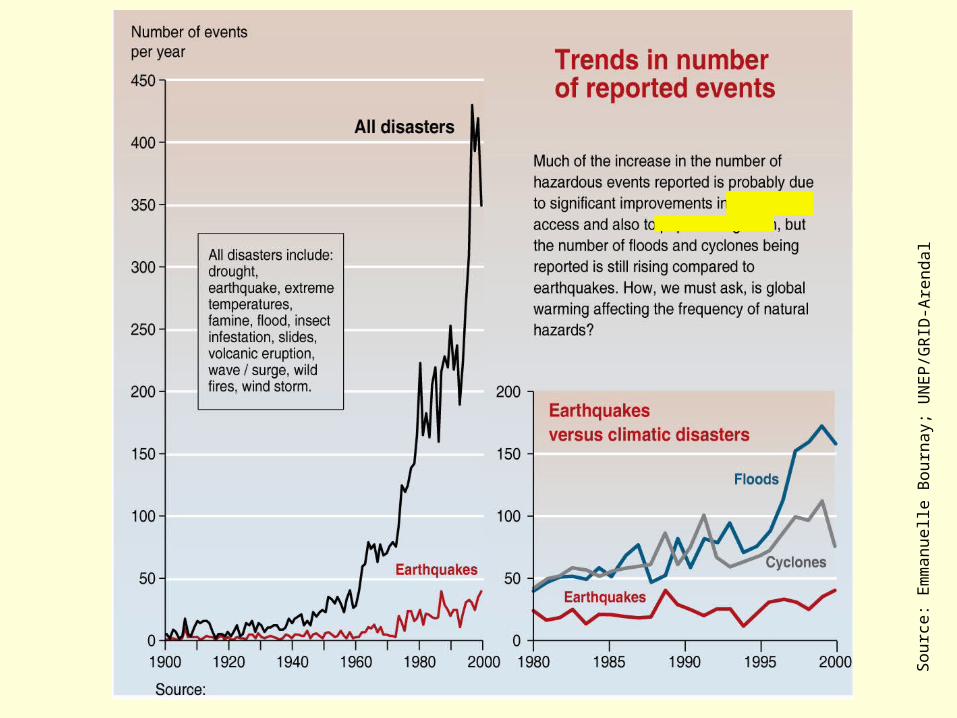
Source: Emmanuelle Bournay; UNEP/GRID-Arendal
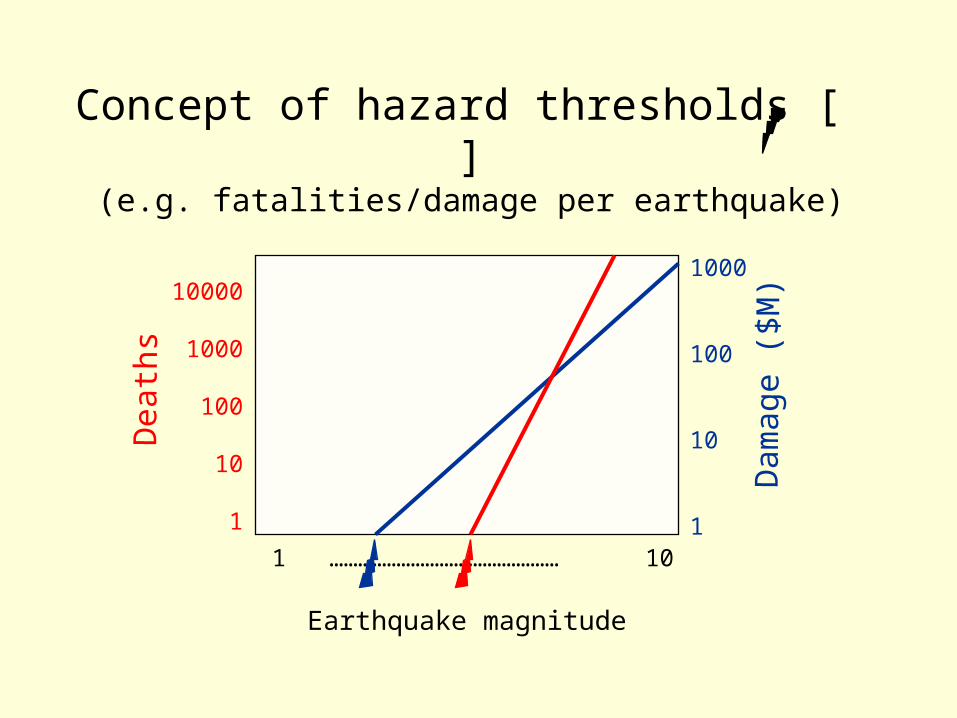
Concept of hazard thresholds [ ] (e.g. fatalities/damage per earthquake)
Earthquake magnitude
Death
s
Dam
age (
$M
)
1 ………………………………………… 10
10000
1000
100
10
1
1000
100
10
1
Natural Hazards• From the preceding it follows that:
Natural hazards are associated with extreme events in the normal operation of the planet’s geological, hydrological and ecological systems.
Natural hazards are limited to inhabited areas (i.e. vulnerable settlements or economic infrastructure).
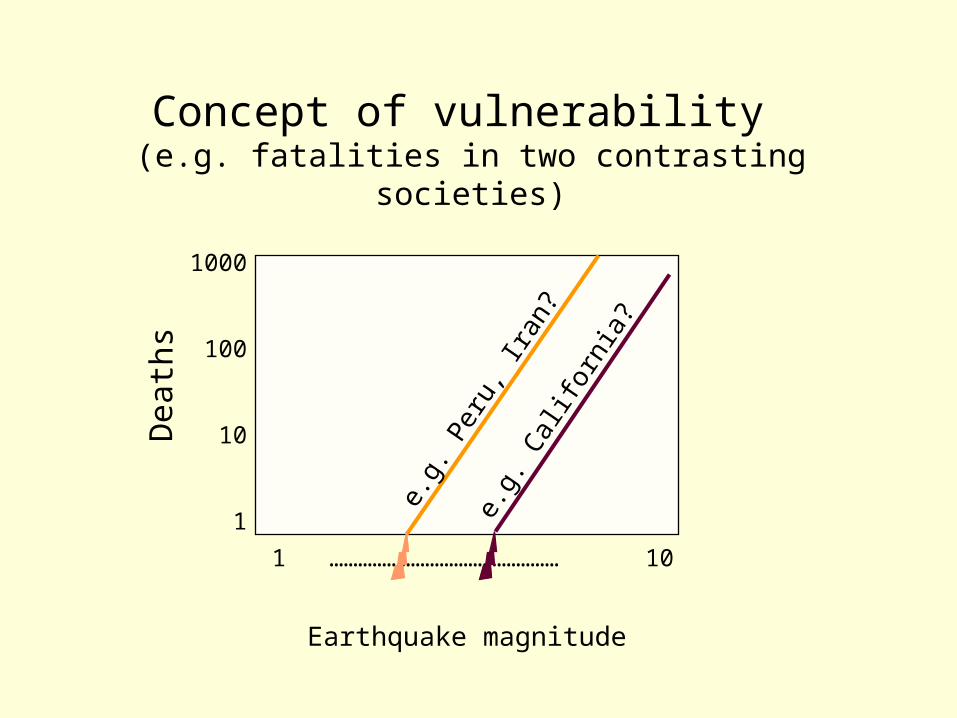
Concept of vulnerability (e.g. fatalities in two contrasting societies)
Death
s
1 ………………………………………… 10
1000
100
10
1
Earthquake magnitude
e.g.
Per
u, Ir
an?
e.g.
Cal
iforn
ia?
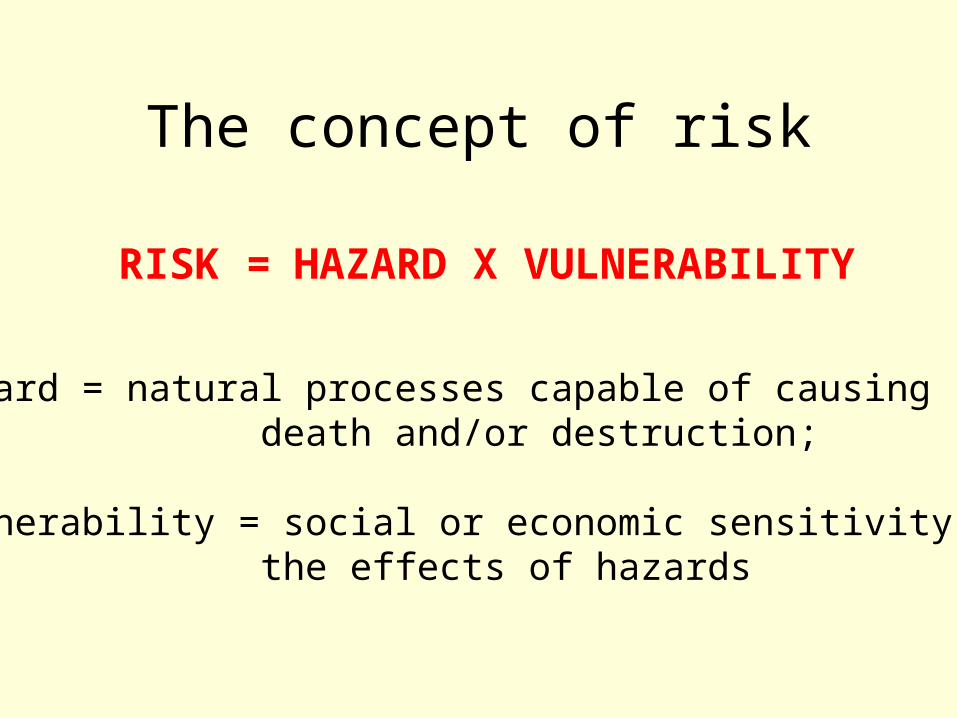
The concept of risk
RISK = HAZARD X VULNERABILITY
Hazard = natural processes capable of causing death and/or destruction;
Vulnerability = social or economic sensitivity to the effects of hazards
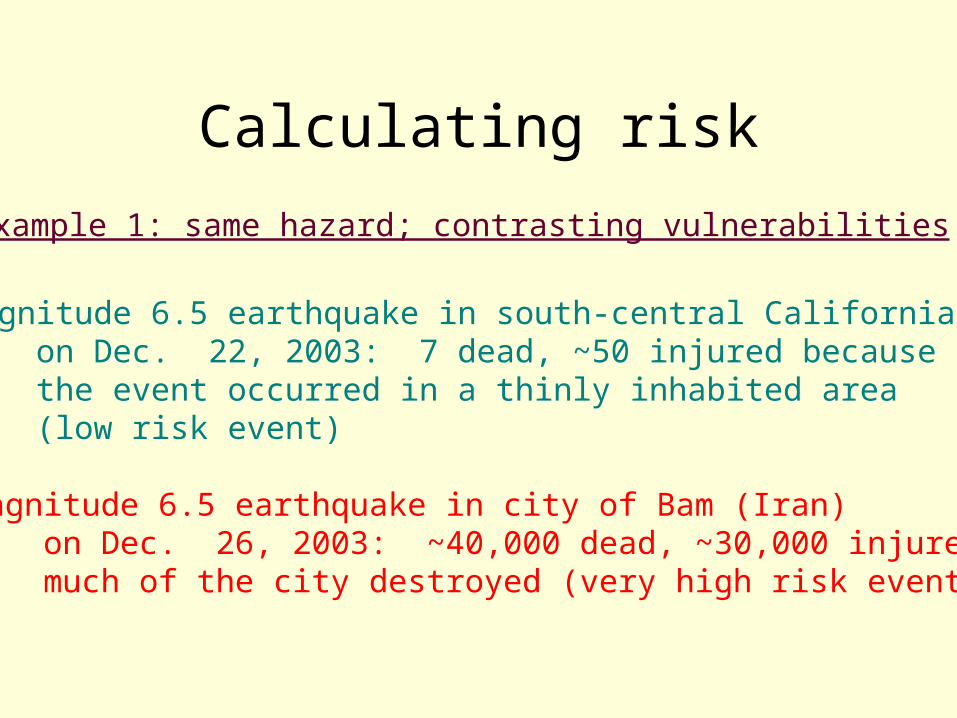
Calculating risk
Example 1: same hazard; contrasting vulnerabilities
Magnitude 6.5 earthquake in south-central California, on Dec. 22, 2003: 7 dead, ~50 injured because the event occurred in a thinly inhabited area (low risk event)
Magnitude 6.5 earthquake in city of Bam (Iran) on Dec. 26, 2003: ~40,000 dead, ~30,000 injured; much of the city destroyed (very high risk event)
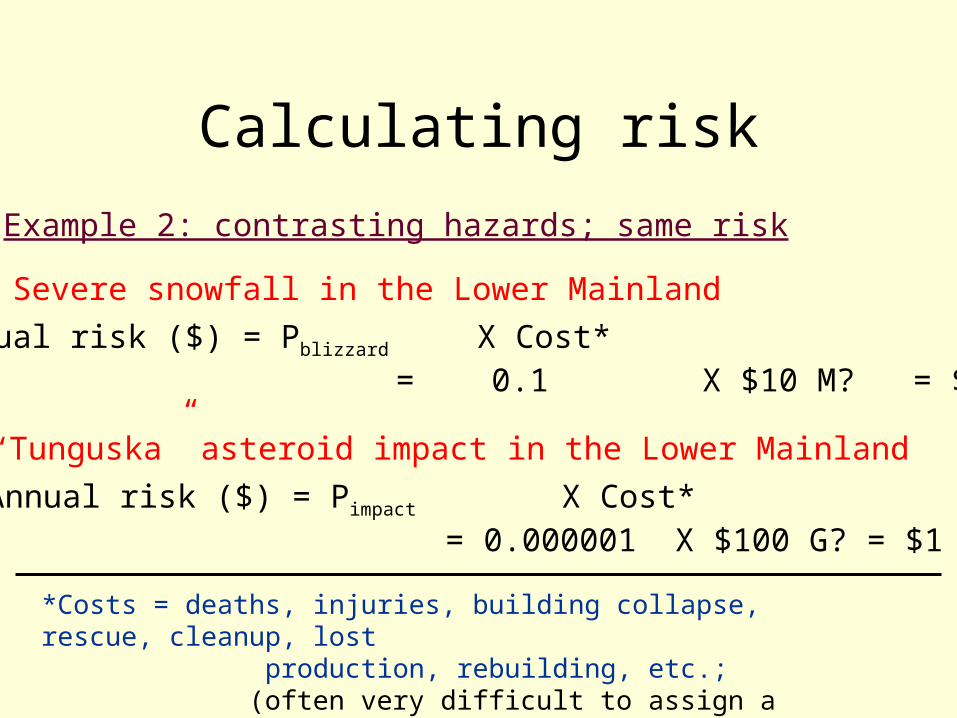
Calculating risk
Example 2: contrasting hazards; same risk
Severe snowfall in the Lower Mainland
Annual risk ($) = Pblizzard X Cost* = 0.1 X $10 M? = $1 M
Annual risk ($) = Pimpact X Cost* = 0.000001 X $100 G? = $1 M?
“Tunguska” asteroid impact in the Lower Mainland
*Costs = deaths, injuries, building collapse, rescue, cleanup, lost production, rebuilding, etc.; (often very difficult to assign a dollar value).
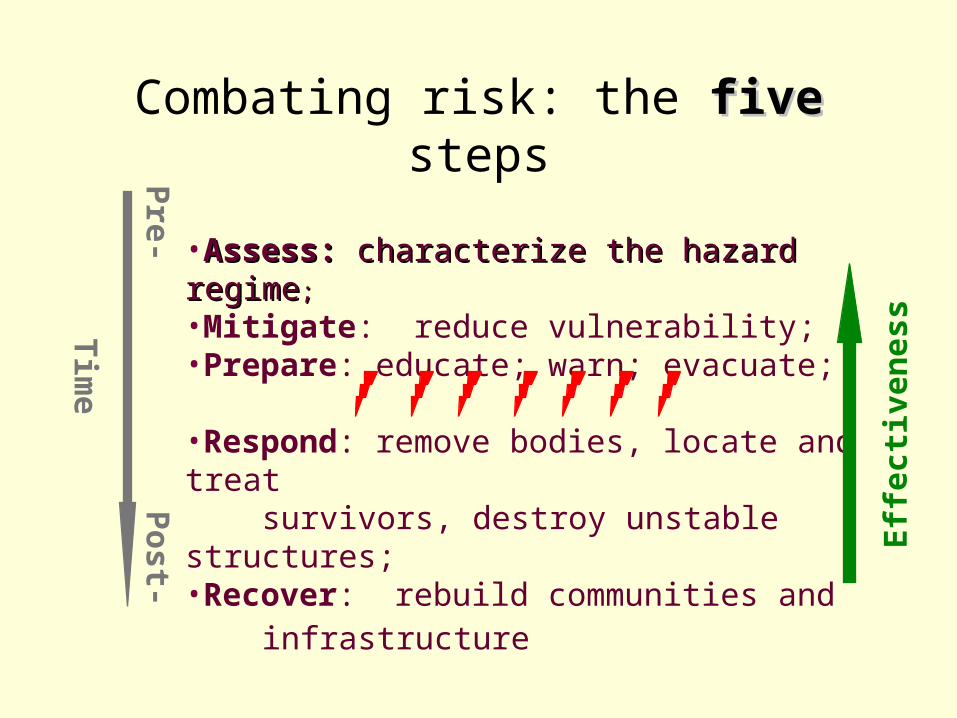
Combating risk: the fivefive steps
•Assess: Assess: characterize the hazard regimecharacterize the hazard regime;;
•Mitigate: reduce vulnerability;•Prepare: educate; warn; evacuate;
•Respond: remove bodies, locate and treat survivors, destroy unstable structures;•Recover: rebuild communities and infrastructure Eff
ect i
ven
essT
ime
Pre
- Post-
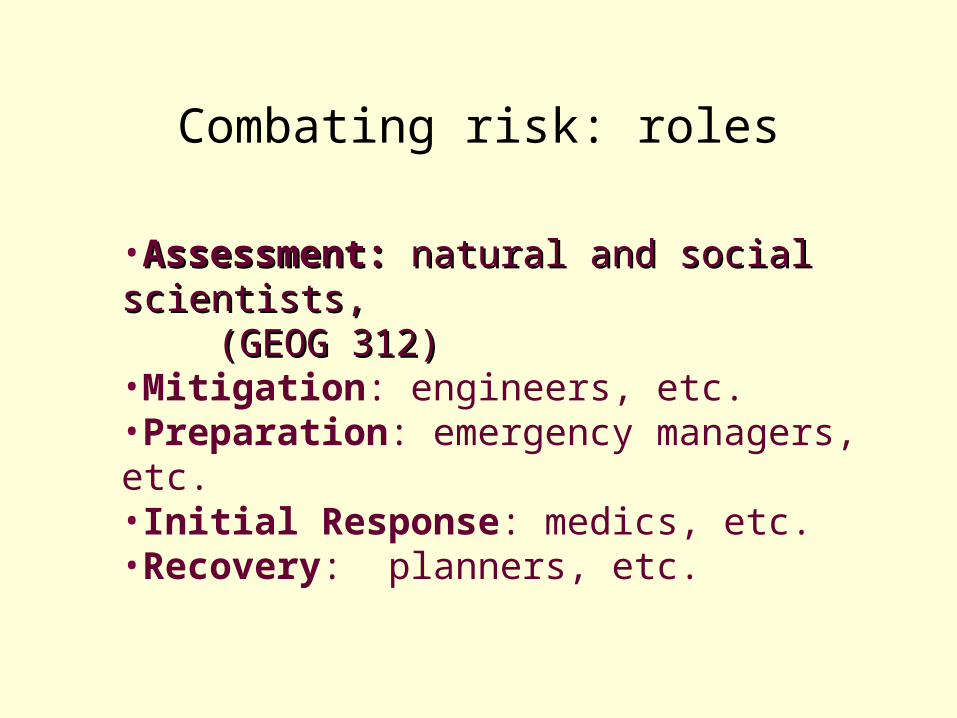
Combating risk: roles
•Assessment: Assessment: natural and social natural and social scientists,scientists,
(GEOG 312)(GEOG 312)•Mitigation: engineers, etc.•Preparation: emergency managers, etc.•Initial Response: medics, etc.•Recovery: planners, etc.
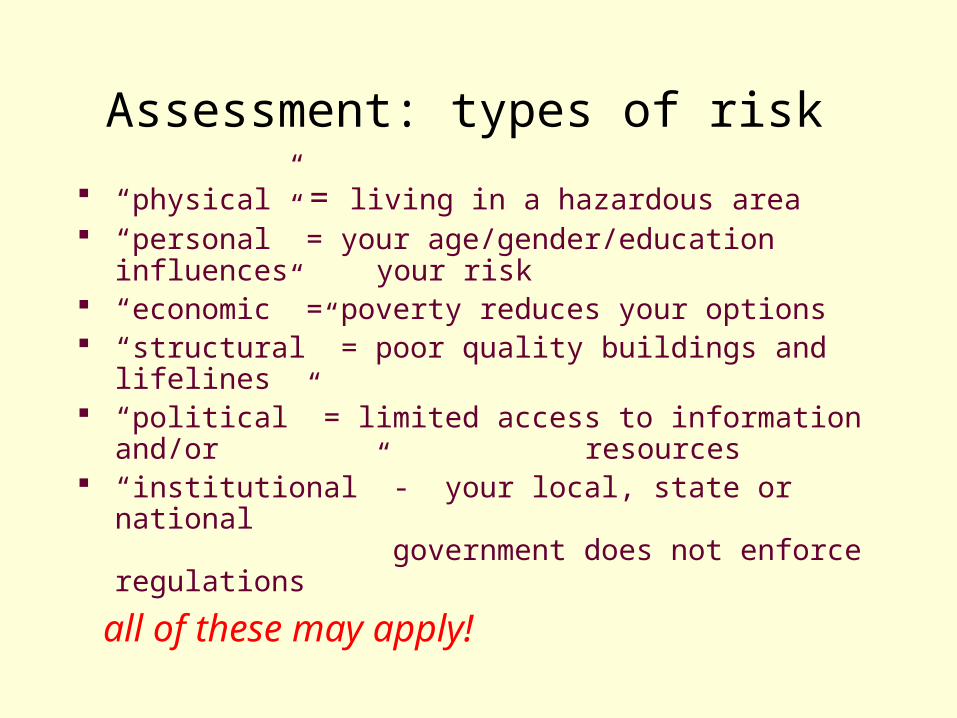
Assessment: types of risk
“physical” = living in a hazardous area “personal” = your age/gender/education
influences your risk “economic” = poverty reduces your options “structural” = poor quality buildings and lifelines “political” = limited access to information and/or
resources “institutional” - your local, state or national
government does not enforce regulations
all of these may apply!
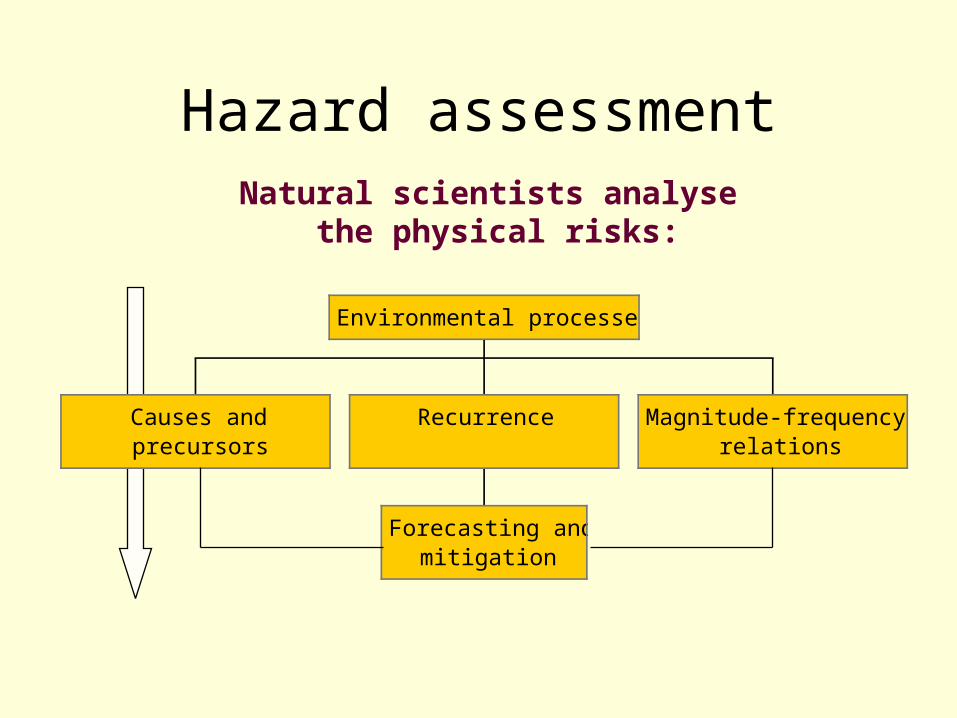
Hazard assessment
Environmental processes
Causes andprecursors
Recurrence
Forecasting andmitigation
Magnitude-frequencyrelations
Natural scientists analyse the physical risks:
Assessing individual hazards:
e.g. hurricanes in Atlantic Canada
QuickTime™ and aTIFF (Uncompressed) decompressor
are needed to see this picture.
QuickTime™ and aTIFF (Uncompressed) decompressor
are needed to see this picture.
Damage resulting from the high winds and heavy rain of Hurricane Juan in Halifax, Nova Scotia, Sept. - Oct. 2003
Photos: CBC News archives
QuickTime™ and aTIFF (LZW) decompressor
are needed to see this picture.
Hazard assessment: causes
Hurricane Juan, Sept. 28, 2003. Juan was an exceptional
storm. Why did it track directly
northward?
QuickTime™ and aTIFF (Uncompressed) decompressor
are needed to see this picture.
Juan was forecast to
reach Nova Scotia as a 65- to 70-
knot hurricane,
but intensified to
85 knots (a “category 2” hurricane).
Why?
Hazard assessment: magnitude
Answer at: http://www.atl.ec.gc.ca/weather/hurricane/juan/intensity_e.html
Halifax last suffered a direct hurricane strike in 1893.
Do hurricanes in the Atlantic provinces therefore recur about once every 100 years on average?
Sources of information:• Instrumental records (~100 yr record)• Explorers’ logs, settlers’ diaries (~400 yr record?)• Micmac oral traditions (?)• Biological evidence (e.g. downed trees; several
centuries?)• Geological evidence (e.g. overwash deposits;
several millennia?)
Hazard assessment: recurrence
Hazard assessment:
will the future differ from the past?
QuickTime™ and aTIFF (LZW) decompressor
are needed to see this picture.
Graph: Munich Re, 2004
Tropical storms and hurricanes in the NW Atlantic
Hazard assessment: focusing on place, not process
• Case studies of individual hazards do not reveal the hazardousness of a particular place
• multiple risks in any area• risk assessment must integrate all
of these• = local “geography of danger”
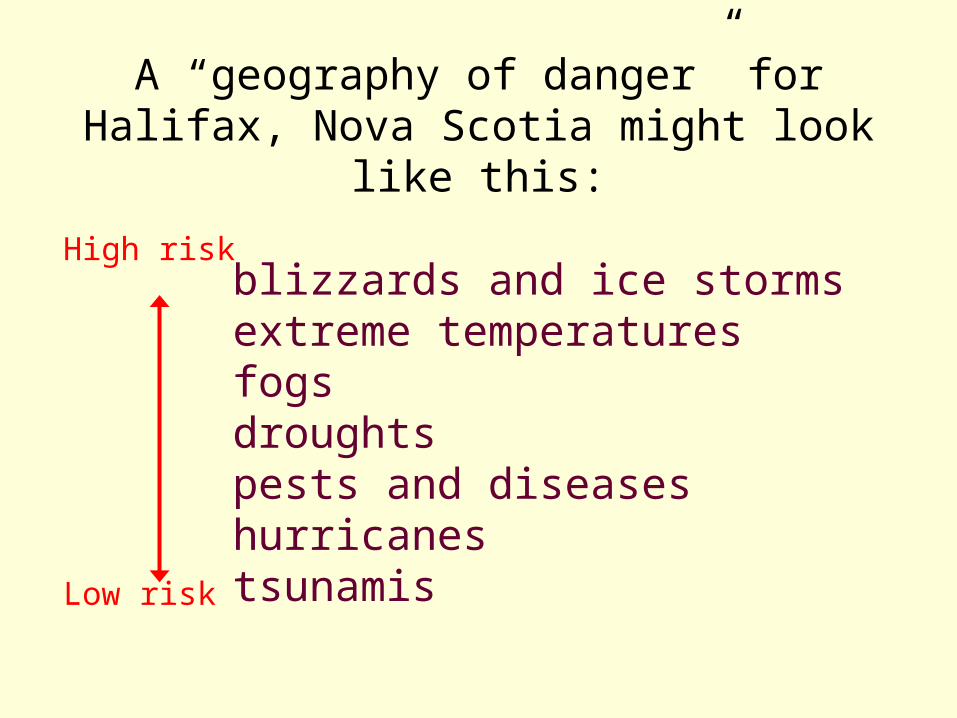
A “geography of danger” for Halifax, Nova Scotia might look like this:
blizzards and ice stormsextreme temperaturesfogsdroughtspests and diseaseshurricanes tsunamis
High risk
Low risk
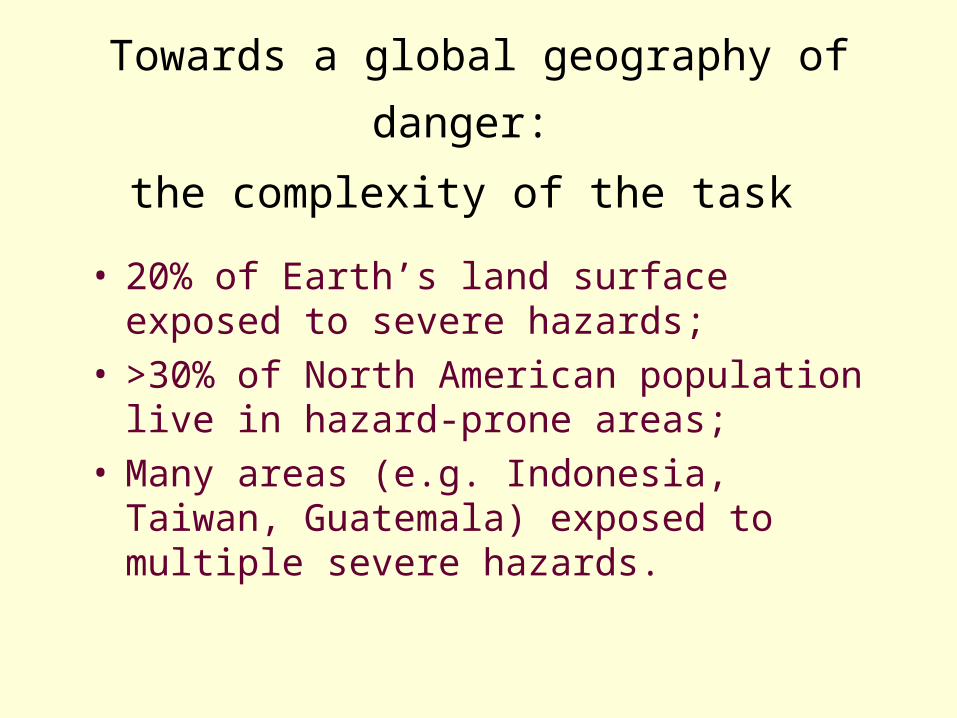
Towards a global geography of
danger: the complexity of the task
• 20% of Earth’s land surface exposed to severe hazards;
• >30% of North American population live in hazard-prone areas;
• Many areas (e.g. Indonesia, Taiwan, Guatemala) exposed to multiple severe hazards.
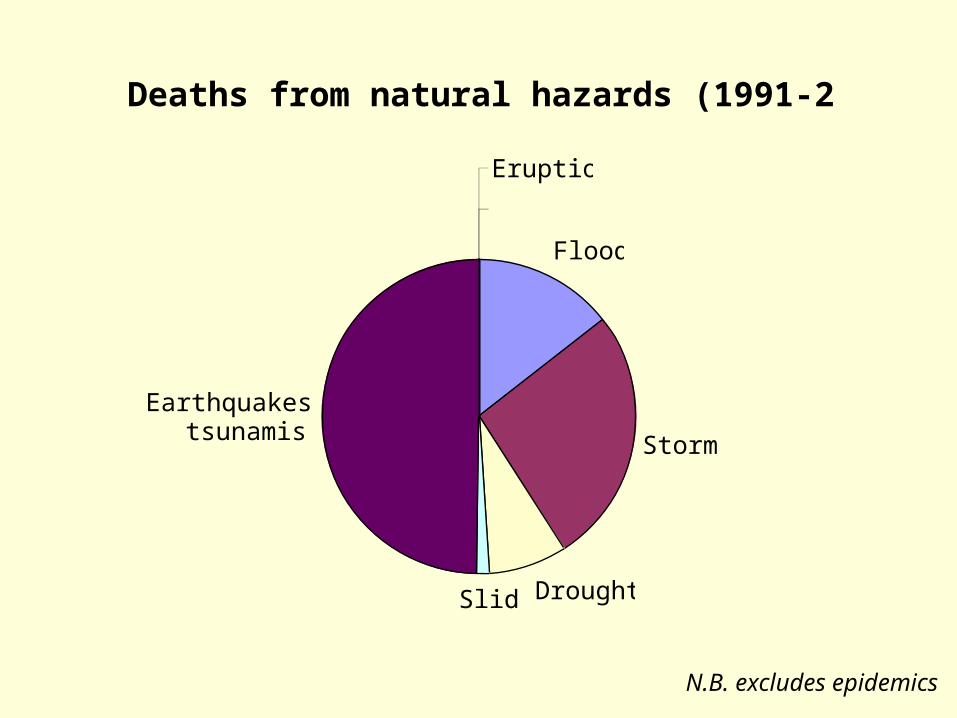
Deaths from natural hazards (1991-2005)
Floods
Storms
DroughtsSlides
Earthquakes and tsunamis
Eruptions
N.B. excludes epidemics
QuickTime™ and aTIFF (LZW) decompressor
are needed to see this picture.
2007
QuickTime™ and aTIFF (LZW) decompressor
are needed to see this picture.
2006
Earthquakes, eruptionsStorms Droughts, wildfiresFloods
A global geography of danger: naturalcatastrophes [2005-7]
Source: Munich Re Annual Reports
QuickTime™ and aTIFF (LZW) decompressor
are needed to see this picture.
2005
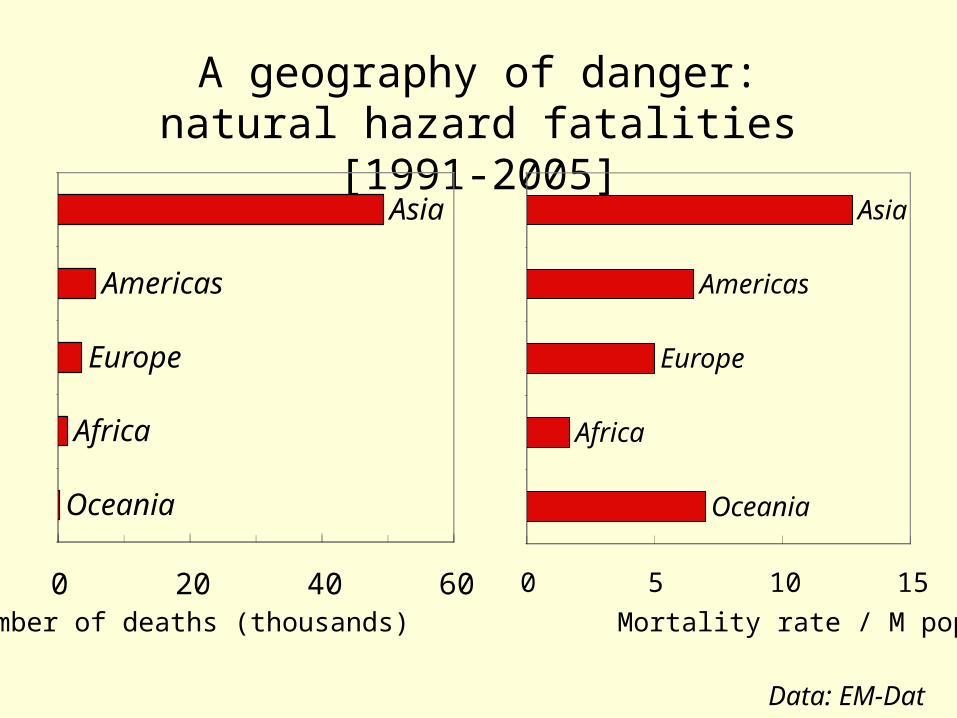
A geography of danger:natural hazard fatalities [1991-
2005]
Data: EM-Dat
Oceania
Africa
Europe
Americas
Asia
0 5 10 15
Asia
Americas
Europe
Africa
Oceania
0 20 40 60Annual number of deaths (thousands) Mortality rate / M population
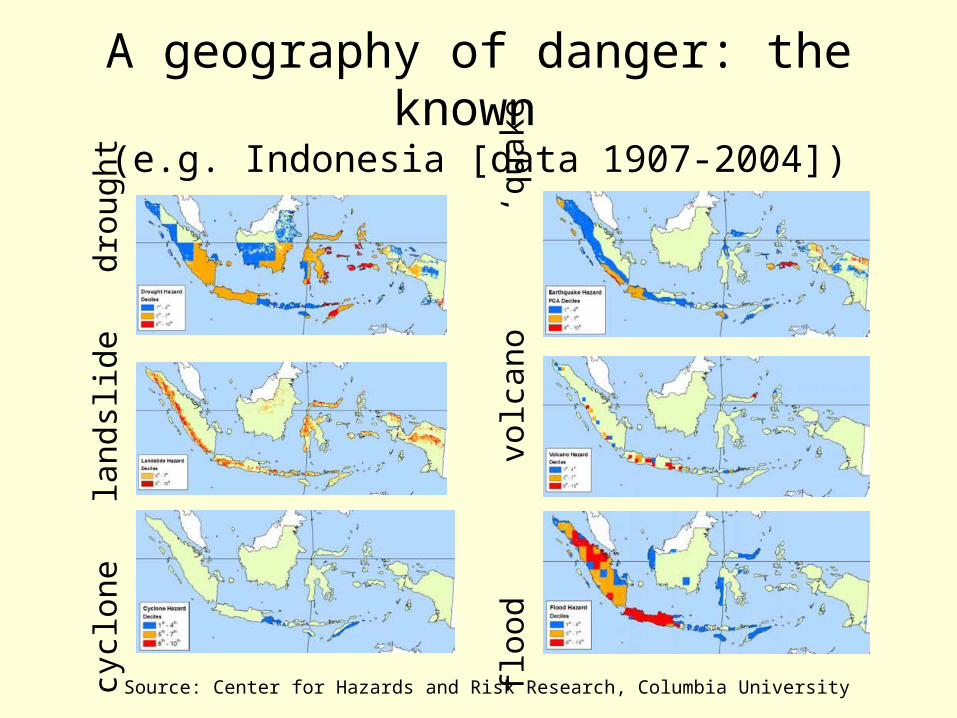
A geography of danger: the known
(e.g. Indonesia [data 1907-2004])
cycl
on
e
lan
dsl
ide
dro
ug
ht
flood
v
olc
an
o
‘qu
ake
Source: Center for Hazards and Risk Research, Columbia University
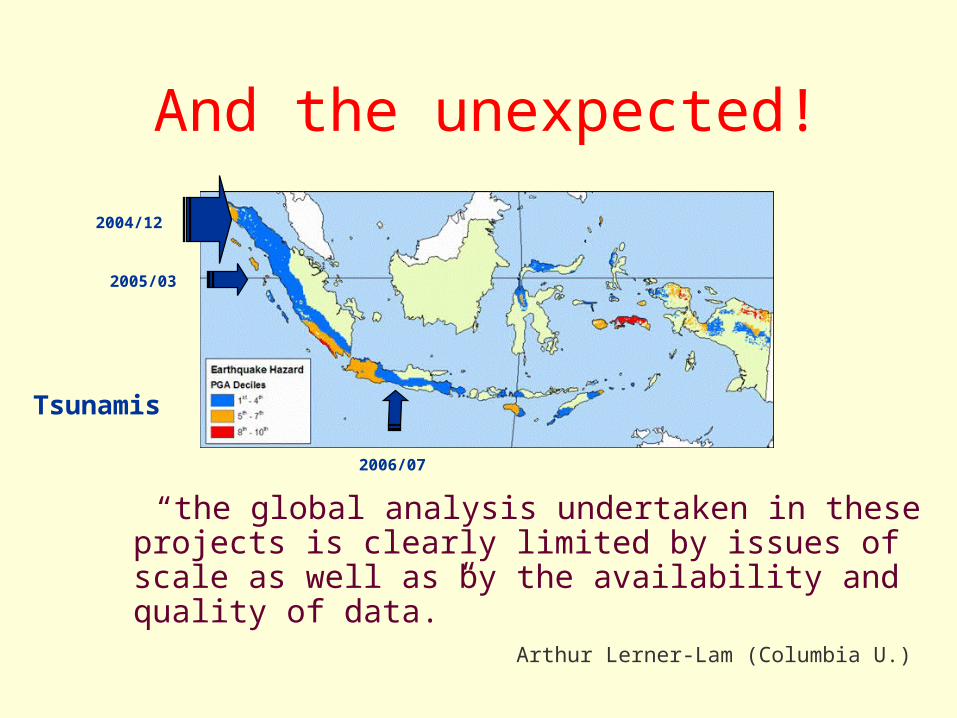
And the unexpected!
“the global analysis undertaken in these projects is clearly limited by issues of scale as well as by the availability and quality of data.”
Arthur Lerner-Lam (Columbia U.)
Tsunamis
2004/12
2005/03
2006/07
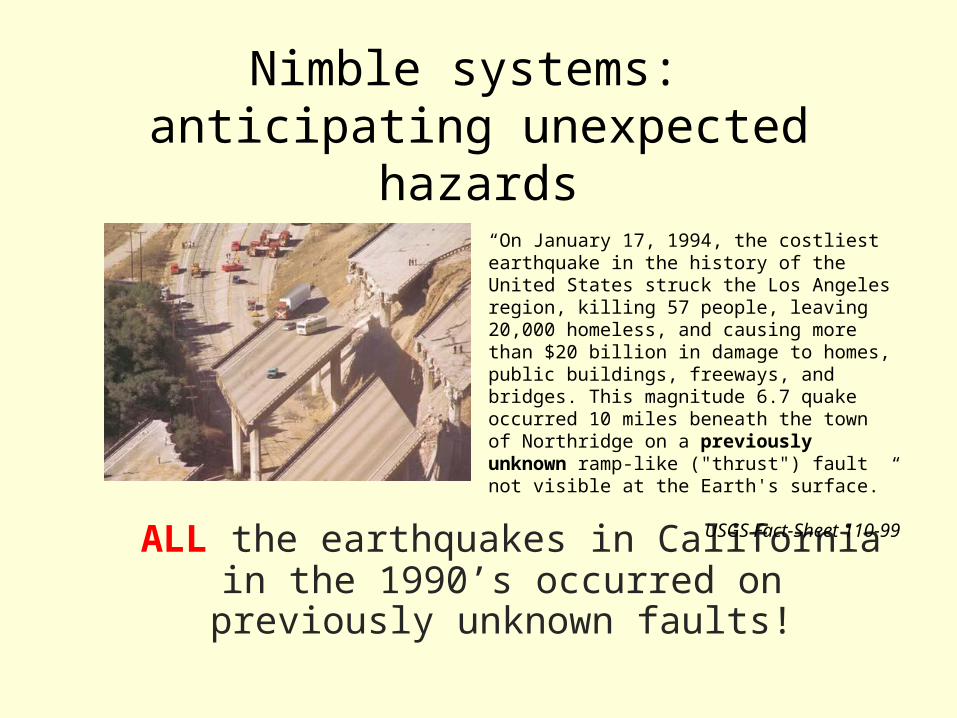
Nimble systems: anticipating unexpected hazards
ALL the earthquakes in California in the 1990’s occurred on previously
unknown faults!
“On January 17, 1994, the costliest earthquake in the history of the United States struck the Los Angeles region, killing 57 people, leaving 20,000 homeless, and causing more than $20 billion in damage to homes, public buildings, freeways, and bridges. This magnitude 6.7 quake occurred 10 miles beneath the town of Northridge on a previously unknown ramp-like ("thrust") fault not visible at the Earth's surface.”
USGS Fact-Sheet 110-99
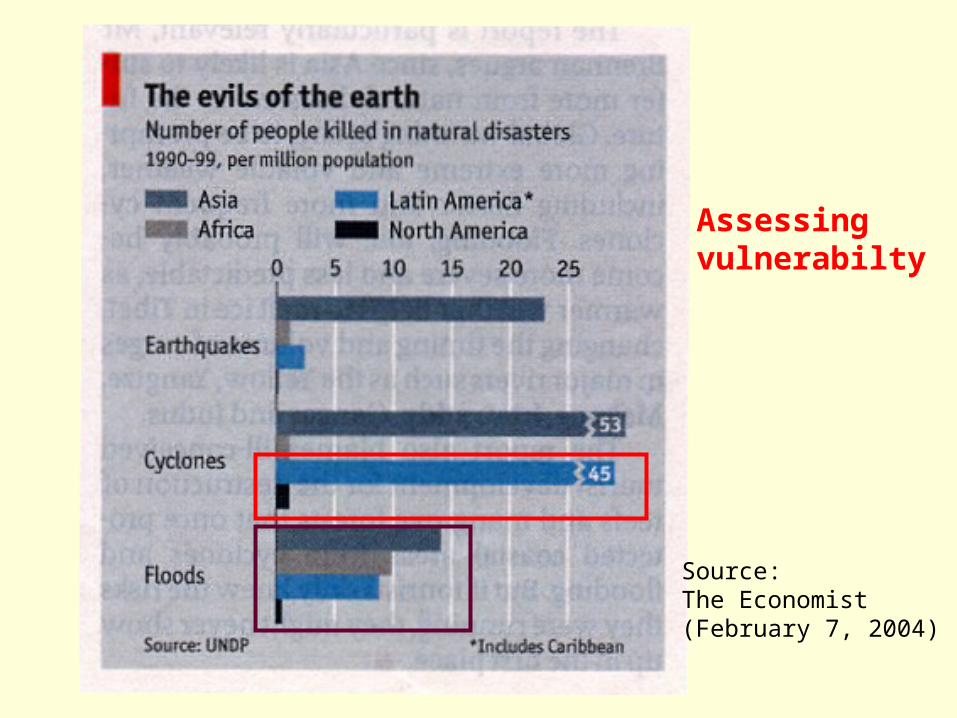
Source:The Economist (February 7, 2004)
Assessingvulnerabilty
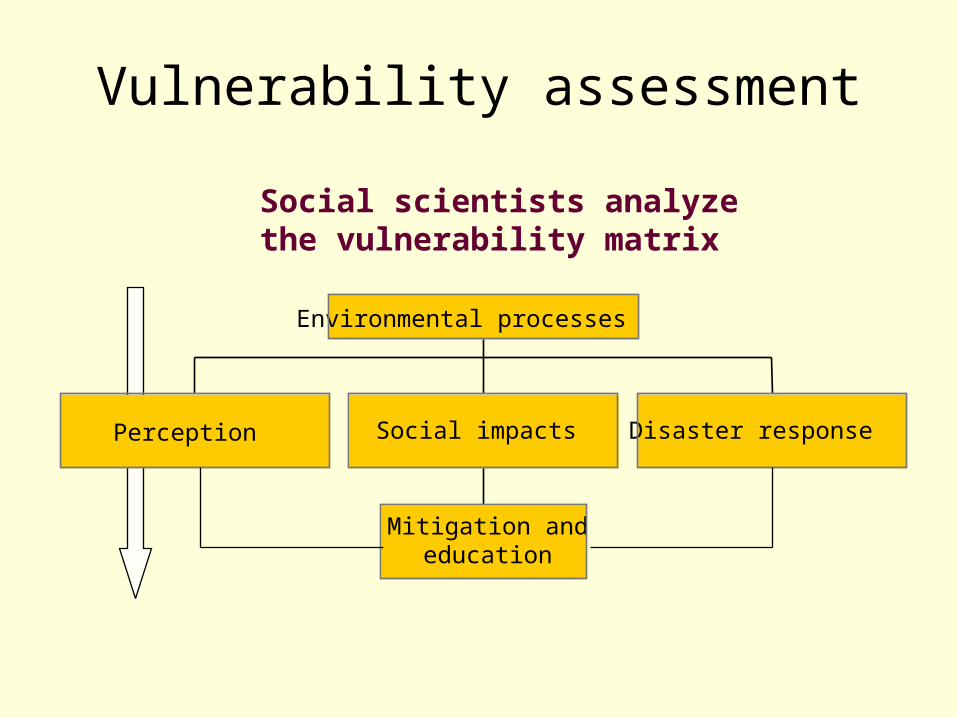
Vulnerability assessment
Social scientists analyzethe vulnerability matrix
Environmental processes
Perception Social impacts
Mitigation andeducation
Disaster response
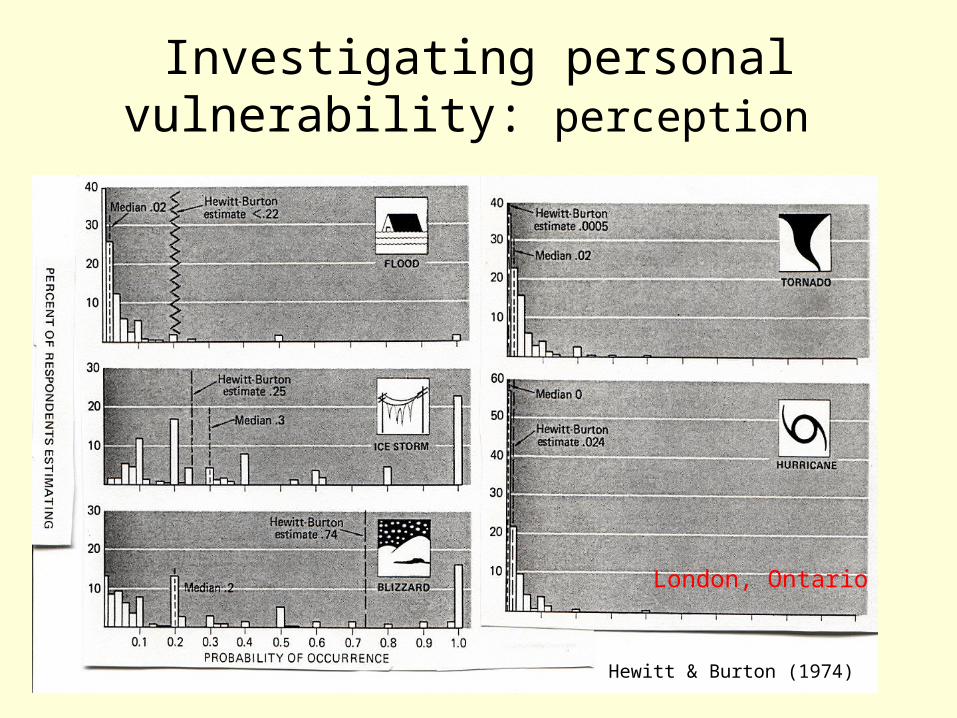
Investigating personal vulnerability: perception
Hewitt & Burton (1974)
London, Ontario
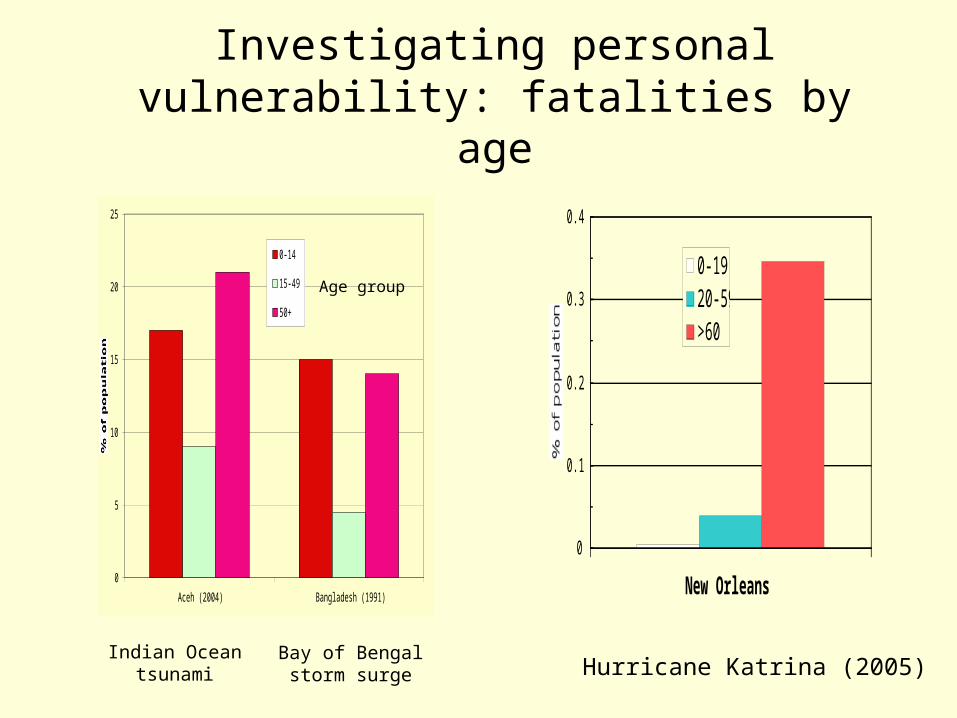
Investigating personal vulnerability: fatalities by age
0
5
10
15
20
25
Aceh (2004) Bangladesh (1991)
% of population
0-14
15-49
50+
Indian Oceantsunami
Age group
Bay of Bengalstorm surge
0
0.1
0.2
0.3
0.4
New Orleans
% of population
0-1920-59>60
Hurricane Katrina (2005)
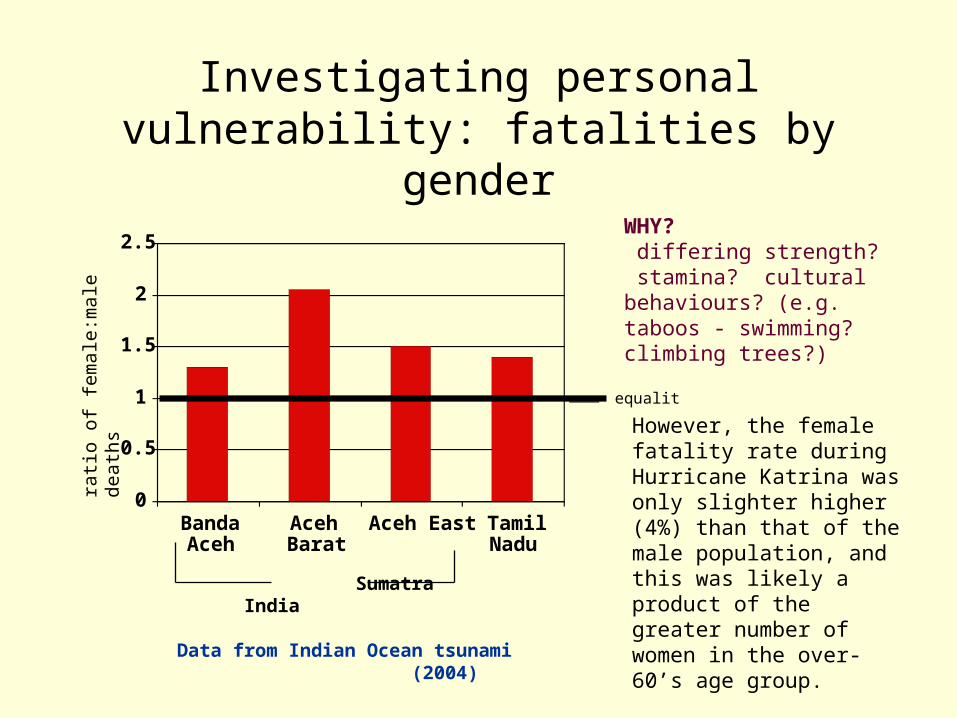
Investigating personal vulnerability: fatalities by gender
0
0.5
1
1.5
2
2.5
BandaAceh
AcehBarat
Aceh East TamilNadu
equality
rati
o o
f fe
male
:male
death
s
Sumatra India
Data from Indian Ocean tsunami (2004)
WHY? differing strength? stamina? cultural behaviours? (e.g. taboos - swimming? climbing trees?)
However, the female fatality rate during Hurricane Katrina was only slighter higher (4%) than that of the male population, and this was likely a product of the greater number of women in the over-60’s age group.
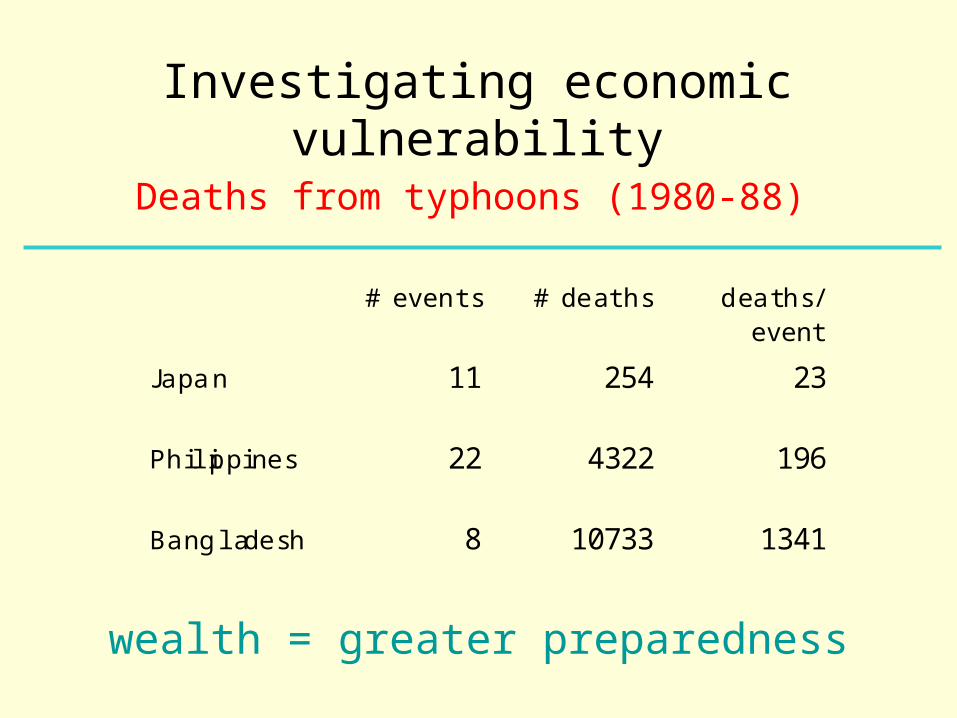
Investigating economic vulnerability
# events # deaths deaths/event
Japan 11 254 23
Phi li ppi ne s 22 4322 196
Bang la de sh 8 10733 1341
Deaths from typhoons (1980-88)
wealth = greater preparedness
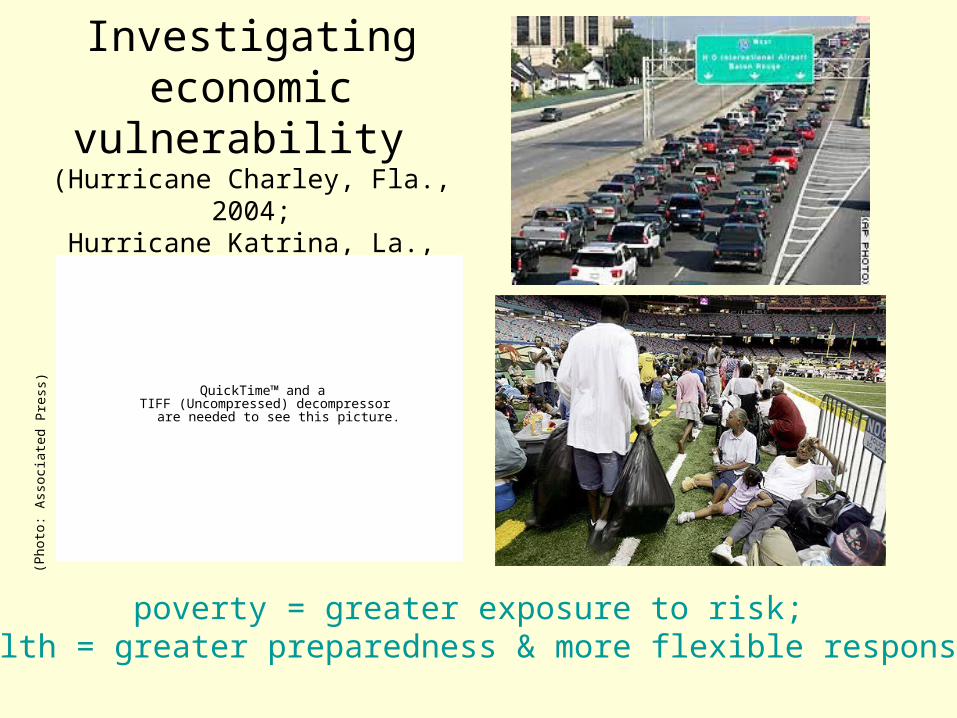
Investigating economic
vulnerability (Hurricane Charley, Fla., 2004;Hurricane Katrina, La., 2005)
poverty = greater exposure to risk;wealth = greater preparedness & more flexible response?
QuickTime™ and aTIFF (Uncompressed) decompressor
are needed to see this picture.
(P
hoto
: Ass
ocia
ted
Pre
s s)
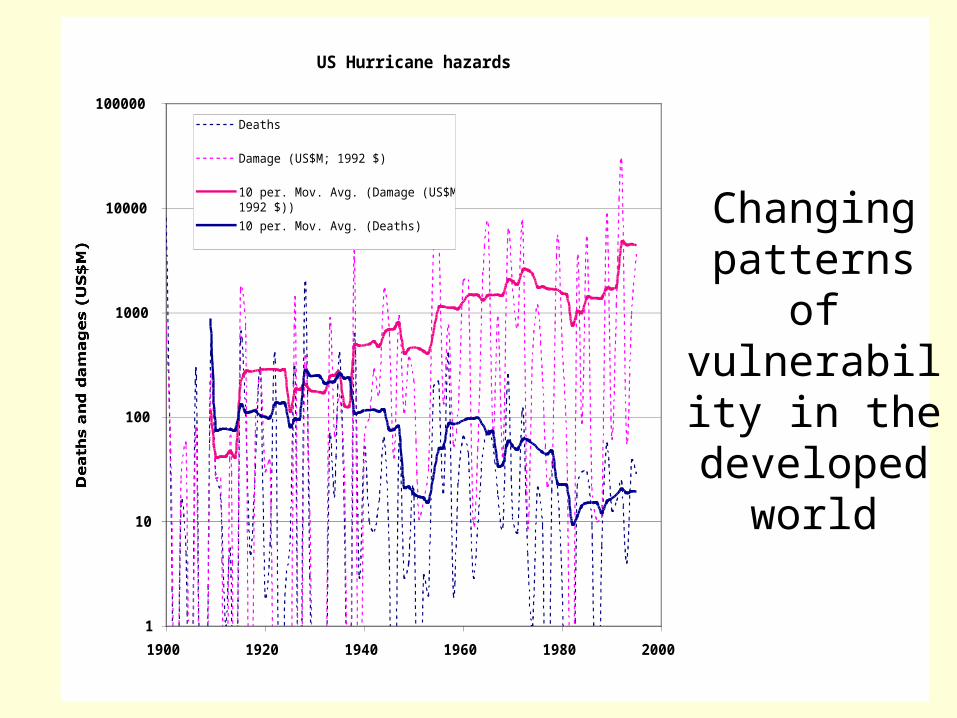
US Hurricane hazards
1
10
100
1000
10000
100000
1900 1920 1940 1960 1980 2000
Deaths and damages (US$M)
Deaths
Damage (US$M; 1992 $)
10 per. Mov. Avg. (Damage (US$M;1992 $))
10 per. Mov. Avg. (Deaths) Changing patterns of
vulnerability in the
developed world
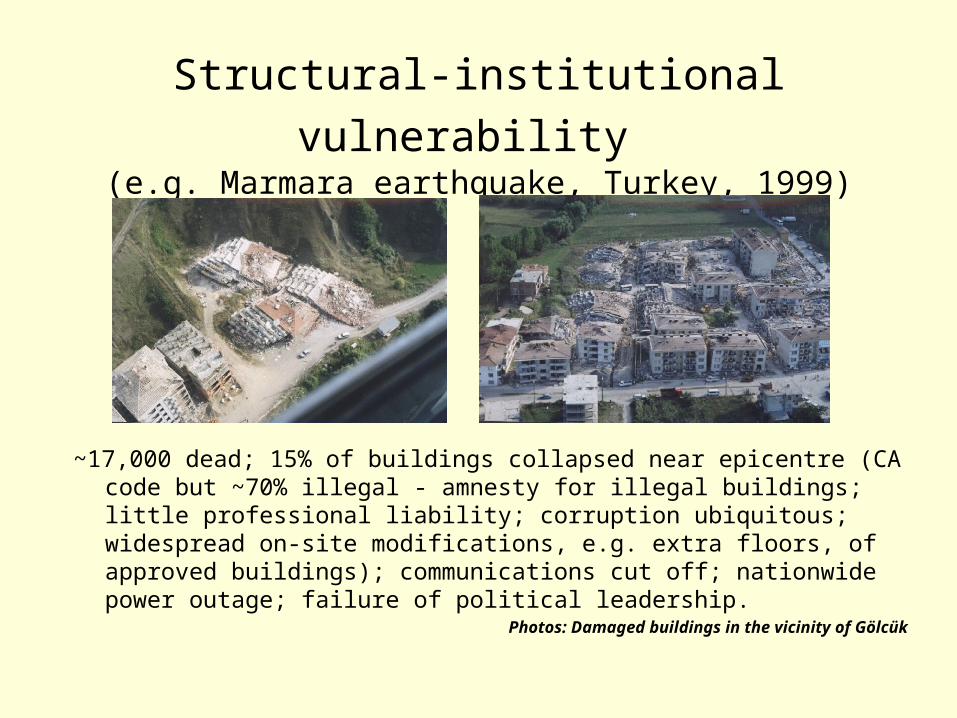
Structural-institutional vulnerability (e.g. Marmara earthquake, Turkey, 1999)
~17,000 dead; 15% of buildings collapsed near epicentre (CA code but ~70% illegal - amnesty for illegal buildings; little professional liability; corruption ubiquitous; widespread on-site modifications, e.g. extra floors, of approved buildings); communications cut off; nationwide power outage; failure of political leadership.
Photos: Damaged buildings in the vicinity of Gölcük
Investigating personal responses:
flight or fight?
• KR (aged 22) said that she’d never build in a forest again after her Kettle Valley home was reduced to ash
• KR (aged 35) said he’d rebuild in an instant. His family’s home was razed. “It was a fluke” …“If you live on the ocean and a tidal wave comes, they’d say we shouldn’t live on the ocean.”
Quoted in The Province, Aug. 25, 2003 (p. A5)
Reactions to the Okanagan Mountain Park fire of August, 2003
Investigating the agencies: (e.g. post-Hurricane Katrina)
were the evacuation orders effective? were rescue efforts well-organized? did everyone in need find the shelters or aid centres? was aid distribution effective?
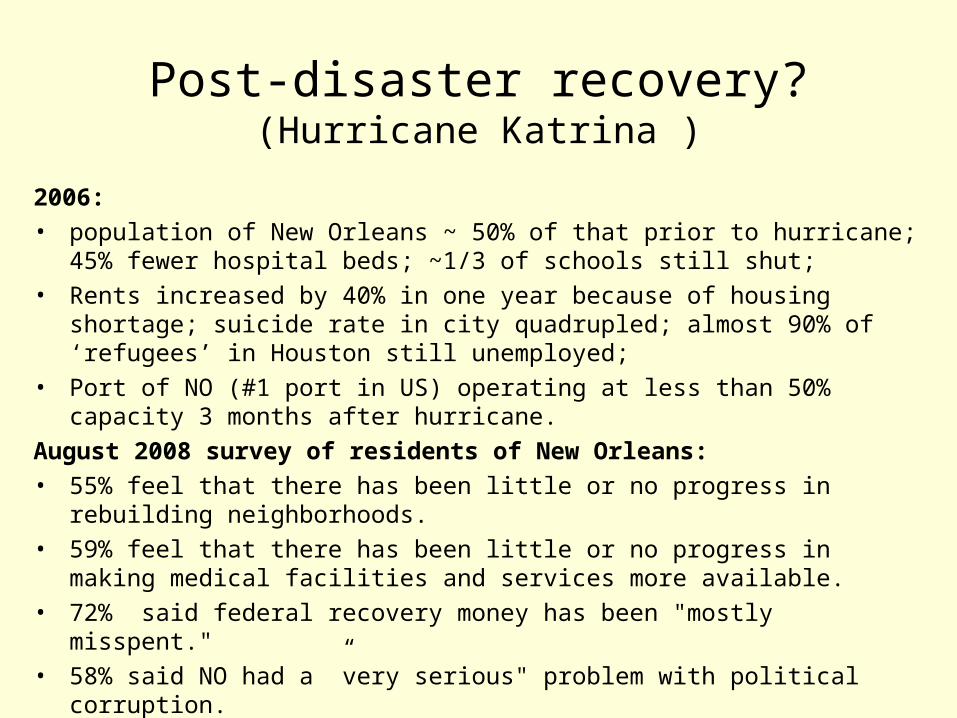
Post-disaster recovery?(Hurricane Katrina )
2006:• population of New Orleans ~ 50% of that prior to hurricane; 45%
fewer hospital beds; ~1/3 of schools still shut;• Rents increased by 40% in one year because of housing shortage;
suicide rate in city quadrupled; almost 90% of ‘refugees’ in Houston still unemployed;
• Port of NO (#1 port in US) operating at less than 50% capacity 3 months after hurricane.
August 2008 survey of residents of New Orleans:• 55% feel that there has been little or no progress in rebuilding
neighborhoods.• 59% feel that there has been little or no progress in making medical
facilities and services more available.• 72% said federal recovery money has been "mostly misspent."• 58% said NO had a ”very serious" problem with political corruption.• 84% face continuing health problems, and 65% reported some sort of
chronic condition or disability, up from 45% in 2006.
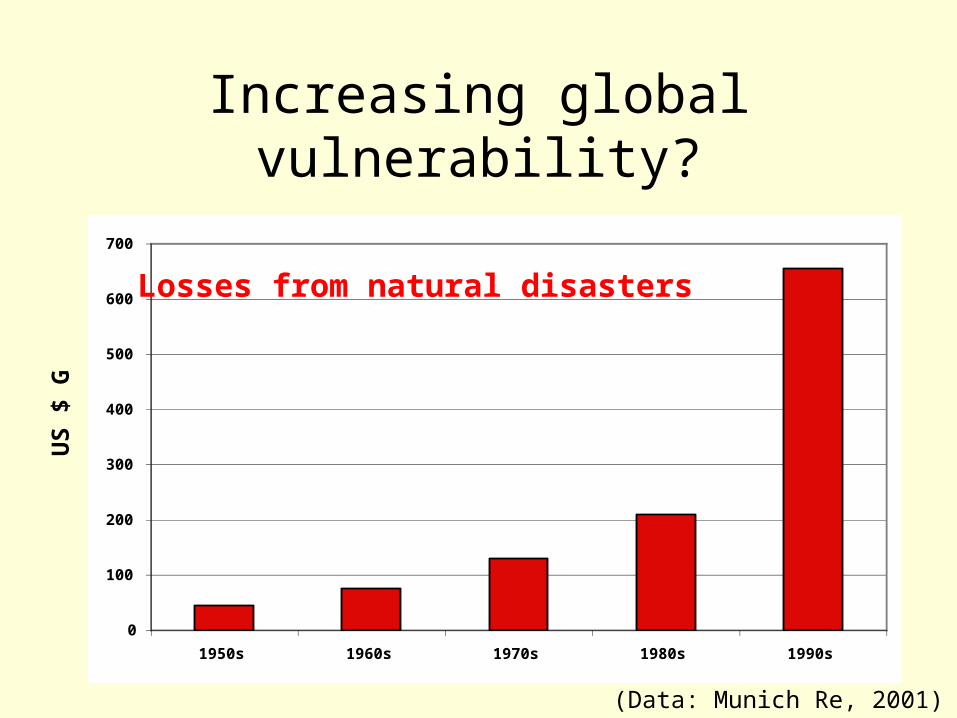
Increasing global vulnerability?
0
100
200
300
400
500
600
700
1950s 1960s 1970s 1980s 1990s
US
$ G
(Data: Munich Re, 2001)
Losses from natural disasters
Sourc
e:
Em
manuelle
Bourn
ay;
UN
EP/G
RID
- Are
ndal
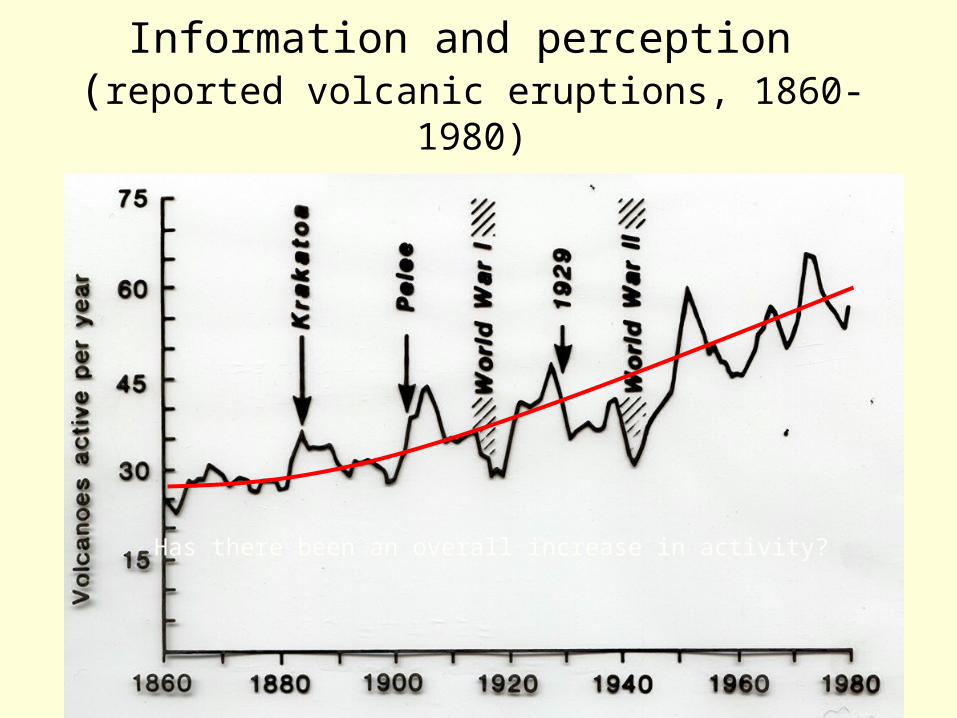
Information and perception (reported volcanic eruptions, 1860-1980)
Has there been an overall increase in activity?
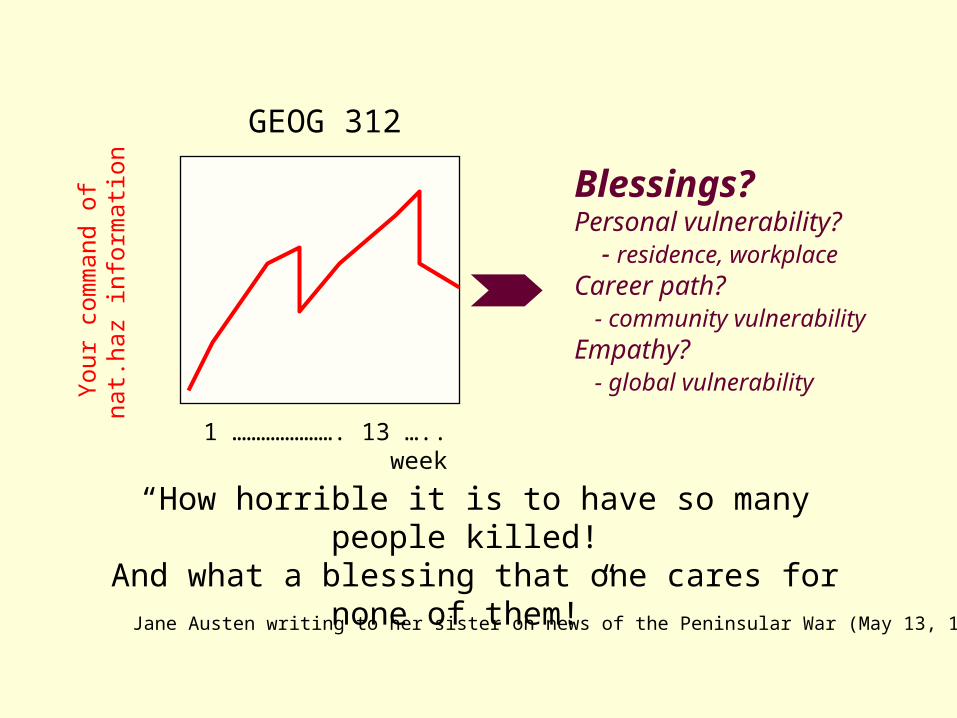
“How horrible it is to have so many people killed! And what a blessing that one cares for none of
them!”Jane Austen writing to her sister on news of the Peninsular War (May 13, 1811)
1 …………………. 13 ….. week
Blessings?Personal vulnerability? - residence, workplaceCareer path? - community vulnerabilityEmpathy? - global vulnerabilityY
our
com
mand o
f nat.
haz
info
rmati
on
GEOG 312