Embed Size (px)
Citation preview
Transport Economics
Knowledge Hub
The Ministry’s
Social Impact Assessment
Framework
Geoff Parr & Philip Caruana
Seminar: 27 September 2018
Grant Thornton Building, Level 13
Some Acronyms…or Initialisms?
GPS…?
LSF…?
CBA…?
EEM…?
CIA…?
HIA…?
SIA…?
DIA…?
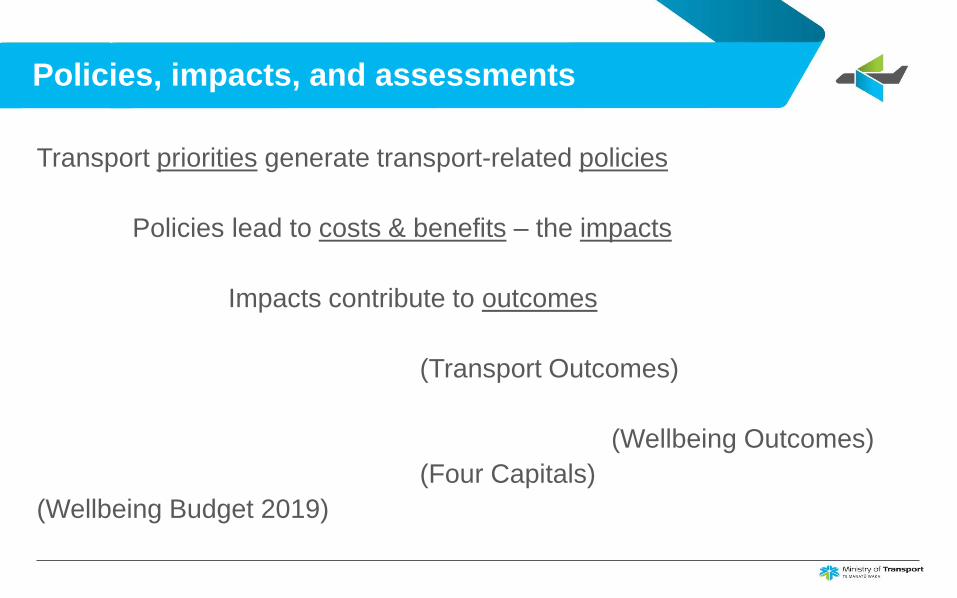
Policies, impacts, and assessments
Transport priorities generate transport-related policies
Policies lead to costs & benefits – the impacts
Impacts contribute to outcomes
(Transport Outcomes)
(Wellbeing Outcomes)
(Four Capitals)
(Wellbeing Budget 2019)
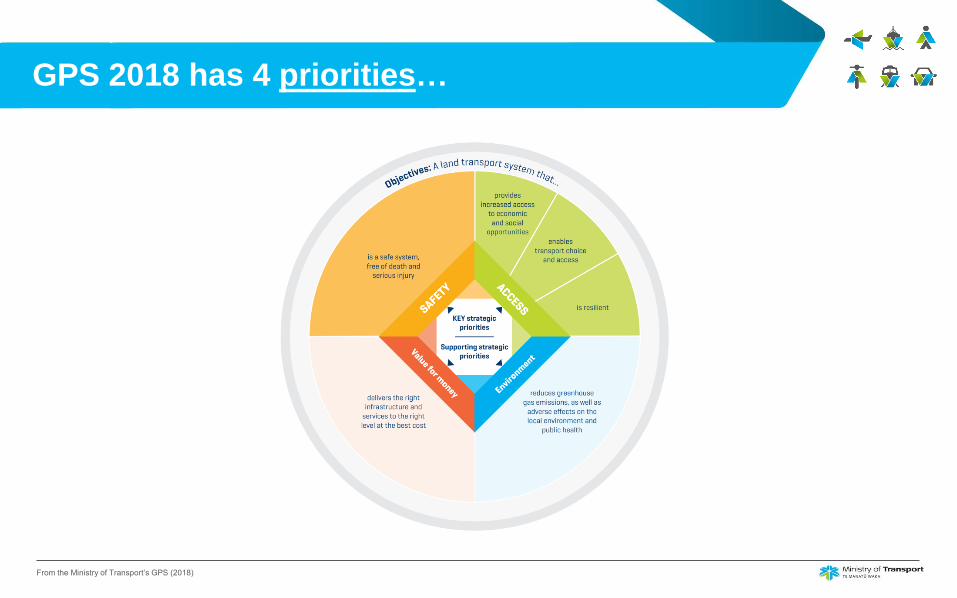
GPS 2018 has 4 priorities…
From the Ministry of Transport’s GPS (2018)
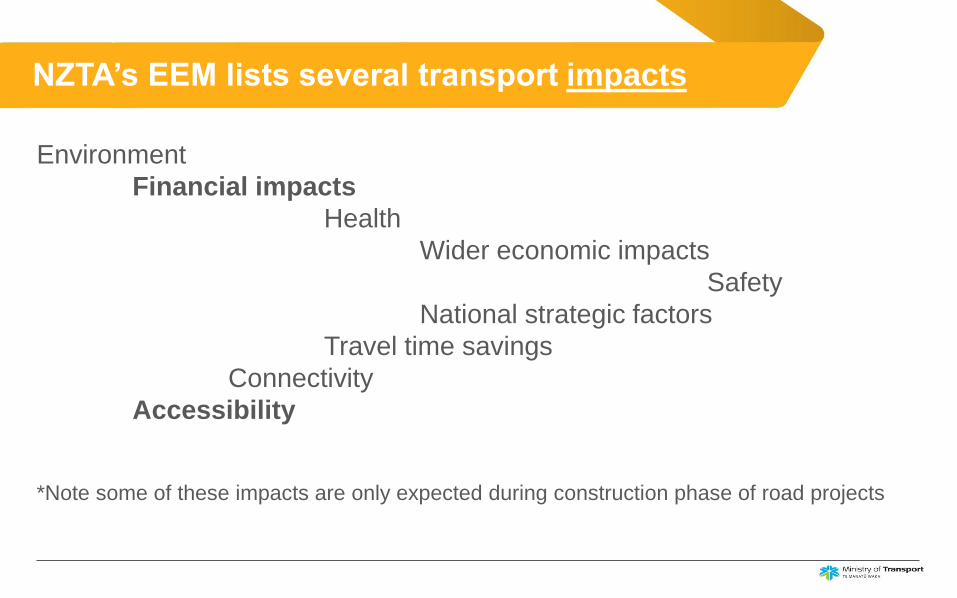
NZTA’s EEM lists several transport impacts
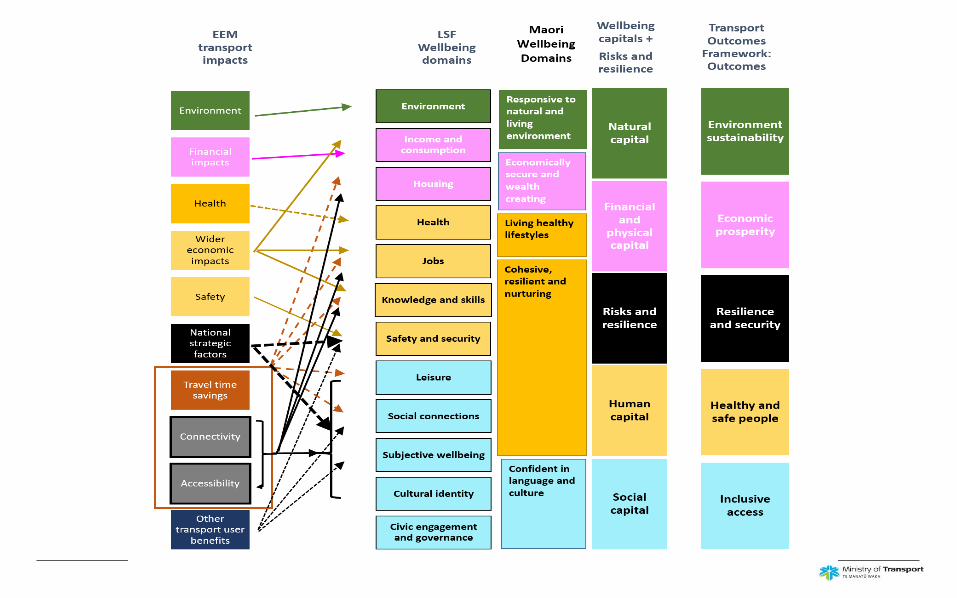
Environment
Financial impacts
Health
Wider economic impacts
Safety
National strategic factors
Travel time savings
Connectivity
Accessibility
*Note some of these impacts are only expected during construction phase of road projects
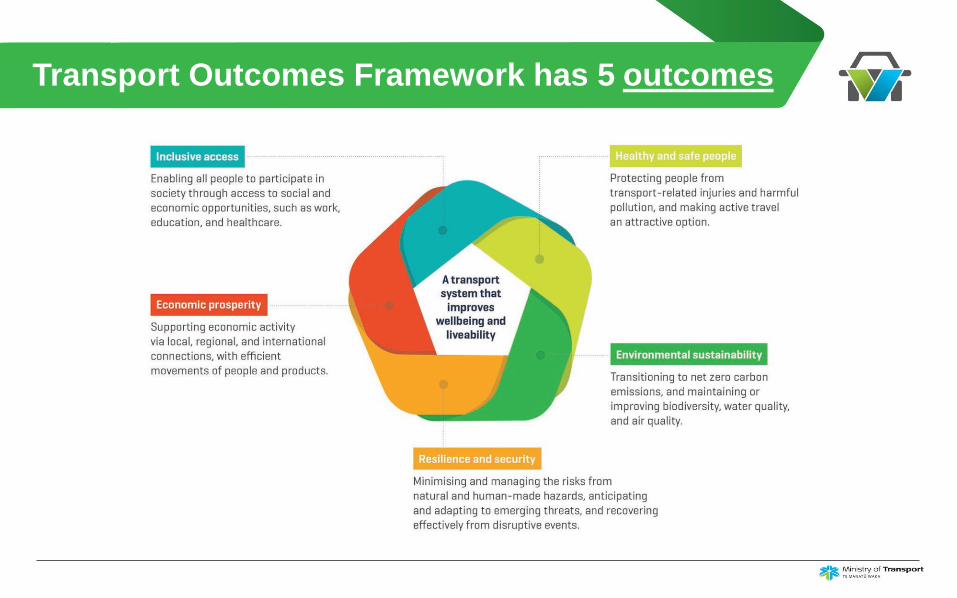
Transport Outcomes Framework has 5 outcomes
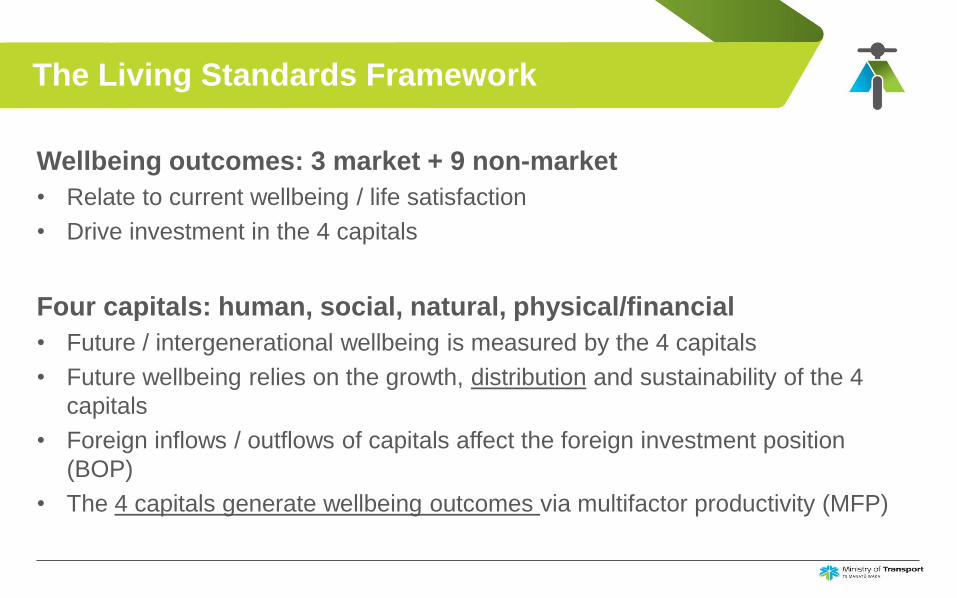
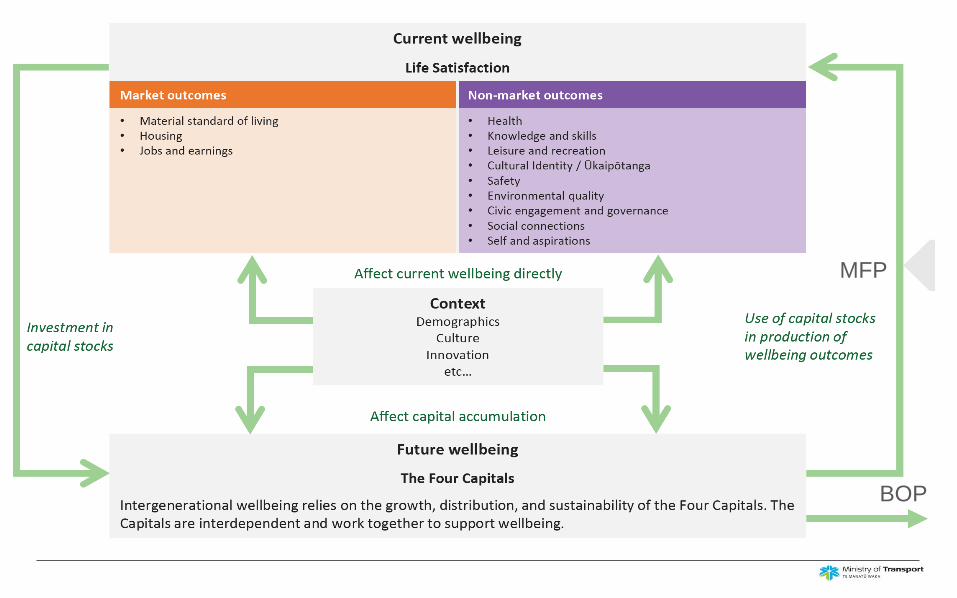
The Living Standards Framework
Wellbeing outcomes: 3 market + 9 non-market
• Relate to current wellbeing / life satisfaction
• Drive investment in the 4 capitals
Four capitals: human, social, natural, physical/financial
• Future / intergenerational wellbeing is measured by the 4 capitals
• Future wellbeing relies on the growth, distribution and sustainability of the 4
capitals
• Foreign inflows / outflows of capitals affect the foreign investment position
(BOP)
• The 4 capitals generate wellbeing outcomes via multifactor productivity (MFP)
MFP
BOP
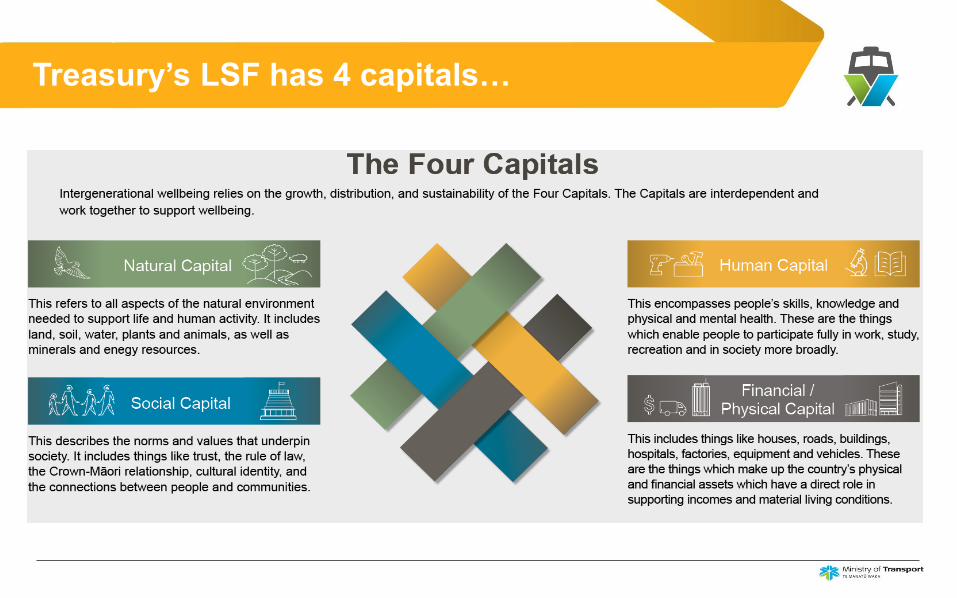
Treasury’s LSF has 4 capitals…
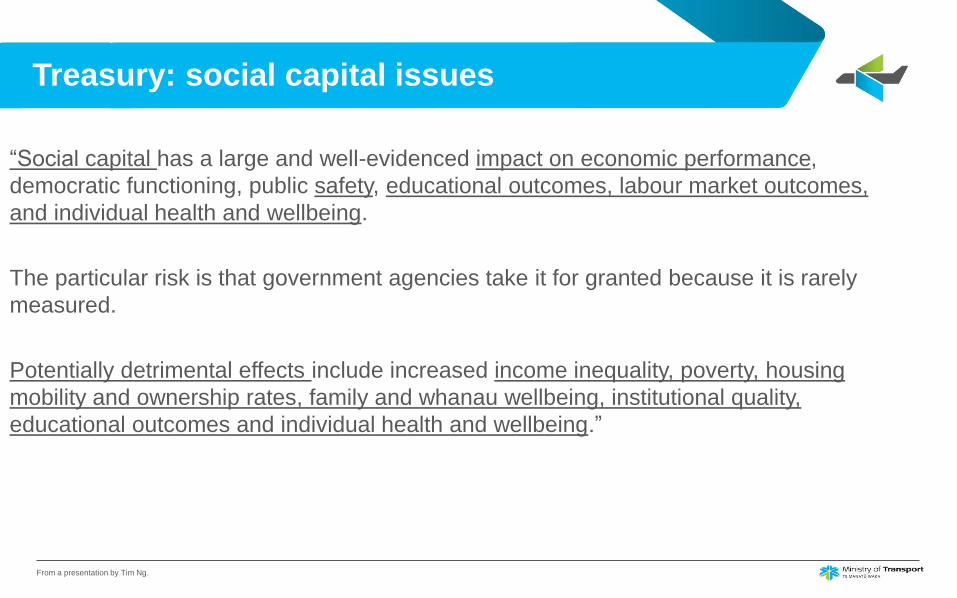
Treasury: social capital issues
From a presentation by Tim Ng.
“Social capital has a large and well-evidenced impact on economic performance,
democratic functioning, public safety, educational outcomes, labour market outcomes,
and individual health and wellbeing.
The particular risk is that government agencies take it for granted because it is rarely
measured.
Potentially detrimental effects include increased income inequality, poverty, housing
mobility and ownership rates, family and whanau wellbeing, institutional quality,
educational outcomes and individual health and wellbeing.”
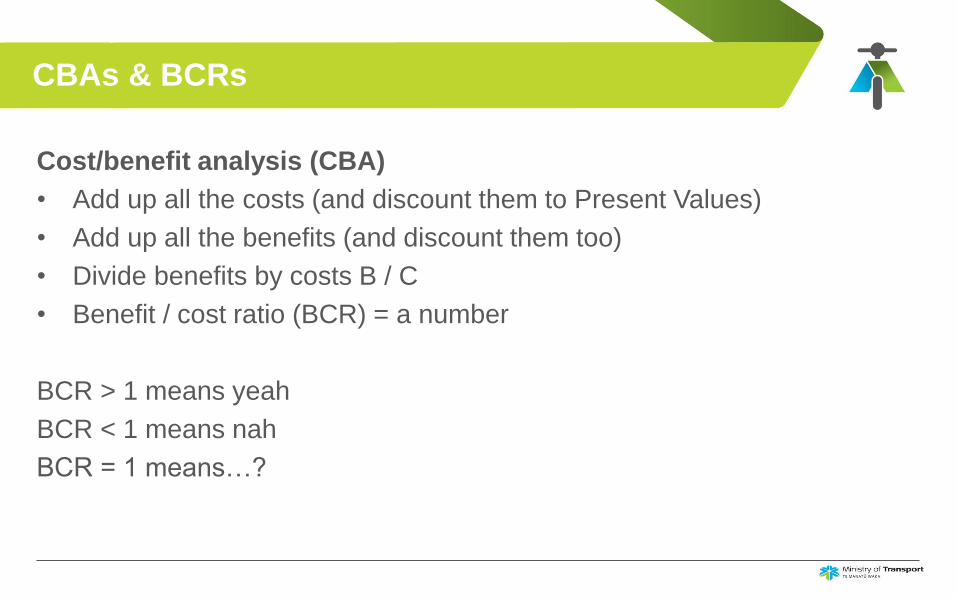
CBAs & BCRs
Cost/benefit analysis (CBA)
• Add up all the costs (and discount them to Present Values)
• Add up all the benefits (and discount them too)
• Divide benefits by costs B / C
• Benefit / cost ratio (BCR) = a number
BCR > 1 means yeah
BCR < 1 means nah
BCR = 1 means…?
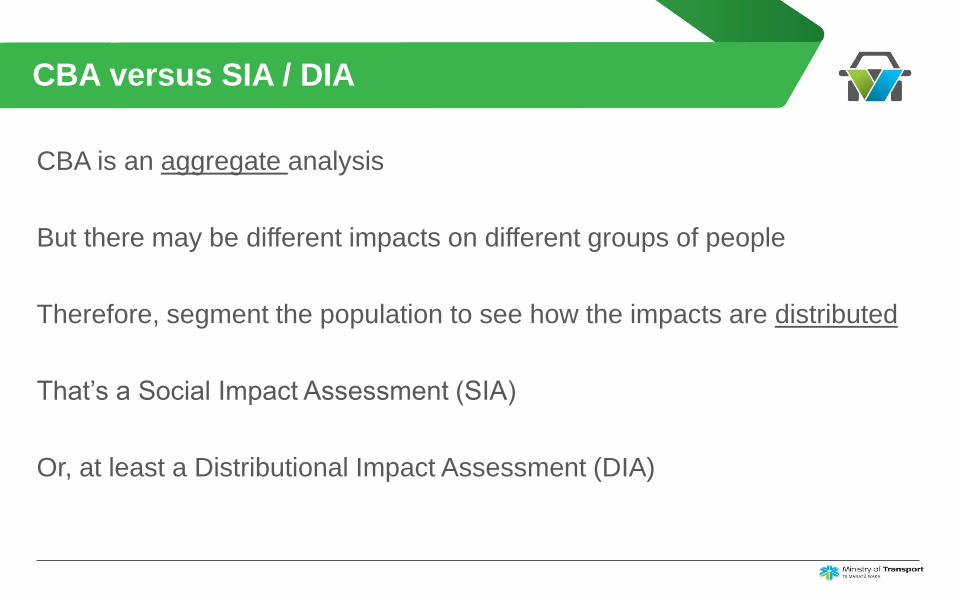
CBA versus SIA / DIA
CBA is an aggregate analysis
But there may be different impacts on different groups of people
Therefore, segment the population to see how the impacts are distributed
That’s a Social Impact Assessment (SIA)
Or, at least a Distributional Impact Assessment (DIA)
Segmenting the population
Total Benefits & Costs:
• By region, or by urban / rural, or by meshblock, etc (spatial)
• By income group, age group, ethnicity, gender, disability status, etc
Other ways of slicing the population:
• Family size, single parent, car / non-car owner, number of cars
• Household, whanau, individuals, communities
• Household characteristics
But: disaggregation depends on good data!
SIA versus DIA
DIA = disaggregated CBA
SIA is so much more…as one peer reviewer noted:
“A full SIA seeks to understand the issues; predict, analyse and assess the
likely impact pathways; develop and implement strategies; and design and
implement evaluation & monitoring programmes.”
SIA also generally involves consulting with those likely to be impacted by a
policy or measure
Impacts and outcomes
Impacts of policies correspond to:
• Priorities in the GPS on Land Transport
• Transport outcomes in the Transport Outcomes Framework
• Wellbeing outcomes in the Living Standards Framework
Common ground across these frameworks:
• Access…to work, education, healthcare, recreation, social connections
• Safety…security, resilience, health (accidents)
• Environment...air quality, noise, amenity
• Health…active transport modes, obesity, safety
Inclusive (and affordable) access
If one combines the Capabilities Approach of Amartya Sen and the Egalitarian
Approach of John Rawls, then transport-related policies and measures can impact
on three transport inequalities:
• Inequality of transport-related resources,
• Inequality of observed daily travel behaviour, and
• Inequality of transport accessibility levels.
The Accessibility Standard suggests that it is best to address the third inequality
Accessibility defined
Analysis of the distributional effects of transport policies on accessibility
should take account of:
• the setting of minimum standards of accessibility to key destinations,
• prioritising disadvantaged groups,
• reducing inequalities of opportunities, and
• mitigating transport externalities
Social/Distributional Impact Assessment
The Ministry will mostly do desktop DIAs rather than full-blown SIAs:
• Perform a CBA
• Disaggregate the impacts by segmenting the population
• Identify groups who will be negatively / positively impacted
• Think about impact pathways
• Are any groups vulnerable? => Equity considerations
• Can the policy be amended so that impacts on vulnerable groups can be more
positive or less negative?
• If not, can compensation or mitigation be applied?
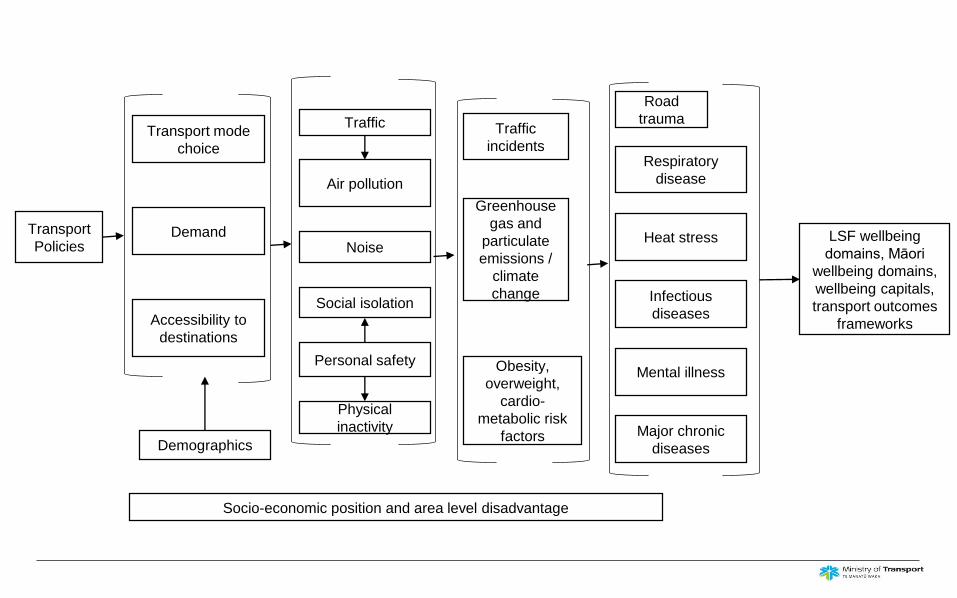
Transport
Policies
Transport mode
choice
Demand
Accessibility to
destinations
Demographics
Traffic
Air pollution
Noise
Social isolation
Personal safety
Physical
inactivity
Traffic
incidents
Greenhouse
gas and
particulate
emissions /
climate
change
Obesity,
overweight,
cardio-
metabolic risk
factors
Road
trauma
Respiratory
disease
Heat stress
Infectious
diseases
Mental illness
Major chronic
diseases
Socio-economic position and area level disadvantage
LSF wellbeing
domains, Māori
wellbeing domains,
wellbeing capitals,
transport outcomes
frameworks
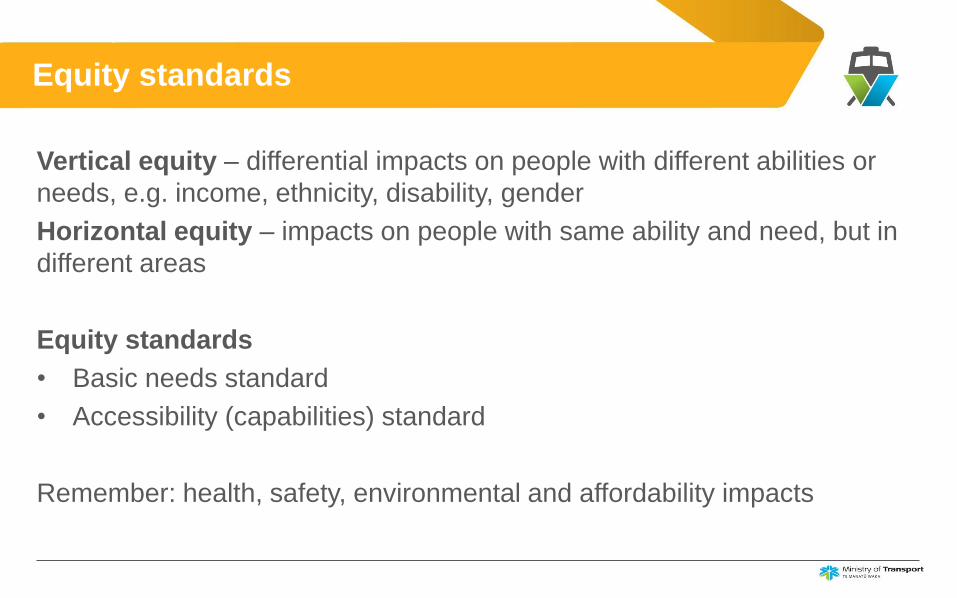
Equity standards
Vertical equity – differential impacts on people with different abilities or
needs, e.g. income, ethnicity, disability, gender
Horizontal equity – impacts on people with same ability and need, but in
different areas
Equity standards
• Basic needs standard
• Accessibility (capabilities) standard
Remember: health, safety, environmental and affordability impacts
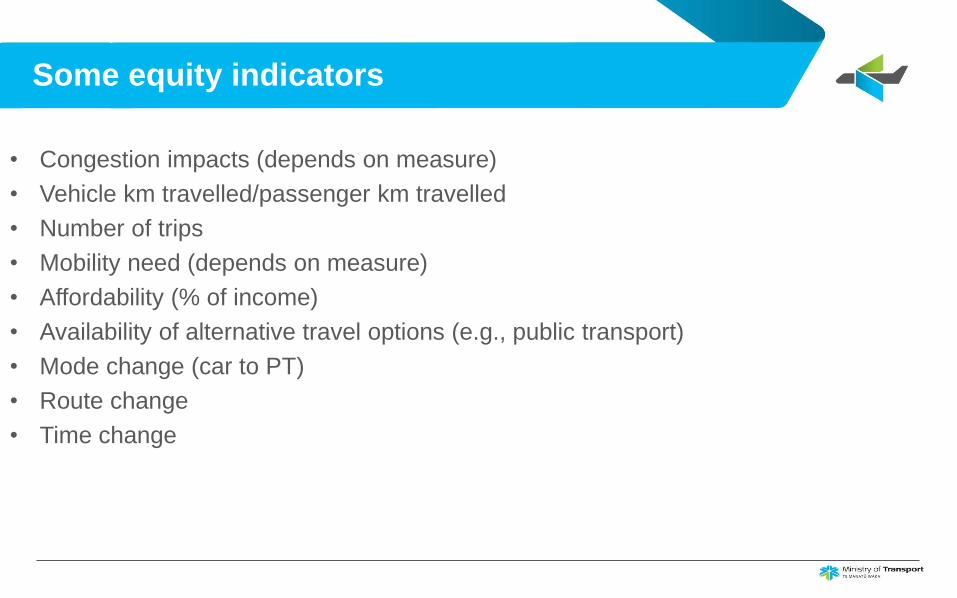
Some equity indicators
• Congestion impacts (depends on measure)
• Vehicle km travelled/passenger km travelled
• Number of trips
• Mobility need (depends on measure)
• Affordability (% of income)
• Availability of alternative travel options (e.g., public transport)
• Mode change (car to PT)
• Route change
• Time change
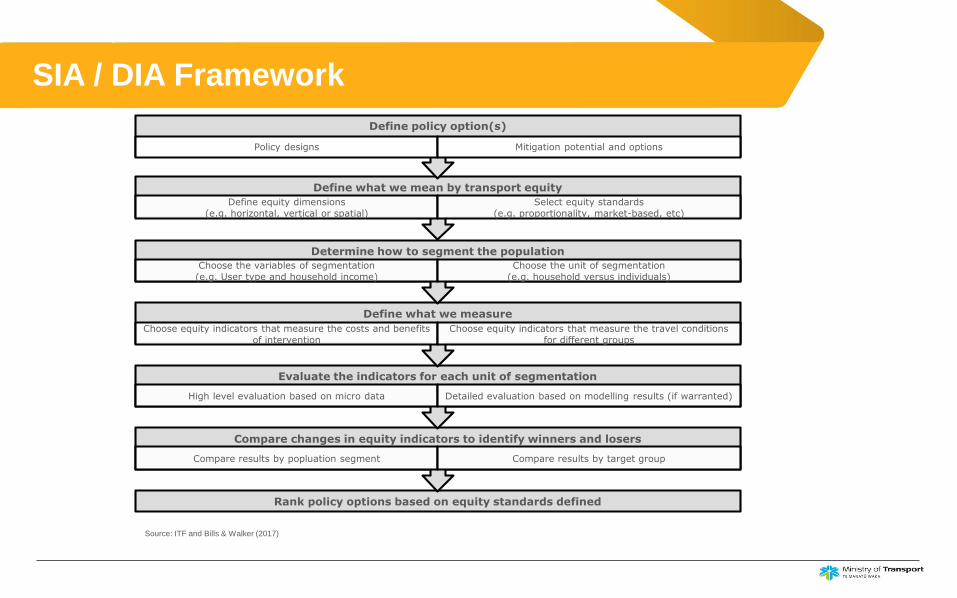
SIA / DIA Framework
Source: ITF and Bills & Walker (2017)
Rank policy options based on equity standards defined
Compare changes in equity indicators to identify winners and losers
Compare results by popluation segment Compare results by target group
Evaluate the indicators for each unit of segmentation
High level evaluation based on micro data Detailed evaluation based on modelling results (if warranted)
Define what we measure
Choose equity indicators that measure the costs and benefits
of intervention
Choose equity indicators that measure the travel conditions
for different groups
Determine how to segment the population
Choose the variables of segmentation
(e.g. User type and household income)
Choose the unit of segmentation
(e.g. household versus individuals)
Define what we mean by transport equity
Define equity dimensions
(e.g. horizontal, vertical or spatial)
Select equity standards
(e.g. proportionality, market-based, etc)
Define policy option(s)
Policy designs Mitigation potential and options
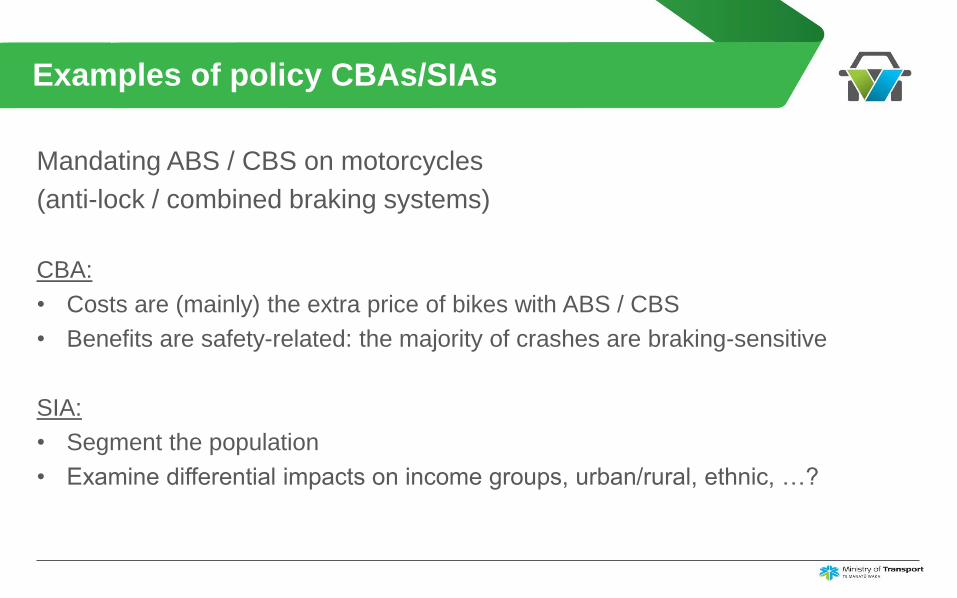
Examples of policy CBAs/SIAs
Mandating ABS / CBS on motorcycles
(anti-lock / combined braking systems)
CBA:
• Costs are (mainly) the extra price of bikes with ABS / CBS
• Benefits are safety-related: the majority of crashes are braking-sensitive
SIA:
• Segment the population
• Examine differential impacts on income groups, urban/rural, ethnic, …?
Examples of policy CBAs/SIAs
SuperGold public transport card
CBA:
• Costs are borne by other PT users or taxpayers in general
• Benefits are accessibility for the elderly
• Especially those with low incomes
SIA:
• Segment the population
• Examine differential impacts on the aged (beneficiaries), and on fare-paying PT
users?
Examples of policy CBAs / SIAs
Potential low-emissions policies (re Productivity Commission report)
• Feebates
• Vehicle Fuel Efficiency Standard
• Vehicle Scrappage Scheme for Auckland
CBAs give an idea of the overall viability of these proposed interventions
SIAs examine the distribution of impacts on vulnerable groups, especially in terms
of affordability of new costs imposed
Putting into practice
Why Measure Social Impact?
• Transport Policy Interventions may target:
• Price of the vehicle (e.g. import tax)
• Use of the vehicle (e.g. fuel tax, WoF)
• Places the vehicle is driven to/from (e.g. toll charge)
• Time it takes for the vehicle to be driven to/from a place (e.g.
congestion charge)
• SIA sheds light on the impact on specific households and;
• One or more (or all) of the above may impact the same
household type -> and to varying degrees.
Assessing the Social Impact of Transport Policy
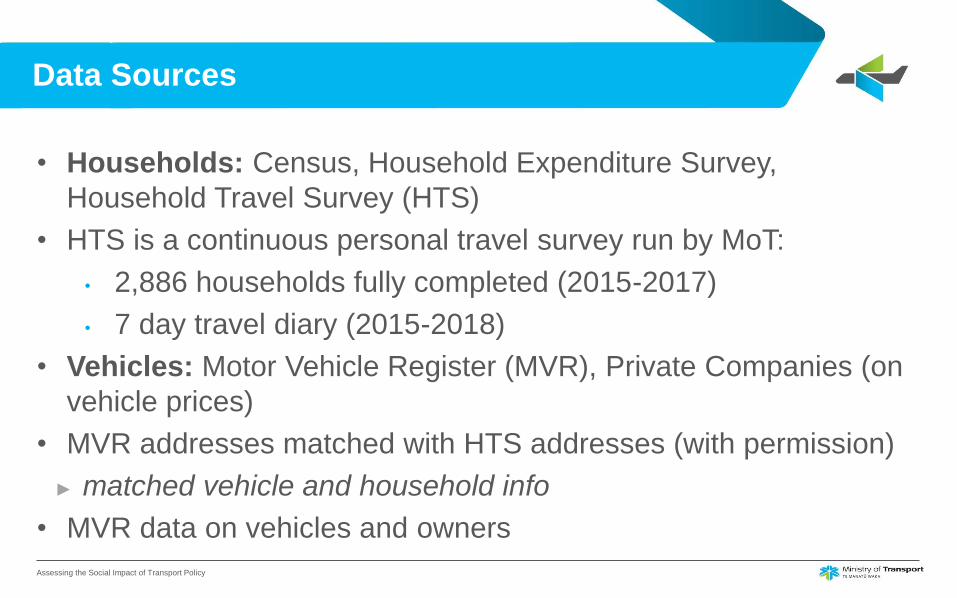
Data Sources
• Households: Census, Household Expenditure Survey,
Household Travel Survey (HTS)
• HTS is a continuous personal travel survey run by MoT:
• 2,886 households fully completed (2015-2017)
• 7 day travel diary (2015-2018)
• Vehicles: Motor Vehicle Register (MVR), Private Companies (on
vehicle prices)
• MVR addresses matched with HTS addresses (with permission)
► matched vehicle and household info
• MVR data on vehicles and owners
Assessing the Social Impact of Transport Policy
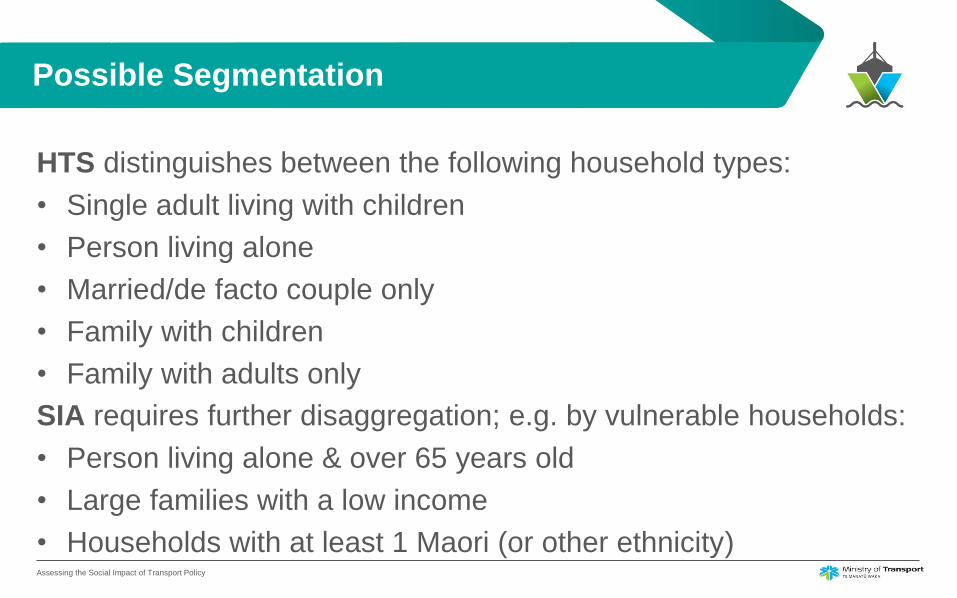
Possible Segmentation
HTS distinguishes between the following household types:
• Single adult living with children
• Person living alone
• Married/de facto couple only
• Family with children
• Family with adults only
SIA requires further disaggregation; e.g. by vulnerable households:
• Person living alone & over 65 years old
• Large families with a low income
• Households with at least 1 Maori (or other ethnicity)Assessing the Social Impact of Transport Policy
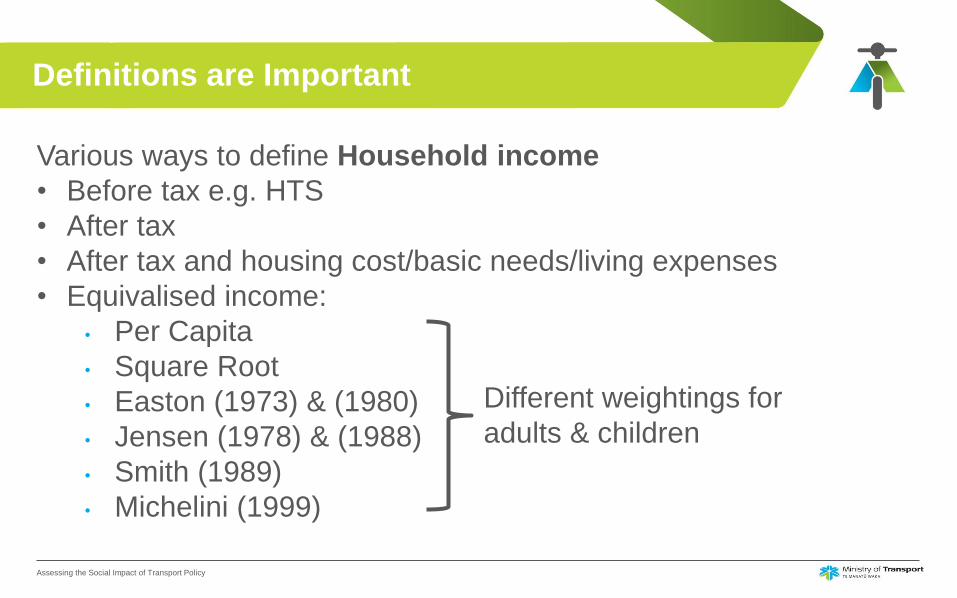
Definitions are Important
Various ways to define Household income
• Before tax e.g. HTS
• After tax
• After tax and housing cost/basic needs/living expenses
• Equivalised income:
• Per Capita
• Square Root
• Easton (1973) & (1980)
• Jensen (1978) & (1988)
• Smith (1989)
• Michelini (1999)
Assessing the Social Impact of Transport Policy
Different weightings for
adults & children
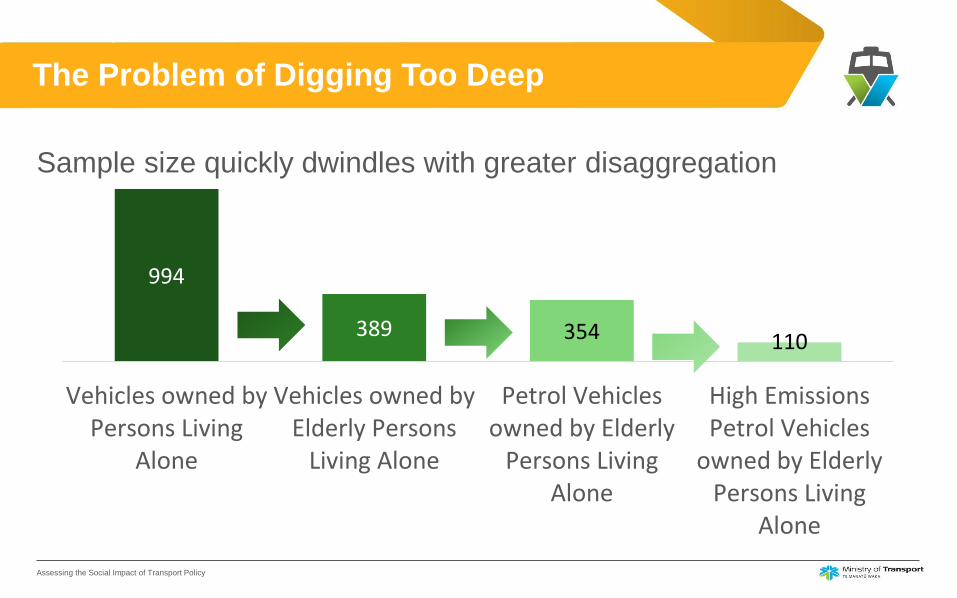
The Problem of Digging Too Deep
Sample size quickly dwindles with greater disaggregation
Assessing the Social Impact of Transport Policy
994
389 354 110
Vehicles owned byPersons Living
Alone
Vehicles owned byElderly Persons
Living Alone
Petrol Vehiclesowned by Elderly
Persons LivingAlone
High EmissionsPetrol Vehicles
owned by ElderlyPersons Living
Alone
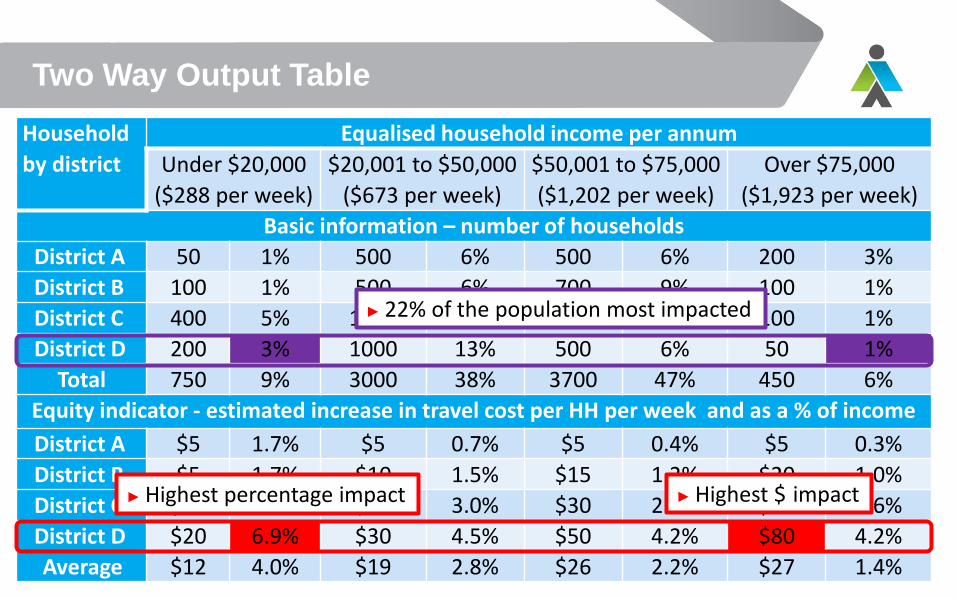
Two Way Output Table
Assessing the Social Impact of Transport Policy
Household
by district
Equalised household income per annum
Under $20,000
($288 per week)
$20,001 to $50,000
($673 per week)
$50,001 to $75,000
($1,202 per week)
Over $75,000
($1,923 per week)
Basic information – number of households
District A 50 1% 500 6% 500 6% 200 3%
District B 100 1% 500 6% 700 9% 100 1%
District C 400 5% 1000 13% 2000 25% 100 1%
District D 200 3% 1000 13% 500 6% 50 1%
Total 750 9% 3000 38% 3700 47% 450 6%
Equity indicator - estimated increase in travel cost per HH per week and as a % of income
District A $5 1.7% $5 0.7% $5 0.4% $5 0.3%
District B $5 1.7% $10 1.5% $15 1.2% $20 1.0%
District C $10 3.5% $20 3.0% $30 2.5% $50 2.6%
District D $20 6.9% $30 4.5% $50 4.2% $80 4.2%
Average $12 4.0% $19 2.8% $26 2.2% $27 1.4%
► Highest $ impact► Highest percentage impact
► 22% of the population most impacted
Some Limitations
• Inherent limitations of surveys
• Info only as good as people supply
• e.g. Decline to give income, ethnicity: Jedi…
• Data entry errors in the MVR
• Mismatches during the MVR/HTS matching process
• Sample size not representative
Future work
• Increased detail
• Increased sample
Assessing the Social Impact of Transport Policy
Questions
37
Upcoming TKH events
Transport Knowledge Conference 2018
• Rydges Hotel, Wellington
• Thursday 15 November
• Registrations open this week
TKH research colloquium
• Wednesday 14 November
https://www.transport.govt.nz/resources/conferences/2018-transport-knowledge-conference/