Embed Size (px)
Citation preview
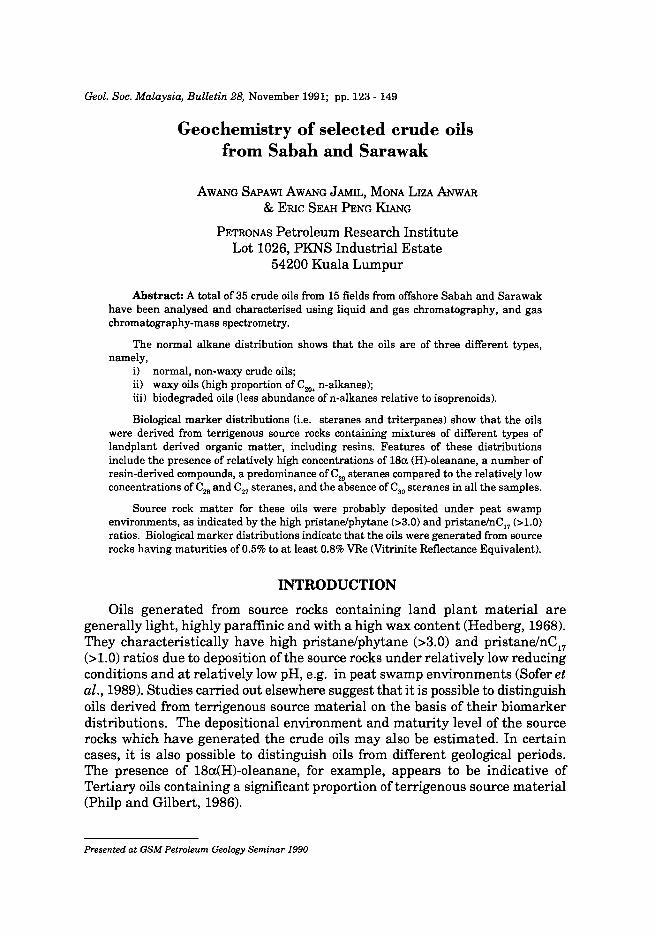
Geol. Soc. Malaysw., Bulletin 28, November 1991; pp. 123 - 149
Geochemistry of selected crude oils from Sabah and Sarawak
AWANG SAPAWI AWANG JAMIL, MONA LIZA ANwAR
& ERIC SEAH PENG KIANG
PETRONAS Petroleum Research Institute Lot 1026, PKNS Industrial Estate
54200 Kuala Lumpur
Abstract: A total of 35 crude oils from 15 fields from offshore Sabah and Sarawak have been analysed and characterised using liquid and gas chromatography, and gas chromatography-mass spectrometry.
The normal alkane distribution shows that the oils are of three different types, namely,
i) normal, non-waxy crude oils; ii) waxy oils (high proportion of C20+ n-alkanes); iii) biodegraded oils (less abundance ofn-alkanes relative to isoprenoids).
Biological marker distributions (i.e. steranes and triterpanes) show that the oils were derived from terrigenous source rocks containing mixtures of different types of landplant derived organic matter, including resins. Features of these distributions include the presence of relatively high concentrations of 18n (H)-oleanane, a number of resin-derived compounds, a predominance of C29 steranes compared to the relatively low concentrations of C28 and C27 steranes, and the absence of CSD steranes in all the samples.
Source rock matter for these oils were probably deposited under peat swamp environments, as indicated by the high pristanelphytane (>3.0) and pristanelnC17 (>1.0) ratios. Biological marker distributions indicate that the oils were generated from source rocks having maturities of 0.5% to at least 0.8% VRe (Vitrinite Reflectance Equivalent).
INTRODUCTION
Oils generated from source rocks containing land plant material are generally light, highly paraffinic and with a high wax content (Hedberg, 1968). They characteristically have high pristane/phytane (>3.0) and pristane/nC17
(>1.0) ratios due to deposition of the source rocks under relatively low reducing conditions and at relatively low pH, e.g. in peat swamp environments (Sofer et al., 1989). Studies carried out elsewhere suggest that it is possible to distinguish oils derived from terrigenous source material on the basis of their biomarker distributions. The depositional environment and maturity level of the source rocks which have generated the crude oils may also be estimated. In certain cases, it is also possible to distinguish oils from different geological periods. The presence of 18a(H)-0Ieanane, for example, appears to be indicative of Tertiary oils containing a significant proportion ofterrigenous source material (Philp and Gilbert, 1986).
Presented at GSM Petroleum Geology Seminar 1990
124 AWANG SAPAWI AWANG JAMIL, MONA LIZA ANwAR & ERIC P.K. SEAH
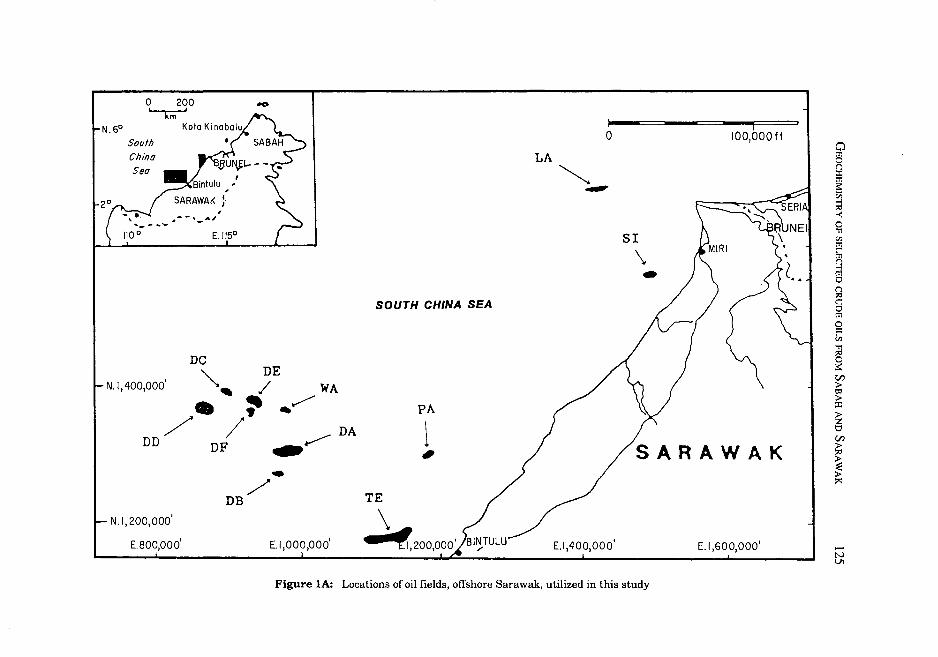
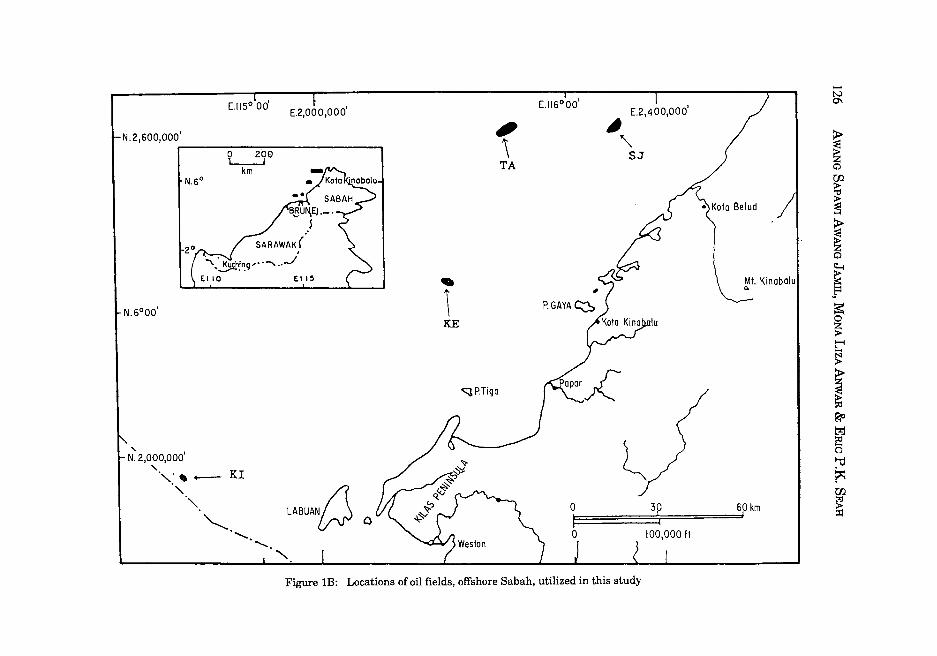
This study describes the application of the geochemical biological markers approach to the elucidation of the origin and maturity of crude oils from offshore Sabah and Sarawak. A total of 35 crude oil samples from 15 fields, drilled offshore Sabah and Sarawak (Fig. 1A & IB) were analysed using liquid and gas chromatography, and gas chromatography-mass spectrometry to study their biomarker distributions.
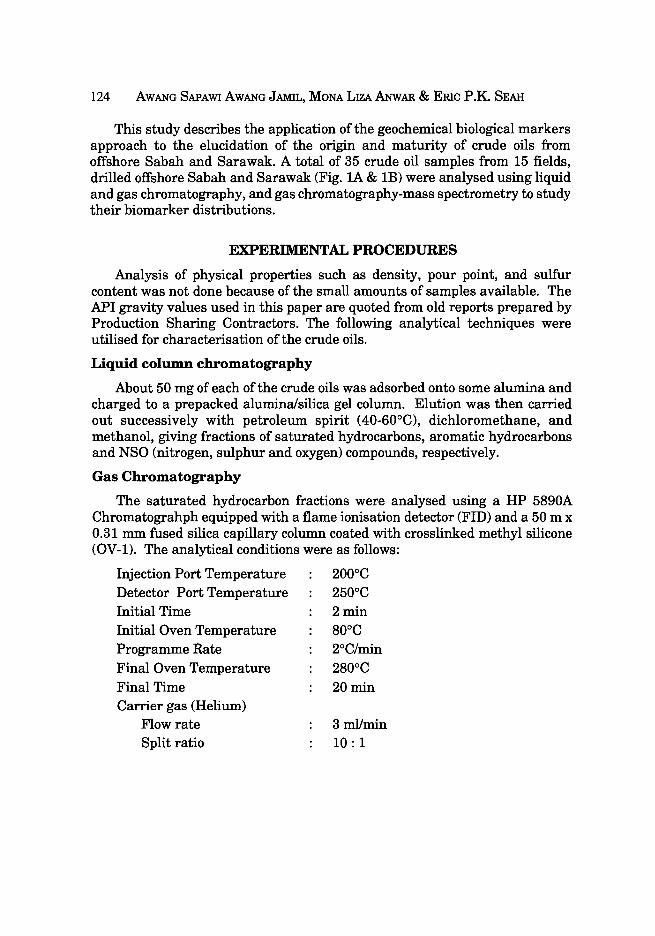
EXPERUMENTALPROCEDURES
Analysis of physical properties such as density, pour point, and sulfur content was not done because of the small amounts of samples available. The API gravity values used in this paper are quoted from old reports prepared by Production Sharing Contractors. The following analytical techniques were utilised for characterisation of the crude oils.
Liquid column chromatography
About 50 mg of each of the crude oils was adsorbed onto some alumina and charged to a prepacked alumina/silica gel column. Elution was then carried out successively with petroleum spirit (40-60°C), dichloromethane, and methanol, giving fractions of saturated hydrocarbons, aromatic hydrocarbons and NSO (nitrogen, sulphur and oxygen) compounds, respectively.
Gas Chromatography
The saturated hydrocarbon fractions were analysed using a HP 5890A Chromatograhph equipped with a flame ionisation detector (FID) and a 50 m x 0.31 mm fused silica capillary column coated with crosslinked methyl silicone (OV-l). The analytical conditions were as follows:
Injection Port Temperature 200°C Detector Port Temperature 250°C Initial Time 2 min Initial Oven Temperature 80°C Programme Rate 2°C/min Final Oven Temperature 280°C Final Time 20 min Carrier gas (Helium)
Flow rate 3 mlImin Split ratio 10: 1
o 200 '---Tr;;-'
~
N.6° South
-- ' ;I '_A' E.115°
SOUTH CHINA SEA
DC DE , "'. / WA
N.I,400,OOO • ~ ~ PA . , - \
/ / ...---- DA ~ DD DF ..
N.I,200,OOO'
E.800,OOO'
-DB/
E.I,OOO,OOO'
TE
~
r -,
o 100,000 fl
LA
~ .."
SI
\ -
E.I,400,OOO' E.I,600,OOO'
Figure lA: Locations of oil fields, offshore Sarawak, utilized in this study
~ ~
~ -c: Sil CIl
~
~ ~ c: o [T1
~ ~ en »III
~ ~ o en ~
~ ;00::
...... tv U\
E.2,000,000'
N.2,SOO,000' .---~~~~----------~ ~Q
km N.sO
N.SOOO'
" N.2,000,000' , ',<, _ KI
"-.,.,....... LA8U~ 0
..........
"
• \ KE
, " TA
c;:;lP.Tigo
E.IISOOO' E.2,400,000'
~ '\
SJ
·'Kolo Belud
MI. Kinobolu ...
:::8 6pkm
Figure IB: Locations of oil fields, offshore Sabah, utilized in this study
-~ ~ ~ 00
~ !l ~ ~
J ~ ~
i r ~ t:z:j
~ ""d ~
f
GEOCHEMISTRY OF SELECfED CRUDE OILS FROM SABAH AND SARAWAK 127
Gas chromatography - mass spectrometry (GC·MS)
GC·MS analysis of the saturated hydrocarbon fractions was made using a KRATOS MS25RFA mass spectrometer coupled to a Carlo Erba gas chromatograph fitted with a 25m x 0.31 mm i.d., CP-Sil 5-CB fused silica capillary column (OV-1). Helium was used as a carrier gas with a flow rate of2 mllmin. Each sample was injected in the split mode (25:1) at 50°C and programmed to 160°C at 5°C/min and then to 280°C at 3°C/min with a final hold at 280°C for 15 min. The mass spectrometer was operated with a filament current of 100 uA, electron ionization energy of 70 e V and ion source temperature of 240°C. Data were acquired and processed using a DS90 Data System.
Apart from the fullscan mode, the samples were also analysed using the Selected Metastable Ion Monitoring (SMIM) technique by monitoring metastable transitions; M+->217+ for steranes and M+->191+ for triterpanes, where M+ is the molecular ion.
RESULTS AND DISCUSSION
API gravity
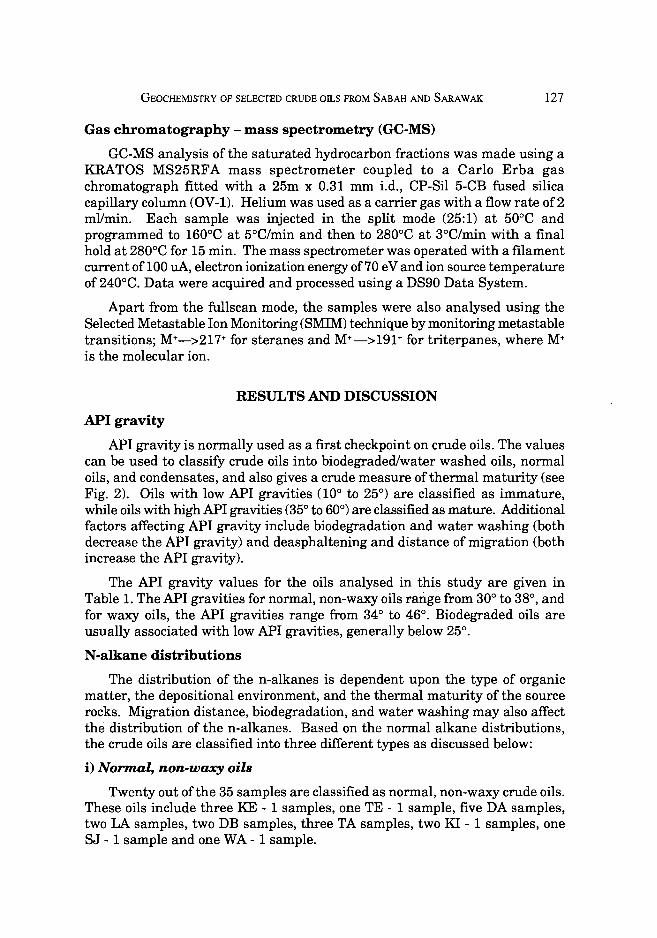
API gravity is normally used as a first checkpoint on crude oils. The values can be used to classify crude oils into biodegraded/water washed oils, normal oils, and condensates, and also gives a crude measure of thermal maturity (see Fig. 2). Oils with low API gravities (10° to 25°) are classified as immature, while oils with high API gravities (35° to 60°) are classified as mature. Additional factors affecting API gravity include biodegradation and water washing (both decrease the API gravity) and deasphaltening and distance of migration (both increase the API gravity).
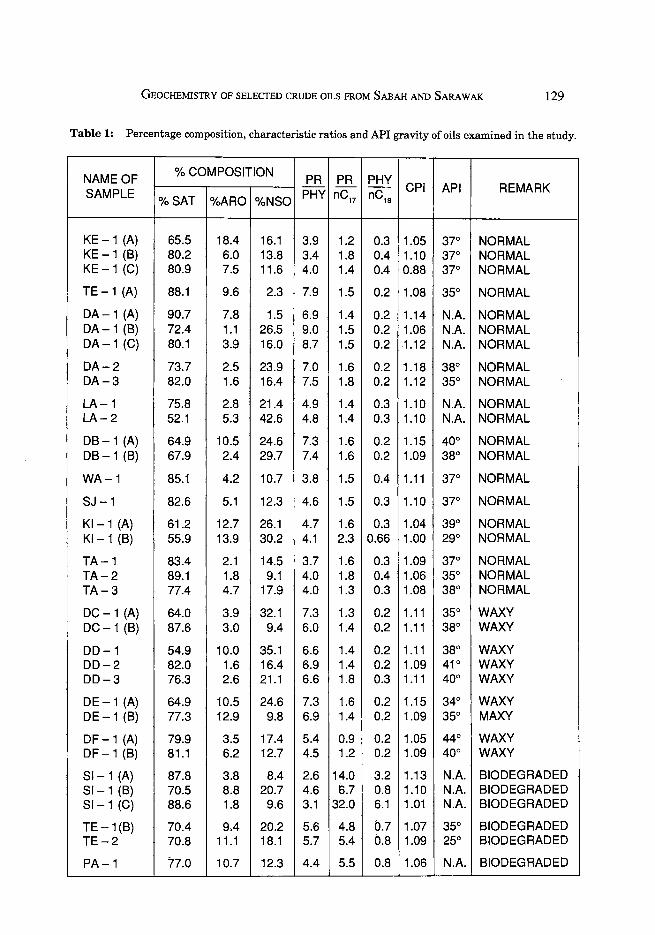
The API gravity values for the oils analysed in this study are given in Table 1. The API gravities for normal, non-waxy oils range from 30° to 38°, and for waxy oils, the API gravities range from 34° to 46°. Biodegraded oils are usually associated with low API gravities, generally below 25°.
N·alkane distributions
The distribution of the n-alkanes is dependent upon the type of organic matter, the depositional environment, and the thermal maturity of the source rocks. Migration distance, biodegradation, and water washing may also affect the distribution of the n-alkanes. Based on the normal alkane distributions, the crude oils are classified into three different types as discussed below:
i) Normal, non·waxy oils
Twenty out of the 35 samples are classified as normal, non-waxy crude oils. These oils include three KE - 1 samples, one TE - 1 sample, five DA samples, two LA samples, two DB samples, three TA samples, two KI - 1 samples, one SJ - 1 sample and one WA - 1 sample.
128 AWANG SAPAWI AWANG JAMIL, MONA LIZA ANwAR & ERIC P.K SEAH
~-----------~--~--,~----------,---------------~--,
API GRAVITY SPECIFIC GRAVITY
095
010
35--t--- 01$
IL •
010
7
- ~
CONDENSATE 55---
LOW MATURITY CRUDE
(OR PHYSICAL TRANSFORMA TION)
NORMAL MATURE CRUDE
HIGH MATURITY CRUDE
(OR THERMAL TRANSFORMA TlON)
-------
l
H
~----------------~--075----------~--------------~--~ Figure 2: Classification of crude oils based on API and specific gravities (From Sofer et al.,
1989).
GEOCHEMISTRY OF SELECfEO CRUDE OILS FROM SABAH AND SARAWAK 129
Table 1: Percentage composition, characteristic ratios and API gravity of oils examined in the study.
NAME OF % COMPOSITION
PR PR PHY SAMPLE
- -nC1S
CPI API REMARK % SAT %ARO %NSO PHY nC17
KE-1 (A) 65.5 18.4 16.1 3.9 1.2 0.3 1.05 37° NORMAL KE-1 (B) 80.2 6.0 13.8 3.4 1.8 0.4 1.10 37° NORMAL KE-1 (C) 80.9 7.5 11.6 4.0 1.4 0.4 0.88 37° NORMAL
TE-1 (A) 88.1 9.6 2.3 7.9 1.5 0.2 1.08 35° NORMAL
DA-1 (A) 90.7 7.8 1.5 6.9 1.4 0.2 1.14 NA NORMAL DA-1 (B) 72.4 1.1 26.5 9.0 1.5 0.2 1.06 N.A. NORMAL DA-1 (C) 80.1 3.9 16.0 8.7 1.5 0.2 ·1.12 NA NORMAL
DA-2 73.7 2.5 23.9 7.0 1.6 0.2 1.18 38° NORMAL DA-3 82.0 1.6 16.4 7.5 1.8 0.2 1.12 35° NORMAL
LA-1 75.8 2.8 21.4 4.9 1.4 0.3 1.10 N.A. NORMAL LA-2 52.1 5.3 42.6 4.8 1.4 0.3 1.10 N.A. NORMAL
DB-1 (A) 64.9 10.5 24.6 7.3 1.6 0.2 1.15 40° NORMAL DB-1 (B) 67.9 2.4 29.7 7.4 1.6 0.2 1.09 38° NORMAL
WA-1 85.1 4.2 10.7 3.8 1.5 0.4 1.11 37° NORMAL
SJ-1 82.6 5.1 12.3 4.6 1.5 0.3 1.10 37° NORMAL
KI-1 (A) 61.2 12.7 26.1 4.7 1.6 0.3 1.04 39° NORMAL KI-1 (B) 55.9 13.9 30.2 4.1 2.3 0.66 1.00 29° NORMAL
TA-1 83.4 2.1 14.5 3.7 1.6 0.3 1.09 37° NORMAL TA-2 89.1 1.8 9.1 4.0 1.8 0.4 1.06 35° NORMAL TA-3 77.4 4.7 17.9 4.0 1.3 0.3 1.08 38° NORMAL
DC-1 (A) 64.0 3.9 32.1 7.3 1.3 0.2 1.11 35° WAXY DC-1 (B) 87.6 3.0 9.4 6.0 1.4 0.2 1.11 38° WAXY
DD-1 54.9 10.0 35.1 6.6 1.4 0.2 1.11 38° WAXY DD-2 82.0 1.6 16.4 6.9 1.4 0.2 1.09 41° WAXY DD-3 76.3 2.6 21.1 6.6 1.8 0.3 1.11 40° WAXY
DE -1 (A) 64.9 10.5 24.6 7.3 1.6 0.2 1.15 34° WAXY DE -1 (B) 77.3 12.9 9.8 6.9 1.4 0.2 1.09 35° MAXY
DF -1 (A) 79.9 3.5 17.4 5.4 0.9 0.2 1.05 44° WAXY DF -1 (B) 81.1 6.2 12.7 4.5 1.2 0.2 1.09 40° WAXY
SI-1 (A) 87.8 3.8 8.4 2.6 14.0 3.2 1.13 N.A. BIODEGRADED SI-1 (B) 70.5 8.8 20.7 4.6 6.7 0.8 1.10 N.A. BIODEGRADED SI-1 (C) 88.6 1.8 9.6 3.1 32.0 6.1 1.01 N.A. BIODEGRADED
TE -1(B) 70.4 9.4 20.2 5.6 4.8 0.7 1.07 35° BIODEGRADED TE-2 70.8 11.1 18.1 5.7 5.4 D.B 1.09 25° BIODEGRADED
PA-1 77.0 10.7 12.3 4.4 5.5 0.8 1.06 N.A. BIODEGRADED
130 AWANG SAPAWI AWANG JAMIL, MONA LlZA ANwAR & ERIC P.K SEAH
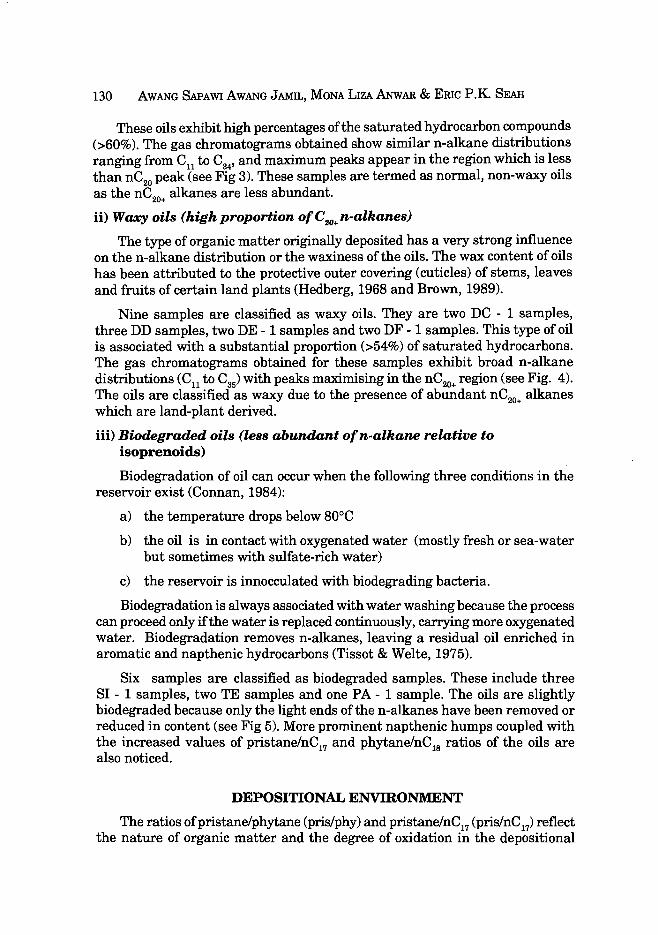
These oils exhibit high percentages of the saturated hydrocarbon compounds (>60%). The gas chromatograms obtained show similar n-alkane distributions ranging from Cll to C34, and maximum peaks appear in the region which is less than nC20 peak (see Fig 3). These samples are termed as normal, non-waxy oils as the nC20+ alkanes are less abundant.
ii) Waxy oils (high proportion of C 20+ n-alkanes)
The type of organic matter originally deposited has a very strong influence on the n-alkane distribution or the waxiness of the oils. The wax content of oils has been attributed to the protective outer covering (cuticles) of stems, leaves and fruits of certain land plants (Hedberg, 1968 and Brown, 1989).
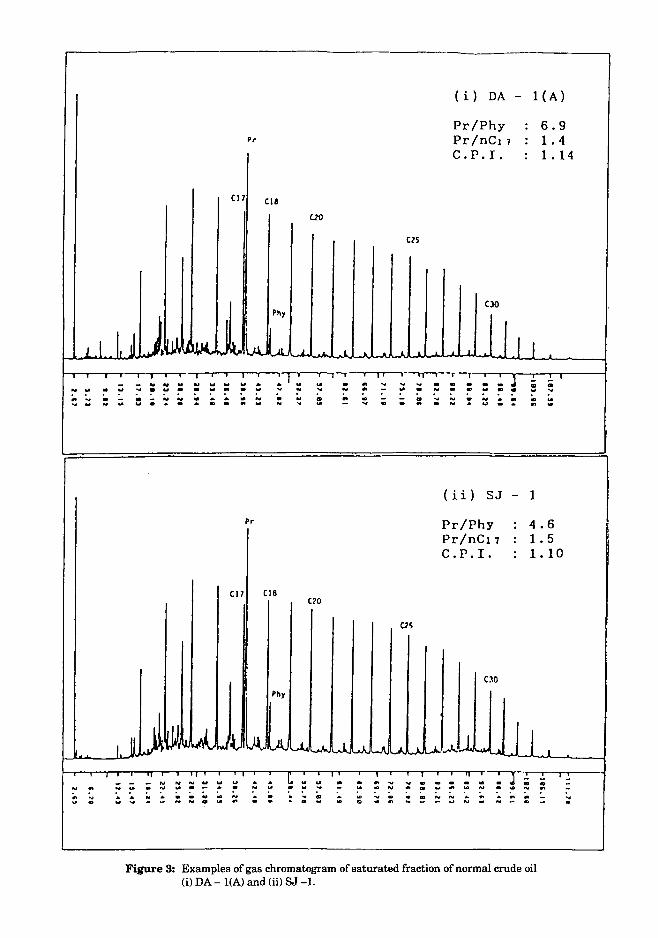
Nine samples are classified as waxy oils. They are two DC - 1 samples, three DD samples, two DE - 1 samples and two DF - 1 samples. This type of oil is associated with a substantial proportion (>54%) of saturated hydrocarbons. The gas chromatograms obtained for these samples exhibit broad n-alkane distributions (Cn to C35) with peaks maximising in the nC20+ region (see Fig. 4). The oils are classified as waxy due to the presence of abundant nC20+ alkanes which are land-plant derived.
iii) Biodegraded oils (less abundant ofn-alkane relative to isoprenoids)
Biodegradation of oil can occur when the following three conditions in the reservoir exist (Connan, 1984):
a) the temperature drops below 80°C
b) the oil is in contact with oxygenated water (mostly fresh or sea-water but sometimes with sulfate-rich water)
c) the reservoir is innocculated with biodegrading bacteria.
Biodegradation is always associated with water washing because the process can proceed only if the water is replaced continuously, carrying more oxygenated water. Biodegradation removes n-alkanes, leaving a residual oil enriched in aromatic and napthenic hydrocarbons (Tissot & Welte, 1975).
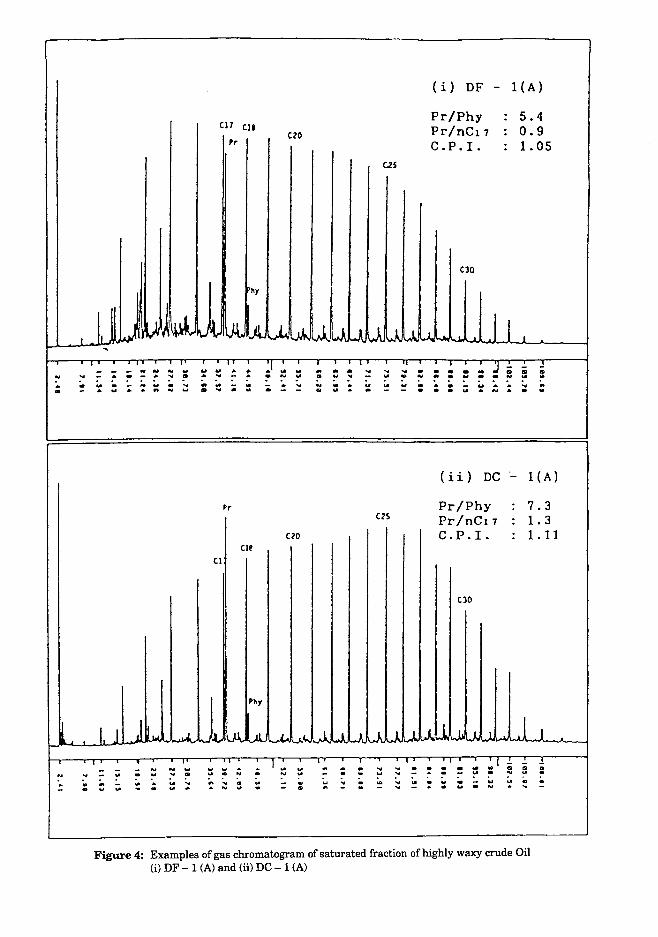
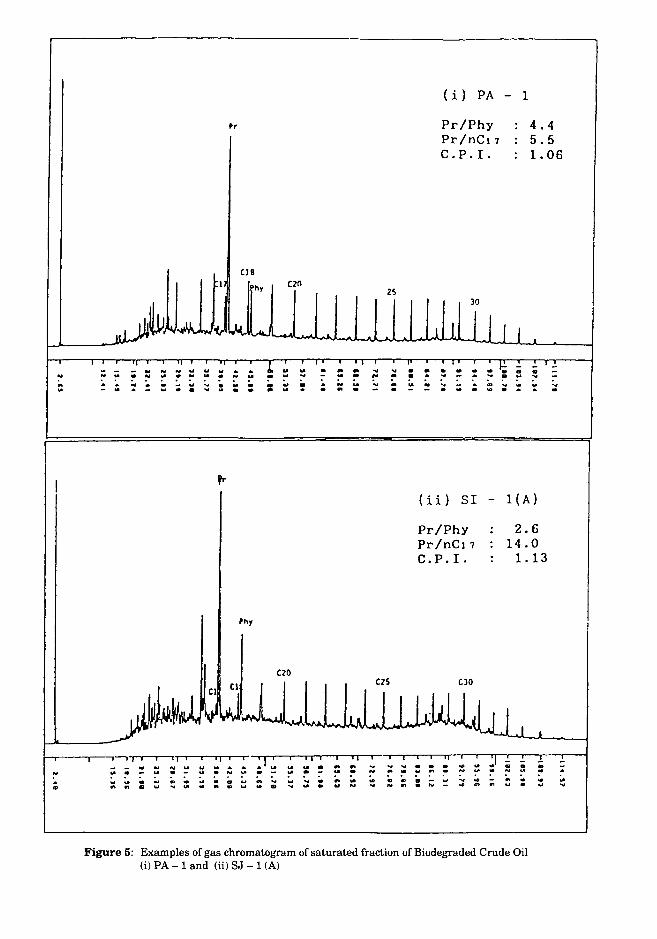
Six samples are classified as biodegraded samples. These include three SI - 1 samples, two TE samples and one PA - 1 sample. The oils are slightly biodegraded because only the light ends of the n-alkanes have been removed or reduced in content (see Fig 5). More prominent napthenic humps coupled with the increased values of pristane/nC17 and phytanelnC18 ratios of the oils are also noticed.
DEPOSITIONAL ENVffiONMENT
The ratios ofpristane/phytane (pris/phy) and pristane/nC17 (pris/nC17) reflect the nature of organic matter and the degree of oxidation in the depositional
1.1
:- !" :" .. .... .. .... .. ..
=- :' .. .. .. ..
( i ) DA - 1 (A)
Pr/Phy : 6.9 Pr Pr/nCl7 : 1.4
C.P.I. : 1. 14
C17 CI8
uo
C15
C30
J,lJI, I j lUI.
, Phy
/,1 J~ I
I, J .J.l .J1 .J... J. Jt .J.
-.,-,---,- I i i I , ~ I ~ i I i , If .---,...,--r-,
: ~ .. Of .. .. .. .. .. . .. .. .. .... .... .... .. .. .. .. iii .. .... !" .. .. .. .. .. .. .. .... .. ... .. .. - !" .. Of .. .. .. .. ;; • ;; .. .. : . . .. .. .. .. .. ~ .. ;; ;; := .... .. .. .. . : .. .. . .. .. .. .. .. .. .... .. .... .. .. . .. .. ..
(ii ) SJ - 1
Pr Pr/Phy : 4.6 Pr/nCl7 : 1.5 C.P.I. : 1. 10
CI7 CI8 (10
05
00 Phy
I. JlJ ,lllJul.A,..Jt LA A ,t ..... 1 ,1 J..l.,.I..;U-..Io' j I ~ ~ .I.e -' 1
~ :: -:T" I
;; .. .. .. ~ .. .. . . .. ~ .. .. .... .... .. .. .. .. := : .a ~ .. .. .. .. .. . .. N .. ... .. .. .. .. .. .. .. ~ . . .. .. . . .. . .. .. .. .. .. : ....
~ ~ .... .. .. ~ ... .. . .. .: ~ .. .. .... .. .. .. .. .. .. . .. w GO .. .. .. OJ .. .. ..
Figure 3: Examples of gas chromatogram of saturated fraction of normal crude oil (i) DA - l(A) and (ii) SJ -1.
I
!" ... .. .. '"
Ii.:
.. :' . .. - ..
( i) DF - I (A)
C17 Pr/Phy : 5.4
CII Pr/nel7 0.9 C10 : Pr C.P.I. : 1. 05
czs
C30
hy
tJ ~' l) ~lul .~ ~ 'l~. Jl ..L 11 l J J J .1 .L .L j I I
...
N N .. .. .. ~I .. I
ii : :; ~ ! : .. .. .. .. ... ... ... .. .. .. .. .. J '" .. ~ :' !- . ... ~ AI .. !" .. .. - .. .. .. .. :- !" ...... .. .. .. :; .. .. .. ... .. ... ;; :: ;; .. ... .. :. .. :: ;. .. .. .. .. ;; ~ .. . :.. .. .. .. .. .. .. III ... .. .. .. - .. .. .. . AI .. ..
(ii) De - leA)
Pr Pr/Phy : 7.3 C2S PrIne! 7 : 1.3
C20 c.p.r. : 1.11 Cle
CI
C30
Ph,
I, .I .I I ... • ..1. ~ II J.l .L L"'- .1 .1 .A J. 1 .1WJJ. .h1 L 1 1
: ;; .. .. .. .. .. . · ' .. .. =: . .. ... ... ~ . : ~ .. 00' ;; iii : .. .. ... !- .. .. .. · :" .. . - .. .. . ~ :- :" ~ .. ;; .. .. .. ... .. .. : .. - .. =: :! .. ... .. .. :: .. :. ;; .. .. .. .. .. .. .. .. .. .. .. · - .. .. .. .. .. AI .. ..
Figure 4: Examples of gas chromatogram of saturated fraction of highly waxy crude Oil (i) DF - 1 (A) and (ii) DC - 1 (A)
.. ..
~
'r
Cln
;:; ;;; ; .. N .. .. .. .. . . .. .. .. .. .. .. .. . .. .. !" .. .... :. . .. ! . ; .. ::: :: .. . • ~ : - .. .. • . .. .. ..
Phy
C20
-, I II Ii :1 I I I ;;; ; ~ .. .. !! .. .. . . ~ .. ... ... . .. .. .. .. .. ... .. w .. ;. .. .. .. ;. . .. w ., .. ... :.. .. .. .. ... ... .. .. .. .. ... .. .. .. ...
2S
::: : .... ... . !" .. !" . :: .. .. .. .. .. .
C2S
I "
~ .. : .. .. .. ... '" .. .. ;. ~ ::: ~
.. .. . ... .. ..
(i) PA 1
Pr/Phy Pr/nC17 C.P.I.
. . ! .. . ... . :.. ... ;;; . .. ..
(ii) SI
Pr/Phy Pr/nC17 C.P.I.
C)O
. . .. ... :: .. .. .. .. : .. ~ ..
.. ... ;,.
.. .. ;;
4.4 5.5 1. 06
.. e e !" ... :: .. .. .
1 (A)
2.6 14.0
1.13
~ :: .. .. ... ...
... .
Figure 5: Examples of gas chromatogram of saturated fraction of Biodegraded Crude Oil (i) PA - 1 and (ii) SJ - 1 (A)
134 AWANG SAPAWI AWANG JAMIL, MONA LIZA ANwAR & ERIC P.K SEAH
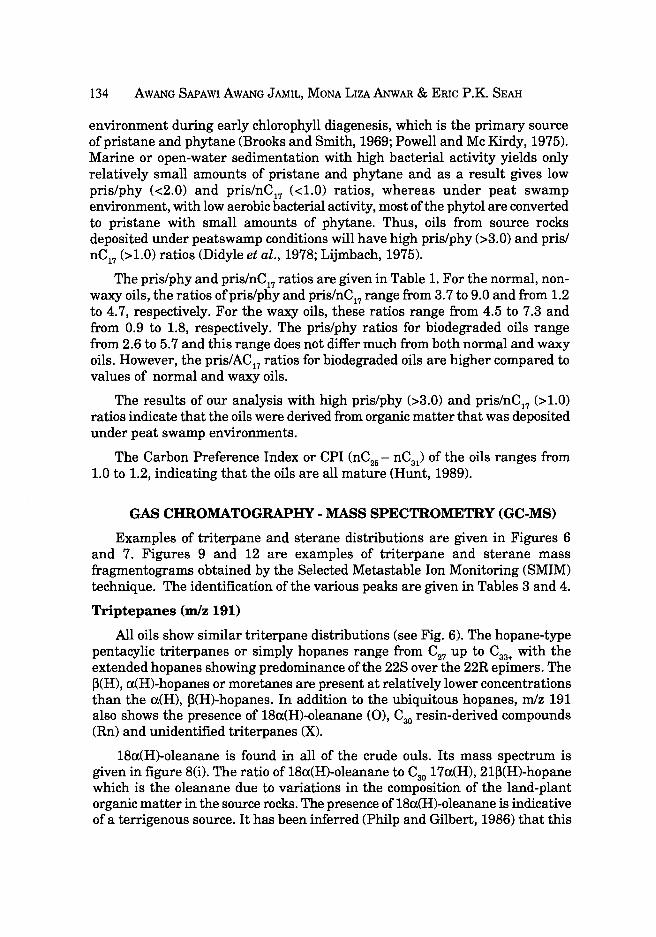
environment during early chlorophyll diagenesis, which is the primary source ofpristane and phytane (Brooks and Smith, 1969; Powell and Mc Kirdy, 1975). Marine or open-water sedimentation with high bacterial activity yields only relatively small amounts of pristane and phytane and as a result gives low pris/phy «2.0) and pris/nCl7 «1.0) ratios, whereas under peat swamp environment, with low aerobic bacterial activity, most of the phytol are converted to pristane with small amounts of phytane. Thus, oils from source rocks deposited under peatswamp conditions will have high prislphy (>3.0) and pris/ nCl7 (>1.0) ratios (Didyle et al., 1978; Lijmbach, 1975).
The pris/phy and prislnCl7 ratios are given in Table 1. For the normal, nonwaxy oils, the ratios ofprislphy and prislnCl7 range from 3.7 to 9.0 and from 1.2 to 4.7, respectively. For the waxy oils, these ratios range from 4.5 to 7.3 and from 0.9 to 1.8, respectively. The prislphy ratios for biodegraded oils range from 2.6 to 5.7 and this range does not differ much from both normal and waxy oils. However, the prislACl7 ratios for biodegraded oils are higher compared to values of normal and waxy oils.
The results of our analysis with high prislphy (>3.0) and prislnCl7 (>1.0) ratios indicate that the oils were derived from organic matter that was deposited under peat swamp environments.
The Carbon Preference Index or CPI (nC25 - nC31) of the oils ranges from 1.0 to 1.2, indicating that the oils are all mature (Hunt, 1989).
GAS CHROMATOGRAPHY· MASS SPECTROMETRY (GC·MS)
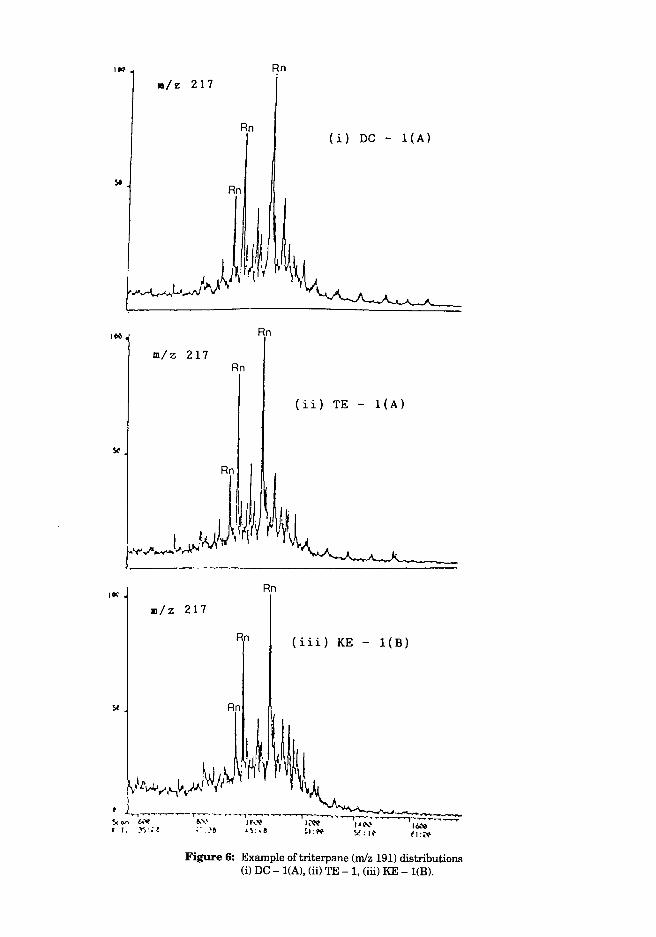
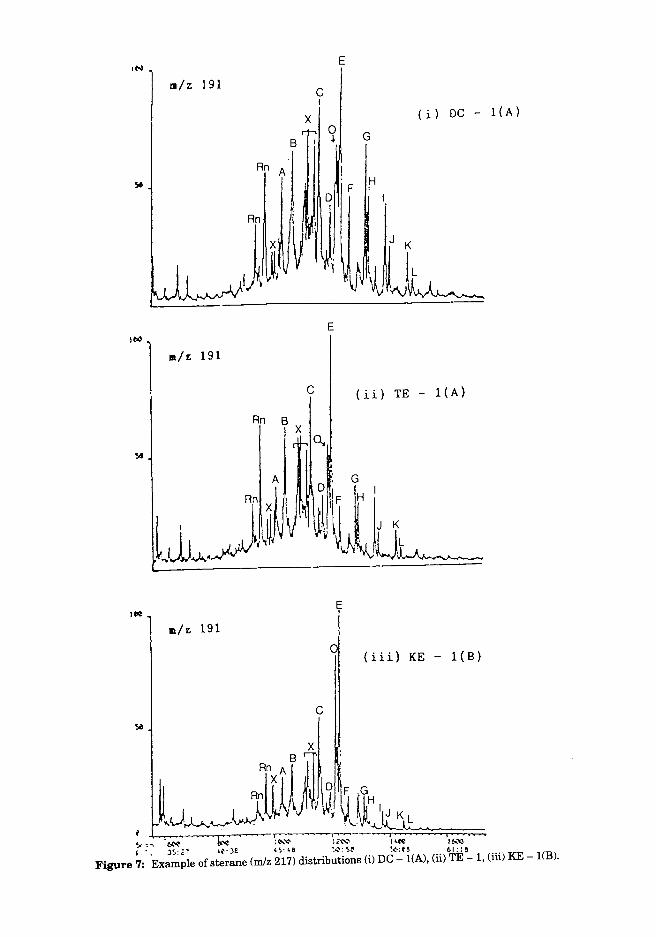
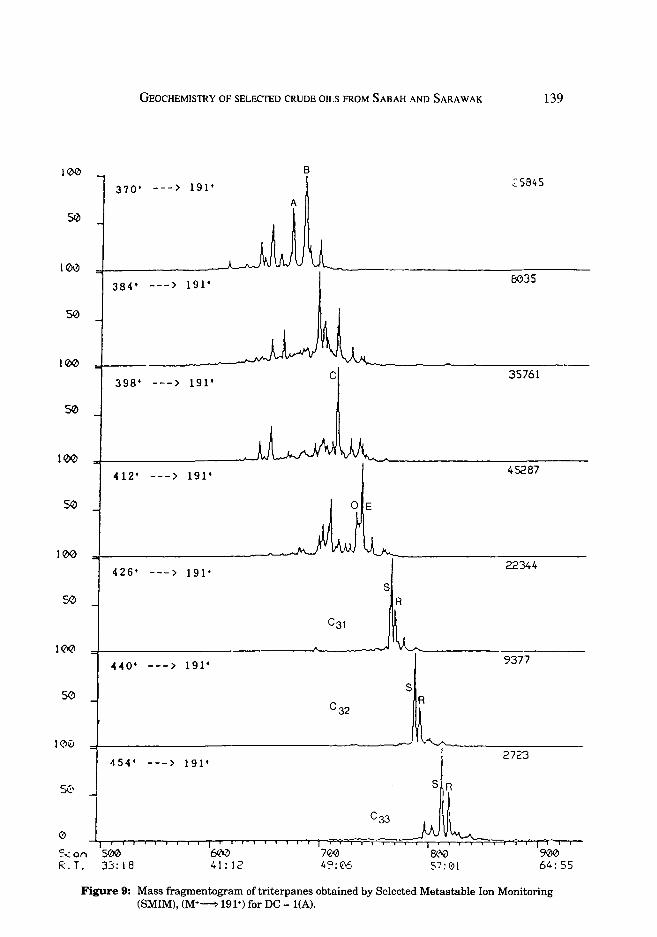
Examples of triterpane and sterane distributions are given in Figures 6 and 7. Figures 9 and 12 are examples of triterpane and sterane mass fragmentograms obtained by the Selected Metastable Ion Monitoring (SMIM) technique. The identification of the various peaks are given in Tables 3 and 4.
Triptepanes (mlz 191)
All oils show similar triterpane distributions (see Fig. 6). The hopane-type pentacylic triterpanes or simply hopanes range from C27 up to C33+ with the extended hopanes showing predominance of the 22S over the 22R epimers. The ~(H), a(H)-hopanes or moretanes are present at relatively lower concentrations than the a(H), ~(H)-hopanes. In addition to the ubiquitous hopanes, mlz 191 also shows the presence of 18a(H)-oleanane (0), CaD resin-derived compounds (Rn) and unidentified triterpanes (X).
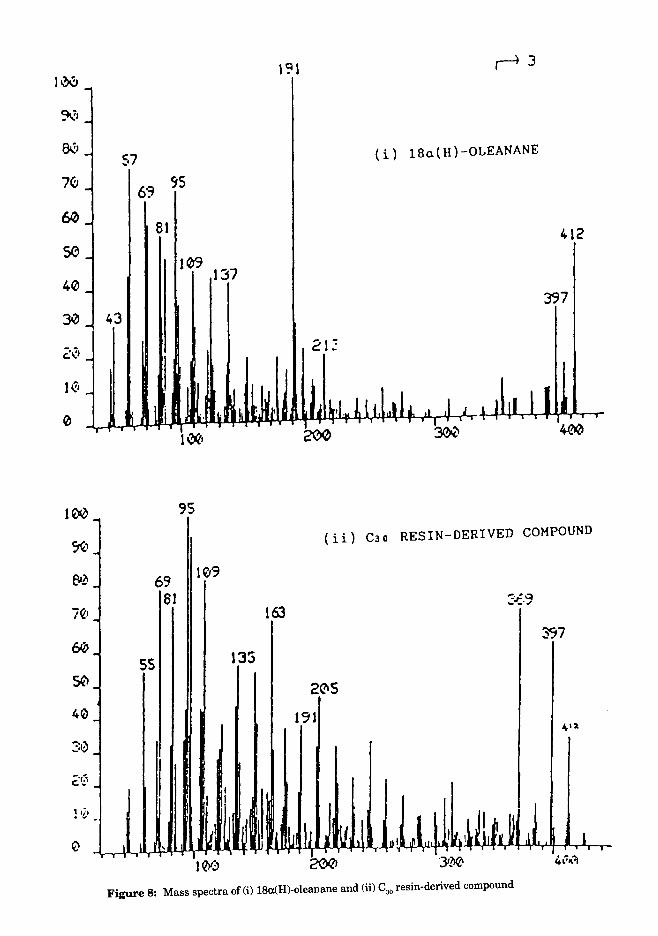
18a(H)-oleanane is found in all of the crude ouls. Its mass spectrum is given in figure 8(i). The ratio of 18a(H)-oleanane to Cao 17a(H), 21~(H)-hopane which is the oleanane due to variations in the composition of the land-plant organic matter in the source rocks. The presence of 18a(H)-oleanane is indicative of a terrigenous source. It has been inferred (Philp and Gilbert, 1986) that this
GEOCHEMISTRY OF SELECfED CRUDE OILS FROM SABAH AND SARAWAK 135
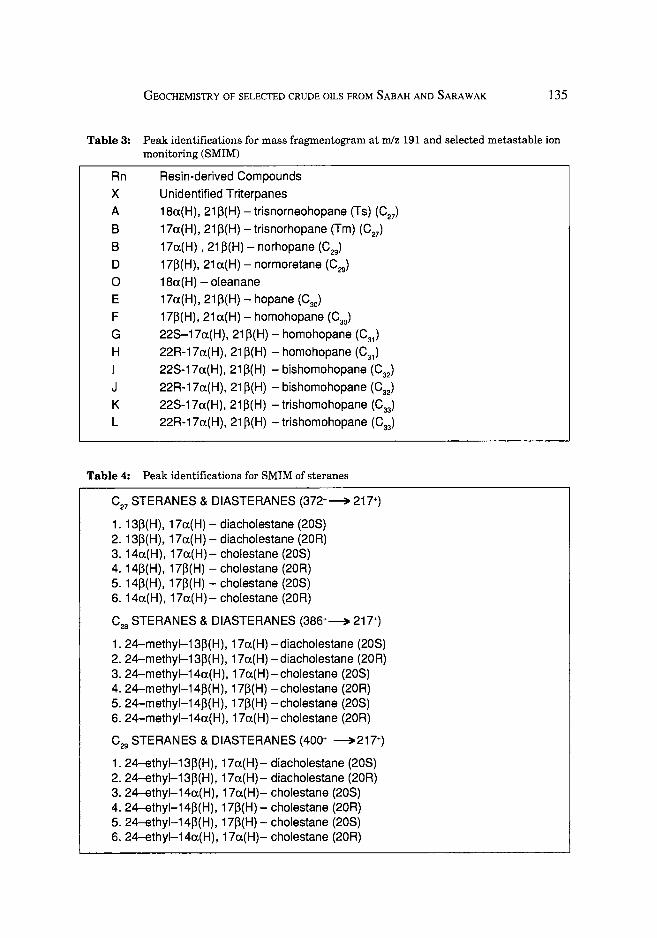
Table 3: Peak identifications for mass fragmentogram at mlz 191 and selected metastable ion monitoring (SMIM)
Rn Resin-derived Compounds X Unidentified Triterpanes A 18a(H). 21 ~(H) - trisnorneohopane (Ts) (C27)
B 17a(H). 21 ~(H) - trisnorhopane (Tm) (C27)
B 17a(H) • 21 ~(H) - norhopane (C29)
D 17~(H). 21 a(H) - normoretane (C29)
o 18a(H) - oleanane E 17a(H). 21 ~(H) - hopane (C30)
F 17~(H). 21 a(H) - homohopane (C30)
G 228-17a(H). 21 ~(H) - homohopane (C3,)
H 22R-17a(H). 21~(H) - homohopane (C3,)
I 22S-17a(H). 21~(H) - bishomohopane (C32)
J 22R-17a(H). 21~(H) - bishomohopane (C32)
K 22S-17a(H). 21 ~(H) - trishomohopane (C33)
L 22R-17a(H). 21 ~(H) - trishomohopane (C33)
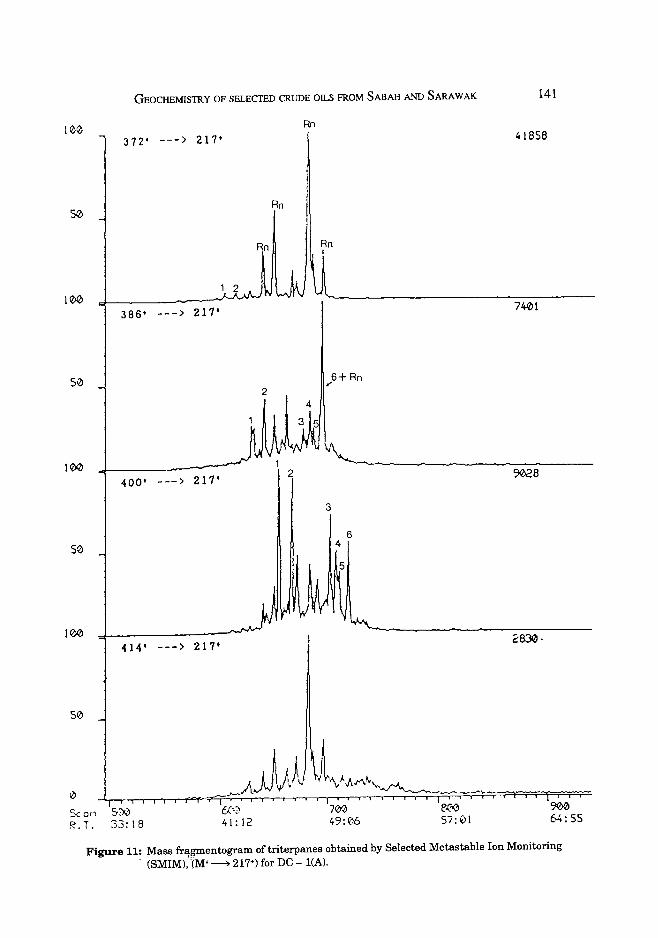
Table 4: Peak identifications for SMIM of steranes
C27 STERANES & DIASTERANES (372+~ 217+)
1. 13~(H). 17a(H) - diacholestane (20S) 2. 13~(H). 17a(H) - diacholestane (20R) 3. 14a(H). 17a(H) - cholestane (20S) 4. 14~(H). 17~(H) - cholestane (20R) 5. 14~(H). 17~(H) - cholestane (20S) 6. 14a(H). 17a(H) - cholestane (20R)
C28 STERANES & DIASTERANES (386+~ 217+)
1. 24-methyl-13~(H). 17a(H) - diacholestane (20S) 2. 24-methyl-13~(H). 17a(H) - diacholestane (20R) 3. 24-methyl-14a(H). 17a(H)-cholestane (20S) 4. 24-methyl-14~(H). 17~(H) -cholestane (20R) 5. 24-methyl-14~(H). 17~(H) -cholestane (20S) 6. 24-methyl-14a(H). 17a(H)- cholestane (20R)
C29 STERANES & DIASTERANES (400+ ~ 217+)
1. 24-ethyl-13~(H). 17a(H)- diacholestane (20S) 2. 24-ethyI-13~(H). 17a(H)- diacholestane (20R) 3. 24-ethyl-14a(H). 17a(H)- cholestane (20S) 4. 24-ethyl-14~(H). 17~(H) - cholestane (20R) 5. 24-ethyl-14~(H). 17~(H)- cholestane (20S) 6. 24-ethyl-14a(H). 17a(H)- cholestane (20R)
Ii'!'
lee
It\'
Rn rely. 217
Rn ( i) DC - 1 (A)
Rn
m/z 217 Rn
( i i) TE - 1 ( A )
Rn
m/z 217
Rn ( iii) KE - 1 ( B )
Figure 6: Example oftriterpane (mlz 191) distributions (i) DC -l(A), (ii) TE - 1, (iii) KE -l(B).
IN E
m/z 191 C I
X ( i) DC - 1 (A)
0 G
B I • Rn A
F H
J K
~ E
air. 191
C ( ii) TE - l( A )
Rn B X
A
l_JJ~.j,~} E
air. 191
o (i ii) KE - 1 ( B )
C
!Ie
X
~'cJ~~Jr~{A ~ F ~HI ,~ .. ~~ ..
f ~ II;~ il4Cle '1&'0
,.~. 35:,,:" '00:32 4S:t.8 ~~:S~ ~:t5 61:18 Figure 7: Example of sterane (m/z 217) distributions (i) DC - l(A), (ii) TE - 1, (iii) KE - 1(B).
1 ~ 1 100
9\:,
BIZ' S7
(i) 18a(H)-OLEANANE
70 69 95
60 81 412
50 109
40 137
397 30 43
2':;' 21 ~
10
0
9S
RESIN-DERIVED COMPOUND , ( i i) C30
69 103
61 J 163
SS 135
2(?1S
- 191 40
30 -- I ,
I I I
-
~ r~ - I I • 41 , :UI III I ~, IJ III
J o 100
Figure 8: Mass spectra of (i) 18a(H)-oleanane and (ii) CaD resin-derived compound
GEOCHEMISTRY OF SELECTED CRUDE OILS FROM SABAH AND SARAWAK 139
100 B
370' ---> 191' Z5845
A
50
100
384' ---> 191' 0035
50
100 C 35761
398' ---> 19I+
50
100
412' ---) 19I+ 45267
50
100
426' 22344
---) 191 • S
50 R
C31
100
440' ---> 191' '7377
S 50 R
C 32
100
I 27~"3 454 ' ---) 191'
5::' -J
~J~ 0 I ~~i 9. I ',".,-,--I , , , I , i , 1 i i i i i I i i i i i
= .. :on S00 600 7e'lJ &~0 5100 R. T. 33: 18 41: 12 4~:06 5::01 64:55
Figure 9: Mass fragmentogram of triterpanes obtained by Selected Metastable Ion Monitoring (SMIM), (M+-? 191 +) for DC - 1(A).
140 AWANG SAPAWI AWANG JAMIL, MONA LIZA ANwAR & ERIC P.K SEAH
100 B 370' ---) 191' 15808
50 A
100 4453
384' ---) 191'
50
100
398' ---) 191' 22834
50 c
.00
412' ---) 191' 49072 OE
50
100
" 26' ---) 191' 10485
50
100
440' ---) 191' S R
50
100
454' ---) 191' 1950
s
R
o Scan S(l0 R. T. 3~: 19
600 .. I: 13
700 49:08
800 57:02
9021 64: 56
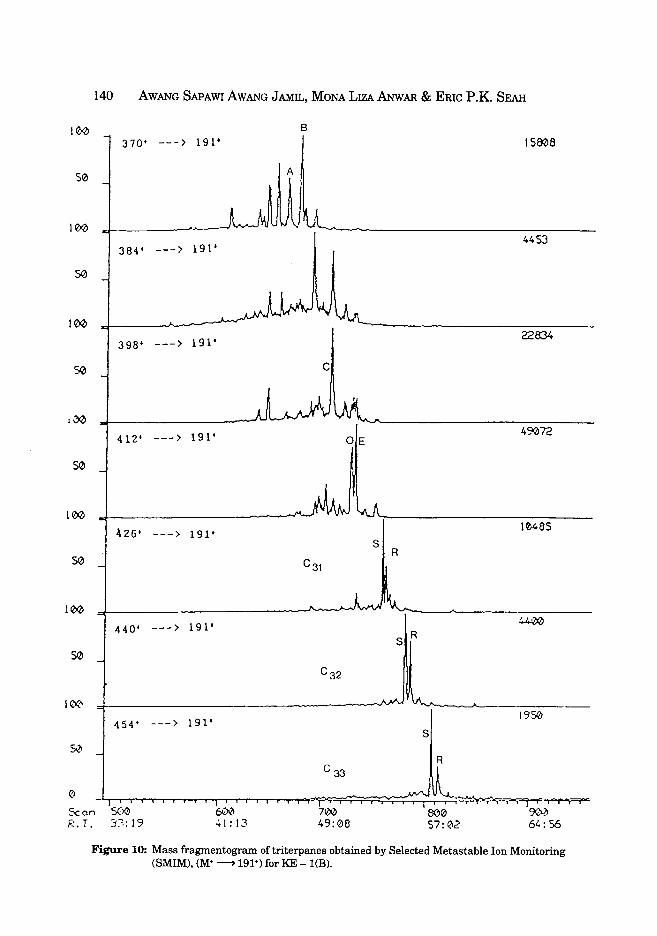
Figure 10: Mass fragmentogram oftriterpanes obtained by Selected Metastable Ion Monitoring (SMIM), (M+ ~ 191+) for KE -l(B).
100
50
100
S13
100
S0
100
S0
GEOCHEMISTRY OF SELEerED CRUDE OILS FROM SABAH AND SARAWAK
Rn 372' ---> 217'
Rn
386+ ---> 217+
2
400' ---> 217' 2
414+ ---> 217+
~JJ -L,--,--..,., ....".--.--,.........~r· -T"7' , I I I I I I
Rn
,,6+ Rn
3
6 4
5
141
41858
9028
2830·
5c an 5'~ 6C:-71
f 7 I i 900 64: SS R. T . 33: 1 8 4 1 : 12
Figure 11: Mass fragmentogram oftriterpanes obtained by Selected Metastable Ion Monitoring . (SMIM):1M+~217+)forDC-l(A).
142
100
50
100
50
100
S0
50
o
AWANG SAPAWI AWANG JAMll.., MONA LlZA ANwAR & ERIC P.K SEAR
372' --->217'
Rn
3
400' ---> 217'
2
414' ---> 217'
n
6+ Rn
4
56
16778
2522
1008
~~ •• "'71' 7,,;,": .~~
Scan 500 R.T. 33:19
~ 41: 13
700 000 900 49:08 57:02 64: 56
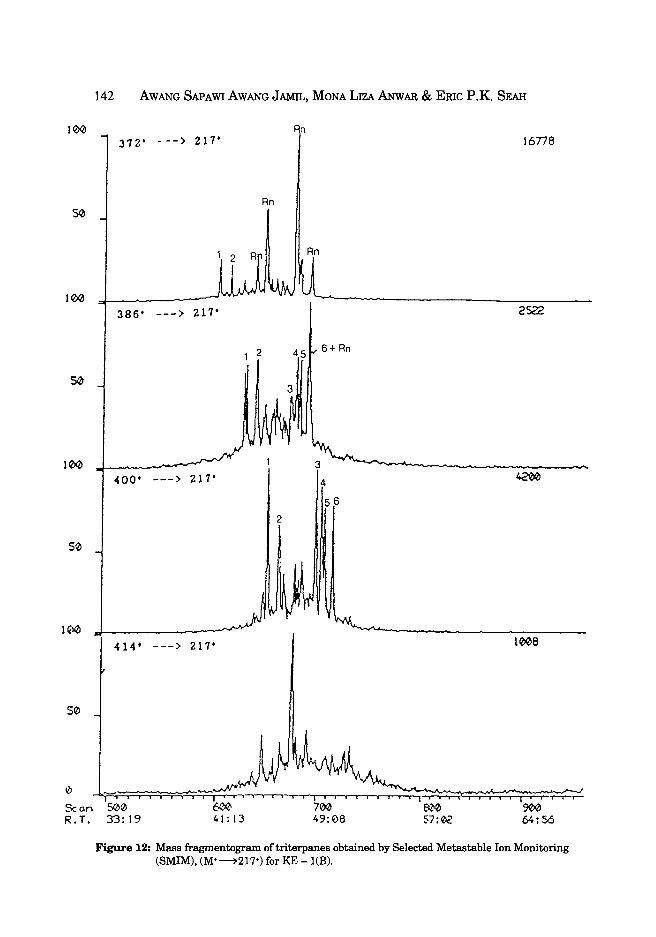
Figure 12: Mass fragmentogram of triterpanes obtained by Selected Metastable Ion Monitoring (SMIM), (M+----7217+) for KE - l(B).
GEOCHEMISTRY OF SELEcrED CRUDE OILS FROM SABAH AND SARAWAK 143
compound, which has been found in Tertiary oils and rock extracts, is a marker for the presence of angiosperm debris in the source rocks. This compound is also found in oils from Indonesia (Robinson, 1987), New Zealand (Czochanska et al., 1988), and Nigeria (Ekweozor et al., 1979), which also contain a predominance of higher plant source material.
The presence of Cao resin-derived compounds (Rn) is confirmed by their mass spectra with characteristic peaks at mlz 163, 313, 369, 397 and 412 [see Fig. 8(ii)]. Various researchers have identified these Rn peaks, three of which were labelled W,T and R by Grantham et al. (1983) and Grantham (1986). Compound T has been found to be trans-trans-trans-bicadinane (Cox et al., 1986), while van Aarssen et al., (1990b) has determined W to be ciscis-transbicadinane.
The presence of 18a.(H)-oleanane and resin-derived compounds in all of the oils suggest that the oils were derived from source rocks of terrigenous origin containing mixtures of dirrerent types of land-plant organic matter including resins.
Steranes (mlz 217)
The mass fragmentogram (mlz 217) shows similar sterane distributions for all of the oils. The steranes are present at relatively lower concentrations than the resins (Rn) and are difficult to identify (See Fig. 7). However, when the sample is monitored using the SMIM technique, the regular steranes and diasteranes are clearly shown and positively identified (see Figs. 11 and 12).
The distributions of the C27, C28, and C29 steranes shows that the C29
steranes are present in greater concentrations than the C27- and C28-steranes. It has been commonly suggested that C29 steranes are derived from C29 steranes at the expense of the C28 and C27 steranes is clearly indicative of a significant input of terrigenous organic material (Philp and Zhaoan, 1986).
Oils which contain high concentrations of components derived from terrigenous organic material customarily contain relatively high proportions of triterpanes relative to steranes (Czochanska et al., 1988). For the 35 crude oils analysed, the hopane to sterane ratios tend to be relatively high, ranging from 1.75 to 8.41, with the majority (29) higher than 3. This indicates variation in the nature of the original organic matter from which the oils were derived, which is to be expected as the area covered is extensive.
A land-plant origin for all of the oils is futher indicated by the absence of Cao-steranes, which are typical of marine-derived oils (Moldowan et al., 1985).
MATURITY
Two maturity parameters based on hopane and sterane isomer rations were used to assess the maturity level of the oils (Seifert and Moldowan 1980, 1981). These are the epimerisation of 22R to 22S ofthe extended hopanes and
144 AWANG SAPAWI AWANG JAMIL, MONA LIZA ANwAR & ERIC P.K SEAR
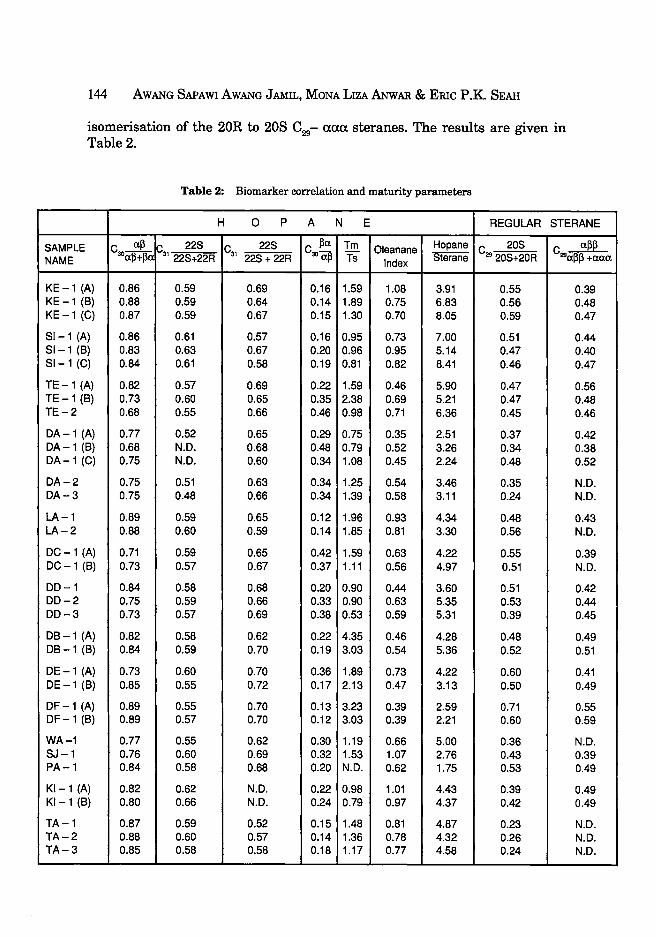
isomerisation of the 20R to 20S C29- aaa steranes. The results are given in Table 2.
Table 2: Biomarker correlation and maturity parameters
H 0 P A N E REGULAR STERANE
SAMPLE C ap h 228 C 22S C pa Tm Oleanane Hopane 208 C~ NAME 3Oa p+pa 1-'3122S+22R 31 228 + 22R 30~ Ts Index 8terane C29 20S+20R 29a pp +aaa
KE-1 (A) 0.86 0.59 0.69 0.16 1.59 1.08 3.91 0.55 0.39 KE-1 (8) 0.88 0.59 0.64 0.14 1.89 0.75 6.83 0.56 0.48 KE-1 (C) 0.87 0.59 0.67 0.15 1.30 0.70 8.05 0.59 0.47
SI-1 (A) 0.86 0.61 0.57 0.16 0.95 0.73 7.00 0.51 0.44 SI-1 (8) 0.83 0.63 0.67 0.20 0.96 0.95 5.14 0.47 0.40 SI-1 (C) 0.84 0.61 0.58 0.19 0.81 0.82 8.41 0.46 0.47
TE-1 (A) 0.82 0.57 0.69 0.22 1.59 0.46 5.90 0.47 0.56 TE-1 (8) 0.73 0.60 0.65 0.35 2.38 0.69 5.21 0.47 0.48 TE-2 0.68 0.55 0.66 0.46 0.98 0.71 6.36 0.45 0.46
DA-1 (A) 0.77 0.52 0.65 0.29 0.75 0.35 2.51 0.37 0.42 DA-1 (8) 0.68 N.D. 0.68 0.48 0.79 0.52 3.26 0.34 0.38 DA-1 (C) 0.75 N.D. 0.60 0.34 1.08 0.45 2.24 0.48 0.52
DA-2 0.75 0.51 0.63 0.34 1.25 0.54 3.46 0.35 N.D. DA-3 0.75 0.48 0.66 0.34 1.39 0.58 3.11 0.24 N.D.
LA-1 0.89 0.59 0.65 0.12 1.96 0.93 4.34 0.48 0.43 LA-2 0.88 0.60 0.59 0.14 1.85 0.81 3.30 0.56 N.D.
DC-1 (A) 0.71 0.59 0.65 0.42 1.59 0.63 4.22 0.55 0.39 DC-1 (8) 0.73 0.57 0.67 0.37 1.11 0.56 4.97 0.51 N.D.
DD-1 0.84 0.58 0.68 0.20 0.90 0.44 3.60 0.51 0.42 DD-2 0.75 0.59 0.66 0.33 0.90 0.63 5.35 0.53 0.44 DD-3 0.73 0.57 0.69 0.38 0.53 0.59 5.31 0.39 0.45
D8-1 (A) 0.82 0.58 0.62 0.22 4.35 0.46 4.28 0.48 0.49 D8-1 (8) 0.84 0.59 0.70 0.19 3.03 0.54 5.36 0.52 0.51
DE-1 (A) 0.73 0.60 0.70 0.36 1.89 0.73 4.22 0.60 0.41 DE-1 (8) 0.85 0.55 0.72 0.17 2.13 0.47 3.13 0.50 0.49
DF -1 (A) 0.89 0.55 0.70 0.13 3.23 0.39 2.59 0.71 0.55 DF -1 (8) 0.89 0.57 0.70 0.12 3.03 0.39 2.21 0.60 0.59
WA-1 0.77 0.55 0.62 0.30 1.19 0.66 5.00 0.36 N.D. SJ-1 0.76 0.60 0.69 0.32 1.53 1.07 2.76 0.43 0.39 PA-1 0.84 0.58 0.68 0.20 N.D. 0.62 1.75 0.53 0.49
KI-1 (A) 0.82 0.62 N.D. 0.22 0.98 1.01 4.43 0.39 0.49 KI-1 (8) 0.80 0.66 N.D. 0.24 0.79 0.97 4.37 0.42 0.49
TA-1 0.87 0.59 0.52 0.15 1.48 0.81 4.87 0.23 N.D. TA-2 0.88 0.60 0.57 0.14 1.36 0.78 4.32 0.26 N.D. TA-3 0.85 0.58 0.58 0.18 1.17 0.77 4.58 0.24 N.D.
GEOCHEMISTRY OF SELECfED CRUDE OILS FROM SABAH AND SARAWAK
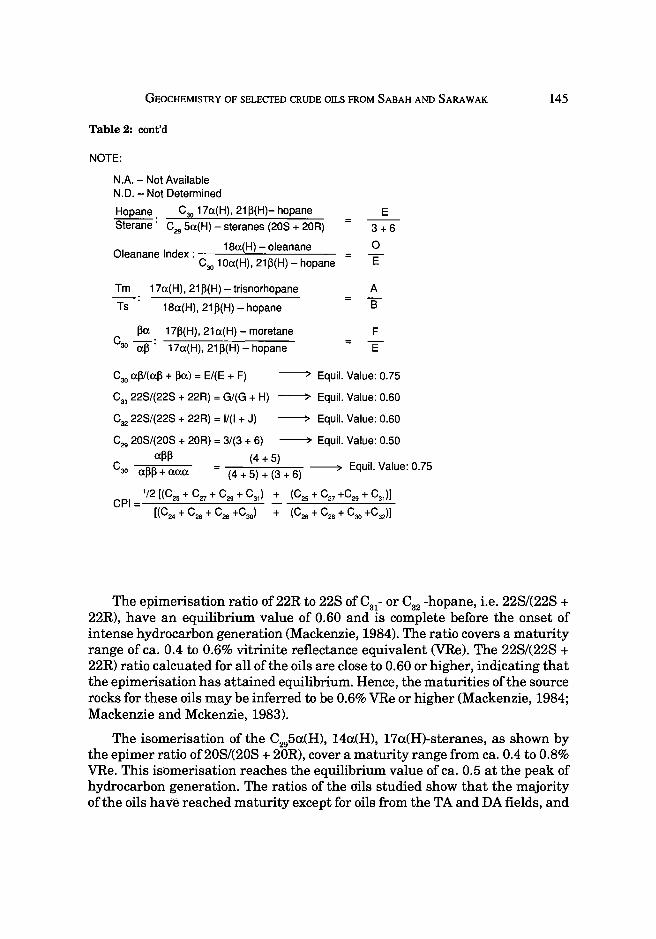
Table 2: cont'd
NOTE:
N.A. - Not Available N.D. - Not Determined
Hopane C30 17a(H), 21 ~(H)- hopane
Sterane: C29 5a(H) - steranes (20S + 20R)
01 I d ____ 1~8_a(~H~)_-_o~le~a~na~n~e __ _ eanane n ex:
Tm
Ts
C30 1 Oa(H), 21 ~(H) - hopane
17a(H), 21 ~(H) - trisnorhopane
18a(H), 21 ~(H) - hopane
~a 17~(H), 21 a(H) - moretane
C30 ajf: 17a(H), 21~(H) - hopane
E
3+6
o E
A B
F E
C30 aW(a~ + ~a) = E/(E + F) ----? Equil. Value: 0.75
C3l 22S/(22S + 22R) = G/(G + H) ----? Equil. Value: 0.60
C32 22S/(22S + 22R) = 1/(1 + J) ----? Equil. Value: 0.60
C29 20S/(20S + 20R) = 3/(3 + 6) ----? Equil. Value: 0.50
a~ ~+~ . C30 ~RR + aa~ ) ( ----? EqUiI. Value: 0.75
.............. (4 + 5 + 3 + 6)
1/2 [(C25 + C27 + C29 + C31 ) + (C25 + C27 +C29 + C31 )] CPI=----------~--~
[(C24 + C26 + C28 +C30) + (C26 + C28 + C30 +C32)]
145
The epimerisation ratio of22R to 228 ofC31- or C32 -hopane, i.e. 228/(228 + 22R), have an equilibrium value of 0.60 and is complete before the onset of intense hydrocarbon generation (Mackenzie, 1984). The ratio covers a maturity range of ca. 0.4 to 0.6% vitrinite reflectance equivalent (VRe). The 228/(228 + 22R) ratio calcuated for all of the oils are close to 0.60 or higher, indicating that the epimerisation has attained equilibrium. Hence, the maturities of the source rocks for these oils may be inferred to be 0.6% VRe or higher (Mackenzie, 1984; Mackenzie and Mckenzie, 1983).
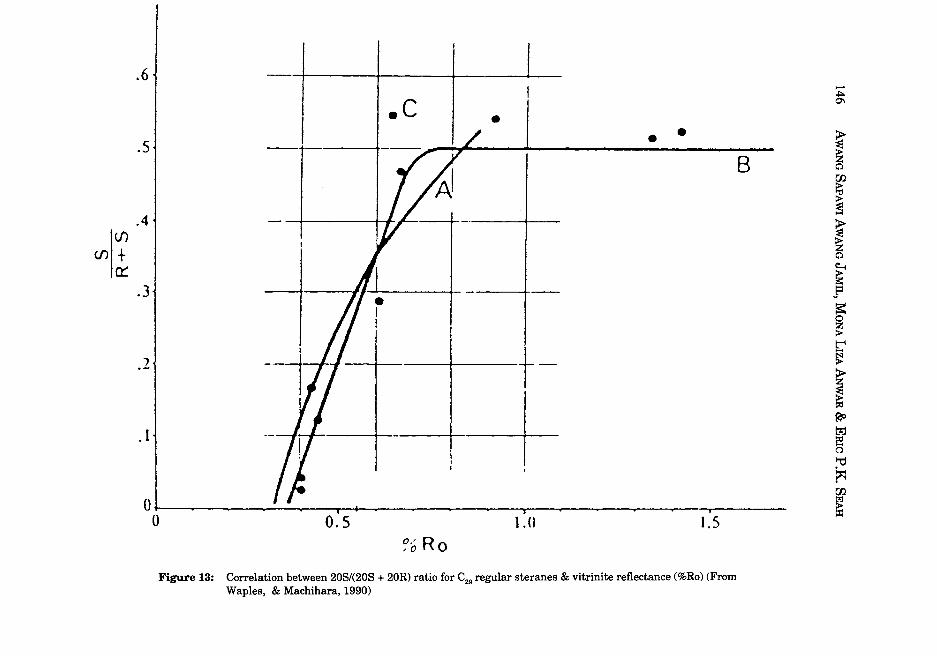
The isomerisation of the C295a(H), 14a(H), 17a(H)-steranes, as shown by the epimer ratio of208/(208 + 20R), cover a maturity range from ca. 0.4 to 0.8% VRe. This isomerisation reaches the equilibrium value of ca. 0.5 at the peak of hydrocarbon generation. The ratios of the oils studied show that the majority of the oils have reached maturity except for oils from the TA and DA fields, and
(j')
(J)I + a:::
.6 I I .c •
. 5 ~ I ~1·- 1-- '/ -' ., • •
B
I Il/AJ I .4
.3
.2
. I
O~I--~--____ ~ __ ~ __ ~4-~ __ ~ __ ~ __ ~ __ ~ __ ~ __ ~ __ ~ __ ~ __ ~ ______ _
o 0.5 1.0 I.S 0/ Ro ,0
Figure 13: Correlation between 208/(208 + 20R) ratio for C29 regular steranes & vitrinite reflectance (%Ro) (From Waples, & Machihara, 1990)
...... ~
~ ~ 00
~ ~
~ ~
J ~ o ~
i r ~ t?::1
~ ~
~
r
GEOCHEMISTRY OF SELECfED CRUDE OILS FROM SABAH AND SARAWAK 147
from wells KI - 1, DD - 3 WA - 1 and SJ - 1. Comparisation of results with published data (see Fig. 13) indicates that the oils were generated from source rocks with maturities that range form 0.5% to 0.8% VRe or higher.
Based on the C29 20S/(20S + 20R) ratio, it appears that samples from DF, KE, LA - 2, DE - 1 (A) and DC - C (A) wells are most mature, while samples from TA and DA fields and KI - 1 and WA - 1 are least mature.
Other maturity parameters such as aromatisation of steranes which cover high VRe need to be applied in order to determine the high end of the maturity of source rocks. However, this data is not currently available.
CONCLUSIONS
1. The oils may be classified into three groups based on their n-alkane distributions: normal non-waxy; waxy; and slightly biodegraded.
2. High pris/phy (>3.0) and pris/nC17 (>1.0) ratios indicate that the oils were derived from organic matter that was deposited under peat swamp environments.
3. Mass fragmentograms of steranes and triterpanes show that the oils were generated from terrigenous source rocks containing mixtures of different types ofland-plant organic matter including resins.
4. The triterpane and sterane distributions show little variation, suggesting that all the oils were derived from the same general type of organic matter, namely land-plants. The large ranges of oleanane index and hopane to sterane ratios probably reflect differences in the vegetation in different parts of the extensive study area.
5. Triterpane and sterane maturity parameters show that the oils were generated from source rocks with maturities ranging from 0.5% to at least 0.8% VRe.
ACKNO~DGEMENTS
Useful comments were provided by Dr. Khalid Ngah and Prof. Dr. N. S Haile of PETRONAS Petroleum Research Institute (PRI) and by Dr. D.W. Waples of Japan National Oil Corporation. The authors would also like to thank the staff of Geochemistry Section of PRI for their assistance and for preparing the samples and carrying out liquid column chromatographic analyses.
REFERENCES
BROOKS, J.D. AND SMITH, W.J. (1969). The diagenesis of plant lipids during the formation of coal, petroleum and natural gas-II, coalification and the formation of oil and gas in the Gippsland basin. Geochimica et Cosmochimica Acta, V. 33, pp. 1183-1194.
148 AWANG SAPAWI AWANG JAMIL, MONA LIZA ANwAR & ERIC P.K. SEAll
BROWN, S. (1989). The "mangrove model", can it be applied to hydrocarbon exploration in Indonesia. Proceedings Indonesian Petroleum Association, Eighteen Annual Convention, pp. 385-40l.
CONNAN, J. (1984). Biodegradation of Crude Oils in Reservoirs. In Adv. Pet. Geochem. (Ed. by Brooks, J. and Welte, D.), 1, pp. 299-335.
Cox, H.C., DE LEEuw, J.W., SCHENCK, P.A., VAN KONINGSVELD, H., JANSEN, J.C., VAN DE GRAAF B., VAN GEERESTEIN, V.J., RANTERS, J.A., KRUK, C. AND JANS, A.W.H. (1986). Bicadinane, a Cso pentacyclic isoprenoid hydrocabon found in crude oil. Nature, 319, 316-318.
CZOSCHANSKA, Z., GILBERT, T.D., PHILP, R.P., SHEPPARD, C.M., WESTON, R.J. AND WOOD, T.A. (1988). Geochemical Application ofSterane and Triterpane Biomarkers to A Description of Oils from the Taranaki Basin in New Zealand. Org. Geochem., Vol. 12, No.2, pp. 123-135.
DIDYK, B.M., SIMONEIT, B.R.T., BRASSELL, S.C. AND EGLINTON, G. (1978). Organic Geochemical Indicators of Palaeoenvironmental Conditions of Sedimentation. Nature (London), 272, pp. 216-222.
EKWEOZOR, C.M., OKOGUN, J.1. EKONG, D.E.U. AND MAxwELL, J.R. (1979). Preliminary organic geochemical studies of samples from the Niger Delta (Nigeria). Chem. Geol., 27, pp. 11-28.
GRANTHAM, P.J. (1986). Sterane isomerisation and moretane/hopane ratios in crude oils derive from Tertiary source rocks. Org. Geochem., Vol. 9, No.6, pp. 293-304.
GRANTHAM, P.J., POSTHUMA J. AND BAAK A. (1983). Triterpanes in a number of Far Eastern Crude oils. Advances in organic geochemistry 1981 (Edited by Bjoroy M. et al.), pp. 710-724. WileyHeydon, Chichester.
HUNT, J.M. (1989). Chapter 7, The Source Rock. Petroleum Geochemistry and Geology, pp. 302-310, W.H. Freeman and Co.
HEDBERG, H.D. (1968). Significance of high wax oils in the generation of petroleum. AAPG Bulletin, v. 52, pp. 736-750.
LlJMBACH, G.W.M. (1975). On the origin of petroleum. Proceedings of the World Petroleum Congress, Special Paper 1, 357.
MACKENZIE, A.S. (1984). Application of Biological Markers in Petroleum Geochemistry. Adv. Pet. Geochem. (Ed. by Brooks, J. and Welte, D.), 1, pp. 115-214.
MACKENZIE, A.S. AND MCKENZIE D. (1983). Isomerisation and aromatization of hydrocarbons in sedimentary basins formed by extension. Geol. Mag., v. 120, pp. 417-465.
MOLDOWAN, J.M., SEIFERT, W.K. AND GALLEGOS, E.J. (1985). Relationship between petroleum composition and depositional environment of petroleum source rocks. APPG Bulletin, vol. 69, No.8, pp. 1255-1268.
PHILP, R.P. AND GILBERT, T.D. (1986). Biomarker distributions in Australian oils predominantly derived from terrigenous source material. Organic Geochem., Vol. 10, pp. 73-84.
PHILP, R.P. AND ZHAOAN, F. (1987). Geochemical investigation of oils and source rocks from Qianjiang depression of Jianghan Basin, a terrigenous saline basin, China. Org. Geochem., Vol. 11, No. 6, pp. 549-562.
POWELL, T.G. AND Mc KIRDY, D.M.(1975). Relationship between ratio of pristane to phytane, crude oil composition and geological environment in Australia. Nature physical science (243), pp. 37-39.
RoBINSON, KM. (1987). An overview of source rocks and oils in Indonesia. IPA Proc. 16th Ann. Conv., pp. 97-122.
SEIFERT, W.K AND MOLDOWAN, J.M. (1980). The effect of thermal stress on souce rock quality as measured by hopane stereochemistry. Adv. in Org. Geochem, 1979 (Edited by Douglas, A.G. and Maxwell, J.R.), pp. 229-237. Pergamon Press, Oxford.
SEIFERT, W.K AND MOLDOWAN, J.M. (1981). Paleoreconstruction by biological markers. Geochim. Cosmochim. Acta, 45, pp. 783-794.
SOFER, Z., PALMER, S. AND VLIERBOOM, F. (1989). In 'Organic Geochemical Parameters, pp. 28, Occidental International Exploration and Production Company, Bakersfield, California.

GEOCHEMISTRY OF SELECTED CRUDE OILS FROM SABAH AND SARA W AK 149
TrSSOT, B.P. AND WELTE, D.H. (1978). Chapter 5, Petroleum Alteration. Petroleum Formation and Occurrence, Springer-Verlag.
WAPLES, D.W. AND MACHIHARA, T. (1990). Application of sterane and triterpane biomarkers in petroleum exploration. Bulletin of Canadian Petroleum Geology, Vol. 38, No.3, pp. 357-380.
VAN AARsSEN, B.G.K, KRUK C., HEssELS J.K.C. & DE LEEUW J.W., 1990 (in press). Ciscis-transbicadinave a novel member of an uncommon triterpane family isolated from crude oils. Tetrahedron Lett.
Manuscript received 3rd June 1991