Embed Size (px)
Citation preview
Geochemistry of Hydric Soil Salinity in a Recharge-Throughflow-DischargePrairie-Pothole Wetland System
J. L. Arndt* and J. L. Richardson
ABSTRACTThe saturation-paste extract (SPE) chemistry of samples collected
in the wet-meadow and shallow-marsh zones of seven North Dakotawetlands was related to SPE electrical conductivity to investigatethe development of hydric-soil salinity. Study wetlands represent alocal, depression-focused groundwater-flow system. Recharge wet-lands recharge the groundwater whereas discharge wetlands receivethe majority of their water as groundwater discharge. Throughflowwetlands receive water from as well as yield water to the system.Development of soil salinity generally followed the Hardie andEugster model of closed-basin brine evolution, which considers thecomposition of solutions undergoing evaporation to be the result ofchemical changes imposed by the successive formation of evaporiteminerals. Hydric soils of recharge wetlands were nonsaline and freeof calcite (CaCO3) and gypsum (CaSO4-2H2O). The chemistry ofthese soils results from evapotranspiration, recharge hydrology, ionicmobility, and exchange relationships. Increases in SPE Mg2+, Na%and SOi dominance in more saline throughflow and discharge wet-lands are caused by calcite and gypsum precipitation, with the formercontrolling alkalinity and the latter Ca2+ concentrations. At highsalinities produced by concentration through freezing, mirabilite(Na2SO4-10H2O) crystallizes and controls Na* levels, resulting inhypersaline solutions enriched in Mg2+ and SO2,'. Additional vari-ation in the patterns of salinity development can be explained bydominance of recharge over discharge, mixing with fresh or chem-ically discrete water, and valence dilution effects.
THE CLASSIFICATION and chemistry of wetlands inthe glaciated Northern Plains is based on depres-
sion-focused groundwater recharge-discharge relation-ships (Rozkowski, 1967; Miller, 1969; Stewart andKantrud, 1971,1972; Sloan, 1972). Local and regionalgroundwater flow systems can be characterized by ex-amining the effects of topography and groundwatermovement on wetland plant communities, the com-position of which reflects average salinity and pondingpermanence (Stewart and Kantrud, 1972). Wetlandstypically fall into three categories: (i) Recharge wet-lands that recharge the groundwater with fresh addi-tions derived primarily from depression-focused over-land flow and snow-catch, (ii) Throughflow wetlandsthat receive water from as well as yield water to thegroundwater system, and (iii) Discharge wetlands thathave a small overland flow component and receivethe majority of their water as groundwater discharge.Several investigators have related hydric soil mor-phology and salinity to these groundwater flow pat-terns (Richardson and Bigler, 1984; Miller et al, 1985;Mills and Zwarich, 1986). A direct relationship wasfound between wetland salinity and net groundwaterdischarge.Dep. of Soil Science, North Dakota State Univ., P.O. Box 5638,Fargo, ND 58105. Contribution from the Dep. of Soil Science, NorthDakota State Univ. Published with the approval of the director ofthe North Dakota Agric. Exp. Stn. as Journal Paper no. 1739. Re-ceived 8 Mar. 1988. 'Corresponding author.
Published in Soil Sci. Soc. Am. J. 53:848-855 (1989).
Surficial groundwater composition in the NorthernPlains results primarily from geochemical processesoperative during groundwater recharge and discharge(Groenewold et al., 1983). Dissolved solids are ini-tially acquired by weathering of surficial geologic ma-terial. Further alterations in groundwater chemistryresult from evapotranspiration, mineral precipitation-dissolution equilibria, ion exchange, biologically-me-diated redox reactions, and additions of meteoric waterand other chemically discrete groundwaters (Hardieand Eugster, 1970; Sloan, 1972; Wigley, 1973; Gor-ham et al., 1983; Hendry et al., 1986).
Because surface drainage is not integrated andgroundwater recharge and discharge is through depres-sions (Lissey, 1971) which have high evaporation, itwas expected that evapotranspiration and solid-phaseevaporite minerals would be important in the devel-opment of hydric-soil salinity. Literature is extensivedescribing the chemical evolution of marine brines.The Hardie and Eugster (1970) model is applicable tothe dilute-solutions found in nonmarine environ-ments. According to this model, as a solution becomessupersaturated further concentration results in precip-itation and an alteration in solution composition de-pendent upon the initial ratio of interacting ions. Withsulfatic solutions similar to those found in the studyarea, the model predicts the successive precipitationof calcite and gypsum with increasing concentration.Resulting saline solutions will be high in sulfates ofMg and Na.
The present study examines the geochemistry of soilsalinity in shallow-marsh and wet-meadow zones ofwetlands in a recharge-throughflow-discharge wetlandcomplex in North Dakota. We hypothesize that thetemporal and spatial development of salinity in thesewetlands results primarily from successive mineralprecipitation in groundwaters being concentrated byevapotranspiration along the recharge-discharge flowpath.
MATERIALS AND METHODSDescription of the Study Area
The study site (sections 1 and 12, Tl5IN R58W, Nelsoncounty, ND) has an elevated hummocky surface surroundedby rolling ground-moraine and the following criteria: highwetland densities, wetlands in relatively homogeneous gla-cial materials, and surface-water with a wide salinity range.Surface elevations in the hummocky area range from 456 to474 m above sea level (mASL). Pierre Formation shales oc-cur at depths of 10 to 30 m. Overlying glacial deposits con-sist mainly of dead-ice facies of Coleharbor Formation tillthat include dolomitic material as well as high-S marineshales (Bluemle, 1973).
The study area has a subhumid, continental climate. Meanannual precipitation is 46 cm. Mean daily temperatures forJuly and January are 20 °C and —16 °C, respectively. Mostprecipitation falls spring through fall, and is heaviest in springand early summer. Winter snowfall is moderate, averaging
848
ARNDT & RICHARDSON: HYDRIC SOIL SALINITY IN A PRAIRIE-POTHOLE WETLAND SYSTEM 849
~ 476
200 400 600 800HORIZONTAL DISTANCE (m)
1000
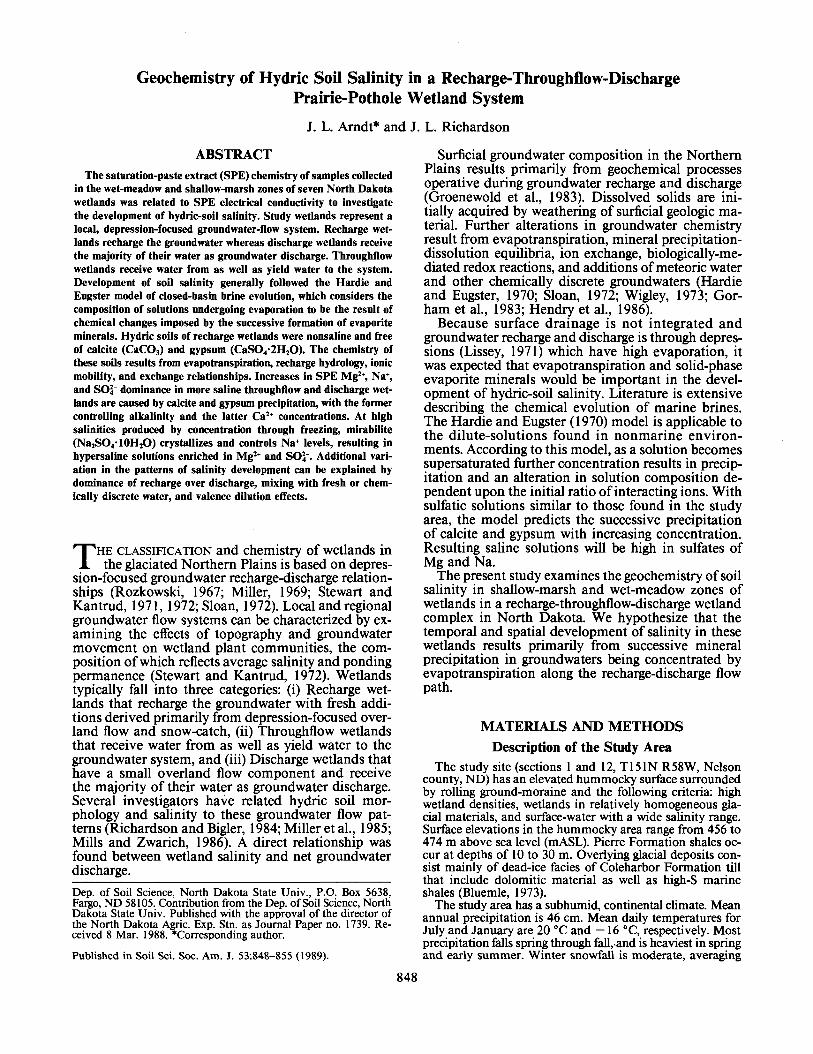
Fig. 1. Cross-section of the study area. Line segments at the top ofthe figure are in plan view in Fig. 3. Numbers indicate samplewetlands.
90 cm, and often drifts into sheltered and low areas, leavingpoorly vegetated ground free of snow (Doolittle et al., 1981).
Plant species composition, surface water conductance, andapproximate elevations of area wetlands were used as cri-teria to select seven wetlands to represent an integrated sys-tem of groundwater recharge, throughflow, and dischargeconditions consistent with the classification schemes of Lis-sey (1971), Sloan (1972), and Stewart and Kantrud (1971,1972). A cross-section of the study area showing these wet-lands and the approximate water table configuration at thetime of sampling is given in Fig. 1. Wetlands 2, 22, and 23represent seasonally ponded groundwater-recharge wetlandswhich have a negligible groundwater discharge componentto their water balance. Wetlands 1,19, and 18 are semiper-manently ponded throughflow wetlands which reflect the ef-fects of progressively greater groundwater discharge relativeto recharge. Wetland 20 is a permanently ponded dischargewetland which receives the majority of its water as ground-water discharge from the entire local area.
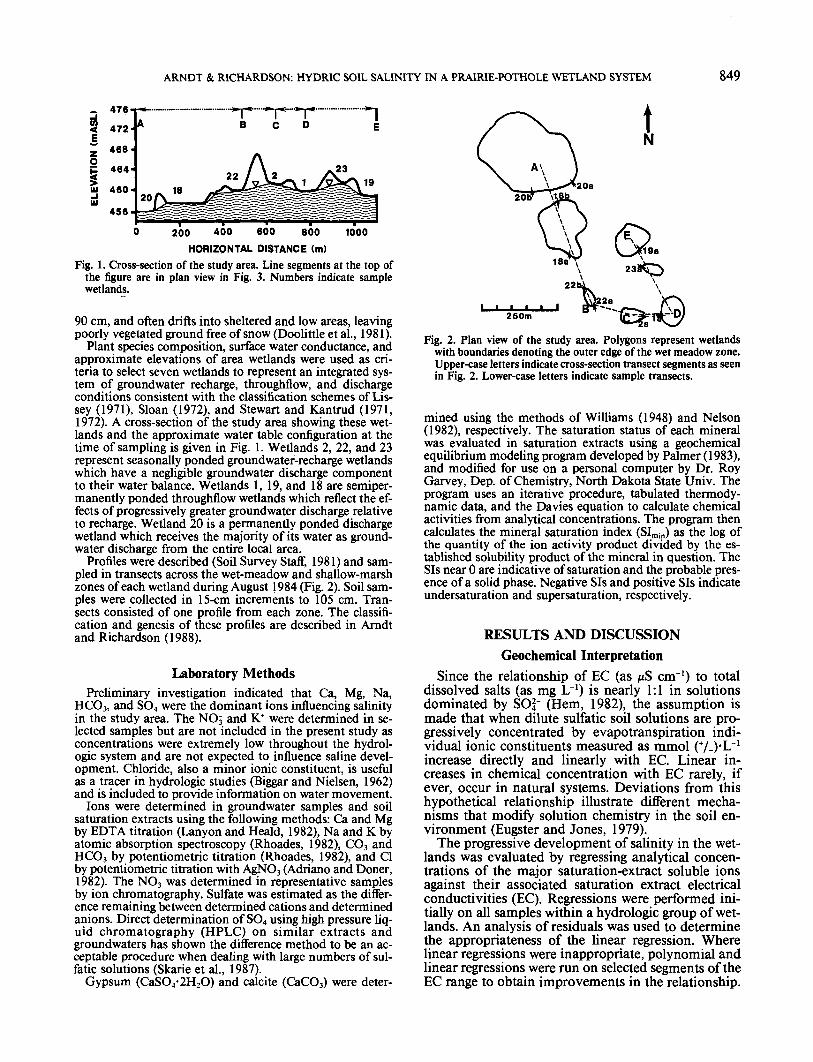
Profiles were described (Soil Survey Staff, 1981) and sam-pled in transects across the wet-meadow and shallow-marshzones of each wetland during August }984 (Fig. 2). Soil sam-ples were collected in 15-cm increments to 105 cm. Tran-sects consisted of one profile from each zone. The classifi-cation and genesis of these profiles are described in Arndtand Richardson (1988).
Laboratory MethodsPreliminary investigation indicated that Ca, Mg, Na,
HCO3, and SO4 were the dominant ions influencing salinityin the study area. The NO;; and K+ were determined in se-lected samples but are not included in the present study asconcentrations were extremely low throughout the hydrol-ogic system and are not expected to influence saline devel-opment. Chloride, also a minor ionic constituent, is usefulas a tracer in hydrologic studies (Biggar and Nielsen, 1962)and is included to provide information on water movement.
Ions were determined in groundwater samples and soilsaturation extracts using the following methods: Ca and Mgby EDTA titration (Lanyon and Heald, 1982), Na and K byatomic absorption spectroscopy (Rhoades, 1982), CO3 andHCO3 by potentiometric titration (Rhoades, 1982), and Clby potentiometric titration with AgNO3 (Adriano and Doner,1982). The NO3 was determined in representative samplesby ion chrpmatography. Sulfate was estimated as the differ-ence remaining between determined cations and determinedanions. Direct determination of SO4 using high pressure liq-uid chromatography (HPLC) on similar extracts andgroundwaters has shown the difference method to be an ac-ceptable procedure when dealing with large numbers of sul-fatic solutions (Skarie et al., 1987).
Gypsum (CaSO4-2H2O) and calcite (CaCO3) were deter-
250m
Fig. 2. Plan view of the study area. Polygons represent wetlandswith boundaries denoting the outer edge of the wet meadow zone.Upper-case letters indicate cross-section transect segments as seenin Fig. 2. Lower-case letters indicate sample transects.
mined using the methods of Williams (1948) and Nelson(1982), respectively. The saturation status of each mineralwas evaluated in saturation extracts using a geochemicalequilibrium modeling program developed by Palmer (1983),and modified for use on a personal computer by Dr. RoyGarvey, Dep. of Chemistry, North Dakota State Univ. Theprogram uses an iterative procedure, tabulated thermody-namic data, and the Davies equation to calculate chemicalactivities from analytical concentrations. The program thencalculates the mineral saturation index (SImin) as the log ofthe quantity of the ion activity product divided by the es-tablished solubility product of the mineral in question. TheSis near 0 are indicative of saturation and the probable pres-ence of a solid phase. Negative Sis and positive Sis indicateundersaturation and supersaturation, respectively.
RESULTS AND DISCUSSIONGeochemical Interpretation
Since the relationship of EC (as /xS cm"1) to totaldissolved salts (as mg L~') is nearly 1:1 in solutionsdominated by SO|~ (Hem, 1982), the assumption ismade that when dilute sulfatic soil solutions are pro-gressively concentrated by evapotranspiration indi-vidual ionic constituents measured as mmol (V-)'L"1
increase directly and linearly with EC. Linear in-creases in chemical concentration with EC rarely, ifever, occur in natural systems. Deviations from thishypothetical relationship illustrate different mecha-nisms that modify solution chemistry in the soil en-vironment (Eugster and Jones, 1979).
The progressive development of salinity in the wet-lands was evaluated by regressing analytical concen-trations of the major saturation-extract soluble ionsagainst their associated saturation extract electricalconductivities (EC). Regressions were performed ini-tially on all samples within a hydrologic group of wet-lands. An analysis of residuals was used to determinethe appropriateness of the linear regression. Wherelinear regressions were inappropriate, polynomial andlinear regressions were run on selected segments of theEC range to obtain improvements in the relationship.
850 SOIL SCI. SOC. AM. J., VOL. 53, MAY-JUNE 1989
Development and Geochemistry of Salinity in HydricSoils Recharge Conditions
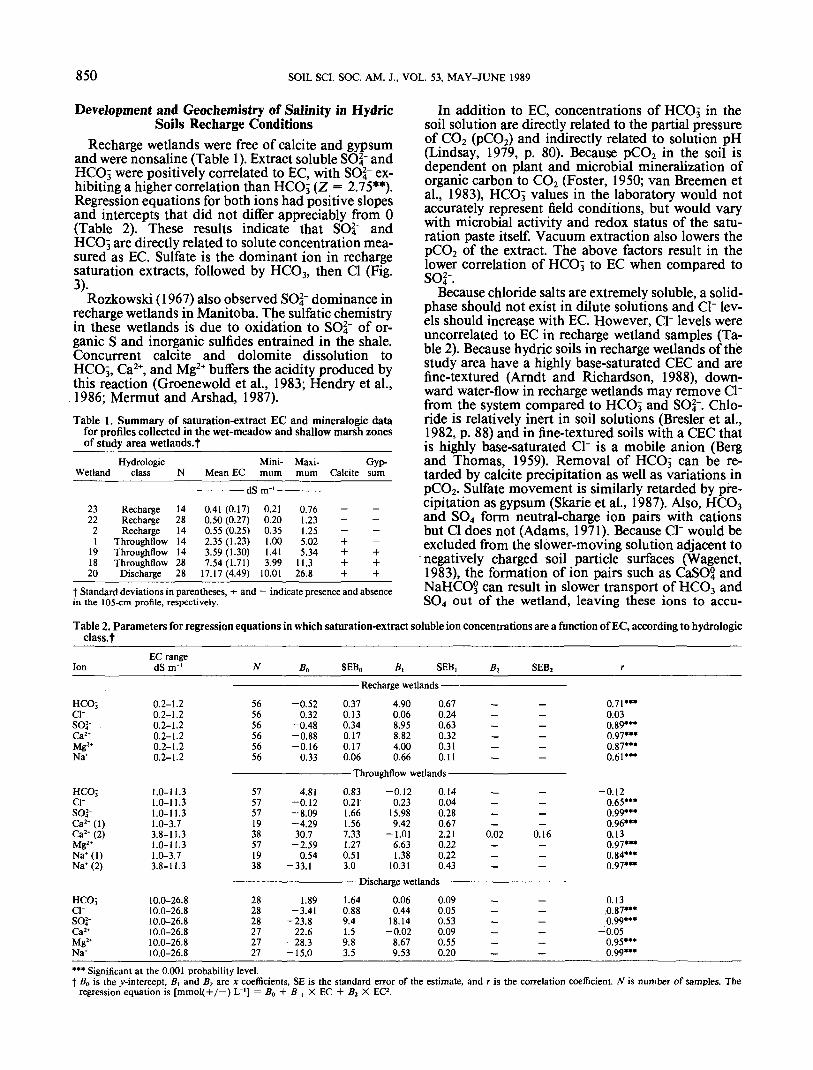
Recharge wetlands were free of calcite and gypsumand were nonsaline (Table 1). Extract soluble SO2," andHCO^ were positively correlated to EC, with SO2,' ex-hibiting a higher correlation than HCO3 (Z = 2.75**).Regression equations for both ions had positive slopesand intercepts that did not differ appreciably from 0(Table 2). These results indicate that SO?," andHCC«5 are directly related to solute concentration mea-sured as EC. Sulfate is the dominant ion in rechargesaturation extracts, followed by HCO3, then Cl (Fig.3).
Rozkowski (1967) also observed SOI' dominance inrecharge wetlands in Manitoba. The sulfatic chemistryin these wetlands is due to oxidation to 804" of or-ganic S and inorganic sulfides entrained in the shale.Concurrent calcite and dolomite dissolution toHCO^, Ca2+, and Mg2+ buffers the acidity produced bythis reaction (Groenewold et al., 1983; Hendry et al,1986; Mermut and Arshad, 1987).Table 1. Summary of saturation-extract EC and mineralogic data
for profiles collected in the wet-meadow and shallow marsh zonesof study area wetlands, f
WetlandHydrologic
class N Mean ECMini-mum
Maxi-mum
Gyp-Calcite sum
JO —— -1
232221
191820
RechargeRechargeRecharge
ThroughflowThroughflowThroughflow
Discharge
14281414142828
0.41 (0.17) 0.210.50 (0.27)0.55 (0.25)2.35 (1.23)3.59 (1.30)7.54(1.71)
17.17(4.49)
0.200.351.001.413.99
10.01
0.761.231.255.025.34
11.326.8
_— —— —+ —+ ++ ++ +
t Standard deviations in parentheses, + and — indicate presence and absencein the 105-cm profile, respectively.
In addition to EC, concentrations of HCOj in thesoil solution are directly related to the partial pressureof CO2 (pCO2) and indirectly related to solution pH(Lindsay, 1979, p. 80). Because pCO2 in the soil isdependent on plant and microbial mineralization oforganic carbon to CO2 (Foster, 1950; van Breemen etal., 1983), HCOj values in the laboratory would notaccurately represent field conditions, but would varywith microbial activity and redox status of the satu-ration paste itself. Vacuum extraction also lowers thepCO2 of the extract. The above factors result in thelower correlation of HCO3 to EC when compared toSO2:.
Because chloride salts are extremely soluble, a solid-phase should not exist in dilute solutions and Cl" lev-els should increase with EC. However, Cl" levels wereuncorrelated to EC in recharge wetland samples (Ta-ble 2). Because hydric soils in recharge wetlands of thestudy area have a highly base-saturated CEC and arefine-textured (Arndt and Richardson, 1988), down-ward water-flow in recharge wetlands may remove Cl"from the system compared to HCOj and SO2.". Chlo-ride is relatively inert in soil solutions (Bresler et al.,1982, p. 88) and in fine-textured soils with a CEC thatis highly base-saturated Cl" is a mobile anion (Bergand Thomas, 1959). Removal of HCO3 can be re-tarded by calcite precipitation as well as variations inpCO2. Sulfate movement is similarly retarded by pre-cipitation as gypsum (Skarie et al., 1987). Also, HCO3and SO4 form neutral-charge ion pairs with cationsbut Cl does not (Adams, 1971). Because Cl" would beexcluded from the slower-moving solution adjacent tonegatively charged soil particle surfaces (Wagenet,1983), the formation of ion pairs such as CaSO° andNaHCO§ can result in slower transport of HCO3 andSO4 out of the wetland, leaving these ions to accu-
Table 2. Parameters for regression equations in which saturation-extract soluble ion concentrations are a function of EC, according to hydrologicclass, t
IonEC range
N SEB0 SEB, SEB2
HCO-,ci-SO2-Ca2*Mg2*Na*
HCO;ci-SOj-Ca2*(l)Ca2* (2)Mg2*Na*(l)Na* (2)
0.2-1.20.2-1.20.2-1.20.2-1.20.2-1.20.2-1.2
1.0-11.31.0-11.31.0-11.31.0-3.73.8-11.31.0-11.31.0-3.73.8-11.3
565656565656
5757571938571938
-0.520.32
-0.48-0.88-0.16
0.33
4.81-0.12-8.09-4.2930.7
-2.590.54
-33.1
————— ixct
0.370.130.340.170.170.06
—— Thro
0.830.21-1.661.567.331.270.513.0
nu
LHOlgC WCLlaj
4.900.068.958.824.000.66
ughflow wet
-0.120.23
15.989.42
-1.016.631.38
10.31pharo** wptla
iiUa ———————————————
0.670.240.630.320.310.11
lands —————————
0.140.040.280.672.21 0.020.220.220.43
nHc ————————————————
____
-
_
—__
0.16__—
0.71***0.030.89***0.97***0.87***0.61***
-0.120.65***0.99***0.96***0.130.97***0.84***0.97***
HC03ci-so2-Ca2*Mg2*Na*
10.0-26.810.0-26.810.0-26.810.0-26.810.0-26.810.0-26.8
282828272727
1.89-3.41
-23.822.6
-28.3-15.0
1.640.889.41.59.83.5
0.060.44
18.14-0.02
8.679.53
0.090.05 - -0.530.09 - -0.550.20
0.13,0.87"*0.99***
-0.050.95***0.99***
*** Significant at the 0.001 probability level.t B0 is the ^-intercept, B, and B2 are x coefficients, SE is the standard error of the estimate, and r is the correlation coefficient. N is number of samples. The
regression equation is [mmol(+/-) L~'] = B0 + B , X EC + B2 X EC2.
ARNDT & RICHARDSON: HYDRIC SOIL SALINITY IN A PRAIRIE-POTHOLE WETLAND SYSTEM 851
mulate during the drawdown cycle. We believe therelatively constant Cl" values (Fig. 3) are the amountreleased by plant decomposition and weathering of theshale component of the alluvium delivered to the pondby erosion of the surrounding till upland.
Calcium was consistently the dominant cation inrecharge soil extracts, followed by Mg, then Na (Fig.3). All were positively correlated to solute concentra-tion measured as EC (Table 2).
The major source for Na+ is exchange for Ca2+ andMg2+ on highly Na-saturated smectites contained inthe shale component of the till (Groenewold et al.,1983; Hendry et al., 1986). The sequence for retentionof these cations on the soil exchange complex is Ca> Mg > Na (Chapelle and Knoble, 1983). Thus Na+
should be removed from the recharge system viadownward saturated flow and not accumulate in thesurficial hydric soil. Conversely, the exchange com-plex retains Ca2+ and Mg2+, retarding their transportout of the wetland. Because Ca2+ and Mg2+ are alsosignificant constituents of plant dry matter, recyclingvia plant uptake and release through decompositionalso retains these elements in the soil (White, 1971).
Throughflow ConditionsThroughflow wetlands represent a continuum be-
tween recharge and discharge dominance. Shallow-marsh and wet-meadow soils of these wetlands alwayscontained identifiable calcite in the profile, and usu-ally contained gypsum (Table 1).
Consistent calcite saturation begins at an EC of 1.0dS rrr1 (Fig. 4), near the upper and lower EC limitsfor recharge and thrpughflow conditions, respectively.Calcite supersaturation is the rule in extracts with ECsgreater than 1.0 dS nr1. Calcite supersaturation of upto one order of magnitude (SI < 1.0) appears to benormal in soil waters and extracts (Suarez, 1977, 1982;Inskeep and Bloom 1986).
Because Ca2+ is present in greater quantities thanHCO^ (Fig. 5) and calcite is stable throughout thethroughflow EC range, calcite precipitation should fixalkalinity levels at a maximum (Hardie and Eugster,1970). Consistent with this model, extract soluble al-kalinity (as HCO^) is relatively constant and uncor-related to EC in throughflow extracts (Table 2).
The rate of accumulation of SO2." increases abovethe inflection point of 1.0 dS nr1 created by calcitesaturation, compensating for the removal of HCOielectrolyte inputs. In calcite-saturated samples, the rateat which SO2.' increases with EC is linear and constant,indicating that SO2" is not under a solid-phase control(Table 2; Fig. 5).
Chloride concentrations are quite low relative toSO2.". In the EC range of 1 to 4 dS nr1, Cl; values areessentially uncorrelated to EC. Above this EC rangeCl" values are positively correlated; however they ex-hibit a wide variance (Fig. 5). In the less salinethroughflow wetlands and in profiles whose upper por-tions are dominated by leaching, Cl" would be re-moved by mechanisms similar to those active underrecharge conditions. At some point in the recharge-discharge continuum, chloride will begin to accumu-late. It appears that this point is reached in wetland18 where saturation-extract ECs are consistently above
4 dS nr1. The wide variance in Cl" values above thisEC are probably due to temporal variations in down-ward and upward saturated and unsaturated flow re-gimes within the profiles. Also, shale entrained in tillis the most likely source of Cl" (Maianu, 1987). Be-cause discharge-dominant wetlands are typically em-placed in shallower tills closer to the Pierre contact,local variations in the amount of shale entrained inthis till may account for some of the observed varia-tion.
15'
10
0.5 1.0EC (dS m~1)
1.5
HCQ,
0.5 1.0
EC (dS m~1)
11,0
5.5
A CaO MgV Na
Na
0.5 1.0 1.5
EC (dS m~1)
Fig. 3. Concentration of the major saturation extract soluble ionsas a function of electrical conductivity for samples collected inrecharge wetlands.
852 SOIL SCI. SOC. AM. J., VOL. 53, MAY-JUNE 1989
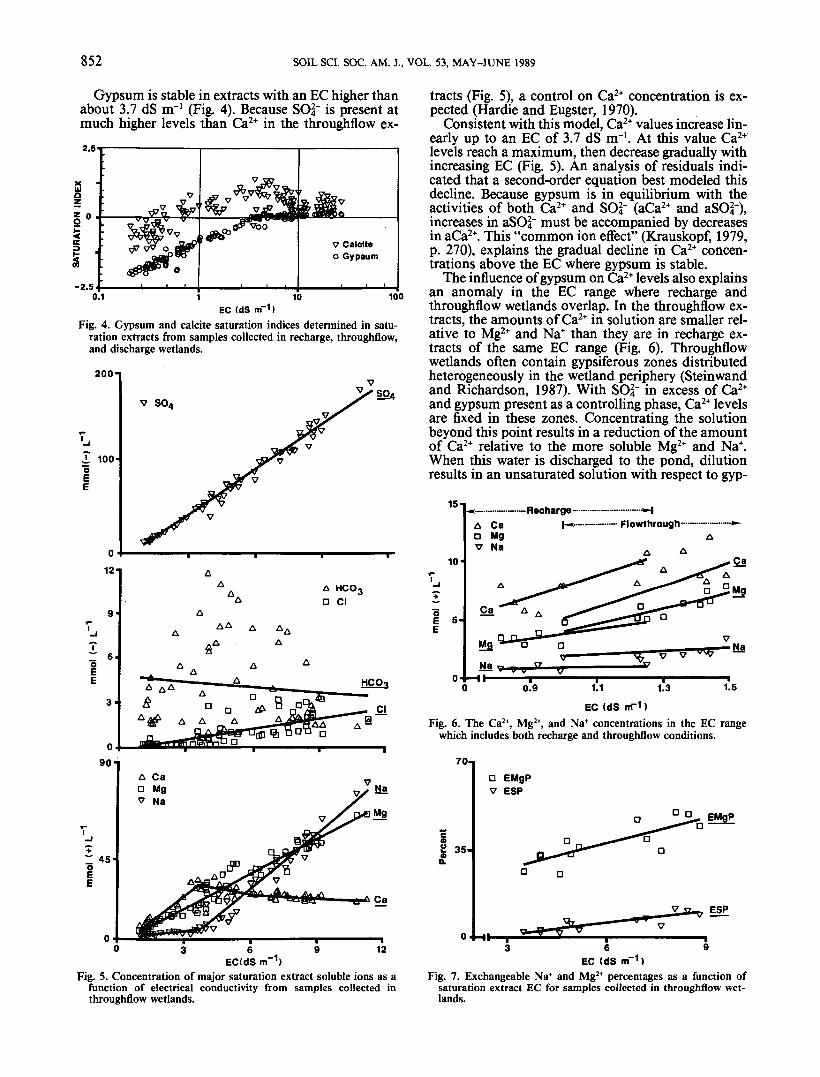
Gypsum is stable in extracts with an EC higher thanabout 3.7 dS nr1 (Fig. 4). Because SO^ is present atmuch higher levels than Ca2+ in the throughflow ex-
10 100EC (dS m~1)
Fig. 4. Gypsum and calcite saturation indices determined in satu-ration extracts from samples collected in recharge, throughflow,and discharge wetlands.
200
Fig. 5. Concentration of major saturation extract soluble ions as afunction of electrical conductivity from samples collected inthroughflow wetlands.
tracts (Fig. 5), a control on Ca2* concentration is ex-pected (Hardie and Eugster, 1970).
Consistent with this model, Ca2+ values increase lin-early up to an EC of 3.7 dS nr1. At this value Ca2+
levels reach a maximum, then decrease gradually withincreasing EC (Fig. 5). An analysis of residuals indi-cated that a second-order equation best modeled thisdecline. Because gypsum is in equilibrium with theactivities of both Ca2+ and SO2,- (aCa2+ and aSO2.'),increases in aSO2." must be accompanied by decreasesin aCa2+. This "common ion effect" (Krauskopf, 1979,p. 270), explains the gradual decline in Ca2+ concen-trations above the EC where gypsum is stable.
The influence of gypsum on Ca2+ levels also explainsan anomaly in the EC range where recharge andthroughflow wetlands overlap. In the throughflow ex-tracts, the amounts of Ca2+ in solution are smaller rel-ative to Mg2+ and Na+ than they are in recharge ex-tracts of the same EC range (Fig. 6). Throughflowwetlands often contain gypsiferous zones distributedheterogeneously in the wetland periphery (Steinwandand Richardson, 1987). With SO2." in excess of Ca2+
and gypsum present as a controlling phase, Ca2+ levelsare fixed in these zones. Concentrating the solutionbeyond this point results in a reduction of the amountof Ca2+ relative to the more soluble Mg2+ and Na*.When this water is discharged to the pond, dilutionresults in an unsaturated solution with respect to gyp-
0.9 1.1 1.3
EC (dS nf-1)Fig. 6. The Ca2*, Mg2*, and Na+ concentrations in the EC range
which includes both recharge and throughflow conditions.
70.
Ig 35.
O EMgPV ESP
a a .EMgP
ESP
HI-6 9
EC (dS nT1)Fig. 7. Exchangeable Na* and Mg2+ percentages as a function of
saturation extract EC for samples collected in throughflow wet-lands.
ARNDT & RICHARDSON: HYDRIC SOIL SALINITY IN A PRAIRIE-POTHOLE WETLAND SYSTEM 853
sum. However, the relative cationic chemistry pro-duced in the gypsiferous zone will be retained, result-ing in higher relative amounts of Mg2+ and Na+. Whenthe diluted pondwater floods zones where gypsum isabsent, the saturation extract chemistry of these zoneswill reflect the antecedent chemistry of the discharginggroundwater, resulting in the observed decreases inCa2+ relative to Mg2+ and Na+.
The rate of Na+ accumulation increases dramati-cally above 3.7 dS nr1 (Fig. 5), apparently compen-sating for the removal of Ca2+ electrolyte inputs. Oncethis inflection point is reached, the rate at which Na+
increases with EC remains linear and constant, indi-cating that it is accumulating in throughflow soils un-controlled by a solid phase.
The Mg2+ increases throughout the throughflow ECcontinuum at a relatively constant rate, indicating thatits concentration is likewise uncontrolled by equilib-rium with a solid phase. The rate does not increaseupon precipitation of gypsum, however. Comparingthe B[ values for each, it is apparent that Na+ accu-mulates faster than Mg2+ in the EC range of 3.8 to 11.3
soo
' 250
10
- 5o
E
250
125
V SO,
A HCO,D Cl
CP
04-1 Hi-
Ca
IK-i—10 2816 22
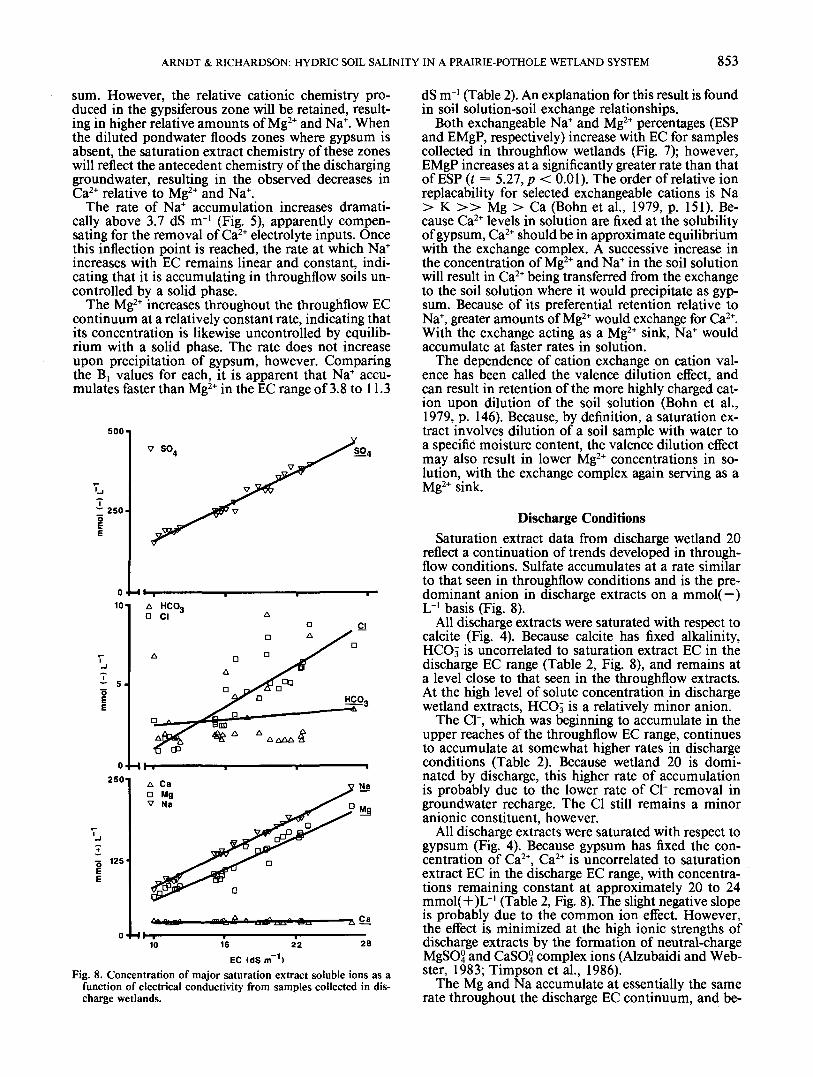
EC (dS m~1)Fig. 8. Concentration of major saturation extract soluble ions as a
function of electrical conductivity from samples collected in dis-charge wetlands.
dS nr' (Table 2). An explanation for this result is foundin soil solution-soil exchange relationships.
Both exchangeable Na+ and Mg2+ percentages (ESPand EMgP, respectively) increase with EC for samplescollected in throughflow wetlands (Fig. 7); however,EMgP increases at a significantly greater rate than thatof ESP (( = 5.27, p < 0.01). The order of relative ionreplacability for selected exchangeable cations is Na> K » Mg > Ca (Bonn et al., 1979, p. 151). Be-cause Ca2+ levels in solution are fixed at the solubilityof gypsum, Ca2+ should be in approximate equilibriumwith the exchange complex. A successive increase inthe concentration of Mg2+ and Na+ in the soil solutionwill result in Ca2+ being transferred from the exchangeto the soil solution where it would precipitate as gyp-sum. Because of its preferential retention relative toNa+, greater amounts of Mg2+ would exchange for Ca2+.With the exchange acting as a Mg2+ sink, Na+ wouldaccumulate at faster rates in solution.
The dependence of cation exchange on cation val-ence has been called the valence dilution effect, andcan result in retention of the more highly charged cat-ion upon dilution of the soil solution (Bohn et al.,1979, p. 146). Because, by definition, a saturation ex-tract involves dilution of a soil sample with water toa specific moisture content, the valence dilution effectmay also result in lower Mg2+ concentrations in so-lution, with the exchange complex again serving as aMg2+ sink.
Discharge ConditionsSaturation extract data from discharge wetland 20
reflect a continuation of trends developed in through-flow conditions. Sulfate accumulates at a rate similarto that seen in throughflow conditions and is the pre-dominant anion in discharge extracts on a mmol(—)L-' basis (Fig. 8).
All discharge extracts were saturated with respect tocalcite (Fig. 4). Because calcite has fixed alkalinity,HCOj is uncorrelated to saturation extract EC in thedischarge EC range (Table 2, Fig. 8), and remains ata level close to that seen in the throughflow extracts.At the high level of solute concentration in dischargewetland extracts, HCOs is a relatively minor anion.
The Cl", which was beginning to accumulate in theupper reaches of the throughflow EC range, continuesto accumulate at somewhat higher rates in dischargeconditions (Table 2). Because wetland 20 is domi-nated by discharge, this higher rate of accumulationis probably due to the lower rate of Cl~ removal ingroundwater recharge. The Cl still remains a minoranionic constituent, however.
All discharge extracts were saturated with respect togypsum (Fig. 4). Because gypsum has fixed the con-centration of Ca2+, Ca2+ is uncorrelated to saturationextract EC in the discharge EC range, with concentra-tions remaining constant at approximately 20 to 24mmol(+)L-' (Table 2, Fig. 8). The slight negative slopeis probably due to the common ion effect. However,the effect is minimized at the high ionic strengths ofdischarge extracts by the formation of neutral-chargeMgSOS and CaSO° complex ions (Alzubaidi and Web-ster, 1983; Timpson et al., 1986).
The Mg and Na accumulate at essentially the samerate throughout the discharge EC continuum, and be-
854 SOIL SCI. SOC. AM. J., VOL. 53, MAY-JUNE 1989
Wetland type Dominant SPE Chemistry Typical soil profile
Dilute Recharge
Flowthrcugh
Discharge
Freezingconditions
Ca > Mg»NaHC03=S04»CI
1
|ca>Mg>Na
SO4>HCO3»CI
<
bMg = Na>Ca,»HCO3>CI
i
Mg>Na»CaSO4»CI>HCO3
t
Calcite precipitates2MCa>AlkallnltyAlkalinity fixed ,.
TT
Gypsum precipitatesMS04>MCaaCa fixed
*Mirabilite precipitates2MS04>MNaaNa fixed
^n*;
'%%,.. ;.•-:•
i;i;;;
Tii"
M#
il'<jf: '•*•'?
A
BtBw
A
Bk
Cky
A
Cky(z)
Saline
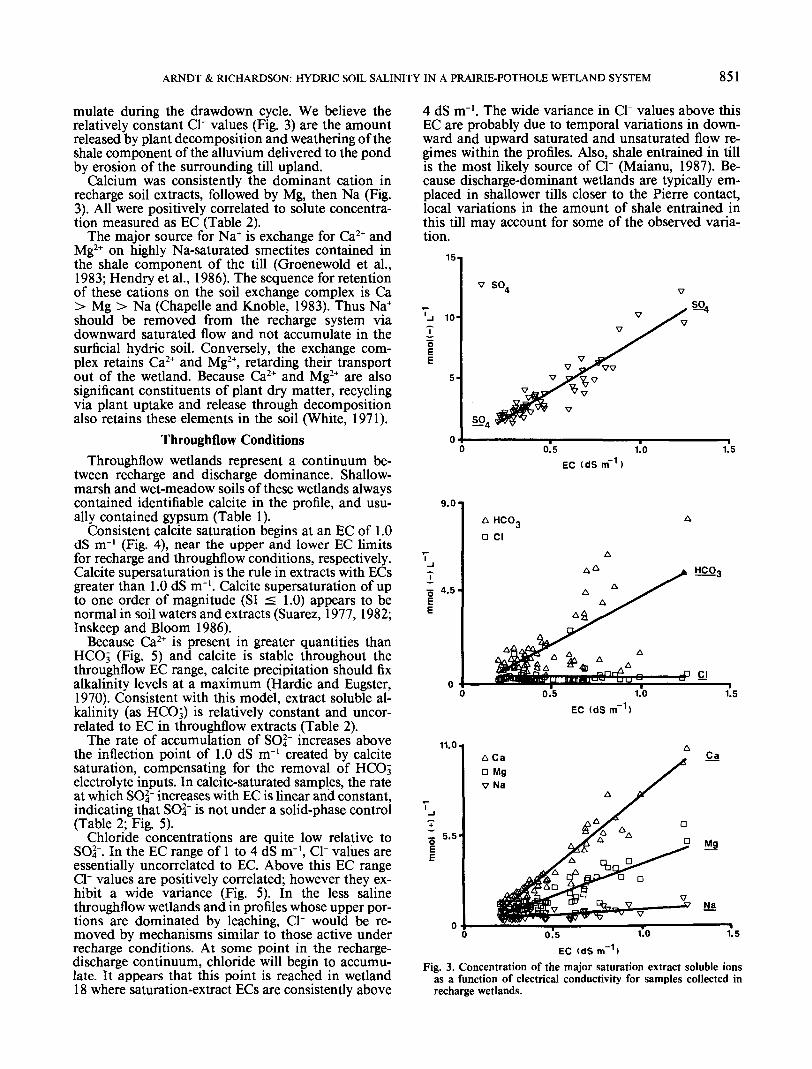
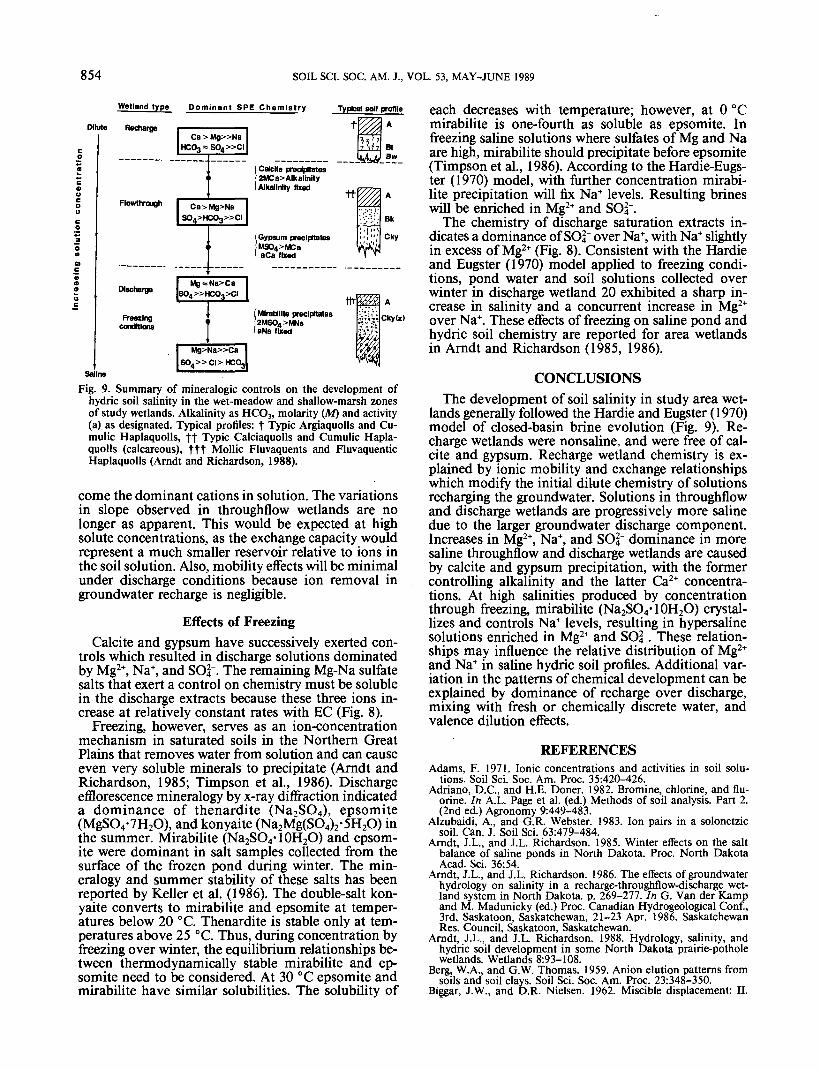
Fig. 9. Summary of mineralogic controls on the development ofhydric soil salinity in the wet-meadow and shallow-marsh zonesof study wetlands. Alkalinity as HCO3, molarity (M) and activity(a) as designated. Typical profiles: t Typic Argiaquolls and Cu-mulic Haplaquolls, tt Typic Calciaquolls and Cumulic Hapla-quolls (calcareous), ttt Mollic Fluvaquents and FluvaquenticHaplaquolls (Arndt and Richardson, 1988).
come the dominant cations in solution. The variationsin slope observed in throughflow wetlands are nolonger as apparent. This would be expected at highsolute concentrations, as the exchange capacity wouldrepresent a much smaller reservoir relative to ions inthe soil solution. Also, mobility effects will be minimalunder discharge conditions because ion removal ingroundwater recharge is negligible.
Effects of FreezingCalcite and gypsum have successively exerted con-
trols which resulted in discharge solutions dominatedby Mg2+, Na+, and SO2^. The remaining Mg-Na sulfatesalts that exert a control on chemistry must be solublein the discharge extracts because these three ions in-crease at relatively constant rates with EC (Fig. 8).
Freezing, however, serves as an ion-concentrationmechanism in saturated soils in the Northern GreatPlains that removes water from solution and can causeeven very soluble minerals to precipitate (Arndt andRichardson, 1985; Timpson et al., 1986). Dischargeefflorescence mineralogy by x-ray diffraction indicateda dominance of thenardite (Na2SO4), epsomite(MgSO4-7H2O), and konyaite (Na2Mg(SO4)2-5H2O) inthe summer. Mirabilite (Na2SO4-10H2O) and epsom-ite were dominant in salt samples collected from thesurface of the frozen pond during winter. The min-eralogy and summer stability of these salts has beenreported by Keller et al. (1986). The double-salt kon-yaite converts to mirabilite and epsomite at temper-atures below 20 °C. Thenardite is stable only at tem-peratures above 25 °C. Thus, during concentration byfreezing over winter, the equilibrium relationships be-tween thermodynamically stable mirabilite and ep-somite need to be considered. At 30 °C epsomite andmirabilite have similar solubilities. The solubility of
each decreases with temperature; however, at 0 °Cmirabilite is one-fourth as soluble as epsomite. Infreezing saline solutions where sulfates of Mg and Naare high, mirabilite should precipitate before epsomite(Timpson et al., 1986). According to the Hardie-Eugs-ter (1970) model, with further concentration mirabi-lite precipitation will fix Na+ levels. Resulting brineswill be enriched in Mg2+ and SO4".
The chemistry of discharge saturation extracts in-dicates a dominance of SO3" over Na+, with Na+ slightlyin excess of Mg2+ (Fig. 8). Consistent with the Hardieand Eugster (1970) model applied to freezing condi-tions, pond water and soil solutions collected overwinter in discharge wetland 20 exhibited a sharp in-crease in salinity and a concurrent increase in Mg2+
over Na+. These effects of freezing on saline pond andhydric soil chemistry are reported for area wetlandsin Arndt and Richardson (1985, 1986).
CONCLUSIONSThe development of soil salinity in study area wet-
lands generally followed the Hardie and Eugster (1970)model of closed-basin brine evolution (Fig. 9). Re-charge wetlands were nonsaline, and were free of cal-cite and gypsum. Recharge wetland chemistry is ex-plained by ionic mobility and exchange relationshipswhich modify the initial dilute chemistry of solutionsrecharging the groundwater. Solutions in throughflowand discharge wetlands are progressively more salinedue to the larger groundwater discharge component.Increases in Mg2+, Na+, and SO2,' dominance in moresaline throughflow and discharge wetlands are causedby calcite and gypsum precipitation, with the formercontrolling alkalinity and the latter Ca2+ concentra-tions. At high salinities produced by concentrationthrough freezing, mirabilite (Na2SCylOH2O) crystal-lizes and controls Na+ levels, resulting in hypersalinesolutions enriched in Mg2+ and SO4~. These relation-ships may influence the relative distribution of Mg2+
and Na+ in saline hydric soil profiles. Additional var-iation in the patterns of chemical development can beexplained by dominance of recharge over discharge,mixing with fresh or chemically discrete water, andvalence dilution effects.
ARNDT & RICHARDSON: HYDRIC SOIL SALINITY IN A PRAIRIE-POTHOLE WETLAND SYSTEM 855