Embed Size (px)
Citation preview
8/12/2019 Geo Lecture 7
http://slidepdf.com/reader/full/geo-lecture-7 1/37
CIVE 2004
Lecture 7 –
Shear Strength of Soils
8/12/2019 Geo Lecture 7
http://slidepdf.com/reader/full/geo-lecture-7 2/37
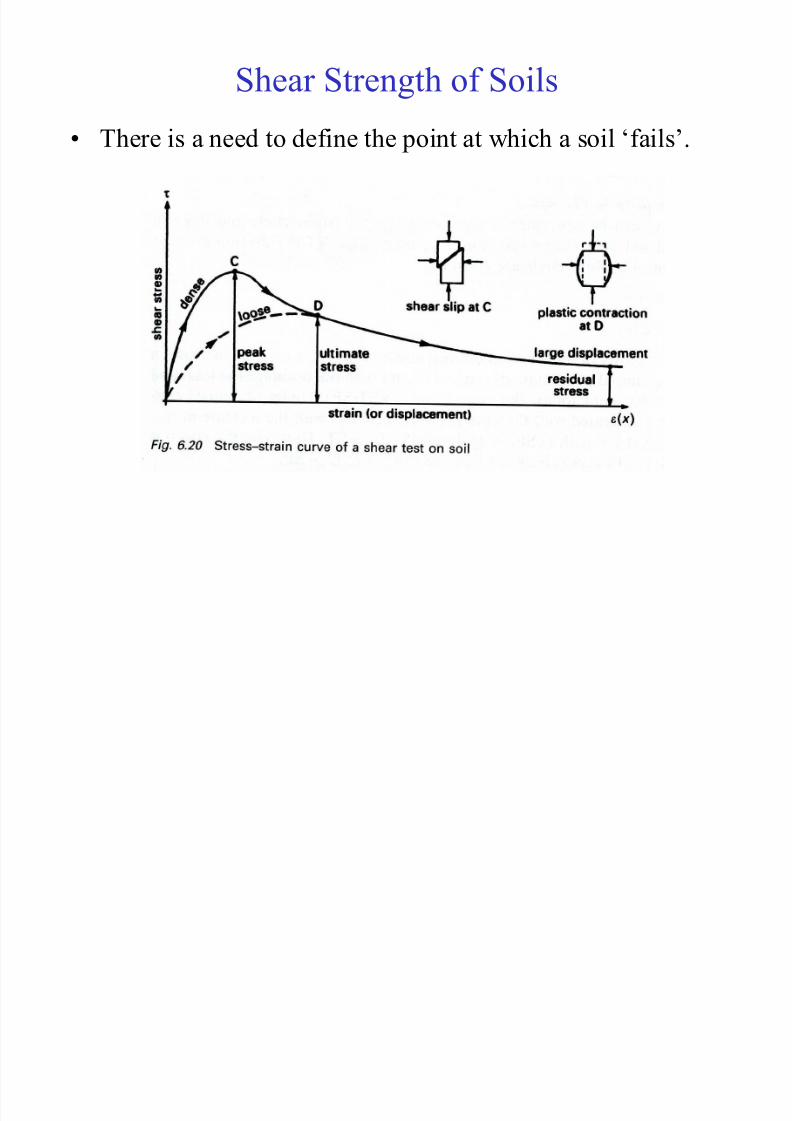
Shear Strength of Soils
• There is a need to define the point at which a soil ‘fails’.

8/12/2019 Geo Lecture 7
http://slidepdf.com/reader/full/geo-lecture-7 3/37
Shear Strength of Soils
• There is a need to define the point at which a soil ‘fails’. – Peak shear strength
– Ultimate shear strength
– Critical shear strength (may be taken as equal to
ultimate shear strength). After critical strength isattained, the volume of the soil remains constant as
shearing continues. The soil is in a critical state.
– Residual shear strength. It is the lowest strength which
is reached after very large displacements. For sands, theresidual strength is the same as the critical state
strength. For clays, the residual strength is about ½ the
critical state strength.
8/12/2019 Geo Lecture 7
http://slidepdf.com/reader/full/geo-lecture-7 4/37
Shear Strength Tests
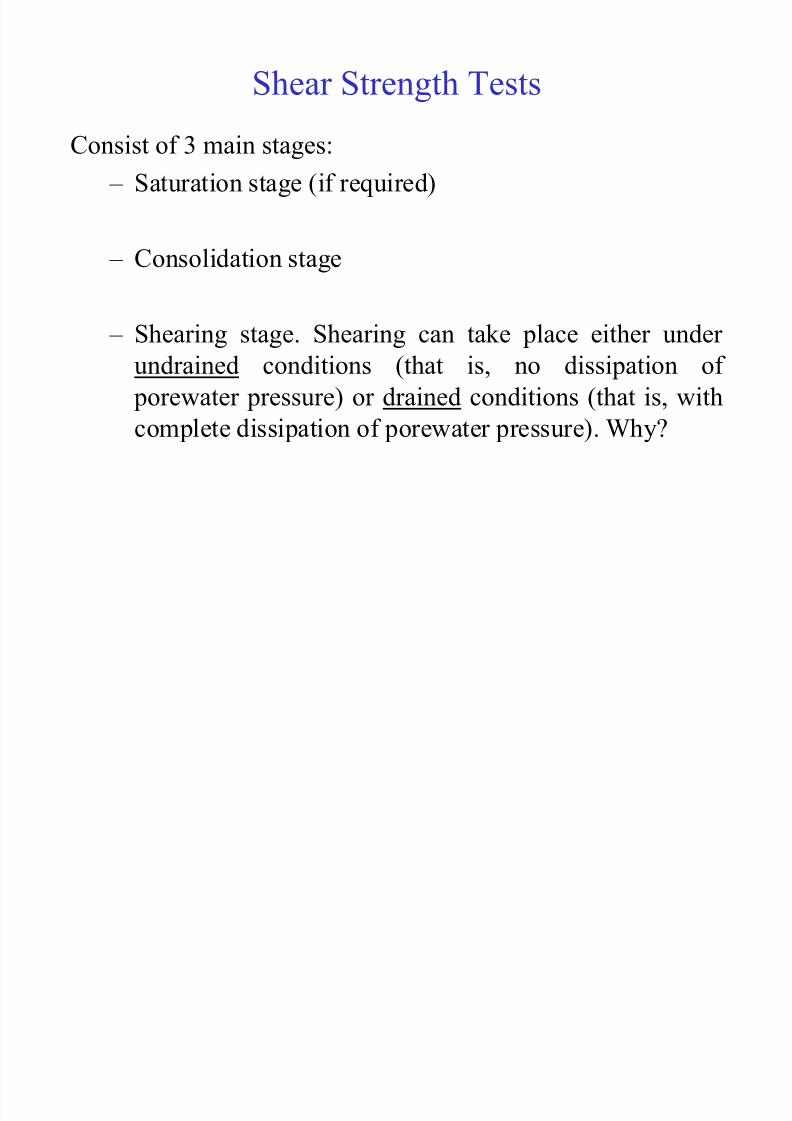
Consist of 3 main stages:
– Saturation stage (if required)
– Consolidation stage
– Shearing stage. Shearing can take place either under
undrained conditions (that is, no dissipation of
porewater pressure) or drained conditions (that is, with
complete dissipation of porewater pressure). Why?
8/12/2019 Geo Lecture 7
http://slidepdf.com/reader/full/geo-lecture-7 5/37
Shear Strength Tests
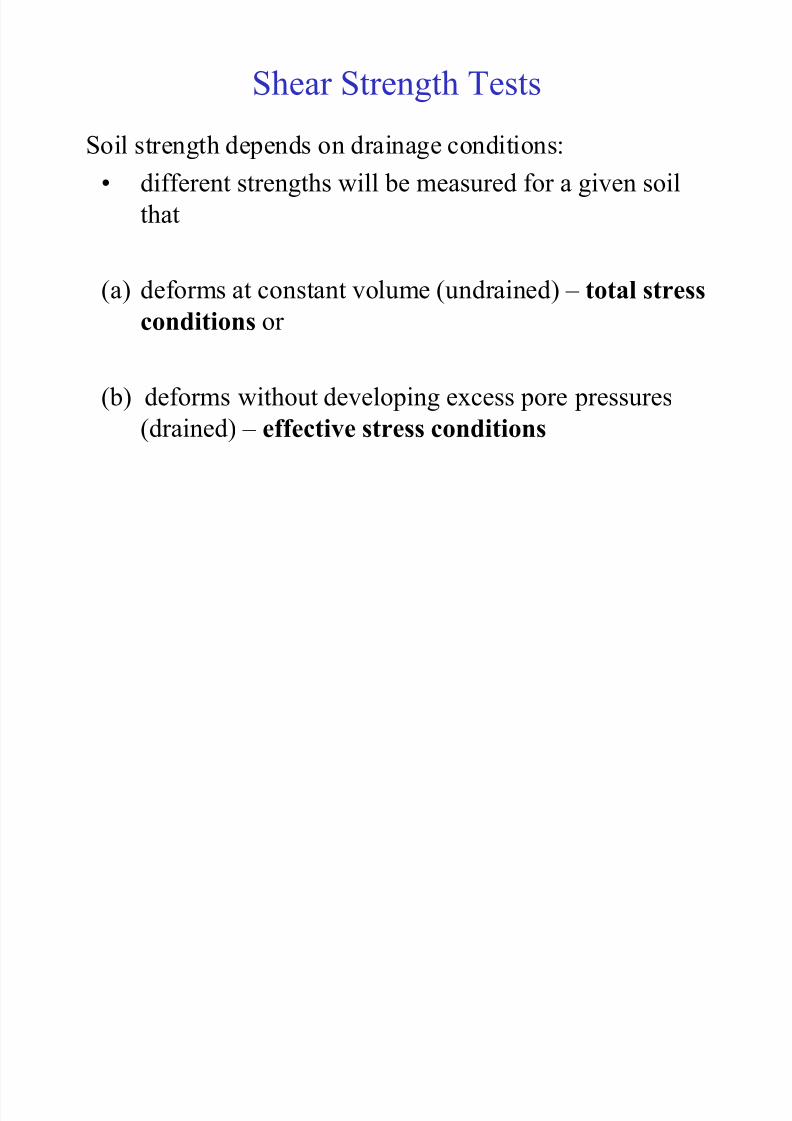
Soil strength depends on drainage conditions:
• different strengths will be measured for a given soil
that
(a) deforms at constant volume (undrained) – total stress
conditions or
(b) deforms without developing excess pore pressures
(drained) – effective stress conditions
8/12/2019 Geo Lecture 7
http://slidepdf.com/reader/full/geo-lecture-7 6/37
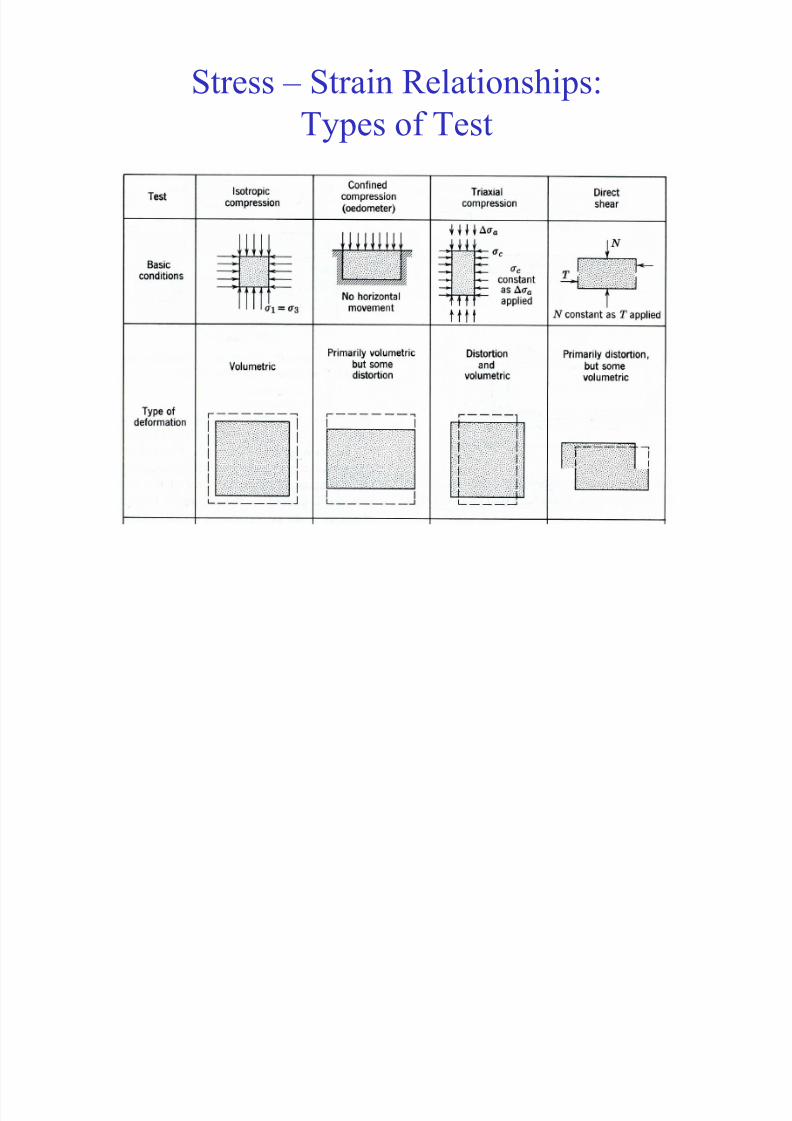
Stress – Strain Relationships:
Types of Test

8/12/2019 Geo Lecture 7
http://slidepdf.com/reader/full/geo-lecture-7 7/37
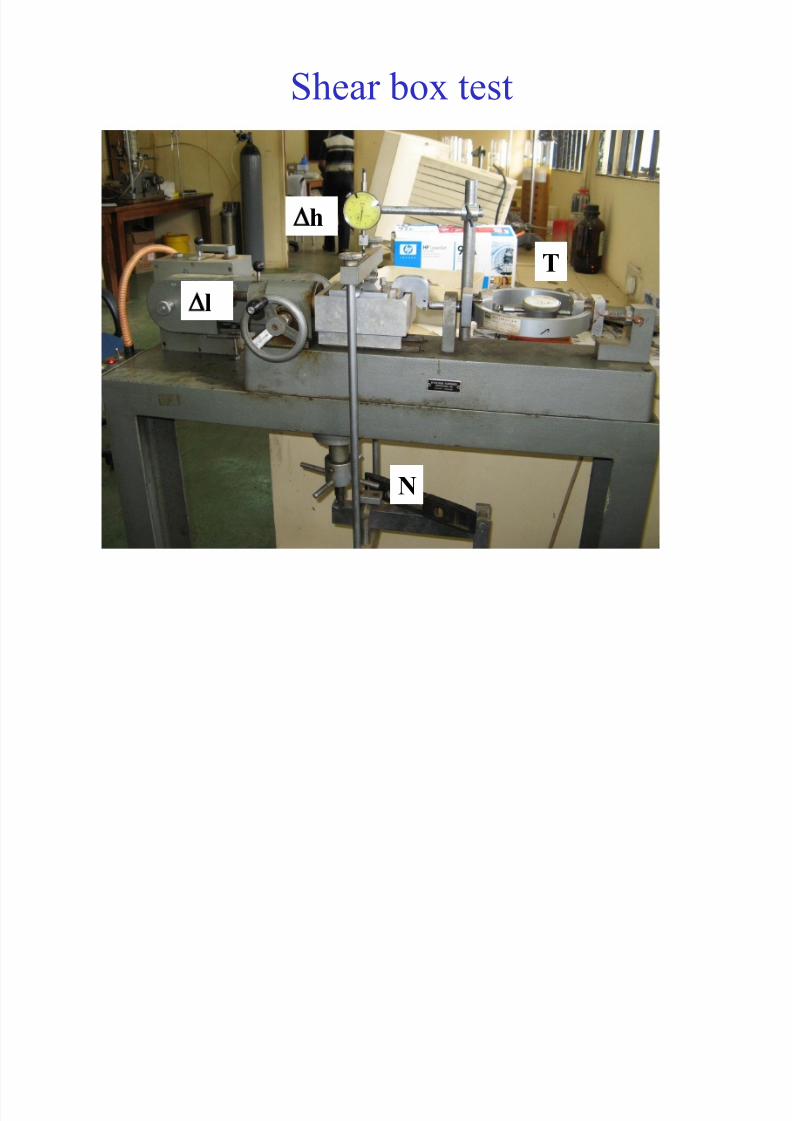
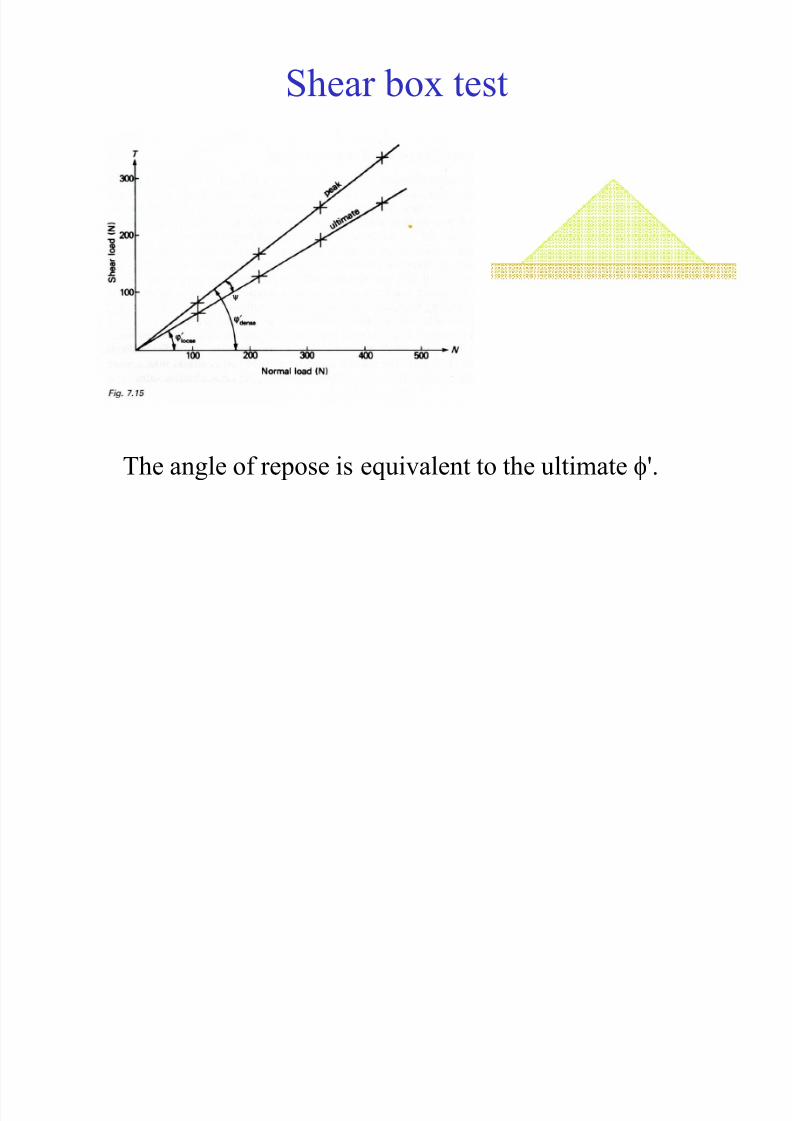
Shear box test
Source: Craig (1992)
Main features:
• Known normal force is applied.
• Shear force T is measured as shear displacement
(Dl) is applied.
• Vertical displacement (Dh) is measured.
8/12/2019 Geo Lecture 7
http://slidepdf.com/reader/full/geo-lecture-7 8/37
Shear box test
N
T
Dh
Dl
8/12/2019 Geo Lecture 7
http://slidepdf.com/reader/full/geo-lecture-7 9/37
Shear box test
Limitations:
• Cannot control drainage or measure porewater pressure.
• Quick test gives undrained (total stress)
measurements.
• Slow test ensuring complete porewater pressure
dissipation gives drained (effective stress)
measurements.
• Soil is forced to shear on a predetermined plane which is
not necessarily the weakest one.
• The stresses over the shear plane is non-uniform. Stress is
higher at the edges than at the centre.
8/12/2019 Geo Lecture 7
http://slidepdf.com/reader/full/geo-lecture-7 10/37
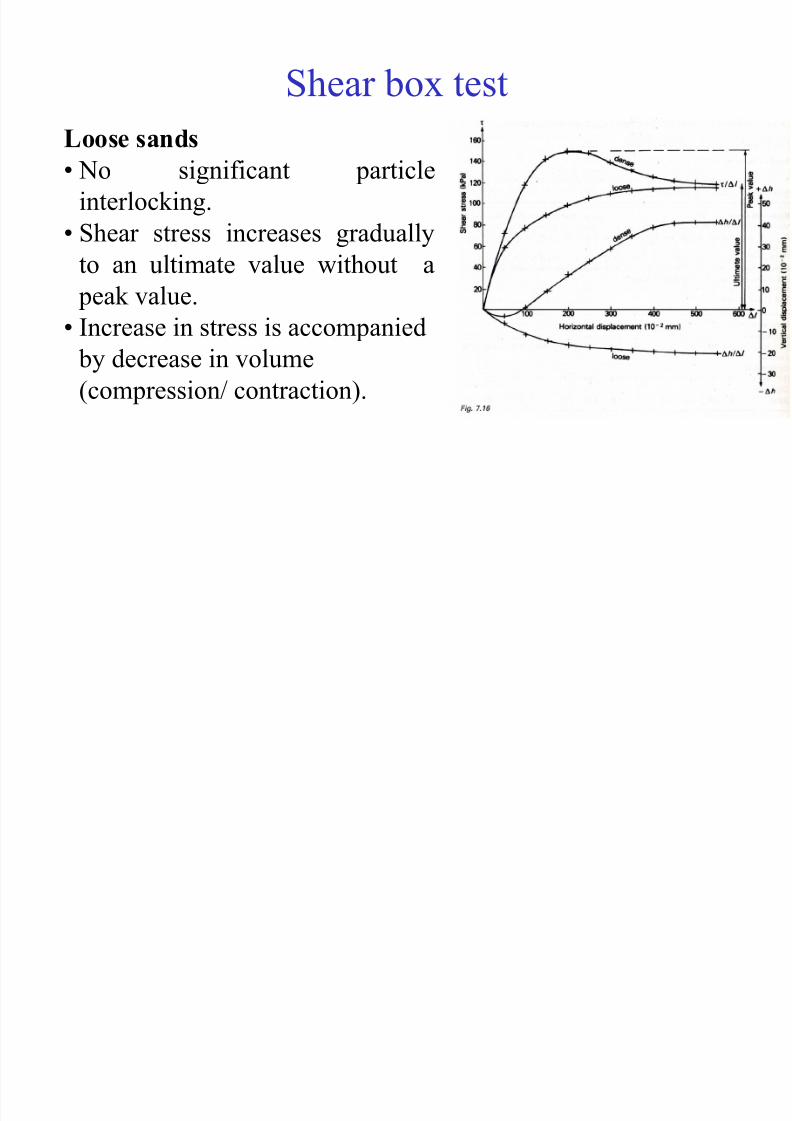
Shear box test
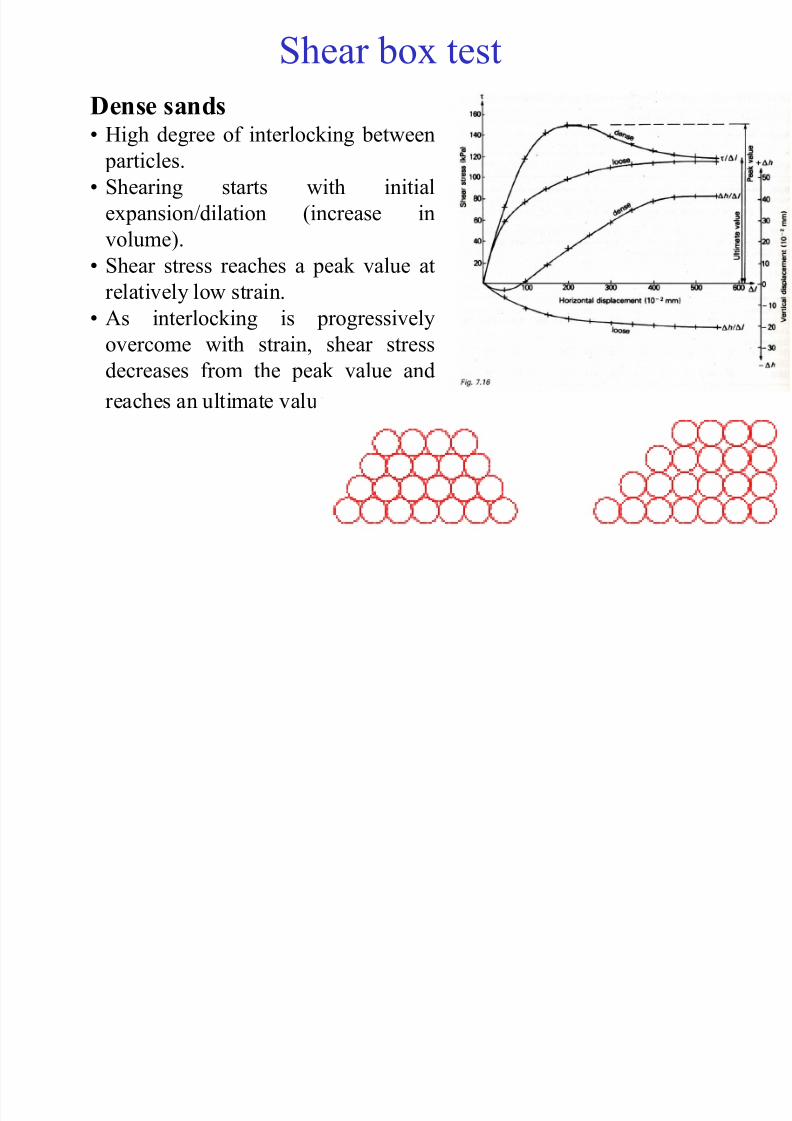
Dense sands
• High degree of interlocking between particles.
• Shearing starts with initial
expansion/dilation (increase in
volume).
• Shear stress reaches a peak value atrelatively low strain.
• As interlocking is progressively
overcome with strain, shear stress
decreases from the peak value and
reaches an ultimate value.
8/12/2019 Geo Lecture 7
http://slidepdf.com/reader/full/geo-lecture-7 11/37
8/12/2019 Geo Lecture 7
http://slidepdf.com/reader/full/geo-lecture-7 12/37
Shear box test
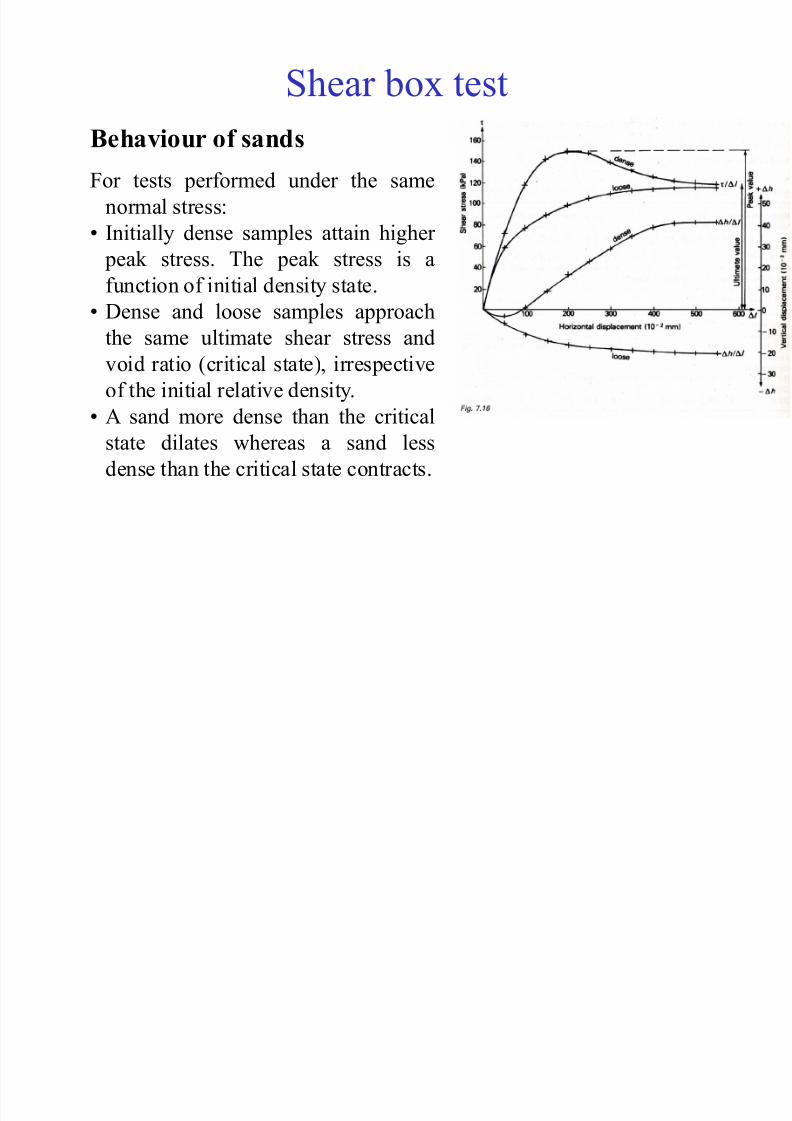
Behaviour of sands
For tests performed under the same
normal stress:
• Initially dense samples attain higher
peak stress. The peak stress is a
function of initial density state.
• Dense and loose samples approach
the same ultimate shear stress and
void ratio (critical state), irrespective
of the initial relative density.
• A sand more dense than the criticalstate dilates whereas a sand less
dense than the critical state contracts.
8/12/2019 Geo Lecture 7
http://slidepdf.com/reader/full/geo-lecture-7 13/37
8/12/2019 Geo Lecture 7
http://slidepdf.com/reader/full/geo-lecture-7 14/37
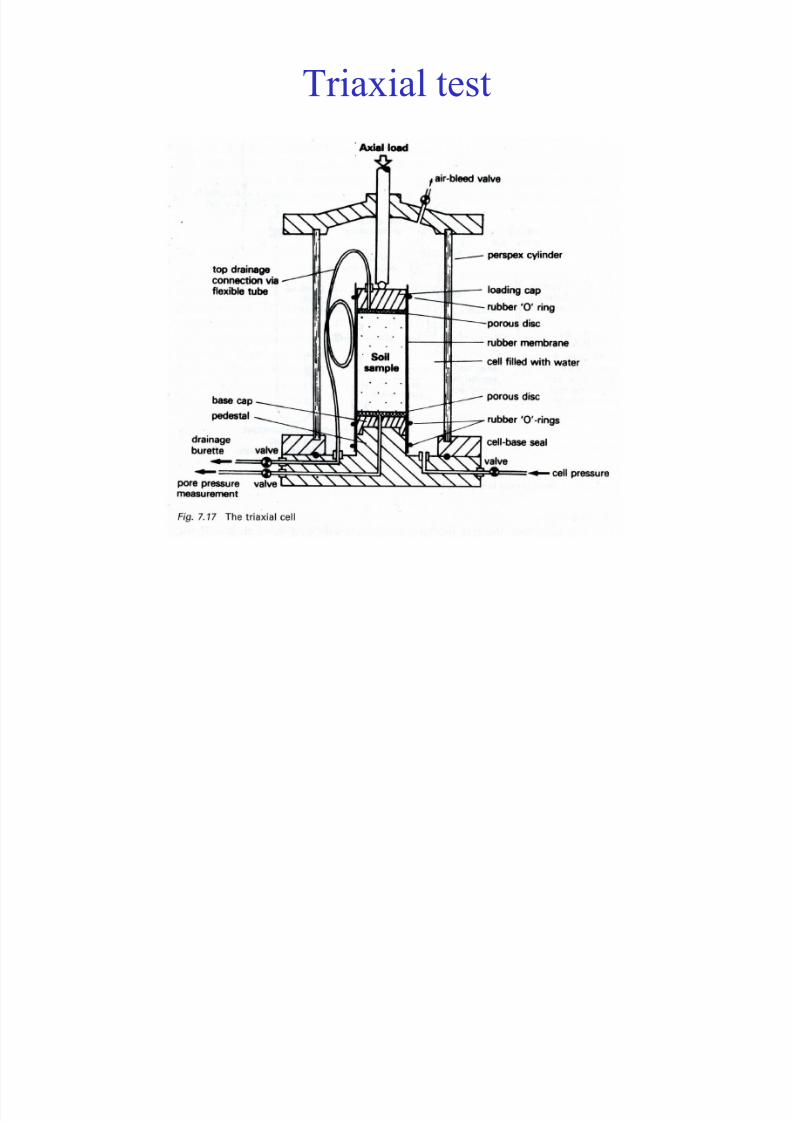
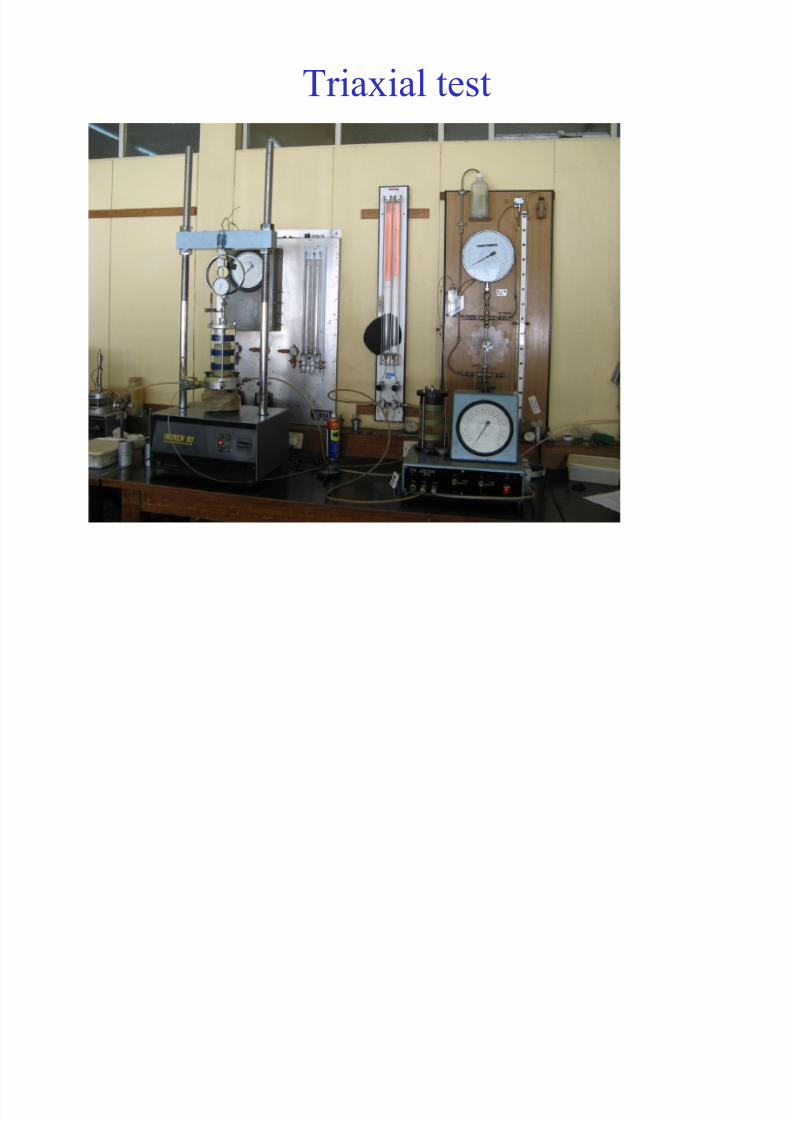
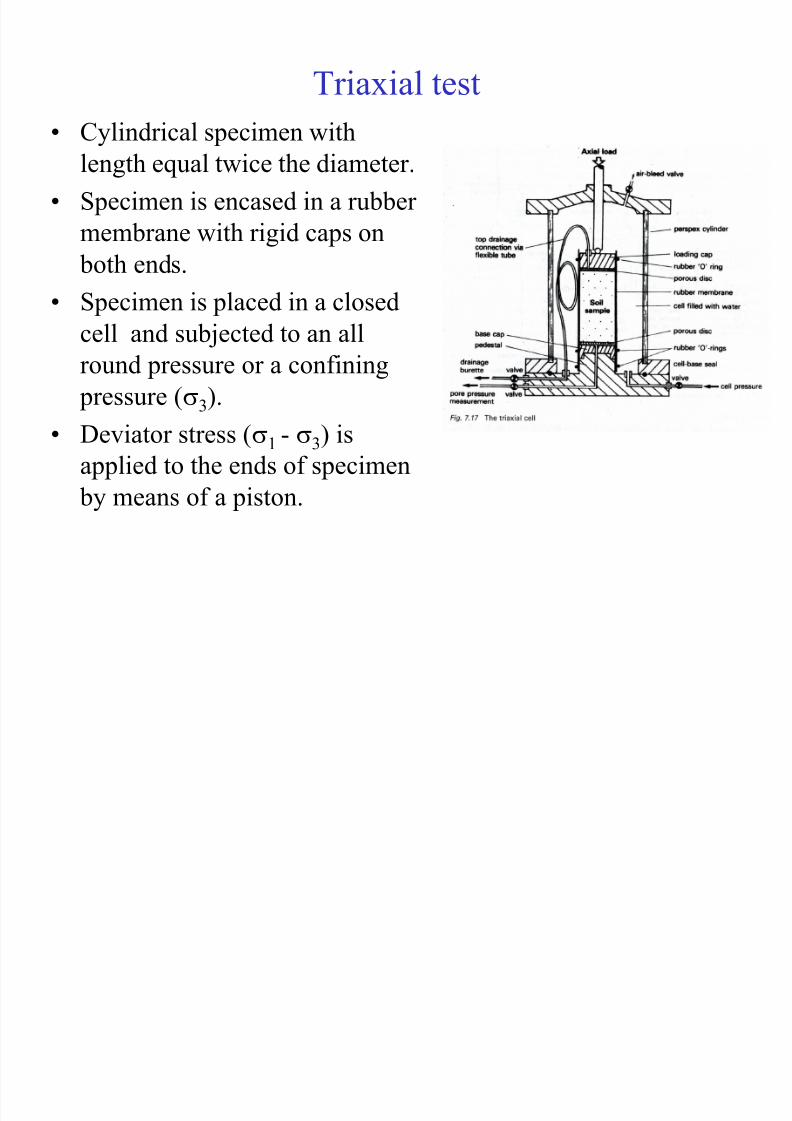
Triaxial test
8/12/2019 Geo Lecture 7
http://slidepdf.com/reader/full/geo-lecture-7 15/37
8/12/2019 Geo Lecture 7
http://slidepdf.com/reader/full/geo-lecture-7 16/37
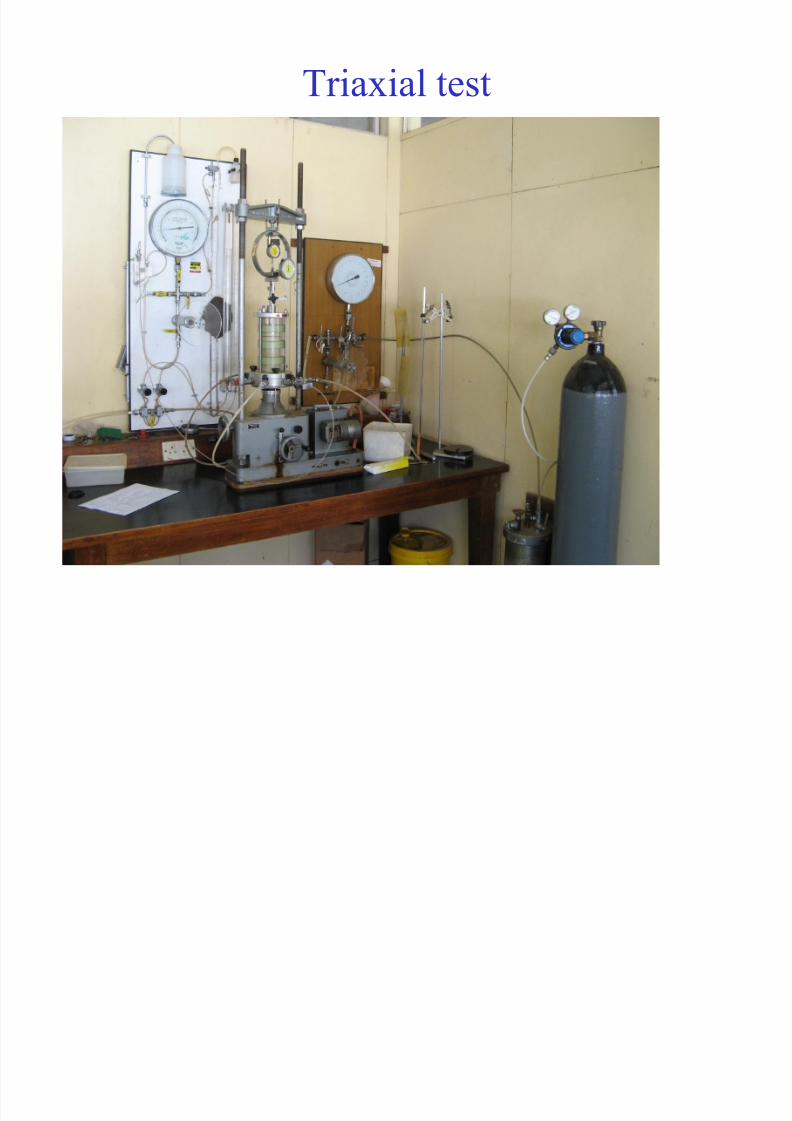
Triaxial test
8/12/2019 Geo Lecture 7
http://slidepdf.com/reader/full/geo-lecture-7 17/37
8/12/2019 Geo Lecture 7
http://slidepdf.com/reader/full/geo-lecture-7 18/37
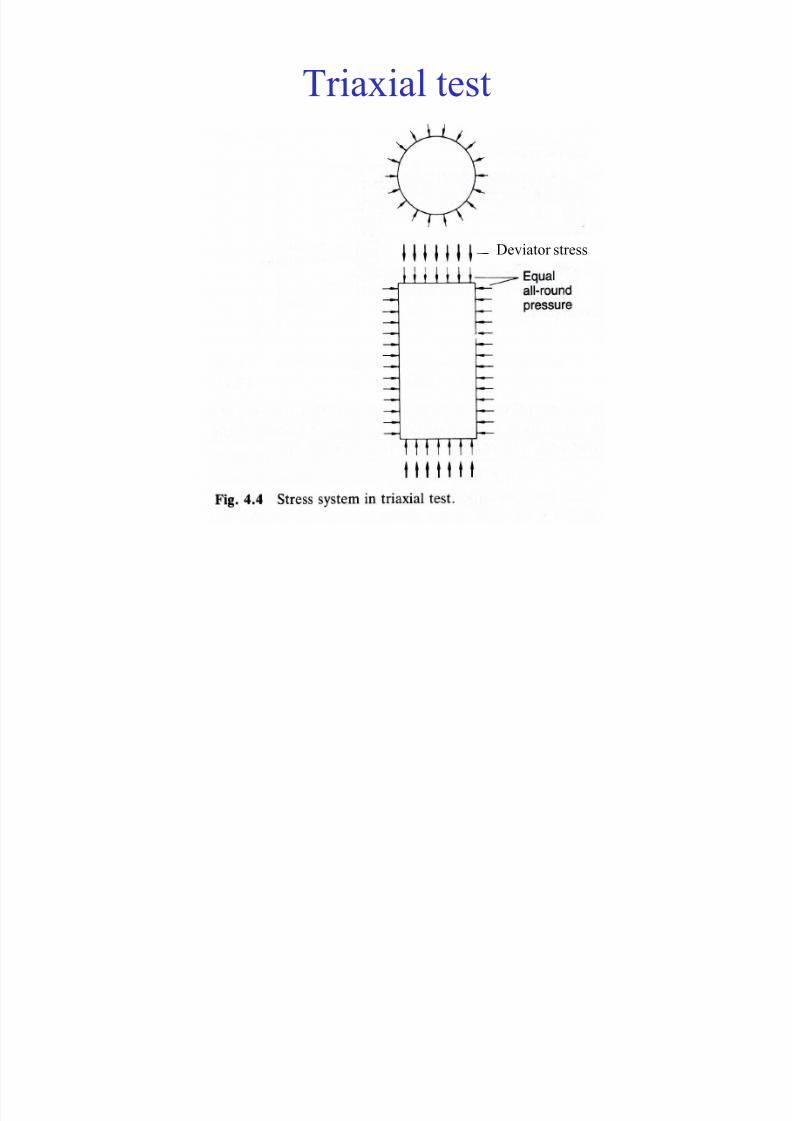
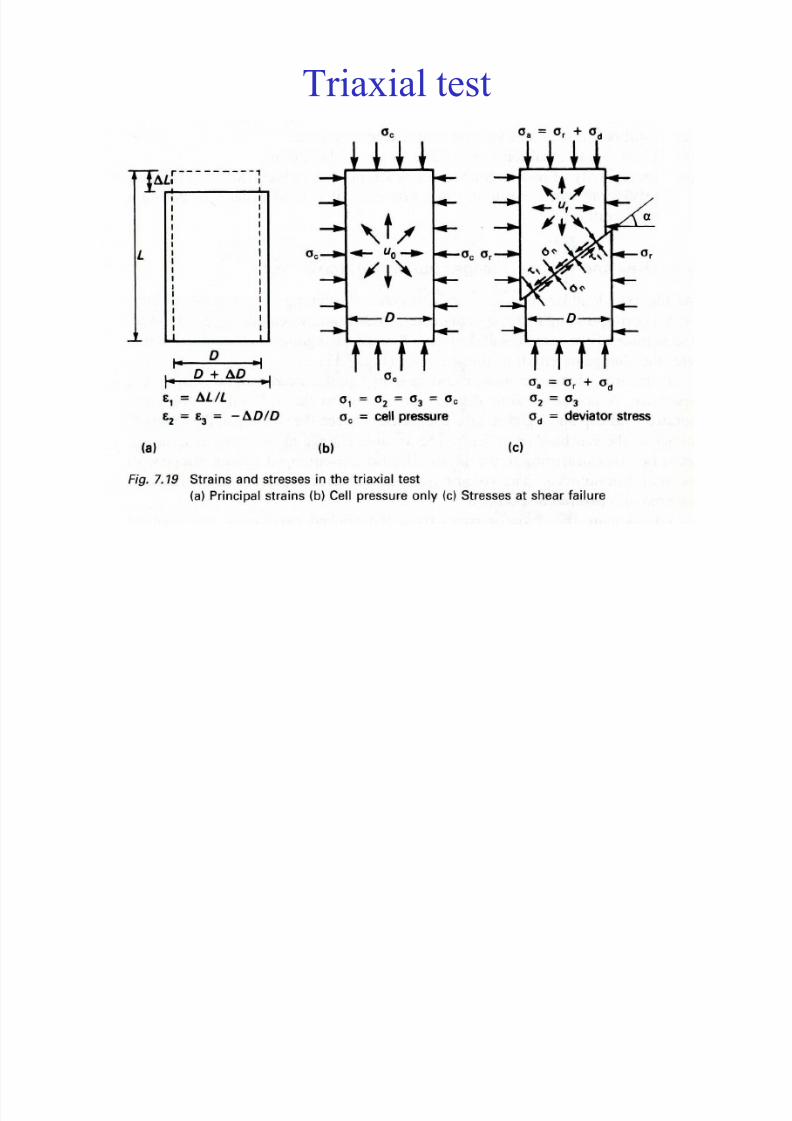
Triaxial test
Deviator stress
8/12/2019 Geo Lecture 7
http://slidepdf.com/reader/full/geo-lecture-7 19/37
Triaxial test
• Porewater pressure can be measured.
• Drainage can be controlled from the top and bottom of the
specimen.

8/12/2019 Geo Lecture 7
http://slidepdf.com/reader/full/geo-lecture-7 20/37
Triaxial test
There are 3 stages in a triaxial test:
Stage 1: Application of s3 undrained, that is without
dissipation of porewater pressure in all types of test
Stage 2: Consolidation stage at constant s3. This stage isomitted in UU tests
Stage 3: Shearing stage at constant s3.
– Undrained shearing in UU and CU tests
– Drained shearing in CD tests
8/12/2019 Geo Lecture 7
http://slidepdf.com/reader/full/geo-lecture-7 21/37
Types of triaxial test
There are 3 types of triaxial test:
• Unconsolidated undrained (UU): No consolidation stage 2
and undrained shearing stage 3
• Consolidated drained (CD): Consolidation stage 2 and
drained shearing stage 3
• Consolidated undrained (CU): Consolidation stage 2 andundrained shearing stage 3 with porewater pressure
measurement
8/12/2019 Geo Lecture 7
http://slidepdf.com/reader/full/geo-lecture-7 22/37
Types of triaxial test
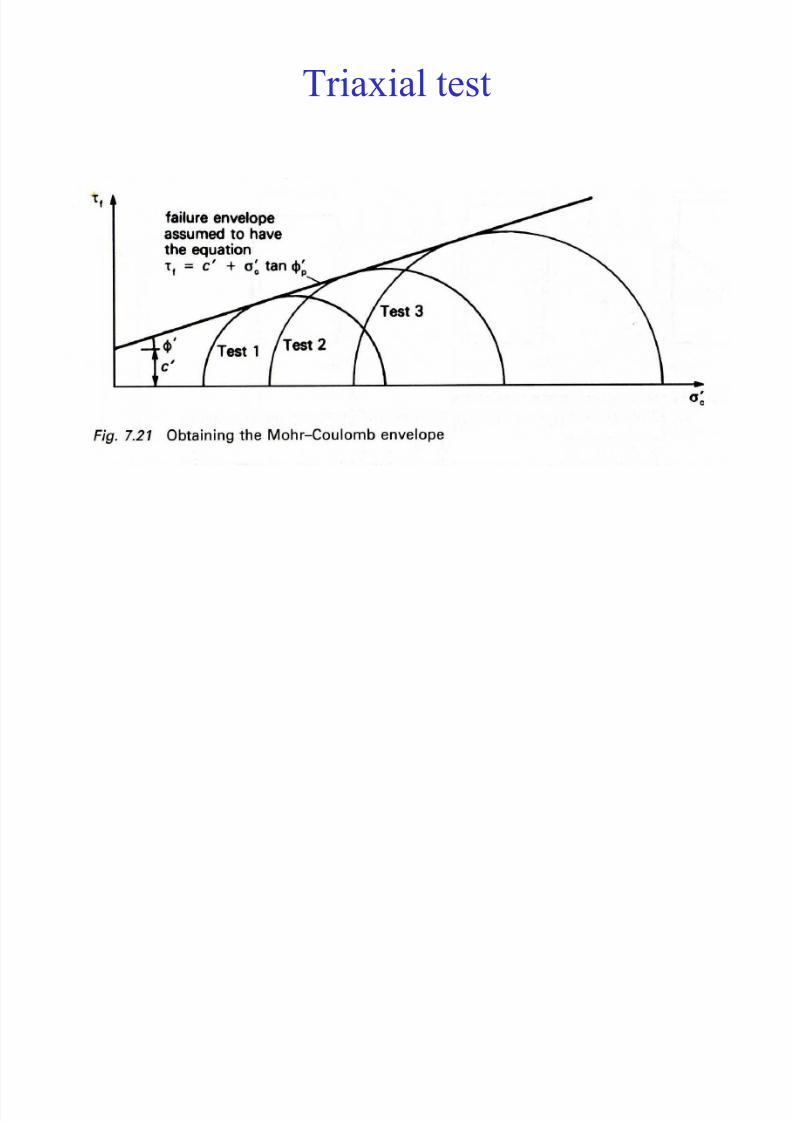
To obtain shear strength parameters, tests are carried out at
3 different confining pressures so as to obtain 3 Mohr
circles.
8/12/2019 Geo Lecture 7
http://slidepdf.com/reader/full/geo-lecture-7 23/37
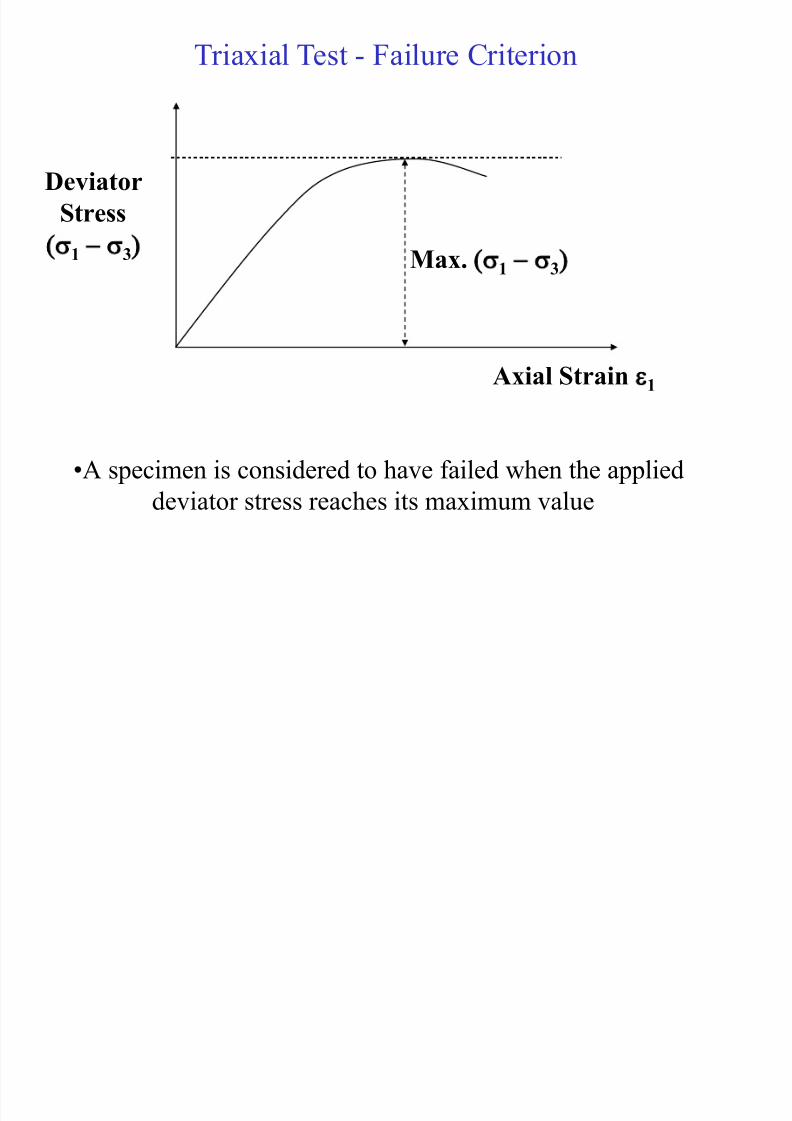
Triaxial Test - Failure Criterion
Deviator
Stress
s1 - s3)
•A specimen is considered to have failed when the applied
deviator stress reaches its maximum value
Axial Strain e1
Max. s1 - s3)

8/12/2019 Geo Lecture 7
http://slidepdf.com/reader/full/geo-lecture-7 24/37
UU triaxial test
• Volume of the specimen remains constant
• Area correction of specimen is required to calculate axial
stress during shearing stage (Eq 7.16)
• Test allows determination of total strength parameters, cu
and fu
o
o
l
l
A A
D-
1
8/12/2019 Geo Lecture 7
http://slidepdf.com/reader/full/geo-lecture-7 25/37
UU triaxial test
• For saturated clays, fu = 0. Undrained shear strength, t = cu
• Unconfined compression test, that is a test in which
confining pressure is zero, can be used to determine
undrained shear strength of a saturated clay
8/12/2019 Geo Lecture 7
http://slidepdf.com/reader/full/geo-lecture-7 26/37
CD triaxial test
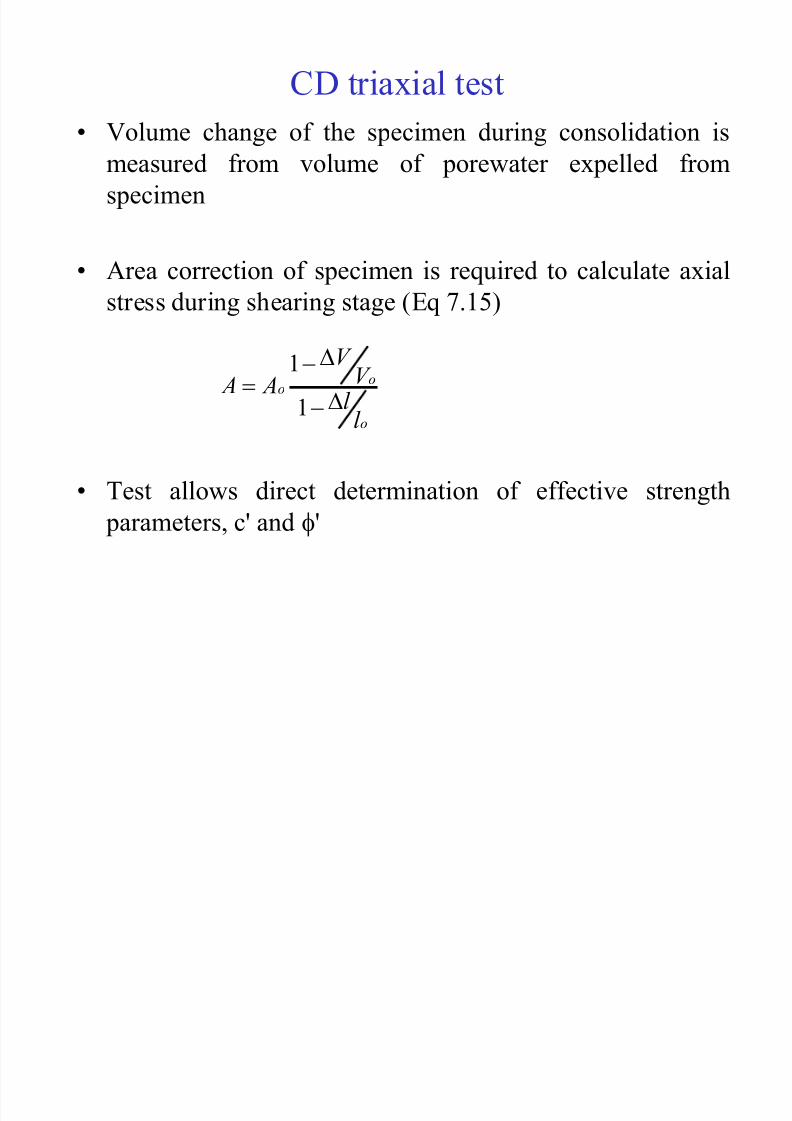
• Volume change of the specimen during consolidation ismeasured from volume of porewater expelled from
specimen
• Area correction of specimen is required to calculate axialstress during shearing stage (Eq 7.15)
• Test allows direct determination of effective strength
parameters, c' and f'
o
oo
l
l
V V
A AD-
D-
1
1
8/12/2019 Geo Lecture 7
http://slidepdf.com/reader/full/geo-lecture-7 27/37
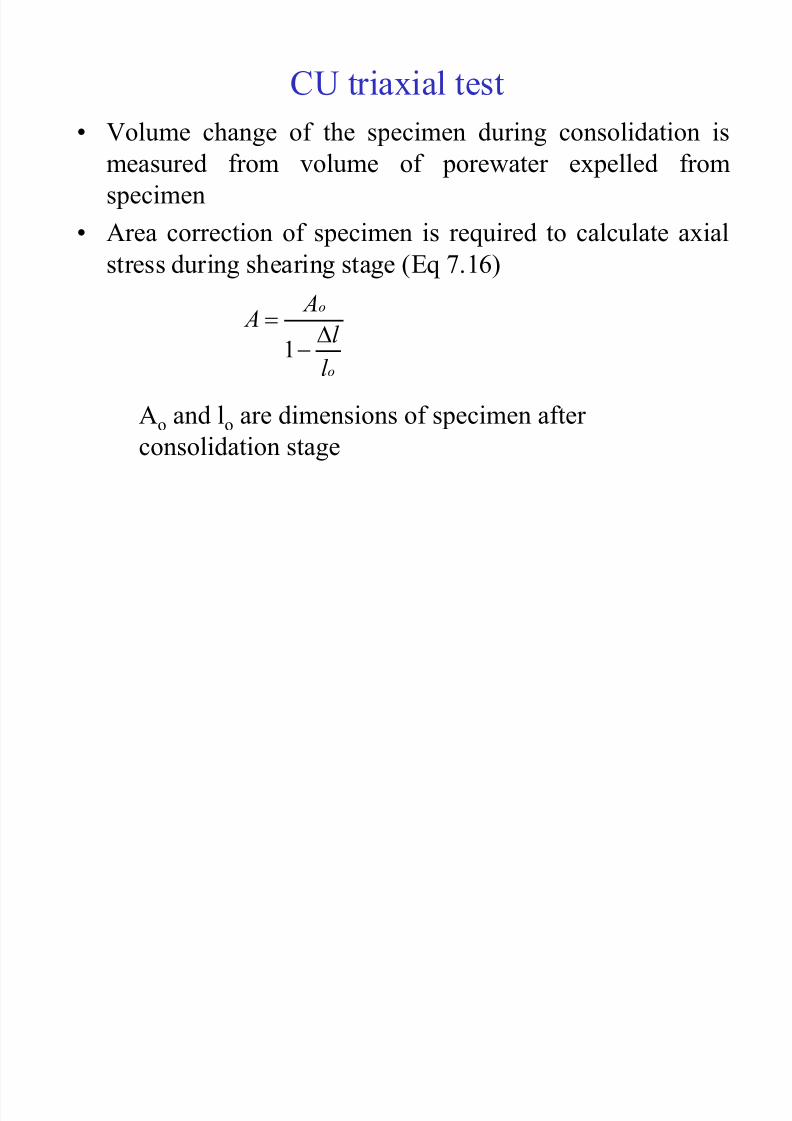
CU triaxial test
• Volume change of the specimen during consolidation ismeasured from volume of porewater expelled from
specimen
• Area correction of specimen is required to calculate axial
stress during shearing stage (Eq 7.16)
Ao and lo are dimensions of specimen afterconsolidation stage
o
o
l
l
A A
D-
1
8/12/2019 Geo Lecture 7
http://slidepdf.com/reader/full/geo-lecture-7 28/37
8/12/2019 Geo Lecture 7
http://slidepdf.com/reader/full/geo-lecture-7 29/37
Triaxial test

8/12/2019 Geo Lecture 7
http://slidepdf.com/reader/full/geo-lecture-7 30/37
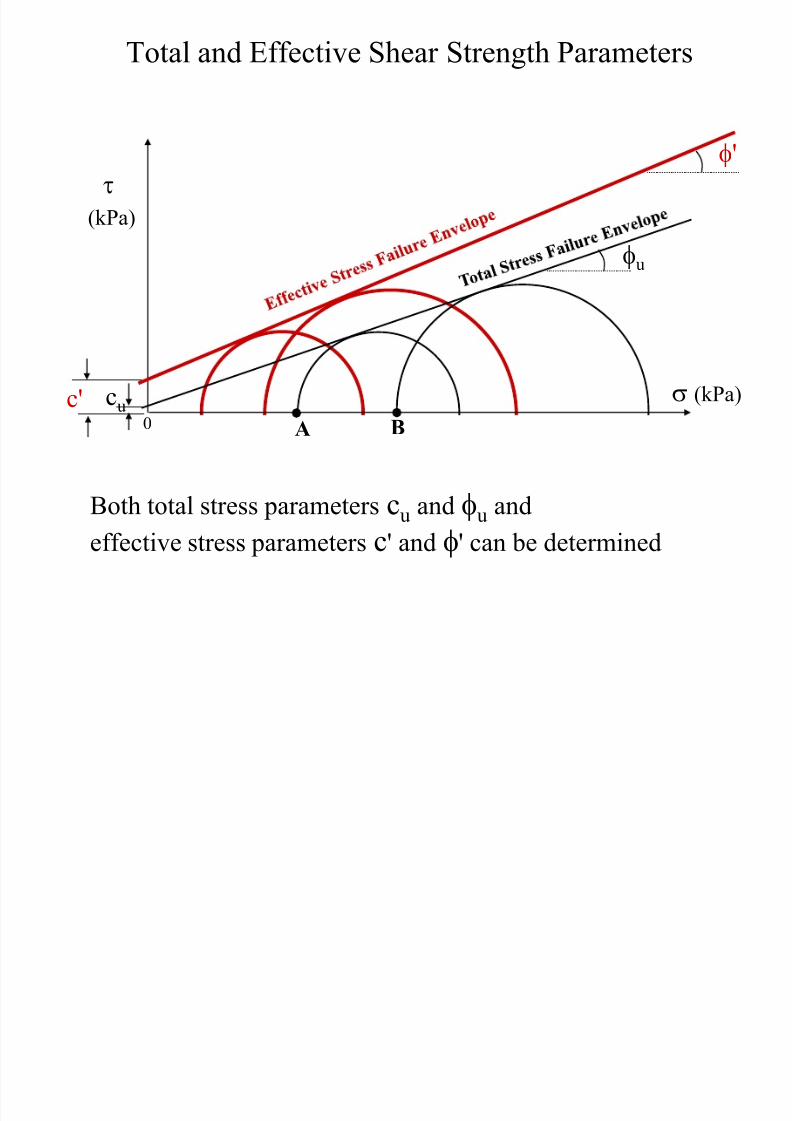
Knowing u and total stresses at failure, effective circles can be
plotted
0
s (kPa)
t
(kPa)
A B
u1 (Test 1)
Effective Mohr Circle
Total Mohr Circle
u2 (Test 2)
8/12/2019 Geo Lecture 7
http://slidepdf.com/reader/full/geo-lecture-7 31/37
0
s (kPa)
t
(kPa)
A B
cu
fu
c'
f'
Both total stress parameters cu and fu and
effective stress parametersc
' andf
' can be determined
Total and Effective Shear Strength Parameters
8/12/2019 Geo Lecture 7
http://slidepdf.com/reader/full/geo-lecture-7 32/37
Triaxial test
8/12/2019 Geo Lecture 7
http://slidepdf.com/reader/full/geo-lecture-7 33/37
8/12/2019 Geo Lecture 7
http://slidepdf.com/reader/full/geo-lecture-7 34/37
Pore Pressure Coefficients A and B
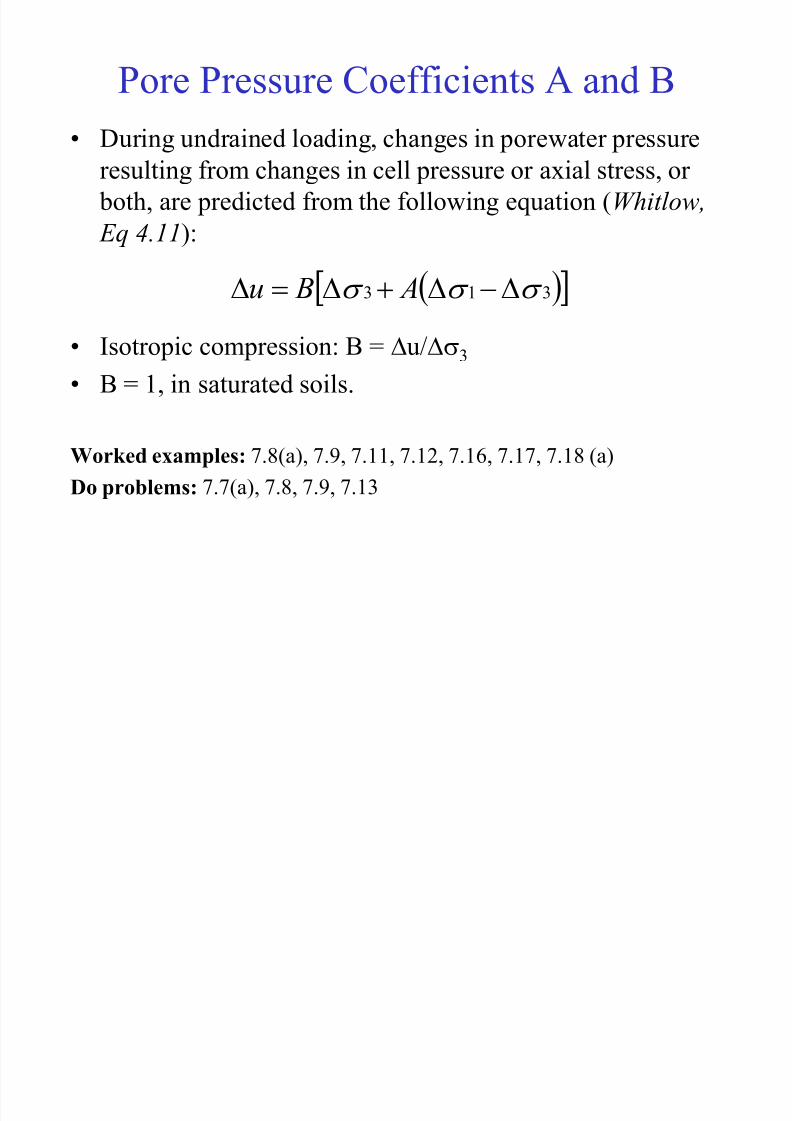
• During undrained loading, changes in porewater pressureresulting from changes in cell pressure or axial stress, or
both, are predicted from the following equation (Whitlow,
Eq 4.11):
• Isotropic compression: B = Du/Ds3
• B = 1, in saturated soils.
Worked examples: 7.8(a), 7.9, 7.11, 7.12, 7.16, 7.17, 7.18 (a)
Do problems: 7.7(a), 7.8, 7.9, 7.13
( ) 313 s s s D-DDD A Bu
8/12/2019 Geo Lecture 7
http://slidepdf.com/reader/full/geo-lecture-7 35/37
Stress Paths
• The behaviour of a soil depends on the route (stress path)taken between the initial state and the final state.
• The stress path method in laboratory testing allows the
actual field stress changes to be simulated more
realistically than by using conventional test proceduresalone.
• Stress path: a curve drawn through a series of points on a
plot of stresses.
• Stress point: a point on a plot of stresses representing the
selected components of stress at a particular instant.
8/12/2019 Geo Lecture 7
http://slidepdf.com/reader/full/geo-lecture-7 36/37
Stress Paths
• Effective stress path (ESP): path plotted in terms of effective stresses.
• Total stress path (TSP): path plotted in terms of total
stresses.

8/12/2019 Geo Lecture 7
http://slidepdf.com/reader/full/geo-lecture-7 37/37
Types of Stress Path Plot
• s1 v/s s3 space for total stresses• s1 v/s s3 space for effective stresses
• t v/s s or s' space (MIT)
– t = (s1 – s3)/2,
– s = (s1 + s3)/2, s' = (s1' + s3
')/2
– The stress point used is the maximum shear stress at
any stage, that is the topmost point of each Mohr circle.


![Arariba Geo 7 Unid 4 Edit[1]](https://img.pdfslide.us/doc/110x75/55cf987f550346d0339801eb/arariba-geo-7-unid-4-edit1.jpg)