Embed Size (px)
Citation preview

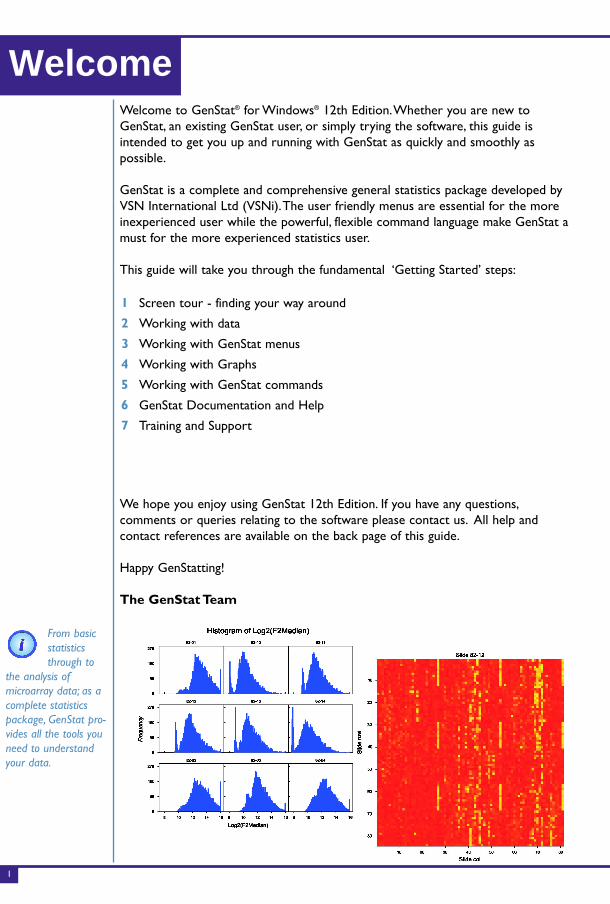
Welcome to GenStat® for Windows® 12th Edition.Whether you are new toGenStat, an existing GenStat user, or simply trying the software, this guide isintended to get you up and running with GenStat as quickly and smoothly aspossible.
GenStat is a complete and comprehensive general statistics package developed byVSN International Ltd (VSNi).The user friendly menus are essential for the moreinexperienced user while the powerful, flexible command language make GenStat amust for the more experienced statistics user.
This guide will take you through the fundamental ‘Getting Started’ steps:
We hope you enjoy using GenStat 12th Edition. If you have any questions,comments or queries relating to the software please contact us. All help andcontact references are available on the back page of this guide.
Happy GenStatting!
The GenStat Team
1 Screen tour - finding your way around
2 Working with data
3 Working with GenStat menus
4 Working with Graphs
5 Working with GenStat commands
6 GenStat Documentation and Help
7 Training and Support
Welcome
1
From basicstatisticsthrough to
the analysis ofmicroarray data; as acomplete statisticspackage, GenStat pro-vides all the tools youneed to understandyour data.
2
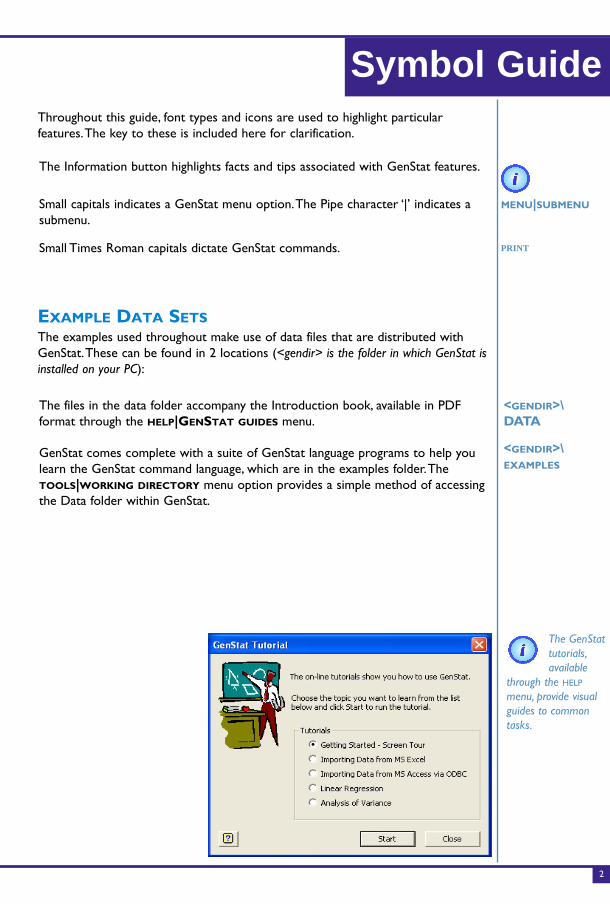
Symbol GuideThroughout this guide, font types and icons are used to highlight particularfeatures.The key to these is included here for clarification.
EXAMPLE DATA SETSThe examples used throughout make use of data files that are distributed withGenStat.These can be found in 2 locations (<gendir> is the folder in which GenStat isinstalled on your PC):
The files in the data folder accompany the Introduction book, available in PDFformat through the HELP|GENSTAT GUIDES menu.
GenStat comes complete with a suite of GenStat language programs to help youlearn the GenStat command language, which are in the examples folder.TheTOOLS|WORKING DIRECTORY menu option provides a simple method of accessingthe Data folder within GenStat.
The Information button highlights facts and tips associated with GenStat features.
Small capitals indicates a GenStat menu option.The Pipe character ‘|’ indicates asubmenu.
Small Times Roman capitals dictate GenStat commands.
MENU|SUBMENU
<GENDIR>\DATA
<GENDIR>\ EXAMPLES
The GenStattutorials,available
through the HELP
menu, provide visualguides to commontasks.
The GenStat interface adopts a multiple-window approach.This means that you canhave a number of different types of windows open at any one time.These can be:
1 GenStat SpreadsheetsTo edit or manipulate your data.
2 Graphics WindowTo display your data visually.
3 Text WindowsGenStat provides several default text windows:
mm Output Window:With the exception of high-resolution graphics, all GenStat output will be displayed here.
mm Input Log: This is the audit trail where GenStat keeps a record of all menuanalyses and GenStat commands submitted.This window is minimized onstart-up and is read only.
mm Event Log:The event log is closed on start-up and keeps a record of any faults,warnings or session interruptions.
1 - Screen Tour
3
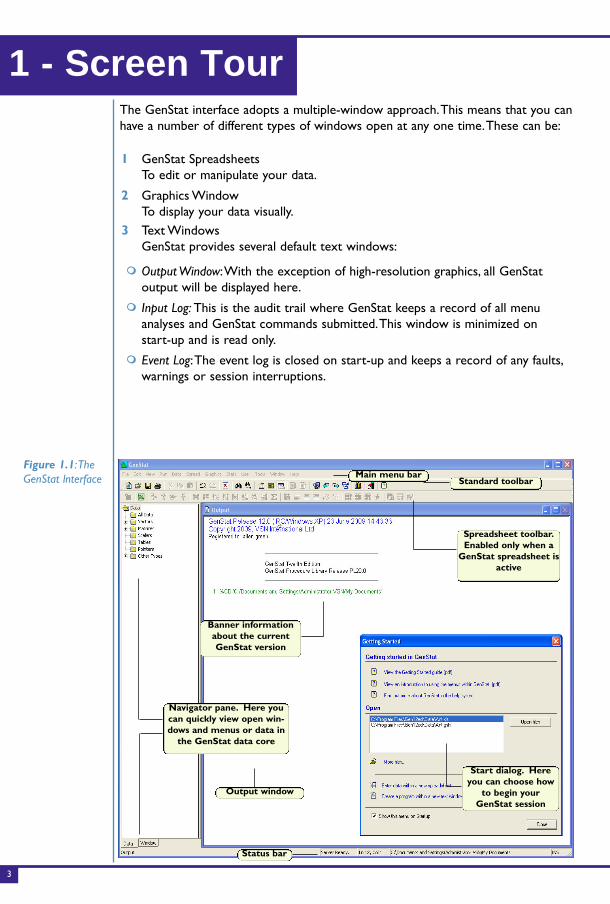
Figure 1.1:TheGenStat lnterface
Navigator pane. Here youcan quickly view open win-dows and menus or data in
the GenStat data core
Banner informationabout the currentGenStat version
Status bar
Output window
Start dialog. Hereyou can choose how
to begin yourGenStat session
Spreadsheet toolbar.Enabled only when a
GenStat spreadsheet isactive
Standard toolbarMain menu bar
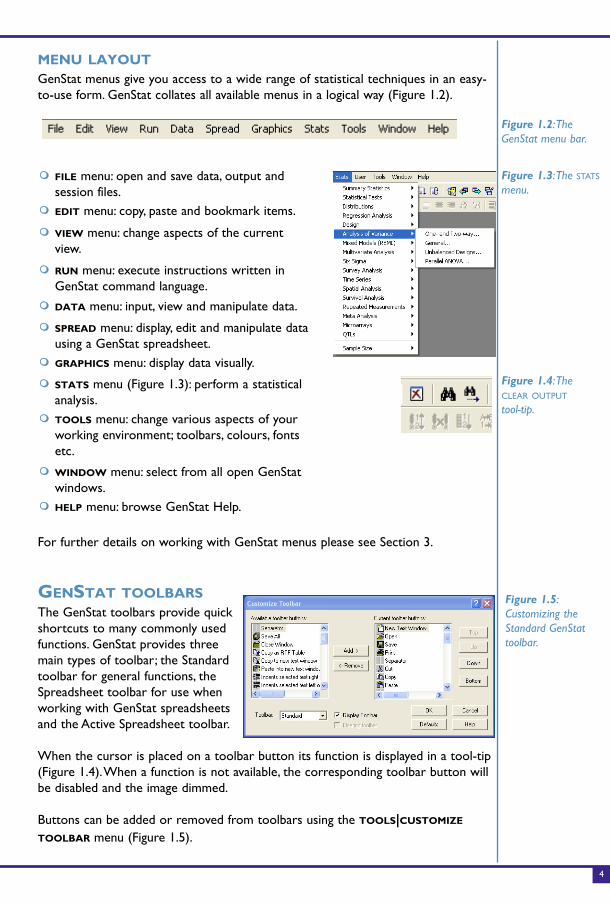
MENU LAYOUTGenStat menus give you access to a wide range of statistical techniques in an easy-to-use form. GenStat collates all available menus in a logical way (Figure 1.2).
For further details on working with GenStat menus please see Section 3.
GENSTAT TOOLBARSThe GenStat toolbars provide quickshortcuts to many commonly usedfunctions. GenStat provides threemain types of toolbar; the Standardtoolbar for general functions, theSpreadsheet toolbar for use whenworking with GenStat spreadsheetsand the Active Spreadsheet toolbar.
When the cursor is placed on a toolbar button its function is displayed in a tool-tip(Figure 1.4).When a function is not available, the corresponding toolbar button willbe disabled and the image dimmed.
Buttons can be added or removed from toolbars using the TOOLS|CUSTOMIZE
TOOLBAR menu (Figure 1.5).
mm FILE menu: open and save data, output andsession files.
mm EDIT menu: copy, paste and bookmark items.
mm VIEW menu: change aspects of the currentview.
mm RUN menu: execute instructions written inGenStat command language.
mm DATA menu: input, view and manipulate data.
mm SPREAD menu: display, edit and manipulate datausing a GenStat spreadsheet.
mm GRAPHICS menu: display data visually.
mm STATS menu (Figure 1.3): perform a statisticalanalysis.
mm TOOLS menu: change various aspects of yourworking environment; toolbars, colours, fontsetc.
mm WINDOW menu: select from all open GenStatwindows.
mm HELP menu: browse GenStat Help.
4
Figure 1.2:TheGenStat menu bar.
Figure 1.3:The STATS
menu.
Figure 1.4:TheCLEAR OUTPUT
tool-tip.
Figure 1.5:Customizing theStandard GenStattoolbar.
GenStat’s extensive data import and manipulation facilities ensure that getting yourdata ready for analysis is easy.
DATA STRUCTURESAn ‘identifier’ is the name given to a particular data structure in GenStat.The firstcharacter of an identifier must be a letter; any others can be either letters ordigits. Only the first 32 characters are significant; subsequent characters areignored.
GenStat supports a wide range of special data structures:
A number of more specialised structures are also supported; please see theGenStat Help system for a complete list.
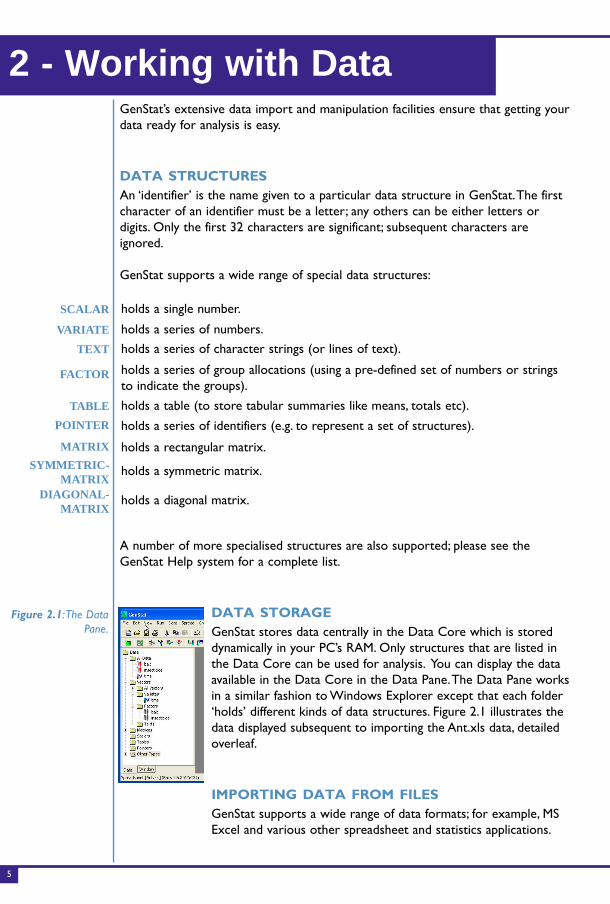
DATA STORAGEGenStat stores data centrally in the Data Core which is storeddynamically in your PC’s RAM. Only structures that are listed inthe Data Core can be used for analysis. You can display the dataavailable in the Data Core in the Data Pane.The Data Pane worksin a similar fashion to Windows Explorer except that each folder‘holds’ different kinds of data structures. Figure 2.1 illustrates thedata displayed subsequent to importing the Ant.xls data, detailedoverleaf.
IMPORTING DATA FROM FILESGenStat supports a wide range of data formats; for example, MSExcel and various other spreadsheet and statistics applications.
holds a single number.
holds a series of numbers.holds a series of character strings (or lines of text).
holds a series of group allocations (using a pre-defined set of numbers or stringsto indicate the groups).holds a table (to store tabular summaries like means, totals etc).
holds a series of identifiers (e.g. to represent a set of structures).
holds a rectangular matrix.
holds a symmetric matrix.
holds a diagonal matrix.
2 - Working with Data
5
SCALAR
VARIATE
TEXT
FACTOR
TABLE
POINTER
MATRIX
SYMMETRIC-MATRIX
DIAGONAL-MATRIX
Figure 2.1:The DataPane.
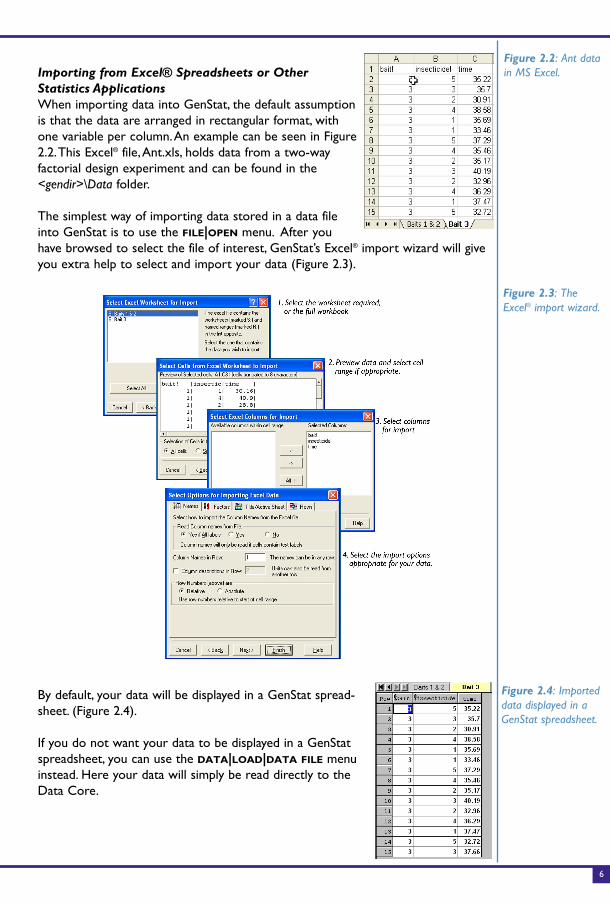
Importing from Excel® Spreadsheets or OtherStatistics ApplicationsWhen importing data into GenStat, the default assumptionis that the data are arranged in rectangular format, withone variable per column.An example can be seen in Figure2.2.This Excel® file,Ant.xls, holds data from a two-wayfactorial design experiment and can be found in the<gendir>\Data folder.
The simplest way of importing data stored in a data fileinto GenStat is to use the FILE|OPEN menu. After youhave browsed to select the file of interest, GenStat’s Excel® import wizard will giveyou extra help to select and import your data (Figure 2.3).
By default, your data will be displayed in a GenStat spread-sheet. (Figure 2.4).
If you do not want your data to be displayed in a GenStatspreadsheet, you can use the DATA|LOAD|DATA FILE menuinstead. Here your data will simply be read directly to theData Core.
6
Figure 2.2: Ant datain MS Excel.
Figure 2.3: TheExcel® import wizard.
Figure 2.4: Importeddata displayed in aGenStat spreadsheet.
Importing from ASCII FilesYou cannot use the FILE|OPEN menu to read in data stored in text (or ASCII)
format. GenStat cannot distinguish between text data and a text command file.The
FILE|OPEN menu defaults to a command file so will display your data in a text
window rather than a spreadsheet.To read in text data, use the DATA|LOAD|ASCII
FILE menu option.
For more details on importing data from data files, please see Chapter 2 of the
Introduction book, available in PDF format from the HELP|GENSTAT GUIDES menu.
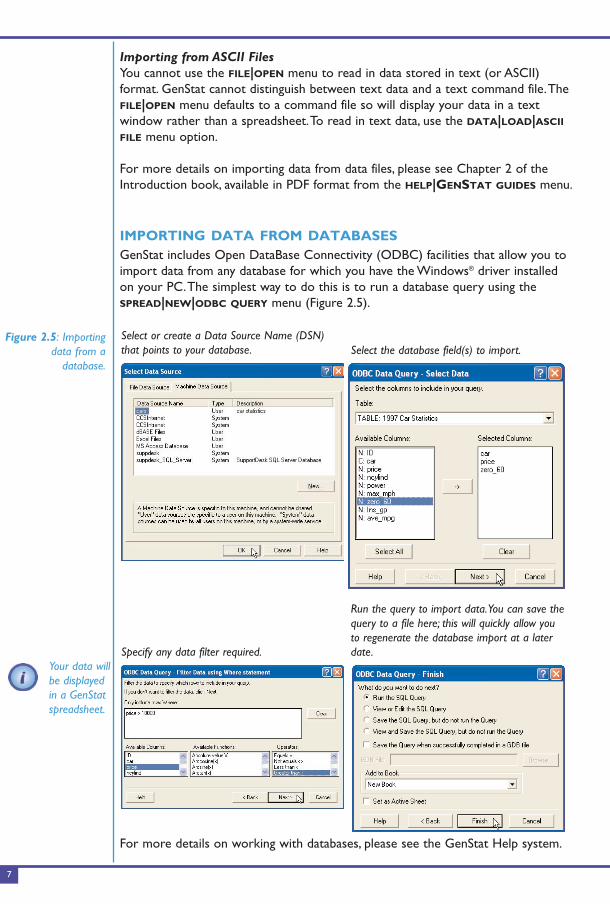
IMPORTING DATA FROM DATABASESGenStat includes Open DataBase Connectivity (ODBC) facilities that allow you to
import data from any database for which you have the Windows® driver installed
on your PC.The simplest way to do this is to run a database query using the
SPREAD|NEW|ODBC QUERY menu (Figure 2.5).
For more details on working with databases, please see the GenStat Help system.
Select or create a Data Source Name (DSN)that points to your database. Select the database field(s) to import.
Specify any data filter required.
Run the query to import data.You can save thequery to a file here; this will quickly allow youto regenerate the database import at a laterdate.
7
Figure 2.5: Importingdata from a
database.
Your data willbe displayedin a GenStatspreadsheet.
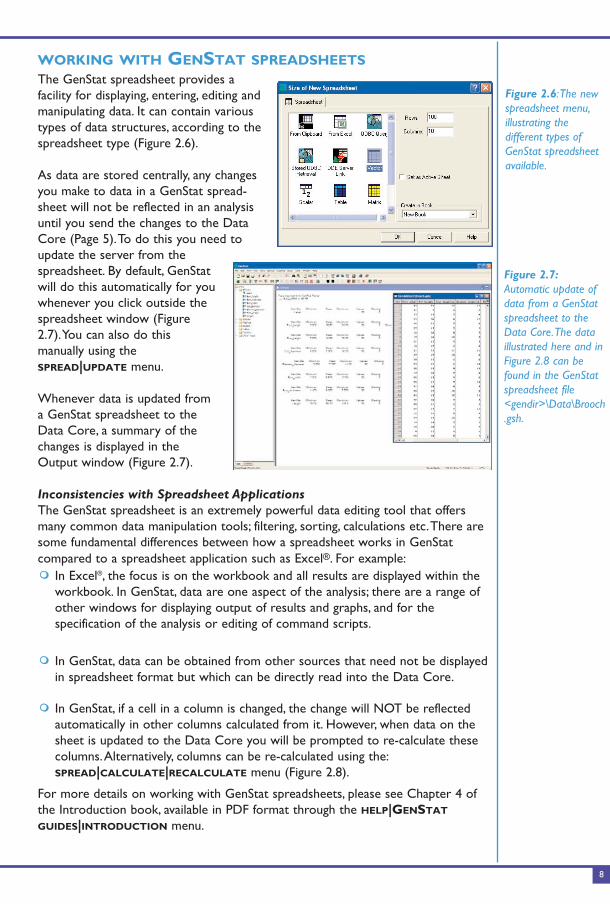
WORKING WITH GENSTAT SPREADSHEETSThe GenStat spreadsheet provides a
facility for displaying, entering, editing and
manipulating data. It can contain various
types of data structures, according to the
spreadsheet type (Figure 2.6).
As data are stored centrally, any changes
you make to data in a GenStat spread-
sheet will not be reflected in an analysis
until you send the changes to the Data
Core (Page 5).To do this you need to
update the server from the
spreadsheet. By default, GenStat
will do this automatically for you
whenever you click outside the
spreadsheet window (Figure
2.7).You can also do this
manually using the
SPREAD|UPDATE menu.
Whenever data is updated from
a GenStat spreadsheet to the
Data Core, a summary of the
changes is displayed in the
Output window (Figure 2.7).
Inconsistencies with Spreadsheet ApplicationsThe GenStat spreadsheet is an extremely powerful data editing tool that offers
many common data manipulation tools; filtering, sorting, calculations etc.There are
some fundamental differences between how a spreadsheet works in GenStat
compared to a spreadsheet application such as Excel®. For example:
For more details on working with GenStat spreadsheets, please see Chapter 4 of
the Introduction book, available in PDF format through the HELP|GENSTAT
GUIDES|INTRODUCTION menu.
�� In Excel®, the focus is on the workbook and all results are displayed within the
workbook. In GenStat, data are one aspect of the analysis; there are a range of
other windows for displaying output of results and graphs, and for the
specification of the analysis or editing of command scripts.
�� In GenStat, data can be obtained from other sources that need not be displayed
in spreadsheet format but which can be directly read into the Data Core.
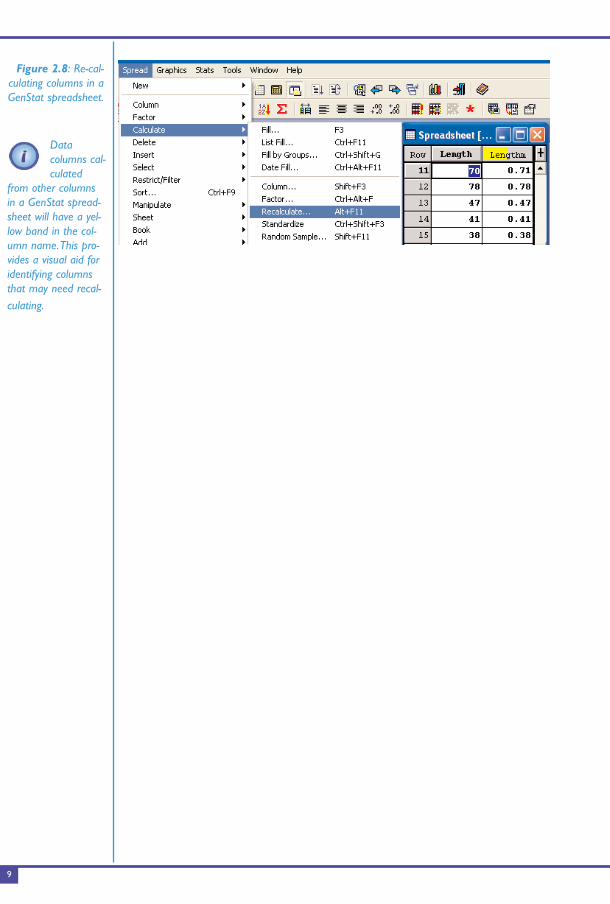
�� In GenStat, if a cell in a column is changed, the change will NOT be reflected
automatically in other columns calculated from it. However, when data on the
sheet is updated to the Data Core you will be prompted to re-calculate these
columns.Alternatively, columns can be re-calculated using the:
SPREAD|CALCULATE|RECALCULATE menu (Figure 2.8).
8
Figure 2.7:Automatic update ofdata from a GenStatspreadsheet to theData Core.The dataillustrated here and inFigure 2.8 can befound in the GenStatspreadsheet file<gendir>\Data\Brooch.gsh.
Figure 2.6:The newspreadsheet menu,illustrating thedifferent types ofGenStat spreadsheetavailable.
9
Figure 2.8: Re-cal-culating columns in aGenStat spreadsheet.
Datacolumns cal-culated
from other columnsin a GenStat spread-sheet will have a yel-low band in the col-umn name.This pro-vides a visual aid foridentifying columnsthat may need recal-culating.
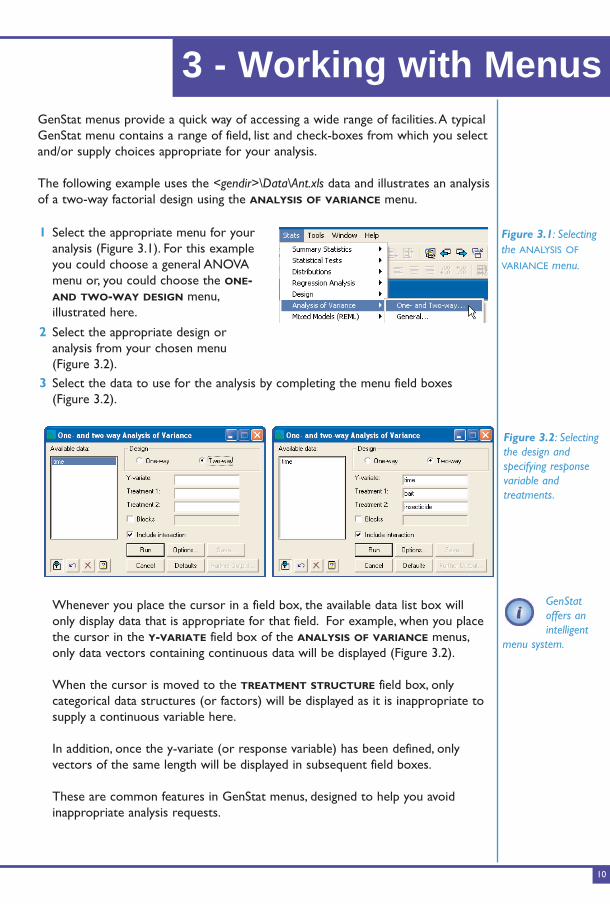
GenStat menus provide a quick way of accessing a wide range of facilities.A typical
GenStat menu contains a range of field, list and check-boxes from which you select
and/or supply choices appropriate for your analysis.
The following example uses the <gendir>\Data\Ant.xls data and illustrates an analysis
of a two-way factorial design using the ANALYSIS OF VARIANCE menu.
Whenever you place the cursor in a field box, the available data list box will
only display data that is appropriate for that field. For example, when you place
the cursor in the Y-VARIATE field box of the ANALYSIS OF VARIANCE menus,
only data vectors containing continuous data will be displayed (Figure 3.2).
When the cursor is moved to the TREATMENT STRUCTURE field box, only
categorical data structures (or factors) will be displayed as it is inappropriate to
supply a continuous variable here.
In addition, once the y-variate (or response variable) has been defined, only
vectors of the same length will be displayed in subsequent field boxes.
These are common features in GenStat menus, designed to help you avoid
inappropriate analysis requests.
1 Select the appropriate menu for your
analysis (Figure 3.1). For this example
you could choose a general ANOVA
menu or, you could choose the ONE-AND TWO-WAY DESIGN menu,
illustrated here.
2 Select the appropriate design or
analysis from your chosen menu
(Figure 3.2).
3 Select the data to use for the analysis by completing the menu field boxes
(Figure 3.2).
10
3 - Working with Menus
Figure 3.1: Selectingthe ANALYSIS OF
VARIANCE menu.
Figure 3.2: Selectingthe design andspecifying responsevariable andtreatments.
GenStatoffers anintelligent
menu system.
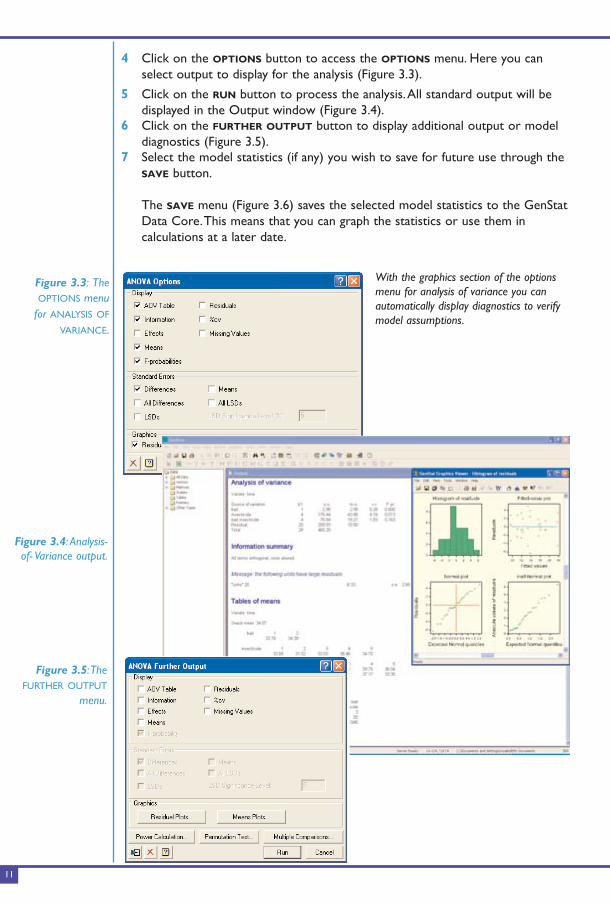
4 Click on the OPTIONS button to access the OPTIONS menu. Here you can
select output to display for the analysis (Figure 3.3).
5 Click on the RUN button to process the analysis.All standard output will be
displayed in the Output window (Figure 3.4).
6 Click on the FURTHER OUTPUT button to display additional output or model
diagnostics (Figure 3.5).
7 Select the model statistics (if any) you wish to save for future use through the
SAVE button.
The SAVE menu (Figure 3.6) saves the selected model statistics to the GenStat
Data Core.This means that you can graph the statistics or use them in
calculations at a later date.
11
Figure 3.3: TheOPTIONS menu
for ANALYSIS OF
VARIANCE.
With the graphics section of the optionsmenu for analysis of variance you canautomatically display diagnostics to verifymodel assumptions.
Figure 3.4: Analysis-of- Variance output.
Figure 3.5:TheFURTHER OUTPUT
menu.
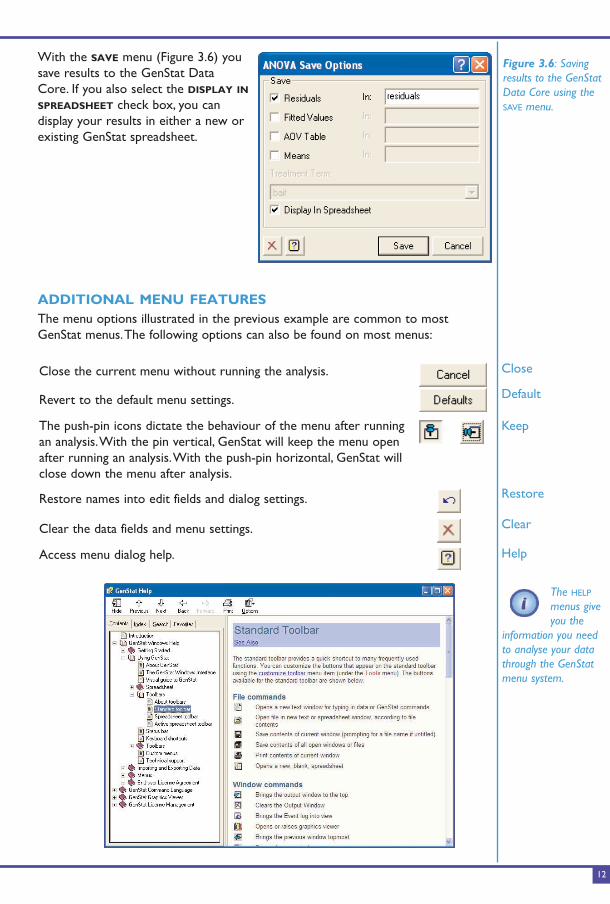
With the SAVE menu (Figure 3.6) you
save results to the GenStat Data
Core. If you also select the DISPLAY IN
SPREADSHEET check box, you can
display your results in either a new or
existing GenStat spreadsheet.
ADDITIONAL MENU FEATURESThe menu options illustrated in the previous example are common to most
GenStat menus.The following options can also be found on most menus:
Close the current menu without running the analysis.
Revert to the default menu settings.
The push-pin icons dictate the behaviour of the menu after running
an analysis.With the pin vertical, GenStat will keep the menu open
after running an analysis.With the push-pin horizontal, GenStat will
close down the menu after analysis.
Restore names into edit fields and dialog settings.
Clear the data fields and menu settings.
Access menu dialog help.
12
Figure 3.6: Savingresults to the GenStatData Core using theSAVE menu.
Close
Default
Keep
Restore
Clear
Help
The HELP
menus giveyou the
information you needto analyse your datathrough the GenStatmenu system.
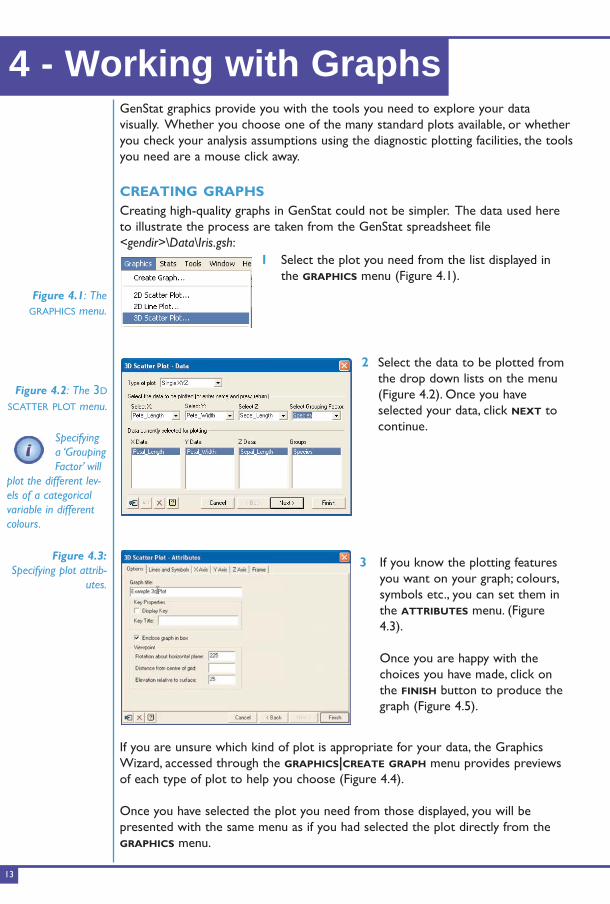
GenStat graphics provide you with the tools you need to explore your data
visually. Whether you choose one of the many standard plots available, or whether
you check your analysis assumptions using the diagnostic plotting facilities, the tools
you need are a mouse click away.
CREATING GRAPHSCreating high-quality graphs in GenStat could not be simpler. The data used here
to illustrate the process are taken from the GenStat spreadsheet file
<gendir>\Data\Iris.gsh:
If you are unsure which kind of plot is appropriate for your data, the Graphics
Wizard, accessed through the GRAPHICS|CREATE GRAPH menu provides previews
of each type of plot to help you choose (Figure 4.4).
Once you have selected the plot you need from those displayed, you will be
presented with the same menu as if you had selected the plot directly from the
GRAPHICS menu.
3 If you know the plotting features
you want on your graph; colours,
symbols etc., you can set them in
the ATTRIBUTES menu. (Figure
4.3).
Once you are happy with the
choices you have made, click on
the FINISH button to produce the
graph (Figure 4.5).
2 Select the data to be plotted from
the drop down lists on the menu
(Figure 4.2). Once you have
selected your data, click NEXT to
continue.
1 Select the plot you need from the list displayed in
the GRAPHICS menu (Figure 4.1).
4 - Working with Graphs
13
Figure 4.1: TheGRAPHICS menu.
Figure 4.2: The 3D
SCATTER PLOT menu.
Specifyinga ‘GroupingFactor’ will
plot the different lev-els of a categoricalvariable in differentcolours.
Figure 4.3:Specifying plot attrib-
utes.
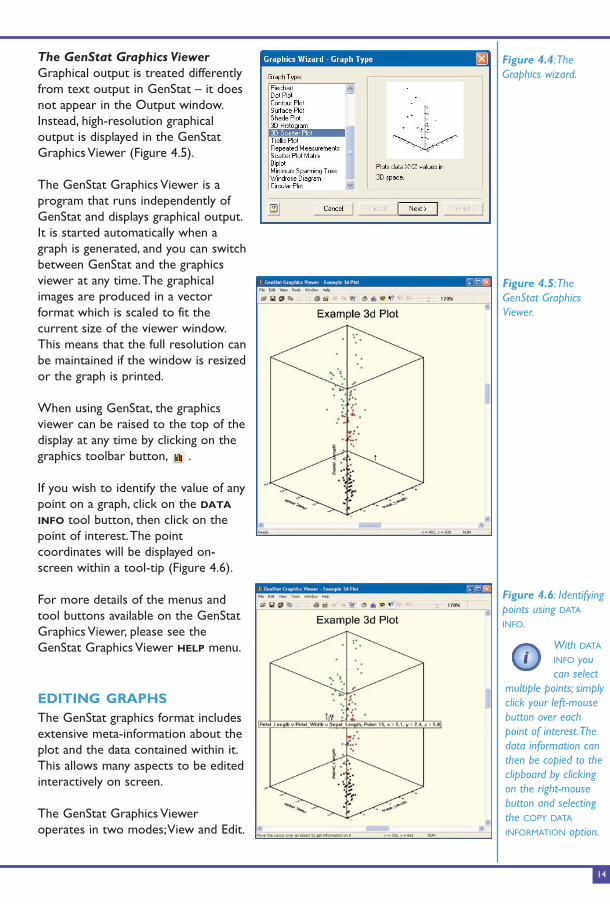
The GenStat Graphics ViewerGraphical output is treated differently
from text output in GenStat – it does
not appear in the Output window.
Instead, high-resolution graphical
output is displayed in the GenStat
Graphics Viewer (Figure 4.5).
The GenStat Graphics Viewer is a
program that runs independently of
GenStat and displays graphical output.
It is started automatically when a
graph is generated, and you can switch
between GenStat and the graphics
viewer at any time.The graphical
images are produced in a vector
format which is scaled to fit the
current size of the viewer window.
This means that the full resolution can
be maintained if the window is resized
or the graph is printed.
When using GenStat, the graphics
viewer can be raised to the top of the
display at any time by clicking on the
graphics toolbar button, .
If you wish to identify the value of any
point on a graph, click on the DATA
INFO tool button, then click on the
point of interest.The point
coordinates will be displayed on-
screen within a tool-tip (Figure 4.6).
For more details of the menus and
tool buttons available on the GenStat
Graphics Viewer, please see the
GenStat Graphics Viewer HELP menu.
EDITING GRAPHSThe GenStat graphics format includes
extensive meta-information about the
plot and the data contained within it.
This allows many aspects to be edited
interactively on screen.
The GenStat Graphics Viewer
operates in two modes;View and Edit.
14
Figure 4.4:TheGraphics wizard.
Figure 4.5:TheGenStat GraphicsViewer.
Figure 4.6: Identifyingpoints using DATA
INFO.
With DATA
INFO youcan select
multiple points; simplyclick your left-mousebutton over eachpoint of interest.Thedata information canthen be copied to theclipboard by clickingon the right-mousebutton and selectingthe COPY DATA
INFORMATION option.
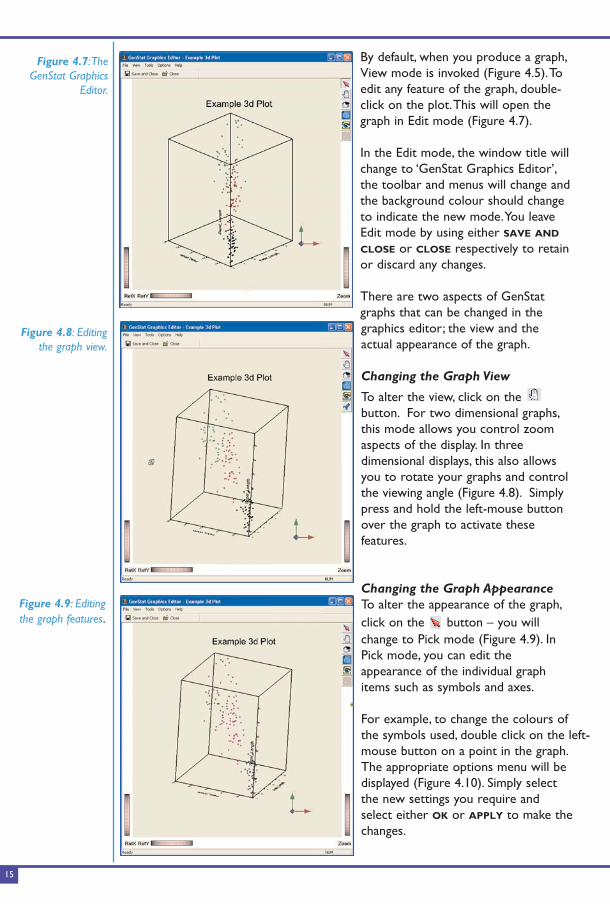
By default, when you produce a graph,
View mode is invoked (Figure 4.5).To
edit any feature of the graph, double-
click on the plot.This will open the
graph in Edit mode (Figure 4.7).
In the Edit mode, the window title will
change to ‘GenStat Graphics Editor’,
the toolbar and menus will change and
the background colour should change
to indicate the new mode.You leave
Edit mode by using either SAVE AND
CLOSE or CLOSE respectively to retain
or discard any changes.
There are two aspects of GenStat
graphs that can be changed in the
graphics editor; the view and the
actual appearance of the graph.
Changing the Graph View
To alter the view, click on the
button. For two dimensional graphs,
this mode allows you control zoom
aspects of the display. In three
dimensional displays, this also allows
you to rotate your graphs and control
the viewing angle (Figure 4.8). Simply
press and hold the left-mouse button
over the graph to activate these
features.
Changing the Graph AppearanceTo alter the appearance of the graph,
click on the button – you will
change to Pick mode (Figure 4.9). In
Pick mode, you can edit the
appearance of the individual graph
items such as symbols and axes.
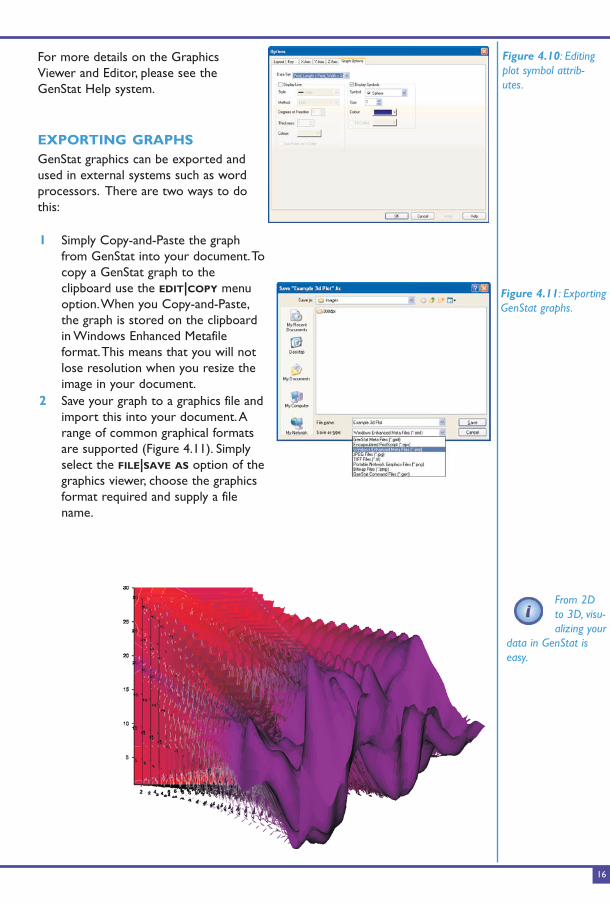
For example, to change the colours of
the symbols used, double click on the left-
mouse button on a point in the graph.
The appropriate options menu will be
displayed (Figure 4.10). Simply select
the new settings you require and
select either OK or APPLY to make the
changes.
15
Figure 4.7:TheGenStat Graphics
Editor.
Figure 4.8: Editingthe graph view.
Figure 4.9: Editingthe graph features.
For more details on the Graphics
Viewer and Editor, please see the
GenStat Help system.
EXPORTING GRAPHSGenStat graphics can be exported and
used in external systems such as word
processors. There are two ways to do
this:
1 Simply Copy-and-Paste the graph
from GenStat into your document.To
copy a GenStat graph to the
clipboard use the EDIT|COPY menu
option.When you Copy-and-Paste,
the graph is stored on the clipboard
in Windows Enhanced Metafile
format.This means that you will not
lose resolution when you resize the
image in your document.
2 Save your graph to a graphics file and
import this into your document.A
range of common graphical formats
are supported (Figure 4.11). Simply
select the FILE|SAVE AS option of the
graphics viewer, choose the graphics
format required and supply a file
name.
16
Figure 4.10: Editingplot symbol attrib-utes.
Figure 4.11: ExportingGenStat graphs.
From 2Dto 3D, visu-alizing your
data in GenStat iseasy.
In addition to the pull-down menu system, GenStat provides a programming lan-
guage that offers greater power and flexibility in working practice. With the
GenStat language you can run audit trails as programs to replicate analyses, extend
GenStat by developing your own statistical techniques, and attach libraries of
routines that you have developed in GenStat.
COMMAND STATEMENT SYNTAXGenStat commands are called directives and take the following form:
DIRECTIVE [ OPTION1= ; OPTION2= ; … ] PARAMETER1= ; PARAMETER2= ; …
Where,
For example: PRINT X
will print the values of the variable X to the GenStat Output window, using the
GenStat printing defaults. However, by including an option called MISSING and a
parameter called DECIMALS;
PRINT[ MISSING=’-999’] X; DECIMALS=1
the values of the variable X will be printed to the GenStat Output window, to one
decimal place, replacing any missing values in the data with the code -999. For
more details on GenStat directives, please see the Directives manual, available
through the HELP|REFERENCE MANUAL|DIRECTIVES menu option.
PROCEDURESA ‘procedure’ in GenStat is a structure that contains GenStat statements and
which fulfils the role of the subroutine in the GenStat language.The syntax of a
procedure looks the same as a GenStat directive.
For more details on writing and using procedures, please see the Syntax and Data
Management manual, available through the HELP|GENSTAT GUIDES|SYNTAX AND
DATA MANAGEMENT menu option.
A standard form of instruction / statement in the GenStat language, requesting a
particular action or analysis.All GenStat directives have the same syntax.
Options specify arguments that are global within a GenStat statement: i.e. they
apply to all the items in the parameter list(s). Often, but not always, options have
default values and so need not be specified.
Parameters specify parallel lists of arguments for a statement.
5 - Working with Commands
17
DIRECTIVE
OPTION
PARAMETER
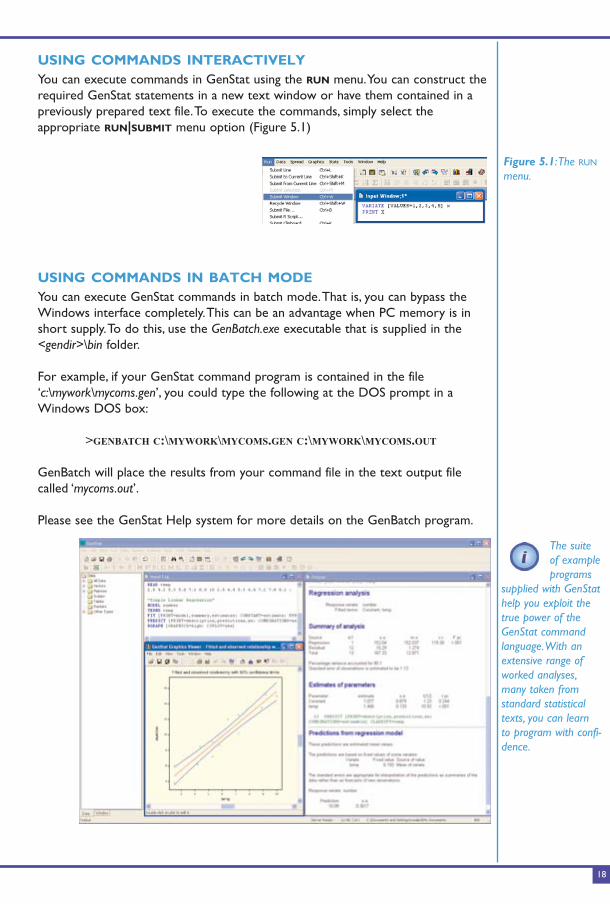
USING COMMANDS INTERACTIVELYYou can execute commands in GenStat using the RUN menu.You can construct the
required GenStat statements in a new text window or have them contained in a
previously prepared text file.To execute the commands, simply select the
appropriate RUN|SUBMIT menu option (Figure 5.1)
USING COMMANDS IN BATCH MODEYou can execute GenStat commands in batch mode.That is, you can bypass the
Windows interface completely.This can be an advantage when PC memory is in
short supply.To do this, use the GenBatch.exe executable that is supplied in the
<gendir>\bin folder.
For example, if your GenStat command program is contained in the file
‘c:\mywork\mycoms.gen’, you could type the following at the DOS prompt in a
Windows DOS box:
>GENBATCH C:\MYWORK\MYCOMS.GEN C:\MYWORK\MYCOMS.OUT
GenBatch will place the results from your command file in the text output file
called ‘mycoms.out’.
Please see the GenStat Help system for more details on the GenBatch program.
18
Figure 5.1:The RUN
menu.
The suiteof exampleprograms
supplied with GenStathelp you exploit thetrue power of theGenStat commandlanguage.With anextensive range ofworked analyses,many taken fromstandard statisticaltexts, you can learnto program with confi-dence.
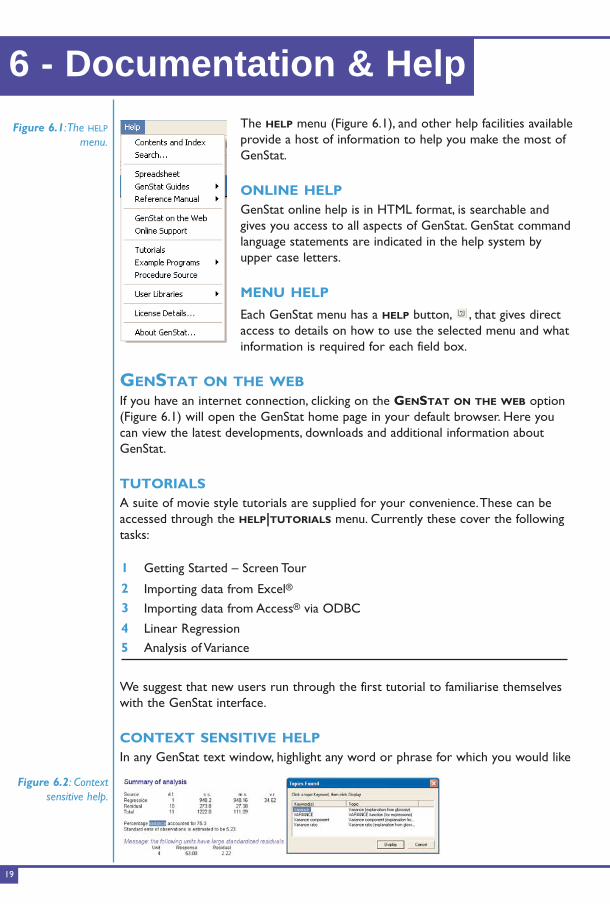
The HELP menu (Figure 6.1), and other help facilities available
provide a host of information to help you make the most of
GenStat.
ONLINE HELPGenStat online help is in HTML format, is searchable and
gives you access to all aspects of GenStat. GenStat command
language statements are indicated in the help system by
upper case letters.
MENU HELP
Each GenStat menu has a HELP button, , that gives direct
access to details on how to use the selected menu and what
information is required for each field box.
GENSTAT ON THE WEBIf you have an internet connection, clicking on the GENSTAT ON THE WEB option
(Figure 6.1) will open the GenStat home page in your default browser. Here you
can view the latest developments, downloads and additional information about
GenStat.
TUTORIALSA suite of movie style tutorials are supplied for your convenience.These can be
accessed through the HELP|TUTORIALS menu. Currently these cover the following
tasks:
We suggest that new users run through the first tutorial to familiarise themselves
with the GenStat interface.
CONTEXT SENSITIVE HELPIn any GenStat text window, highlight any word or phrase for which you would like
1 Getting Started – Screen Tour
2 Importing data from Excel®
3 Importing data from Access® via ODBC
4 Linear Regression
5 Analysis of Variance
6 - Documentation & Help
19
Figure 6.1:The HELP
menu.
Figure 6.2: Contextsensitive help.
some additional information. Press the F1 key on your keyboard and the contextsensitive help facility will take you to the appropriate section of the GenStat Helpsystem.The Help system includes details on GenStat facilities plus a glossary ofcommon statistical terms.Where more than one Help entry applies, GenStat willdisplay all entries (Figure 6.2).
GENSTAT COMMAND LANGUAGE HELPIn addition to the online Help facilities, GenStat offers further help specificallyaimed at assisting you to use the GenStat command language to its full potential:
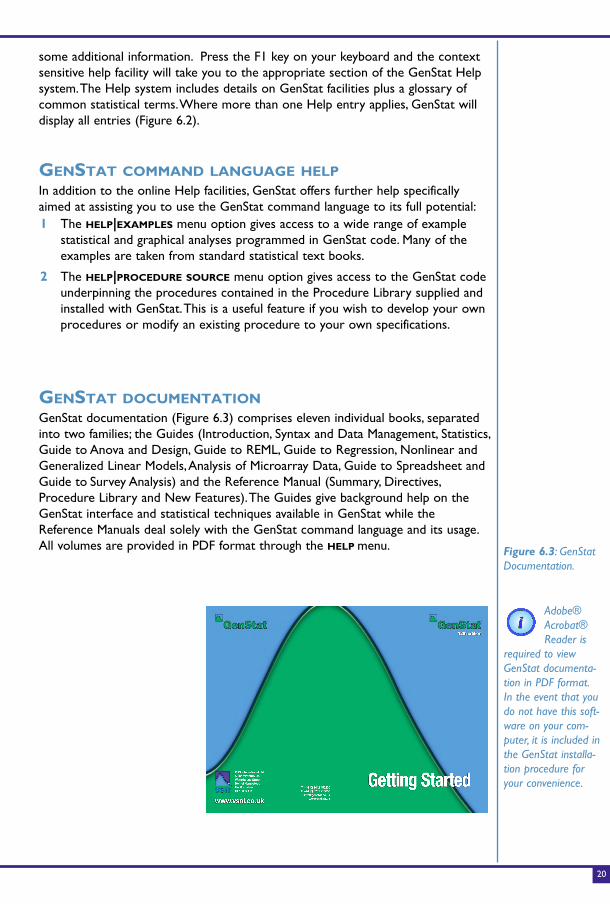
GENSTAT DOCUMENTATIONGenStat documentation (Figure 6.3) comprises eleven individual books, separatedinto two families; the Guides (Introduction, Syntax and Data Management, Statistics,Guide to Anova and Design, Guide to REML, Guide to Regression, Nonlinear andGeneralized Linear Models,Analysis of Microarray Data, Guide to Spreadsheet andGuide to Survey Analysis) and the Reference Manual (Summary, Directives,Procedure Library and New Features).The Guides give background help on theGenStat interface and statistical techniques available in GenStat while theReference Manuals deal solely with the GenStat command language and its usage.All volumes are provided in PDF format through the HELP menu.
1 The HELP|EXAMPLES menu option gives access to a wide range of examplestatistical and graphical analyses programmed in GenStat code. Many of theexamples are taken from standard statistical text books.
2 The HELP|PROCEDURE SOURCE menu option gives access to the GenStat codeunderpinning the procedures contained in the Procedure Library supplied andinstalled with GenStat.This is a useful feature if you wish to develop your ownprocedures or modify an existing procedure to your own specifications.
20
Figure 6.3: GenStatDocumentation.
Adobe®Acrobat®Reader is
required to viewGenStat documenta-tion in PDF format.In the event that youdo not have this soft-ware on your com-puter, it is included inthe GenStat installa-tion procedure foryour convenience.
There is rich functionality in GenStat.To help you realise its full benefits,VSNi offer
a range of training solutions.
TRAINING COURSESVSNi offers a range of courses in both software specific and statistics based
subjects.
BESPOKE TRAININGYou may not think it but often a bespoke course, workshop or seminar offers the
best value for money; particularly for small or large groups.We build the sessions
totally around your needs and crucially, your experience.
1:1 COACHINGIf the course you need is not available at a date to suit you, why not contact us to
arrange some 1:1 GenStat coaching?
GENSTAT TRAINERSVSNi trainers don't just know the software; they all have strong statistical
backgrounds.Add in their expert training skills and all the essential elements are
there for you to maximise your learning potential.
In addition to our own training staff, VSNi works closely with other external
certified trainers.These are trainers who have been observed training by us and
given the VSN seal of approval.When choosing to train with a certified trainer you
can rest assured that not only does your trainer have a sound knowledge of
GenStat and statistics - but they also appreciate how people learn.This is vital in
helping you optimize your learning potential.
The first step is to establish your particular training requirement; we can help here
too.Why not contact the Training Team at [email protected] for an informal
discussion about your training need?
CONSULTANCYHaving problems deciding the best statistical approach to fully understand your
data? Would a customised GenStat menu or additional GenStat functionality be
helpful within your organisation?
Why not contact the VSNi Consultancy Team at [email protected] to see
how our statisticians and development team can help.
7 - Training & Support
21
VSNi offer an annual Technical Support and Maintenance policy to GenStat users.
Supported users can take advantage of the following features.
All email correspondence with VSNi should be sent to [email protected].
Alternatively you can telephone +44 (0)1442 450230.This will ensure that your call
is officially logged and tracked.
To subscribe to the GenStat Technical Support and Maintenance policy, please
contact [email protected].
1 Automatic upgrades to new versions of GenStat.
2 Access to technical support from the GenStat development team.
3 Two additional license keys for GenStat; one for a laptop PC and one for a
home desktop PC.This allows much greater flexibility in where you work.
4 In the event that your PC is upgraded, replaced or stolen,VSNi will issue you
with a replacement license, free of charge. Non-supported users are entitled
to one free replacement key per version.Thereafter, a £50 administration fee is
levvied for each replacement key requested.
22
SUPPORT
CONTACTS
VSN International Ltd
5 The Waterhouse,Waterhouse Street,
Hemel Hempstead, Hertfordshire, HP1 1ES, UK.
t: +44 (0) 1442 450230
f: +44 (0) 8701 215653
w: www.vsni.co.uk