Embed Size (px)
Citation preview
Caballero et al. BMC Genomics 2013, 14:528http://www.biomedcentral.com/1471-2164/14/528
RESEARCH ARTICLE Open Access
Genomic distribution of AFLP markers relative togene locations for different eukaryotic speciesArmando Caballero*, María Jesús García-Pereira and Humberto Quesada
Abstract
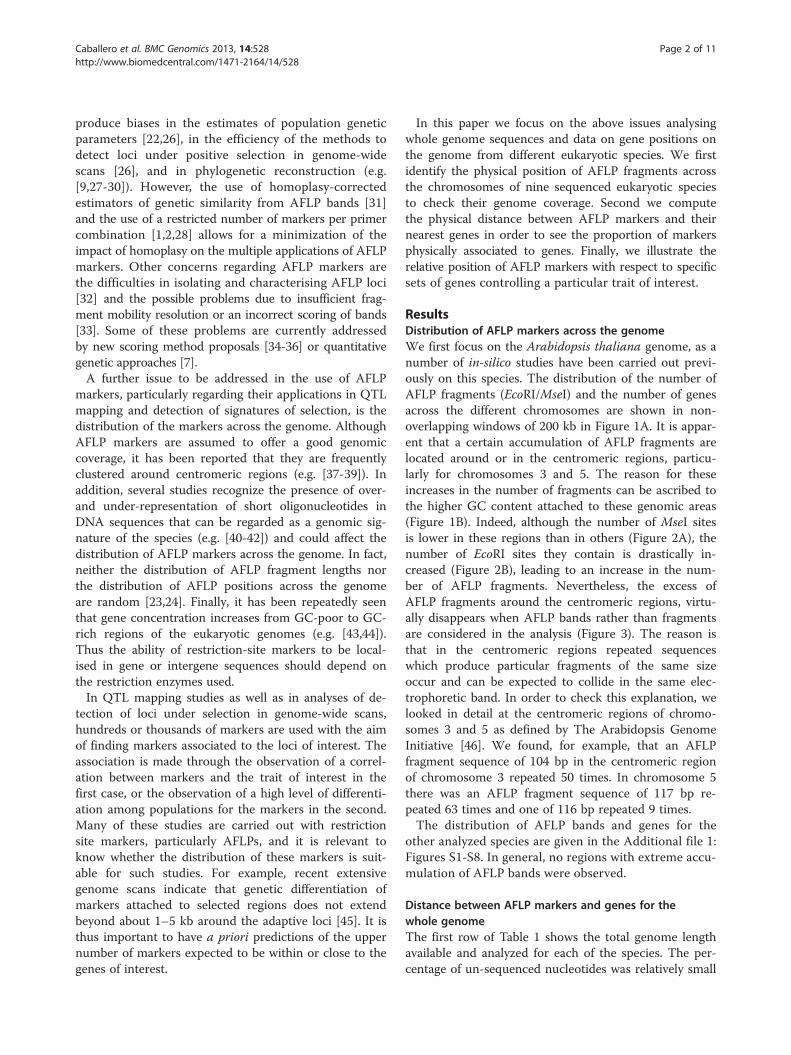
Background: Amplified fragment length polymorphism (AFLP) markers are frequently used for a wide range ofstudies, such as genome-wide mapping, population genetic diversity estimation, hybridization and introgressionstudies, phylogenetic analyses, and detection of signatures of selection. An important issue to be addressed forsome of these fields is the distribution of the markers across the genome, particularly in relation to gene sequences.
Results: Using in-silico restriction fragment analysis of the genomes of nine eukaryotic species we characterise thedistribution of AFLP fragments across the genome and, particularly, in relation to gene locations. First, we identifythe physical position of markers across the chromosomes of all species. An observed accumulation of fragmentsaround (peri) centromeric regions in some species is produced by repeated sequences, and this accumulationdisappears when AFLP bands rather than fragments are considered. Second, we calculate the percentage of AFLPmarkers positioned within gene sequences. For the typical EcoRI/MseI enzyme pair, this ranges between 28 and87% and is usually larger than that expected by chance because of the higher GC content of gene sequencesrelative to intergenic ones. In agreement with this, the use of enzyme pairs with GC-rich restriction sitessubstantially increases the above percentages. For example, using the enzyme system SacI/HpaII, 86% of AFLPmarkers are located within gene sequences in A. thaliana, and 100% of markers in Plasmodium falciparun. Wefurther find that for a typical trait controlled by 50 genes of average size, if 1000 AFLPs are used in a study, thenumber of those within 1 kb distance from any of the genes would be only about 1–2, and only about 50% of thegenes would have markers within that distance.
Conclusions: The high coverage of AFLP markers across the genomes and the high proportion of markers withinor close to gene sequences make them suitable for genome scans and detecting large islands of differentiation inthe genome. However, for specific traits, the percentage of AFLP markers close to genes can be rather small.Therefore, genome scans directed towards the search of markers closely linked to selected loci can be a difficulttask in many instances.
Keywords: AFLP, Candidate genes, Genome scans, Genomic signature, Restriction-site markers
BackgroundAmplified fragment length polymorphisms (AFLP; [1])are extensively used in evolutionary, population geneticsand conservation studies on plants, animals and micro-organisms [2,3]. Applications of these markers are par-ticularly useful in non-model species for which no priorDNA sequence is available, and where other alternativewide-genome markers, such as SNPs, are difficult to ob-tain. AFLP markers are also very useful because of theirlow cost relative to other markers [4]. Thus, AFLP
* Correspondence: [email protected] de Bioquímica, Genética e Inmunología, Facultad de Biología,Universidade de Vigo, 36310, Vigo, Spain
© 2013 Caballero et al.; licensee BioMed CentrCommons Attribution License (http://creativecreproduction in any medium, provided the or
markers have been used for a wide range of objectives,such as genome-wide mapping (e.g. [5]), population gen-etic diversity estimation, hybridization and introgressionstudies (e.g. [6-8]), phylogenetic analyses (e.g. [9-11])and detection of signatures of selection (e.g. [12-17]).More recently, restriction site associated DNA markers(RAD; [18,19]) have been suggested as an alternative toolfor some of the above objectives, although importantproblems also affect this type of marker [20,21].Several concerns regarding the application of AFLP
markers have been addressed and discussed in the re-cent years. One is the possible lack of homology due tofragment size homoplasy [16,22-25]. Homoplasy may
al Ltd. This is an Open Access article distributed under the terms of the Creativeommons.org/licenses/by/2.0), which permits unrestricted use, distribution, andiginal work is properly cited.
Caballero et al. BMC Genomics 2013, 14:528 Page 2 of 11http://www.biomedcentral.com/1471-2164/14/528
produce biases in the estimates of population geneticparameters [22,26], in the efficiency of the methods todetect loci under positive selection in genome-widescans [26], and in phylogenetic reconstruction (e.g.[9,27-30]). However, the use of homoplasy-correctedestimators of genetic similarity from AFLP bands [31]and the use of a restricted number of markers per primercombination [1,2,28] allows for a minimization of theimpact of homoplasy on the multiple applications of AFLPmarkers. Other concerns regarding AFLP markers arethe difficulties in isolating and characterising AFLP loci[32] and the possible problems due to insufficient frag-ment mobility resolution or an incorrect scoring of bands[33]. Some of these problems are currently addressedby new scoring method proposals [34-36] or quantitativegenetic approaches [7].A further issue to be addressed in the use of AFLP
markers, particularly regarding their applications in QTLmapping and detection of signatures of selection, is thedistribution of the markers across the genome. AlthoughAFLP markers are assumed to offer a good genomiccoverage, it has been reported that they are frequentlyclustered around centromeric regions (e.g. [37-39]). Inaddition, several studies recognize the presence of over-and under-representation of short oligonucleotides inDNA sequences that can be regarded as a genomic sig-nature of the species (e.g. [40-42]) and could affect thedistribution of AFLP markers across the genome. In fact,neither the distribution of AFLP fragment lengths northe distribution of AFLP positions across the genomeare random [23,24]. Finally, it has been repeatedly seenthat gene concentration increases from GC-poor to GC-rich regions of the eukaryotic genomes (e.g. [43,44]).Thus the ability of restriction-site markers to be local-ised in gene or intergene sequences should depend onthe restriction enzymes used.In QTL mapping studies as well as in analyses of de-
tection of loci under selection in genome-wide scans,hundreds or thousands of markers are used with the aimof finding markers associated to the loci of interest. Theassociation is made through the observation of a correl-ation between markers and the trait of interest in thefirst case, or the observation of a high level of differenti-ation among populations for the markers in the second.Many of these studies are carried out with restrictionsite markers, particularly AFLPs, and it is relevant toknow whether the distribution of these markers is suit-able for such studies. For example, recent extensivegenome scans indicate that genetic differentiation ofmarkers attached to selected regions does not extendbeyond about 1–5 kb around the adaptive loci [45]. It isthus important to have a priori predictions of the uppernumber of markers expected to be within or close to thegenes of interest.
In this paper we focus on the above issues analysingwhole genome sequences and data on gene positions onthe genome from different eukaryotic species. We firstidentify the physical position of AFLP fragments acrossthe chromosomes of nine sequenced eukaryotic speciesto check their genome coverage. Second we computethe physical distance between AFLP markers and theirnearest genes in order to see the proportion of markersphysically associated to genes. Finally, we illustrate therelative position of AFLP markers with respect to specificsets of genes controlling a particular trait of interest.
ResultsDistribution of AFLP markers across the genomeWe first focus on the Arabidopsis thaliana genome, as anumber of in-silico studies have been carried out previ-ously on this species. The distribution of the number ofAFLP fragments (EcoRI/MseI) and the number of genesacross the different chromosomes are shown in non-overlapping windows of 200 kb in Figure 1A. It is appar-ent that a certain accumulation of AFLP fragments arelocated around or in the centromeric regions, particu-larly for chromosomes 3 and 5. The reason for theseincreases in the number of fragments can be ascribed tothe higher GC content attached to these genomic areas(Figure 1B). Indeed, although the number of MseI sitesis lower in these regions than in others (Figure 2A), thenumber of EcoRI sites they contain is drastically in-creased (Figure 2B), leading to an increase in the num-ber of AFLP fragments. Nevertheless, the excess ofAFLP fragments around the centromeric regions, virtu-ally disappears when AFLP bands rather than fragmentsare considered in the analysis (Figure 3). The reason isthat in the centromeric regions repeated sequenceswhich produce particular fragments of the same sizeoccur and can be expected to collide in the same elec-trophoretic band. In order to check this explanation, welooked in detail at the centromeric regions of chromo-somes 3 and 5 as defined by The Arabidopsis GenomeInitiative [46]. We found, for example, that an AFLPfragment sequence of 104 bp in the centromeric regionof chromosome 3 repeated 50 times. In chromosome 5there was an AFLP fragment sequence of 117 bp re-peated 63 times and one of 116 bp repeated 9 times.The distribution of AFLP bands and genes for the
other analyzed species are given in the Additional file 1:Figures S1-S8. In general, no regions with extreme accu-mulation of AFLP bands were observed.
Distance between AFLP markers and genes for thewhole genomeThe first row of Table 1 shows the total genome lengthavailable and analyzed for each of the species. The per-centage of un-sequenced nucleotides was relatively small
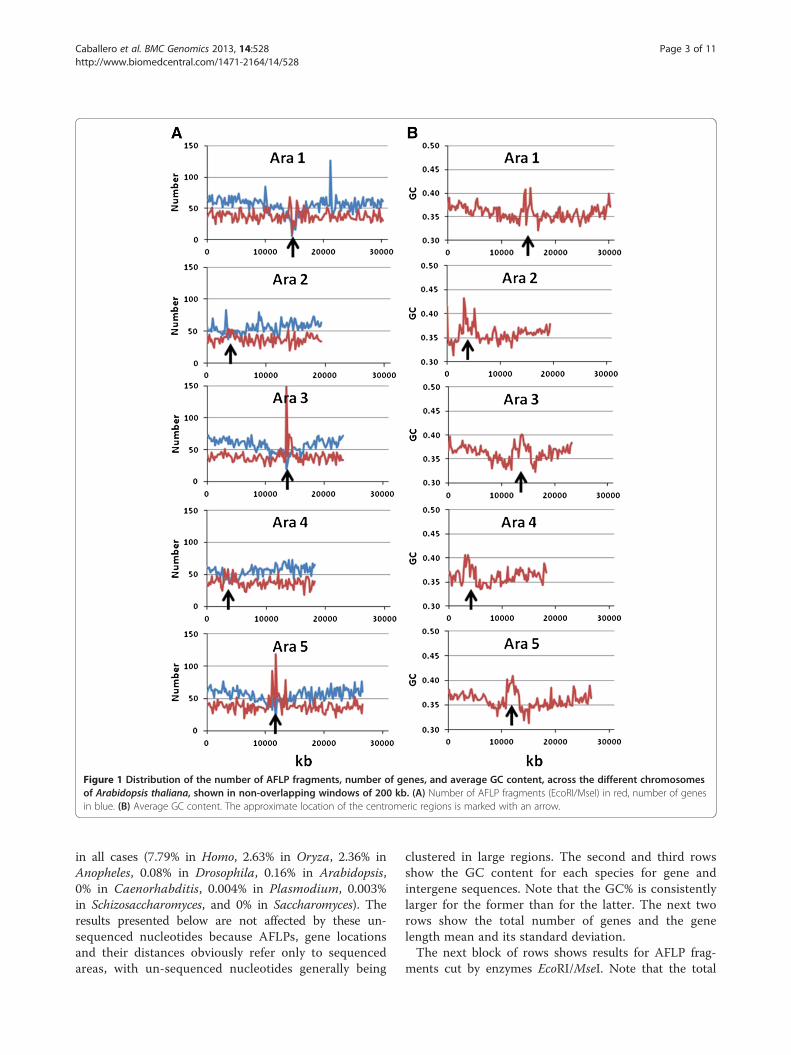
Figure 1 Distribution of the number of AFLP fragments, number of genes, and average GC content, across the different chromosomesof Arabidopsis thaliana, shown in non-overlapping windows of 200 kb. (A) Number of AFLP fragments (EcoRI/MseI) in red, number of genesin blue. (B) Average GC content. The approximate location of the centromeric regions is marked with an arrow.
Caballero et al. BMC Genomics 2013, 14:528 Page 3 of 11http://www.biomedcentral.com/1471-2164/14/528
in all cases (7.79% in Homo, 2.63% in Oryza, 2.36% inAnopheles, 0.08% in Drosophila, 0.16% in Arabidopsis,0% in Caenorhabditis, 0.004% in Plasmodium, 0.003%in Schizosaccharomyces, and 0% in Saccharomyces). Theresults presented below are not affected by these un-sequenced nucleotides because AFLPs, gene locationsand their distances obviously refer only to sequencedareas, with un-sequenced nucleotides generally being
clustered in large regions. The second and third rowsshow the GC content for each species for gene andintergene sequences. Note that the GC% is consistentlylarger for the former than for the latter. The next tworows show the total number of genes and the genelength mean and its standard deviation.The next block of rows shows results for AFLP frag-
ments cut by enzymes EcoRI/MseI. Note that the total

Figure 2 Distribution of the number of MseI (A) and EcoRI (B) cutting sites across the different chromosomes of Arabidopsis thaliana,shown in non-overlapping windows of 200 kb. The approximate location of the centromeric regions is marked with an arrow.
Caballero et al. BMC Genomics 2013, 14:528 Page 4 of 11http://www.biomedcentral.com/1471-2164/14/528
number of AFLP fragments is generally larger than thenumber of genes for species with large genome sizes,but the mean distance between AFLPs is relatively uni-form across all species, with most values ranging be-tween about 4 and 8 kb.Next, the table presents the percentage of AFLP frag-
ments positioned at a given physical distance from the
closest gene. AFLP markers at a 0 kb distance fromgenes refer to those within the gene sequence or over-lapping it. The expected value of this percentage ifAFLP fragments were randomly positioned in the gen-ome is shown in parenthesis. This expectation is simplycalculated as the percentage of the sequenced genomecovered by all gene sequences. For 6 out of 9 species
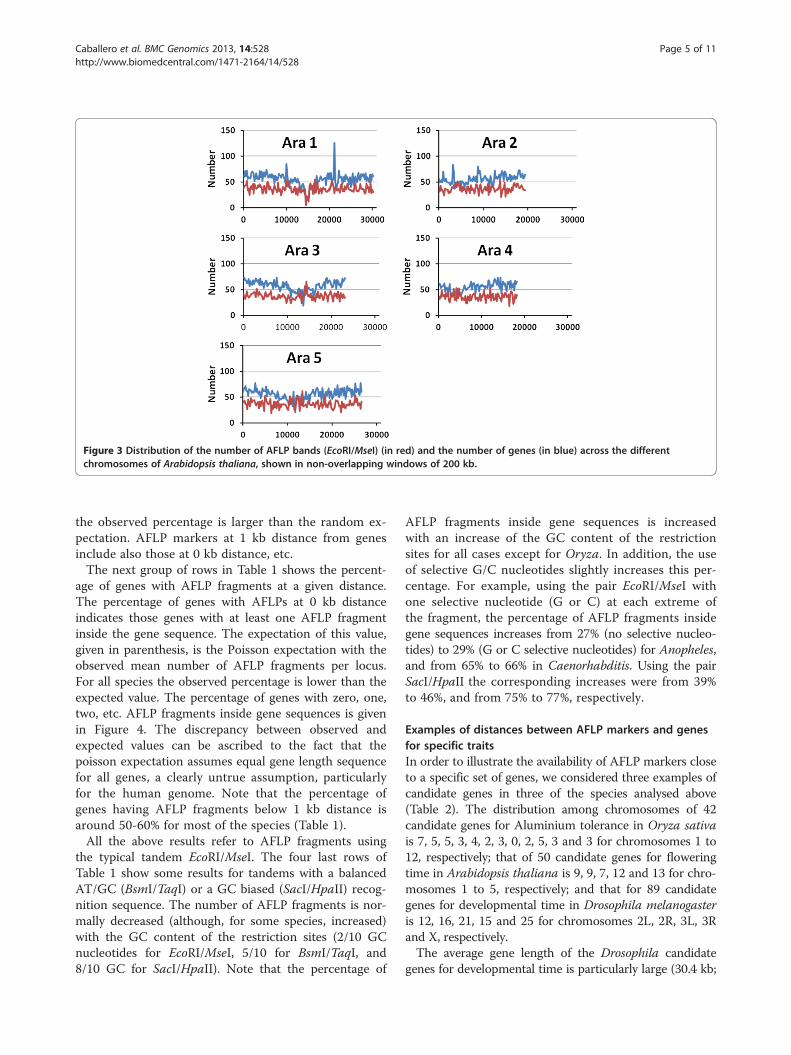
Figure 3 Distribution of the number of AFLP bands (EcoRI/MseI) (in red) and the number of genes (in blue) across the differentchromosomes of Arabidopsis thaliana, shown in non-overlapping windows of 200 kb.
Caballero et al. BMC Genomics 2013, 14:528 Page 5 of 11http://www.biomedcentral.com/1471-2164/14/528
the observed percentage is larger than the random ex-pectation. AFLP markers at 1 kb distance from genesinclude also those at 0 kb distance, etc.The next group of rows in Table 1 shows the percent-
age of genes with AFLP fragments at a given distance.The percentage of genes with AFLPs at 0 kb distanceindicates those genes with at least one AFLP fragmentinside the gene sequence. The expectation of this value,given in parenthesis, is the Poisson expectation with theobserved mean number of AFLP fragments per locus.For all species the observed percentage is lower than theexpected value. The percentage of genes with zero, one,two, etc. AFLP fragments inside gene sequences is givenin Figure 4. The discrepancy between observed andexpected values can be ascribed to the fact that thepoisson expectation assumes equal gene length sequencefor all genes, a clearly untrue assumption, particularlyfor the human genome. Note that the percentage ofgenes having AFLP fragments below 1 kb distance isaround 50-60% for most of the species (Table 1).All the above results refer to AFLP fragments using
the typical tandem EcoRI/MseI. The four last rows ofTable 1 show some results for tandems with a balancedAT/GC (BsmI/TaqI) or a GC biased (SacI/HpaII) recog-nition sequence. The number of AFLP fragments is nor-mally decreased (although, for some species, increased)with the GC content of the restriction sites (2/10 GCnucleotides for EcoRI/MseI, 5/10 for BsmI/TaqI, and8/10 GC for SacI/HpaII). Note that the percentage of
AFLP fragments inside gene sequences is increasedwith an increase of the GC content of the restrictionsites for all cases except for Oryza. In addition, the useof selective G/C nucleotides slightly increases this per-centage. For example, using the pair EcoRI/MseI withone selective nucleotide (G or C) at each extreme ofthe fragment, the percentage of AFLP fragments insidegene sequences increases from 27% (no selective nucleo-tides) to 29% (G or C selective nucleotides) for Anopheles,and from 65% to 66% in Caenorhabditis. Using the pairSacI/HpaII the corresponding increases were from 39%to 46%, and from 75% to 77%, respectively.
Examples of distances between AFLP markers and genesfor specific traitsIn order to illustrate the availability of AFLP markers closeto a specific set of genes, we considered three examples ofcandidate genes in three of the species analysed above(Table 2). The distribution among chromosomes of 42candidate genes for Aluminium tolerance in Oryza sativais 7, 5, 5, 3, 4, 2, 3, 0, 2, 5, 3 and 3 for chromosomes 1 to12, respectively; that of 50 candidate genes for floweringtime in Arabidopsis thaliana is 9, 9, 7, 12 and 13 for chro-mosomes 1 to 5, respectively; and that for 89 candidategenes for developmental time in Drosophila melanogasteris 12, 16, 21, 15 and 25 for chromosomes 2L, 2R, 3L, 3Rand X, respectively.The average gene length of the Drosophila candidate
genes for developmental time is particularly large (30.4 kb;
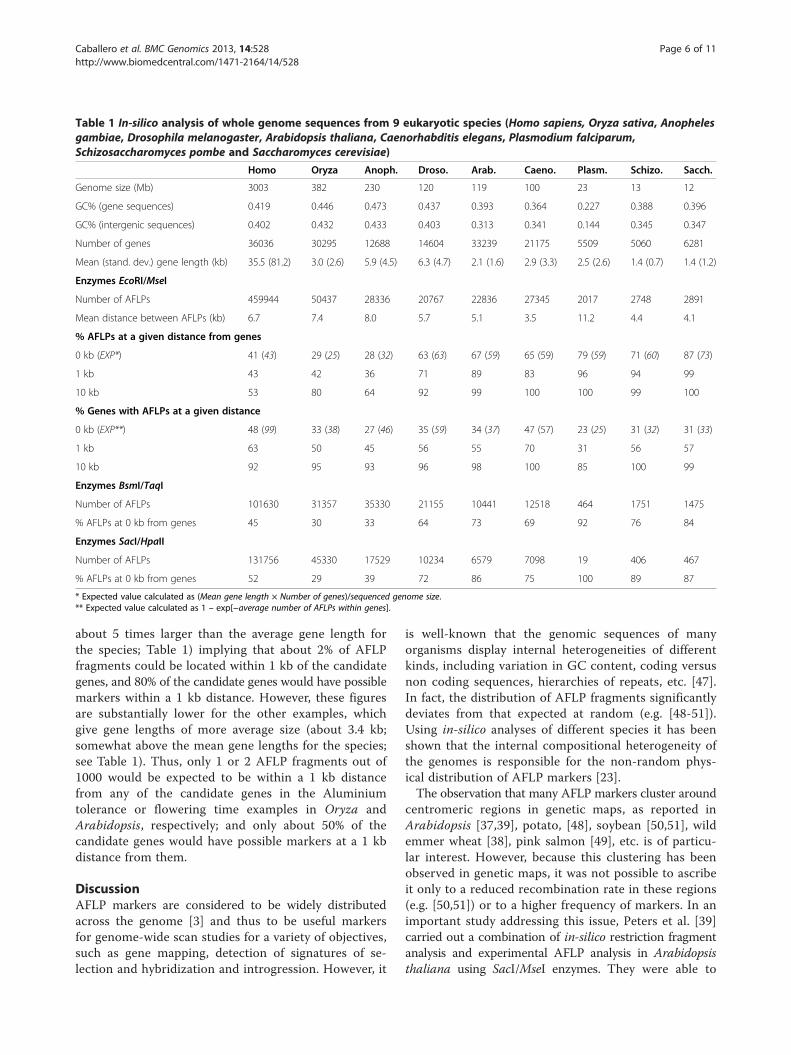
Table 1 In-silico analysis of whole genome sequences from 9 eukaryotic species (Homo sapiens, Oryza sativa, Anophelesgambiae, Drosophila melanogaster, Arabidopsis thaliana, Caenorhabditis elegans, Plasmodium falciparum,Schizosaccharomyces pombe and Saccharomyces cerevisiae)
Homo Oryza Anoph. Droso. Arab. Caeno. Plasm. Schizo. Sacch.
Genome size (Mb) 3003 382 230 120 119 100 23 13 12
GC% (gene sequences) 0.419 0.446 0.473 0.437 0.393 0.364 0.227 0.388 0.396
GC% (intergenic sequences) 0.402 0.432 0.433 0.403 0.313 0.341 0.144 0.345 0.347
Number of genes 36036 30295 12688 14604 33239 21175 5509 5060 6281
Mean (stand. dev.) gene length (kb) 35.5 (81.2) 3.0 (2.6) 5.9 (4.5) 6.3 (4.7) 2.1 (1.6) 2.9 (3.3) 2.5 (2.6) 1.4 (0.7) 1.4 (1.2)
Enzymes EcoRI/MseI
Number of AFLPs 459944 50437 28336 20767 22836 27345 2017 2748 2891
Mean distance between AFLPs (kb) 6.7 7.4 8.0 5.7 5.1 3.5 11.2 4.4 4.1
% AFLPs at a given distance from genes
0 kb (EXP*) 41 (43) 29 (25) 28 (32) 63 (63) 67 (59) 65 (59) 79 (59) 71 (60) 87 (73)
1 kb 43 42 36 71 89 83 96 94 99
10 kb 53 80 64 92 99 100 100 99 100
% Genes with AFLPs at a given distance
0 kb (EXP**) 48 (99) 33 (38) 27 (46) 35 (59) 34 (37) 47 (57) 23 (25) 31 (32) 31 (33)
1 kb 63 50 45 56 55 70 31 56 57
10 kb 92 95 93 96 98 100 85 100 99
Enzymes BsmI/TaqI
Number of AFLPs 101630 31357 35330 21155 10441 12518 464 1751 1475
% AFLPs at 0 kb from genes 45 30 33 64 73 69 92 76 84
Enzymes SacI/HpaII
Number of AFLPs 131756 45330 17529 10234 6579 7098 19 406 467
% AFLPs at 0 kb from genes 52 29 39 72 86 75 100 89 87
* Expected value calculated as (Mean gene length × Number of genes)/sequenced genome size.** Expected value calculated as 1 – exp[−average number of AFLPs within genes].
Caballero et al. BMC Genomics 2013, 14:528 Page 6 of 11http://www.biomedcentral.com/1471-2164/14/528
about 5 times larger than the average gene length forthe species; Table 1) implying that about 2% of AFLPfragments could be located within 1 kb of the candidategenes, and 80% of the candidate genes would have possiblemarkers within a 1 kb distance. However, these figuresare substantially lower for the other examples, whichgive gene lengths of more average size (about 3.4 kb;somewhat above the mean gene lengths for the species;see Table 1). Thus, only 1 or 2 AFLP fragments out of1000 would be expected to be within a 1 kb distancefrom any of the candidate genes in the Aluminiumtolerance or flowering time examples in Oryza andArabidopsis, respectively; and only about 50% of thecandidate genes would have possible markers at a 1 kbdistance from them.
DiscussionAFLP markers are considered to be widely distributedacross the genome [3] and thus to be useful markersfor genome-wide scan studies for a variety of objectives,such as gene mapping, detection of signatures of se-lection and hybridization and introgression. However, it
is well-known that the genomic sequences of manyorganisms display internal heterogeneities of differentkinds, including variation in GC content, coding versusnon coding sequences, hierarchies of repeats, etc. [47].In fact, the distribution of AFLP fragments significantlydeviates from that expected at random (e.g. [48-51]).Using in-silico analyses of different species it has beenshown that the internal compositional heterogeneity ofthe genomes is responsible for the non-random phys-ical distribution of AFLP markers [23].The observation that many AFLP markers cluster around
centromeric regions in genetic maps, as reported inArabidopsis [37,39], potato, [48], soybean [50,51], wildemmer wheat [38], pink salmon [49], etc. is of particu-lar interest. However, because this clustering has beenobserved in genetic maps, it was not possible to ascribeit only to a reduced recombination rate in these regions(e.g. [50,51]) or to a higher frequency of markers. In animportant study addressing this issue, Peters et al. [39]carried out a combination of in-silico restriction fragmentanalysis and experimental AFLP analysis in Arabidopsisthaliana using SacI/MseI enzymes. They were able to
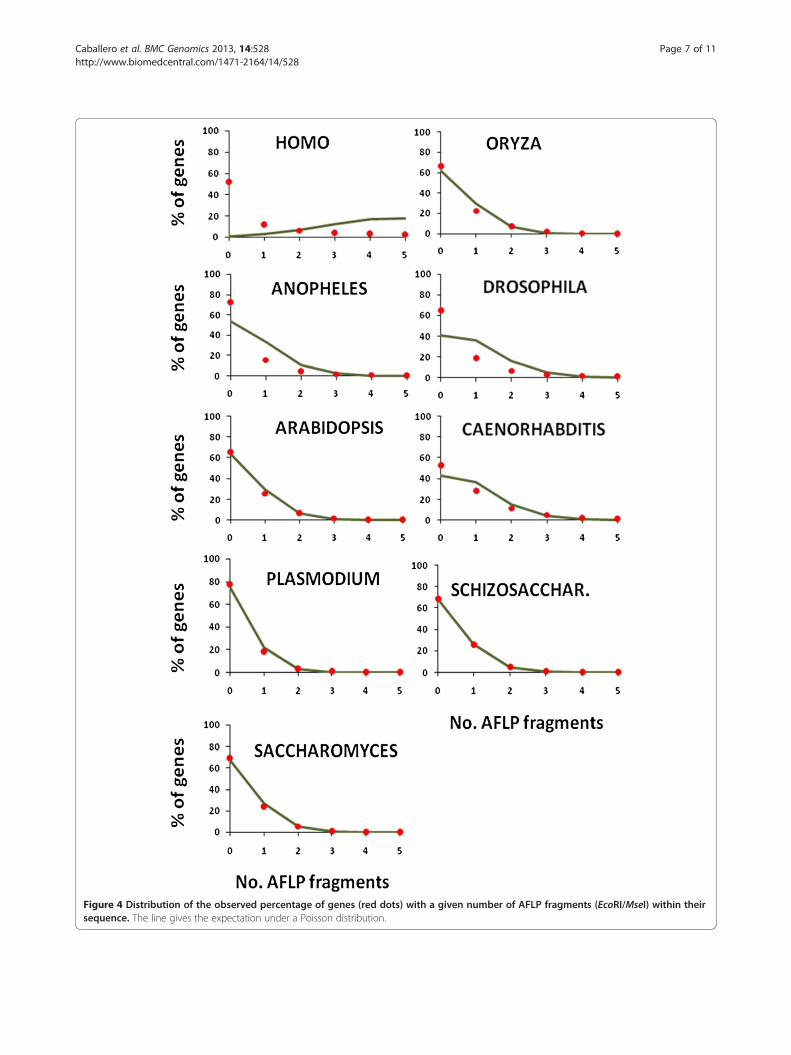
Figure 4 Distribution of the observed percentage of genes (red dots) with a given number of AFLP fragments (EcoRI/MseI) within theirsequence. The line gives the expectation under a Poisson distribution.
Caballero et al. BMC Genomics 2013, 14:528 Page 7 of 11http://www.biomedcentral.com/1471-2164/14/528

Table 2 In-silico analysis of candidate genes forAluminium tolerance (AL) in Oryza sativa, developmentaltime (DT) in Drosophila melanogaster, and flowering time(FT) in Arabidopsis thaliana
Oryza(AL)
Droso(DT)
Arab(FT)
Number of candidate genes 42 89 50
Mean (stand. dev.) gene length (kb) 3.4 (2.0) 30.4 (30.2) 3.4 (1.8)
% AFLPs at a given distance fromgenes
0 kb (EXP*) 0.06 (0.04) 1.89 (2.05) 0.14(0.14)
1 kb 0.09 2.02 0.24
10 kb 0.30 3.32 0.95
100 kb 2.39 14.73 7.51
% Genes with AFLPs at a givendistance
0 kb (EXP**) 43 (50) 73 (99) 34 (47)
1 kb 57 80 55
10 kb 86 99 98
100 kb 100 100 100
* Expected value calculated as (Mean gene length × Number of candidategenes)/sequenced genome size.** Expected value calculated as 1 – exp[−average number of AFLPs withincandidate genes].
Caballero et al. BMC Genomics 2013, 14:528 Page 8 of 11http://www.biomedcentral.com/1471-2164/14/528
find the physical position of 1267 experimental AFLPmarkers in the genome, showing that 98.6% of the gen-ome is covered by AFLPs. They showed that a reducedrecombination rate in (peri) centromeric regions wasonly part of the explanation for the observed accumu-lation of AFLPs in these regions. In physical maps,there was still some agglomeration of empirical AFLPmarkers around centromeric regions. Nevertheless, Peterset al. [39] indicated that the occurrence of in-silicoAFLP fragments was not increased in the (peri) centro-meric regions, although this observation was not expli-citly shown in the article. Here we have revisited thepoint regarding the typical enzyme system EcoRI/MseIand found an increase in the number of AFLP markersin the (peri) centromeric regions of some chromosomes,particularly chromosomes 3 and 5 (Figure 1A). This wasshown to be both a consequence of the higher GC contentin these regions (Figure 1B and 2) and the presence ofsome repeated sequences which generate the same frag-ments. When AFLP bands rather than fragments areconsidered, which is more appropriate for an experi-mental setting, the (peri) centromeric agglomerationsof AFLP markers mostly disappear (Figure 3). Thus,AFLP markers do not particularly accumulate in someregions of the genome. However, in experimental ana-lyses, they still appear somewhat more frequently in the(peri) centromeric regions. Peters et al. [39] suggestedthat the explanation for this empirical observation may
be that the frequency of mutations is increased in theseregions. This is in fact a highly reasonable explanation,as it may be expected that the degree of polymorphismis larger in (peri) centromeric regions than in othercoding sequences, so that segregating AFLP markersare more likely to be found in the former. In summary,the observed accumulation of empirical AFLP markersin (peri) centromeric regions can be due to a reducedrecombination rate (for genetic maps; e.g. [50,51]) anda higher polymorphism (for genetic and physical maps[39]) in these regions. However, the physical distributionof AFLP markers, although non-random (e.g. [23,24]) hasa coverage wide enough so as to become useful markersin genome-scan studies.Regarding the location of AFLP markers relative to
gene positions, we have shown that for the EcoRI/MseIsystem the percentage of AFLP markers located withingene sequences ranges between 28% and 87% dependingon the species and it is somewhat larger than expectedby chance. The reason is likely to be that the GC con-tent for gene sequences is generally larger than forintergene sequences (e.g. [43,44,52]), and this increasesthe likelihood of enzyme cuts in the former. The use ofenzymes with a higher GC content (BseI/TaqI andSacI/HpaII) further increases this likelihood. It is re-markable that, for example, using the pair SacI/HpaIIin Arabidopsis, 86% of the 6579 possible AFLP frag-ments are located within gene sequences, rising to 95%for fragments located within 1 kb distance from genes.These results are in agreement with those of Arnoldet al. [21] in their analysis of the biases associated withRAD markers for the estimation of diversity. In theirstudy, in silico digestion of D. melanogaster genomesindicated that GC-rich recognition sequences appearmore frequently in exons, whereas AT-rich recognitionsequences appear disproportionately more in intronicand intergenic regions. Therefore, we can conclude thatusing enzymes with high GC content could be moreappropriate than enzymes with low GC content if theobjective is to get available markers as close as possibleto gene sequences.The number of AFLP fragments clearly depends on the
genome size, showing a rather linear relationship. Theregression of the number of AFLP markers (EcoRI/MseI)on genome size for the nine species analysed has a slopeof 152 markers per megabase with a squared correlationof R2 = 0.998. If the human genome is excluded in theanalysis, the slope is a bit lower, 125 markers permegabase, with R2 = 0.900. Thus, the density of AFLPmarkers is of about one AFLP per 7 kb. Using the en-zymes BsmI/TaqI and SacI/HpaII, the correspondingslopes (including all 9 species) are 31 (R2 = 0.908) and43 (R2 = 0.953) markers per megabase, respectively, im-plying densities of about one AFLP per 32 kb for BsmI/

Caballero et al. BMC Genomics 2013, 14:528 Page 9 of 11http://www.biomedcentral.com/1471-2164/14/528
TaqI and about one AFLP per 23 kb for SacI/HpaII.The corresponding densities in the genetic map varysubstantially among species. For example, in Oryza andArabidopsis 1 cM corresponds to about 200–250 kb onaverage [39,53]. Thus, with EcoRI/MseI it is expected to beabout 30 AFLPs per centimorgan for these species. How-ever, in Drosophila 1 cM corresponds to about 0.63 Mbof sequence on average, and in Humans 0.82 Mb [54].Thus, in these cases, there is an expected number ofabout 100 AFLPs per centimorgan. In general, therefore,the density of AFLP markers is relatively high, makingAFLP markers generally suitable for genome scans.When specific traits are considered, however, the per-
centage of AFLP markers within gene sequences or closeto them can be rather small. We have illustrated thiswith some examples in three of the species analysed(Table 2). The results show that, for a typical trait con-trolled by a few dozen of genes of the typical gene sizein the species, the number of AFLPs within 1 kb dis-tance from those genes can be of the order of 1–2 in anAFLP analysis involving 1000 markers. In addition, onlyabout 50% of the genes of interest would have markerswithin that distance. Thus, genome scans directed to-wards the search of markers closely associated to specificselected loci can be difficult depending on the situations.For example, genomic scans using molecular markers,such as AFLPs, are frequently used to infer adaptivepopulation divergence [55-57]. Some of the methodsused are based on the comparison between the observedlevels of differentiation in gene frequencies among sub-populations with those expected under a neutral modelof variation [58], with the objective of identifying thosemarkers (outliers) that deviate significantly from theneutral expectation (see, e.g. [56,59,60]). It is generallyassumed that local selection is extended over very smallchromosomal regions [61,62], and recent studies suggestthat genetic differentiation of markers attached to localadaptation genes does not extend beyond about 1–5 kbaround the adaptive loci [45,63,64]. In this situation, theprobability of finding markers closely associated withselective loci must be really low even in analyses involv-ing thousands of markers. However, regions of increaseddifferentiation (islands of differentiation; [45]) through“divergence hitchhiking” [65], in which strong divergentselection between diverging populations reduces geneexchange, can reach several megabases sequence size[65,66], and markers such as AFLPs can be appropriateto delineate these regions. In fact, analysis combiningQTL mapping and detection of selective loci using AFLPmarkers show that the distance between the outliermarkers and the nearest selected loci ranges 10–32 cM[65,67], which would imply physical distances in theorder of megabases. In addition, computer simulationsinvestigating the performance of methods in detecting
selective loci under divergent selection with markerssuch as AFLPs shows that, despite the methods havingsubstantial uncertainty, the average distance betweendetected outlier markers and true selective loci rangesbetween 7 and 18 cM [68], in agreement with empiricalobservations.
ConclusionsIn-silico AFLP analyses assessing the distribution ofAFLP markers across the genomes of nine eukaryoticspecies indicates that AFLP bands do not particularlyaccumulate around (peri) centromeric regions. The per-centage of AFLP markers positioned within gene se-quences is usually larger than that expected by chancebecause of their higher GC content relative to intergenesequences. In fact, the use of enzyme pairs recognizingrestriction sites with a larger GC content substantiallyincreases the above percentages. Thus, enzymes withhigh GC content recognition sites should be used if theinterest is to obtain markers within or close to genesequences. The high coverage of AFLP markers acrossthe genomes and the high proportion of markers withinor close to gene sequences make them suitable for genomescanning and identifying large islands of genomic differen-tiation. However, their use in the search for markersclosely linked to selected loci for specific traits can be adifficult task, as only a small percentage of markers areexpected to be close to particular genes of interest.
MethodsWhole genome sequences and data on gene positions onthe genome were obtained from 9 eukaryotic species(Homo sapiens, Oryza sativa, Anopheles gambiae, Dros-ophila melanogaster, Arabidopsis thaliana, Caenohabditiselegans, Plasmodium falciparum, Saccharomyces cerevisiaeand Schizosaccharomyces pombe) obtained from the NCBIEntrez Genome database. These species were chosen be-cause of their high coverage of genome sequencing, theirassignment of all sequences to chromosomal locations,and because they cover a wide spectrum of genome sizes.A computer program written in C [23] was used to simu-late the cutting of the whole genome with two restrictionenzymes so as to produce AFLP fragments. We mainlyconsidered the typical enzymes used in AFLP studies,EcoRI and MseI (cutting at sites GAATTC and TTAA,respectively), but analyses were also carried out withrestriction enzymes with a balanced AT/GC recognitionsequence (BsmI and TaqI, with sites GAATGC and TCGA,respectively) and with a biased GC composition (SacI andHpaII, with sites GAGCTC and CCGG, respectively). Onlyfragments EcoRI-MseI, BsmI-TaqI or SacI-HpaII with sizesbetween 40 and 440 nucleotides (which correspond toPCR fragments between 72 and 472 when the typicalprimers are added) were used to mimic the experimental
Caballero et al. BMC Genomics 2013, 14:528 Page 10 of 11http://www.biomedcentral.com/1471-2164/14/528
procedure used in AFLP studies. The distance in base-pairs between consecutive AFLP fragments and betweeneach AFLP fragment and its closest gene were recorded.In order to illustrate the number of AFLP markers clos-
est to specific sets of genes, three examples of candidateloci were analysed. These correspond to 46 candidategenes for Aluminium tolerance in Oryza sativa [53], 51candidate genes for flowering time in Arabidopsis thaliana[69], and 102 candidate genes for developmental timein Drosophila melanogaster [70]. The locations of thesecandidate genes were searched for in the GENBANK(Drosophila and Arabidopsis) and PLANTPAN (Oryza)databases, but only 42, 50 and 89 genes (respectively)were localised and considered in the analysis.
Additional file
Additional file 1: Distribution of the number of AFLP bands (EcoRI/MseI) (in red) and the number of genes (in blue) across the differentspecies, shown in non-overlapping windows of 100 or 200 kb. (S1)Homo sapiens (regions with no markers and genes denote unsequencedgenomic areas). (S2) Oryza sativa (regions with no markers and genesdenote unsequenced genomic areas). (S3) Anopheles gambiae. (S4)Drosophila melanogaster. (S5) Caenorhabditis elegans. (S6) Plasmodiumfalciparum. (S7) Schizosaccharomyces pombe. (S8) Saccharomycescerevisiae.
Competing interestsThe authors declare they have no competing interests.
Authors’ contributionsAll authors contributed to the design of the study and the writing of themanuscript. AC and MJGP carried out the computer analyses. All authorsread and approved the final manuscript.
Authors’ informationThe authors are members of the Population Genetics and CytogeneticsGroup of the University of Vigo (http://webs.uvigo.es/genxb2/).
AcknowledgementsWe thank Raquel Sampedro for technical assistance, Mark P. Simmons foruseful comments on the manuscript, and Ramón Fallon for Englishcorrections. This work was funded by the Ministerio de Economía yCompetitividad (CGL2012-39861-C02), the Xunta de Galicia (10PXIB310044PR, Grupos de Referencia Competitiva, 2010/80) and Fondos Feder:“Unha maneira de facer Europa”.
Received: 18 April 2013 Accepted: 30 July 2013Published: 1 August 2013
References1. Vos P, Hogers R, Bleeker M, Reijans M, van de Lee T, Hornes M, Frijters A,
Pot J, Peleman J, Kuiper M: AFLP: a new technique for DNA fingerprinting.Nucleic Acids Res 1995, 23(21):4407–4414.
2. Bonin A, Ehrich D, Manel S: Statistical analysis of amplified fragmentlength polymorphism data: a toolbox for molecular ecologists andevolutionists. Mol Ecol 2007, 16(18):3737–3758.
3. Meudt HM, Clarke AC: Almost forgotten or latest practice? AFLPapplications, analyses and advances. Trends Plant Sci 2007, 12(3):106–117.
4. Bensch S, Akesson M: Ten years of AFLP in ecology and evolution: why sofew animals? Mol Ecol 2005, 14(10):2899–2914.
5. Peters JL, Cnops G, Neyt P, Zethof J, Cornelis K, Van Lijsebettens M, Gerats T:An AFLP-based genome-wide mapping strategy. Theor Appl Genet 2004,108(2):321–327.
6. Gosset CC, Bierne N: Differential introgression from a sister speciesexplains high F(ST) outlier loci within a mussel species. J Evol Biol 2013,26(1):14–26.
7. Ley AC, Hardy OJ: Improving AFLP analysis of large-scale patterns ofgenetic variation - a case study with the Central African lianas Haumaniaspp (Marantaceae) showing interspecific gene flow. Mol Ecol 2013,22(7):1984–1997.
8. Hoffman J, Clark M, Amos W, Peck L: Widespread amplification ofamplified fragment length polymorphisms (AFLPs) in marine Antarcticanimals. Polar Biol 2012, 35(6):919–929.
9. Després L, Gielly L, Redoutet B, Taberlet P: Using AFLP to resolvephylogenetic relationships in a morphologically diversified plant speciescomplex when nuclear and chloroplast sequences fail to revealvariability. Mol Phylogenet Evol 2003, 27(2):185–196.
10. Koopman WJ: Phylogenetic signal in AFLP data sets. Syst Biol 2005,54(2):197–217.
11. Luo R, Hipp AL, Larget B: A Bayesian model of AFLP marker evolution andphylogenetic inference. Stat Appl Genet Mol Biol 2007, 6(1):11. Article 11.
12. Wilding C, Butlin R, Grahame J: Differential gene exchange betweenparapatric morphs of Littorina saxatilis detected using AFLP markers.J Evol Biol 2001, 14(4):611–619.
13. Bonin A, Taberlet P, Miaud C, Pompanon F: Explorative genome scan todetect candidate loci for adaptation along a gradient of altitude in thecommon frog (Rana temporaria). Mol Biol Evol 2006, 23(4):773–783.
14. Paris M, Despres L: Identifying insecticide resistance genes in mosquitoby combining AFLP genome scans and 454 pyrosequencing. Mol Ecol2012, 21(7):1672–1686.
15. Galindo J, Morán P, Rolán-Alvarez E: Comparing geographical geneticdifferentiation between candidate and noncandidate loci for adaptationstrengthens support for parallel ecological divergence in the marinesnail Littorina saxatilis. Mol Ecol 2009, 18(5):919–930.
16. Paris M, Boyer S, Bonin A, Collado A, David JP, Despres L: Genome scan in themosquito Aedes rusticus: population structure and detection of positiveselection after insecticide treatment. Mol Ecol 2010, 19(2):325–337.
17. Tice KA, Carlon DB: Can AFLP genome scans detect small islands ofdifferentiation? The case of shell sculpture variation in the periwinkleEchinolittorina hawaiiensis. J Evol Biol 2011, 24(8):1814–1825.
18. Miller MR, Dunham JP, Amores A, Cresko WA, Johnson EA: Rapid andcost-effective polymorphism identification and genotyping usingrestriction site associated DNA (RAD) markers. Genome Res 2007,17(2):240–248.
19. Rowe HC, Renaut S, Guggisberg A: RAD in the realm of next-generationsequencing technologies. Mol Ecol 2011, 20(17):3499–3502.
20. Gautier M, Gharbi K, Cezard T, Foucaud J, Kerdelhué C, Pudlo P, Cornuet JM,Estoup A: The effect of RAD allele dropout on the estimation of geneticvariation within and between populations. Mol Ecol 2012, 22(11):3165–3178.
21. Arnold B, Corbett-Detig RB, Hartl D, Bomblies K: RADseq underestimatesdiversity and introduces genealogical biases due to nonrandomhaplotype sampling. Mol Ecol 2013, 22(11):3179–3190.
22. Vekemans X, Beauwens T, Lemaire M, Roldán-Ruiz I: Data from amplifiedfragment length polymorphism (AFLP) markers show indication of sizehomoplasy and of a relationship between degree of homoplasy andfragment size. Mol Ecol 2002, 11(1):139–151.
23. Caballero A, Quesada H: Homoplasy and distribution of AFLP fragments:an analysis in silico of the genome of different species. Mol Biol Evol2010, 27(5):1139–1151.
24. Koopman WJ, Gort G: Significance tests and weighted values for AFLPsimilarities, based on Arabidopsis in silico AFLP fragment lengthdistributions. Genetics 2004, 167(4):1915–1928.
25. Gort G, Koopman WJ, Stein A: Fragment length distributions and collisionprobabilities for AFLP markers. Biometrics 2006, 62(4):1107–1115.
26. Caballero A, Quesada H, Rolán-Alvarez E: Impact of amplified fragmentlength polymorphism size homoplasy on the estimation of populationgenetic diversity and the detection of selective loci. Genetics 2008,179(1):539–554.
27. Simmons MP, Zhang LB, Webb CT, Müller K: A penalty of usinganonymous dominant markers (AFLPs, ISSRs, and RAPDs) forphylogenetic inference. Mol Phylogenet Evol 2007, 42(2):528–542.
28. García-Pereira MJ, Caballero A, Quesada H: Evaluating the relationshipbetween evolutionary divergence and phylogenetic accuracy in AFLPdata sets. Mol Biol Evol 2010, 27(5):988–1000.
Caballero et al. BMC Genomics 2013, 14:528 Page 11 of 11http://www.biomedcentral.com/1471-2164/14/528
29. García-Pereira MJ, Caballero A, Quesada H: The relative contribution ofband number to phylogenetic accuracy in AFLP data sets. J Evol Biol2011, 24(11):2346–2356.
30. García-Pereira MJ, Quesada H, Caballero A, Carvajal-Rodríguez A: AFLPMax:a user-friendly application for computing the optimal number ofamplified fragment length polymorphism markers needed inphylogenetic reconstruction. Mol Ecol Resour 2012, 12(3):566–569.
31. Gort G, van Hintum T, van Eeuwijk F: Homoplasy corrected estimation ofgenetic similarity from AFLP bands, and the effect of the number of bandson the precision of estimation. Theor Appl Genet 2009, 119(3):397–416.
32. Nunes VL, Beaumont MA, Butlin RK, Paulo OS: Challenges and pitfalls inthe characterization of anonymous outlier AFLP markers in non-modelspecies: lessons from an ocellated lizard genome scan. Heredity (Edinb)2012, 109(6):340–348.
33. Pompanon F, Bonin A, Bellemain E, Taberlet P: Genotyping errors: causes,consequences and solutions. Nat Rev Genet 2005, 6(11):847–859.
34. Holland BR, Clarke AC, Meudt HM: Optimizing automated AFLP scoringparameters to improve phylogenetic resolution. Syst Biol 2008, 57(3):347–366.
35. Whitlock R, Hipperson H, Mannarelli M, Butlin RK, Burke T: An objective,rapid and reproducible method for scoring AFLP peak-height data thatminimizes genotyping error. Mol Ecol Resour 2008, 8(4):725–735.
36. Kück P, Greve C, Misof B, Gimnich F: Automated masking of AFLP markersimproves reliability of phylogenetic analyses. PLoS One 2012, 7(11):e49119.
37. Alonso-Blanco C, Peeters AJ, Koornneef M, Lister C, Dean C, van den BoschN, Pot J, Kuiper MT: Development of an AFLP based linkage map of Ler,Col and Cvi Arabidopsis thaliana ecotypes and construction of a Ler/Cvirecombinant inbred line population. Plant J 1998, 14(2):259–271.
38. Peng J, Korol AB, Fahima T, Röder MS, Ronin YI, Li YC, Nevo E: Moleculargenetic maps in wild emmer wheat, Triticum dicoccoides: genome-widecoverage, massive negative interference, and putative quasi-linkage.Genome Res 2000, 10(10):1509–1531.
39. Peters JL, Constandt H, Neyt P, Cnops G, Zethof J, Zabeau M, Gerats T: Aphysical amplified fragment-length polymorphism map of Arabidopsis.Plant Physiol 2001, 127(4):1579–1589.
40. Karlin S, Burge C: Dinucleotide relative abundance extremes: a genomicsignature. Trends Genet 1995, 11(7):283–290.
41. Jernigan RW, Baran RH: Pervasive properties of the genomic signature.BMC Genomics 2002, 3(1):23.
42. Wang Y, Hill K, Singh S, Kari L: The spectrum of genomic signatures: fromdinucleotides to chaos game representation. Gene 2005, 346:173–185.
43. Bernardi G, Olofsson B, Filipski J, Zerial M, Salinas J, Cuny G, Meunier-RotivalM, Rodier F: The mosaic genome of warm-blooded vertebrates. Science1985, 228(4702):953–958.
44. Zoubak S, Clay O, Bernardi G: The gene distribution of the humangenome. Gene 1996, 174(1):95–102.
45. Turner TL, Bourne EC, Von Wettberg EJ, Hu TT, Nuzhdin SV: Populationresequencing reveals local adaptation of Arabidopsis lyrata toserpentine soils. Nat Genet 2010, 42(3):260–263.
46. Initiative AG: Analysis of the genome sequence of the flowering plantArabidopsis thaliana. Nature 2000, 408(6814):796–815.
47. Karlin S, Mrázek J, Campbell AM: Compositional biases of bacterial genomesand evolutionary implications. J Bacteriol 1997, 179(12):3899–3913.
48. Vaneck H, Vanddervoort J, Draaistra J, Vanzandvoort P, Vanenckevorte E,Segers B, Peleman J, Jacobsen E, Helder J, Bakker J: The Inheritance andchromosomal localization of AFLP markers in a noninbred potatooffspring. Mol Breed 1995, 1(4):397–410.
49. Lindner KR, Seeb JE, Habicht C, Knudsen KL, Kretschmer E, Reedy DJ, SpruellP, Allendorf FW: Gene-centromere mapping of 312 loci in pink salmon byhalf-tetrad analysis. Genome 2000, 43(3):538–549.
50. Keim P, Schupp J, Travis S, Clayton K, Zhu T, Shi L, Ferreira A, Webb D: Ahigh-density soybean genetic map based on AFLP markers. Crop Sci1997, 37(2):537–543.
51. Young W, Schupp J, Keim P: DNA methylation and AFLP marker distributionin the soybean genome. Theor Appl Genet 1999, 99(5):785–792.
52. Jabbari K, Bernardi G: Comparative genomics of Anopheles gambiae andDrosophila melanogaster. Gene 2004, 333:183–186.
53. Famoso AN, Zhao K, Clark RT, Tung CW, Wright MH, Bustamante C, KochianLV, McCouch SR: Genetic architecture of aluminum tolerance in rice(Oryza sativa) determined through genome-wide association analysisand QTL mapping. PLoS Genet 2011, 7(8):e1002221.
54. Beye M, Gattermeier I, Hasselmann M, Gempe T, Schioett M, Baines JF,Schlipalius D, Mougel F, Emore C, Rueppell O, et al: Exceptionally highlevels of recombination across the honey bee genome. Genome Res 2006,16(11):1339–1344.
55. Storz JF: Using genome scans of DNA polymorphism to infer adaptivepopulation divergence. Mol Ecol 2005, 14(3):671–688.
56. Butlin RK: Population genomics and speciation. Genetica 2010, 138(4):409–418.57. Nosil P, Feder JL: Genomic divergence during speciation: causes and
consequences. Philos Trans R Soc Lond B Biol Sci 2012, 367(1587):332–342.58. Lewontin RC, Krakauer J: Distribution of gene frequency as a test of the
theory of the selective neutrality of polymorphisms. Genetics 1973,74(1):175–195.
59. Nosil P, Funk DJ, Ortiz-Barrientos D: Divergent selection andheterogeneous genomic divergence. Mol Ecol 2009, 18(3):375–402.
60. Pérez-Figueroa A, García-Pereira MJ, Saura M, Rolán-Alvarez E, Caballero A:Comparing three different methods to detect selective loci usingdominant markers. J Evol Biol 2010, 23(10):2267–2276.
61. Charlesworth B, Nordborg M, Charlesworth D: The effects of localselection, balanced polymorphism and background selection onequilibrium patterns of genetic diversity in subdivided populations.Genet Res 1997, 70(2):155–174.
62. Feder JL, Nosil P: The efficacy of divergence hitchhiking in generatinggenomic islands during ecological speciation. Evolution 2010, 64(6):1729–1747.
63. Kolaczkowski B, Kern AD, Holloway AK, Begun DJ: Genomic differentiationbetween temperate and tropical Australian populations of Drosophilamelanogaster. Genetics 2011, 187(1):245–260.
64. Bierne N, Welch J, Loire E, Bonhomme F, David P: The coupling hypothesis:why genome scans may fail to map local adaptation genes. Mol Ecol2011, 20(10):2044–2072.
65. Via S: Divergence hitchhiking and the spread of genomic isolationduring ecological speciation-with-gene-flow. Philos Trans R Soc B - Biol Sci2012, 367(1587):451–460.
66. Renaut S, Maillet N, Normandeau E, Sauvage C, Derome N, Rogers SM,Bernatchez L: Genome-wide patterns of divergence during speciation:the lake whitefish case study. Philos Trans R Soc Lond B Biol Sci 2012, 367(1587):354–363.
67. Via S, West J: The genetic mosaic suggests a new role for hitchhiking inecological speciation. Mol Ecol 2008, 17(19):4334–4345.
68. Vilas A, Pérez-Figueroa A, Caballero A: A simulation study on theperformance of differentiation-based methods to detect selected lociusing linked neutral markers. J Evol Biol 2012, 25(7):1364–1376.
69. Ehrenreich IM, Hanzawa Y, Chou L, Roe JL, Kover PX, Purugganan MD:Candidate gene association mapping of Arabidopsis flowering time.Genetics 2009, 183(1):325–335.
70. Mensch J, Lavagnino N, Carreira VP, Massaldi A, Hasson E, Fanara JJ:Identifying candidate genes affecting developmental time in Drosophilamelanogaster: pervasive pleiotropy and gene-by-environmentinteraction. BMC Dev Biol 2008, 8:78.
doi:10.1186/1471-2164-14-528Cite this article as: Caballero et al.: Genomic distribution of AFLPmarkers relative to gene locations for different eukaryotic species. BMCGenomics 2013 14:528.
Submit your next manuscript to BioMed Centraland take full advantage of:
• Convenient online submission
• Thorough peer review
• No space constraints or color figure charges
• Immediate publication on acceptance
• Inclusion in PubMed, CAS, Scopus and Google Scholar
• Research which is freely available for redistribution
Submit your manuscript at www.biomedcentral.com/submit