Embed Size (px)
Citation preview
Genomic changes associated with somaclonal variation
in banana (Musa spp.)
• Thomas J. Oha,,
• Margaret A. Cullisa,
• Karl Kunertb,
• Iris Engelborghsc,
• Rony Swennenc
• Christopher A. Cullisa,d,*
aNovoMark Technologies Inc., PO Box 22584, Beachwood, OH 44122-0854, USA bForestry and Agricultural Biotechnology Institute & Botany Department, University of
Pretoria, Lunnon Road, Pretoria, South Africa cLaboratory of Tropical Crop Improvement, Division of Crop Biotechnics, Faculty of
Bioscience Engineering, Katholieke Universiteit Leuven, Kasteelpark Arenberg 13, B-
3001 Leuven, Belgium dDepartment of Biology, Case Western Reserve University, 10900 Euclid Avenue,
Cleveland, OH 44106-7080, USA
*e-mail: [email protected]
Present address: Institute of Paper Science and Technology at Georgia Institute of
Technology, 500 10th Street NW, Atlanta, GA 30332, USA
Received 8 August 2006; revised 19 October 2006
[Figures and Tables at the bottom of the document]
Abstract The molecular basis of somaclonal variation is not precisely known, but both genetic and
epigenetic mechanisms have been proposed. The available evidence points toward the
openUP (June 2007)
existence of labile portions of the genome that can be modulated when the cells undergo
the stress of tissue culture. Therefore, the hypothesis that there are identifiable and
predictable DNA markers for the early diagnosis of somaclonal variation has been tested.
Representational difference analysis was used to isolate unique fragments of DNA
(difference products) between visible culture-induced off-type and normal banana plants.
Markers generated from six difference products differentiated between some of the off-
type and normal pairs. The genomic region around one of these difference products has
been extensively characterized and has a high degree of polymorphism, with variation in
up to 10% of the nucleotides sequenced in the region. This same region has been shown
to vary in other pairs of off-type and normal banana plants derived from tissue culture as
well as in plants propagated commercially in vitro. The data are consistent with the
hypothesis that there is at least one particularly labile portion of the genome that is
especially susceptible to the stress imposed during tissue culture and that is associated
with higher rearrangement and mutation rates than other portions of the genome.
Consequently, the regions that are reported here have the potential to be used as early
detection tools for identifying somaclonal variants.
Introduction Somaclonal variation is the genetic variation that is observed when plants are regenerated
from cultured somatic cells. During the micropropagation of valuable elite clones, this
variation usually results in off-types that reduce the commercial value of resultant plants.
Genetically enhanced (transgenic) plants also need to be carefully screened to avoid
unwanted and unintended somaclonal variation. Various types of mutations have been
described in somaclonal variants, including point mutations, gene duplication,
chromosomal rearrangements, and chromosome number changes (Kaeppler et al. 2000,
Peschke and Phillips 1992, Phillips et al. 1994). Transposable element movement and
changes in DNA methylation (Koukalova et al. 2005, Kubis et al. 2003, Smulders et al.
1995), possibly through the function of small interfering RNA (Lippman et al. 2003),
have also been implicated as potential mechanisms behind some somaclonal variation.
The appearance of somaclonal variants may not be a process unique to in vitro
propagation but may occur naturally in plant somatic and reproductive tissues (Cullis
openUP (June 2007)
2005). The trigger for all these types of changes can be described as genomic shock or
plasticity, which occurs after the plant has exhausted its ordinary physiological responses
to environmental stress (Cullis 1999). This genomic shock response may be a radical, but
limited, genomic reorganization, which is an adaptive mechanism and can be activated
under stress. The occurrence of hotspots of mutation and recurring menus of alternative
alleles is consistent with this response being limited to a subfraction of the genome.
The sometimes massive but reproducible genetic changes observed with somaclonal
variation offers the possibility for identifying specific DNA variants (be they structural or
DNA modifications) that are associated with the release of this genetic variation.
Therefore, they can be used to monitor the genome through the process of in vitro
propagation. Such DNA markers could also be used to screen plants to determine the
possibility of their being true-to-type.
The clonal propagation of horticultural species and crops, such as bananas and oil palm,
is intended to produce chosen elite individuals in mass. Somaclonal variation is
problematic under these circumstances, where even a low percentage of off-types is
unacceptable for commercial use. A high percentage of off-types can be costly, as has
been proven in both the banana and oil palm industries (Larkin 2004). In a similar vein,
somaclonal variation can be problematic during the in vitro conservation of vegetatively
multiplied crops and the genetic modification of crops where hundreds of individual
transgenics would need to be exhaustively tested so that only proven elite individuals are
chosen to become commercial releases. Therefore, the early detection of somaclonal
variants is very useful in plant tissue culture and transformation studies.
A number of different molecular techniques are currently available to detect sequence
variation between closely related genomes such as those between source plants and
somaclones. These include random amplified polymorphic DNAs (RAPDs) and
amplified fragment length polymorphisms (AFLPs) (Labra et al. 2001, Linacero et al.
2000). Both techniques are useful in comparing the DNA from any number of different
samples for the differentiation of plants because of sequence variation by identifying
random polymorphisms. However, these studies have not led to the development of
openUP (June 2007)
general markers applicable in the screening of micropropagated plants for somaclonal
variation. Representational difference analysis (RDA) has been applied to detect variation
in a limited number of plant species (Cullis and Kunert 2000, Donnison et al. 1996, Oh
and Cullis 2003, Vorster et al. 2002, Zoldos et al. 2001). RDA technology has been used
to detect genomic losses, rearrangements, amplifications, point mutations and pathogenic
organisms between two genomes (Lisitsyn 1995, Lisitsyn et al. 1993, Michiels et al.
1998, Ushijima et al. 1997). The advantage of RDA is that a complexity of about 5 × 10⁸
base pairs of DNA can be scanned in each subtraction, which is greater than can be
achieved with other commonly used differentiation techniques, such as restriction
fragment length polymorphisms, RAPDs, AFLPs or microsatellites.
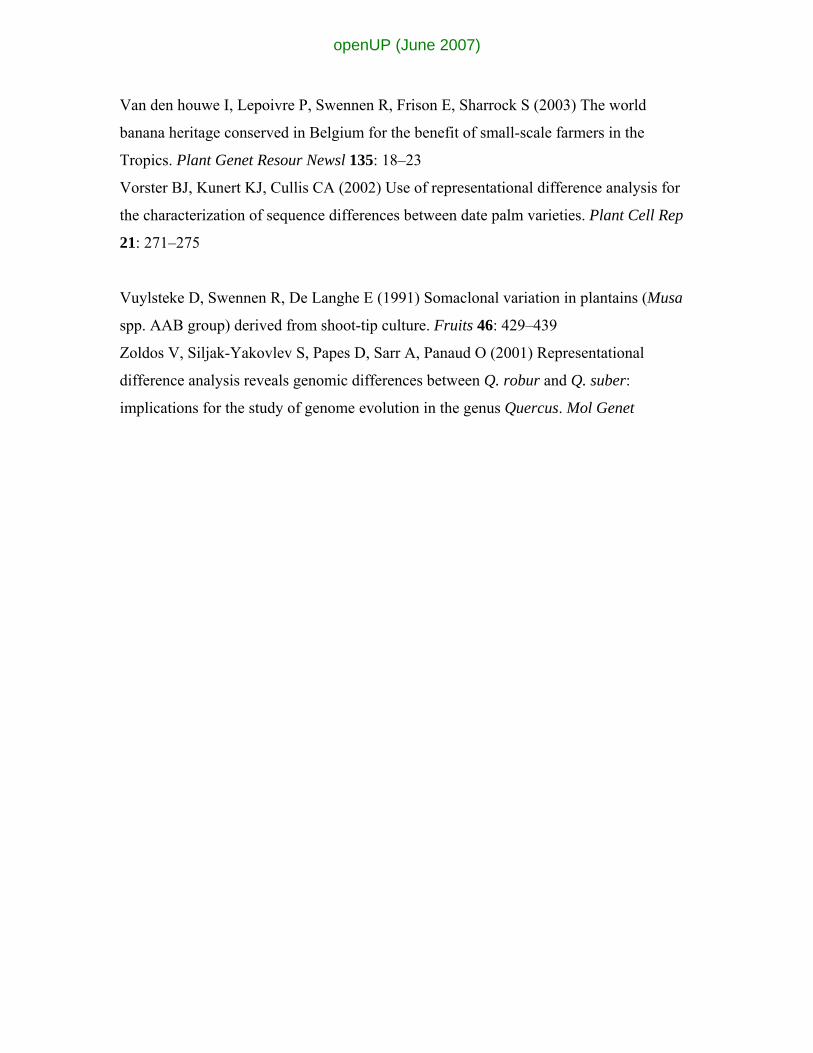
In banana, reduced height, thicker pseudostem and shorter but wider leaves are examples
of the major visible differences between the naturally occurring dwarfs ‘Cachaco enano’,
‘Prata ana’ and ‘Figue Rose naine’ and their naturally occurring normal-sized variants
‘Cachaco’, ‘Prata’ and ‘Figue Rose’, respectively. In the case of ‘Cavendish’ banana a
whole range of naturally occurring ‘Cavendish’ types exist gradually going from extra
dwarf (‘Dwarf Parfitt’) to tall plants like the ‘Giant Cavendish’ (Daniells et al. 2001).
This dwarf phenotype is often also obtained by in vitro culture (Damasco et al. 1998,
Smith and Hamill 1993, Vuylsteke et al. 1991).
The overall aim of this study was to identify unique genomic DNA regions that could be
developed into DNA markers for the diagnosis of somaclonal variation in banana.
Several rounds of partial genomic DNA subtractions using RDA have been performed
using the tall (off-type arising from tissue culture) and dwarf forms of ‘Curare enano’
(Fig. 1) to identify regions of the genome that differ in sequence or methylation status
between these two types. DNA oligonucleotides designed from the sequences of the
difference products have been used as primers in a polymerase chain reaction (PCR)-
based system to compare pairs of normal and off-type banana plants. The genomic locus
of one of these difference products appeared to be a hotspot (extremely labile) for
variation arising during culture. This extended region has been shown to be useful as a
diagnostic tool for somaclonal variation in banana.
openUP (June 2007)
Materials and methods Plant material
Plant material was supplied by the International Musa germplasm collection of the
International Network for the Improvement of Banana and Plantain (INIBAP) Transit
Centre, where germplasm is stored since 1987–1992 at an ambient temperature of 16 ±
1°C and permanent illumination of 25 μmol m 2 s 1. The medium is a Murashige and
Skoog (1962) supplemented with 2.25 mg l 1 (10 μM) 6-benzyladedinine and 0.175 mg
l 1 (1 μM) indole-3-acetic acid and solidified with 2–4 g l 1 Gelrite®. Under these
conditions germplasm is subcultured on average once per year (Van den houwe et al.
1995, 2003), because growing conditions were set to slow down growth. However, under
normal proliferating conditions (same as above but at 28 ± 2°C in a light cycle of 12–16 h
of about 60 μE m 2 s 1) plants are subcultured every 2 months.
Plant material was supplied by the International Musa germplasm collection of the
INIBAP Transit Centre. This comprised in vitro plantlets of three different cultivars
(Daniells et al. 2001) (‘Cachaco’, ABB, ITC.0643; ‘Figue Rose’, AAA, ITC.1159; and
‘Prata’, AAB, ITC.0207) in pairs of naturally occurring dwarf and normal-sized
phenotypes, a pair of naturally occurring dwarf and in vitro-induced tall (normal) off-type
of the cultivar ‘Curare enano’ (AAB, ITC.1165), and three Cavendish types, ‘Giant
Cavendish’, ITC0346, ‘Dwarf Cavendish’, ITC0002, ‘Dwarf Parfitt’, ITC0548.
Phenotypes, whether normal or variant, are transmitted without change to the next
generation of plants in the field as banana plants produce ratoons (suckers) vegetatively
and do not produce seeds. Naturally occurring accessions were found in farmers‘ fields,
and the fact that they are now cultivated in many countries in the world without any
phenotypic changes underlines their phenotypic stability.
The variant phenotype was created in vitro and is only phenotypically different from the
other set of the pair by its plant size. This phenotype also remained stable during
ratooning in the field or greenhouse. Other Cavendish plant materials were supplied by
Du Roi Ltd, Tzaneen, South Africa.
openUP (June 2007)
DNA extraction
Total DNA was isolated from 300 mg of young leaf tissue from greenhouse or in vitro
plantlets using the DNeasy DNA extraction kit (Qiagen, Hilden, Germany) with some
modifications. Briefly, plant tissue was homogenized in a mortar with pestle and lysed as
described by Dellaporta et al. (1983). The lysate was further purified on DNeasy columns
according to the manufacturer’s instructions. Typical yields were between 30 and 45 μg
g 1 of leaf tissue. Four independent DNA extractions from the ‘Curare enano’ normal
and dwarf individuals were analyzed.
Representational difference analysis
The general outline for the RDA procedure described by Lisitsyn et al. (1993) and
Vorster et al. (2002) was followed. Reciprocal subtractions were performed with the
normal DNA being the tester and the dwarf DNA being the driver in one experiment and
the dwarf DNA being the tester and the normal DNA being the driver in the other
experiment. Amplicons (representations) were prepared by the digestion of 2 μg of DNA
with 80 units of the restriction enzyme HpaII, ligation of adapter sequences RHpa11 (5'-
CGGTCGGTGAG -3') and RHpa24 (5'-AGCACTCTCCAGCCTCTCACCGAC-3') to
the digested DNA and amplification of the ligation products by PCR to generate the first
round of amplicons. All PCR amplifications were performed using a program with an
initial denaturation of 1 min at 95°C, the appropriate number of cycles of 30 s at 94°C
and 3 min at 72°C, a final extension for 10 min at 72°C and then an indefinite soak at
4°C. All amplicons were then digested with HpaII to remove the RHpa24 adapter
sequences from the ends of the amplicons. To add another set of adapters to the tester
amplicons only, the HpaII digest of tester amplicons was purified by using a low-
melting-point agarose gel (Roche, Indianapolis, IN) and Qiagen-tip 20 (Qiagen) to
eliminate digested adapter RHpa24. Then a different set of adapters, JHpa11 (5'-
CGGTTTCATGG-3') and JHpa24 (5'-ACCGACGTCGACTATCCATGAAAC-3'), was
ligated to the digested and purified tester amplicons before entering to the
hybridization/amplification step (Lisitsyn et al. 1993). The adapters on the subtracted
tester products were changed before each round of hybridization and amplification. The
first hybridization reaction used 20 μg of driver DNA amplicons and 0.5 μg of tester
openUP (June 2007)
DNA amplicons (40:1 driver/tester ratio). The mixed amplicons were dried and
redissolved in 4 μl of hybridization buffer [30 mM EPPS, (2-hydroxyethyl piperizine)-N'-
(3-propene sulfonic acid), pH 8, and 3 mM EDTA] and overlayed with mineral oil. The
DNA was denatured at 100°C for 10 min, 1 μl of sodium chloride (5 M) was added to a
final concentration of 1 M and the reaction was incubated at 67°C for 16 h. The
hybridization mixture was then diluted to 300 μl and an aliquot amplified. The first round
of amplification following all hybridizations was for 10 cycles followed by digestion of
the products with mung bean nuclease to remove single-stranded DNA. The nuclease-
treated product was then amplified for an additional 20 cycles. From the resulting
amplicons (first subtraction product) the adapters were removed by HpaII digestion and a
second pair of adapters with different sequences was ligated onto the amplicons used as
tester DNA for the second hybridization (NHpa24 5'-
AGGCAACTGTGCTATCCGAGGGAC-3'; NHpa11 5'-CGGTCCCTCGG-3'). The
second hybridization used 20 μg of driver DNA amplicons and 0.01 μg of tester DNA
amplicons (2000:1 driver/tester ratio) and following hybridization the products were
amplified. Adapters were removed from the resulting amplicons and the subtraction
products were filled in, blunt-end ligated into the pCRScript cloning vector (Stratagene)
and transformed into Escherichia coli competent cells. Plasmid-containing colonies
carrying an insert were selected for plasmid isolation and determination of the insert size
and nucleotide sequence.
Primer design and testing
Pairs of primers were designed using the program, Primer3
(http://www.frodo.wi.mit.edu/cgi-bin/primer3/primer3_www.cgi). The primer pairs were
used in a PCR using banana DNA as template at various annealing temperatures to
optimize the PCR. The PCRs were carried out in 25-μl volumes containing 25 ng of total
genomic DNA, 15 ng of primer, 200 μM of each dNTP, 10 mM Tris–HCl (pH 8.3), 2 mM
MgCl2 and 0.5 units of Taq polymerase (Takara, Shiga, Japan). Amplification was
performed using an MJRPTC60 system. The following standard amplification program
was used: (1) 94°C for 1 min × 1 cycle; (2) 94°C for 1 min, 55°C or 60°C for 1 min
depending on the primer pair, 72°C for 1 min × 35 cycles; (3) 72°C for 7 min × 1 cycle
openUP (June 2007)
followed by an optional soak period at 4°C. The PCR products were separated on a 1.5%
agarose gel, stained with ethidium bromide and visualized under UV light.
Flanking sequence isolation
A two-step PCR technique as outlined by Sorensen et al. (1993) was applied using each
of four different flanking primers three of which (FP01, 02 and 04) are shown in Fig. 4
and two primers designed from the difference product sequence. These primers were used
to amplify from the banana genome the 3'- and 5'-end DNA flanking sequences of one of
the RDA subtraction products (Musomav2). For amplification of the two flanking
sequences, 5'-end biotinylated primers complementary to sections of the RDA subtraction
product were used in combination with a mixture of all four flanking primers to isolate a
sequence complementary to the flanking regions of the RDA subtraction product. After
PCR amplification, biotinylated DNA fragments were isolated by mixing 40 μl of the
PCR mixture with 40 μl (200 μg) prewashed Dynabead M280-streptavidin as
recommended by the supplier (Dynal Biotech, Oslo, Norway) and removing all
biotinylated fragments from the mixture using a Dynal magnetic particle concentrator.
Binding and washing steps were done in the presence of a buffer consisting of 10 mM
Tris–HCl (pH 7.5), 1 mM EDTA and 2 M NaCl. After incubation for 15 min to remove
the biotinylated DNA fragments with the particle concentrator from the mixture and
washing the beads in buffer, the bead-bound DNA fragments were treated in 8 μl of 100
mM NaOH for 10 min to remove the beads and the biotin label. The resulting supernatant
containing non-biotinylated DNA strands was then neutralized with 4 μl of 200 mM HCl
and 1 μl of 1 M Tris–HCl (pH 8) diluted to 30 μl with distilled H2O. A second PCR with
2 μl of this product was used to amplify the isolated flanking sequences with an internal
(nested) primer. All PCRs were carried out using a standard PCR protocol with 42 cycles
of amplification and primer annealing at 62°C. Amplified and agarose gel-purified DNA
fragments were cloned into the vector pCRScript and sequenced.
openUP (June 2007)
Results RDA difference products
Twenty clones varying in length from 48 to 297 bp were isolated from the subtraction
between the normal (tester) and dwarf (driver) phenotypes of ‘Curare enano’ and
sequenced. Six of these clones (Musomav1–6) were characterized and their sequences
have been deposited in GenBank with accession numbers (DQ842002, DQ842001,
DQ842003, DQ842004, DQ842005, and DQ842006). No difference products were
obtained when the reciprocal subtraction (dwarf tester and normal driver) was performed.
The sequences were analyzed with both BLASTN and BLASTX to determine any related
sequences in the non-redundant (nr) databases of GenBank. None of the sequences had
significant homology (E < 10 10) with BLASTN searches. Musomav1 had two non-
overlapping regions of homology with the Musa acuminata expansin1 (EXP1) gene and
the Arabidopsis thaliana transketolase AT3G60750 gene. Equivalent homologies were
also found with the BLASTX search. The BLASTX searches identified more potential
homologies in addition to those seen with Musomav1. Musomav5 and 6 both had
potential homologies with kinase genes while Musomav3 had similarity to a putative
disease resistance protein. Musomav2 and 4 had no significant similarities with either
BLASTN or BLASTX searches.
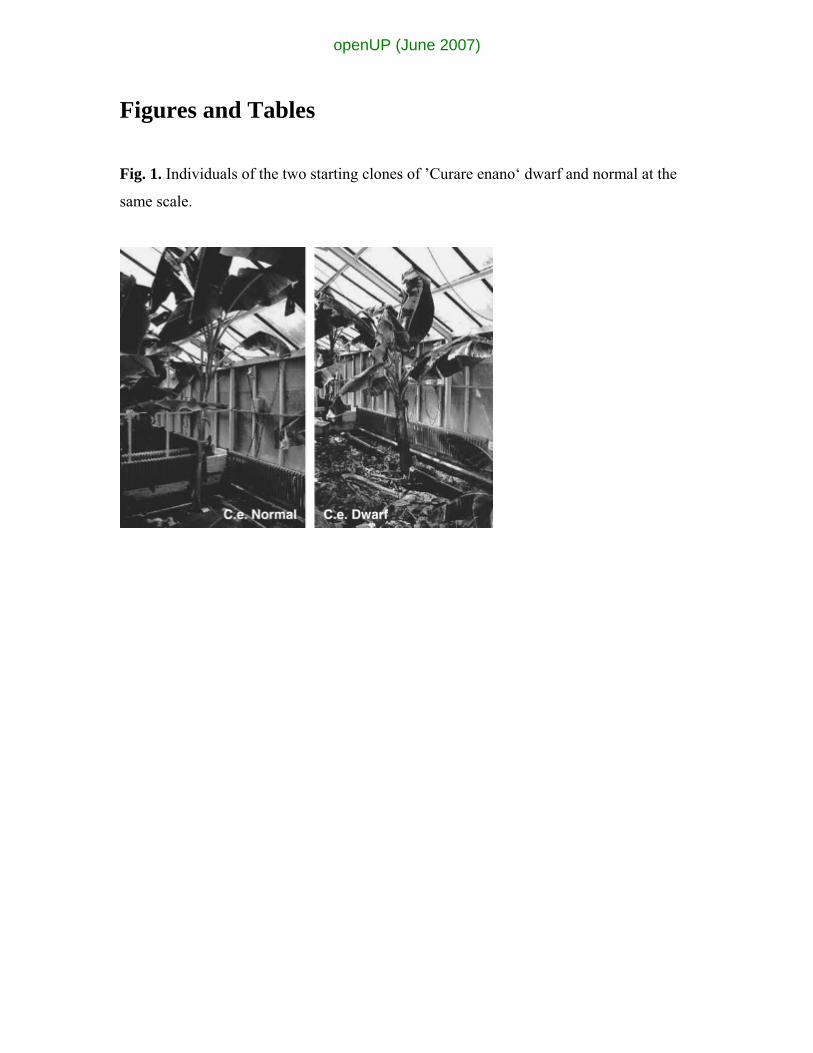
Primers were designed from these six sequences (Table 1) and the result of PCRs using
these primers with the ‘Curare enano’ normal and dwarf DNAs used in the subtraction is
given in Fig. 2. Two of the primer sets, one consisting of primers 1 and 2 and the other of
primers 3 and 4 showed differences between the two starting DNAs (indicated by
arrowheads in Fig. 2). The primer sets (1 and 2, 3 and 4) revealed a polymorphism
between normal and dwarf with a band being produced in the normal that was absent
from the dwarf. With primers 1 and 2 a complex of differences were observed between
the starting materials, while the PCR product with primers 3 and 4 was a single band in
the normal DNA and no band with the dwarf DNA. This presence with one DNA but not
with the other is consistent with a structural change in the DNA rather than with a
modification, such as methylation, of the DNA. Five of the six pairs of primers were used
to amplify DNA from the other sets of normal and dwarf banana DNAs (Fig. 3). All these
openUP (June 2007)
sets of primers differentiated between the normal and dwarf phenotypes of each cultivar.
Primers 3 and 4 were most useful in distinguishing between the normal and dwarf
phenotypes (Fig. 2B), only failing to distinguish between the ‘Cachaco’ normal and
dwarf. Although there are differences between the lines, none of the other markers
distinguish between the plants based solely on the height phenotype. Because primers 3
and 4 did not amplify in five of the six dwarf phenotypes but did amplify in all the
normal phenotypes, this particular subtraction product was subjected to additional
characterization.
Isolation of flanking sequences around difference product Musomav2
The flanking regions of this difference product were isolated resulting in the region
depicted in Fig. 4. The whole region was sequenced (GenBank accession number
DQ842001). The complete sequence was again characterized using BLASTN and BLASTX
to determine any related sequences in the nr databases of GenBank with no significant
similarities being reported. The positions of additional primers that were designed are
indicated in Fig. 4. These additional primers were used to amplify from ‘Curare enano’
normal and dwarf DNAs (Fig. 5) and some were also used to amplify from the banana
dwarf and normal pairs. The variation using these additional primers demonstrated that
many primers can be designed from this region to distinguish between the normal and
dwarf phenotypes. These observations strongly suggest that this whole region of the
genome is highly variable. The complete pairwise sequence comparison for all five
sequences is shown in Fig. 6 with the positions of gaps in the sequence noted. The three
individuals (5, 6 and 11) derived from culture do show minor sequence differences,
which would be consistent with the region being modified during in vitro propagation of
banana even when obvious phenotypic variation is absent.
Methylation differences
Because the basis for somaclonal variation has been proposed to be epigenetic and the
result of DNA or chromatin modification, tests on the methylation status of various
regions around Musomav2 were carried out. The primers 45 and 4, 45 and i4, and r5 and
r6 (from the flanking regions of Musomav2) were used to amplify DNA from normal and
openUP (June 2007)
dwarf ‘Curare enano’ prior to and after digestion with the isoschizomers MspI and HpaII
(Fig. 7) which are differentially affected by the methylation of their common recognition
site. The results show that the amplification from dwarf with primers 45 and i4 is
essentially unaffected by either digestion, indicating that both the C residues in the
restriction sites are methylated. However, the amplification from the normal is reduced in
both cases, indicating that neither of the C residues in most of the restriction sites are
methylated. The level of amplification from the normal DNA is much greater than that
seen with the dwarf DNA prior to digestion. The differential amplification with primers
45 and i4 is not because of lower DNA concentration but because of the efficiency of
amplification supported. The equivalent amplification from both DNA samples with
primers r5 and r6 (Fig. 7C) supports this conclusion. When primers r5 and r6 are used,
the level of amplification from both samples is equivalent. Both are greatly reduced by
HpaII digestion. No amplification was observed from the normal DNA after MspI
digestion, although the level of amplification seen with the dwarf DNA sample is similar
to that observed after HpaII digestion. This result is consistent with methylation
differences between normal and dwarf phenotypes of ‘Curare enano’ occurring within
this region in addition to the actual sequence variation already identified.
Testing of Primers 3 and 4 for the detection of in vitro-associated variation
Primers 3 and 4 were used in PCRs with the DNA isolated from 300 individual plants
supplied by a commercial in vitro propagation facility. The result was that 14 of the 300
showed no amplification with the primer pair 3 and 4. However, all DNA samples
showed the expected amplification with the primer pair r5 and r6. The frequency of
observed non-amplification (4.7%) was approximately equal to that expected for the rate
of dwarf types observed in this batch of plants. However, the plants have not been
followed to determine whether or not this primer pair exclusively identified dwarf types,
a range of other off-type phenotypes or apparently normal plants.
Discussion RDA has proved to be useful in identifying regions of the banana genome that vary
between different phenotypes. The observation that difference products were isolated
openUP (June 2007)
when the normal phenotype was used as tester, but not when the dwarf phenotype was
used as tester, is consistent with earlier observations using two other in vitro-derived off-
types (Cullis and Kunert 2000). This evidence is consistent with the idea that all the
fragments present in the off-types are also present in the normal plants, but not vice
versa. A possible explanation is that the banana varieties that were tested were triploid
and not all three copies of a particular sequence were modified in the somaclones.
The findings in this study are consistent with the notion that there is a labile fraction of
the genome that is modified during the generation of somaclonal variation in banana. The
difference products reported here have all the characteristics of representatives of this
labile region of the genome, although not all are diagnostic of either the normal or dwarf
phenotypes. Thus, primer pair 5 and 6 amplifies a band in ‘Cachaco’ dwarf but not in
‘Cachaco’ normal, while the reverse is true for the other pairs of normal and dwarf lines.
It should also be noted that ‘Cachaco’ dwarf and normal is the only pair that is not
distinguishable using the primer pair 3 and 4 (from Musomav2) and may have a genetic
basis different from those of the other pairs of normal and dwarf phenotypes. The
observation that many of the independent banana variants can be distinguished with the
six sequences described here supports the notion of a limited set of loci being modified
during the generation of variation during in vitro propagation. The characterization of the
extended region around one of the difference products (Musomav2) has been used to
design sets of primers that differentiate between the two starting phenotypes (normal and
dwarf) as well as between other pairs of normal and dwarf banana plants arising from
culture. The region contains a large number of mutations that arise frequently during in
vitro propagation supported by the observation of sequence differences among
individuals from in vitro propagation. This high rate of variation also makes the region a
candidate for identifying single-nucleotide polymorphisms as possible markers for
variation arising through in vitro propagation of bananas. Musomav2 appears to contain
both sequence variation and variations in the methylation status. Therefore, both
sequence and methylation differences occur in somaclonal variants in banana.
It is important to note that in the pair of normal and dwarf ‘Curare enano‘ forms, the
normal (tall) individual arose from culture. However, the sequence of this region is most
closely related to the sequence derived from other tall but not dwarf forms. Therefore, it
openUP (June 2007)
appears that the change that had occurred in culture was a reversion to the previous
sequence. This type of reversion has similarities with the reversion of Arabidopsis
hothead mutations (Lolle et al. 2005), although more data are needed before this
comparison can be validated. Another possibility is that the initial explant was chimeric
and the normal form was a selection from this chimera in the culture.
The primers 3 and 4 from Musomav2 have been tested to determine if they can be used to
distinguish individuals from a commercial in vitro propagation facility. A small number
of the plants could be distinguished by failing to amplify a product with these two
primers. A larger number of individuals need to be tested, and the altered individuals
grown up and their phenotype determined to confirm the frequency of association
between this marker and a specific phenotype. However, the preliminary evidence
indicates that primers 3 and 4 can be used as a diagnostic for identifying off-types in
banana plants produced through in vitro propagation. The sequences reported here and
the primers developed from them (particularly primers 3 and 4) have the potential to be
developed into a robust diagnostic DNA marker for somaclonal variation.
Edited by H. G. Nam
References
Cullis, CA (1999) Environmental stress – a generator of adaptive variation? In: Lerner
HR (ed) Plant Adaptations to Stress Environments. Marcel Dekker,
New York, pp 149–160
Cullis, CA (2005) Mechanisms and control of rapid genomic changes in flax. Ann Bot
(Lond) 95: 201–206
Cullis CA, Kunert KJ (2000) Isolation of tissue culture-induced polymorphisms in
bananas by representational difference analysis. Acta Hortic 530: 421–428
openUP (June 2007)

Damasco OP, Adkins SW, Godwin ID, Smith MK, Drew RA (1998) Use of a SCAR-
based marker for the early detection of dwarf off-types in micropropagated Cavendish
bananas. Acta Hortic 461: 157–164
Daniells J, Jenny C, Karamura D, Tomekpe K (2001) Musalogue: a catalogue of Musa
germplasm. In: Arnaud E, Sharrock S (compiled by these persons) Diversity in the Genus
Musa. INIBAP, Montpellier, France, 213 pp. Available at
http://www.inibap.org/pdf/IN010189_en.pdf
Dellaporta SL, Wood J, Hicks JB (1983) A plant DNA minipreparation: version II. Plant
Mol Biol Rep 1: 19–21
Donnison IS, Siroky J, Vyskot B, Saedler H, Grant SR (1996) Isolation of y
chromosome-specific sequences from Silene latifolia and mapping of male sex-
determining genes using representational difference analysis. Genetics 144: 1893–1901
Kaeppler SM, Kaeppler HF, Rhee S (2000) Epigenetic aspects of somaclonal variation in
plants. Plant Mol Biol 43: 179–188
Koukalova B, Fojtova M, Lim YK, Fulnecek J, Leitch AR, Kovarik A (2005)
Dedifferentiation of tobacco cells is associated with ribosomal RNA gene
hypomethylation, increased transcription, and chromatin alterations. Plant Physiol 139:
275–286
Kubis SE, Castilho AMMF, Vershinin AV, Heslop-Harrison JS (2003) Retroelements,
transposons and methylation status in the genome of oil palm (Elaeis guineensis) and the
relationship to somaclonal variation. Plant Mol Biol 52: 69–79
openUP (June 2007)
Labra M, Savini C, Bracale M, Pelucchi N, Colombo L, Bardini M, Sala F (2001)
Genomic changes in transgenic rice (Oryza sativa L.) plants produced by infecting calli
with Agrobacterium tumefaciens. Plant Cell Rep 20: 325–330
Larkin P (2004) Somaclonal Variation: Origins and Causes. Encyclopedia of Crop and
Plant Science. Marcel Dekker,
New York, pp 1158–1161
Linacero R, Alves EF, Vazquez AM (2000) Hot spots of DNA instability revealed
through the study of somaclonal variation in rye. Theor Appl Genet 100: 506–511
Lippman Z, May B, Yordan C, Singer T, Martienssen R (2003) Distinct mechanisms
determine transposon inheritance and methylation via small interfering RNA and histone
modification. PLoS Biol 1: 420–428
Lisitsyn N (1995) Representational difference analysis: finding the differences between
genomes. Trends Genet 11: 303–307
Lisitsyn N, Lisitsyn N, Wigler M (1993) Cloning the differences between two complex
genomes. Science 259: 946–951
Lolle SJ, Victor JL, Young JM, Pruitt RE (2005) Genome-wide non-Mendelian
inheritance of extra genomic information in Arabidopsis. Nature 434: 505–509
Michiels L, Van Leuven F, Van Den Oord JJ, De Wolf-Peeters C, Delabie J (1998)
Representational difference analysis using minute quantities of DNA. Nucleic Acids Res
26: 3608–3610
Murashige T, Skoog F (1962) A revised medium for rapid growth and bio-assays with
tobacco tissue cultures. Physiol Plant 15: 473–497
openUP (June 2007)
Oh TJ, Cullis CA (2003) Labile DNA sequences in flax identified by combined sample
representational difference analysis (csRDA). Plant Mol Biol 52: 527–536
Peschke VM, Phillips RL (1992) Genetic implications of somaclonal variation in plants.
Adv Genet 30: 41–75
Phillips RL, Kaepler SM, Olhoft P (1994) Genetic instability of plant tissue cultures:
breakdown of normal controls. Proc Natl Acad Sci U S A 91: 5222–5226
Smith M, Hamill S (1993) Early detection of dwarf off-types from micropropagated
Cavendish bananas. Aust J Exp Agric 33: 639–644
Smulders MJM, Rus-Kortekaas W, Vosman B (1995) Tissue culture induced DNA
methylation polymorphisms in repetitive DNA of tomato calli and regenerated plants.
Theor Appl Genet 91: 1257–1264
Sorensen AB, Duch M, Jorgensen P, Pedersen FS (1993) Amplification and sequence
analysis of DNA flanking integrated proviruses by a simple two-step polymerase chain
reaction method. Am Soc Microbiol 67: 7118–7124
•
Ushijima T, Morimura K, Hosoya Y, Okonogi H, Tatematsu M, Sugimura T, Nagao M
(1997) Establishment of methylation-sensitive representational difference analysis and
isolation of hypo- and hypermethylated genomic fragments in mouse liver tumors. Proc
Natl Acad Sci U S A 94: 2284–2289
Van den houwe I, De Smet K, Tezenas de Montcel H, Swennen R (1995) Variability in
storage potential of banana shoot cultures under medium term storage conditions. Plant
Cell Tissue Organ Cult 42: 269–274.
openUP (June 2007)
Van den houwe I, Lepoivre P, Swennen R, Frison E, Sharrock S (2003) The world
banana heritage conserved in Belgium for the benefit of small-scale farmers in the
Tropics. Plant Genet Resour Newsl 135: 18–23
Vorster BJ, Kunert KJ, Cullis CA (2002) Use of representational difference analysis for
the characterization of sequence differences between date palm varieties. Plant Cell Rep
21: 271–275
Vuylsteke D, Swennen R, De Langhe E (1991) Somaclonal variation in plantains (Musa
spp. AAB group) derived from shoot-tip culture. Fruits 46: 429–439
Zoldos V, Siljak-Yakovlev S, Papes D, Sarr A, Panaud O (2001) Representational
difference analysis reveals genomic differences between Q. robur and Q. suber:
implications for the study of genome evolution in the genus Quercus. Mol Genet
openUP (June 2007)
Figures and Tables
Fig. 1. Individuals of the two starting clones of ’Curare enano‘ dwarf and normal at the
same scale.
openUP (June 2007)
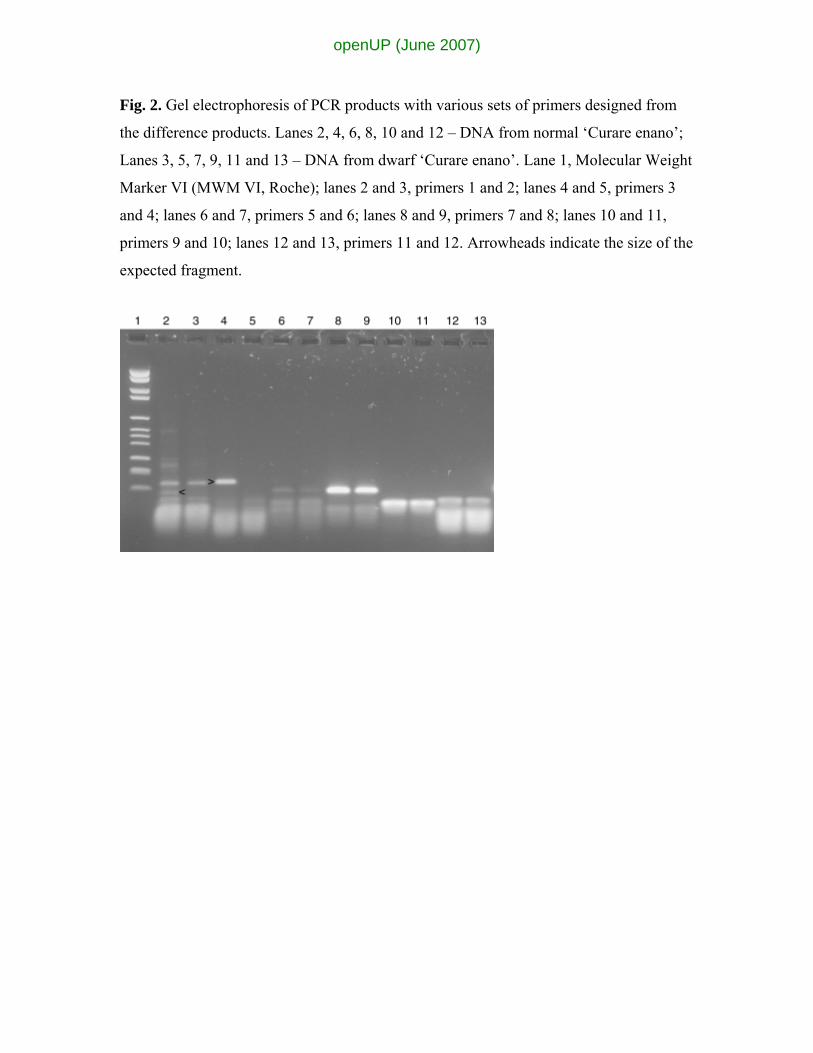
Fig. 2. Gel electrophoresis of PCR products with various sets of primers designed from
the difference products. Lanes 2, 4, 6, 8, 10 and 12 – DNA from normal ‘Curare enano’;
Lanes 3, 5, 7, 9, 11 and 13 – DNA from dwarf ‘Curare enano’. Lane 1, Molecular Weight
Marker VI (MWM VI, Roche); lanes 2 and 3, primers 1 and 2; lanes 4 and 5, primers 3
and 4; lanes 6 and 7, primers 5 and 6; lanes 8 and 9, primers 7 and 8; lanes 10 and 11,
primers 9 and 10; lanes 12 and 13, primers 11 and 12. Arrowheads indicate the size of the
expected fragment.
openUP (June 2007)
Fig. 3. Gel electrophoresis of PCR products with various sets of primers designed from
the difference products used in PCR amplifications with nine banana samples. Lane 1,
Molecular Weight Marker VI (MWM VI, Roche); lane 2, ‘Dwarf Parfitt’; lane 3, ‘Dwarf
Cavendish’; lane 4, ‘Giant Cavendish’; lane 5, ‘Prata’ (normal); lane 6, ‘Prata ana’
(dwarf); lane 7, ‘Figue Rose’ (normal); lane 8, ‘Figue Rose naine’ (dwarf); lane 9,
‘Cachaco’ (normal); lane 10, ‘Cachaco enano’ (dwarf). (A) Primers 1 and 2, (B) primers
3 and 4, (C) primers 5 and 6, (D) primers 9 and 10, and (E) primers 11 and 12.
openUP (June 2007)
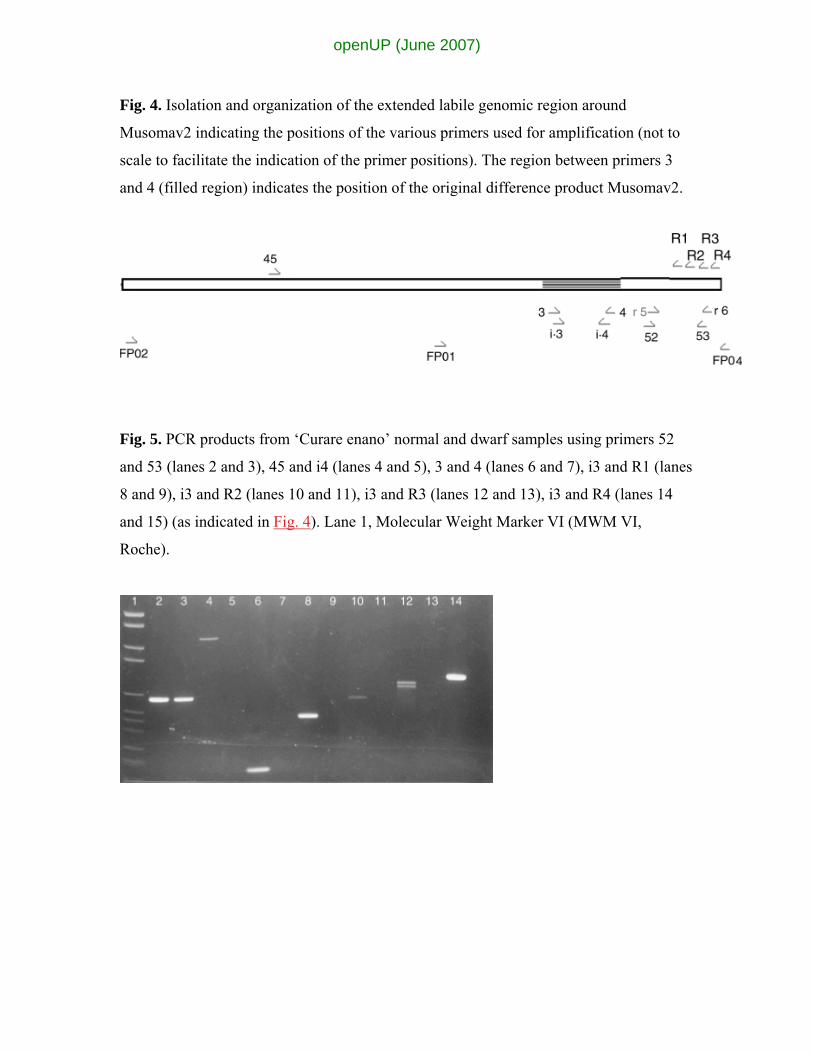
Fig. 4. Isolation and organization of the extended labile genomic region around
Musomav2 indicating the positions of the various primers used for amplification (not to
scale to facilitate the indication of the primer positions). The region between primers 3
and 4 (filled region) indicates the position of the original difference product Musomav2.
Fig. 5. PCR products from ‘Curare enano’ normal and dwarf samples using primers 52
and 53 (lanes 2 and 3), 45 and i4 (lanes 4 and 5), 3 and 4 (lanes 6 and 7), i3 and R1 (lanes
8 and 9), i3 and R2 (lanes 10 and 11), i3 and R3 (lanes 12 and 13), i3 and R4 (lanes 14
and 15) (as indicated in Fig. 4). Lane 1, Molecular Weight Marker VI (MWM VI,
Roche).
openUP (June 2007)
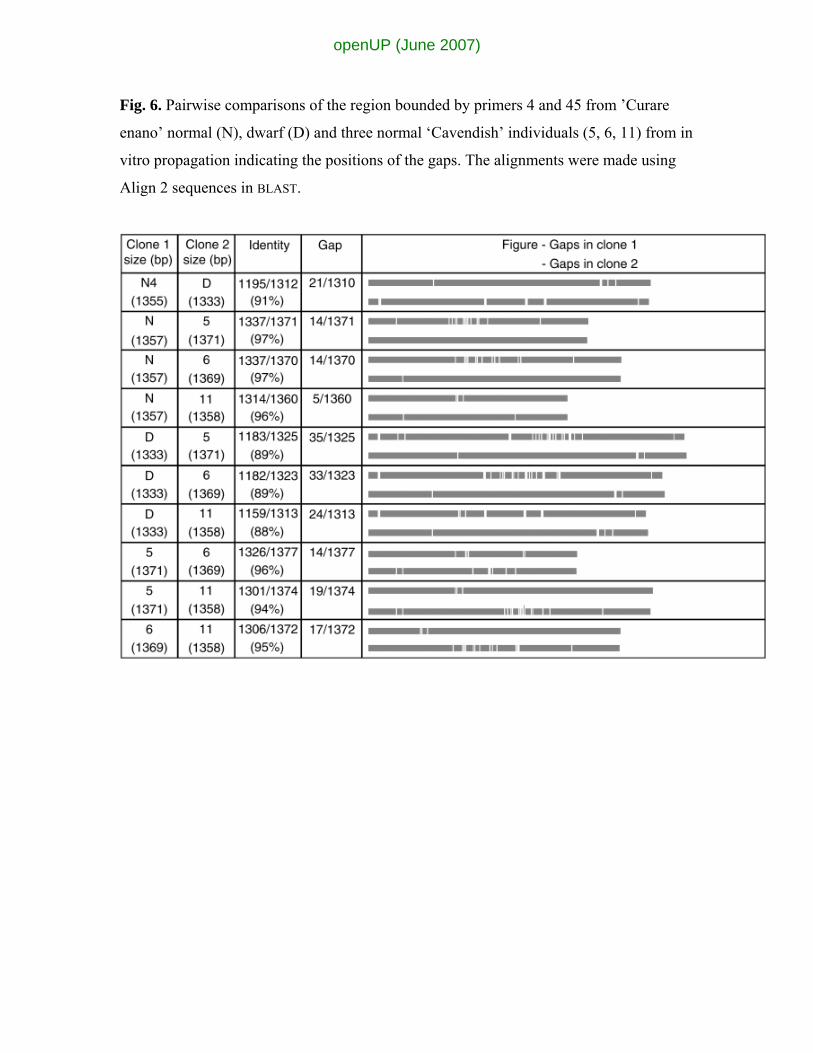
Fig. 6. Pairwise comparisons of the region bounded by primers 4 and 45 from ’Curare
enano’ normal (N), dwarf (D) and three normal ‘Cavendish’ individuals (5, 6, 11) from in
vitro propagation indicating the positions of the gaps. The alignments were made using
Align 2 sequences in BLAST.
openUP (June 2007)
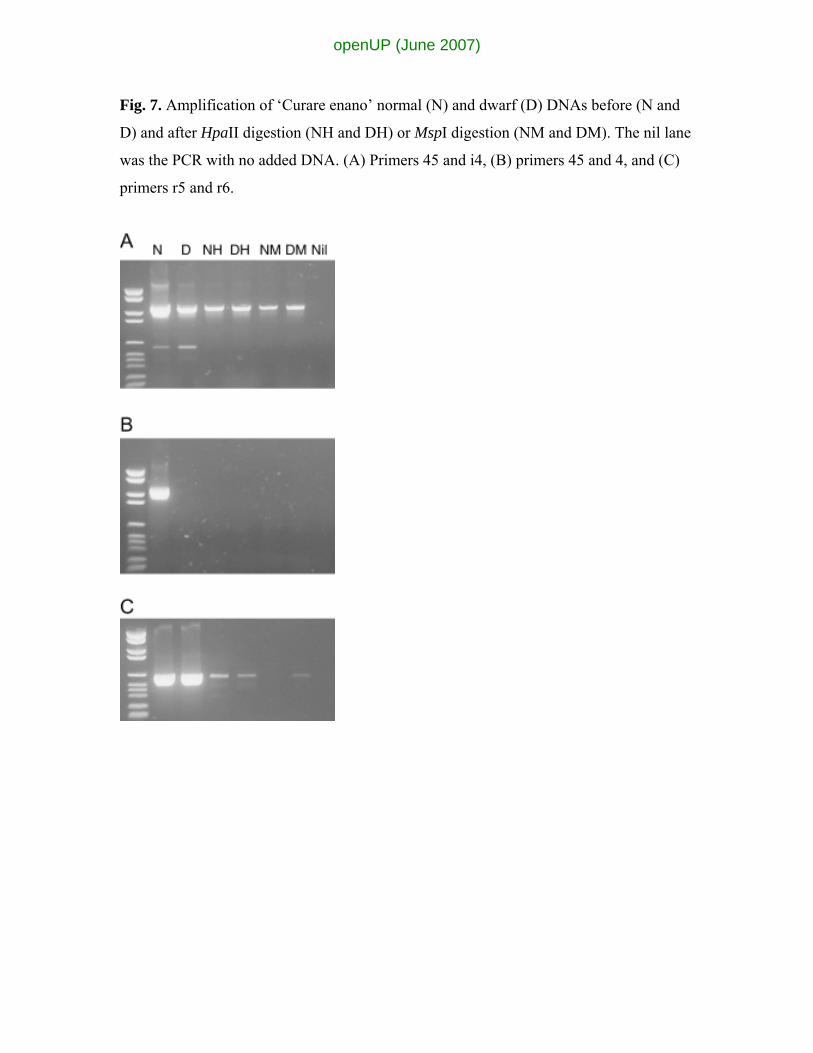
Fig. 7. Amplification of ‘Curare enano’ normal (N) and dwarf (D) DNAs before (N and
D) and after HpaII digestion (NH and DH) or MspI digestion (NM and DM). The nil lane
was the PCR with no added DNA. (A) Primers 45 and i4, (B) primers 45 and 4, and (C)
primers r5 and r6.
openUP (June 2007)

Table 1. Primer sequences from differential products
Source DNA Primer number Primer sequence (5' – 3')
Musomav1 1 AGG CAC CAC TGC GGG TCG T
Musomav1 2 TGC TGG GAG TTG TTC GTG GA
Musomav2 3 AGG GAA AGG CAG CTA GAG AAA
Musomav2 4 TTC GCT CGT TGT AGT GAT TTC
Musomav3 5 TCA CGT ACT CTG CTG TGG AAA
Musomav3 6 TGC AAA CTG GGT CCT GAG TT
Musomav4 7 TCA CCT ACG AAA CAA ACC ACA
Musomav4 8 AGA ACG AGA AAA GGG CAG AA
Musomav5 9 TGG CTT TCT CGT GCA GGT A
Musomav5 10 ACT CGC TTG GTA CAC CAG GAT
Musomav6 11 GTC GTC GGG ATC TGC ACC AG
Musomav6 12 AAG CAA TTC GTG GCG GAG GTT
openUP (June 2007)