Embed Size (px)
Citation preview
Genome-wide association study of caffeine metabolites provides new insights to caffeine
metabolism and dietary caffeine-consumption behavior
Marilyn C. Cornelis1*
, Tim Kacprowski2,3
, Cristina Menni4, Stefan Gustafsson
5, Edward Pivin
6,
Jerzy Adamski7,8,9
, Anna Artati7, Chin B. Eap
10, 11, Georg Ehret
12,13, Nele Friedrich
3,14, Andrea
Ganna15,16
, Idris Guessous6,17,18
, Georg Homuth2, Lars Lind
19, Patrik K. Magnusson
20, Massimo
Mangino4, Nancy L. Pedersen
20, Maik Pietzner
3,14, Karsten Suhre
21,22, Henry Völzke
23, Swiss
Kidney Project on Genes in Hypertension (SKIPOGH) team24
, Murielle Bochud6, Tim D.
Spector4, Hans J Grabe
25 and Erik Ingelsson
5,26
1Department of Preventive Medicine, Northwestern University Feinberg School of Medicine,
Chicago, USA; 2Department of Functional Genomics, Interfaculty Institute for Genetics and
Functional Genomics, University Medicine and Ernst-Moritz-Arndt University Greifswald,
Greifswald, Germany; 3DZHK (German Center for Cardiovascular Research), partner site
Greifswald, Greifswald, Germany; 4Department of Twin Research & Genetic Epidemiology,
King’s College London, St Thomas Hospital, London, UK; 5Department of Medical Sciences,
Molecular Epidemiology and Science for Life Laboratory, Uppsala University, Uppsala,
Sweden; 6Division of Chronic Diseases, University Institute of Social and Preventive Medicine
(IUMSP), University Hospital of Lausanne (CHUV), Lausanne, Switzerland; 7Institute of
Experimental Genetics, Genome Analysis Center, Helmholtz Zentrum München, German Research
Center for Environmental Health, Neuherberg, Germany; 8Lehrstuhl für Experimentelle Genetik,
Technische Universität München, Freising-Weihenstephan, Germany; 9German Center for Diabetes
Research (DZD), Neuherberg, Germany; 10
Unit of Pharmacogenetics and Clinical
Psychopharmacology, Department of Psychiatry, Centre for Psychiatric Neuroscience, Lausanne,
Switzerland; 11
School of Pharmaceutical Sciences, University of Geneve, University of
Lausanne, Geneva, Switzerland; 12
Cardiology, Department of Specialties of Internal Medicine,
© The Author 2016. Published by Oxford University Press. All rights reserved. For Permissions, please email: [email protected]
HMG Advance Access published October 3, 2016 at K
ing's College L
ondon on October 18, 2016
http://hmg.oxfordjournals.org/
Dow
nloaded from
2
Geneva University Hospitals, Geneva, Switzerland; 13
Center for Complex Disease Genomics,
McKusick-Nathans Institute of Genetic Medicine, Johns Hopkins University, Baltimore, USA;
14Institute of Clinical Chemistry and Laboratory Medicine, University Medicine Greifswald,
Germany; 15
Analytic and Translational Genetics Unit, Department of Medicine, Massachusetts
General Hospital and Harvard Medical School, Boston, USA; 16
Program in Medical and
Population Genetics, Broad Institute of Harvard and MIT, USA; 17
Unit of Population
Epidemiology, Department of Community Medicine and Primary Care and Emergency
Medicine, Geneva University Hospitals, Geneva, Switzerland; 18
Department of Epidemiology,
Rollins School of Public Health, Emory University, Atlanta, USA; 19
Department of Medical
Sciences, Cardiovascular Epidemiology, Uppsala University, Uppsala, Sweden; 20
Karolinska
Institutet, Department of Medical Epidemiology and Biostatistics, Stockholm, Sweden;
21Institute of Bioinformatics and Systems Biology, Helmholtz Zentrum München, German
Research Center for Environmental Health, Neuherberg, Germany; 22
Department of Physiology
and Biophysics, Weill Cornell Medicine- Qatar, Doha, Qatar; 23
Institute for Community
Medicine, University Medicine Greifswald, Greifswald , Germany; 24
Full list of members and
affiliations appears at the end of the paper; 25
Department of Psychiatry and Psychotherapy,
University Medicine Greifswald, Greifswald , Germany; 26
Department of Medicine, Division of
Cardiovascular Medicine, Stanford University School of Medicine, Stanford, USA
Correspondence: Dr. M.C. Cornelis at the Department of Preventive Medicine, Northwestern
University Feinberg School of Medicine, 680 North Lake Shore Drive, Suite 1400, Chicago IL
60611, USA, Tel: 1-312-503-4548, Fax: 312-908-9588 E-mail:
at King's C
ollege London on O
ctober 18, 2016http://hm
g.oxfordjournals.org/D
ownloaded from
3
Abstract
Caffeine is the most widely consumed psychoactive substance in the world and presents with
wide interindividual variation in metabolism. This variation may modify potential adverse or
beneficial effects of caffeine on health. We conducted a genome-wide association study (GWAS)
of plasma caffeine, paraxanthine, theophylline, theobromine and paraxanthine/caffeine ratio
among up to 9,876 individuals of European ancestry from six population-based studies. A single
SNP at 6p23 (near CD83) and several SNPs at 7p21 (near AHR), 15q24 (near CYP1A2) and
19q13.2 (near CYP2A6) met GW-significance (P<5×10⁻⁸
) and were associated with one or more
metabolites. Variants at 7p21 and 15q24 associated with higher plasma caffeine and lower
plasma paraxanthine/caffeine (slow caffeine metabolism) were previously associated with lower
coffee and caffeine consumption behavior in GWAS. Variants at 19q13.2 associated with higher
plasma paraxanthine/caffeine (slow paraxanthine metabolism) were also associated with lower
coffee consumption in the UK Biobank (n=94,343, P<1.0 × 10⁻⁶
). Variants at 2p24 (in GCKR),
4q22 (in ABCG2) and 7q11.23 (near POR) that were previously associated with coffee
consumption in GWAS were nominally associated with plasma caffeine or its metabolites. Taken
together, we have identified genetic factors contributing to variation in caffeine metabolism and
confirm an important modulating role of systemic caffeine levels in dietary caffeine consumption
behavior. Moreover, candidate genes identified encode proteins with important clinical functions
that extend beyond caffeine metabolism.
at King's C
ollege London on O
ctober 18, 2016http://hm
g.oxfordjournals.org/D
ownloaded from
4
Introduction
Caffeine (1,3,7 trimethylxanthine, 137X) is the most widely consumed psychoactive substance in
the world (1). While naturally present in coffee, tea and chocolate, caffeine is also increasingly
added to a variety of foods and beverages and this has fostered interest and concern regarding
potential health effects of caffeine in the diet (1, 2).
It is well known that there is wide interindividual variation in caffeine metabolism and
this may modify potential adverse or beneficial health effects of dietary caffeine (3-5). After its
oral intake, caffeine is completely absorbed, rapidly distributed and extensively metabolized in
the liver to three major metabolites: paraxanthine (1,7 dimethylxanthine [17X]), theophylline
(1,3 dimethylxanthine [13X]), and theobromine (3,7 dimethylxanthine [37X]) which undergo
further metabolism to several xanthines and uric acids(5) (Figure 1). Over 95% of caffeine is
metabolized by CYP1A2 and the known interindividual variability in the activity of this enzyme
is thought to strongly correlate with variability in caffeine metabolism (5-7). An individual’s
caffeine metabolic rate can be estimated by calculating one of a number of ratios of metabolites
in blood, urine or saliva following an acute oral dose of caffeine (8). The ratio of paraxanthine to
caffeine [17X/137X] is especially informative since the formation of paraxanthine from caffeine
is exclusively catalyzed by CYP1A2 (8) and is the step in which ~80% of caffeine is
metabolized.
Clinical pharmacokinetic studies have identified a number of environmental and
biological factors impacting caffeine metabolism and, more specifically, its CYP1A2-mediated
metabolism (5-7, 9). However, much of the variation in caffeine metabolism is heritable and
clinical studies have limited power in identifying the precise genetic factors (6, 9). Population-
based genome-wide association studies (GWAS) have identified eight loci associated with self-
at King's C
ollege London on O
ctober 18, 2016http://hm
g.oxfordjournals.org/D
ownloaded from
5
reported coffee and caffeine intake (10, 11). The most prominent loci map near AHR and
CYP1A2, which code for biological candidate proteins involved in caffeine metabolism.
Moreover, GWAS of the human metabolome identified a significant association between cross-
sectional measures of plasma caffeine levels and the same loci near AHR (12, 13). In the current
study, we build on our previous work to identify loci associated with different aspects of caffeine
metabolism in a larger sample and with a more comprehensive analysis of the caffeine metabolic
pathway. The results are additionally mined to gain insight to loci previously associated with
dietary caffeine intake behavior.
Results
Genome-wide association studies
We performed a meta-analysis of GWAS summary statistics from six population-based studies
of European ancestry to detect single-nucleotide polymorphisms (SNPs) that are associated with
plasma 137X, 17X, 13X, 37X, 1,3,7-trimethyluric acid (137U) and the plasma ratio: 17X/137X
(Supplementary Table S1-S3, Figure 1). Study participant characteristics closest to the time of
blood collection are presented in Supplementary Table S2. Overall, men (36%) and women
(64%) were aged ~48 to 71 years and 17% reported currently smoking. GW-significant SNPs
were identified for 137X (n=25), 17X (n=1), 13X (n=1) and 17X/137X (n=103), and together
mapped to 22 independent SNPs (defined as r2<0.3 or distance >500 kb) in four genomic regions
(Table 1, Supplementary Table S4, Figure S1-S8). Within two of the four candidate regions,
7p21 and 19q13.2, we identified 13 GW-significant indel associations with 17X/137X
(Supplementary Table S5). Four of these indels did not correlate with GW-significant SNPs in
these regions (Table 1). Heterogeneous allelic effects (I2>50%) were observed at 7p21 and
at King's C
ollege London on O
ctober 18, 2016http://hm
g.oxfordjournals.org/D
ownloaded from
6
19q13.2 for 17X/137X. Although most index SNPs were imputed by contributing studies,
imputation quality was excellent (Supplementary Table S6).
Follow-up metabolite analysis
All top index SNPs and indels were followed up in several of the participating studies for
association testing with the same or related metabolites and ratios in plasma and urine
(Supplementary Table S3). Table 2 summarizes the results of these analyses while details are
provided in Supplementary Tables S4 and S7. Patterns of associations consistent with respective
plasma metabolites and/or proximity in the caffeine metabolic pathways were observed. We also
tested SNP associations with plasma levels of trigonelline (Trig) and quinine (QN), both
unrelated to caffeine, but correlated with coffee intake (4). We observed convincing SNP
associations only when Trig and QN were modeled as ratios with caffeine (i.e. 137X/Trig and
137X/QN).
Pathway and gene-based analysis
GW-summary statistics for plasma 137X were significantly enriched for gene members of ‘N-
glycan biosynthesis’ (FDR=0.04) and ‘other polysaccharide metabolism’ (FDR=0.04) pathways
(Supplementary Table S8). GW-summary statistics for plasma 17X yielded four significant
pathways: ‘drug metabolic process’ (FDR=0.01), ‘xenobiotics’ (FDR=0.02), ‘nicotine
degradation’ (FDR=0.02), ‘NF-kappaB cascade’ (FDR=0.03) and ‘5HT3-type receptor mediated
signaling’ (FDR=0.05). 13X summary statistics were significantly enriched for gene members of
‘5HT3-type receptor mediated signaling’ (FDR=0.05). GW-summary statistics for plasma
17X/137X yielded three significant pathways: ‘xenobiotics’ (FDR=0.002), ‘nicotine degradation’
at King's C
ollege London on O
ctober 18, 2016http://hm
g.oxfordjournals.org/D
ownloaded from
7
(FDR=0.01) and ‘NF-kappaB cascade’ (FDR=0.03). Each of 280 autosomal genes mapped to
one or more of these seven pathways, a custom CYP1A2 regulation pathway(14) or the caffeine
metabolism pathway (Figure 1), and were subject to gene-based testing. Tests for AHR, CYP1A2,
CYP1A1, CYP2B6, CYP2A6, and CYP2A7 reached statistical significance (defined as P<1.8×10⁻⁴
[0.05/280]) for plasma 137X, 13X or 17X/137X. Several nominally significant genes were also
observed (Supplementary Table S9).
Potential SNP-function
Putative causal variants in cell types of action and target genes were predicted for GW-confirmed
loci (Table 1) by systematically mining comparative, epigenomic and regulatory annotations.
SNP level results are detailed in Supplementary Table S10. Overall, we observed the strongest
enrichment for enhancers in adult liver, relative to all common SNPs (binomial P<2×10⁻⁶
) and
GWAS SNPs (binomial P<9.7×10⁻⁴
), regardless of enhancer definition (i.e. 15-state core
ChromHMM model, H3K4me1 peaks or H3K27ac peaks). The index SNP rs10275488 lies 34kb
upstream of AHR and is an eQTL for this gene in dendritic cells. All five index SNPs at 15q24
span a distance of ~250kb harboring ARID3B, CLK3, EDC3 and CYP1A1 and lie at DNAse sites
that overlap enhancers within several tissue types. QTLs are reported for rs62005807 (ULK3),
rs2470893 (CSK, MPI, SCAMP2, ULK3) and rs2472297 (CSK, SCAMP2, ULK3). Of several
transcription factor motifs disrupted at these SNP sites, the most intriguing are those for
rs12909047: AhR and Arnt; which form a heterodimer that binds to response elements to initiate
specific gene transcription (15). Moreover, rs2470893 and rs2472297 both lie upstream of
CYP1A1 and CYP1A2, within the 24kb intergenic region where several aryl hydrocarbon
response elements (AHRE) reside. SNPs at 19q13.2 span ~310kb harboring the CYP2 cluster, as
at King's C
ollege London on O
ctober 18, 2016http://hm
g.oxfordjournals.org/D
ownloaded from
8
well as NUMBL, ADCK4, ITPKC, SNRPA, MIA and EGLN2 and overlap several enhancers and
other regulatory elements.
Overlap of loci for caffeine metabolites and coffee consumption behavior
Table 2 and Supplementary Tables S4 and S7 also include results for the association between
metabolites and SNPs previously associated with coffee consumption (11). SNPs at 7p21 (AHR)
and 15q24 (CYP1A2) associated with coffee consumption behavior were the same SNPs
associated with caffeine metabolites in GWAS (Table 1). SNPs at 2p24 (GCKR), 4q22 (ABCG2),
and 7q11.23 (POR) were at least nominally associated with three or more metabolite measures.
There was no convincing evidence to support an association between SNPs at 7q11.23 (MLXIPL)
and 17q11.2 (EFCAB6, SLC6A4) and caffeine metabolites. None of the 19q13.2 index SNPs
were examined in the GWAS of coffee consumption, although SNPs in moderate LD presented
nominal associations (data not shown). In a new analysis of 94,343 coffee drinkers from the UK
Biobank, we replicated seven of the eight loci identified in the previous GWAS of coffee
consumption (P<0.05, Table 2). Moreover, alleles of rs56113850 and rs56267346 at 19q13.2
associated with higher 17X/137X were strongly associated with lower coffee consumption
(P<1.0 × 10⁻⁶
). Results were similar when restricting to participants reporting consumption of
mostly regular coffee (N=75,627), with the exception that rs9902453 in 17q11.2 was no longer
significant (P=0.06, but same direction of effect). SNPs at 7p21, 15q24, 7q11.23 (POR) and
19q13.2 were also associated with the consumption of tea (P<0.002), another source of dietary
caffeine. Among participants reporting consumption of mostly decaffeinated coffee (N=18,275),
nominal associations were observed between Table 2 variants at 4q22 (P=0.0007), 7p21
(0.04<P<2.3 × 10⁻⁷
), 7q11.23 (MLXIPL, P=0.004), 7q11.23 (POR, P<2.3 × 10⁻⁷
), 15q24
at King's C
ollege London on O
ctober 18, 2016http://hm
g.oxfordjournals.org/D
ownloaded from
9
(0.02<P<1.5 × 10⁻⁷
), and 19q13.2 (P<0.04 for rs56881024 and rs56267346 only) and
decaffeinated coffee consumption, with direction of effects consistent with those reported for
total and regular coffee.
Discussion
In the current study, we leverage the existing knowledge of caffeine pharmacology and power of
large population-based –omics studies to identify loci associated with plasma levels of caffeine
metabolites in humans. Despite the absence of data concerning recent caffeine intake prior to
sample collection, we identified three genomic regions mapping to biologically relevant
candidate genes. Our study also informs about mechanisms of SNPs identified in our previous
GWAS of coffee consumption and, in turn, confirms an important modulating role of systemic
caffeine levels in dietary caffeine consumption behavior.
Consistent with the major role of CYP1A2 in caffeine metabolism (3, 8, 16), SNPs near
CYP1A2 were significantly associated with 17X/137X and 137X levels as well as several other
caffeine metabolites measured in plasma or urine. The most significant index SNP (rs2472297)
maps to the bidirectional promoter region of CYP1A1 and CYP1A2, where known AHRE reside.
The aryl hydrocarbon receptor (Ahr) plays an important role in CYP1A2 expression(17), and its
gene is also the only candidate residing at 7p21, where up to 6 SNPs correlate with plasma
17X/137X and 137X. All alleles at 7p21 and 15q24 that were associated with lower 17X/137X
were associated with higher 137X levels, suggesting they are associated with slow caffeine
metabolism. Individuals with these particular alleles may require less caffeine than individuals
with the alternate alleles to achieve or maintain the levels needed for the optimal
psychostimulant effects of caffeine. Their threshold for adverse effects of caffeine may also be
at King's C
ollege London on O
ctober 18, 2016http://hm
g.oxfordjournals.org/D
ownloaded from
10
lower. Indeed, the same alleles were associated with lower caffeine and coffee consumption in
previous GWAS (10, 11) and in the UK Biobank in the present study.
The most plausible candidate at 19q13.2 associated with 17X/137X is CYP2A6. Based on
existing knowledge, however, CYP2A6 does not catalyze the demethylation of 137X to 17X, but
rather hydroxylates 17X to 17U (Figure 1). The latter metabolic step is responsible for only 10-
20% of 17X clearance and is also catalyzed by CYP1A2 and xanthine dehydrogenase, but to a
lesser extent relative to CYP2A6 (3, 8, 18, 19). The association between CYP2A6 variation and
17X/137X is likely an indirect result of altered 17X metabolism. Indeed, CYP2A6 variants linked
to higher 17X/137X were associated with higher 17X and lower plasma and urine 17U/17X ratio
(a measure of CYP2A6 activity (20)), but presented with no association with 137X.
Pharmacokinetic studies also report associations between CYP2A6 variation and urine 17U/17X
and (5-acetylamino- 6-amine-3-methyluracil + 1-methylxanthine + 1-methyluric acid )/17U
(originally described as an index of CYP1A2 activity (18, 21, 22). Our interpretation is further
supported by the literature pertaining to CYP2A6 variation and nicotine metabolism. Up to 75%
of nicotine is converted to cotinine (COT) mainly by CYP2A6 and most of COT is converted to
trans 3-hydroxycotinine (THOC) exclusively by CYP2A6 (23). The ratio of THOC/COT is thus
a common proxy for CYP2A6 activity and nicotine clearance (23, 24). rs56113850, our top
19q13.2 index SNP for 17X/137X, was also the top GW-significant SNP reported in a recent
GWAS of plasma THOC/COT by Loukola et al (25). The minor T allele, which we propose
reduces CYP2A6-mediated hydroxylation of 17X, was linked to lower THOC/COT. CYP2A6*2
(rs1801272), encoding a catalytically inactive enzyme (26), and other SNPs at 19q13.2
associated with THOC/COT identified by Loukola et al (25) and others (27), were also
associated with 17X/137X (data not shown). Variants at 19q13.2 linked with lower THOC/COT
at King's C
ollege London on O
ctober 18, 2016http://hm
g.oxfordjournals.org/D
ownloaded from
11
predispose to heavy smoking (27, 28). In the UK Biobank, these same variants were nominally
associated with increased coffee consumption. The weaker CYP2A6-behavior association relative
to CYP1A2- and AHR- behavior associations may reflect the minor role of CYP2A6 in caffeine
metabolism.
A single SNP at 6p23 near CD83 was significantly associated with 17X. Although
associations between this SNP and other plasma and urine caffeine metabolites were also
observed, a plausible link between the 6p23 locus and caffeine metabolism is unknown.
Variation in other candidate genes involved in caffeine metabolism or CYP450 regulation did
not yield statistically significant associations. It is possible that these genes have less common
functional SNPs or very modest effects on plasma caffeine metabolite levels that warrant a larger
sample size to detect.
In addition to loci near CYP1A2 and AHR discussed above, the CCGC identified six
additional SNPs associated with coffee consumption (Table 2). rs17685 maps to the 3’UTR of
POR, encoding P450 oxidoreductase which transfers electrons to all microsomal CYP450s
enzymes (29). Given this function and the observation that the rs17685 C variant associated with
lower coffee consumption (11) was nominally associated with higher plasma caffeine levels, the
mechanism linking this variant to coffee consumption behavior may be similar to that of AHR
and CYP1A2, as discussed above.
rs1481012 at 4q22 maps to ABCG2, encoding a xenobiotic efflux transporter. The more
frequent rs1481012 A allele previously linked with higher coffee consumption was nominally
associated with higher plasma levels of 137X, 17X and 13X compared to the minor G allele. The
latter allele is in LD (CEU: r2=0.92) with a nonsynoymous SNP (rs2231142, Gln141Lys) allele
that results in reduced ABCG2 protein expression and function(30). ABCG2 is expressed in
at King's C
ollege London on O
ctober 18, 2016http://hm
g.oxfordjournals.org/D
ownloaded from
12
apical membranes of the liver, kidney, intestine, and brain, and plays an important role in in
preventing absorption and excessive accumulation of numerous xenobiotic and endogenous
substrates in certain tissues(31). ABCG2 is a plausible candidate but unlikely via its role at the
gastrointestinal, renal or hepatic sites. Caffeine and dimethylxanthines have favorable
permeability characteristics that allow them to readily bypasses efflux transporters and also have
relatively low renal clearance rendering limited contact with renal transporters(32). ABCG2
facilitates biliary excretion of substrates and may also affect hepatic metabolic clearance by
modulating the duration of substrate exposure to hepatic enzymes. Whether biliary excretion of
caffeine is common in healthy individuals is unclear. Even so, if the putative reduced-function
ABCG2 allele impairs caffeine biliary excretion and leads to increased hepatic metabolism of
caffeine, the consequential lower caffeine levels should have been met with a compensatory
increase in dietary caffeine consumption as observed for AHR, CYP1A2 and POR. The positive
correlation of a putative normal ABCG2 variant with both plasma caffeine levels and caffeine
intake behavior suggests this relationship might take place at the blood:brain barrier (BBB);
where ABCG2 functions to restrict the brain penetration of compounds(33). In rats, caffeine
enters the brain by both passive diffusion and active influx and has rapid exchange and
equilibration between the peripheral compartments and the CNS (34, 35). However, little is
known about the distribution properties of caffeine across the human BBB. Whether individuals
with impaired ABCG2 function have higher or longer CNS exposure to caffeine and thus a lower
caffeine dose requirement for neural effects merits further study.
rs1260326 is a nonsynonymous and functional SNP in GCKR that has previously been
associated with over 25 other metabolic traits(36). GCKR is expressed nearly exclusively in the
liver and encodes glucokinase regulatory protein (GKRP). We previously postulated that GCKR
at King's C
ollege London on O
ctober 18, 2016http://hm
g.oxfordjournals.org/D
ownloaded from
13
variation may impact the glucose sensing process of the brain that, in turn, influences central
pathways responding to coffee(11). Also, there are other candidate genes in this region that may
also underlie the association (acting via LD). For example, in the frontal cortex, the rs1260326
SNP alters methylation of PPM1G; a putative regulatory target for Ahr and binding target for
PPP1R1B, which mediates psychostimulant effects of caffeine(11, 37). To our knowledge,
GKRP has no known role in caffeine or xenobiotic metabolism yet the results of the current
study do not rule out the possibility. rs1260326 was strongly associated with 17X/137X and
patterns of associations with caffeine metabolites and coffee drinking behavior were similar to
those for AHR, CYP1A2 and POR (Table 2). Future larger studies are warranted to further
disentangle the association of the GCKR locus with coffee intake and caffeine metabolism.
Variants near 7q11.23, 11p13 and 17q11.2 map near genes including MLXIPL, BDNF and
SLC6A4, respectively, with no known role in caffeine metabolism but possibly roles in response
to caffeine psychostimulant effects. Although alleles at these loci linked to increased intake may
have theoretically been associated with higher caffeine levels, no SNP-metabolite associations
were observed in the current study.
SNPs near AHR associated with higher coffee consumption were also associated with
higher decaffeinated coffee consumption in the CCGC study (11). This finding was replicated in
the current analysis of the UK Biobank, but similar patterns of associations also extended to
variants near CYP1A2, ABCG2, MLXIPL, and POR. These associations may be the result of
Pavlovian conditioning among former regular coffee consumers or perhaps the small amounts of
caffeine in decaffeinated coffee (1). These genetic factors may therefore be good markers of
early or lifetime dietary caffeine exposure.
at King's C
ollege London on O
ctober 18, 2016http://hm
g.oxfordjournals.org/D
ownloaded from
14
The current study adds further support to the hypothesis that individuals adjust their
dietary caffeine consumption to maintain biological exposure levels of caffeine that elicit optimal
stimulant effects. Slow caffeine metabolism or elevated neural exposure may lower the caffeine-
dose response and thus the amount of caffeine consumed. Although this innate self-regulation of
dietary caffeine intake may be beneficial, the effects of other non-caffeine constituents correlated
with dietary caffeine as well as the broader peripheral effects of caffeine may not be subject to
the same regulation and thus accounting for genetic variants identified in the current study may
improve efforts to understand the role of dietary caffeine in health. Moreover, all loci identified
in the current study encode clinically important proteins that contribute to the metabolism of a
wide variety of pharmaceutical drugs and endogenous compounds, and the metabolic activation
of some procarcinogens (6, 38). Specific variants identified thus have important significance that
extends beyond caffeine metabolism. Major limitations of the current study are the cross-
sectional nature of sample collection and non-uniform availability of information on factors
known to alter caffeine metabolism. SNP effect sizes are therefore imprecise and deter further
efforts to characterize potential higher order interactions in the current sample. Complementary
clinical pharmacokinetic studies are thus warranted and the current study represents an efficient
first step that will narrow these more detailed efforts to SNPs with potential clinical significance.
Materials and Methods
Study samples
Studies contributing to the GWAS of caffeine metabolites have been described in detail
previously and included the Prospective Study of the Vasculature in Uppsala Seniors
(PIVUS)(39), the Study of Health in Pomerania TREND (SHIP-TREND)(40), the Swiss Kidney
Project on Genes in Hypertension (SKIPOGH)(41), TwinGene (42), TwinsUK (43), and the
at King's C
ollege London on O
ctober 18, 2016http://hm
g.oxfordjournals.org/D
ownloaded from
15
Uppsala Longitudinal Study of Adult Men (ULSAM)(44). Study samples for the current research
included adults or elderly who provided a fasting blood sample (details in Supplementary
Materials and Methods and Supplementary Table S2). Each study protocol was approved by its
corresponding institutional review board. All participants provided verbal or written informed
consent regarding use of their data and blood specimens for analysis.
Measurement of metabolites
Plasma 137X, 17X, 13X, 37X and 137U were measured as part of large-scale metabolite
profiling projects independently initiated by each study. Sample processing, metabolite data
acquisition and pre-processing have been published in detail elsewhere and is summarized in
Supplementary Table S2. Briefly, metabolite profiling was performed using UPLC-MS/MS
(ULSAM, PIVUS, TwinGene, SKIPOGH) or UPLC-ESI-MS/MS (SHIP-TREND and
TwinsUK). Technical, water, and spiked-standard controls were analyzed in parallel with study
samples. For each metabolite examined in the current study, samples with values of 0 were
excluded as were data points more than 4 standard deviations from the median concentration.
Each study applied a different method for normalizing the distribution of the metabolites and
17X/137X (Supplementary Table S2). To facilitate meta-analysis all data were rescaled to have a
mean of 0 and standard deviation of 1 prior to study-specific GW analysis.
Plasma QN, Trig and additional caffeine metabolites addressed in follow-up analysis
were measured in TwinsUK or SHIP-TREND. Urine measures of eight caffeine-related
metabolites were available in SHIP-TREND and four of these were also available in SKIPOGH.
Urine metabolites were measured by the same methods used for plasma measures but with
modification to sample preparation and pre-processing (Supplementary Table S2-S3). Data were
at King's C
ollege London on O
ctober 18, 2016http://hm
g.oxfordjournals.org/D
ownloaded from
16
normalized and standardized as described above for plasma metabolites and 17X/137X prior to
study-specific GW analysis.
Genotyping, quality control and imputation
DNA was extracted from blood samples using conventional methods. Details of the genotyping
process and QC for each study population have been described previously and also detailed in
Supplementary Table S2. Briefly, genotyping for PIVUS, SHIP-TREND, TwinGene, TwinsUK
and ULSAM was completed using various Illumina GWAS arrays while SKIPOGH samples
were genotyped on the Illumina Metabochip array. At a minimum, DNA samples that did not
meet a 90% completion threshold, and SNPs with low call rates (<95%) and Hardy-Weinberg P
<1 × 10⁻⁵
were dropped. EIGENSTRAT(45) or PLINK(46), along with HapMap II or III
reference populations, were used to carry-out ancestry analyses and any putative non-European
samples were excluded from subsequent analyses. With the exception of SKIPOGH (not
imputed), each study used Minimac(47) or IMPUTE(48) to impute ~31 million SNPs and indels
based on the 1000G v3 ALL reference panel(49). Imputation results are summarized as an “allele
dosage” (a fractional value between 0 and 2), defined as the expected number of copies of a
specified allele at that SNP.
UK Biobank
To complement previously published GWAS of coffee intake behavior (see below), we
performed new candidate SNP association studies of coffee intake behavior in the UK Biobank,
which recruited 502,650 participants aged 37-73 years at 21 centers across England, Wales and
Scotland in 2006-2010(50). Data on usual coffee consumption and other health and lifestyle
at King's C
ollege London on O
ctober 18, 2016http://hm
g.oxfordjournals.org/D
ownloaded from
17
factors was collected by a touchscreen questionnaire that all participants filled out at baseline
(51). Total coffee intake was based on the question: "How many cups of coffee do you drink
each day (include decaffeinated coffee)?" A similar question was asked about tea. Response
units were <1 cup/d or exact cups/day. A separate question about usual type of coffee
(decaffeinated, instant, ground, other, unknown) was also asked. Thus far, ~150,000 participants
have been genotyped using the Affymetrix UK BiLEVE Axiom array and Affymetrix UK
Biobank Axiom® array and imputed to a merged dataset consisting of the UK10K haplotype and
1000G phase 3 reference panels as described previously (52, 53).
Statistical analysis
Genome-wide association studies: Each study performed GWA-testing for each metabolite or
ratio across up to ~31 million SNPs and indels, based on linear regression under an additive
genetic model. Analyses were adjusted for smoking status and, when applicable, age, sex, study-
site, fasting status, family structure and/or study-specific principal components of population
substructure (Supplementary Table S2).
Prior to meta-analysis, we removed SNPs with a minor allele frequency <0.01 or
imputation quality information score <0.4. Fixed effects meta-analyses were performed with
METAL (54) using p-values and effective sample size for each study. The software also
calculates the genomic control (λ) value for each study and then adjusts each study's results using
the corresponding λ value. Supplementary Table S2 provides metabolite- and study-specific
summaries pertaining to number of SNPs contributing to the meta-analysis and λ values. Only
SNP-metabolite associations based on data from at least two studies were used to generate
Manhattan, quantile-quantile, and regional association plots, and for pathway and gene-based
at King's C
ollege London on O
ctober 18, 2016http://hm
g.oxfordjournals.org/D
ownloaded from
18
analysis. Genome-wide significance was defined as the traditional P-value threshold of P<5×10-
8. This threshold was not corrected for multiple traits, since metabolites were significantly
correlated (12) and as expected given a common group of CYP450 isoforms is involved in their
metabolism (Figure 1). The same statistical models were applied to tests of (i) indel-metabolite
associations (candidate genomic regions only); and (ii) follow-up analysis of plasma and urine
metabolites (candidate index SNPs only).
Pathway and candidate gene-based analysis. Summary statistics of GWAS yielding GW-
significant loci (i.e. 137X, 17X, 13X and 17X/137X) were also subject to pathway and candidate
gene-based analyses using MAGENTA(55) and VEGAS(56), respectively. The former uses
gene-based testing as a means to pathway enrichment analysis, while VEGAS was implemented
as a robust validation of the primary findings. Candidate genes included those encoding
CYP1A2-regulating proteins(14), enzymes involved in caffeine metabolism based on existing
knowledge (Figure 1), and members of significant pathways (MAGENTA, FDR>0.05). Gene-
based threshold for significance was defined using a Bonferonni correction for multiple testing
(i.e. number of genes tested).
Potential SNP function: All confirmed index SNPs and their correlated proxies (r2>0.8) were
systematically mined for putative causal variants, eQTLs, cell types, regulators and target genes
using publicly available resources; a process facilitated by Haploreg v4(57). The latter was also
used for enhancer enrichment analysis using the 15-state ChromHMM core model, H3K4me1
peaks and H3K27ac peaks(57). The overlap with enhancers in each cell type was compared to
two background models to assess enrichment: all 1000 Genomes variants with a frequency above
5% in any population and all independent GWAS catalog SNPs. The enrichment relative to these
at King's C
ollege London on O
ctober 18, 2016http://hm
g.oxfordjournals.org/D
ownloaded from
19
background frequencies was performed using a binomial test and uncorrected P-values were
reported.
Overlap of loci for caffeine metabolites and coffee consumption behavior: Metabolite
associations with SNPs previously associated with coffee consumption in the Coffee and
Caffeine Genetics Consortium (CCGC) GWAS (11) were also detected in the current study.
Since the CCGC GWAS was based on HapMap II, the complementary look-up (i.e. SNPs
associated with metabolites) was incomplete. Therefore, de novo candidate SNP analysis of the
UK Biobank cohort was performed following the same linear regression models used in the
GWAS of coffee intake (cups/d among coffee drinkers). Age, sex, genotype array, smoking
status and ten principal components were included in the regression model and was restricted to
unrelated individuals of European Ancestry with high quality genetic data (N=94,343) following
guidelines provided by the UK Biobank Coordinating Centre(58).
Acknowledgements
Full sets of summary association statistics are available at
https://digitalhub.northwestern.edu/users/mcc340 . This work was funded by the American
Diabetes Association (7-13-JF-15 to MCC) with additional funding for study-specific
infrastructure and data collection. SHIP-TREND is part of the Community Medicine Research
net of the University of Greifswald, Germany, which is funded by the Federal Ministry of
Education and Research (BMBF, grants no. 01ZZ9603, 01ZZ0103, and 01ZZ0403), the Ministry
of Cultural Affairs and the Social Ministry of the Federal State of Mecklenburg-West Pomerania.
Generation of genome-wide data for SHIP-TREND was also supported by the BMBF (grant no.
03ZIK012). SKIPOGH is funded by the Swiss National Science Foundation (FN33CM30-
at King's C
ollege London on O
ctober 18, 2016http://hm
g.oxfordjournals.org/D
ownloaded from
20
124087). KS is supported by ‘Biomedical Research Program’ funds at Weill Cornell Medicine in
Qatar, a program funded by the Qatar Foundation.
We thank everyone who has contributed to the data collection, genotyping and analysis of
the individual cohorts, as well as all the study participants. We especially thank Dr Werner
Römisch-Margl who contributed to SHIP sample preparation. This research has been conducted
using the UK Biobank Resource. Summary-level and UK Biobank computations in this paper
were run on the Quest cluster supported in part through the computational resources and staff
contributions provided for the Quest high performance computing facility at Northwestern
University, which is jointly supported by the Office of the Provost, the Office for Research, and
Northwestern University Information Technology.
The SKIPOGH team
Murielle Bochud6, Michel Burnier
27, Olivier Devuyst
28, Pierre-Yves Martin
29, Markus
Mohaupt30
,Fred Paccaud6, Antoinette Pechère-Bertschi
31, Bruno Vogt
30, Daniel Ackermann
30,
Georg Ehret12,13
, Idris Guessous6,14
, Belen Ponte29
& Menno Pruijm27
27Department of Nephrology, Lausanne University Hospital, Lausanne, Switzerland.
28Institute
of Physiology, Zurich Center for Integrative Human Physiology, University of Zurich, Zurich,
Switzerland; 29
Department of Nephrology, Geneva University Hospitals, Geneva, Switzerland;
30Department of Nephrology, Hypertension and Clinical Pharmacology, Inselspital, University
Hospital and University of Bern, Bern, Switzerland; 31
Hypertension Unit, Geneva University
Hospitals, Geneva, Switzerland.
Conflicts of Interest
The authors declare no conflict of interest.
at King's C
ollege London on O
ctober 18, 2016http://hm
g.oxfordjournals.org/D
ownloaded from
21
References
1 Fredholm, B.B., Battig, K., Holmen, J., Nehlig, A. and Zvartau, E.E. (1999) Actions of
caffeine in the brain with special reference to factors that contribute to its widespread use.
Pharmacol. Rev., 51, 83-133.
2 Heckman, M.A., Weil, J. and Gonzalez de Mejia, E. (2010) Caffeine (1, 3, 7-
trimethylxanthine) in foods: a comprehensive review on consumption, functionality,
safety, and regulatory matters. J. Food Sci., 75, R77-87.
3 Gu, L., Gonzalez, F.J., Kalow, W. and Tang, B.K. (1992) Biotransformation of caffeine,
paraxanthine, theobromine and theophylline by cDNA-expressed human CYP1A2 and
CYP2E1. Pharmacogenetics, 2, 73-77.
4 Cornelis, M.C. (2015) Toward systems epidemiology of coffee and health. Curr. Opin.
Lipidol., 26, 20-29.
5 Thorn, C.F., Aklillu, E., McDonagh, E.M., Klein, T.E. and Altman, R.B. (2012)
PharmGKB summary: caffeine pathway. Pharmacogenet. Genomics, 22, 389.
6 Gunes, A. and Dahl, M.L. (2008) Variation in CYP1A2 activity and its clinical
implications: influence of environmental factors and genetic polymorphisms.
Pharmacogenomics, 9, 625-637.
7 Thorn, C.F., Aklillu, E., Klein, T.E. and Altman, R.B. (2012) PharmGKB summary: very
important pharmacogene information for CYP1A2. Pharmacogenet. Genomics, 22, 73-
77.
8 Perera, V., Gross, A.S. and McLachlan, A.J. (2012) Measurement of CYP1A2 activity: a
focus on caffeine as a probe. Curr. Drug Metab., 13, 667-678.
at King's C
ollege London on O
ctober 18, 2016http://hm
g.oxfordjournals.org/D
ownloaded from
22
9 Perera, V., Gross, A.S. and McLachlan, A.J. (2012) Influence of environmental and
genetic factors on CYP1A2 activity in individuals of South Asian and European ancestry.
Clin. Pharmacol. Ther., 92, 511-519.
10 Cornelis, M.C., Monda, K.L., Yu, K., Paynter, N., Azzato, E.M., Bennett, S.N., Berndt,
S.I., Boerwinkle, E., Chanock, S., Chatterjee, N. et al. (2011) Genome-wide meta-
analysis identifies regions on 7p21 (AHR) and 15q24 (CYP1A2) as determinants of
habitual caffeine consumption. PLoS Genet., 7, e1002033.
11 Coffee and Caffeine Genetics Consortium, Cornelis, M.C., Byrne, E.M., Esko, T., Nalls,
M.A., Ganna, A., Paynter, N., Monda, K.L., Amin, N., Fischer, K. et al. (2015) Genome-
wide meta-analysis identifies six novel loci associated with habitual coffee consumption.
Mol. Psychiatry, 20, 647-656.
12 Shin, S.Y., Fauman, E.B., Petersen, A.K., Krumsiek, J., Santos, R., Huang, J., Arnold,
M., Erte, I., Forgetta, V., Yang, T.P. et al. (2014) An atlas of genetic influences on
human blood metabolites. Nat. Genet., 46, 543-550.
13 Suhre, K., Shin, S.Y., Petersen, A.K., Mohney, R.P., Meredith, D., Wagele, B., Altmaier,
E., Deloukas, P., Erdmann, J., Grundberg, E. et al. (2011) Human metabolic individuality
in biomedical and pharmaceutical research. Nature, 477, 54-60.
14 Klein, K., Winter, S., Turpeinen, M., Schwab, M. and Zanger, U.M. (2010) Pathway-
Targeted Pharmacogenomics of CYP1A2 in Human Liver. Front. Pharmacol., 1, 129.
15 Beischlag, T.V., Luis Morales, J., Hollingshead, B.D. and Perdew, G.H. (2008) The aryl
hydrocarbon receptor complex and the control of gene expression. Crit. Rev. Eukaryot.
Gene Expr., 18, 207-250.
at King's C
ollege London on O
ctober 18, 2016http://hm
g.oxfordjournals.org/D
ownloaded from
23
16 Kot, M. and Daniel, W.A. (2008) The relative contribution of human cytochrome P450
isoforms to the four caffeine oxidation pathways: an in vitro comparative study with
cDNA-expressed P450s including CYP2C isoforms. Biochem. Pharmacol., 76, 543-551.
17 Le Vee, M., Jouan, E. and Fardel, O. (2010) Involvement of aryl hydrocarbon receptor in
basal and 2,3,7,8-tetrachlorodibenzo-p-dioxin-induced expression of target genes in
primary human hepatocytes. Toxicol. In Vitro, 24, 1775-1781.
18 Kimura, M., Yamazaki, H., Fujieda, M., Kiyotani, K., Honda, G., Saruwatari, J.,
Nakagawa, K., Ishizaki, T. and Kamataki, T. (2005) CYP2A6 is a principle enzyme
involved in hydroxylation of 1,7-dimethylxanthine, a main caffeine metabolite in
humans. Drug Metab. Dispos., 33, 1361-1366.
19 Campbell, M.E., Grant, D.M., Inaba, T. and Kalow, W. (1987) Biotransformation of
caffeine, paraxanthine, theophylline, and theobromine by polycyclic aromatic
hydrocarbon-inducible cytochrome(s) P-450 in human liver microsomes. Drug Metab.
Dispos., 15, 237-249.
20 Begas, E., Kouvaras, E., Tsakalof, A., Papakosta, S. and Asprodini, E.K. (2007) In vivo
evaluation of CYP1A2, CYP2A6, NAT-2 and xanthine oxidase activities in a Greek
population sample by the RP-HPLC monitoring of caffeine metabolic ratios. Biomed.
Chromatogr., 21, 190-200.
21 Denaro, C.P., Wilson, M., Jacob, P. and Benowitz, N.L. (1996) Validation of urine
caffeine metabolite ratios with use of stable isotope‐labeled caffeine clearance. Clin.
Pharmacol. Ther., 59, 284-296.
at King's C
ollege London on O
ctober 18, 2016http://hm
g.oxfordjournals.org/D
ownloaded from
24
22 Djordjevic, N., Carrillo, J.A., Gervasini, G., Jankovic, S. and Aklillu, E. (2010) In vivo
evaluation of CYP2A6 and xanthine oxidase enzyme activities in the Serbian population.
Eur. J. Clin. Pharmacol., 66, 571-578.
23 Benowitz, N.L., Swan, G.E., Jacob, P., 3rd, Lessov-Schlaggar, C.N. and Tyndale, R.F.
(2006) CYP2A6 genotype and the metabolism and disposition kinetics of nicotine. Clin.
Pharmacol. Ther., 80, 457-467.
24 Dempsey, D., Tutka, P., Jacob, P., 3rd, Allen, F., Schoedel, K., Tyndale, R.F. and
Benowitz, N.L. (2004) Nicotine metabolite ratio as an index of cytochrome P450 2A6
metabolic activity. Clin. Pharmacol. Ther., 76, 64-72.
25 Loukola, A., Buchwald, J., Gupta, R., Palviainen, T., Hällfors, J., Tikkanen, E.,
Korhonen, T., Ollikainen, M., Sarin, A.-P. and Ripatti, S. (2015) A genome-wide
association study of a biomarker of nicotine metabolism. PLoS Genet., 11, e1005498.
26 Raunio, H. and Rahnasto-Rilla, M. (2012) CYP2A6: genetics, structure, regulation, and
function. Drug Metabol. Drug Interact., 27, 73-88.
27 Bergen, A.W., Michel, M., Nishita, D., Krasnow, R., Javitz, H.S., Conneely, K.N.,
Lessov-Schlaggar, C.N., Hops, H., Zhu, A.Z. and Baurley, J.W. (2015) Drug
metabolizing enzyme and transporter gene variation, nicotine metabolism, prospective
abstinence, and cigarette consumption. PLoS ONE, 10, e0126113.
28 Thorgeirsson, T.E., Gudbjartsson, D.F., Surakka, I., Vink, J.M., Amin, N., Geller, F.,
Sulem, P., Rafnar, T., Esko, T., Walter, S. et al. (2010) Sequence variants at CHRNB3-
CHRNA6 and CYP2A6 affect smoking behavior. Nat. Genet., 42, 448-453.
at King's C
ollege London on O
ctober 18, 2016http://hm
g.oxfordjournals.org/D
ownloaded from
25
29 Hu, L., Zhuo, W., He, Y.J., Zhou, H.H. and Fan, L. (2012) Pharmacogenetics of P450
oxidoreductase: implications in drug metabolism and therapy. Pharmacogenet.
Genomics, 22, 812-819.
30 Giacomini, K., Balimane, P., Cho, S., Eadon, M., Edeki, T., Hillgren, K., Huang, S.M.,
Sugiyama, Y., Weitz, D. and Wen, Y. (2013) International Transporter Consortium
commentary on clinically important transporter polymorphisms. Clin. Pharmacol. Ther.,
94, 23-26.
31 Klaassen, C.D. and Aleksunes, L.M. (2010) Xenobiotic, bile acid, and cholesterol
transporters: function and regulation. Pharmacol. Rev., 62, 1-96.
32 Arnaud, M.J. (2011) Pharmacokinetic and metabolism of natural methylxanthines in
animal and man. In Fredholm, B. (ed.),Methylxanthines. Springer, pp. 33-92.
33 Vlaming, M.L., Lagas, J.S. and Schinkel, A.H. (2009) Physiological and pharmacological
roles of ABCG2 (BCRP): recent findings in Abcg2 knockout mice. Adv. Drug Deliv.
Rev., 61, 14-25.
34 McCall, A.L., Millington, W.R. and Wurtman, R.J. (1982) Blood-brain barrier transport
of caffeine: dose-related restriction of adenine transport. Life Sci., 31, 2709-2715.
35 Shyr, M.-H., Lin, L.-C., Chang, C.-H., Wu, Y.-T., Hsieh, Y.-J. and Tsai, T.-H. (2006)
Hepatobiliary excretion and brain distribution of caffeine in rats using microdialysis.
Anal. Chim. Acta, 566, 265-270.
36 Burdett , T., Hall, P., Hastings, E., Hindorf, L., Junkins, H.A., Klemm, A., MacArthur, J.,
Manolio, T., Morales, J., Parkinson, H. et al. (2016) The NHGRI-EBI Catalog of
published genome-wide association studies,www.ebi.ac.uk/gwas, Accessed April 2016
at King's C
ollege London on O
ctober 18, 2016http://hm
g.oxfordjournals.org/D
ownloaded from
26
37 Lindskog, M., Svenningsson, P., Pozzi, L., Kim, Y., Fienberg, A.A., Bibb, J.A.,
Fredholm, B.B., Nairn, A.C., Greengard, P. and Fisone, G. (2002) Involvement of
DARPP-32 phosphorylation in the stimulant action of caffeine. Nature, 418, 774-778.
38 Zanger, U.M. and Schwab, M. (2013) Cytochrome P450 enzymes in drug metabolism:
regulation of gene expression, enzyme activities, and impact of genetic variation.
Pharmacol. Ther., 138, 103-141.
39 Lind, L., Fors, N., Hall, J., Marttala, K. and Stenborg, A. (2005) A comparison of three
different methods to evaluate endothelium-dependent vasodilation in the elderly: the
Prospective Investigation of the Vasculature in Uppsala Seniors (PIVUS) study.
Arterioscler. Thromb. Vasc. Biol., 25, 2368-2375.
40 Volzke, H., Alte, D., Schmidt, C.O., Radke, D., Lorbeer, R., Friedrich, N., Aumann, N.,
Lau, K., Piontek, M., Born, G. et al. (2011) Cohort profile: the study of health in
Pomerania. Int. J. Epidemiol., 40, 294-307.
41 Ponte, B., Pruijm, M., Ackermann, D., Vuistiner, P., Eisenberger, U., Guessous, I.,
Rousson, V., Mohaupt, M.G., Alwan, H., Ehret, G. et al. (2014) Reference values and
factors associated with renal resistive index in a family-based population study.
Hypertension, 63, 136-142.
42 Magnusson, P.K., Almqvist, C., Rahman, I., Ganna, A., Viktorin, A., Walum, H.,
Halldner, L., Lundstrom, S., Ullen, F., Langstrom, N. et al. (2013) The Swedish Twin
Registry: establishment of a biobank and other recent developments. Twin Res. Hum.
Genet., 16, 317-329.
43 Moayyeri, A., Hammond, C.J., Valdes, A.M. and Spector, T.D. (2013) Cohort Profile:
TwinsUK and healthy ageing twin study. Int. J. Epidemiol., 42, 76-85.
at King's C
ollege London on O
ctober 18, 2016http://hm
g.oxfordjournals.org/D
ownloaded from
27
44 Ingelsson, E., Sundstrom, J., Arnlov, J., Zethelius, B. and Lind, L. (2005) Insulin
resistance and risk of congestive heart failure. Jama, 294, 334-341.
45 Price, A.L., Patterson, N.J., Plenge, R.M., Weinblatt, M.E., Shadick, N.A. and Reich, D.
(2006) Principal components analysis corrects for stratification in genome-wide
association studies. Nat. Genet., 38, 904-909.
46 Purcell, S., Neale, B., Todd-Brown, K., Thomas, L., Ferreira, M.A., Bender, D., Maller,
J., Sklar, P., de Bakker, P.I., Daly, M.J. et al. (2007) PLINK: a tool set for whole-genome
association and population-based linkage analyses. Am. J. Hum. Genet., 81, 559-575.
47 Fuchsberger, C., Abecasis, G.R. and Hinds, D.A. (2015) minimac2: faster genotype
imputation. Bioinformatics, 31, 782-784.
48 Howie, B., Fuchsberger, C., Stephens, M., Marchini, J. and Abecasis, G.R. (2012) Fast
and accurate genotype imputation in genome-wide association studies through pre-
phasing. Nat. Genet., 44, 955-959.
49 Abecasis, G.R., Auton, A., Brooks, L.D., DePristo, M.A., Durbin, R.M., Handsaker, R.E.,
Kang, H.M., Marth, G.T. and McVean, G.A. (2012) An integrated map of genetic
variation from 1,092 human genomes. Nature, 491, 56-65.
50 UK Biobank Coordinating Centre. (2007) UK Biobank: Protocol for a large-scale
prospective epidemiological resource,http://www.ukbiobank.ac.uk/wp-
content/uploads/2011/11/UK-Biobank-Protocol.pdf
51 UK Biobank Coordinating Centre. (2006) UK Biobank touch-screen questionnaire: final
version,http://biobank.ctsu.ox.ac.uk/crystal/docs/TouchscreenQuestionsMainFinal.pdf
at King's C
ollege London on O
ctober 18, 2016http://hm
g.oxfordjournals.org/D
ownloaded from
28
52 UK biobank Coordinating Centre. (2014) UK Biobank Axiom
Array,http://www.ukbiobank.ac.uk/wp-content/uploads/2014/04/UK-Biobank-Axiom-
Array-Content-Summary-2014.pdf
53 UK Biobank Coordinating Centre. (2015) Genotype imputation and genetic association
studies using UK Biobank data,http://biobank.ctsu.ox.ac.uk/crystal/refer.cgi?id=157020
54 Willer, C.J., Li, Y. and Abecasis, G.R. (2010) METAL: fast and efficient meta-analysis
of genomewide association scans. Bioinformatics, 26, 2190-2191.
55 Segre, A.V., Groop, L., Mootha, V.K., Daly, M.J. and Altshuler, D. (2010) Common
inherited variation in mitochondrial genes is not enriched for associations with type 2
diabetes or related glycemic traits. PLoS Genet., 6, e1001058.
56 Liu, J.Z., McRae, A.F., Nyholt, D.R., Medland, S.E., Wray, N.R., Brown, K.M.,
Hayward, N.K., Montgomery, G.W., Visscher, P.M., Martin, N.G. et al. (2010) A
versatile gene-based test for genome-wide association studies. Am. J. Hum. Genet., 87,
139-145.
57 Ward, L.D. and Kellis, M. (2016) HaploReg v4: systematic mining of putative causal
variants, cell types, regulators and target genes for human complex traits and disease.
Nucleic Acids Res., 44, D877-D881.
58 UK Biobank Coordinating Centre. (2015) Genotype imputation and genetic association
studies of UK Biobank,http://www.ukbiobank.ac.uk/wp-
content/uploads/2014/04/imputation_documentation_May2015.pdf
at King's C
ollege London on O
ctober 18, 2016http://hm
g.oxfordjournals.org/D
ownloaded from
29
Legends to Figures
Figure 1
Our current understanding of caffeine metabolism in humans. Metabolites underlined are
amongst those examined in the current study. 137X: 1,3,7-trimethylxanthine (caffeine); 17X:
1,7-dimethylxanthine (paraxanthine); 13X: 1,3-dimethylxanthine (theophylline); 37X: 3,7-
dimethylxanthine (theobromine); 137U:1,3,7-trimethyluric acid; 17U: 1,7-dimethyluric acid;
13U:1,3-dimethyluric acid; 37U: 3,7-dimethyluric acid; 1MX: 1-methylxanthine; 3MX: 3-
methylxanthine; 7MX: 7-methylxanthine; 1MU: 1-methyluric acid; 3MU: 3-methyluric acid;
7MU: 7-methyluric acid; AFMU: 5-acetylamino-6-formylamino-3-methyluracil. Data from (7,
8).
at King's C
ollege London on O
ctober 18, 2016http://hm
g.oxfordjournals.org/D
ownloaded from
30
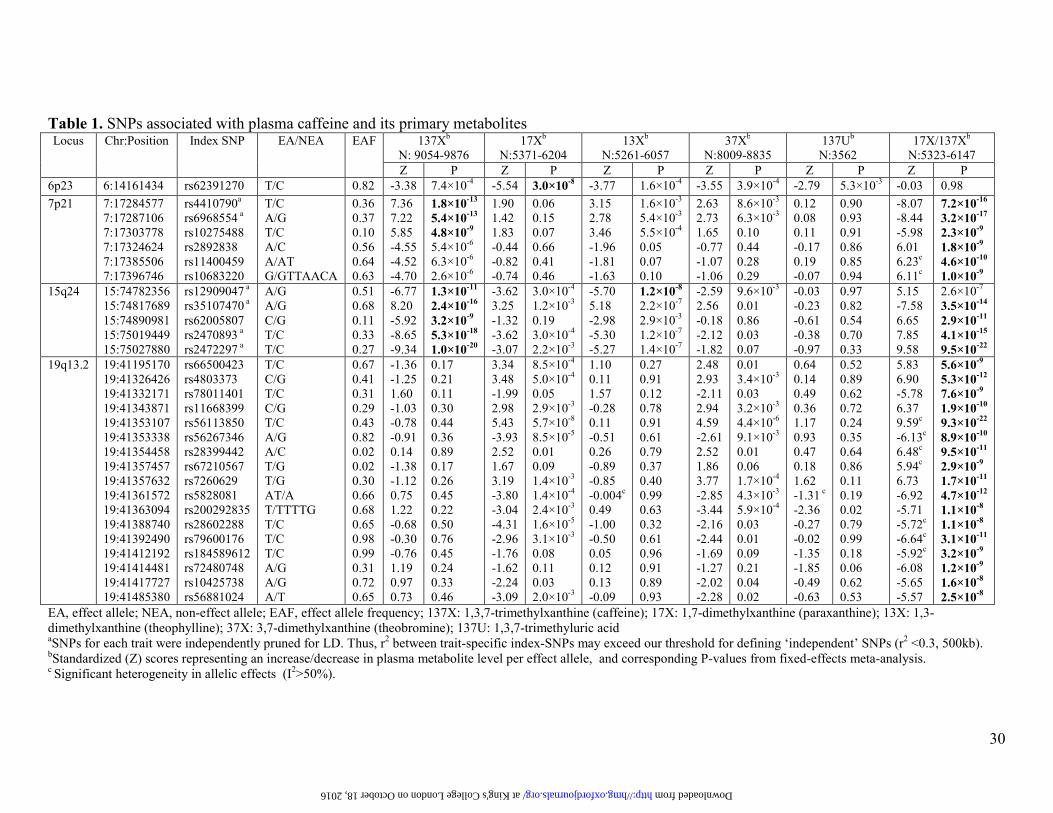
Table 1. SNPs associated with plasma caffeine and its primary metabolites Locus Chr:Position Index SNP EA/NEA EAF 137X
b
N: 9054-9876
17Xb
N:5371-6204
13Xb
N:5261-6057
37Xb
N:8009-8835
137Ub
N:3562
17X/137Xb
N:5323-6147
Z P Z P Z P Z P Z P Z P
6p23 6:14161434 rs62391270 T/C 0.82 -3.38 7.4×10⁻⁴
-5.54 3.0×10⁻⁸ -3.77 1.6×10
-4 -3.55 3.9×10
-4 -2.79 5.3×10
-3 -0.03 0.98
7p21 7:17284577
7:17287106
7:17303778
7:17324624
7:17385506
7:17396746
rs4410790a
rs6968554 a
rs10275488
rs2892838
rs11400459
rs10683220
T/C
A/G
T/C
A/C
A/AT
G/GTTAACA
0.36
0.37
0.10
0.56
0.64
0.63
7.36
7.22
5.85
-4.55
-4.52
-4.70
1.8×10⁻¹³
5.4×10⁻¹³
4.8×10⁻⁹
5.4×10⁻⁶
6.3×10⁻⁶
2.6×10⁻⁶
1.90
1.42
1.83
-0.44
-0.82
-0.74
0.06
0.15
0.07
0.66
0.41
0.46
3.15
2.78
3.46
-1.96
-1.81
-1.63
1.6×10⁻³
5.4×10⁻³
5.5×10⁻⁴
0.05
0.07
0.10
2.63
2.73
1.65
-0.77
-1.07
-1.06
8.6×10⁻³
6.3×10⁻³
0.10
0.44
0.28
0.29
0.12
0.08
0.11
-0.17
0.19
-0.07
0.90
0.93
0.91
0.86
0.85
0.94
-8.07
-8.44
-5.98
6.01
6.23c
6.11c
7.2×10⁻¹⁶
3.2×10⁻¹⁷
2.3×10⁻⁹
1.8×10⁻⁹
4.6×10⁻¹⁰
1.0×10⁻⁹
15q24 15:74782356
15:74817689
15:74890981
15:75019449
15:75027880
rs12909047 a
rs35107470 a
rs62005807
rs2470893 a
rs2472297 a
A/G
A/G
C/G
T/C
T/C
0.51
0.68
0.11
0.33
0.27
-6.77
8.20
-5.92
-8.65
-9.34
1.3×10⁻¹¹
2.4×10⁻¹⁶
3.2×10⁻⁹
5.3×10⁻¹⁸
1.0×10⁻²⁰
-3.62
3.25
-1.32
-3.62
-3.07
3.0×10⁻⁴
1.2×10⁻³
0.19
3.0×10⁻⁴
2.2×10⁻³
-5.70
5.18
-2.98
-5.30
-5.27
1.2×10⁻⁸
2.2×10⁻⁷
2.9×10⁻³
1.2×10⁻⁷
1.4×10⁻⁷
-2.59
2.56
-0.18
-2.12
-1.82
9.6×10⁻³
0.01
0.86
0.03
0.07
-0.03
-0.23
-0.61
-0.38
-0.97
0.97
0.82
0.54
0.70
0.33
5.15
-7.58
6.65
7.85
9.58
2.6×10⁻⁷
3.5×10⁻¹⁴
2.9×10⁻¹¹
4.1×10⁻¹⁵
9.5×10⁻²²
19q13.2 19:41195170
19:41326426
19:41332171
19:41343871
19:41353107
19:41353338
19:41354458
19:41357457
19:41357632
19:41361572
19:41363094
19:41388740
19:41392490
19:41412192
19:41414481
19:41417727
19:41485380
rs66500423
rs4803373
rs78011401
rs11668399
rs56113850
rs56267346
rs28399442
rs67210567
rs7260629
rs5828081
rs200292835
rs28602288
rs79600176
rs184589612
rs72480748
rs10425738
rs56881024
T/C
C/G
T/C
C/G
T/C
A/G
A/C
T/G
T/G
AT/A
T/TTTTG
T/C
T/C
T/C
A/G
A/G
A/T
0.67
0.41
0.31
0.29
0.43
0.82
0.02
0.02
0.30
0.66
0.68
0.65
0.98
0.99
0.31
0.72
0.65
-1.36
-1.25
1.60
-1.03
-0.78
-0.91
0.14
-1.38
-1.12
0.75
1.22
-0.68
-0.30
-0.76
1.19
0.97
0.73
0.17
0.21
0.11
0.30
0.44
0.36
0.89
0.17
0.26
0.45
0.22
0.50
0.76
0.45
0.24
0.33
0.46
3.34
3.48
-1.99
2.98
5.43
-3.93
2.52
1.67
3.19
-3.80
-3.04
-4.31
-2.96
-1.76
-1.62
-2.24
-3.09
8.5×10⁻⁴
5.0×10⁻⁴
0.05
2.9×10⁻³
5.7×10⁻⁸
8.5×10⁻⁵
0.01
0.09
1.4×10⁻³
1.4×10⁻⁴
2.4×10⁻³
1.6×10⁻⁵
3.1×10⁻³
0.08
0.11
0.03
2.0×10⁻³
1.10
0.11
1.57
-0.28
0.11
-0.51
0.26
-0.89
-0.85
-0.004c
0.49
-1.00
-0.50
0.05
0.12
0.13
-0.09
0.27
0.91
0.12
0.78
0.91
0.61
0.79
0.37
0.40
0.99
0.63
0.32
0.61
0.96
0.91
0.89
0.93
2.48
2.93
-2.11
2.94
4.59
-2.61
2.52
1.86
3.77
-2.85
-3.44
-2.16
-2.44
-1.69
-1.27
-2.02
-2.28
0.01
3.4×10⁻³
0.03
3.2×10⁻³
4.4×10⁻⁶
9.1×10⁻³
0.01
0.06
1.7×10⁻⁴
4.3×10⁻³
5.9×10⁻⁴
0.03
0.01
0.09
0.21
0.04
0.02
0.64
0.14
0.49
0.36
1.17
0.93
0.47
0.18
1.62
-1.31 c
-2.36
-0.27
-0.02
-1.35
-1.85
-0.49
-0.63
0.52
0.89
0.62
0.72
0.24
0.35
0.64
0.86
0.11
0.19
0.02
0.79
0.99
0.18
0.06
0.62
0.53
5.83
6.90
-5.78
6.37
9.59c
-6.13c
6.48c
5.94c
6.73
-6.92
-5.71
-5.72c
-6.64c
-5.92c
-6.08
-5.65
-5.57
5.6×10⁻⁹
5.3×10⁻¹²
7.6×10⁻⁹
1.9×10⁻¹⁰
9.3×10⁻²²
8.9×10⁻¹⁰
9.5×10⁻¹¹
2.9×10⁻⁹
1.7×10⁻¹¹
4.7×10⁻¹²
1.1×10⁻⁸
1.1×10⁻⁸
3.1×10⁻¹¹
3.2×10⁻⁹
1.2×10⁻⁹
1.6×10⁻⁸
2.5×10⁻⁸
EA, effect allele; NEA, non-effect allele; EAF, effect allele frequency; 137X: 1,3,7-trimethylxanthine (caffeine); 17X: 1,7-dimethylxanthine (paraxanthine); 13X: 1,3-
dimethylxanthine (theophylline); 37X: 3,7-dimethylxanthine (theobromine); 137U: 1,3,7-trimethyluric acid aSNPs for each trait were independently pruned for LD. Thus, r
2 between trait-specific index-SNPs may exceed our threshold for defining ‘independent’ SNPs (r
2 <0.3, 500kb).
bStandardized (Z) scores representing an increase/decrease in plasma metabolite level per effect allele, and corresponding P-values from fixed-effects meta-analysis.
c Significant heterogeneity in allelic effects (I
2>50%).
5051525354555657585960
at King's College London on October 18, 2016 http://hmg.oxfordjournals.org/ Downloaded from
31
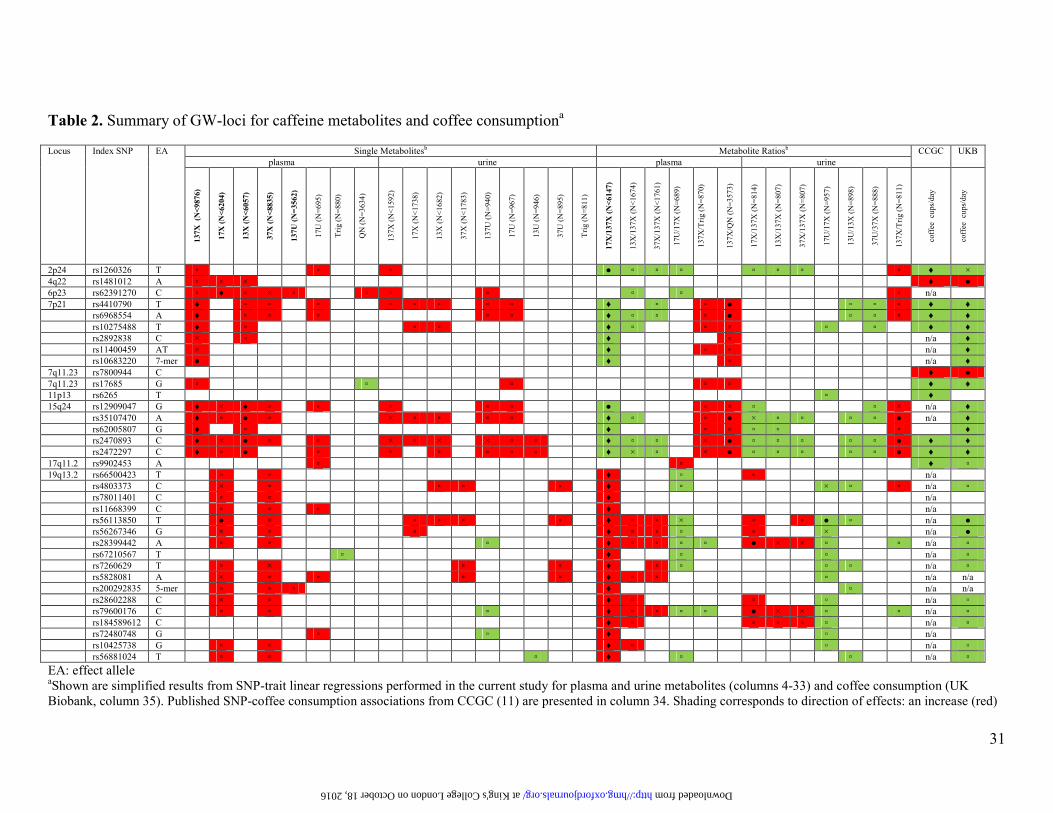
Table 2. Summary of GW-loci for caffeine metabolites and coffee consumptiona
Locus Index SNP EA Single Metabolitesb Metabolite Ratiosb CCGC UKB
plasma urine plasma urine
137X (N
<9876)
17X (N<6204)
13X (N<6057)
37X (N<8835)
137U (N=3562)
17U
(N
=695)
Tri
g (
N=
880)
QN
(N
=3634)
137X
(N
<1592)
17X
(N
<1738)
13X
(N
<1682)
37X
(N
<1783)
137U
(N
=940)
17U
(N
=967)
13U
(N
=946)
37U
(N
=895)
Tri
g (
N=
811)
17X/137X (N<6147)
13X
/137X
(N
<1674)
37X
/137X
(N
<1761)
17U
/17X
(N
=689)
137X
/Tri
g (
N=
870)
137X
/QN
(N
=3573)
17X
/137X
(N
=814)
13X
/137X
(N
=807)
37X
/137X
(N
=807)
17U
/17X
(N
=957)
13U
/13X
(N
=898)
37U
/37X
(N
=888)
137X
/Tri
g (
N=
811)
coff
ee
cups/
day
coff
ee
cups/
day
2p24 rs1260326 T ▫ ▫ ▫ ● ▫ ▫ ▫ ▫ ▫ ▫ ▫ ♦ ×
4q22 rs1481012 A ▫ ▫ × ♦ ●
6p23 rs62391270 C ▫ ♦ × × ▫ ▫ ▫ ▫ ▫ ▫ ▫ n/a
7p21 rs4410790 T ♦ ▫ ▫ ▫ ▫ ▫ ▫ ▫ ▫ ♦ ▫ ▫ ● ▫ ▫ ▫ ♦ ♦ rs6968554 A ♦ ▫ ▫ ▫ ▫ ▫ ♦ ▫ ▫ ▫ ● ▫ ▫ ▫ ♦ ♦ rs10275488 T ♦ ▫ ▫ ▫ ♦ ▫ ▫ × ▫ ▫ ♦ ♦ rs2892838 C × ▫ ♦ ▫ n/a ♦ rs11400459 AT × ♦ ▫ ▫ n/a ♦ rs10683220 7-mer ● ♦ ▫ n/a ♦ 7q11.23 rs7800944 C ♦ ●
7q11.23 rs17685 G ▫ ▫ ▫ ▫ ▫ ♦ ♦
11p13 rs6265 T ▫ ♦
15q24 rs12909047 G ♦ × ♦ ▫ ▫ ▫ ▫ ▫ ● ▫ × ▫ ▫ × n/a ♦ rs35107470 A ♦ ▫ ● ▫ × ▫ ▫ ▫ ▫ ♦ ▫ ▫ ● × ▫ ▫ ▫ ▫ ● n/a ♦ rs62005807 G ♦ ▫ ♦ ▫ × ▫ ▫ ▫ ♦ rs2470893 C ♦ × ● ▫ ▫ × ▫ × × ▫ ▫ ♦ ▫ ▫ × ● ▫ ▫ ▫ ▫ ▫ ● ♦ ♦ rs2472297 C ♦ ▫ ● ▫ ▫ ▫ ▫ ▫ ▫ ♦ × ▫ × ● ▫ ▫ ▫ ▫ ▫ ● ♦ ♦ 17q11.2 rs9902453 A ▫ ▫ ♦ ▫ 19q13.2 rs66500423 T ▫ ▫ ♦ ▫ ▫ n/a
rs4803373 C × ▫ ▫ ▫ ▫ ♦ ▫ × ▫ ▫ n/a ▫
rs78011401 C ▫ ▫ ♦ n/a
rs11668399 C ▫ ▫ ▫ ♦ n/a
rs56113850 T ● × ▫ ▫ ▫ ▫ ♦ ▫ ▫ × ▫ ▫ ● ▫ n/a ●
rs56267346 G × ▫ ▫ ♦ ▫ ▫ ▫ ▫ × n/a ●
rs28399442 A ▫ ▫ ▫ ♦ ▫ ▫ ▫ ▫ ● × × ▫ ▫ n/a ▫
rs67210567 T ▫ ♦ ▫ ▫ n/a ▫
rs7260629 T ▫ × ▫ ▫ ♦ ▫ ▫ ▫ ▫ n/a ▫
rs5828081 A × ▫ ▫ ▫ ▫ ♦ ▫ ▫ ▫ n/a n/a
rs200292835 5-mer ▫ ▫ ▫ ♦ ▫ n/a n/a
rs28602288 C × ▫ ♦ ▫ ▫ ▫ n/a ▫
rs79600176 C ▫ ▫ ▫ ♦ ▫ ▫ ▫ ▫ ● × × ▫ ▫ n/a ▫
rs184589612 C ♦ ▫ ▫ ▫ ▫ ▫ n/a ▫
rs72480748 G ▫ ▫ ♦ ▫ n/a
rs10425738 G ▫ ▫ ♦ ▫ ▫ n/a ▫
rs56881024 T ▫ ▫ ▫ ♦ ▫ ▫ n/a ▫
EA: effect allele aShown are simplified results from SNP-trait linear regressions performed in the current study for plasma and urine metabolites (columns 4-33) and coffee consumption (UK
Biobank, column 35). Published SNP-coffee consumption associations from CCGC (11) are presented in column 34. Shading corresponds to direction of effects: an increase (red)
5051525354555657585960
at King's College London on October 18, 2016 http://hmg.oxfordjournals.org/ Downloaded from
32
or decrease (green) in metabolite levels or coffee consumed. Symbols correspond to statistical tests: ♦P<2.5×10⁻⁸
; ●P<5×10⁻⁶
; ×P<5×10⁻⁴
; ▫P<0.05; n/a: data not available; no
symbol: P ≥0.05 bSee Supplementary Table S1 and Figure 1 for metabolite full names. Bold-face metabolites were subject to GWAS in the current report.
5051525354555657585960
at King's College London on October 18, 2016 http://hmg.oxfordjournals.org/ Downloaded from
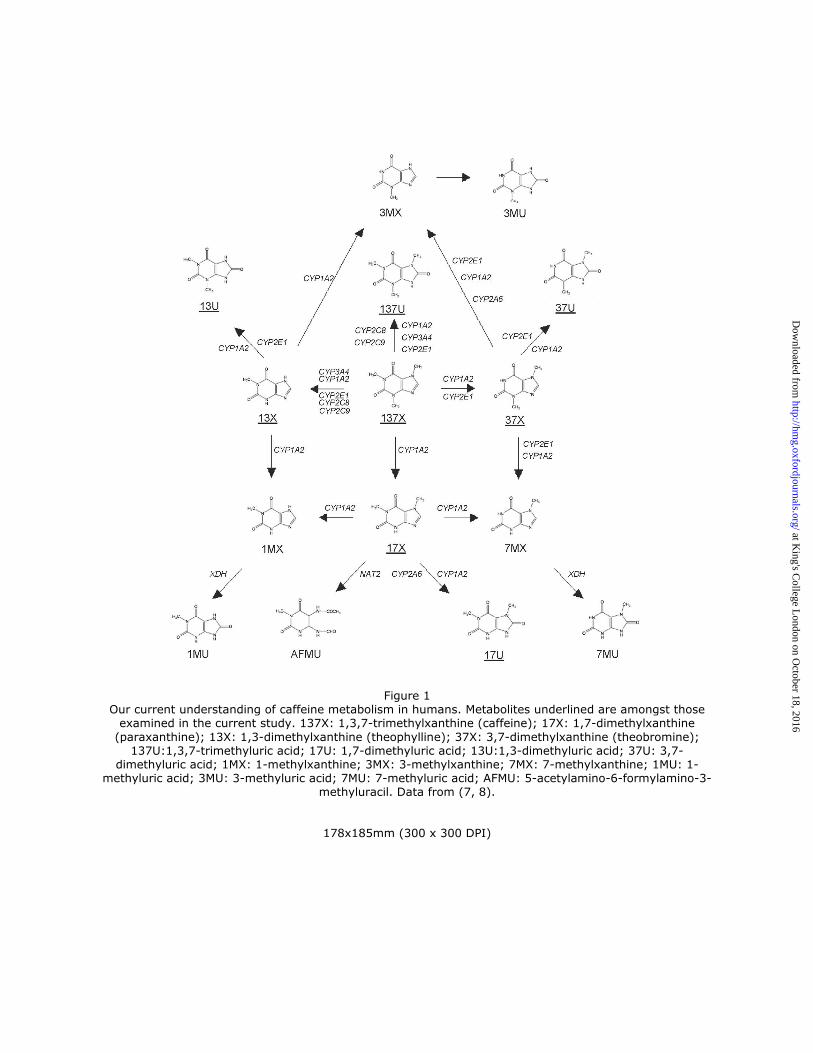
Figure 1 Our current understanding of caffeine metabolism in humans. Metabolites underlined are amongst those examined in the current study. 137X: 1,3,7-trimethylxanthine (caffeine); 17X: 1,7-dimethylxanthine
(paraxanthine); 13X: 1,3-dimethylxanthine (theophylline); 37X: 3,7-dimethylxanthine (theobromine); 137U:1,3,7-trimethyluric acid; 17U: 1,7-dimethyluric acid; 13U:1,3-dimethyluric acid; 37U: 3,7-
dimethyluric acid; 1MX: 1-methylxanthine; 3MX: 3-methylxanthine; 7MX: 7-methylxanthine; 1MU: 1-methyluric acid; 3MU: 3-methyluric acid; 7MU: 7-methyluric acid; AFMU: 5-acetylamino-6-formylamino-3-
methyluracil. Data from (7, 8).
178x185mm (300 x 300 DPI)
at King's C
ollege London on O
ctober 18, 2016http://hm
g.oxfordjournals.org/D
ownloaded from