Embed Size (px)
Citation preview
GENOME EVOLUTION AND SYSTEMATICS OF THE PAENUNGULATA (AFROTHERIA, MAMMALIA)
AMANDA T. PARDINI
Dissertation presented for the Degree of Doctor of Philosophy (Zoology) at the University of Stellenbosch
Promoter: T. J. ROBINSON
December 2006

ii
Declaration
I, the undersigned, hereby declare that the work contained in this dissertation is my own original work and that I have not previously in its entirety or in part submitted it at any university for a degree.
Amanda Pardini Date: 1 August 2006
Stellenbosch University http://scholar.sun.ac.za
iii
Abstract
Increases in taxonomic sampling and the numbers and types of markers used in
phylogenetic studies have resulted in a marked improvement in the interpretation of
systematic relationships within Eutheria. However, relationships within several clades,
including Paenungulata (Hyracoidea, Sirenia, Proboscidea), remain unresolved. Here the
combination of i) a rapid radiation and ii) a deep divergence have resulted in limited
phylogenetic signal available for analysis. Specifically i) a short internode separating
successive branching events reduces the time available for changes to occur, while ii) the
longer the time since divergence, the greater the opportunity for signal to be negatively
affected by homoplasy. This is evident in both molecular and morphological data where
an overall consensus on paenungulate relationships is lacking. Morphological analysis of
anatomical and fossil evidence favours the association of Sirenia (S) and Proboscidea (P)
(Tethytheria) to the exclusion of Hyracoidea (H); further, support for uniting these three
taxa as Paenungulata is contentious. In contrast, molecular data provide strong support
for Paenungulata but intra-ordinal relationships are ambiguous. Although results from
mitochondrial DNA sequence data favour Tethytheria, there is no consensus of support
for this clade from nuclear DNA. Nuclear DNA is typified by node instability but favours
H+P in the largest concatenation of sequences. Due to the expected increased effect from
homoplasy and consequently the increased likelihood for misleading signal, it is unclear
which result is most likely to represent the “true” tree.
An analysis of available and added intron sequences to characterise signal heterogeneity
among nuclear DNA and mitochondrial DNA partitions indicated that the phylogenetic
utility of partitions varies considerably. Subpartitioning of the data according to similar
evolutionary processes/characteristics (e. g., mtDNA vs. nDNA and codon position)
revealed new insights into the signal structure of the data set; specifically i) that nuclear
DNA first codon positions, and to a lesser degree second codon sites, provide convincing
support for H+P, and ii) that support for S+P by faster evolving sites within mtDNA
suggests that this may be the result of misleading signal. If H+P represents the “true
tree”, then support for this clade indicates that phylogenetic signal has been reduced over
Stellenbosch University http://scholar.sun.ac.za

iv
time as a result of multiple hits, which explains the presence of (hidden) support in
slower evolving sites where homoplasy is less likely to occur, in contrast to faster
evolving sites where no support for H+P was observed.
In an attempt to provide further resolution from an alternative perspective to that possible
with DNA sequence data, chromosomal rearrangements were identified among the three
paenungulate lineages. Using comparative chromosome painting, unique changes within
each order and specific to Paenungulata were characterised, however, intra-ordinal
synapomorphies were not recovered. Although this may suggest a hard polytomy, the
slow to moderate rate of evolution estimated from the data is likely not sufficient relative
to the rapid radiation associated with the paenungulate node. Further examination of
chromosomal rearrangements at a higher level of resolution may yet reveal informative
changes.
Stellenbosch University http://scholar.sun.ac.za
v
Opsomming
‘n Toename in die aantal taksonomiese monsters sowel as die aantal en soort merkers wat
in filogenetiese studies gebruik word, het tot ‘n merkbare verbetering in die vertolking
van sistematiese verwantskappe binne die Eutheria gelei. Desondanks bly ‘n aantal klades
(stamlyne), met inbegrip van Paenungulata (Hyracoidea, Sirenia, Proboscidea), steeds
onopgelos. By laasgenoemde het die kombinasie van i) ‘n vinnige radiasie en ii) ‘n diep
divergensie die filogenetiese sein wat vir analise beskikbaar is, beperk. Meer spesifiek sal
i) opeenvolgende vertakkings wat deur kort internodusse geskei word die beskikbare tyd
waartydens veranderings kan intree, verminder, terwyl ii) ‘n toename in tydsverloop
sedert divergensie die kans dat die sein deur homoplasie nadelig beïnvloed sal word,
vergroot. Dit word in sowel molekulêre en morfologiese data, waar ‘n oorhoofse
konsensus t.o.v. verwantskappe van Paenungulata ontbreek, waargeneem. Morfologiese
analise van anatomiese en fossielbewyse ondersteun die samevoeging van Sirenia (S) en
Proboscidea (P) (Tethytheria) ten koste van Hyracoidea (H). Ondersteuning vir die
samevoeging van dié drie taksa as Paenungulata is egter aanvegbaar. In teenstelling
hiermee word Paenungulata sterk deur molekulêre data ondersteun, al bly die
verwantstkappe op intra-orde vlak, steeds onduidelik. Alhoewel die resultate van
mitochondriale DNA op Tethytheria dui, word die klade nie deur data van kern-DNA
ondersteun nie. Kern-DNA word gekarakteriseer deur node instabiliteit maar verkies H+P
in die grootste samevoeging van geen volgordes. Na aanleiding van die verwagte
toename in die effek van homoplasie en die gevolglik groter kans op ‘n misleidende sein,
is dit nie duidelik watter van die resultate die meer korrekte filogenetiese stamboom
verteenwoordig nie.
Analise van beskikbare en nuut toegevoegde intron-volgordes om sein-heterogeniteit
tussen kern- en mitochondriale DNA verdelings te karakteriseer, toon dat die
filogenetiese nut van verdelings beduidend verskil. Onderverdeling van die data op grond
van soortgelyke evolusionêre prosesse/karaktereienskappe (bv. mtDNA vs. nDNA, en
kodonposisie) het na nuwe insigte in die seinstruktuur van die datastel gelei. Meer
spesifiek dat i) kern-DNA se eerste kodonposisies, en tot ‘n mindere mate die tweede
Stellenbosch University http://scholar.sun.ac.za
vi
kodonposisies, H+P oortuigend ondersteun en ii) dat ondersteuning vir S+P deur posisies
binne mtDNA wat vinnig verander, op ‘n misleidende sein mag dui. As H+P die korrekte
stamboom verteenwoordig dui ondersteuning vir die klade op ‘n filogenetiese sein wat
met verloop van tyd as gevolg van veelvuldige seinvoorkomste verklein het. Dit verklaar
die aanwesigheid van versluierde ondersteuning in stadig-veranderende posisies waar die
neiging tot homoplasie klein is, in teenstelling met posisies wat vinniger verander en
waar ondersteuning vir H+P nie waargeneem is nie.
Op soek na verhoogde resolusie vanuit ‘n ander perspektief as DNA-volgordebepaling, is
chromosomale herrangskikkings in die drie stamlyne van Paenungulata nagevors. Met
behulp van vergelykende chromosoomkleuring is unieke veranderings binne elke orde en
spesifiek binne Paenungulata gekarakteriseer, maar geen sinapomorfe kenmerke is op die
intra-orde vlak gevind nie. Alhoewel dit op ‘n onopgeloste politomie mag dui, is die
stadige tot matige evolusietempo wat van die data afgelei word, relatief tot die vinnige
radiasie wat met die Paenungulata-nodus geassosieer word, waarskynlik onvoldoende vir
‘n oplossing. Verdere navorsing oor chromosomale herrangskikkings met ‘n hoër
resolusievlak mag addisionele insiggewende veranderings aantoon.
Stellenbosch University http://scholar.sun.ac.za

vii
Dedication
To my grandfather, Verdun Pardini
Stellenbosch University http://scholar.sun.ac.za

viii
Acknowledgements I thank my supervisor, Terry Robinson, for support throughout this project but most importantly, for providing the initial exposure and opportunity to become involved in a field I have developed a great interest in. Special thanks to Bettine, Conrad, Gauthier, Geeta, Krystal, Nico, Raurie, Sandi, Victor and Wilbur for much assistance in the laboratory and with analytical concerns, and to the members of the Evolutionary Genomics Group, who have come and gone over the past four years, for their support. Many thanks to Jurie van den Heever and other people in the department who I have come to know and who have helped in diverse ways. I am particularly indebted to Fengtang Yang and members of the Centre for Veterinary Science, Cambridge University, whose contribution to this study is invaluable. Many thanks to Johann Watson with attempts to catch aardvarks. A very big thanks to Hanneline and Mhairi for their fantastic support in the last few months and to Sands, Kate, Big Rich, Mhairi, Brent, Victor, Savel and Geeta for much needed discussions and trips to the Neelsie. I thank the University of Stellenbosch, the National Research Foundation, Department of Labour and the Harry Crossley Foundation for financial support. Finally, many, many thanks to my family and friends, both old and new, from South Africa and abroad for support, advice and inspiration.
Stellenbosch University http://scholar.sun.ac.za

ix
Table of Contents
Page
Declaration ii Abstract iii Opsomming v Dedication vii Acknowledgements viii Table of Contents ix List of Figures xii List of Tables xiii
CHAPTER 1: GENERAL INTRODUCTION
1.1 Preamble 1 1.2 Background 1
1.2.1 Morphological data 1 1.2.2 Molecular data 4 1.3 Molecular analysis 10 1.3.1 DNA sequence data 10 1.3.2 Molecular cytogenetic data 15 1.3.2.1 Phylogenomics 17 1.4 Aims 19
CHAPTER 2: SEQUENCING AND ANALYSIS OF NUCLEAR AND
MITOCHONDRIAL MARKERS
2.1 Introduction 20 2.2 Materials and methods 25
2.2.1 Taxon sampling 25 2.2.2 Laboratory procedures 28 2.2.3 Alignment and processing of sequences 30 2.2.4 Data analysis 31
2.2.4.1 Data partitioning 31 2.2.4.2 Base composition 31 2.2.4.3 Congruence between data partitions 31 2.2.4.4 Phylogenetic analyses 32
2.3 Results and discussion 34 2.3.1 Data 34
Stellenbosch University http://scholar.sun.ac.za

x
2.3.1.1 Data description and partition variability 34 2.3.1.2 Base composition 37 2.3.1.3 Nucleotide evolution within Paenungulata 39 2.3.1.3.1 Sequence divergence 39 2.3.1.3.2 Substitution processes 43 2.3.1.4 ILD tests 52
2.3.2 Hierarchical (phylogenetic) analysis 54 2.3.2.1 Comparison with published data 54 2.3.2.2 Taxon sampling 55 2.3.2.3 Individual partitions/separate analysis 61 2.3.2.4 Intron data 63 2.3.2.5 Combined partitions and subpartitions 64
2.3.3 Hyrax and elephant 68 2.3.4 Manatee and hyrax 72 2.3.5 Manatee and elephant 72
2.4 Conclusion 76
CHAPTER 3: COMPARATIVE CYTOGENETICS
3.1 Introduction 79 3.2 Materials and methods 81
3.2.1 Taxon sampling and cell culture 81 3.2.2 Chromosome and standard karyotype preparation 83
3.2.2.1 Chromosome metaphase suspension 83 3.2.2.2 Giemsa-banding (GTG-banding) 83 3.2.2.3 Constitutive heterochromatin staining (CBG-banding) 84
3.2.3 Standardisation of karyotypes 84 3.2.4 Chromosome painting using fluorescence in situ hybridisation (FISH) 84
3.2.4.1 Flow-sorting and generation of chromosome-specific probes 84 3.2.4.2 Fluorescence in situ hybridisation 85 3.2.4.3 Reciprocal chromosome painting 85 3.2.4.4 Intra-FISH hybridisations 86 3.2.4.5 Analysis 87
3.3 Results and discussion 88 3.3.1 Karyotype analysis 88
3.3.1.1 G- and C-banding 88 3.3.2 Fluorescence in situ hybridisation 93
3.3.2.1 Flow-sorting and assignment of paenungulate chromosomes 93 3.3.2.1.1 Elephant 93 3.3.2.1.2 Hyrax 93 3.3.2.1.3 Manatee 97
3.3.2.2 Reciprocal chromosome painting 97 3.3.2.2.1 Elephant 97 3.3.2.2.2 Manatee 99
Stellenbosch University http://scholar.sun.ac.za
xi
3.3.2.2.3 Hyrax 99 3.3.2.2.4 Aardvark 99
3.3.2.3 Comparison to previous studies 104 3.3.2.4 Chromosomal evolution within Paenungulata 109
3.3.2.4.1 The ancestral karyotype 109 3.3.2.4.2 Paenungulate-specific syntenies 109 3.3.2.4.3 Rates of chromosomal evolution 112 3.3.2.4.4 G-band chromosome comparisons predicted by
FISH homology 112 3.3.2.4.5 Genome evolution within Paenungulata 114
3.4 Conclusion 118
CHAPTER 4 - SUMMARY AND CONCLUDING REMARKS 120
REFERENCES 125 APPENDIX 1 147 APPENDIX 2 155 APPENDIX 3 157 APPENDIX 4 158 APPENDIX 5 161 APPENDIX 6 162
Stellenbosch University http://scholar.sun.ac.za
xii
List of Figures Figure 2.1: Nucleotide base composition differences between partitions. 40 Figure 2.2: MtDNA base composition at each codon position of the taxa included in this study. 41 Figure 2.3 Transition versus transversion ratios in nDNA 44 Figure 2.4 Transition versus transversion ratios in mtDNA 46 Figure 2.5 The proportion of changes scored in each taxa correlate with the base composition 50 Figure 2.6 Bayesian inference tree obtained from the total evidence data set. 56 Figure 3.1a: Constitutive heterochromatin staining in L. africana. 89 Figure 3.1b: Constitutive heterochromatin staining in T. m. latirostris. 89 Figure 3.2: G-banded karyotype of a male cape rock hyrax, P. capensis (2n=54, XY). Chromosomes are arranged firstly according to the position of the centromere and then size of the chromosome. 90 Figure 3.3: Constitutive heterochromatin staining in P. capensis. 91 Figure 3.4: Side by side comparisons of G-banded and C-banded chromosomes of the aardvark, O. afer (2n=20, XY). 92 Figure 3.5: Assignment of bivariate-sorted chromosomes of the hyrax, P. capensis (2n=54, XY) using FISH to G-banded chromosomes. 95 Figure 3.6: Assignment of bivariate-sorted chromosomes of the manatee, T. m. latirostris (2n=48, XY) using FISH to G-banded chromosomes. 96 Figure 3.7: G-banded metaphase chromosomes of the African elephant, L. africana with regions homologous to the manatee (right) and hyrax (left) mapped using whole chromosome painting with FISH. 98 Figure 3.8: G-banded metaphase chromosomes of the Florida manatee, T. m. latirostris with regions homologous to the elephant (right) and hyrax (left) mapped using whole chromosome painting with FISH. 100 Figure 3.9: G-banded metaphase chromosomes of the hyrax, P. capensis with regions homologous to the manatee (left) and elephant (right) mapped using whole chromosome painting with FISH. 101 Figure 3.10: G-banded chromosomes of the aardvark, O. afer (2n=20) with regions of homology (right of aardvark chromosomes) delimited by FISH to the elephant, manatee and hyrax (from left to right). 103 Figure 3.11: Reconstruction of chromosomal phylogeny using Maximum Parsimony (MP). 105 Figure 3.12: Examples of cross-species chromosome painting using painting probes developed specifically for this investigation. 106 Figure 3.13: Hybridisation of LAF27 to TMA19. 108 Figure 3.14: Comparison of G-banded chromosomes of the elephant (E), hyrax (H) and manatee (M). 113
Stellenbosch University http://scholar.sun.ac.za
xiii
List of Tables Table 2.1: New intron sequences generated for all afrotherian representatives and outgroup taxa in this study. 26 Table 2.2: Sequences obtained from previously published studies. 27 Table 2.3: Afrotherian-specific intron primers developed in this study. 29 Table 2.4: GenBank accession numbers for intron sequences generated during this study. 29 Table 2.5: Characteristics of individual and combined regions (nDNA, mtDNA, coding, non-coding, codon position) used in this study. 35 Table 2.6: Indels scored from intron sequences generated in this study. 38 Table 2.7.1: Percentage sequence divergences for the total combined data set. 42 Table 2.7.2: Percentage sequence divergences for the combined nuclear data set. 42 Table 2.7.3: Percentage sequence divergences for the combined mtDNA data set. 42 Table 2.8 Pairwise nucleotide substitutions in mtDNAcod for Paenungulata 48 Table 2.9 Regression line formulas, correlation coefficients, and P values of lines plotted in figure 2.5. 51 Table 2.10: Congruence of topologies resulting from analysis with MP and BI of individual partitions and combined data sets. 57 Table 2.11 Congruence of topologies resulting from analysis with MP, ML and BI of each of the four intron partitions 65 Table 2.12: Partitioned Bremmer support for mtDNA. 66 Table 2.13: Partitioned Bremmer support for nDNA. 71 Table 3.1: Species used as part of the comparative cytogenetic analysis in this study. 82 Table 3.2: Flow-sort characterisation of chromosomes from the African elephant, L. africana. 94 Table 3.3 Comparison of hybridisation differences between this study and two previous studies. 108
Stellenbosch University http://scholar.sun.ac.za

1
CHAPTER 1 - GENERAL INTRODUCTION
1.1 Preamble
The mammalian clade Paenungulata (“almost ungulates”), comprising the orders
Proboscidea, Sirenia and Hyracoidea, was first suggested by Cope (1884, in: Springer,
Cleven et al., 1997) subsequently formally described by Simpson (1945) on the basis of
morphological characteristics. An alternative interpretation of the relationships between
these three orders exists favouring an association between Proboscidea and Sirenia forming
Tethytheria (McKenna, 1975) and with Hyracoidea more closely affiliated to
Perissodactyla (McKenna, 1975). However, in contrast to the Hyracoidea-Perissodactyla
hypothesis, Paenungulata receives overwhelming support from molecular data suggesting
the validity of this clade. When considering relationships among the three paenungulate
lineages, however, there is no clear consensus from morphological and molecular
characters. Individual DNA segments vary considerably with respect to which of the three
possible associations within Paenungulata they support. Moreover, concatenations of
individual partitions are sensitive to the addition of new data. Consequently, analyses
remain equivocal over associations within Paenungulata. The extensive data currently
available and their inability to provide resolution among the lineages indicates a need for
additional, independent markers that may provide a new perspective on the paenungulate
polytomy. To this end this study aims to use a combination of chromosomal and sequence
data to address the systematic relationships and genome evolution within Paenungulata.
1.2 Background
1.2.1 Morphological data
The central issue in the morphological debate on systematic relationships between
Hyracoidea, Sirenia and Proboscidea concerns the monophyly of Paenungulata.
Specifically, one may ask whether Simpson’s (1945) uniting of these three orders is more
justifiable considering the data than McKenna’s (1975) hypothesis of Tethytheria with
Hyracoidea aligned more closely to Perissodactyla? Although the monophyly of
Paenungulata is not in question here, consideration of this debate is important as it
implicitly considers relationships among the three paenungulate lineages. Clearly, the
Stellenbosch University http://scholar.sun.ac.za

2
exclusion of Hyracoidea from Paenungulata suggests that the closer association of
Proboscidea with Sirenia (Tethytheria) based on morphology is more acceptable.
The discussion of paenungulate monophyly and specifically that of Tethytheria is
considered one of the most ongoing and contentious debates in eutherian phylogenetic
relationships (Gheerbrandt, Domning et al,. 2005, p. 84; Amrine and Springer, 1999;
Waddell, Okada et al. 1999). A comprehensive discussion of the validity of the different
morphological arguments is beyond the scope of this thesis, but examination of the relevant
literature highlights certain important points concerning the difficulties with resolving this
issue. Few characters can be characterised as potential synapomorphies in support of a
particular hypothesis and those that are, are very often reassessed as homoplasious. For
example, a proposed synapomorphic character for Tethytheria concerns the absence of the
splenius colli muscle (Amrine and Springer, 1999). However, this character state is also
present in Tubulidentata, Cetacea and Pholidota (Shoshani, 1993) and since Tubulidentata,
on the basis of molecular evidence, is a likely a sister taxon to paenungulates (Amrine-
Madsen, Koepfli et al., 2003; Springer, Amrine et al., 1999; Stanhope, Smith et al., 1996),
this character may be plesiomorphic. Further, a reassessment of an auditory character
considered one of the most striking synapomorphies for Tethytheria (Fischer, 1990) was
also subsequently found to be homoplastic (Court, 1994). Similar re-evaluations of
potential synapomorphies for a Hyracoidea-Proboscidea or Hyracoidea-Sirenia association
are also evident (Tassy and Shoshani, 1988, p.305). For example, initial suggestions of a
Hyracoidea-Sirenia synapomorphy for placenta type has subsequently been invalidated
(Enders and Carter, 2004, A. M. Carter pers. comm.)1. Earlier suggestions of a close
relationship between Proboscidea and Sirenia by Gregory (1910, in: Tassy and Shoshani,
1988, p. 286) combined both derived, plesiomorphic, as well as convergent characters in
support of this relationship. Consequently, following review of the validity of these
characters, many have fallen away. In general, as new fossils are found and relationships
are reassessed, characters may no longer be considered applicable (Lavergne, Douzery et
al., 1996). To date though, Tethytheria receives more support from morphological evidence
than either of the two other possible associations within Paenungulata (Gheerbrandt,
1 A. M. Carter, Institut for Medicinsk Biologi, Syddansk Universitet, Denmark
Stellenbosch University http://scholar.sun.ac.za
3
Domning et al,. 2005, p. 102). However, there are large gaps in the paenungulate fossil
record (Gheerbrandt, Domning et al,. 2005, p. 102) which may still yield important
findings. An example is a very recent report of additional material from the oldest known
proboscidean, Phosphatherium escuilliei which provides support for Paenungulata
(Gheerbrandt, Sudre et al., 2005).
The problem of a lack of reliable synapomorphies is largely the result of the extensive
morphological diversification within each paenungulate lineage. For example, sirenians
have evolved a fully aquatic lifestyle and although hyraxes and elephants are both
terrestrial, they have considerably different life-histories. It is noteworthy that a semi-
aquatic ancestry has been suggested for ancestral proboscideans based on ontogenetic
characters in Loxodonta (West, Fu et al., 2003; Gaeth, Short et al., 1999). The extent of
anatomical differentiation is reflected (most strongly) in extant lineages. The progression of
these morphological radiations can be traced through the fossil record with adaptations to
the differing niches readily apparent. The earliest sirenian fossil found to date, Pezosiren
portelli (early Middle Eocene) retains quadrupedal capability but shows changes to the rib
cage, nasal openings and sinus morphology indicative of aquatic specialisations (Domning,
2001). Fossils from the Middle Eocene that follow P. portelli in temporal sequence,
including Prorastomus sirenoides (Savage, Domning et al., 1994) and several protosirenids
(Domning, 1994) exhibit reduction in hind-limbs, mandibular adaptations to bottom-
feeding and associated dental changes. Most notable of the anatomical changes within
Hyracoidea is the extensive size diversity and dietary adaptations evident in fossil
specimens from the Paleogene, with body size variation ranging from that of extant
hyracoids to those exceeding several hundred kilograms (De Blieux and Simons, 2002;
Thewissen and Simons, 2001 and references therein). Likewise, proboscidean evolution is
characterised by considerable body-size increases, the development of a trunk, and
extensive variation in dental characteristics (see Shoshani, 1998 for review). Hence, the
overwriting of synapomorphies established during the early stages of evolution by
subsequent morphological changes (Madsen, Scally et al., 2001) is likely given the
extensive morphological diversification in paenungulates.
Stellenbosch University http://scholar.sun.ac.za
4
1.2.2 Molecular data
The contribution of molecular data to the paenungulate debate was notable for its strong
support of paenungulate monophyly to the extent that it is considered one of the most well
supported supraordinal clades (Gheerbrandt, Domning et al,. 2005, p. 99). An early
indication of an association of Hyracoidea with Tethytheria over Perissodactyla was
provided through serological work which showed a close relationship between the hyrax
and elephant (Weitz, 1953). Subsequent studies using immunological distances (Shoshani,
1986), amino acid sequences (Kleinschmidt, Czelusniak et al., 1986; Miyamoto and
Goodman, 1986; Shoshani, 1986; Rainey, Lowenstein et al., 1984; De Jong, Zweers et al.,
1981) and the first studies using nucleotide sequence data from a single DNA segment
(Greenwood, Englbrecht et al., 2004; Madsen, Deen et al., 1997; Lavergne, Douzery et al.,
1996; Porter, Goodman et al., 1996; Stanhope, Smith et al., 1996; Springer and Kirsch,
1993; Stanhope, Czelusniak et al., 1992; Irwin, Kocher et al., 1991) continued this trend, all
providing support for Paenungulata. However, intra-paenungulate relationships were
inconsistent with the different markers used, and despite the addition of new taxa and DNA
regions, the outcomes continued to vary in their interpretation of relationships between
Proboscidea, Hyracoidea and Sirenia (Eizirik, Murphy et al., 2001; Liu, Miyamoto et al.,
2001; Waddell, Kishino et al., 2001; Amrine and Springer, 1999; Springer, Amrine et al.,
1999; Stanhope, Madsen et al., 1998; Stanhope, Waddell et al., 1998; Springer, Burk et al.,
1997; Springer, Cleven et al., 1997).
As eutherian molecular systematic studies began to include more taxa and additional
markers (e.g., Amrine-Madsen, Koepfli et al., 2003; Murata, Nikaido et al., 2003; Murphy,
Eizirik et al., 2001b; Murphy, Eizirik et al., 2001a; Eizirik, Murphy et al., 2001; Madsen,
Scally et al., 2001; Nikaido, Kawai et al., 2001; Waddell, Kishino et al., 2001; Waddell,
Okada et al., 1999), two important developments became apparent. First is that the increase
in data, including whole mitochondrial genomes, did not lead to increased resolution within
Paenungulata with the result that this node became one of the few remaining ambiguous
nodes in eutherian evolution (Murphy, Pevzner et al., 2004; Waddell, Kishino et al., 2001;
Waddell, Okada et al., 1999). For example, despite the very large size (16397bp) of the
Murphy, Eizirik et al. (2001b) data set, the statistical support for the sirenian-hyracoid node
Stellenbosch University http://scholar.sun.ac.za

5
using both maximum likelihood (ML) and Bayesian inference (BI) was weak.
Consequently, the sensitivity of this node to the addition of another 1.3kb to this data set
(~8% sequence data increase) that resulted in a change to a hyracoid-proboscidean
association (Amrine-Madsen, Koepfli et al., 2003) was not unexpected. Studies that have
targeted different DNA regions and analysed the data using diverse analytical approaches
(Douady, Scally et al., 2004; Asher, Novacek et al., 2003; Waddell and Shelley, 2003;
Malia, Adkins et al., 2002; Scally, Madsen et al., 2001) have not resulted in improved
resolution, confirming the instability of the intra-ordinal relationships within Paenungulata.
Interestingly, when considering the number of synapomorphies supporting one of the three
possible intrapaenungulate relationships among the 19 nuclear protein-coding genes at the
amino acid level, Hyracoidea-Proboscidea is clearly favoured (Nishihara, Satta et al.,
2005). Analyses that take account of secondary structures and protein signatures have also
identified particular synapomorphies. Comparison of 16S rRNA secondary structure shows
positional covariance for Hyracoidea-Sirenia, and also for Hyracoidea-Proboscidea,
although the latter character also occurs in Pecora and Phocidae (Burk, Douzery et al.,
2002). Considering the phylogenetic distance, however, it is not unreasonable to expect
convergence in this case. Protein signatures in the apolipoprotein B gene yield one
synapomorphy for Hyracoidea-Proboscidea (Amrine-Madsen, Koepfli et al., 2003) and a
recent analysis of SINEs yielded a synapomorphy for Hyracoidea-Sirenia (Nishihara, Satta
et al., 2005). Hence despite the relatively large amount of data available to assess
intrapaenungulate systematic relationships, no congruence is apparent. A pattern has
emerged showing a discrepancy between mitochondrial DNA (mtDNA) and nuclear DNA
(nDNA) with the largest concatenations of mtDNA protein coding segments favouring
Tethytheria (Murata, Nikaido et al., 2003; Nikaido, Cao et al., 2003). Results from nDNA
are varied although amino acid sequence comparisons favour Hyracoidea-Proboscidea
(Nishihara, Satta et al., 2005; Waddell, Kishino et al., 2001).
An important point emerging from the molecular data is that, like the morphological
analyses, there are relatively few potential synapomorphic characters while many more
characters are autapomorphic within each lineage. This is likely an indication that the
paenungulates underwent a rapid radiation reducing the time for changes to occur between
divergence events (Nishihara, Satta et al., 2005; Amrine and Springer, 1999; Waddell,
Stellenbosch University http://scholar.sun.ac.za

6
Okada et al., 1999). This would certainly help explain the inability of the large molecular
data sets to convincingly resolve intra-paenungulate relationships.
The second major development arising from the increase in data and taxonomic sampling
for mammalian phylogenetic analyses involved considerable changes ("..dynamiting the
tree..", Waddell and Shelley, 2003) to the conventional interpretation of eutherian mammal
systematic relationships (Novacek, 1992). The larger molecular data sets revealed new
relationships between taxa which were not previously suspected with morphological data.
With the reorganisation, four new supraordinal groupings emerged, Xenarthra,
Laurasiatheria, Euarchontoglires (= Supraprimates2) and Afrotheria. One of the surprising
insights suggested by the molecular data is Afrotheria (Springer, Cleven et al., 1997), so
named (Stanhope, Waddell et al., 1998) because of a presumed African origin of the
member taxa (Gheerbrandt, Sudre et al., 1996; Carroll, 1988) most of which are still
confined to this continent. The uniting of Macroscelidae, Afrosoricida (Chrysochloridae
and Tenrecidae), Paenungulata and the monotypic Orycteropus (Tubulidentata) is
contentious because it requires the merging of orders for which no morphological
synapomorphy exists (Novacek, 2001; Asher, 1999). Furthermore, the established clades
Anagalida, Ungulata and Insectivora are disrupted (Robinson and Seiffert, 2004; Stanhope,
Waddell et al., 1998; Springer, Cleven et al., 1997). In some cases, such as a comparison of
the “insectivorous” afrotherians (tenrecs and golden moles) to the “ungulate” members
(paenungulates and aardvark), morphological differences are so considerable that without
genetic evidence it is unlikely that these taxa would have been grouped together (Asher,
2001). However, prior suggestions of similar morphological characters do exist. All
afrotherian taxa with the exception of the aardvark and certain members of Tenrecomorpha,
have intra-abdominal (nondescended) testes (Whidden, 2002; Werdelin and Nilsonne,
1999). While this excludes the aardvark and is variably present within Tenrecomorpha, a
morphological character uniting the majority of the smaller insectivorous members of
Afrotheria with Paenungulata is compelling. It is important to note that intra-abdominal
testes have previously been regarded as primitive (Freeman, 1990). Although it is unclear
2 Priority is unclear between Euarchontoglires (Murphy et al. 2001b) and Supraprimates (Waddell et al. 2001); the former will be used here following Waddell and Shelley (2003).
Stellenbosch University http://scholar.sun.ac.za
7
based on comparisons to marsupials and monotremes what state represents the primitive
form (Werdelin and Nilsonne, 1999), the view taken by Freeman (1990) would negate this
character as a morphological synapomorphy for this clade. Additional morphological
characters include dental features from the earliest fossil macroscelideans which show a
closer affinity to paenungulates and “condylarths” (primitive extinct "ungulates", Seiffert,
2003; Tabuce, Coiffait et al., 2001; Simons, Holroyd et al., 1991) and, early morphological
studies which describe features that show a strong similarity between Hyracoidea,
Proboscidea and Orycteropus (Le Gros Clark and Sonntag, 1926). Particular astragalar
features which unite hyraxes, elephants, elephant shrews, aardvarks, and the extinct
Plesiorycteropus (but excludes extant sirenians due to the absence of hind limbs) have been
suggested as possible synapomorphies requiring further consideration, although these
characters are not exclusive to these taxa (Helgen, 2003; McPhee, 1994).
Within Afrotheria, Paenungulata is the most well supported clade. However, relationships
among afrotherians, and particularly the sister-taxa to Paenungulata, are unclear. Despite
the persuasive fossil evidence supporting a paenungulate-macroscelidean association
(reviewed in Seiffert, 2003), these data are not conclusive. From a molecular perspective, a
variety of hypotheses have been proposed but vary with the particular DNA markers used.
Afroinsectiphillia (Murphy, Eizirik et al., 2001b; Waddell, Kishino et al., 2001) which
includes all afrotherians except paenungulates, has found support from several molecular
studies including cytogenetic data (Robinson, Fu et al., 2004). Within this clade,
Afroinsectivora (which excludes the aardvark, Waddell, Kishino et al., 2001) has also been
described though with varying support (Amrine-Madsen, Koepfli et al., 2003; Waddell and
Shelley, 2003; Murphy, Eizirik et al., 2001b).
Traditionally, the radiation of eutherian mammals is believed to have begun on northern
continents (Carroll, 1988 p. 449) approximately 65 million years ago (MYA) coinciding
with the demise of the dinosaurs around the Cretaceous-Tertiary boundary (K/T) and the
concomitant sudden availability of a broad range of adaptive niches (Carroll, 1988 p. 449).
The K/T radiation hypothesis is borne out by the fossil record. Following the abrupt decline
of the dinosaur fossil fauna in the Cenozoic (65 MYA), a considerable increase in the
Stellenbosch University http://scholar.sun.ac.za

8
diversity of mammalian fossils is apparent compared to the preceding Mesozoic (245-65
MYA, Rich, Vickers-Rich et al., 1997) where few fossils have unequivocally been
described as ancestors to modern mammalian orders (Rage and Cappetta, 2002; Bromham,
Phillips et al., 1999; Nessov, Zhegallo et al., 1998). The ‘bush-like’ phylogeny of mammals
was interpreted as a sign of a rapid radiation ( Explosive Model, Archibald and
Deutschman, 2001; Bromham, Phillips et al., 1999) and this was generally accepted prior to
the reshuffling of mammalian relationships suggested by molecular data that proposed a
considerably different interpretation, prompted in large part by the basal placement of
Afrotheria. It is necessary to mention that although Afrotheria is well supported and is
favoured as the basal placental mammalian clade (as Exafroplacentalia) (Waddell, Kishino
et al., 2001), other hypotheses do receive some support from molecular studies. These
include Atlantogenata (Afrotheria + Xenarthra, Waddell, Cao et al., 1999b) and the
morphological hypothesis of Xenarthra (Epitheria, McKenna, 1975). The molecular
divergence of Afrotheria from the remaining three placental mammal supraordinal clades
(Murphy, Eizirik et al., 2001b; Murphy, Eizirik et al., 2001a; Madsen, Scally et al., 2001)
has more recently been estimated at 103 MYA (103-108 MYA, Springer, Murphy et al.,
2003a; Murphy, Eizirik et al., 2001b, but see Waddell, Cao et al. 1999b and Waddel,
Kishino et al. 2001). This divergence coincides with the separation of South America and
Africa in the Cretaceous (~95-110 MYA Waddell, Cao et al., 1999a), following which
Africa was isolated for approximately 90 MYA. Based on the molecular divergence
patterns a subsequent dispersal from Gondwana to Laurasia yielded the split between
Xenarthra and Boreoeutheria (88 to 100 MYA) eventually forming the northern hemisphere
supraordinal groups Laurasiatheria and Euarchontoglires (Murphy, Eizirik et al., 2001b).
The vicariant event caused by the opening up of the Atlantic ocean was also invoked by an
earlier hypothesis in support of one of the alternative basal mammalian clades,
Atlantogenata (Waddell, Cao et al. 1999b). The maintenance of small,
insectivorous/generalist species retaining purported primitive placental characteristics in
each of the four placental clades suggests that early lineages of these small mammals were
isolated following continental breakup (Eizirik, Murphy et al., 2001; Waddell, Okada et al.,
1999). Parallel adaptive radiations into modern orders, including specialisations for ant-
eating and aquatic lifestyles, occurred in different geographic locations (Madsen, Scally et
Stellenbosch University http://scholar.sun.ac.za
9
al., 2001) and the increased availability of ecological niches following the dinosaur
extinctions may have contibuted to the remarkable morphological diversification (Murphy,
Eizirik et al., 2001a; Eizirik, Murphy et al., 2001). This pattern of mammalian radiation is
more consistent (Springer, Murphy et al., 2003b) with what has been described as the
Long-Fuse Model (Archibald and Deutschman, 2001) in which the majority of intraordinal
divergences (like the preceding Explosive model) occur after the K/T boundary, but all
interordinal divergences occur well within the Cretaceous.
The new hypothesis lacks convincing support from fossil evidence (but see Springer,
Murphy et al., 2003b). However, in terms of paenungulate origins, this is not controversial
since the majority of the fossils are found in (North) Africa supporting a southern
hemisphere origin. In particular, the earliest fossil for Paenungulata, a primitive
proboscidean P. escuilliei, was discovered in Morroco (57.9-55 MYA, Gheerbrandt, Sudre
et al., 1996). It is worth noting that although paenungulates form part of the basal
mammalian clade Afrotheria with a divergence of ~80 MYA (Springer, Murphy et al.,
2003b), the newer molecular estimate of the paenungulate divergence of ~62.5 MYA
(Springer, Murphy et al., 2003b) is similar to the morphological estimate. Although
morphological data are unclear about the placement of Hyracoidea and places all three
Paenungulate taxa in the most derived position in extant placental mammals, their
divergence based on fossil and anatomical evidence is estimated at just preceding the K/T
boundary (Novacek, 1992) an interpretation that dates from Gregory (1910: in Waddell,
Cao et al., 1999a, p.120) at least, and has consistently held sway with most authors (e.g.,
De Jong, 1998).
1.3 Molecular analysis
1.3.1 DNA sequence data
DNA sequence comparison has been the principal molecular approach used in the
investigation of mammalian systematic relationships, facilitated by the increasing
availability of, and accessibility to, prospective marker fragments. Initially, phylogenetic
analysis was dominated by mtDNA and in particular protein-coding fragments. The power
of mtDNA has been ascribed to the rapid evolutionary rate (Creer, Malhotra et al., 2003;
Stellenbosch University http://scholar.sun.ac.za

10
Brown, Prager et al., 1982), maternal inheritance, and lack of recombination, although the
latter two features have been shown to have exceptions (but also see Sato, Nakada et al.,
2005; Kraytsberg, Schwartz et al., 2004; Piganeau, Gardner et al., 2004; Rokas, Ladoukakis
et al., 2003; Gyllensten, Wharton et al., 1991). The phylogenetic utility of the non-coding
control region, the 13 protein-coding, two rRNA, and 22 tRNA segments that comprise
mammalian mtDNA has been demonstrated repeatedly at different levels. Due to
representing a single linkage group, however, mtDNA segments reflect a single
evolutionary history. The addition of nuclear DNA fragments to phylogenetic analysis has
circumvented this and made available many more markers. Initially, like mtDNA, protein-
coding regions were the marker of choice but non-coding regions, such as introns and
untranslated regions (UTRs) have subsequently been included in mammalian studies (e.g.,
Castillo, Cortinas et al., 2005; Willows-Munro, Robinson et al., 2005; Gaubert and Veron,
2003; Murphy, Eizirik et al., 2001b; Murphy, Eizirik et al., 2001a; DeBry and Seshadri,
2001; Matthee, Burzlaff et al., 2001; Matthee and Davis, 2001).
The testing of systematic relationships with diverse markers may produce different “gene”
trees (Hudson, 1983). This is due to variation in the performance of different markers in
recovering phylogenies. Faster evolving sites will be more useful over shorter (Moore,
1995) and more recent time-scales, while slower, more conserved sites perform better at
recovering deeper level phylogenies. Due to the overall increased rate of evolution in
mtDNA (Vawter and Brown, 1986; Brown, Prager et al., 1982) it has been found to be
more effective at tracking relatively recent changes (<15 MYA) consequently limiting the
utility of mtDNA when applied to deeper level relationships (Halanych, Demboski et al.,
1999; Lara, Patton et al., 1996; Kraus and Miyamoto, 1991). This has been documented in
studies that have found that mtDNA markers perform better when compared among species
and genera within the same family (Matthee, van Vuuren et al., 2004; Matthee, Burzlaff et
al., 2001) than for deeper nodes. The limits of resolution of different markers/sites is a
result of the different functional constraints imposed on them. Those genes and regulatory
regions whose functions are most likely to be disrupted by mutations will have reduced
rates of substitution (Moritz, Dowling et al., 1987), although for mtDNA an inefficient
Stellenbosch University http://scholar.sun.ac.za
11
DNA repair system also contributes to the elevated substitution rate (Moritz, Dowling et
al., 1987).
In combined data sets, different markers will vary in their contribution to resolving a
phylogeny and, although the effects of homoplasy from less useful markers may have a
negative affect, it has generally been found that increasing data set size results in increased
resolution. In contrast, although the data set size for Paenungulata is large, this has not
resulted in improved resolution with marked disagreement between different data sets and
partitions. A lack of congruence can be a result of both biological and analytical factors.
Different inheritance pathways (eg mitochondrial versus nuclear) can lead to biological
processes such as lineage sorting, gene duplication/deletion (e.g., Martin and Burg, 2002) ,
natural selection, genetic drift and lateral transfer of genetic material, producing different
gene and species trees. Analytical factors which have been shown to affect phylogenetic
reconstruction include among others taxon sampling (e.g., Graybeal, 1998), optimal model
choice (Nylander, Ronquist et al., 2004), limited data (Cummings, Otto et al., 1995), model
assumption violations (Nylander, Ronquist et al., 2004; Waddell and Shelley, 2003), base
composition differences (Gibson, Gowri-Shankar et al., 2005; Foster and Hickey, 1999)
and rate variation (site and lineage, Reyes, Pesole et al., 2000; Yang, 1996). Furthermore,
there is much opportunity for subjectivity on the part of the researcher to influence the
readers, for example, through choice of data set(s), model assumptions, method of tree
inference and criterion of statistical support used for the results presented (Waddell and
Shelley, 2003).
Results from previous phylogenetic studies including Paeunugulata give an indication as to
why relationships within this clade have remained ambiguous. The problem of an
unresolved paenungulate node can be characterized by conflicting associations between
mtDNA (Murata, Nikaido et al., 2003; Nikaido, Cao et al., 2003) and nDNA (Amrine-
Madsen, Koepfli et al., 2003; Murphy, Eizirik et al., 2001b) and within the latter, an
unstable node as evidenced by topological fluctuations with the addition of new sequence
data and/or differences in analytical approaches (Amrine-Madsen, Koepfli et al., 2003;
Waddell and Shelley, 2003; Springer, Amrine et al., 1999). Further, earlier studies have
Stellenbosch University http://scholar.sun.ac.za

12
generally found a reduced number of synapomorphies in relation to the number of
autapomorphies in each of the three lineages. The lack of congruence between markers (in
particular between mtDNA and nDNA) and low number of informative characters point to
a rapid radiation of Paenungulata resulting in a short internal edge (Nishihara, Satta et al.,
2005; Amrine and Springer, 1999; Waddell, Okada et al., 1999). The difficulties associated
with a short internal edge are further exacerbated by the relatively deep divergence (~62.5
MYA) between Hyracoidea, Proboscidea and Sirenia (Springer, Murphy et al., 2003a)
which will further reduce an already limited signal through homoplasy.
The two factors, a deep split followed by a rapid radiation, will affect the potential utility of
nuclear and mitochondrial DNA to resolve this particular node. As a result of the maternal
and haploid mode of inheritance of mtDNA, the effective population size is reduced to one
quarter that of nDNA and hence it is more likely to track changes through a short internal
edge (Moore, 1995). However, the advantages of using mtDNA over short intervals is
likely to decrease as time since divergence increases because sites within mtDNA (such as
third codon position and ribosomal RNA loop regions) experience multiple hits which can
obscure the signal (which is already restricted in the case of a rapid radiation). Further, with
the use of mtDNA (and faster-evolving markers overall) in conjunction with increasing
evolutionary distance between taxa, comes the issue of larger variation in lineage-specific
substitutional processes such as base compositional bias and among-site rate heterogeneity
(Kelsey, Crandall et al., 1999).
The importance of these factors to phylogenetic analysis is best depicted in the
development of mammalian systematic relationships using mtDNA. As mitochondrial data
sets increased both in sequence length and sample size a considerable lack of congruence
between different data sets (Gibson, Gowri-Shankar et al., 2005; Lin, Waddell et al., 2002;
Waddell, Cao et al., 1999b) as well as tree inference methods was evident (Arnason,
Gullberg et al., 1999; Waddell, Cao et al., 1999b). Particular lineages and their associations
stood out as problematic. These include, the basal position of the hedgehog (Arnason,
Adegoke et al., 2002; Arnason, Gullberg et al., 1999; Arnason, Gullberg et al., 1997; but
see Waddell, Kishino et al., 2001, Sullivan and Swofford, 1997) the monophyly and
Stellenbosch University http://scholar.sun.ac.za

13
position of Murids (Arnason, Gullberg et al., 1997, but see Lin, Waddell et al., 2002;
Waddell, Kishino et al., 2001), the status of Glires (Lin, Waddell et al., 2002; Arnason,
Gullberg et al., 1997) and Lipotyphla (Lin, McLenachan et al., 2002; Mouchaty, Gullberg
et al., 2000), and the affect of outgroups (Lin, McLenachan et al., 2002). The addition of
new species helped improve resolution by breaking up long edges (Lin, McLenachan et al.,
2002; Waddell, Cao et al., 1999b) where this was problematic and stabilising the position
of certain taxa (e.g., the elephant as more afrotherian taxa were added). However, critical
analysis of the lack of congruence in eutherian systematics through more senstitive tests
highlighted the true extent of nonstationarity of evolutionary processes among species
(Penny, Hasegawa et al., 1999a; Waddell, Cao et al., 1999b) and the inadequacy of then
current analytical methods to deal with this (Lin, McLenachan et al., 2002; Mooers and
Holmes, 2000; Penny, Hasegawa et al., 1999a; Waddell, Cao et al., 1999b; Waddell and
Steel, 1997). The exclusion of problematic taxa (e.g., Lin, Waddell et al., 2002; Waddell,
Kishino et al., 2001; Reyes, Pesole et al., 2000) and the use of more appropriate analyses
gradually resulted in progress towards a more congruent mtDNA mammalian tree (Gibson,
Gowri-Shankar et al., 2005; Kitazoe, Kishino et al., 2005; Reyes, Gissi et al., 2004;
Hudelot, Gowri-Shankar et al., 2003; Waddell, Kishino et al., 2001). These approaches
emphasised the importance of using a suitable model relative to the particular dataset and
that high bootstrap support in the face of (considerable) model violation was not unlikely to
be misleading (e.g., persistent basal hedgehog, Arnason, Adegoke et al., 2002; Arnason and
Janke, 2002).
While nDNA is not exempt to problems arising from the saturation of sites (Springer,
Amrine et al., 1999) and variation in substitution processes between taxa and markers, the
slower rate of evolution is more appropriate for use over longer evolutionary time-scales.
Further, some investigations indicate that when assessed on a per residue basis, the
phylogenetic performance of nDNA surpasses mtDNA (Springer, DeBry et al., 2001;
Springer, Amrine et al., 1999). Since the presence of a polytomy in combination with a
deep divergence introduces particular difficultes to phylogenetic analysis, the anticipated
merits or disadvantages of particular markers need to be evaluated in context of the specific
study and set of taxa included.
Stellenbosch University http://scholar.sun.ac.za

14
The presence of limited signal in a data set poses particular issues for resolving the node in
question. There are two scenarios to consider in this situation. First, if the internal edge is
too short and/or if the original signal has been appreciably reduced over time, such that
there is insufficient signal for phylogenetic analysis, then the node will be characterised as
unresolvable. Alternatively, the signal may comprise sufficient informative characters for
supporting a particular systematic association but is obscured by a low signal to noise ratio.
Under this second scenario, the identification of emergent or hidden support (Gatesy and
Baker, 2005; Gatesy, Amato et al., 2003; Gatesy, O'Grady et al., 1999; Barrett, Donoghue
et al., 1991) may be possible for example, by analysing the data to maximise the
phylogenetic signal by reducing the input from homplasious characters.
The addition of new sources of data to the analysis of a problematic node is a further means
of improving resolution. The data available for assessing the radiation of paenungulates are
extensive (Amrine-Madsen, Koepfli et al., 2003). However, the majority of markers
comprise protein-coding regions with non-coding fragments represented by four UTRs.
Introns are the transcribed non-coding spacer regions located between exonic regions in
genes and, although they have been used successfully in phylogenetic studies of other
mammalian taxa, their utility in Paenungulata has not yet been tested. These regions have
been regarded as free from functional constraints and so all sites are considered potentially
phylogenetically informative, with lower levels of homoplasy and reduced
transition:transversion biases (Creer, Malhotra et al., 2003). This is in contrast to exons,
where varying constraints on codon positions in particular will limit phylogenetic utility
(Creer, Malhotra et al., 2003). Due to differing constraints on substitutional processes in
comparison to exons, introns represent an alternative marker which can be used to test
previous hypotheses (Waddell and Shelley, 2003). Further, introns have been shown to
contain indels of varying size, that if shared between two or more taxa often contribute to
phylogenetic resolution (e.g., Eick, Jacobs et al., 2005; Matthee, Burzlaff et al., 2001).
Although an absence of functional constraints has been assumed for intron regions, it is
becoming apparent that this may not be entirely correct. Higher than expected levels of
sequence conservation in cross-species comparisons (Hare and Palumbi, 2003), non-
random spatial differences that show higher conservation in sequences closer to flanking
Stellenbosch University http://scholar.sun.ac.za
15
exons than the interior of the intron (Hare and Palumbi, 2003), and nucleotide
compositional bias at the fragment ends all indicate a level of functional constraint
(Chamary and Hurst, 2005). It is not clear to what degree this may apply generally for
intron sequences as differences in intron position within a gene have been shown to be a
factor too (Levy, Hannenhalli et al., 2001; Venter, Adams et al., 2001). Although this is of
concern in studies where it is assumed that neutral rates persist across a DNA segment for
phylogenetic reconstruction, it is likely that similar constraints will be operating on
orthologous regions across taxa and the negative effects of these “unknown” constraints
will therefore be minimised.
1.3.2 Molecular cytogenetic data
The ability to accurately and confidently characterise cytogenetic changes between
karyotypes at finer levels has facilitated their increasing use in comparative studies.
Karyotypes were originally characterised at a basic level according to number, gross
morphology (e.g. centromere position and size) and type (autosomal, sex). Through
developments in staining methods which target specific areas on chromosomes, specific
banding patterns (e.g., GTG-, Reverse-banding) are produced which enable the
differentiation of individual chromosomes, and also delimit areas of constitutive
heterochromatin (CBG-banding). However, comparison of banding patterns is an indirect
means of establishing homology and particularly when chromosomal evolution is
extensive, may be confounded. A more recent contribution to cytogenetic studies is the
application of fluorescence in situ hybridisation (FISH) which allows for direct assessment
of homology. Due to the relative ease of producing probe DNA to use in the hybridisation
experiments, the method has considerably increased the range of potential markers for
comparison. The effectiveness of this approach is evident in that it is now a commonly
used application in many areas of research and clinical diagnosis.
The advantages of FISH in molecular cytogenetic analysis extend to phylogenetic studies
where a wide range of markers have been identified and developed for use. These include
whole chromosomes (and Frönicke, 2005 for recent reviews; see Weinberg, 2004), specific
functional regions such as telomeres (Dobigny, Ozouf-Costaz et al., 2003; Meyne, Baker et
Stellenbosch University http://scholar.sun.ac.za
16
al., 1990; Meyne, Ratliff et al., 1989), targeted loci (Dobigny, Ozouf-Costaz et al., 2003;
Waters, Kirby et al., 2001), and subregional probes through microdissection (Raudsepp and
Chowdhary, 1999) as well as classes of DNA (e.g., LINEs, Waters, Dobigny et al., 2004).
The majority of these markers delimit a part of the genome. In contrast, however, a coarse
genome-wide characterisation of chromosomal changes is possible with the use of whole
chromosome probes. This approach depends on generating a suite of probes consisting
(preferably) of individual chromosomes. The isolation of individual metaphase
chromosomes is made possible by the use of fluorescence activated cell sorting (FACS)
which separates individual chromosomes on the basis of their size and nucleotide
composition (Ferguson-Smith, Yang et al., 1998). This bivariate sorting procedure is
performed by a dual laser beam system with associated dyes (Hoecsht 33258 and
chromomycin A3). The chromosome pools generated from the sorting procedure require
amplification and labeling with a fluorescent molecule, which is performed simultaneously
using degenerate oligonucleotide-primed PCR (DOP-PCR, Telenius, Carter et al., 1992;
Telenius, Pelmear et al., 1992). The development of multi-coloured probe systems such as
SKY (spectral karyotyping e.g., Sawyer, Lukacs et al., 1998), have enabled higher levels of
resolution to be obtained.
The first cross-species hybridisation experiments using fluorescently-labeled flow-sorted
chromosomes, or comparative chromosome painting as it was soon termed, “painted”
primate metaphase chromosomes with human probes (Jauch, Wienberg et al., 1992;
Weinberg, Jauch et al., 1990). Refinements to this technique made it possible to increase
the taxonomic distance of hybridisation experiments to the ordinal level (zoo-FISH,
Scherthan, Cremer et al., 1994). Chromosome libraries have since been generated for
representatives from almost all placental mammal orders (Frönicke, 2005) facilitating
interordinal comparisons of chromosomal evolution.
1.3.2.1 Phylogenomics
Chromosome painting enables the characterisation of chromosomal changes and conserved
regions through the identification of breakpoints and syntenic regions between taxa. This
has enabled the identification of ancestral syntenic associations which have been detected
Stellenbosch University http://scholar.sun.ac.za
17
across different placental orders (HSA3/21, 7/16, 12/22, 14/15, 16/19)3. The extensive
comparative studies have also enabled insight into the evolution and organisation of the
mammalian genome through the reconstruction of an ancestral mammalian karyotype with
the most recent estimates of diploid chromosome number ranging from 2n=44-50
(Frönicke, Wienberg et al., 2003; Murphy, Frönicke et al., 2003; Richard, Lombard et al.,
2003; Yang, Alkalaeva et al., 2003). Normally, the establishment of ancestral versus
derived characters is dependent on comparison to an outgroup. However, chromosome
painting success between placental mammals and marsupials is limited to the X
chromosome (Glas, Marshall Graves et al., 1999). The process of inferring the ancestral
mammalian karyotype is consequently dependent on commonality where the most common
character state of a specific character is assumed to be ancestral.
Although chromosomes, as independent genetic units that are subject to Mendelian patterns
of inheritance, satisfy important requirements for phylogenetic analysis, they remain under-
used in phylogenetic studies (Dobigny, Ducroz et al., 2004). Further, chromosomal
rearrangements belong to a class of marker called rare genomic changes (RGCs, Rokas and
Holland, 2000) which offer specific advantages over sequence based studies to particular
problems. RGCs are large-scale and infrequent in comparison to nucleotide changes in
sequence data (Rokas and Holland, 2000) and in addition to chromosomal rearrangements
include for example, large indels, protein sequence signatures, and gene duplications
(Rokas and Holland, 2000). As with morphological characters, chromosomal
rearrangements can be scored on a simple presence-absence basis and hence avoid a
complex analytical approach required for sequence data (Amrine-Madsen, Koepfli et al.,
2003; Waddell, Kishino et al., 2001). With the inclusion of an appropriate outgroup,
potential synapomorphic characters can be identified for phylogenetic reconstruction.
Previous chromosome painting studies on afrotherians have compared aardvark and
elephant with human (Frönicke, Wienberg et al., 2003; Yang, Alkalaeva et al., 2003) and
3 Ancestral syntenic associations are denoted according to their homology to human chromosomes. For example, adjacent chromosome segments of different mammalian species have been shown to be homologous to human (HSA) chromosomes 3 and 21. Here the notation HSA3/21 is used to indicate the presence of this homology.
Stellenbosch University http://scholar.sun.ac.za
18
the golden mole and elephant shrew with human (Robinson, Fu et al., 2004; Svartman,
Stone et al., 2004). Syntenies detected from these comparisons have yielded the first non-
DNA sequence data in support of this supraordinal clade and include HSA1/19p and an
extension on the ancestral synteny HSA3/21, to HSA5/3/21. HSA1/19p has also been
found in a primate, the galago (Stanyon, Koehler et al., 2002). However, in addition to the
large genetic distance between afrotherians and primates, a comparison of G-banded
chromosomes of the galago, aardvark and elephant indicates that the segments on HSA1 to
which the afrotherians and the galago hybridise to are not orthologous (Frönicke, Wienberg
et al., 2003). Hence although HSA1/19p is likely specific to afrotherians, fine-scale
analysis of breakpoints would confirm this synteny. Syntenic segmental combinations were
found in support of Afroinsectiphillia (HSA2/8p/4), while a further two segmental
combinations, (HSA10q/17 and HSA3/20) indicate a closer association for the aardvark
and elephant shrew (Robinson, Fu et al., 2004).
Stellenbosch University http://scholar.sun.ac.za
19
1.4 Aims
The aims of this study were:
1. To determine if phylogenetic signal informative for resolving the paenungulate polytomy
can be distinguished from other (non-phylogenetic) signals present within the DNA
sequence data. A hierarchical analysis was used to examine signal heterogeneity within
existing sequence data supplemented with intron sequences to enable the identification of a
limited or hidden, phylogenetic signal expected to result from a rapid radiation.
2. In an attempt to identify chromosomal synapomorphies that delimit paenungulate intra-
ordinal relationships, I set out to delineate the pattern of chromosomal evolution among the
three paenungulate lineages and outgroup taxa. Reciprocal cross-species chromosome
painting (FISH) and standard cytogenetic staining techniques were used to characterise
chromosomal rearrangements. It was hoped that these data would enable the reconstruction
of an ancestral paenungulate karyotype from which insight into the genome evolution of
this superordinal clade would be made possible.
Stellenbosch University http://scholar.sun.ac.za
20
CHAPTER 2 - SEQUENCING AND ANALYSIS OF NUCLEAR
AND MITOCHONDRIAL MARKERS
2.1 INTRODUCTION
A polytomy represents a node in a phylogenetic tree where the expected bifurcating
relationships among taxa are absent and the relationships among two or more taxa are
unresolved. A node may be difficult to resolve for a variety of reasons, for example, it may
represent the biologically realistic condition, i.e., a “hard” node where the divergence
events among lineages are simultaneous (Cao, Adachi et al., 1994; Hoelzer and Melnick,
1994). In this case there is no shared phylogenetic signal and no further steps can be taken
to improve the outcome. Alternatively a polytomy may be considered “soft” when it is
difficult to resolve due to the presence of limited signal as a result of rapid successive
branching events. Under certain circumstances, a soft polytomy may be perceived as a hard
node. The data available may not contain sufficient signal needed to resolve the node and
uncertainties will be encountered during phylogenetic reconstruction (McCracken and
Sorenson, 2005).
Relationships among paenungulates have proven difficult to resolve (see Chapter 1) with
the result that this clade is considered one of the remaining ambiguous nodes of placental
mammal relationships (Murphy, Pevzner et al., 2004; Springer, Murphy et al., 2003b;
Waddell, Kishino et al., 2001). Although a large amount of data has been applied to this
question, the continued lack of resolution may be considered indicative of insufficient
signal for phylogenetic reconstruction, suggesting a hard polytomy. Distinct associations
among paenungulates are evident from previous studies such as the strong support for
Sirenia-Proboscidea using mtDNA (Murata, Nikaido et al., 2003; Nikaido, Cao et al., 2003)
but, given the problematic behaviour of this marker at this level of divergence (e.g.,
Arnason, Adegoke et al., 2002; Arnason, Gullberg et al., 1999; D'Erchia, Gissi et al., 1996;
Graur, Hide et al., 1991), it is unclear if these results are likely to represent the “true” tree
or are misleading. Further, there is also the possibility that the true signal has been
overlooked as a signal from a short internal edge will be limited and will not receive high
Stellenbosch University http://scholar.sun.ac.za

21
support. Although the inherent difficulties in resolving paenungulate relationships suggest
that this is a hard polytomy, the possibility also exists that this node may be soft but due to
the increasing effects of homoplasy appears hard. The question of whether Paenungulata is
best characterised as a hard or soft polytomy can therefore be addressed by means of a
comprehensive investigation aimed at identifying a limited phylogenetic signal.
In molecular systematics, the term ‘signal’ refers to the signature of phylogenetic history in
the data. However, many other signals will be present in the data set including those
resulting from multiple hits, positive selection, alterations to the mutational process and
functional constraints (Gatesy and Baker, 2005 and references therein). Although it is often
assumed that the signal from shared history is dominant, there is no substantiation for this.
Consequently, the (phylogenetic) signal to noise ratio is an important factor in data
analysis, particularly where the signal is small and likely to be obscured by homoplasy.
How the signal, or characters of differing phylogenetic utility are dispersed throughout the
data will also have an impact on the analysis, particularly with concatenated data sets.
Incongruence within or among partitions4 is unlikely to be evenly distributed across a finite
set of sequences (Gatesy and Baker, 2005; Naylor and Brown, 1998), as a result removal or
downweighting of data may result in the inadvertent loss of informative characters (Gatesy,
Amato et al., 2003). The characterisation of these two factors, i.e., the relative proportion
and distribution of phylogenetically useful sites, are summarised in this study as signal
structure.
Variation in signal structure between partitions is determined by the gain and loss of
informative characters at different sites due to diverse evolutionary processes acting at
these positions. The effect of these processes may be homoplasious, for example where
changes among sites are not independent such as in structural constraints in rRNA stem
regions (Burk, Douzery et al., 2002), or where increased rates of evolution have resulted in
saturation. However, under certain evolutionary scenarios, particular biological processes
will be more likely to produce phylogenetically informative characters. For example, 4 Definition of “partition” in this study – set of finite sequences analysed as a unit; may comprise a single segment, e.g., exon or intron, a set of combined segments or subset of segments.
Stellenbosch University http://scholar.sun.ac.za
22
constraints at slower evolving sites have facilitated the resolution of deep divergences.
Consequently, similarity of evolutionary processes among sites may result in a similar
phylogenetic signal and where the opportunity for signal to be established and subsequently
retrieved is limited, a narrower set of sites may be expected to reflect synapomorphic
changes. This is not to suggest that in each case a single set of characters will be
appropriate. In fact, due to the many possible interactions between different character types
(e.g., coding, non-coding) and evolutionary processes, several character sets may be useful.
The identification of legitimate phylogenetic signal will provide support for a paenungulate
soft polytomy; however, due to the restricted interval available for phylogenetically
informative characters to be established as a result of the rapid radiation, these may be
more likely to be present within a specific category of sites. As the signal degrades further
(or the polytomy “hardens”), fewer phylogenetically informative characters with a
gradually more diffuse and random distribution will remain. Hence the detection of a “non-
random” signal (i.e., one associated with a particular group of characters) may provide
evidence against a paenungulate hard polytomy. With a less favourable signal to noise ratio
associated with polytomies, the ability of different data partitions to provide resolution at
the appropriate level will vary due to the increased effects of stochastic error.
Consequently, assessment of which regions of the data are less homoplasious, and hence
more likely to contain a signal, is required.
The approach used to analyse large data sets composed of smaller partitions has attracted
much discussion in the form of the “combined versus separate analysis” debate. Briefly, the
combined approach has been advocated due to the expected improvement in resolving
power with an increase in the number of characters. But this approach, particularly in its
most extreme form (total evidence with unweighted parsimony, Kluge, 1997), has been
criticised for ignoring potential heterogeneities among data sets which may generate
misleading results (De Queiroz, Donoghue et al., 1995; Bull, Huelsenbeck et al., 1993). An
advantage of separate analysis of data partitions is that this problem will be circumvented,
but with a reduction in number of characters, resolving power may be diminished (De
Queiroz, Donoghue et al., 1995). Congruence among partitions analysed separately is also
often used as evidence of support for a particular hypothesis and where this is not apparent
Stellenbosch University http://scholar.sun.ac.za

23
can serve as an indication of incongruence (Miyamoto and Fitch, 1995; Hillis, 1987).
Recent studies have shown that results obtained with separate and combined approaches
can differ considerably (Gatesy, Amato et al., 2003; Barrett, Donoghue et al., 1991), even
to the point for example, that a novel result, not evident through separate analysis, becomes
apparent in a combined analysis as “hidden” support (Gatesy and Baker, 2005; Gatesy and
Arctander, 2000). These results suggest that signal structure within a data set (separate and
combined) is not clear-cut which has implications for phylogenetic analysis. Given that
separate and combined approaches are able to provide different perspectives on conflict
and support within a particular data set, the simultaneous use of these methods will be more
informative than either alone (Gatesy and Baker, 2005). Where phylogenetic signal is
small, this is particularly useful.
To determine which parts of the data are likely to contain phylogenetic signal appropriate
for resolving a soft polytomy, signal heterogeneity is examined by determining whether
phylogenetically informative or misleading signal is present. A heuristic approach is used
to explore signal structure through hierarchical partitioning of the data set, facilitating
identification of areas of conflict and support. This approach encompasses both combined
and separate analysis of partitions, as well as subdivisions comprising similar evolutionary
characteristics, i.e., mtDNA versus nDNA, coding versus non-coding, and within coding
regions, codon position. This provides a more comprehensive means of surveying the data
and consequently an increased chance of exposing potentially hidden signal to ascertain
whether Paenungulata is likely to represent a hard or soft polytomy. To address this
objective an expanded data set comprising 29904 characters from 15 mtDNA and 24
nDNA fragments is analysed. Signal structure is assessed by variation in topology and node
support using two methods which differ fundamentally in their implementation, MP and BI
analysis. Briefly, MP, is a cladistic approach and as the name indicates, searches for the
most parsimonious outcome among competing phylogenetic hypotheses by optimising tree
length to require the least number of steps. In contrast, BI is model-based and estimates
different parameters in the process of generating a posterior probability distribution of trees
sampled using a Metropolis-coupled Markov Chain Monte Carlo algorithm (MCMCMC,
Ronquist and Huelsenbeck, 2003).
Stellenbosch University http://scholar.sun.ac.za

24
It must be made clear that in the present study, phylogenetic reconstruction is principally
used as a tool to characterise signal structure (favourable or misleading) across different
data partitions, rather than to search for the optimal, phylogenetically-favourable result in
each partition. In phylogenetic analysis, the search for the true tree may involve the
removal or downweighting of potentially homoplasious characters. Although characters are
sometimes excluded in the present study, this is specifically performed to assess the
phylogenetic contribution (positive or misleading) of the remaining characters and differs
from the optimising approach in that all characters are ultimately considered. Following
characterisation of phylogenetic signal across the data, the observed changes in topology
and/or node support across different partitions are investigated in conjunction with
expectations of data performance based on patterns of character evolution (e.g., coding
versus non-coding, mtDNA versus nDNA). Furthermore, although the difference in
approach to phylogenetic reconstruction by MP and BI can be considered as an advantage
to assessing whether a result is misleading or not (i.e., convincing support of a node by
both methods can be regarded with higher confidence), it is not improbable that both
methods may be positively misled, for example, where sufficient violation of the model has
occurred during BI (Nylander, Ronquist et al., 2004; Douady, Delsuc et al., 2003; Waddell,
Kishino et al., 2001). Hence examination of the data set for areas where high support and
expectations of the characters for providing resolution differ, is necessary.
The availability of an extensive data set comprising 39 partitions also enables the
simultaneous assessment of the effects of i) increasing data, and ii) the use of consensus
among individual partitions (McCracken and Sorenson, 2005) on improving the resolution
of a polytomy. In particular, i) the increase in resolution associated with an increase in data
(e.g., Gatesy and Baker, 2005; Creer, Malhotra et al., 2003; Murphy, Eizirik et al., 2001a;
Madsen, Scally et al., 2001; Gatesy, O'Grady et al., 1999) is used as an indication that there
has been sufficient time for a signal to be established (soft polytomy) in comparison to a
hard polytomy where this has not been possible (McCracken and Sorenson, 2005). In the
case of ii), the chance of encountering incongruence in the presence of a short internal edge
is increased as incomplete lineage sorting is more likely to confound resolution under this
condition (McCracken and Sorenson, 2005). Variation among topologies obtained with
Stellenbosch University http://scholar.sun.ac.za

25
separate analysis of different loci reflect polymorphism in the ancestral population and the
strength of this effect is dependent on the length of the internal edge; as the edge length
increases so does the likelihood of congruence between different data partitions, indicating
that a polytomy is soft (McCracken and Sorenson, 2005). The inclusion of the combined
and separate approaches enables the effect of increasing data and consensus among
partitions, to be assessed respectively.
2.2 MATERIALS AND METHODS
2.2.1 Taxon sampling
Introns: Sequence data were generated from seven afrotherian species representing each of
the six orders (Proboscidea, Hyracoidea, Sirenia, Tubulidentata, Macroscelidea and
Afrosoricida) including specimens from each of the suborders within Afrosoricida,
Tenrecomorpha and Chrysochloridea. Two outgroup species were chosen from each of the
supraorders Xenarthra (Order Pilosa, Tamandua tetradactyla and Bradypus tridactylus) and
Laurasiatheria (Order Carnivora, Genetta genetta and Cetartiodactyla, Tragelaphus
imberbis). Nucleotide sequence data was generated for three of these species with the
fourth (Tragelaphus imberbis) available from GenBank (AF165732, AF165733,
AF165735, AF165737). Tissue was obtained either from cell pellets harvested from
fibroblast cultures or fresh tissue stored in either 100% ethanol or 20% DMSO/saturated
salt solution. Specimen details are listed in table 2.1.
Concatenation: Nucleotide sequences from previously published data were obtained from
the publisher’s website as supplementary information (Murphy, Eizirik et al., 2001b) or
directly from GenBank (Apolipoprotein B and mtDNA; see table 2.2 for list of species and
accession numbers). Taxon representation for the published sequence data did not always
match the exact species used for the intron data. For example, in the multi-partition data set
of Amrine-Madsen, Koepfli et al. (2003), G. genetta was not available and the next closest
appropriate taxon (Crocuta crocuta) was selected from those available from electronic
databases.
Stellenbosch University http://scholar.sun.ac.za

26
Table 2.1 New intron sequences generated for all afrotherian representatives and outgroup taxa in this study
Species name Common name Material Region Sample ID Loxodonta africana African savanna elephant Fibroblast cells MGF, PRKCI, STAT5A, THY LAF-NAMIBIA Procavia capensis Cape rock hyrax Tissue, DMSO MGF, PRKCI, STAT5A, THY PCA03-TUSRIV Trichechus manatus latirostris1, 2 Florida manatee Fibroblast cells MGF, PRKCI, STAT5A, THY TMA01-FLORIDA Chrysochloris asiatica Cape golden mole DNA MGF, PRKCI, STAT5A, THY CAS03-STBSCH Macroscelides proboscideus Round-eared elephant shrew Fibroblast cells MGF, PRKCI, STAT5A, THY MPR04-TANKWA Microgale cowani3 Cowan’s shrew tenrec Tissue MGF, STAT5A MCO04-OLSEN Echinops telfairi4 Lesser hedgehog tenrec Tissue PRKCI, THY ETE04-SUN1256 Orycteropus afer Aardvark Tissue, DMSO MGF, PRKCI, STAT5A, THY OAF03-TUSRIV Tamandua tetradactyla Southern tamandua DNA MGF, PRKCI, STAT5A, THY TTE-FRGUYANA Bradypus tridactylus Pale-throated three-toed sloth DNA MGF, PRKCI, STAT5A, THY BTR-FRGUYANA Genetta genetta Small spotted genet DNA MGF SUN1161 1 Fibroblast cell culture provided by: Robert Bonde, Sirenia Project, U.S. Geological Survey, Florida Integrated Science Center, 2201 NW 40th Terrace, Gainesville, Florida 32605-3574. 2 Federal Research Permit: MA-791721; CITES Export Permit: US808447. 3 Sample tissue provided by: Dr Link Olson, Curator of Mammals, Assistant Professor of Systematic Biology, University of Alaska Museum, 907 Yukon Drive, Fairbanks, AK 99775-6960. 4 Material provided by: Dr Heinz Künzle, Institute of Anatomy, University of Munich, Germany. MGF – stem cell factor; PRKCI – protein kinase C, iota; STAT5A – signal transducer and activator of transcription 5A, THY - thyrotropin
Stellenbosch University http://scholar.sun.ac.za

27
Table 2.2 Sequences obtained from previously published studies. The Murphy et al. (2001b) data set was downloaded directly from the publisher’s website as supplementary information. (APOB - apolipoprotein B). Species Common name Study GenBank/EMBL* no. Region Genetta genetta Small spotted genet Eick et al. 2005 AJ866335* PRKCI Genetta genetta Small spotted genet Eick et al. 2005 AJ865444* STAT5A Genetta genetta Small spotted genet Eick et al. 2005 AJ865689* THY Tragelaphus imberbis Lesser kudu Matthee et al. 2001 AF165732 MGF Tragelaphus imberbis Lesser kudu Matthee et al. 2001 AF165733 PRKCI Tragelaphus imberbis Lesser kudu Matthee et al. 2001 AF165735 STAT5A Tragelaphus imberbis Lesser kudu Matthee et al. 2001 AF165737 THY Bradypus tridactylus Pale-throated three-toed sloth Amrine-Madsen et al. 2003 AF548427 APOB Tamandua tetradactyla Southern tamandua Amrine-Madsen et al. 2003 AF548426 APOB Llama glama Llama Amrine-Madsen et al. 2003 AY243381 APOB Crocuta crocuta Spotted hyena Amrine-Madsen et al. 2003 AF548422 APOB Echinops telfairi Madagascar hedgehog Amrine-Madsen et al. 2003 AF548412 APOB Amblysomus hottentotus Hottentot golden mole Amrine-Madsen et al. 2003 AF548413 APOB Elephantulus rufescens Long-eared elephant shrew Amrine-Madsen et al. 2003 AF548408 APOB Orycteropus afer Aardvark Amrine-Madsen et al. 2003 AF548409 APOB Loxodonta africana African savanna elephant Amrine-Madsen et al. 2003 AF548406 APOB Procavia capensis Cape rock hyrax Amrine-Madsen et al. 2003 AF548411 APOB Dugon dugon Dugong Amrine-Madsen et al. 2003 AF548410 APOB Dasypus novemcinctus Nine-banded armadillo Arnason et al. 1997 Y11832 Complete mtDNA Tamandua tetradactyla Southern tamandua Arnason et al. 2002 NC_004032 Complete mtDNA Canis familiaris Beagle dog Zhu et al. (unpublished) AY729880 Complete mtDNA Llama pacos Alpaca Arnason et al. 2004 AJ566364 Complete mtDNA Echinops telfairi Madagascar hedgehog Mouchaty et al. 2000 AJ400734 Complete mtDNA Chrysochloris asiatica Cape golden mole Murata et al. 2003 AB096866 Complete mtDNA Elephantulus sp. Elephant shrew Murata et al. 2003 AB096867 Complete mtDNA Orycteropus afer Aardvark Arnason et al. 1999 Y18475 Complete mtDNA Loxodonta africana African savanna elephant Hauf et al. 2000 AJ4821 Complete mtDNA Procavia capensis Cape rock hyrax Murata et al. 2003 AB096865 Complete mtDNA Dugon dugon Dugong Arnason et al. 2002 DDU421723 Complete mtDNA
Stellenbosch University http://scholar.sun.ac.za

28
2.2.2 Laboratory procedures
Total genomic DNA was extracted from tissue following standard phenol-chloroform
protocols. DNA quality and approximate yield was estimated by visualizing the DNA using
agarose gel electrophoresis and ethidium bromide staining.
Four nuclear intron regions, namely stem cell factor (MGF) intron 3/4, protein kinase C iota
(PRKCI) intron 9/10, signal transducer and activator of transcription 5A (STAT5A) intron
15/16 and thyrotropin (THY) intron 2/3 were selected from a suite of genetic markers
characterised by Matthee, Burzlaff et al. (2001) which have been shown to be useful for
resolving phylogenetic relationships at both higher and lower taxonomic levels (e.g., Eick,
Jacobs et al., 2005; Willows-Munro, Robinson et al., 2005; Matthee and Davis, 2001). Each
intron region was amplified by polymerase chain reaction (PCR) under the following
conditions: initial denaturation at 94˚C for 3 minutes; denaturation at 94˚C for 30 seconds,
annealing at 48-56˚C for 30 seconds and extension at 72˚C for 45 seconds (30 cycles); and a
final denaturation at 72˚C for 8 minutes. A combination of intron primers was used in the
study. These were derived from primers developed for cetartiodactyls (Matthee, Burzlaff et
al., 2001), leporids (Matthee, van Vuuren et al., 2004) and chiropterans (Eick, Jacobs et al.,
2005). Two new afrotherian specific primers for MGF and STAT5A (table 2.3) were
developed as part of the present investigation. A negative control (to test for contamination)
and a positive control (from the species group the particular primer was designed from) were
included each time. PCR products were visualized under UV light after agarose gel (1%)
electrophoresis and ethidium bromide staining. The selected products were subsequently
purified with the Wizard® SV Gel and PCR clean-up system (Promega) and cycle-sequenced
using Big Dye terminator chemistry (version 3.1, Applied Biosystems, Inc). Sequences were
obtained by analyzing the samples on an ABI 3100 automated DNA sequencer. The accuracy
of the sequence data obtained was checked in most cases by sequencing both strands and
confirming exact homology in the region of overlap. Sequence identity was further verified
by GenBank BlastN searches. All sequences generated in this study were deposited in
GenBank (table 2.4).
Stellenbosch University http://scholar.sun.ac.za
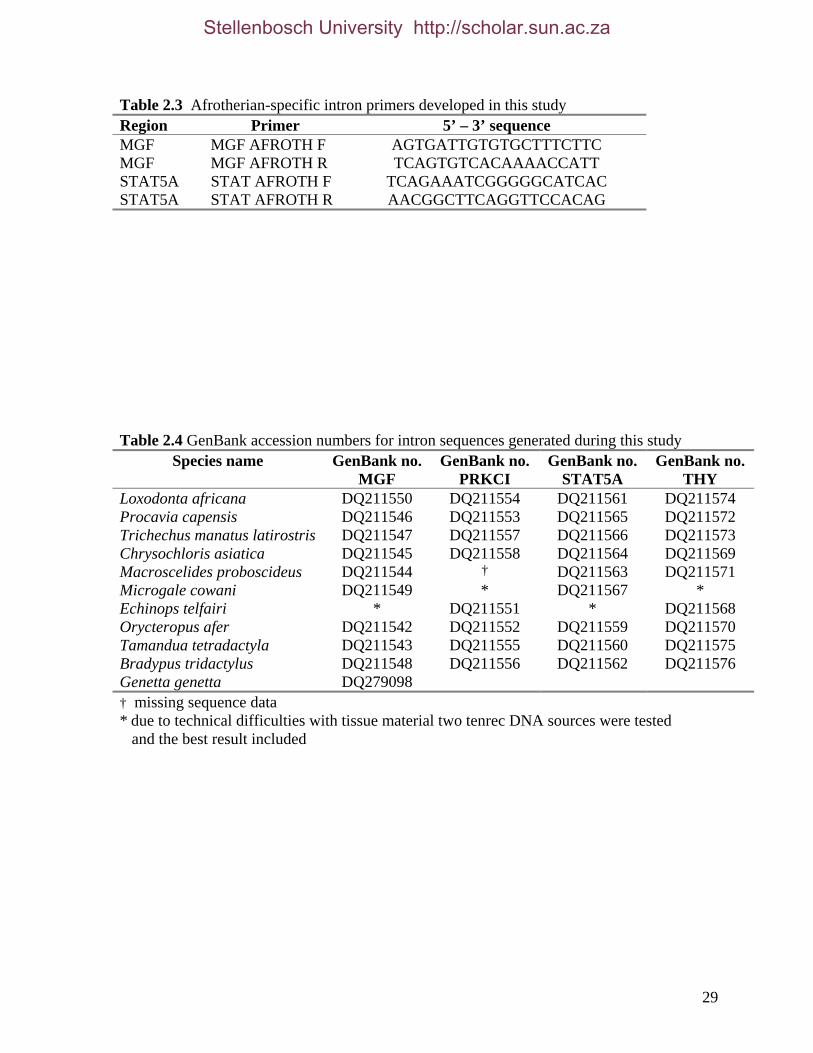
29
Table 2.3 Afrotherian-specific intron primers developed in this study Region Primer 5’ – 3’ sequence MGF MGF AFROTH F AGTGATTGTGTGCTTTCTTC MGF MGF AFROTH R TCAGTGTCACAAAACCATT STAT5A STAT AFROTH F TCAGAAATCGGGGGCATCAC STAT5A STAT AFROTH R AACGGCTTCAGGTTCCACAG Table 2.4 GenBank accession numbers for intron sequences generated during this study
Species name GenBank no. MGF
GenBank no. PRKCI
GenBank no. STAT5A
GenBank no. THY
Loxodonta africana DQ211550 DQ211554 DQ211561 DQ211574 Procavia capensis DQ211546 DQ211553 DQ211565 DQ211572 Trichechus manatus latirostris DQ211547 DQ211557 DQ211566 DQ211573 Chrysochloris asiatica DQ211545 DQ211558 DQ211564 DQ211569 Macroscelides proboscideus DQ211544 † DQ211563 DQ211571 Microgale cowani DQ211549 * DQ211567 * Echinops telfairi * DQ211551 * DQ211568 Orycteropus afer DQ211542 DQ211552 DQ211559 DQ211570 Tamandua tetradactyla DQ211543 DQ211555 DQ211560 DQ211575 Bradypus tridactylus DQ211548 DQ211556 DQ211562 DQ211576 Genetta genetta DQ279098 † missing sequence data * due to technical difficulties with tissue material two tenrec DNA sources were tested and the best result included
Stellenbosch University http://scholar.sun.ac.za
30
2.2.3 Alignment and processing of sequences
Sequences generated in this study and obtained from other sources were aligned separately
according to the following partitions: intron data (this study), APOB (Amrine-Madsen,
Koepfli et al., 2003) and mtDNA (GenBank, see table 2.2 for details). The Murphy, Eizirik et
al. (2001b) sequences are available as an aligned data set and did not require further
modification.
All sequences were initially aligned using T-COFFEE (Notredame, Higgins et al., 2000) with
the default settings. The intron regions were manually optimized in MacClade 4.0 (Maddison
and Maddison, 1989) to reduce gaps resulting from indels which ranged in size from 1-488bp
across taxa. Exon sequence remaining from primer annealing sites was identified by
comparison to published sequences and removed with the exception of several codons at
each end which were available to anchor the alignment. Indels larger than 20bp were always
found to be unique to a particular species and due to the autapomorphic nature of this
character, omitted from the alignment. All remaining indels were treated as missing data for
the computational analysis. Nucleotide sites that are heterozygous were identified as a double
peak in the chromatogram and were recoded using an IUBMB ambiguity code.
The mtDNA sequence partition was formed by concatenating the 12 heavy-strand proteins.
ND6, which is the only mtDNA protein encoded on the light strand and consequently has
different evolutionary properties to the other proteins, was excluded (Murata, Nikaido et al.,
2003; Nikaido, Kawai et al., 2001; Waddell, Cao et al., 1999b). The mtDNA 12S rRNA, 16S
rRNA and the intervening tRNA valine form part of the aligned Murphy, Eizirik et al.
(2001b) data set and therefore were not included with the mtDNA aligned data set.
Remaining tRNA sequences are unavailable for any species from Hyracoidea and
consequently, tRNA fragments, with the exception of tRNAvaline, were not included in the
analysis for any species. Overlapping positions between ATP8/ATP6 and ND4L/ND4 were
excluded. The mtDNA and APOB alignments consist entirely of coding DNA and were
converted to amino acids using McClade to confirm that nucleotide alignments did not have
codon frameshifts. Regions that could not be aligned unambiguously in each partition were
excluded from the analysis.
Stellenbosch University http://scholar.sun.ac.za

31
2.2.4 Data analysis
2.2.4.1 Data partitioning
The data were partitioned as follows:
- each individual region or gene was analysed separately to determine (as far as
possible) a relative level of signal and consequently its contribution in a combined
analysis;
- to account for the different evolutionary processes and histories of mtDNA and
nuclear DNA each of the individual partitions was grouped according to its genomic
origin;
- to compare the potential affects of functional constraints between coding and non-
coding sequences, individual genes and regions within each genomic partition were
grouped according to functionality i.e., coding or non-coding;
- and at a further selective level within coding partitions, genes were divided according
to codon position and these were merged across partitions;
- finally, all data were merged into a single large data set as a total molecular evidence
approach in this study.
2.2.4.2 Base composition
Large variation in nucleotide composition has been shown to negatively affect phylogenetic
reconstruction (Collins, Wimberger et al., 1994, Swofford, Olsen et al. 1996) and may be
more of a concern for deeper divergences (Kelsey, Crandall et al., 1999). The base
composition for each partition and combination thereof was first determined using PAUP*
4.0b10 (Swofford, 2002) and then tested for homogeneity of nucleotide composition using a
chi-squared test of nucleotide frequencies across all taxa as implemented in PAUP* 4.0b10
(this test ignores correlation due to phylogenetic structure).
2.2.4.3 Congruence between data partitions
PAUP*4.0b10 was used to carry out pairwise comparisons of heterogeneity among
individual DNA segments using the incongruence length difference test (Farris, Kallersjo et
al., 1994). Uninformative characters were excluded and 1000 replicates were used for each
comparison.
Stellenbosch University http://scholar.sun.ac.za
32
2.2.4.4 Phylogenetic analyses
All partitions were analysed using equal weights maximum parsimony (MP) in PAUP* 4.0
b10 (Swofford, 2002). Due to the small number of taxa in the study, the exhaustive search
option could be used which evaluates every possible tree topology (Swofford, Olsen et al.
1996). To assess phylogenetic utility the number of parsimony informative sites (PI),
consistency index (CI, Kluge and Farris, 1969) and retention index (RI, Farris, 1989) as well
as the number of equally parsimonious trees for each data set was determined. A measure of
support for each node was determined using 1000 replicates of nonparametric bootstrapping
(Felsenstein, 1985), each with 100 random addition of taxa and TBR branch-swapping.
Although the branch-and-bound option would have been more appropriate for smaller data
sets, this option was too computationally intensive for the larger partitions. To maintain
consistency across all data sets, a TBR branch-swapping approach was applied. To enable an
assessment of the relative contribution of individual partitions to combined data sets,
partitioned Bremmer support (Baker, Wilkinson et al., 2001) was calculated using TreeRot
(version 2, Sorenson, 1999). Alternative topologies were assessed using the
Kishino/Hasegawa test (1989), implemented in PAUP* 4.0 b10.
In contrast to treating sequence data as one, large, homogeneous partition as with the
unweighted parsimony approach used above, the sequences were also analysed using a
model-based approach. Here the evolutionary characteristics of nucleotides, such as
substitution rate are taken into account and, using newer analytical methods (Huelsenbeck
and Ronquist, 2001), can be estimated for separate data partitions simultaneously. For
partitions with very different characteristics, as is expected with different markers and deeper
divergences (Kelsey, Crandall et al., 1999), the efficiency of phylogenetic reconstruction
may be hampered by various factors e.g., long branch attraction and/or among site rate
variation. Model-based approaches to phylogenetic analyses, such as Bayesian inference,
have been shown to be particularly useful where data partitions show a great degree of
heterogeneity (Kelly, 2005; Nylander, Ronquist et al., 2004). The computer program
MrBayes 3.0b4 (Huelsenbeck and Ronquist, 2001) was used to analyse the data using a
Bayesian inference and MCMC approach. Each run was initiated from a random tree. To
better search tree-space and avoid becoming trapped on local optima, four Metropolis-
Stellenbosch University http://scholar.sun.ac.za

33
coupled MCMC (Huelsenbeck and Ronquist, 2001) chains (one cold and three heated) were
implemented and the runs repeated (and compared) to determine convergence to the same
topology. Four separate runs of 1 million generations, sampled at intervals of 50 generations,
were conducted for individual genes or regions. Combined data sets were run for 2 million
generations and sampled at intervals of 100 generations. Trees and parameter estimates
sampled before the ln likelihood scores reached equilibrium were determined empirically by
plotting ln likelihood scores against generation time in Excel (Microsoft) and confirmed
using the sump command in MrBayes. This “burn-in” phase of the process was discarded
prior to calculating the posterior node probabilities. The specification of an appropriate
model for model-based analysis is imperative (Kolaczkowski and Thornton, 2004;
Huelsenbeck and Crandall, 1997) and particularly so for more complex models (Nylander,
Ronquist et al., 2004). For all data sets, an optimal model was determined by Modeltest 3.06
(Posada and Crandall, 1998) using the Akaike information criterion (Kishino and Hasegawa,
1989, Akaike, 1973). Priors were specified for the number of substitution types (nst=2 or 6)
and among-site rate variation (gamma, G; invariant sites, I; or G+I) and where a gamma
distribution was specified, four rate categories were used (Swofford, Olsen et al., 1996).
Default settings were maintained for estimation of base frequencies (Dirichlet distribution)
and topology (uniform).
In addition to the BI tree inference method, maximum-likelihood (ML) was included as an
additional model-based approach to provide a more comprehensive analysis of the new
(intron) sequences. The optimal nucleotide substitution model was selected (see above) using
Modeltest 3.06 (Posada and Crandall, 1998) and searches using both the AIC and likelihood
ratio test (LRT) were included where these differed. Maximum likelihood analyses were
performed using PAUP* 4.0 b10 (Swofford, 2002). Starting trees were obtained using
neighbour-joining and this was followed by TBR branch-swapping. To determine nodal
support, 100 ML bootstrap replicates were performed using TBR branch-swapping on each
topology.
Stellenbosch University http://scholar.sun.ac.za
34
2.3 RESULTS AND DISCUSSION
2.3.1 Data
2.3.1.1 Data description and partition variability
The combined total dataset of 29904bp consisted of 12 mtDNA protein-coding segments
(10760bp), three mitochondrial rRNA regions (1640bp), 16 protein-coding genes (13857bp)
and eight non-coding regions of nuclear origin. The eight non-coding nuclear regions were
subdivided into four intron segments (1987bp) and four 3’ untranslated regions (UTRs,
1660bp). Comparison of the different levels of functional divisions (e.g., coding versus non-
coding, mtDNA versus nDNA) of the above partitions corresponds to the proportion of
variable characters (% Var, table 2.5). Hence, the highest level present is found in the faster
evolving mtDNA genome and specifically in ATP8 (87.56). This value is considerably
higher than values for other mtDNA regions in the same class (protein-coding; 41.73-67.37,
average 49.63) and may be a stochastic effect as a result of the short length of this partition
(201bp). Despite this high outlier value, intron regions (50.66-69.84; average 60.16) have on
average a higher level of variability than mtDNA protein segments even when including
ATP8 (average 52.16). UTR partitions (16.98-56.36; average 36.05) fall within the range of
variability of nuclear genes (16.45-59.68; average 36.27) and mitochondrial rRNAs (27.34-
35.16; average 31.75) exhibit the lowest overall levels of variability. This pattern is not
unexpected considering the higher substitution rate in intron and mtDNA regions in
comparison to nuclear exons. The higher proportion of variable characters in introns,
compared to mtDNA is, however, notable. Extending this analysis to codon positions within
genes similarly conforms to expectations of substitution rate with third codon positions
having a greater number of variable characters than first or second codon positions.
Comparison of the percentage of parsimony informative characters (%PI, table 2.5)
between different partitions shows that overall mtDNA (39.27) has a far greater proportion
of PI characters than nuclear DNA (17.59) and within the mitochondrial genome itself,
protein coding segments (34.39-56.72; average 43.70) exceed ribosomal RNA regions
(14.49-18.51; average16.68). Introns (18.06-32.65; average 24.48) contain the greatest
number of PI characters within the nuclear DNA partition, followed by exons (8.30-27.02;
average 17.21) and UTR regions (4.32-24.92; average 11.07).
Stellenbosch University http://scholar.sun.ac.za
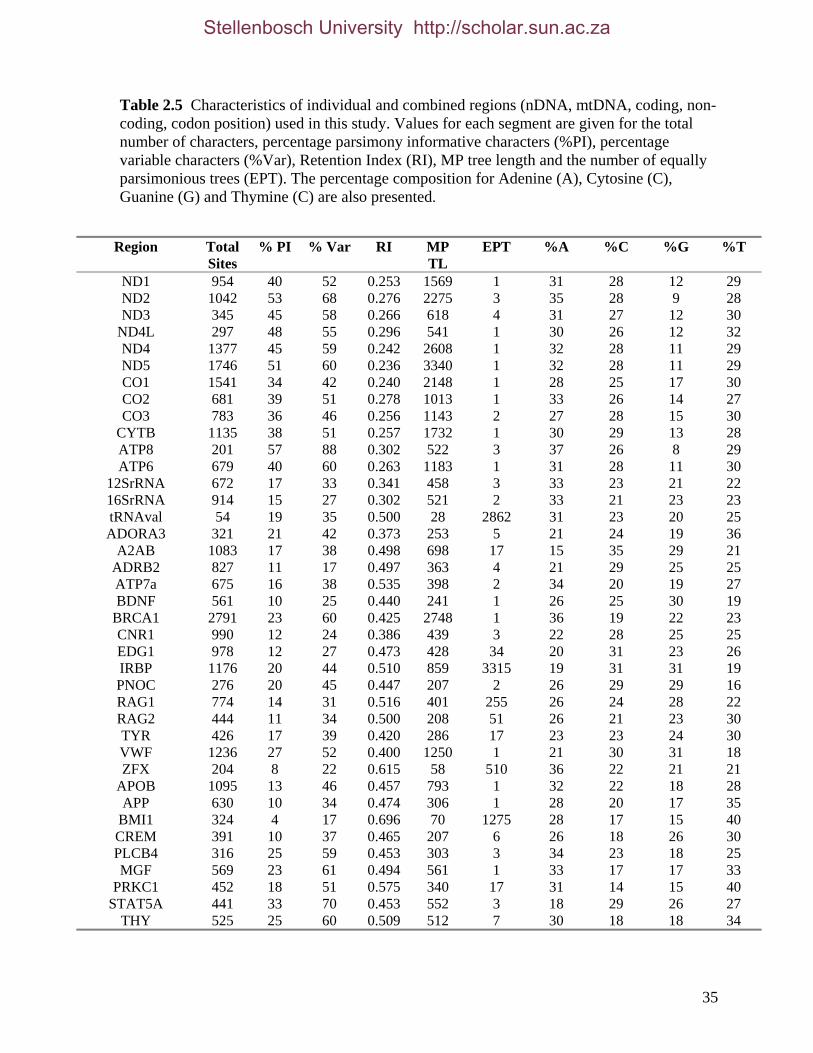
35
Table 2.5 Characteristics of individual and combined regions (nDNA, mtDNA, coding, non-coding, codon position) used in this study. Values for each segment are given for the total number of characters, percentage parsimony informative characters (%PI), percentage variable characters (%Var), Retention Index (RI), MP tree length and the number of equally parsimonious trees (EPT). The percentage composition for Adenine (A), Cytosine (C), Guanine (G) and Thymine (C) are also presented.
Region Total Sites
% PI % Var RI MP TL
EPT %A %C %G %T
ND1 954 40 52 0.253 1569 1 31 28 12 29 ND2 1042 53 68 0.276 2275 3 35 28 9 28 ND3 345 45 58 0.266 618 4 31 27 12 30
ND4L 297 48 55 0.296 541 1 30 26 12 32 ND4 1377 45 59 0.242 2608 1 32 28 11 29 ND5 1746 51 60 0.236 3340 1 32 28 11 29 CO1 1541 34 42 0.240 2148 1 28 25 17 30 CO2 681 39 51 0.278 1013 1 33 26 14 27 CO3 783 36 46 0.256 1143 2 27 28 15 30
CYTB 1135 38 51 0.257 1732 1 30 29 13 28 ATP8 201 57 88 0.302 522 3 37 26 8 29 ATP6 679 40 60 0.263 1183 1 31 28 11 30
12SrRNA 672 17 33 0.341 458 3 33 23 21 22 16SrRNA 914 15 27 0.302 521 2 33 21 23 23 tRNAval 54 19 35 0.500 28 2862 31 23 20 25 ADORA3 321 21 42 0.373 253 5 21 24 19 36
A2AB 1083 17 38 0.498 698 17 15 35 29 21 ADRB2 827 11 17 0.497 363 4 21 29 25 25 ATP7a 675 16 38 0.535 398 2 34 20 19 27 BDNF 561 10 25 0.440 241 1 26 25 30 19
BRCA1 2791 23 60 0.425 2748 1 36 19 22 23 CNR1 990 12 24 0.386 439 3 22 28 25 25 EDG1 978 12 27 0.473 428 34 20 31 23 26 IRBP 1176 20 44 0.510 859 3315 19 31 31 19 PNOC 276 20 45 0.447 207 2 26 29 29 16 RAG1 774 14 31 0.516 401 255 26 24 28 22 RAG2 444 11 34 0.500 208 51 26 21 23 30 TYR 426 17 39 0.420 286 17 23 23 24 30 VWF 1236 27 52 0.400 1250 1 21 30 31 18 ZFX 204 8 22 0.615 58 510 36 22 21 21
APOB 1095 13 46 0.457 793 1 32 22 18 28 APP 630 10 34 0.474 306 1 28 20 17 35
BMI1 324 4 17 0.696 70 1275 28 17 15 40 CREM 391 10 37 0.465 207 6 26 18 26 30 PLCB4 316 25 59 0.453 303 3 34 23 18 25 MGF 569 23 61 0.494 561 1 33 17 17 33
PRKC1 452 18 51 0.575 340 17 31 14 15 40 STAT5A 441 33 70 0.453 552 3 18 29 26 27
THY 525 25 60 0.509 512 7 30 18 18 34
Stellenbosch University http://scholar.sun.ac.za
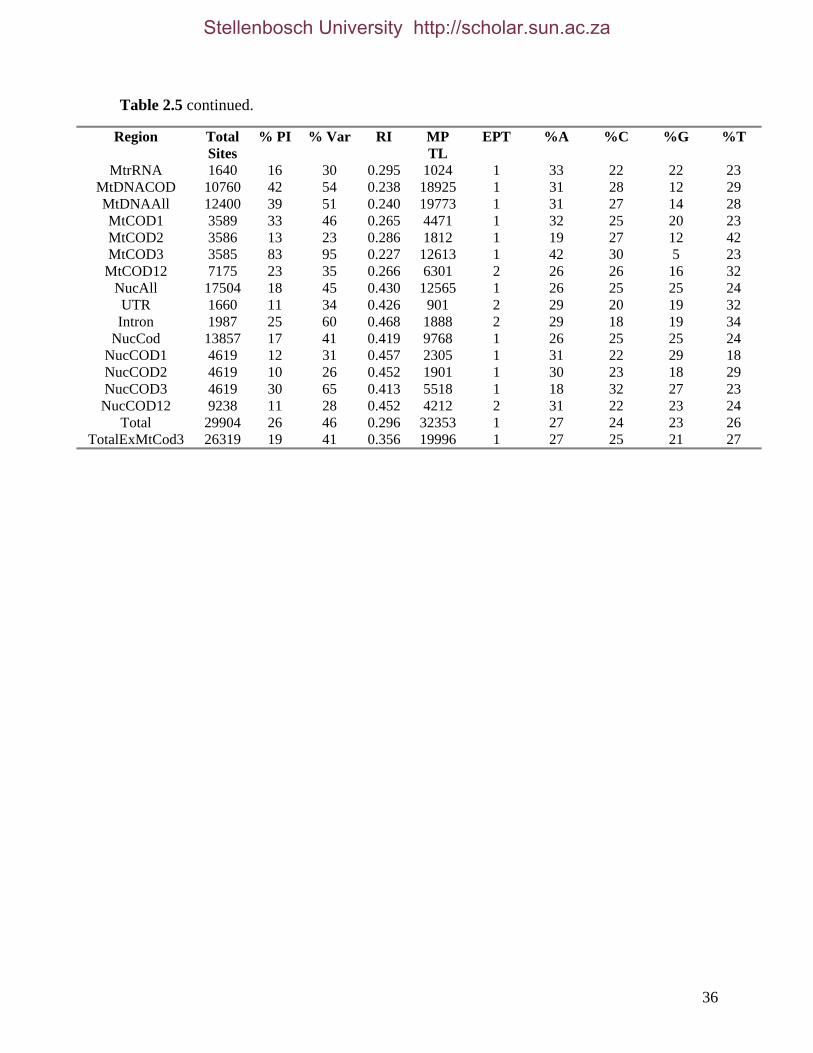
36
Table 2.5 continued.
Region Total Sites
% PI % Var RI MP TL
EPT %A %C %G %T
MtrRNA 1640 16 30 0.295 1024 1 33 22 22 23 MtDNACOD 10760 42 54 0.238 18925 1 31 28 12 29 MtDNAAll 12400 39 51 0.240 19773 1 31 27 14 28 MtCOD1 3589 33 46 0.265 4471 1 32 25 20 23 MtCOD2 3586 13 23 0.286 1812 1 19 27 12 42 MtCOD3 3585 83 95 0.227 12613 1 42 30 5 23
MtCOD12 7175 23 35 0.266 6301 2 26 26 16 32 NucAll 17504 18 45 0.430 12565 1 26 25 25 24 UTR 1660 11 34 0.426 901 2 29 20 19 32 Intron 1987 25 60 0.468 1888 2 29 18 19 34
NucCod 13857 17 41 0.419 9768 1 26 25 25 24 NucCOD1 4619 12 31 0.457 2305 1 31 22 29 18 NucCOD2 4619 10 26 0.452 1901 1 30 23 18 29 NucCOD3 4619 30 65 0.413 5518 1 18 32 27 23
NucCOD12 9238 11 28 0.452 4212 2 31 22 23 24 Total 29904 26 46 0.296 32353 1 27 24 23 26
TotalExMtCod3 26319 19 41 0.356 19996 1 27 25 21 27
Stellenbosch University http://scholar.sun.ac.za
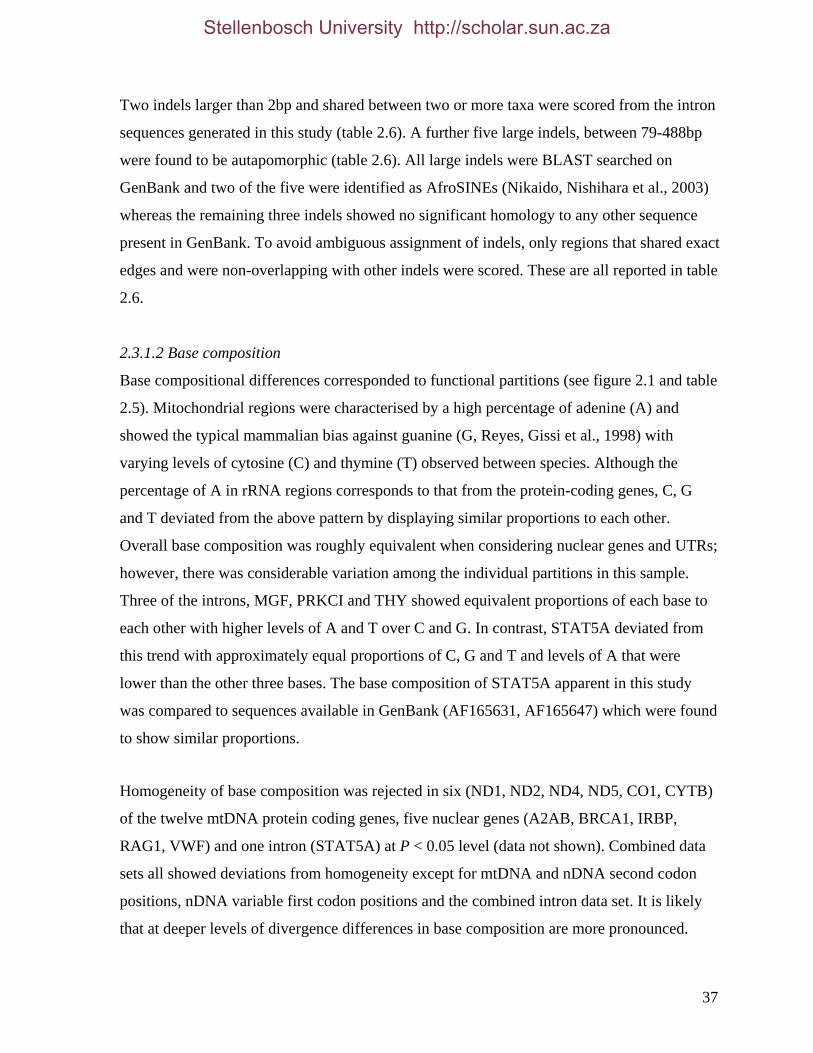
37
Two indels larger than 2bp and shared between two or more taxa were scored from the intron
sequences generated in this study (table 2.6). A further five large indels, between 79-488bp
were found to be autapomorphic (table 2.6). All large indels were BLAST searched on
GenBank and two of the five were identified as AfroSINEs (Nikaido, Nishihara et al., 2003)
whereas the remaining three indels showed no significant homology to any other sequence
present in GenBank. To avoid ambiguous assignment of indels, only regions that shared exact
edges and were non-overlapping with other indels were scored. These are all reported in table
2.6.
2.3.1.2 Base composition
Base compositional differences corresponded to functional partitions (see figure 2.1 and table
2.5). Mitochondrial regions were characterised by a high percentage of adenine (A) and
showed the typical mammalian bias against guanine (G, Reyes, Gissi et al., 1998) with
varying levels of cytosine (C) and thymine (T) observed between species. Although the
percentage of A in rRNA regions corresponds to that from the protein-coding genes, C, G
and T deviated from the above pattern by displaying similar proportions to each other.
Overall base composition was roughly equivalent when considering nuclear genes and UTRs;
however, there was considerable variation among the individual partitions in this sample.
Three of the introns, MGF, PRKCI and THY showed equivalent proportions of each base to
each other with higher levels of A and T over C and G. In contrast, STAT5A deviated from
this trend with approximately equal proportions of C, G and T and levels of A that were
lower than the other three bases. The base composition of STAT5A apparent in this study
was compared to sequences available in GenBank (AF165631, AF165647) which were found
to show similar proportions.
Homogeneity of base composition was rejected in six (ND1, ND2, ND4, ND5, CO1, CYTB)
of the twelve mtDNA protein coding genes, five nuclear genes (A2AB, BRCA1, IRBP,
RAG1, VWF) and one intron (STAT5A) at P < 0.05 level (data not shown). Combined data
sets all showed deviations from homogeneity except for mtDNA and nDNA second codon
positions, nDNA variable first codon positions and the combined intron data set. It is likely
that at deeper levels of divergence differences in base composition are more pronounced.
Stellenbosch University http://scholar.sun.ac.za
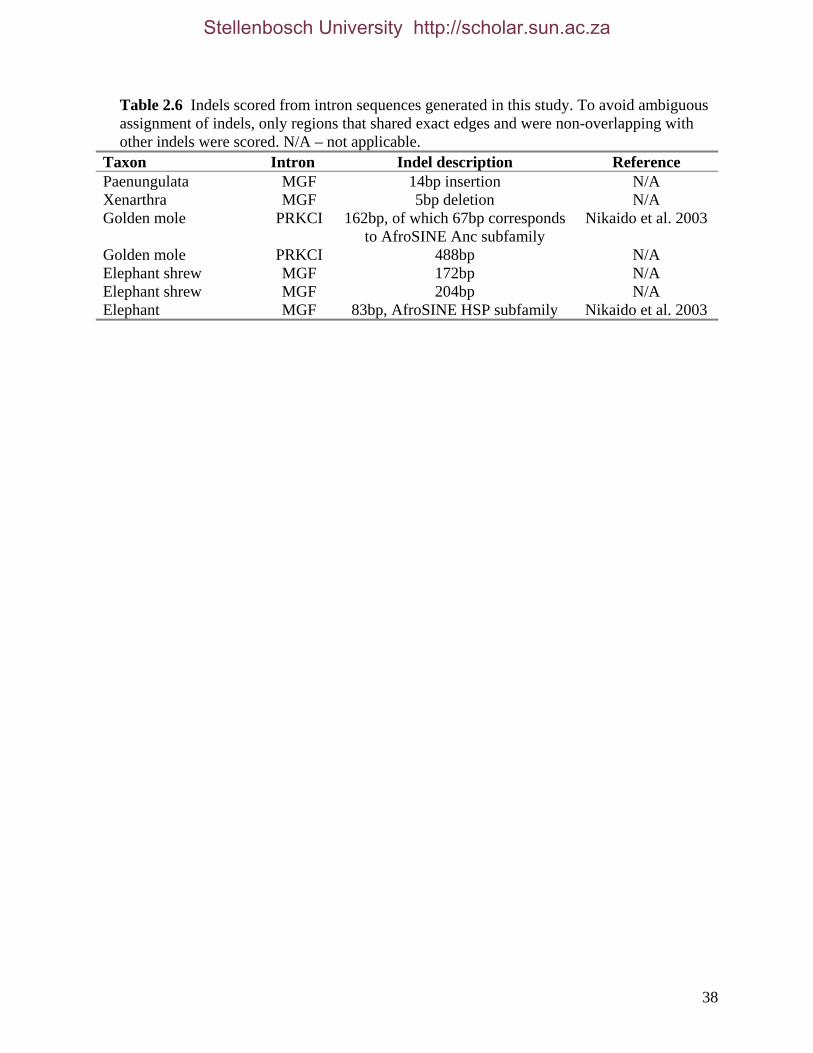
38
Table 2.6 Indels scored from intron sequences generated in this study. To avoid ambiguous assignment of indels, only regions that shared exact edges and were non-overlapping with other indels were scored. N/A – not applicable.
Taxon Intron Indel description Reference Paenungulata MGF 14bp insertion N/A Xenarthra MGF 5bp deletion N/A Golden mole PRKCI 162bp, of which 67bp corresponds
to AfroSINE Anc subfamily Nikaido et al. 2003
Golden mole PRKCI 488bp N/A Elephant shrew MGF 172bp N/A Elephant shrew MGF 204bp N/A Elephant MGF 83bp, AfroSINE HSP subfamily Nikaido et al. 2003
Stellenbosch University http://scholar.sun.ac.za

39
Base composition among taxa show little variation for nDNA and levels of similarity
corresponded to established phylogenetic groupings (e.g., Xenarthra, Paenungulata). This is
in stark contrast to that for mtDNA where considerable variation was present among sister
taxa, in particular within Paenungulata (see fig. 2.2). The base composition of each mtDNA
codon position was determined and then tested for homogeneity of nucleotide composition
using a chi-squared test of nucleotide frequencies across Paenungulata as implemented in
PAUP* 4.0b10. A highly significant difference was apparent for third codon positions which
is expected due to the more exaggerated differences at these sites due to the reduced
constraints in comparison to first and second codon positions. Consequently, third codon
sites will evolve rapidly according to particular base composition preferences apparent in the
genome (Inagaki, Simpson et al., 2004).
2.3.1.3 Nucleotide evolution within Paenungulata
2.3.1.3.1 Sequence divergence
Comparison of nDNA and mtDNA sequence divergences (corrected and uncorrected)
between paenungulate species yields two distinct patterns that are consistent across partitions
derived from each genome (table 2.7). In nDNA, sequence divergence estimates among
paenungulates are lowest between manatee and elephant (M+E), followed by manatee and
hyrax (M+H) and lastly hyrax and elephant (H+E). In contrast, mtDNA divergences between
these three taxa are lowest in M+H, increasing with M+E and highest in H+E. By taking the
relative substitution rates for each species within both mitochondrial and nuclear genomes
into account, the difference in sequence divergence pattern of M+E between mtDNA and
nDNA can be assessed. Specifically, substitution rate differences can be compared between
different partitions by examining the edge lengths of the phylograms which give an
indication of the number of changes leading to a particular terminal taxon. When topologies
originating from both nuclear and mtDNA partitions are compared, there is a trend showing
consistently shorter edge lengths for the manatee (92% of comparisons in mtDNA, 69%
nDNA) relative to the hyrax and elephant, indicating a relatively slower rate of evolution in
the manatee across both genomes. At nuclear sites the elephant has shorter edge lengths than
the hyrax; however, in mtDNA topologies, the elephant has the longest edge length among
paenungulates in 93% of cases which is consistent with an elevated mitochondrial
Stellenbosch University http://scholar.sun.ac.za
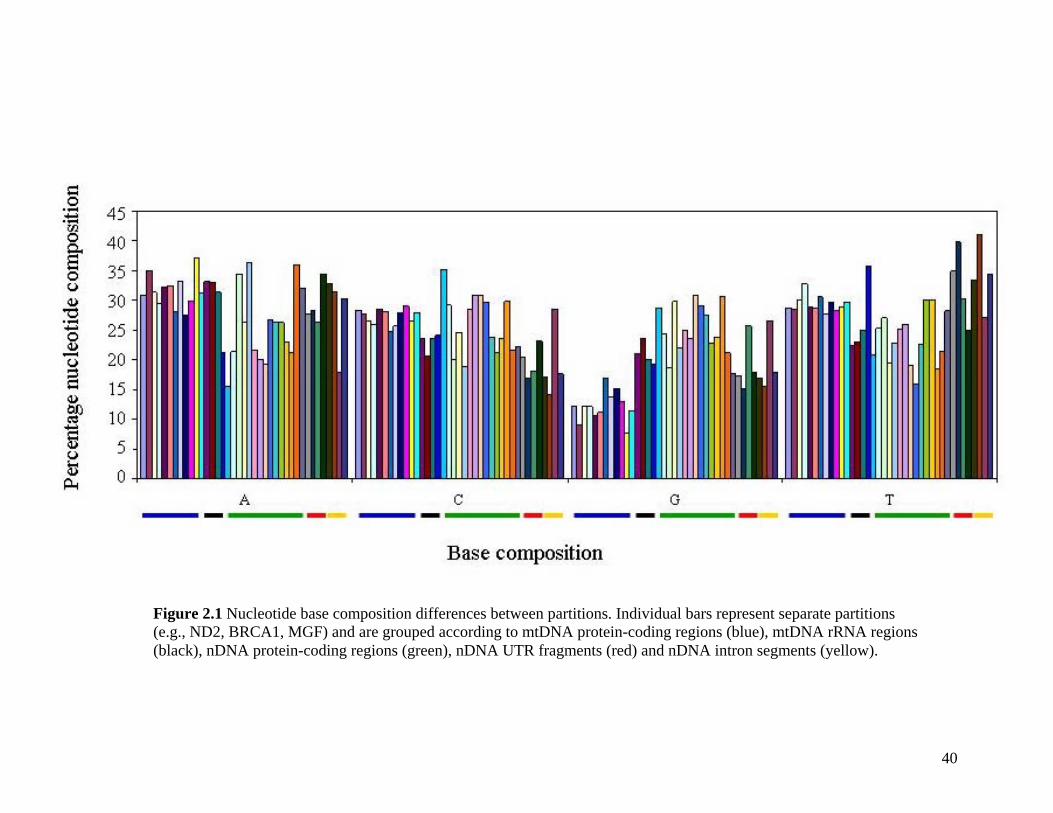
40
Figure 2.1 Nucleotide base composition differences between partitions. Individual bars represent separate partitions (e.g., ND2, BRCA1, MGF) and are grouped according to mtDNA protein-coding regions (blue), mtDNA rRNA regions (black), nDNA protein-coding regions (green), nDNA UTR fragments (red) and nDNA intron segments (yellow).
Stellenbosch University http://scholar.sun.ac.za
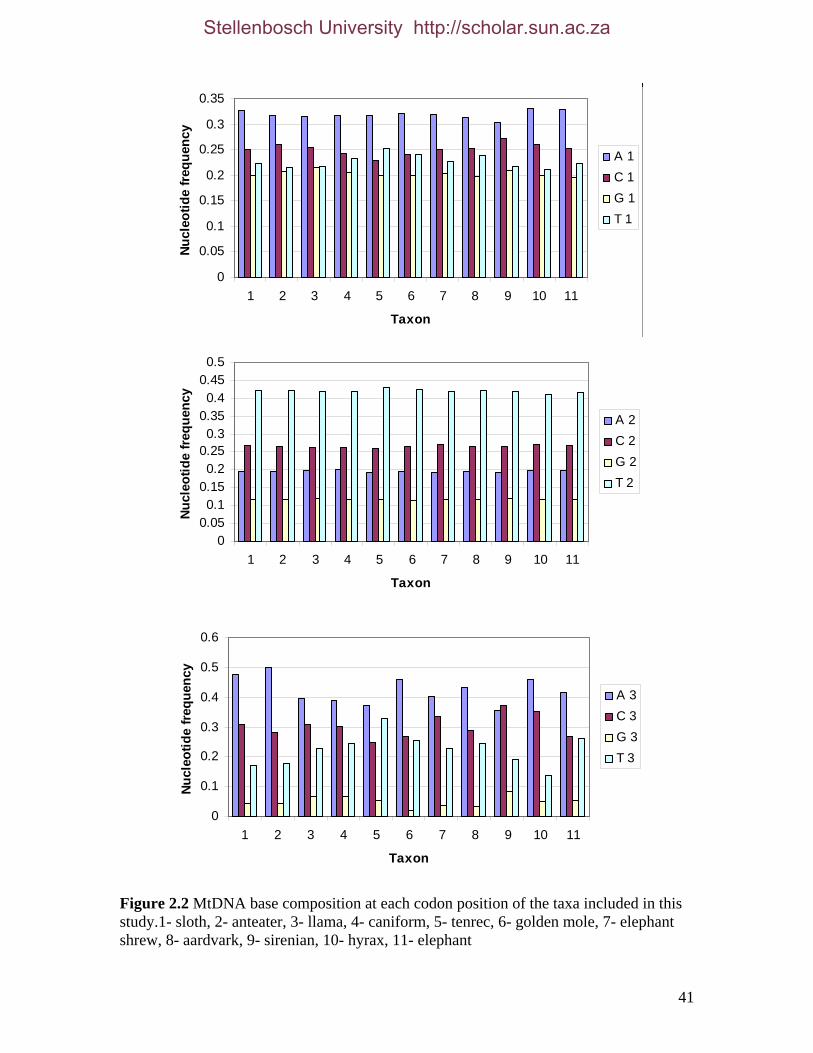
41
Figure 2.2 MtDNA base composition at each codon position of the taxa included in this study.1- sloth, 2- anteater, 3- llama, 4- caniform, 5- tenrec, 6- golden mole, 7- elephant shrew, 8- aardvark, 9- sirenian, 10- hyrax, 11- elephant
0
0.05
0.1
0.15
0.2
0.25
0.3
0.35
1 2 3 4 5 6 7 8 9 10 11
Taxon
Nucl
eotid
e fre
quen
cy
A 1C 1G 1T 1
0
0.1
0.2
0.3
0.4
0.5
0.6
1 2 3 4 5 6 7 8 9 10 11
Taxon
Nucl
eotid
e fr
eque
ncy
A 3C 3G 3T 3
00.050.1
0.150.2
0.250.3
0.350.4
0.450.5
1 2 3 4 5 6 7 8 9 10 11
Taxon
Nucl
eotid
e fr
eque
ncy
A 2C 2G 2T 2
Stellenbosch University http://scholar.sun.ac.za
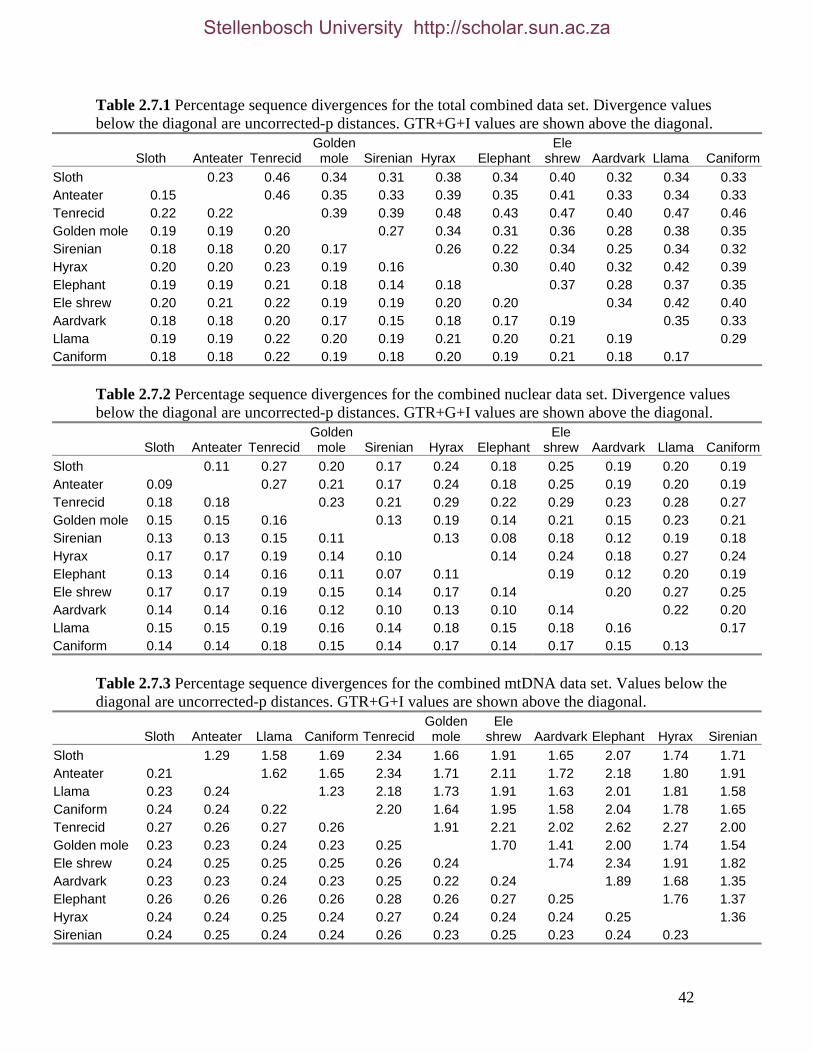
42
Table 2.7.1 Percentage sequence divergences for the total combined data set. Divergence values below the diagonal are uncorrected-p distances. GTR+G+I values are shown above the diagonal.
Sloth Anteater Tenrecid Golden mole Sirenian Hyrax Elephant
Ele shrew Aardvark Llama Caniform
Sloth 0.23 0.46 0.34 0.31 0.38 0.34 0.40 0.32 0.34 0.33 Anteater 0.15 0.46 0.35 0.33 0.39 0.35 0.41 0.33 0.34 0.33 Tenrecid 0.22 0.22 0.39 0.39 0.48 0.43 0.47 0.40 0.47 0.46 Golden mole 0.19 0.19 0.20 0.27 0.34 0.31 0.36 0.28 0.38 0.35 Sirenian 0.18 0.18 0.20 0.17 0.26 0.22 0.34 0.25 0.34 0.32 Hyrax 0.20 0.20 0.23 0.19 0.16 0.30 0.40 0.32 0.42 0.39 Elephant 0.19 0.19 0.21 0.18 0.14 0.18 0.37 0.28 0.37 0.35 Ele shrew 0.20 0.21 0.22 0.19 0.19 0.20 0.20 0.34 0.42 0.40 Aardvark 0.18 0.18 0.20 0.17 0.15 0.18 0.17 0.19 0.35 0.33 Llama 0.19 0.19 0.22 0.20 0.19 0.21 0.20 0.21 0.19 0.29 Caniform 0.18 0.18 0.22 0.19 0.18 0.20 0.19 0.21 0.18 0.17
Table 2.7.2 Percentage sequence divergences for the combined nuclear data set. Divergence values below the diagonal are uncorrected-p distances. GTR+G+I values are shown above the diagonal.
Sloth Anteater Tenrecid Golden mole Sirenian Hyrax Elephant
Ele shrew Aardvark Llama Caniform
Sloth 0.11 0.27 0.20 0.17 0.24 0.18 0.25 0.19 0.20 0.19 Anteater 0.09 0.27 0.21 0.17 0.24 0.18 0.25 0.19 0.20 0.19 Tenrecid 0.18 0.18 0.23 0.21 0.29 0.22 0.29 0.23 0.28 0.27 Golden mole 0.15 0.15 0.16 0.13 0.19 0.14 0.21 0.15 0.23 0.21 Sirenian 0.13 0.13 0.15 0.11 0.13 0.08 0.18 0.12 0.19 0.18 Hyrax 0.17 0.17 0.19 0.14 0.10 0.14 0.24 0.18 0.27 0.24 Elephant 0.13 0.14 0.16 0.11 0.07 0.11 0.19 0.12 0.20 0.19 Ele shrew 0.17 0.17 0.19 0.15 0.14 0.17 0.14 0.20 0.27 0.25 Aardvark 0.14 0.14 0.16 0.12 0.10 0.13 0.10 0.14 0.22 0.20 Llama 0.15 0.15 0.19 0.16 0.14 0.18 0.15 0.18 0.16 0.17 Caniform 0.14 0.14 0.18 0.15 0.14 0.17 0.14 0.17 0.15 0.13
Table 2.7.3 Percentage sequence divergences for the combined mtDNA data set. Values below the diagonal are uncorrected-p distances. GTR+G+I values are shown above the diagonal.
Sloth Anteater Llama Caniform TenrecidGolden mole
Ele shrew Aardvark Elephant Hyrax Sirenian
Sloth 1.29 1.58 1.69 2.34 1.66 1.91 1.65 2.07 1.74 1.71 Anteater 0.21 1.62 1.65 2.34 1.71 2.11 1.72 2.18 1.80 1.91 Llama 0.23 0.24 1.23 2.18 1.73 1.91 1.63 2.01 1.81 1.58 Caniform 0.24 0.24 0.22 2.20 1.64 1.95 1.58 2.04 1.78 1.65 Tenrecid 0.27 0.26 0.27 0.26 1.91 2.21 2.02 2.62 2.27 2.00 Golden mole 0.23 0.23 0.24 0.23 0.25 1.70 1.41 2.00 1.74 1.54 Ele shrew 0.24 0.25 0.25 0.25 0.26 0.24 1.74 2.34 1.91 1.82 Aardvark 0.23 0.23 0.24 0.23 0.25 0.22 0.24 1.89 1.68 1.35 Elephant 0.26 0.26 0.26 0.26 0.28 0.26 0.27 0.25 1.76 1.37 Hyrax 0.24 0.24 0.25 0.24 0.27 0.24 0.24 0.24 0.25 1.36 Sirenian 0.24 0.25 0.24 0.24 0.26 0.23 0.25 0.23 0.24 0.23
Stellenbosch University http://scholar.sun.ac.za

43
substitution rate in this species, particularly found to be higher than any other mammalian
order in CYTB and 12S rRNA (Gissi, Reyes et al., 2000). It is noteworthy that the
elevated rate in elephant mtDNA is contrary to the generation time hypothesis (Waddell,
Cao et al., 1999a) and may indicate involvement from the many interrelated factors that
could potentially affect substitution rates in mtDNA (Bromham, Rambaut et al., 1996).
The increased sequence divergence of M+E present in mtDNA relative to nDNA, taking
into account the slow rate in manatee across both genomes, is therefore likely a
consequence of the increased rate of evolution of elephant mtDNA relative to the nDNA
rate for this taxon.
2.3.1.3.2 Substitution processes
A comparison of transition/transversion (ti/tv) estimates against distance enables a further
assessment of differences in substitution processes (Waddell and Steel, 1997) between
nDNA and mtDNA. Ti/tv ratio estimates for pairs of taxa obtained with different
corrections (gamma, G; invariant sites, I; or G+I; calculated in PAUP* 4.0b10, Swofford,
2002) were plotted against the observed distance for nDNA (figure 2.3) and mtDNA
(figure 2.4). Transitions evolve faster than transversions (Jukes, 1987; Brown, Prager et
al., 1982), consequently as the distance between taxa increases, the ratio will decrease as
a result of multiple substitutions occurring at a site (Waddell and Steel, 1997). This is
evident in nDNA (figure 2.3a). When ti/tv for each codon position is estimated separately
(figure 2.3b-d), this effect is greater at faster-evolving third codon positions as expected.
Ti/tv ratios estimated with a more parameter rich correction (e.g., GTR+G+I, Waddell
and Steel, 1997) show a reduced leveling-off suggesting that these models are affecting a
degree of correction for multiple hits. In contrast, the ti/tv estimates for mtDNA (figure
2.4a-c) show an increase with distance which appears to increase further as more
parameters are included in the model suggesting an over-correction and/or strongly non-
stationary process of evolution. Additionally, the range of distance values for mtDNA is
narrower in comparison to nDNA which together with the trend of increasing ti/tv
estimates, indicates that the models are not able to compensate for mtDNA substitution
processes. Above all, the ti/tv estimates for M+E (for mtDNA) are clearly elevated in
contrast to other taxon pairs particularly when third codon position are included
Stellenbosch University http://scholar.sun.ac.za

44
a
b
Figure 2.3 a b, (c,d overleaf) Transition versus transversion ratios in a) nuclearcod, b) nuccod1, c) nuccod2, d) nuccod3 plotted against the observed distance. IR - identical rates; M+E, H+E, M+H for GTR+G+I. Only one representative of each outgroup was included. Estimates for G and I were obtained from Modeltest 3.06 (Posada and Crandall, 1998), using the AIC and where a GTR+I+G model was not selected (nuccod3, nuccod1) the missing parameter estimates were obtained from MrBayes 3.1 (see appendix 3).
0
0.5
1
1.5
2
2.5
3
3.5
0 0.05 0.1 0.15 0.2
distance (observed)
ti/tv
IRGTR+IGTR+GGTR+I+G
0
0.5
1
1.5
2
2.5
3
3.5
4
0 0.05 0.1 0.15
distance (observed)
ti/tv GTR+I
GTR+I+G
Stellenbosch University http://scholar.sun.ac.za
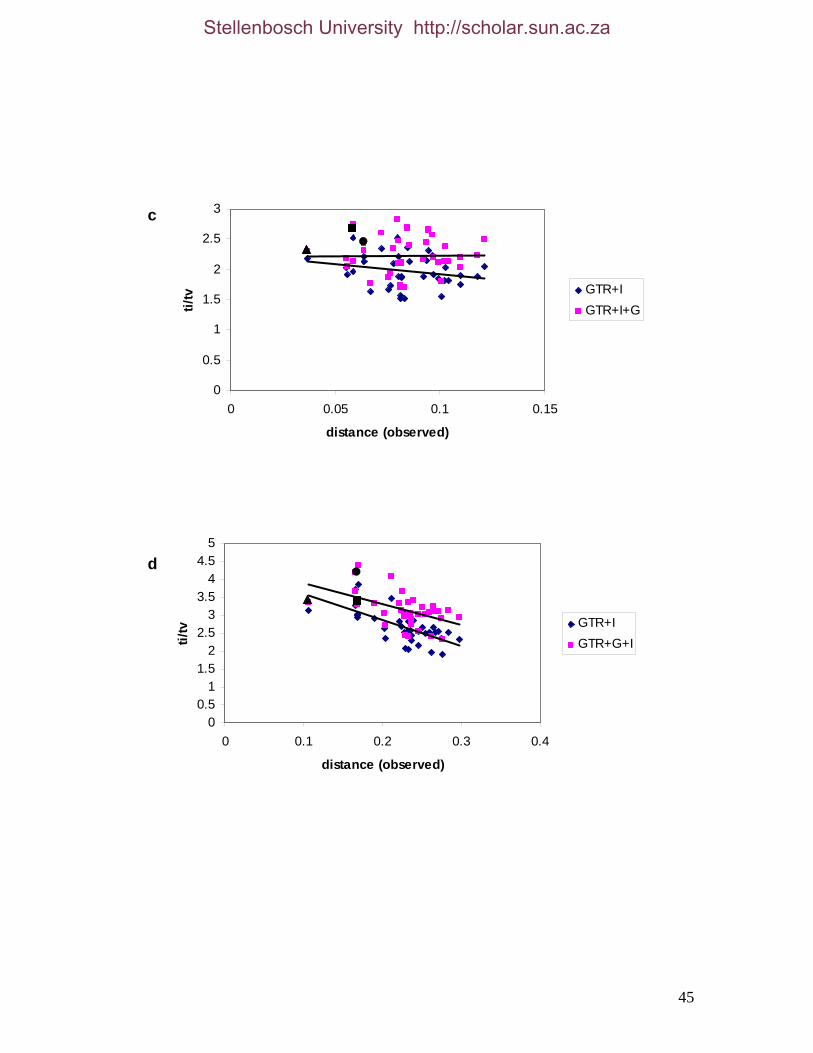
45
c d
0
0.5
1
1.5
2
2.5
3
0 0.05 0.1 0.15
distance (observed)
ti/tv GTR+I
GTR+I+G
00.5
11.5
22.5
33.5
44.5
5
0 0.1 0.2 0.3 0.4
distance (observed)
ti/tv GTR+I
GTR+G+I
Stellenbosch University http://scholar.sun.ac.za
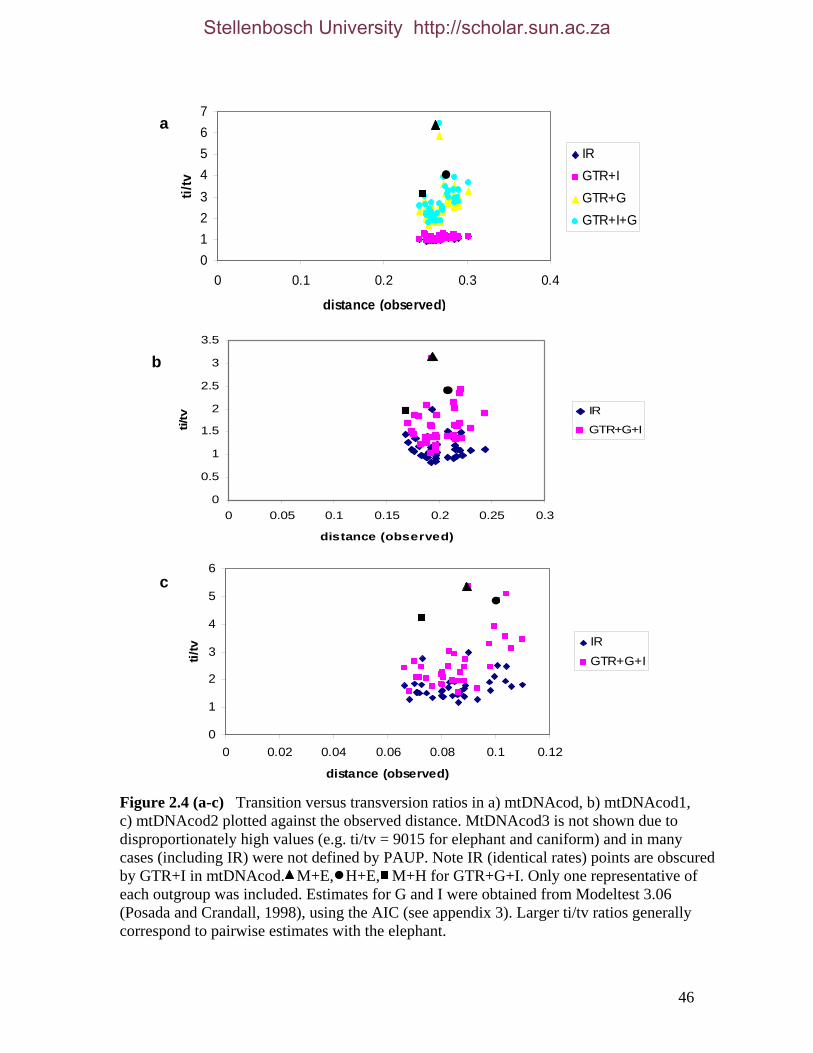
46
a b c
Figure 2.4 (a-c) Transition versus transversion ratios in a) mtDNAcod, b) mtDNAcod1, c) mtDNAcod2 plotted against the observed distance. MtDNAcod3 is not shown due to disproportionately high values (e.g. ti/tv = 9015 for elephant and caniform) and in many cases (including IR) were not defined by PAUP. Note IR (identical rates) points are obscured by GTR+I in mtDNAcod. M+E, H+E, M+H for GTR+G+I. Only one representative of each outgroup was included. Estimates for G and I were obtained from Modeltest 3.06 (Posada and Crandall, 1998), using the AIC (see appendix 3). Larger ti/tv ratios generally correspond to pairwise estimates with the elephant.
01234567
0 0.1 0.2 0.3 0.4
distance (observed)
ti/tv
IRGTR+IGTR+GGTR+I+G
0
0.5
1
1.5
2
2.5
3
3.5
0 0.05 0.1 0.15 0.2 0.25 0.3
distance (observed)
ti/tv IR
GTR+G+I
0
1
2
3
4
5
6
0 0.02 0.04 0.06 0.08 0.1 0.12
distance (observed)
ti/tv IR
GTR+G+I
Stellenbosch University http://scholar.sun.ac.za
47
(fig. 2.4a) and estimates are obtained with more parameter-rich corrections. Although
elephant pairwise ti/tv estimates overall are elevated in comparison to other taxon pairs
(data not shown), the large difference of M+E to other elephant pairwise comparisons is
noteworthy.
To determine if particular substitution biases are in effect with the elevated ti/tv estimate
for M+E, a manual scan of the mtDNAcod dataset was performed using the trace
character option in MacClade to directly characterise and quantify nucleotide
substitutions shared between two paenungulates. Although Afrotheria receives
considerable support in the basal position within the eutherian tree, alternative hypotheses
are also considered feasible (see section 1.2.2). An ambiguous basal position can result in
the incorrect assignment of the polarity of a character. Consequently, given the relatively
small number of taxa used in this study a conservative approach was taken and the
changes scored were limited to the following three groups; i) synapomorphic changes
within Paenungulata, ii) those shared by two paenungulates and any single (non-
paenungulate) taxon in the data set, and iii) those shared by two paenungulates and any
two other (non-paenungulate) taxa in the data set. Changes were scored according to
substitution type (e.g., A to T, G to A) and codon position and are summarised in table
2.8. A comparison of the number of changes counted in each of the three groups shows
concordance in all cases except one (group i, T to C, M+H) indicating that the three
groups are likely representative subsamples. Additionally, there is agreement in the
proportion of changes in different substitution classes obtained from the manual scan
(shared changes) and those present in the mtDNAcod data set (total changes per taxon,
appendix 1 and 2) as calculated in PAUP* 4.0b10 (Swofford, 2002).
On first examination of the changes scored from the manual scan (table 2.8), the
following results are of note: i) a large number of transversion differences for pairwise
manatee changes from A to C and A to T; ii) an increase in first codon changes from C to
T and A to C for M+E relative to the average number of first codon changes overall; and,
iii) an increase in second codon changes from T to C present in H+E relative to the
average number of second codon changes overall. Furthermore, a trend between the
Stellenbosch University http://scholar.sun.ac.za
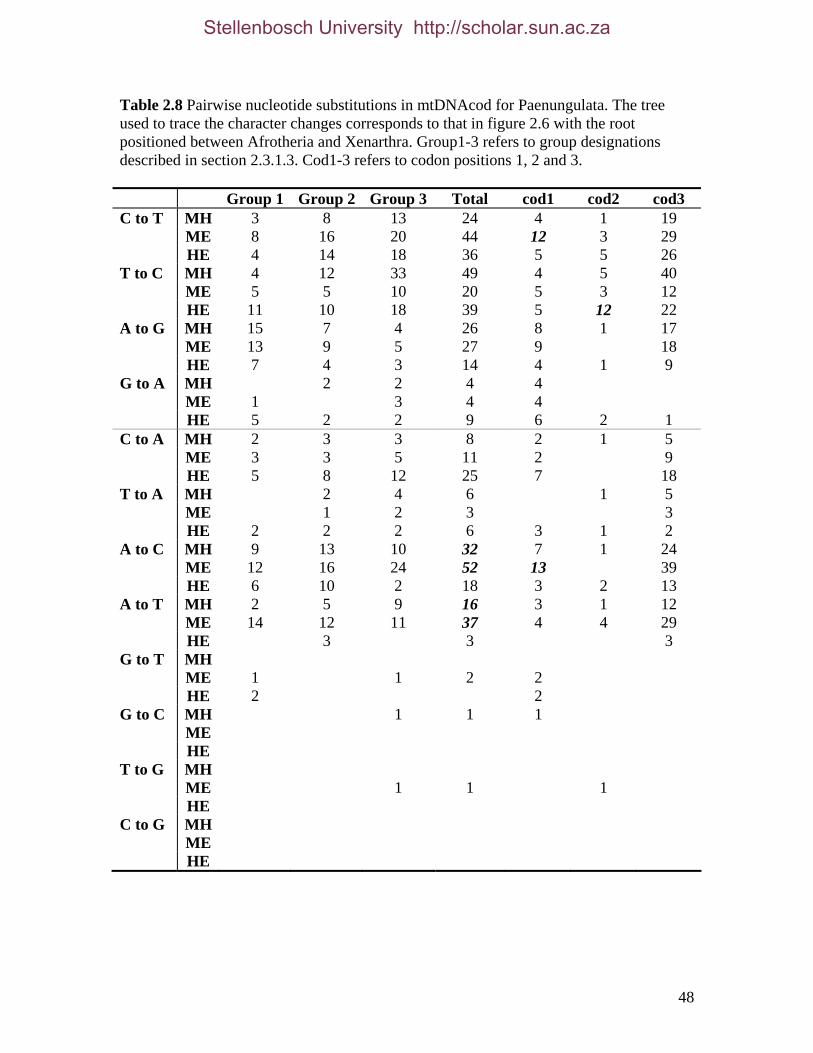
48
Table 2.8 Pairwise nucleotide substitutions in mtDNAcod for Paenungulata. The tree used to trace the character changes corresponds to that in figure 2.6 with the root positioned between Afrotheria and Xenarthra. Group1-3 refers to group designations described in section 2.3.1.3. Cod1-3 refers to codon positions 1, 2 and 3. Group 1 Group 2 Group 3 Total cod1 cod2 cod3 C to T MH 3 8 13 24 4 1 19 ME 8 16 20 44 12 3 29 HE 4 14 18 36 5 5 26 T to C MH 4 12 33 49 4 5 40 ME 5 5 10 20 5 3 12 HE 11 10 18 39 5 12 22 A to G MH 15 7 4 26 8 1 17 ME 13 9 5 27 9 18 HE 7 4 3 14 4 1 9 G to A MH 2 2 4 4 ME 1 3 4 4 HE 5 2 2 9 6 2 1 C to A MH 2 3 3 8 2 1 5 ME 3 3 5 11 2 9 HE 5 8 12 25 7 18 T to A MH 2 4 6 1 5 ME 1 2 3 3 HE 2 2 2 6 3 1 2 A to C MH 9 13 10 32 7 1 24 ME 12 16 24 52 13 39 HE 6 10 2 18 3 2 13 A to T MH 2 5 9 16 3 1 12 ME 14 12 11 37 4 4 29 HE 3 3 3 G to T MH ME 1 1 2 2 HE 2 2 G to C MH 1 1 1 ME HE T to G MH ME 1 1 1 HE C to G MH ME HE
Stellenbosch University http://scholar.sun.ac.za
49
number of pairwise changes (i.e., M+H, H+E, M+E) of each substitution class and base
composition is evident. An example of the latter concerns the number of A substitutions (A
to N, N to A) scored for manatee pairwise associations (M+H, M+E) and the proportion of
A in manatee mtDNA (fig.2.2). All changes scored for A to N are the largest for M+H and
M+E, while the reverse is true for N to A with H+E showing a greater number of changes
in this direction. The manatee has the lowest percentage of A relative to all other nine taxa
in the mtDNAcod data set as well as to the majority of other documented eutherian
mitochondrial genomes (OGRe database, sirenian representative Dugon dugon, Jameson,
Gibson et al., 2003). This indicates a strong bias against A which agrees with the reduced
number of manatee N to A pairwise changes and the increased number of A to N changes,
resulting in a reduced percentage of A in mtDNA overall for this species. Furthermore, the
relatively higher proportion of A present in the hyrax suggests a bias in favour of A which
may also contribute to the opposite trend of hyrax pairwise comparisons to the manatee for
this nucleotide. The correspondence of pairwise shared substitutions to base composition
also applies to the higher proportion of G in the manatee, the lower percentage of T in the
hyrax and a higher proportion of T in the elephant. When plotting the proportion of
changes scored in each taxon against base composition (figure 2.5, table 2.9), there is a
significant correlation for the proportion of A changes (both directions) and the proportion
of T changes (T to N) but not for C. This is not unexpected given that the only two
available comparisons involving C are with T and A and since these have opposite affects
on H and M, they produce a counter effect in the regression canceling out the correlation.
The distinct pattern of pairwise shared sites shown here is likely due to the particularly
strong base compositional biases present within Paenungulata and the way these differ
with respect to each other. Base composition varies considerably between paenungulates
with at least one taxon at the limit of the range of values in this data set. This pattern
extends to a broader comparison with 128 placental mammals in the OGRe mtDNA
database (Jameson, Gibson et al., 2003). Specifically, the hyrax lies within the lowest 4%
and the elephant within the top 25% for T, the manatee has the lowest percentage of A
overall while the hyrax is within the top 25% for this nucleotide, and the manatee is
within the top 4% for G.
Stellenbosch University http://scholar.sun.ac.za

50
Figure 2.5 The proportion of changes scored in each taxa correlate with the base composition of A and T (T to N). Although a similar trend is seen for C substitutions and N to T substitutions, these were not found to be significant (table 2.9). Due to the lower numberof G substitutions, these could not be assessed (see table 2.8) except for A-G changes included with A above.
0
0.05
0.1
0.15
0.2
0.25
0.3
0.35
0.4
0.45
0.5
0.27 0.28 0.29 0.3 0.31 0.32 0.33 0.34
Frequency of A
Prop
ortio
n of
sco
red
chan
ges
A to NN to A
0
0.05
0.1
0.15
0.2
0.25
0.3
0.35
0.4
0.45
0.5
0.25 0.26 0.27 0.28 0.29 0.3 0.31
Frequency of T
Pro
porti
on o
f sco
red
chan
ges
T to NN to T
0
0.05
0.1
0.15
0.2
0.25
0.3
0.35
0.4
0.45
0.25 0.26 0.27 0.28 0.29 0.3 0.31
Frequency of C
Prop
ortio
n of
sco
red
chan
ges
C to NN to C
Stellenbosch University http://scholar.sun.ac.za

51
Table 2.9 Regression line formulas, correlation coefficients, and P values of lines plotted in figure 2.5.
Substitution class Regression line R2 P A to N y = -3.0714x + 1.2977 0.5740 0.018* N to A y = 2.1905x - 0.3435 0.6538 0.008* T to N y = -3x + 1.1733 0.8606 0.017* N to T y = 3.625x - 0.68 0.4110 0.008* C to N y = -2.375x + 1.0175 0.4640 0.136 N to C y = -2.375x + 1.0175 0.1265 0.490
* P < 0.05
Stellenbosch University http://scholar.sun.ac.za
52
Furthermore, the majority of the differences among paenungulates involve a divergent
bias between two taxa (e.g., manatee versus hyrax for A, hyrax versus elephant for T)
leading to different substitution patterns. As a result, since Paenungulata only comprises
three taxa, the third taxon (with intermediate base composition) will show a similar
pattern to either one of the other two “by default” since it shares a more similar base
composition to both of them than they do with each other.
The pattern of shared substitutions shown here (e.g., A to N for M+E) likely accounts for
the inflated ti/tv ratio seen in M+E in comparison to other estimates. The ti/tv estimate for
M+E is due to both an elevated number of transitions and a reduced number of
transversions in comparison to other taxa (appendix 1 and 2) which can be accounted for by
the higher number of shared transversions (A to N) and lower proportion of shared
transitions (T to C, G to A) demonstrated for M+E (table 2.8, appendix 1 and 2).
2.3.1.4 ILD tests
Significant partition heterogeneity as a potentially confounding factor in combining
individual partitions was assessed by applying the incongruence length difference test
(appendix 4). Tests between mitochondrial partitions were significant between 12S rRNA
and ND4L (P = 0.036) and 12S rRNA and ATP6 (P = 0.032). Four groups can be
identified: i) those which show two or less significant results when compared to other
partitions (ND1, ND2, ND4, CO1, CYTB, CNR1, IRBP, RAG2, PNOC), ii) those that
show relatively more conflict with mtDNA partitions than nuclear (ADRB2, A2AB,
BRCA1, APOB, STAT5A, THY), iii) those which show most conflict with nuclear
partitions (ND3, ND4L, ND5, CO2, CO3, ATP6, ATP8, 12S rRNA, 16S rRNA, tRNA
APP, BDNF, CREM, PLCB4, TYR) and iv) those which show approximately even
numbers of significant results between mtDNA and nDNA (ATP7, BMI1, EDG1, RAG1,
MGF, PRKCI).
In considering significant heterogeneity between two particular partitions, the approach
typically taken is to compare topologies and determine if conflict of well supported nodes
between the topologies exists. Direct comparisons of topological variation between
Stellenbosch University http://scholar.sun.ac.za
53
partitions in this study was most often not possible due to the poor resolution of trees
generated using a parsimony approach (table 2.10; see section II below for more detail).
However, even when comparisons where made between topologies that were considered
homogenous according to the ILD test, lack of resolution and/or conflicting nodes were
evident. For example, BRCA1 pairwise comparisons to mtDNA segments returned
significant P-values for all but three partitions, ND2, 12S rRNA and 16S rRNA.
Comparing the BRCA1 topology to these three mtDNA partitions revealed no nodes in
common between BRCA1 and 16SrRNA, only three out of nine shared nodes with 12S
rRNA and five out of nine nodes in common with ND2. Consequently, the link between
the extent of topological variation in pairwise comparisons and a significant result for the
ILD test is tenuous in this study. Two factors may account for this variability. Firstly, the
limiting effect of topological differences between partitions may impact on the capacity
of the ILD test to detect incongruence (Darlu and Lecointre, 2002) and secondly, in cases
where the added data generate few nodes with statistical support, it has been suggested
that there is unlikely to be significant alteration of nodes previously supported in the
original data set (Matthee, van Vuuren et al., 2004).
The use of the ILD test for the purpose of assessing combinability is not without criticism
(Darlu and Lecointre, 2002; Yoder, Irwin et al., 2001; Cunningham, 1997; Huelsenbeck,
Bull et al., 1996; Sullivan, 1996). In addition to the factors mentioned above, under
conditions with increased homoplasy due to differences in substitution rate or where the
number of informative characters is low, the ILD test loses power to detect incongruences
(Darlu and Lecointre, 2002). Numerous studies have found that incongruence between
data partitions should not prevent data set combination (e.g., Yoder, Irwin et al., 2001;
Cunningham, 1997; Sullivan, 1996). Evidence is seen in the form of hidden support from
combined data analysis (see Gatesy and Baker, 2005 and references therein) which likely
explains why using a combined approach in cases of significant data conflict has lead to
increased character support (Gatesy, Amato et al., 2003). Furthermore, the increasing
evidence of hidden support indicates that non-inclusion of data sets in analysis because of
conflict may be excessive, as many suitable characters might be missed (Gatesy, Amato
et al., 2003). Differences in topologies with identical taxa, but generated using different
Stellenbosch University http://scholar.sun.ac.za
54
data partitions, can indicate that partition combination is questionable. However, if the
conflict is due to limitations of the reconstruction method used (Cunningham, 1997), or
other methodologically related factors, this does not preclude a combined approach
(Huelsenbeck, Bull et al., 1996; Sullivan, 1996). Due to the overall poor resolution of the
trees generated by parsimony and differences in topologies between the parsimony and
model approaches for many of the partitions and some combined data sets in this study
(see section 2.3.2), inadequacy of the phylogenetic method is likely a contributing factor
and thus combining partitions is not problematic in these cases. However, when
biological factors cannot be excluded as a potential cause of conflict, for example from
lineage sorting, caution should be exercised. Due to the rapid radiation of Paenungulata
(Waddell, Kishino et al., 2001; Amrine and Springer, 1999) the presence of a short
internal edge is more likely to lead to lineage sorting among different partitions
(McCracken and Sorenson, 2005) and consequently conflict among topologies.
2.3.2 Hierarchical (phylogenetic) analysis
To assess the level of resolution obtained from a particular topology each partition was
considered according to the usefulness of the data in defining two (benchmark) clades,
Afrotheria and Paenungulata. These particular nodes were selected as they are well
supported by molecular data (Nishihara, Satta et al., 2005; e.g., Murphy, Eizirik et al.,
2001b) and encompass evolutionary events at both temporal limits of this supraordinal
clade (Springer, Murphy et al., 2003a). All subsequent phylogenetic results refer to table
2.10 and figure 2.6.
2.3.2.1 Comparison with published data
Due to the considerable differences in taxon sampling between this study and those
previously published, analyses were initially performed using identical sequence data to
confirm that the trees obtained in the present study were similar to those published. The
Murphy, Eizirik et al. (2001b) data set consisting of 19 segments (16 nuclear, three
mitochondrial) was analysed using ML (GTR+G+I, nonparametric bootstrapping) and BI
(GTR+G+I) with the settings specified by the authors. Both analytical approaches agreed
with that of the single published tree both with respect to topology and node support.
Stellenbosch University http://scholar.sun.ac.za
55
Although the Paenungulata node in the Murphy, Eizirik et al. (2001b) ML tree was
constrained, associations among taxa within this group resulted in a polytomy when
analysed here.
Amrine-Madsen, Koepfli et al. (2003) reanalysed the Murphy, Eizirik et al. (2001b) data
set with the addition of a 1.3kb portion of the apolipoprotein B (APOB) gene. Both the
ML (GTR+G+I) and BI (GTR+G+I) approaches were used for analysis on the gene
segment alone and concatenated to the Murphy, Eizirik et al. (2001b) data set. Topologies
obtained in this study were identical to those in Amrine-Madsen, Koepfli et al. (2003)
with the following exceptions. In the APOB ML tree, the aardvark did not join with
Paenungulata (unsupported in Amrine-Madsen, Koepfli et al., 2003) but was unresolved
at the base of Afrotheria. For the ML concatenated tree, Amrine-Madsen, Koepfli et al.
(2003) retrieved M+H (unsupported) whereas Paenungulata remained unresolved in this
study. The BI concatenated tree and that obtained in this study were identical in topology
and node support.
With regards to the mitochondrial DNA data set, two previous works (Murata, Nikaido et
al., 2003; Nikaido, Cao et al., 2003) have been published that include all members of
Paenungulata for the 12 heavy-strand protein sequences. These were analysed using
amino acid data and consequently cannot be compared to the mtDNA analysis in this
study as the analytical approach differs considerably. However, with regards to
associations within Paenungulata, M+E is favoured here and with the previously
published result.
2.3.2.2 Taxon sampling
One of the most contentious debates in phylogenetic analysis is the question of the
importance of taxon sampling versus increasing data size for efficient construction
(Pollock, Zwickl et al., 2002; Hillis, 1998). By today’s standards, the 11 taxa analysed
here may be considered small (Sullivan, Swofford et al., 1999) and of concern. However,
Stellenbosch University http://scholar.sun.ac.za

56
Anteater
Sloth
Aardvark
Elephant shrew
Tenrec
Golden mole
Manatee
Hyrax
Elephant
Cetartiodactyl
Caniform
Xenarthra
Afrotheria
Paenungulata
Laurasiatheria
Figure 2.6 Bayesian inference tree obtained from the concatenated data set, all nodes have a posterior probability of 1. Paenungulate node represented as a polytomy due to mixed results with different BI analyses.
Stellenbosch University http://scholar.sun.ac.za
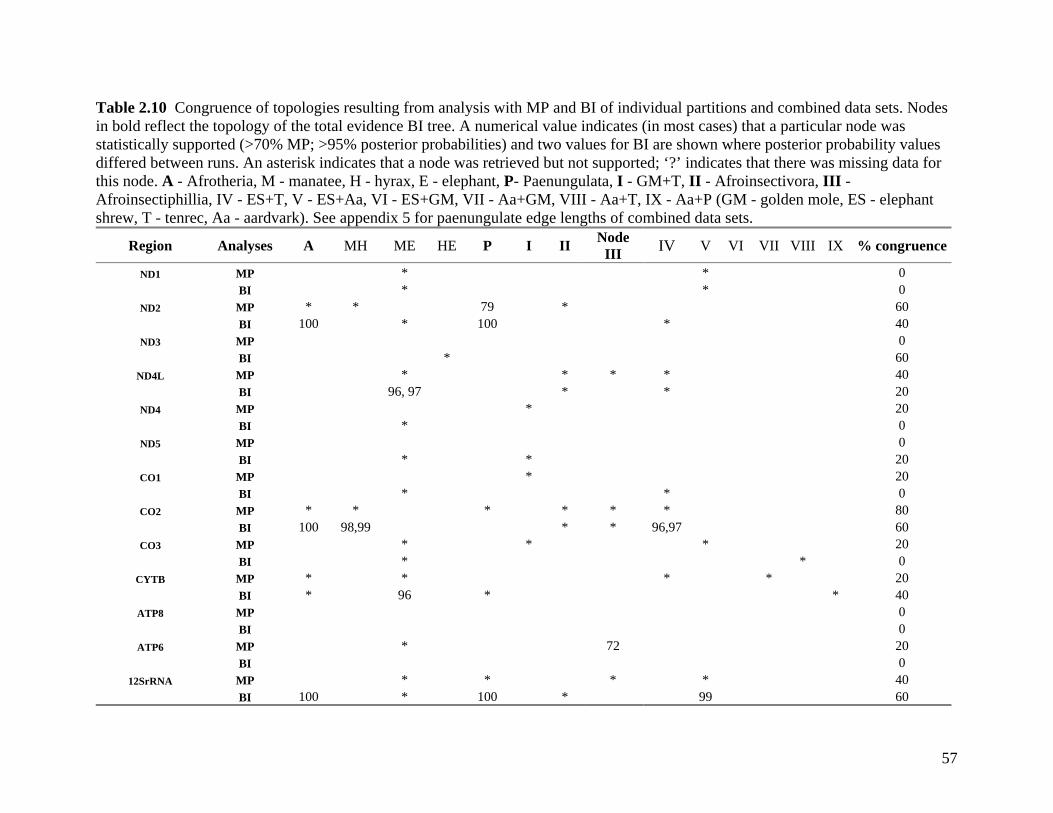
57
Table 2.10 Congruence of topologies resulting from analysis with MP and BI of individual partitions and combined data sets. Nodes in bold reflect the topology of the total evidence BI tree. A numerical value indicates (in most cases) that a particular node was statistically supported (>70% MP; >95% posterior probabilities) and two values for BI are shown where posterior probability values differed between runs. An asterisk indicates that a node was retrieved but not supported; ‘?’ indicates that there was missing data for this node. A - Afrotheria, M - manatee, H - hyrax, E - elephant, P- Paenungulata, I - GM+T, II - Afroinsectivora, III - Afroinsectiphillia, IV - ES+T, V - ES+Aa, VI - ES+GM, VII - Aa+GM, VIII - Aa+T, IX - Aa+P (GM - golden mole, ES - elephant shrew, T - tenrec, Aa - aardvark). See appendix 5 for paenungulate edge lengths of combined data sets.
Region Analyses A MH ME HE P I II Node III IV V VI VII VIII IX % congruence
ND1 MP * * 0 BI * * 0
ND2 MP * * 79 * 60 BI 100 * 100 * 40
ND3 MP 0 BI * 60
ND4L MP * * * * 40 BI 96, 97 * * 20
ND4 MP * 20 BI * 0
ND5 MP 0 BI * * 20
CO1 MP * 20 BI * * 0
CO2 MP * * * * * * 80 BI 100 98,99 * * 96,97 60
CO3 MP * * * 20 BI * * 0
CYTB MP * * * * 20 BI * 96 * * 40
ATP8 MP 0 BI 0
ATP6 MP * 72 20 BI 0
12SrRNA MP * * * * 40 BI 100 * 100 * 99 60
Stellenbosch University http://scholar.sun.ac.za
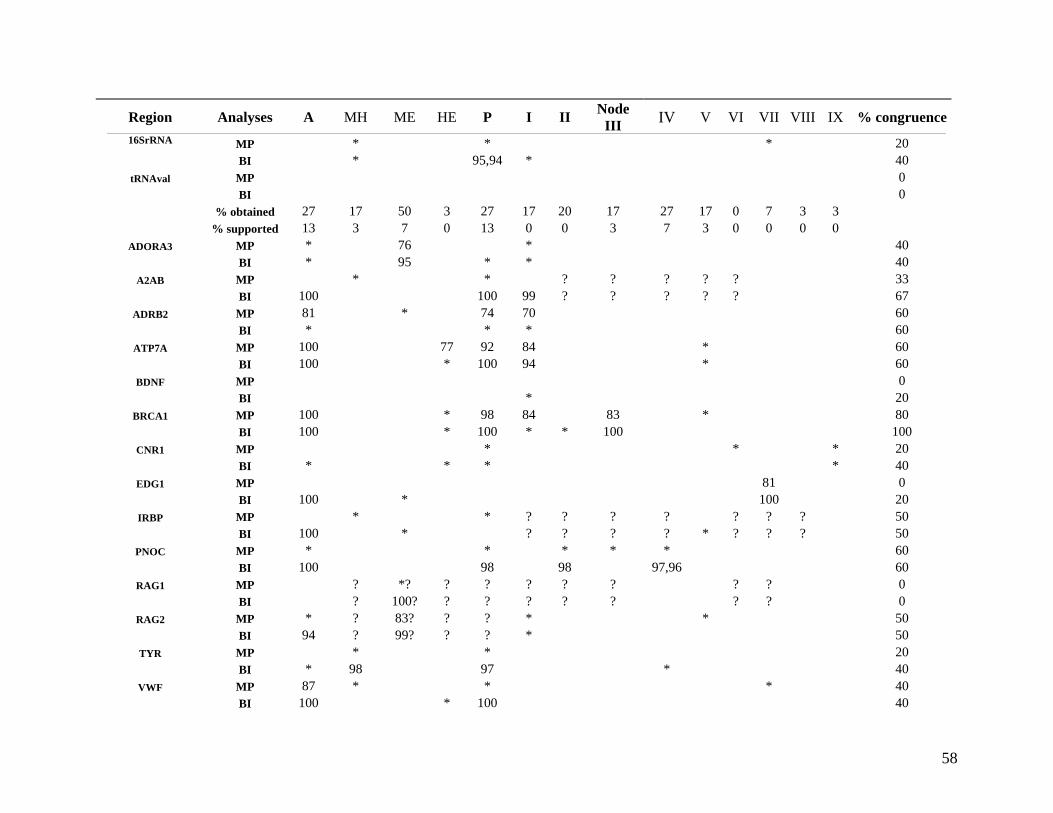
58
Region Analyses A MH ME HE P I II Node III IV V VI VII VIII IX % congruence
16SrRNA MP * * * 20 BI * 95,94 * 40
tRNAval MP 0 BI 0 % obtained 27 17 50 3 27 17 20 17 27 17 0 7 3 3 % supported 13 3 7 0 13 0 0 3 7 3 0 0 0 0
ADORA3 MP * 76 * 40 BI * 95 * * 40
A2AB MP * * ? ? ? ? ? 33 BI 100 100 99 ? ? ? ? ? 67
ADRB2 MP 81 * 74 70 60 BI * * * 60
ATP7A MP 100 77 92 84 * 60 BI 100 * 100 94 * 60
BDNF MP 0 BI * 20
BRCA1 MP 100 * 98 84 83 * 80 BI 100 * 100 * * 100 100
CNR1 MP * * * 20 BI * * * * 40
EDG1 MP 81 0 BI 100 * 100 20
IRBP MP * * ? ? ? ? ? ? ? 50 BI 100 * ? ? ? ? * ? ? ? 50
PNOC MP * * * * * 60 BI 100 98 98 97,96 60
RAG1 MP ? *? ? ? ? ? ? ? ? 0 BI ? 100? ? ? ? ? ? ? ? 0
RAG2 MP * ? 83? ? ? * * 50 BI 94 ? 99? ? ? * 50
TYR MP * * 20 BI * 98 97 * 40
VWF MP 87 * * * 40 BI 100 * 100 40
Stellenbosch University http://scholar.sun.ac.za
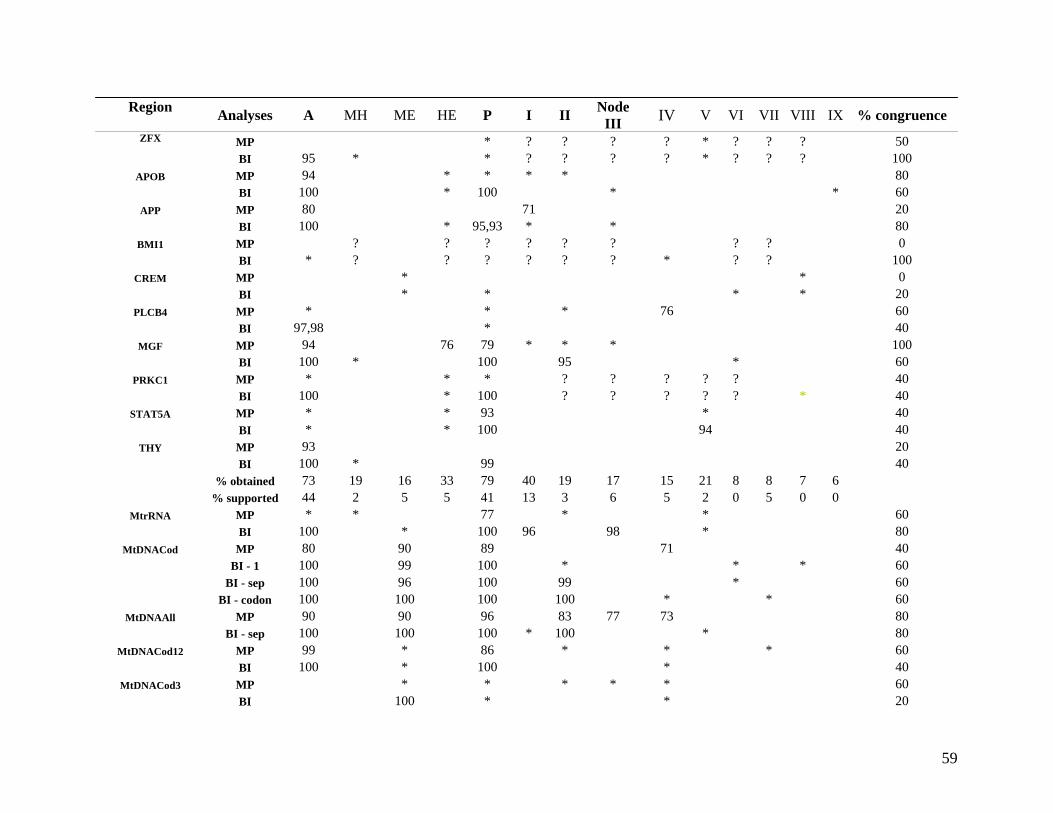
59
Region Analyses A MH ME HE P I II Node III IV V VI VII VIII IX % congruence
ZFX MP * ? ? ? ? * ? ? ? 50 BI 95 * * ? ? ? ? * ? ? ? 100
APOB MP 94 * * * * 80 BI 100 * 100 * * 60
APP MP 80 71 20 BI 100 * 95,93 * * 80
BMI1 MP ? ? ? ? ? ? ? ? 0 BI * ? ? ? ? ? ? * ? ? 100
CREM MP * * 0 BI * * * * 20
PLCB4 MP * * * 76 60 BI 97,98 * 40
MGF MP 94 76 79 * * * 100 BI 100 * 100 95 * 60
PRKC1 MP * * * ? ? ? ? ? 40 BI 100 * 100 ? ? ? ? ? * 40
STAT5A MP * * 93 * 40 BI * * 100 94 40
THY MP 93 20 BI 100 * 99 40 % obtained 73 19 16 33 79 40 19 17 15 21 8 8 7 6 % supported 44 2 5 5 41 13 3 6 5 2 0 5 0 0
MtrRNA MP * * 77 * * 60 BI 100 * 100 96 98 * 80
MtDNACod MP 80 90 89 71 40 BI - 1 100 99 100 * * * 60 BI - sep 100 96 100 99 * 60 BI - codon 100 100 100 100 * * 60
MtDNAAll MP 90 90 96 83 77 73 80 BI - sep 100 100 100 * 100 * 80
MtDNACod12 MP 99 * 86 * * * 60 BI 100 * 100 * 40
MtDNACod3 MP * * * * * 60 BI 100 * * 20
Stellenbosch University http://scholar.sun.ac.za
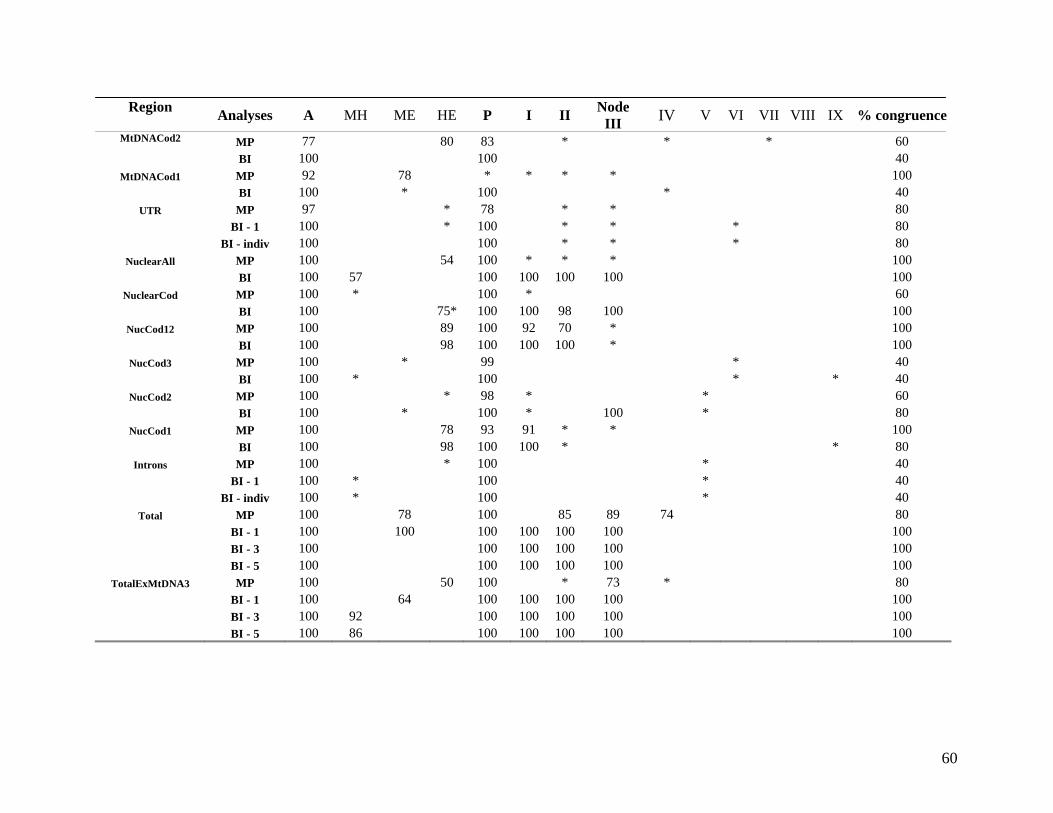
60
Region Analyses A MH ME HE P I II Node III IV V VI VII VIII IX % congruence
MtDNACod2 MP 77 80 83 * * * 60 BI 100 100 40
MtDNACod1 MP 92 78 * * * * 100 BI 100 * 100 * 40
UTR MP 97 * 78 * * 80 BI - 1 100 * 100 * * * 80 BI - indiv 100 100 * * * 80
NuclearAll MP 100 54 100 * * * 100 BI 100 57 100 100 100 100 100
NuclearCod MP 100 * 100 * 60 BI 100 75* 100 100 98 100 100
NucCod12 MP 100 89 100 92 70 * 100 BI 100 98 100 100 100 * 100
NucCod3 MP 100 * 99 * 40 BI 100 * 100 * * 40
NucCod2 MP 100 * 98 * * 60 BI 100 * 100 * 100 * 80
NucCod1 MP 100 78 93 91 * * 100 BI 100 98 100 100 * * 80
Introns MP 100 * 100 * 40 BI - 1 100 * 100 * 40 BI - indiv 100 * 100 * 40
Total MP 100 78 100 85 89 74 80 BI - 1 100 100 100 100 100 100 100 BI - 3 100 100 100 100 100 100 BI - 5 100 100 100 100 100 100
TotalExMtDNA3 MP 100 50 100 * 73 * 80 BI - 1 100 64 100 100 100 100 100 BI - 3 100 92 100 100 100 100 100 BI - 5 100 86 100 100 100 100 100
Stellenbosch University http://scholar.sun.ac.za

61
the results obtained from analysing previous data sets (see previous section, Amrine-
Madsen, Koepfli et al., 2003; Murphy, Eizirik et al., 2001b) with the reduced number of
taxa as used in this study, display good concordance. All topologies and levels of support
were found to be identical for the combined partitions (16397-17492bp) as well the
comparison with APOB alone (1095bp) when using BI, while minor differences were
obtained when using ML. Despite this, the ingroup used in this study comprises all extant
afrotherian taxa which precludes attempts at increasing the number of taxa at the ordinal
level.
2.3.2.3 Individual partitions/separate analysis
This level represents the lowest or foundation level of the hierarchical analysis with the
smallest partition sizes overall. Parsimony resolution across all individual partitions,
based on nodes with bootstrap support, is limited to a single mtDNA partition (ND2), and
ten nDNA regions (ADRB2, ATP7A, BRCA1, VWF, APOB, APP, MGF, PRKCI,
STAT5A, THY) producing trees with either one or both of the benchmark clades
supported. It is noteworthy that when adopting a less conservative standpoint in which
unsupported topologies are considered, five mtDNA and 20 nDNA partitions retrieve
Afrotheria and/or Paenungulata. Only three nDNA partitions showed support for
associations within Paenungulata. However, when considering topologies alone, six
nDNA partitions favour H+E, three M+E and four M+H and within mtDNA six partitions
yield M+E, and three M+H.
When a model approach to phylogenetic reconstruction of the individual partitions was
applied (BI), the extent of topological resolution and node support improved to varying
degrees. However, two partitions (ATP6, ADRB2) showed reduced support while five
regions (CO3, ATP8, tRNAval, ND1, ND4) remained unchanged. In agreement with the
MP result, most mtDNA partitions favour M+E over M+H and H+E using BI, however,
only two of these partitions show a well supported M+E node and neither of these
topologies support either Afrotheria or Paenungulata. H+E continues to be favoured over
M+E and M+H with nDNA, however, BI does not yield any significant posterior
Stellenbosch University http://scholar.sun.ac.za
62
probabilities for this association. Although RAG1 and RAG2 support M+E, they are not
considered as the hyrax is missing from both these data sets.
Although the focus of this study concerns Paenungulata, a brief description of the results
for the remaining afrotherians is included. The limited level of resolution seen for the
previously discussed nodes extends to those within Afroinsectiphillia. Individual
partitions retrieve a variety of associations however these also differ between
mitochondrial and nuclear genomes. With both a MP and BI approach, nuclear partitions
retrieve golden mole + tenrec (GM+T), Afroinsectivora and Afroinsectiphillia and
consequently are more congruent with the total combined topology than are mtDNA
partitions, which in contrast to nDNA regions, favour an elephant shrew + tenrec (ES+T)
association.
In all but four of the topologies, the next most parsimonious tree was found to be one step
away from the shortest tree. Numbers of mtDNA MP trees varied from 1-4 excluding
tRNAval which produced 2862 trees, a result likely due to the very short sequence for
this particular partition. Nuclear DNA partitions that did not have the full complement of
taxa yielded greater numbers of MP trees than partitions with all eleven taxa. When
excluding those partitions with missing taxa, the number of MP trees from nuclear
partitions varied from 1-7, which is marginally larger than for mtDNA. The CI/RI
estimates are lowest in mtDNA protein coding genes (CI: 0.44-0.57, RI: 0.24-0.50),
intermediate in nuclear coding regions (CI: 0.54-0.67; RI: 0.37-0.62), and highest in
introns (CI: 0.62-0.68, RI: 0.45-0.57) and UTRs (CI: 0.58-0.73, RI: 0.45- 0.70). In
comparison to other mtDNA regions the ribosomal RNA segments tended toward the
higher range of values (CI: 0.50-0.56, RI: 0.30-0.50).
Although few individual topologies had well supported nodes, it is clear that at the level
of individual partitions there was no overall convincing support favouring a majority
consensus of any one of the three possible associations within Paenungulata. This is also
evident following assessment of the two possible alternative paenungulate topologies
using the Kishino/Hasegawa (KH) test for individual partitions. The best tree was not
Stellenbosch University http://scholar.sun.ac.za
63
found to be significantly different to both of the alternative trees and only significantly
different to one of the two alternatives in four partitions (ND1, CO2, 12S rRNA, TYR).
In analyses of mtDNA and nDNA sequences, M+E and H+E were found to predominate
respectively, suggesting consensus among mtDNA partitions and to a lesser degree,
among nDNA regions. However, considering the rapid radiation of Paenungulata
(Amrine and Springer, 1999) it is likely that lineage sorting is a factor. Where the internal
edge is very short and under certain conditions i.e., the effective population size (Ne) is
large, and sufficient time has passed for lineage sorting to have completed, it is expected
that about 33% of gene trees from independent, polymorphic loci will support each of the
three possible clades (McCracken and Sorenson, 2005; Waddell, Kishino et al., 2001;
Hudson, 1983). Although support for M+E, H+E and M+H was not proportionate among
nDNA partitions, and tended to favour H+E, the support for H+E was not substantial and
consequently an affect from sampling bias cannot be disregarded. Based on consensus
from individual partitions, support for H+E is not convincing. Since mtDNA is inherited
as a single linkage group, it is not unexpected that the majority of the individual partitions
share a similar result.
Resolution of Afrotheria and Paenungulata differed among individual partitions
demonstrating variation in phylogenetic utility and consequently signal content among
partitions. Both of these clades were supported to a greater degree by nuclear partitions
and by extending the same comparison to codon position, it is apparent that the higher
substitution rates in third codon positions of mtDNA coding regions have had a negative
effect on the ability of individual coding partitions to resolve deeper nodes, with an
unsupported topology for a single benchmark clade (Paenungulata) evident.
2.3.2.4 Intron data
The benchmark clades, Afrotheria and Paenungulata were retrieved with significant
support across all four introns with five exceptions (tables 2.10. and 2.11). Three of these
exceptions concern MP (PK and STAT), and one each ML (THY) and BI (STAT).
Intrapaenungulate relationships in contrast were poorly resolved with only one node
(MGF with MP) producing significant support for H+E. However, agreement among
Stellenbosch University http://scholar.sun.ac.za
64
model-based approaches for a particular association within an intron was noted for MGF
(M+H), PK (H+E) and THY (M+H) while MP favoured H+E which is also evident in the
combined intron analysis. Relationships within Afroinsectiphillia were not well resolved
with a single significantly supported node (ES+A) obtained with STAT5A. The overall
poor level of resolution for all nodes except Afrotheria and Paenungulata, also extended
to the combined intron analyses. In the combined analyses, a manatee-hyrax association
is favoured by the different model-based approaches while H+E is obtained with MP. It is
noteworthy that M+E was not retrieved in any individual intron or combined analysis.
The lack of resolution among paenungulates with this data set indicates that, despite the
anticipated increased propensity for resolving short edge lengths, there is insufficient
phylogenetic signal at the level of this analysis. Examination of indel events among the
eleven taxa included (table 2.6), revealed a synapomorphic deletion specific to Xenarthra
(synapomorphy implied) as well as an insertion that was informative for Paenungulata.
2.3.2.5 Combined partitions and subpartitions
Individual partitions were combined according to genome (mtDNAAll, nuclearAll),
mtDNA or nuclear protein-coding loci (mtDNAcod, nuccod), non-coding regions (UTRs,
introns, mtrRNA) and within protein-coding fragments, codon position (mtDNAcod1,
mtDNAcod2, mtDNAcod3, mtDNAcod12, nuccod1, nuccod2, nuccod3, nuccod12). The
combination of individual partitions yielded improved resolution of topologies and
increased support for the benchmark clades with trends differentiating topologies derived
from individual mitochondrial and nuclear loci carried through to the combined analysis.
The mtDNA combined data sets show convincing support for M+E within paenungulates
and favour ES+T within Afroinsectiphillia more often in comparison to GM+T.
Deviation from an M+E association is found with both mtDNAcod2 and with the
mtrRNA data set. It is worth noting that although mtDNAcod3 shows support for M+E, it
is the only node, using either a MP or BI approach, that this data set can resolve. This is
further apparent from Partitioned Bremmer Support analyses of the MP data (table 2.12)
which indicate that most support (5<PBS>10) is from CYTB, CO3, ND1, ND4 and ND5
but in particular that this is largely limited to faster evolving sites, as support for this
association is dominated by third (PBS = 27) and first (PBS=8) codon positions.
Stellenbosch University http://scholar.sun.ac.za
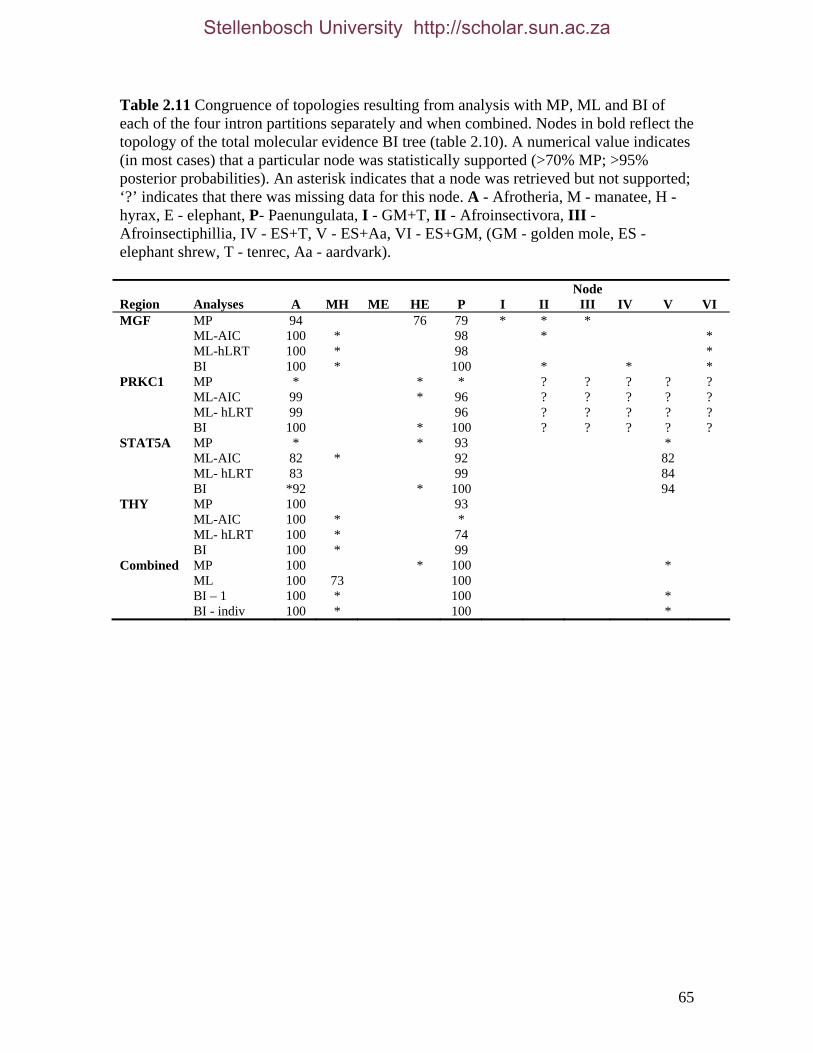
65
Table 2.11 Congruence of topologies resulting from analysis with MP, ML and BI of each of the four intron partitions separately and when combined. Nodes in bold reflect the topology of the total molecular evidence BI tree (table 2.10). A numerical value indicates (in most cases) that a particular node was statistically supported (>70% MP; >95% posterior probabilities). An asterisk indicates that a node was retrieved but not supported; ‘?’ indicates that there was missing data for this node. A - Afrotheria, M - manatee, H - hyrax, E - elephant, P- Paenungulata, I - GM+T, II - Afroinsectivora, III - Afroinsectiphillia, IV - ES+T, V - ES+Aa, VI - ES+GM, (GM - golden mole, ES - elephant shrew, T - tenrec, Aa - aardvark). Region
Analyses A MH ME HE P I II
Node III IV V VI
MGF MP 94 76 79 * * * ML-AIC 100 * 98 * * ML-hLRT 100 * 98 * BI 100 * 100 * * * PRKC1 MP * * * ? ? ? ? ? ML-AIC 99 * 96 ? ? ? ? ? ML- hLRT 99 96 ? ? ? ? ? BI 100 * 100 ? ? ? ? ? STAT5A MP * * 93 * ML-AIC 82 * 92 82 ML- hLRT 83 99 84 BI *92 * 100 94 THY MP 100 93 ML-AIC 100 * * ML- hLRT 100 * 74 BI 100 * 99 Combined MP 100 * 100 * ML 100 73 100 BI – 1 100 * 100 * BI - indiv 100 * 100 *
Stellenbosch University http://scholar.sun.ac.za
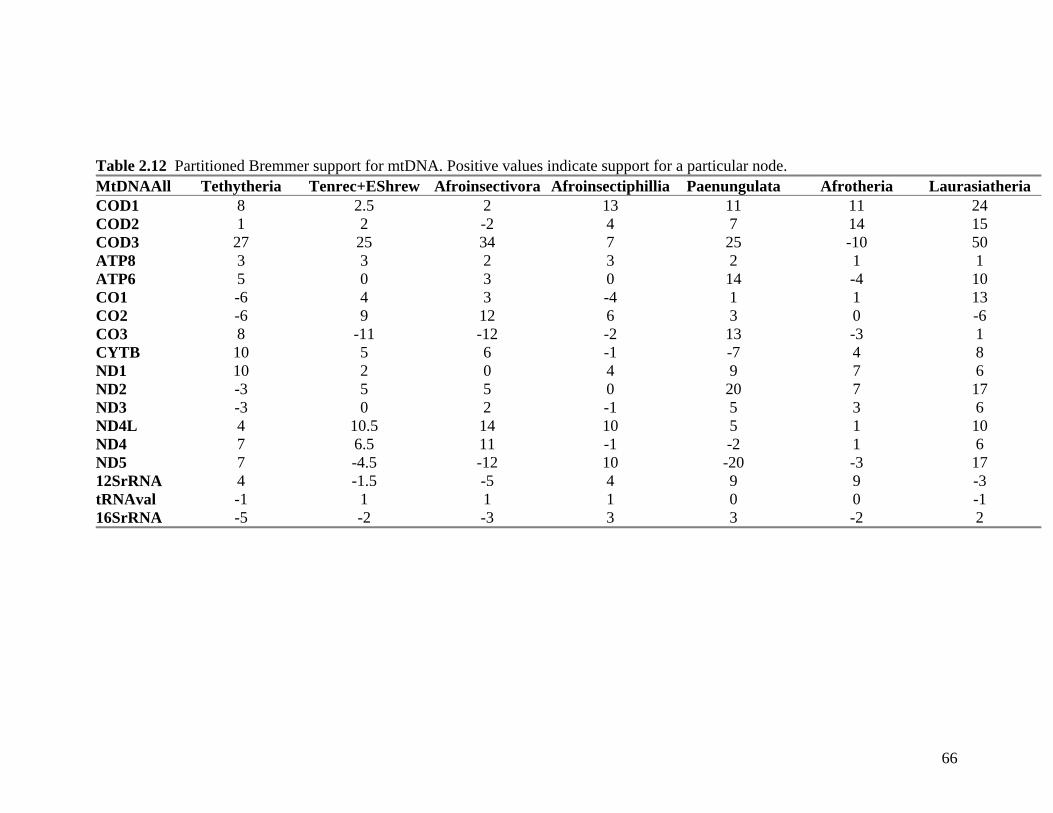
66
Table 2.12 Partitioned Bremmer support for mtDNA. Positive values indicate support for a particular node. MtDNAAll Tethytheria Tenrec+EShrew Afroinsectivora Afroinsectiphillia Paenungulata Afrotheria Laurasiatheria COD1 8 2.5 2 13 11 11 24 COD2 1 2 -2 4 7 14 15 COD3 27 25 34 7 25 -10 50 ATP8 3 3 2 3 2 1 1 ATP6 5 0 3 0 14 -4 10 CO1 -6 4 3 -4 1 1 13 CO2 -6 9 12 6 3 0 -6 CO3 8 -11 -12 -2 13 -3 1 CYTB 10 5 6 -1 -7 4 8 ND1 10 2 0 4 9 7 6 ND2 -3 5 5 0 20 7 17 ND3 -3 0 2 -1 5 3 6 ND4L 4 10.5 14 10 5 1 10 ND4 7 6.5 11 -1 -2 1 6 ND5 7 -4.5 -12 10 -20 -3 17 12SrRNA 4 -1.5 -5 4 9 9 -3 tRNAval -1 1 1 1 0 0 -1 16SrRNA -5 -2 -3 3 3 -2 2
Stellenbosch University http://scholar.sun.ac.za
67
In contrast to mtDNA, combined nDNA data sets did not provide support in favour of a
particular relationship within Paenungulata overall. However, assessment at the level of
codon position provided convincing support for H+E. This association (H+E) was present
(either supported or unsupported) in all nDNA combined partitions with BI and/or MP,
except nuccod3. KH tests of the concatenated data sets found that H+E and M+E were
significantly different in mtDNAcod (P = 0.016), mtDNAcod3 (P = 0.009), nuccod12 (P
= 0.023) and nuccod1 (P = 0.004). Further, M+E and M+H differed significantly at the
95% level in mtDNAcod1 and mtDNAcod2. Well supported nodes for relationships
within Afroinsectiphillia appear to be limited to the larger combined data sets
(mtDNAAll, mtDNAcod, nucAll and nuccod), with limited resolution obtained with
partitions less than 5Kb in size.
A further increase in data set length by combining all partitions (total) led to improved
resolution in several parts of the tree; however, within Paenungulata stability remained
problematic. An MP analysis favoured the mtDNA associations of M+E and ES+T but
this did not apply to BI. In the latter, three different approaches to partition specification
were applied. Initially all data was analyzed as a single partition. This was subsequently
subdivided into three subsets: all nuclear DNA partitions combined (nuclearAll),
mtDNAcod and mtrRNA and subsequently into five partitions: nuccod, UTRs, introns,
mtDNAcod and mtrRNA. Dividing the total combined data set into 39 individual
partitions is not possible with the (then) current version of MrBayes due to the specified
limit of 30 partitions (see Material and Methods). All three methods produced identical
topologies apart from relationships within Paenungulata which contrasted considerably
between the single data set and the three and five subset analyses. The former maintained
an M+E association as was obtained for the MP analysis, while the two latter approaches
yielded polytomies.
An additional analysis was performed on the total data set excluding mtDNAcod3 with
MP and the three BI approaches to partitioning the data set as implemented for the total
combined data set (above). Topologies were similar in all respects except for associations
within Paenungulata. The MP topology and BI one partition topology favoured H+E and
Stellenbosch University http://scholar.sun.ac.za

68
M+E respectively. Both the BI three and five partition data sets retrieved an M+H
association within Paenungulata. In all cases documented above none of the nodes within
Paenungulata were supported.
Using a combined approach a gradual improvement in the resolution of certain nodes was
evidenced by the present study. In the case of nuclear DNA, a trend of increasing support
for nodes was seen starting with Afrotheria and Paenungulata followed by relationships
within Afroinsectiphillia as the different data sets were merged. Although relationships
within Paenungulata were well supported in some combined data sets, the actual
phylogenetic associations differed between partitions of similar size (e.g., nuccod and
mtDNAcod comparisons) and continued to vary as data sets merged. This was also
apparent with GM+T/ES+T but showed less variation than associations within
Paenungulata when considering analysis of the total data set. A similar improvement with
increasing data set size and support for the two benchmark clades was also seen when
using mtDNA sequences. Comparisons between mtDNAcod and mtrRNA showed
limited overlap of relationships within Paenungulata and Afroinsectiphillia but within
mtDNAcod, M+E was retrieved most often with the larger data sets. Across different
nuclear combined data sets, H+E was the predominant association that received support
but this association was not seen with the total and totalExmtDNA3 data sets. The
paenungulate node showed much variability at this level with the different analytical
approaches. Although different combined data sets did provide good support for
particular nodes, increasing the amount of sequence data to form the total data set did not
result in convincingly resolved relationships within Paenungulata, providing evidence
against a paenungulate soft polytomy. Alternatively, the presence of different signals in
each genome indicates that the lack of resolution of Paenungulata may be due to
incongruence/conflict among mtDNA and nDNA partitions.
2.3.3 Hyrax and Elephant
The hierarchical analysis of the first codon positions of nDNA (nuccod1) identified a
well supported H+E node. Notably, this node received the most support in any nDNA
combined partition for a paenungulate association using both BI and MP. The retrieval of
Stellenbosch University http://scholar.sun.ac.za
69
a highly supported H+E by nuccod1 and to a lesser degree nuccod2, as well as with
several individual nDNA partitions, strongly suggests an H+E association within
Paenungulata may be a biological reality. This result echoes a previous amino acid level
analysis of a similar nDNA data set which also retrieved a supported H+E (Waddell,
Kishino et al., 2001).
The topologies generated by both MP and BI analysis of the three nuclear codon
partitions indicate that nuccod1 (which also shows good concordance with the total
molecular evidence topology) shows a greater number of well supported nodes in
comparison to nuccod2 or 3. By combining first and second codon positions (nuccod12),
a further increase in support is obtained. However, BI analysis of a partition comprising
all three coding sites results in an increase in support for all nodes except H+E. It is
noteworthy that a previous study with considerably greater taxon sampling was also
unable to provide support for H+E when analysing nuclear protein-coding fragments
(supplementary information, Murphy, Eizirik et al., 2001b). Using an MP approach to
analyse all three codon positions combined, a more dramatic change is seen producing a
topology supporting only Afrotheria and Paenungulata. Substitution rates at nuccod1 are
intermediate to the other two codon positions and thus substitutions at these positions
may be more likely to resolve short internal edges and less likely to suffer from multiple
hits in comparison to nuccod2 and 3, respectively. Whether rates in general at the first
codon position are in fact appropriate for resolving the paenungulate node is unknown,
but the combination of a well resolved topology across different analytical methods and
which shows good concordance with the total evidence tree suggests that an H+E sister
relationship merits consideration.
If this topology is considered as representative of the true tree then the improved
resolution at this functional level indicates that homoplasy is proportionately lower at
nuccod1 (and nuccod2) sites and misleading characters from other sites are obscuring the
signal. This is indicated by the analysis of the nuclearAll data set using PBS (table 2.13)
where the majority of support (5<PBS>10) is derived from three partitions: APP, ATP7A
and BRCA1. However, APP is non-coding and was not included with the analysis of
Stellenbosch University http://scholar.sun.ac.za

70
nDNA protein coding sequences. The greatest support for H+E from nDNA is derived
from nuccod1 (PBS = 10; nuccod2 PBS = 7) which suggests that this data set (comprising
16 partitions) contains hidden support for H+E. The negative value from nuccod3 further
indicates that this partition negatively affects the retrieval of this node.
In phylogenetic analysis the justification for a particular hypothesis is largely based on
statistical support and node stability across different partitions; however, it is difficult to
judge the plausibility of H+E using these criteria since by definition, a soft node would
not be expected to have strong support. Despite the large number of individual DNA
segments included, there is the possibility that overall greater support for H+E is due to
sampling error. However, support for H+E is also apparent from other sources including
protein signatures which are amino acid replacements restricted to the clade in question
(Van Dijk, Madsen et al., 2001) scored on a presence-absence basis similar to
morphological characters. Amrine-Madsen, Koepfli et al. (2003) identified a single
protein signature unique to H+E in APOB which involves the substitution of alanine for
threonine at position 2396. Further, following a manual scan of the Murphy, Eizirik et al.
(2001b) data set, a deletion of a single amino acid in the BRCA1 gene (at position 12710)
specific to H+E was found. Recently, the amino acid sequences of 19 nuclear genes (all
included in this study) were examined for Paenungulata and six other species used as
outgroups (human, mouse and all remaining afrotherian taxa) to determine the number of
phylogenetically informative characters supporting each of the three possible
paenungulate sister relationships (Nishihara, Satta et al., 2005). Significantly with every
outgroup comparison over half of the informative sites supported H+E. In the
mitochondrial genome, additional support is seen using more conservative sites of
mtDNAcod2 which yields a well supported H+E association with MP. Although not a
completely reliable comparison, it is noteworthy that mtDNAcod2 exhibits roughly
similar levels of variable sites and proportions of parsimony informative characters to
nuccod1. Additionally, by analysing the data according to codon position, the effect of
lineage sorting is effectively reduced as characters from different DNA segments are
included. Finally, individual partitions within nDNA that favour H+E (ATP7A, BRCA1,
APOB, PRKCI, STAT5A) also recovered well supported benchmark clades.
Stellenbosch University http://scholar.sun.ac.za

71
Table 2.13 Partitioned Bremmer support for nDNA. Positive values indicate support for a particular node. NuclearAll Hyrax+Elephant Tenrec+GMole Afroinsectivora Afroinsectiphillia Paenungulata Afrotheria Laurasiatheria ADORA3 1 1 1 1 -6 7 7 ADRB2 1 2 0 0 -3 2 2 APP 5 3.5 2 2 -2 10 5 ATP7A 8 6.5 5 5 9 12 11 BDNF 1 1.5 4 4 3 2 8 BMI1 0 0 0 0 3 6 6 CNR1 -3 -3.5 -1 -1 8 -4 -4 CREM 1 0.5 2 2 0 -1 -3 EDG1 -3 -2 -16 -16 -11 -5 -7 PLCB4 -6 -6.5 -5 -5 -1 2 2 PNOC -4 -3.5 0 0 5 4 7 RAG1 0 0 -3 -3 12 0 2 RAG2 0 0 -1 -1 -1 5 4 TYR -7 -5 -3 -3 -2 1 6 ZFX 0 0 1 1 2 0 4 VWF 3 2.5 -4 -4 0 6 -5 BRCA1 6 6.5 19 19 16 45 44 IRBP -1 -0.5 6 6 24 0 13 A2AB -2 -1 -3 -3 0 5 8 NUCCOD1 10 9 21 21 12 58 49 NUCCOD2 7 5 9 9 17 21 32 NUCCOD3 -17 -11 -24 -24 36 4 17 APOB 0 -1.5 1 1 9 3 -2 MGF -1 -1.5 0 0 14 10 17 PRKCI 2 1 2 2 1 6 10 STAT5A 2 2 2 2 12 0 12 THY 0 1 -1 -1 -2 9 13
Stellenbosch University http://scholar.sun.ac.za
72
2.3.4 Manatee and hyrax
Support for M+H was apparent both from mtDNA and nDNA markers although never in
the majority in either case. Support for this clade by CO2 represented the only other well
supported paenungulate node obtained from the separate analysis of mtDNA partitions
and from a topological consideration alone was retrieved considerably more often than
H+E. However, within nDNA M+H and M+E were apparent to similar extents but M+H
was present in the combined analysis of intron as well as nuccod and nuclearAll. In the
BI (partitioned) analysis of the total data set excluding mtDNAcod3, M+H was retrieved.
Although M+H is present in several topologies, this clade is only supported by two data
sets, CO2 and TYR. Unlike H+E, there is no convincing support at any other level and it
is unclear to what extent there is hidden support for M+H.
2.3.5 Manatee and elephant
Support for M+E with mtDNA is evident from both the combined and separate analysis
of partitions with particularly strong support from third codon positions and to a lesser
degree, first codon positions. Furthermore, previous analysis of mtDNA protein-coding
genes at the amino acid level, also provide support for M+E (Murata, Nikaido et al.,
2003; Nikaido, Cao et al., 2003). However, that signal for M+E is present in the fastest
evolving sites, in particular mtDNAcod3 and apparently negligibly in mtDNAcod2 is a
cause for concern. Since signal from third and first codon positions evolve at a faster rate
it is expected that problems such as heterogeneous evolutionary processes and multiple
hits which are associated with using mtDNA to resolve deep divergences, will be
exacerbated (Kelsey, Crandall et al., 1999). Additionally, as a result of the short internal
edge, any phylogenetic signal present will be eroded at a higher rate at faster-evolving
sites and so are more likely to be obscured by a misleading signal. Consequently, there is
an increasing probability that signal from third and first codons of mtDNA is likely to be
compromised by homoplasy.
Although M+E is supported by mtDNA analyses together with high bootstrap values and
significant Bayesian posterior probabilities, this does not discount the possibility of these
results being misleading. A signal from a non-historical source may be sufficiently strong
Stellenbosch University http://scholar.sun.ac.za
73
to overwhelm the weaker but biologically real signal, as well as the statistical evaluation
of the result (Bos and Posada, 2005; Naylor and Brown, 1998; Sullivan and Swofford,
1997). BI may be more sensitive to signal in the sequence data (Alfaro, Zoller et al.,
2003); however, there is also a greater chance of incorrectly providing higher support for
a short internal edge where non-Bayesian measures of support are low (Lewis, Holder et
al., 2005) due to the stochastic nature of the model of evolution (Alfaro, Zoller et al.,
2003; Erixon, Svennblad et al., 2003). Inflated levels of support for mtDNA data sets,
particularly for protein-coding sequences, have been documented in previous mammalian
systematic studies (Arnason, Adegoke et al., 2002; Penny, Hasegawa et al., 1999b) where
high bootstrap support was associated with the incorrect placement of the root of the tree
and also of certain clades (Lin, Waddell et al., 2002; Waddell, Cao et al., 1999b).
Although Bayesian posterior probabilities are likely to be unbiased estimators of the
probability of recovering a particular clade (Waddell and Shelley, 2003), the parameters
of the model applied must be as similar as possible to those under which the sequences
evolved (Nylander, Ronquist et al., 2004). If this is not the case, for example due to
strong biases, then convincing support for the incorrect topology may result (Douady,
Delsuc et al., 2003; Waddell, Kishino et al., 2002; Waddell, Kishino et al., 2001). This
may account for the high support of the M+E node from BI when, with mtDNAcod3, a
posterior probability of 1 was obtained. Furthermore, posterior probability values from
the total data set analysis also show a well-supported M+E when all data partitions are
merged. However, when the data are subdivided into three and then five partitions, a
substantial change is noted with BI producing a polytomy at this level. In the
totalExmtDNA3 analysis, a similar trend of reduced support for M+E is seen as the data
is partitioned. Specification of individual partitions in a combined BI analysis enables
heterogeneity among data partitions to be better accounted for (Brandley, Schmitz et al.,
2005; Nylander, Ronquist et al., 2004). If this is applicable to the partition BI analysis
here, the decreased support for M+E further supports that this signal is misleading.
Furthermore, the over-correction evident with the ti/tv estimates obtained with different
corrections demonstrates that the models are not able to account for the evolutionary
processes in mtDNA.
Stellenbosch University http://scholar.sun.ac.za
74
In the presence of pronounced base composition heterogeneity, there is an increased
chance for the accuracy of phylogenetic inference to be negatively affected (Gibson,
Gowri-Shankar et al., 2005; Foster and Hickey, 1999; Lake, 1994; Lockhart, Steel et al.,
1994). In particular, faster evolving sites which evolve rapidly to reflect particular biases
in base composition (Inagaki, Simpson et al., 2004) potentially result in strongly
misleading signals if the models used assume stationarity of the nucleotide substitution
process (Foster and Hickey, 1999; Galtier and Gouy, 1998). The presence of variable
nucleotide frequencies among paenungulates and a link between these and the proportion
of pairwise shared substitutions (see section 2.3.1.3.2) is a clear indication that the signal
favouring M+E is questionable. Moreover, it can be shown that the presence of an M+E
association rather than M+H or H+E is a result of two specific factors: i) the presence of
particular (divergent) biases in each of the three paenungulates and the interaction
between these in different substitution classes; and ii) that the interaction between the
biases takes place specifically under a three-taxon condition. In the case of ii), when
considering a trichotomy with a divergent bias between two taxa (T1 and T2), the third
taxon T3 will, as a result of being intermediate to T1 and T2, be more likely to share a
similar substitution profile with either T1 or T2, than T1 and T2 would with each other.
Consequently, the number of shared sites between T3 and either T1 (T3+T1) or T2
(T3+T2) will tend towards the bias particular for each divergent taxon, with the number
of shared sites for T1+T2 intermediate to T3+T1 and T3+T2. As a result, the relative
number of shared sites between two taxa, for example T1 and T3 (or T2 and T3), is due
to divergent substitution biases in T1 and T2 rather than T1 and T3 sharing similar sites
due to shared history (or conversely, sharing relatively fewer sites due to greater
evolutionary distance). In the case of Paenungulata, a particular taxon pair (M+E) shares
a greater number of changes across several different substitution types than other
pairwise associations. M+E changes (table 2.8) dominate the data set with respect to both
the total number of changes (M+E-200, M+H-166, H+E-150) and the number of different
substitution classes (3 out of 6)5 where M+E counts exceed M+H and H+E. This is
accounted for by considering point i) above.
5The classes of substitution change where sufficient numbers of changes were detected in the manual scan include all transitions, C to A, T to A, A to T and A to C. Of these, a particular pairwise association showed a majority of shared sites in all classes except A to G and C to A (see table 2.8).
Stellenbosch University http://scholar.sun.ac.za

75
Using the previous example but taking into consideration the direction of divergent taxon
bias, if the direction of change favours the bias present in T1 (i.e., a bias to G will favour
changes in the direction of N to G), then logically T1 will share the most changes with T3
(intermediate taxon), while the taxon which does not favour the direction of change, T2,
will share the least number of changes with T3. This is evident for divergent biases
between both the hyrax versus the manatee and hyrax versus elephant. Significantly, the
hyrax shares a clear divergent bias with either the manatee or elephant for seven of the
eight substitution classes considered. Furthermore, since the majority of cases where the
direction of change is favoured by the manatee or elephant (i.e., greater number of
changes) coincides with substitution classes where a greater number of changes occur
(e.g., T to C versus G to A, table 2.8), a larger number of M+E shared sites results
overall. Consequently, the presence of a larger number of shared changes between M+E
can be accounted for by the particular combination of biases in effect between these three
taxa and differences in the relative proportion of changes present within different
substitution classes, indicating that the signal associated with M+E is likely not due to
shared history. Of note, although there are a majority of first and third codon sites which
are shared between M+E, second codon sites do not show the same trend (with the
exception of one substitutional class, A to T). This may be a result of sampling error with
the low frequency of changes expected at second codon positions but may also indicate
that these positions are less susceptible to the nucleotide bias and consequently may
contain phylogenetic signal.
Although the previous discussion refers to analyses with all codon positions included,
significant correlations obtained with these sites held for third and first codon positions
separately. However, the latter found an additional significant correlation for N to T
substitutions which is likely due to the elevated number of C to T sites for M+E. A
relative increase at first codon positions was also present for A to C substitutions in M+E.
In both cases the majority of sites code for leucine (A to C, 9 of 13 sites; C to T, 9 of 12
sites) which is the most abundant amino acid in mtDNA and one of only two amino acids
that experience synonymous changes (C to T ) at first codon positions. Strong biases in
mtDNA nucleotide composition have previously been shown to be significantly
Stellenbosch University http://scholar.sun.ac.za

76
correlated with amino acid composition and negatively affect protein-level phylogenetic
analysis (Gibson, Gowri-Shankar et al., 2005; Schmitz, Ohme et al., 2002; Singer and
Hickey, 2000; Foster, Jermiin et al., 1997). This is contrary to the assumption that protein
sequences are generally considered to be free from the effects of bias in nucleotide
sequence due to the presence of greater functional constraints (e.g., Loomis and Smith,
1990). However, the presence of a significant correlation between base composition and
N to T and A to N pairwise changes at first codon positions indicate that protein-level
analyses for Paenungulata are also affected by nucleotide bias and may explain why
previous studies using mtDNA protein-coding sequences analysed at the amino acid level
also supported an M+E node (Murata, Nikaido et al., 2003; Nikaido, Cao et al., 2003)6.
It has been recently reported that random sequences can bias phylogenetic reconstruction
(Susko, Spencer et al., 2005). Random sequences occur when a proportion of sites is
independent of sequence data for other taxa, for example due to incorrect alignment or
when sites evolve at a considerably increased rate in some portions of the tree; this
phenomenon is of particular relevance when deep divergence times are involved (Susko,
Spencer et al., 2005). With the considerably increased mtDNA substitution rate of
elephant relative to manatee and most other mammalian orders (Gissi, Reyes et al., 2000;
Hauf, Waddell et al., 2000; Waddell, Cao et al., 1999b), it is not unlikely that DNA
segments from the elephant may contain random sites which negatively influence
phylogenetic reconstruction.
2.4 CONCLUSION
In the present study, a hierarchical analysis was used to increase understanding of signal
heterogeneity within the 29904kb data set. By taking advantage of the different
approaches to phylogenetic reconstruction used by MP and BI, the identification of areas
of conflict and support not otherwise evident with a strictly separate or total evidence
6 Although the test for homogeneity of nucleotide composition (PAUP*4.0b10, section 2.3.1.2) was not significant for first codon sites (P = 0.114), the results discussed here indicate that this may be due to this test being conservative (Waddell, Cao et al., 1999)
Stellenbosch University http://scholar.sun.ac.za
77
combined approach was possible. This enabled the use of an exploratory approach to
examine and interpret node support to gain insight into the paenungulate polytomy.
The M+E evolutionary relationship has received support from previous molecular studies
(Murata, Nikaido et al., 2003; Nikaido, Cao et al., 2003) as well as from morphological
characters as the Mirorder Tethytheria (McKenna, 1975). Additionally, evidence for an
aquatic ancestry for Proboscidea (Gaeth, Short et al., 1999) is considered as further
confirmation; however, convergent evolution of this character cannot be disregarded
(Seiffert, 2003). As demonstrated here, there are several lines of molecular evidence to
suggest that there are misleading factors contributing to M+E, most notably the
correlation of base composition bias and the proportion of pairwise shared sites.
Although this does not discount M+E altogether, it introduces a caveat for the use of
these data to support M+E. The Waddell, Kishino et al., (2001) study was the first using a
large, combined data set to suggest a H+E sister relationship for Paenungulata. In the
present study, this association received convincing support from a specific set of
characters sharing similar evolutionary properties. Although H+E is not robustly
supported by larger data sets, this is not an expectation of a signal from a short internal
edge (soft polytomy). Additional molecular evidence supports this result (e.g., Nishihara,
Satta et al., 2005; Amrine-Madsen, Koepfli et al., 2003). The association of M+H was
evident in several nDNA and mtDNA individual markers, though never in the majority,
and together with H+E was retrieved by several combined partitions. This may indicate
hidden support for M+H, however, due to the absence of a defined set of characters
providing convincing support (as evident for H+E), precluded further investigation of the
M+H association in this study.
A definitive solution to the paenungulate polytomy is not possible from the analysis
presented here. However, given the likelihood that the M+E association is affected by
misleading signal and the comparatively lower support for M+H, these associations are
considered less probable than the H+E association. H+E fits the pattern expected for a
small signal from a soft polytomy and if real, then Paenungulata is best characterised as a
soft polytomy. If H+E is incorrect, the data based on this analysis are then in favour of a
Stellenbosch University http://scholar.sun.ac.za

78
paenungulate trichotomy, whether due to an essentially simultaneous radiation or
subsequent hardening of a soft node. Finally, this study empirically demonstrates that
increasing data does not necessarily result in more biologically accurate trees but that
consideration of signal structure, particular in the case of a short internal edge, is an
important element in combined analyses of increasingly larger and likely heterogeneous
data sets.
Stellenbosch University http://scholar.sun.ac.za
79
CHAPTER 3 – COMPARATIVE CYTOGENETICS
3.1 INTRODUCTION
An option available in phylogenetic reconstruction to address the problem of an
ambiguous node is the inclusion of alternative markers. For DNA sequence data this
choice is in effect limitless, made possible by the increasing availability of new markers
through comprehensive genome sequencing projects. A less frequently used approach to
phylogenetic reconstruction is the comparison of chromosomal differences between taxa
using cytogenetic methods. This approach provides a broad, genome-wide assessment of
evolutionary changes in contrast to that of the relatively narrow but fine-scale analysis at
the nucleotide level. Consequently, the phylogenetic analysis of problematic nodes may
benefit from an alternative perspective on evolutionary relationships – such as the one
provided by cytogenetic methods.
The relationship among the three extant orders (Proboscidea, Hyracoidea and Sirenia)
comprising Paenungulata remains unresolved despite several comprehensive nucleotide-
level analyses. Although various chromosomal data exist for several species from each
paenungulate order (see Chapter 1), the potential of a cytogenetic approach to resolve this
trichotomy has not previously been investigated. Accordingly, the delineation of
chromosomal rearrangements among paenungulates and outgroup reference taxa permits
the use of phylogenetic analyses to determine if synapomorphic changes are present
(Dobigny, Ducroz et al., 2004; Qumsiyeh and Baker, 1988).
The choice of phylogenetic character (and character state) has varied across chromosomal
phylogenetic studies and the validity of these choices have been much debated (e.g.,
Dobigny, Ducroz et al., 2004; Borowik, 1995; Qumsiyeh and Baker, 1988). Whole
chromosomes (Viegas-Péquignot, Dutrillaux et al., 1983) or chromosome segments
(Otells, 1995) as well as rearrangements (De Oliviera, Neusser et al., 2005; Frönicke,
2005) have previously been selected as the appropriate character for phylogenetic
reconstruction. Here, I followed Dobigny, Ducroz et al. (2004) and defined individual
chromosome rearrangements as characters and the presence or absence thereof as the
Stellenbosch University http://scholar.sun.ac.za
80
character state. Consequently, characters could be coded using a binary approach for
phylogenetic analysis. The use of rearrangements as phylogenetic characters avoids
multiple scoring which may be problematic if the whole chromosome, or part thereof, is
used as a character. Further, this ensures that characters are independent (Dobigny,
Ducroz et al., 2004). For example, a chromosomal segment that has undergone a fission
is unlikely to be independently rejoined in various evolutionary lineages (Weinberg,
Stanyon et al., 1997).
The characterisation of specific characters as derived rather than ancestral requires
comparison with an outgroup reference (Dobigny, Ducroz et al., 2004; Qumsiyeh and
Baker, 1988) following cladistic methodology (Farris, 1978). Here the inclusion of
outgroup taxa enabled the polarisation of characters for phylogenetic analysis. In this
study, the aardvark and the human were selected as outgroups. Although the sister taxon
of Paenungulata is uncertain, the aardvark has received support in this position (Amrine-
Madsen, Koepfli et al., 2003). Further, from a cytogenetic perspective, this species is
regarded as conserved within eutherian evolution (Yang, Alkalaeva et al., 2003).
Consequently, the inclusion of a closely related species as outgroup should filter “noise”
that may result from using an outgroup that is too distantly related (Müller, Hollatz et al.,
2003). It may have been additionally informative to include an outgroup to Afrotheria.
This supraordinal clade is generally considered basal within eutherian phylogenetics
(Springer, Murphy et al., 2003a, but see section 1.2.2 for discussion on alternative
hypotheses) and would require comparison to a metatherian representative; however, data
for a eutherian-metatherian assessment are currently limited to the X chromosome (Glas,
Marshall Graves et al., 1999). Characterisation of homologous segments between
paenungulates and human were indirectly mapped through existing data between the
human and aardvark, and human and elephant (Frönicke, Wienberg et al., 2003; Yang,
Alkalaeva et al., 2003). The human syntenic patterns were included to enable
comparisons with existing data on paenungulates (Frönicke, Wienberg et al., 2003; Yang,
Alkalaeva et al., 2003) and other eutherian taxa.
Stellenbosch University http://scholar.sun.ac.za
81
Two techniques were used to characterise karyotypic rearrangements: standard
cytogenetic staining techniques (G- and C-banding), and cross-species comparative
painting using fluorescence in situ hybridisation (FISH). Previous applications of
cytogenetic data to phylogenetic questions were initially based on inferred homologies
using chromosome morphology and staining results. However, the usefulness of this
approach is restricted due to uncertainty regarding true homology, especially with highly
rearranged chromosomes (Borowik, 1995) resulting from elevated levels of chromosomal
evolution (Müller, Hollatz et al., 2003; Bininda-Edmonds, Gittleman et al., 1999) and/or
from deep divergence times where it may be virtually impossible to infer homologies.
The development of FISH for cytogenetic analysis has enabled the direct assessment of
homology between DNA segments, circumventing this shortcoming associated with
staining techniques. The application of FISH through cross-species chromosome painting
using fluorescently-labeled whole chromosomes facilitates the identification of
karyotypic rearrangements but not rearrangements within a particular conserved block
(e.g., inversions). By including differences in G-banding patterns of homologous
segments that have been verified through FISH, finer-scale changes such as inversions or
translocations, may sometimes be identified.
In addition to the characterisation of phylogenetic characters for a systematic analysis,
chromosomal rearrangement data in conjunction with banding patterns may provide
insight into karyotypic evolution and genome organisation within Paenungulata.
Specifically, estimates of rates of chromosomal change and the reconstruction of an
ancestral paenungulate karyotype are used to provide a glimpse into the succession of
evolutionary events involved in paenungulate evolution.
3.2 MATERIALS AND METHODS
3.2.1 Taxon sampling and cell culture
A representative specimen from each of the three paenungulate orders (Hyracoidea,
Proboscidea and Sirenia) as well as from the monotypic Tubulidentata (included as an
outgroup) were used in this study (table 3.1). Cell cultures for all four taxa were available
at the start of the study. New specimens for the hyrax and aardvark were subsequently
Stellenbosch University http://scholar.sun.ac.za
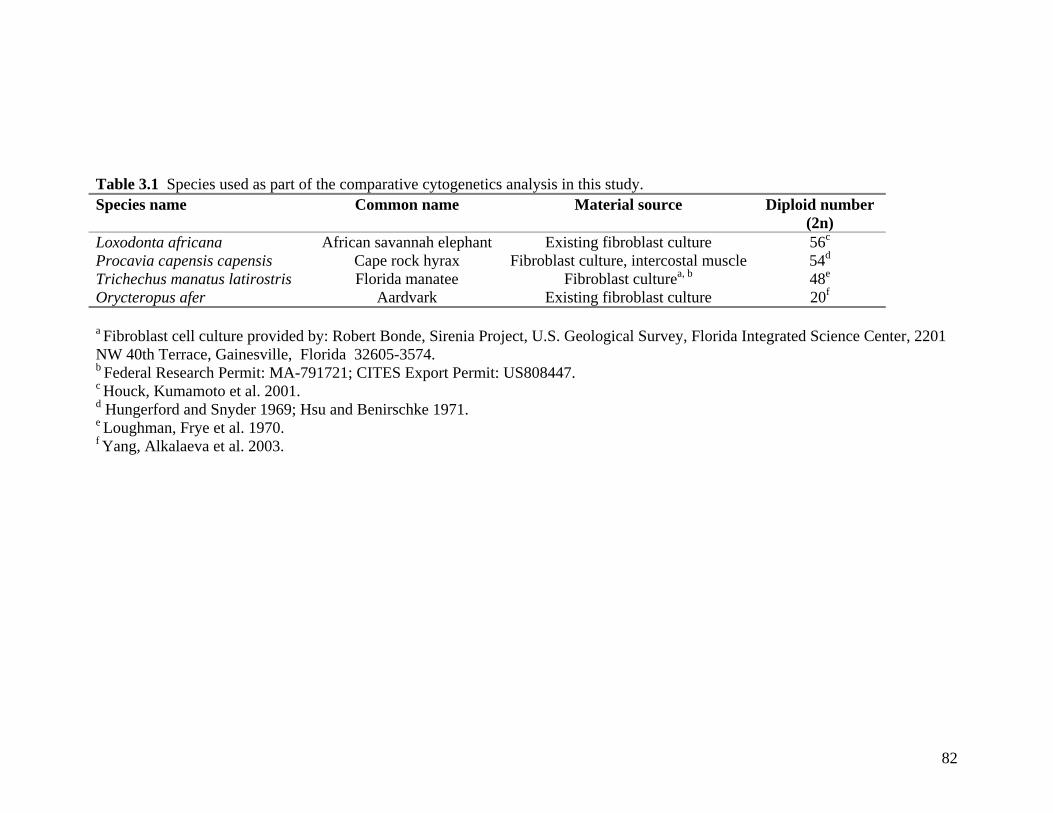
82
Table 3.1 Species used as part of the comparative cytogenetics analysis in this study. Species name Common name Material source Diploid number
(2n) Loxodonta africana African savannah elephant Existing fibroblast culture 56c Procavia capensis capensis Cape rock hyrax Fibroblast culture, intercostal muscle 54d Trichechus manatus latirostris Florida manatee Fibroblast culturea, b 48e Orycteropus afer Aardvark Existing fibroblast culture 20f a Fibroblast cell culture provided by: Robert Bonde, Sirenia Project, U.S. Geological Survey, Florida Integrated Science Center, 2201 NW 40th Terrace, Gainesville, Florida 32605-3574. b Federal Research Permit: MA-791721; CITES Export Permit: US808447. c Houck, Kumamoto et al. 2001. d Hungerford and Snyder 1969; Hsu and Benirschke 1971. e Loughman, Frye et al. 1970. f Yang, Alkalaeva et al. 2003.
Stellenbosch University http://scholar.sun.ac.za
83
included and fibroblast cell cultures were established from intercostal muscle and ear
biopsies, respectively.
Tissue from external tissue sources used to generate primary cell cultures were
thoroughly cleaned under sterile conditions with 70% ethanol (EtOH) and placed in tissue
culture medium (Dulbecco’s Modified Eagle Medium supplemented with 15% (v/v)
foetal calf serum, FCS). Prior to processing the biopsy further it was incubated overnight
at 37oC with 5% CO2 to ensure the tissue was contaminant-free. All samples were
minced, placed into 25cm2 tissue culture flasks, enough medium was added to almost
submerge the tissue fragments, and the cultures incubated at 37oC. Flasks were
maintained until confluent using standard techniques (Schwarzacher, Wolf et al., 1974)
for subsequent analysis. Cultures generated from new samples were also cryopreserved
(FCS with 10% (v/v) DMSO) in liquid nitrogen and added to the existing SUN
(Stellenbosch University) collection.
3.2.2 Chromosome and standard karyotype preparation
3.2.2.1 Chromosome metaphase suspension
Cells were harvested by arresting cell division at metaphase using 30 µl colcemid (10
µg/ml; Gibco). Prior to harvesting, manatee cell cultures in particular required
synchronisation using a thymidine block (300 µg/ml) followed by BrdU
(bromodeoxyuridine, 3mg/ml) treatment for seven hours before trypsinising. Subsequent
to trypsin treatment, all cells were incubated in a hypotonic solution (0.075 M KCl) at
37oC for 16 minutes and then fixed with 3:1 methanol-acetic acid. Slides for subsequent
analysis were prepared by dropping a single drop of the fixed cell suspension which was
then overlaid with a drop of 3:1 (methanol: glacial acetic acid) fresh fixative on a clean
microscope slide.
3.2.2.2 Giemsa-banding (GTG-banding)
GTG-banding (Seabright, 1971) by trypsin digestion was used to enable the identification
of homologous chromosomes. Slides for G-banding were aged overnight by baking in a
65 oC oven. Prior to trypsin treatment, slides were briefly rinsed in Hanks’ balanced salt
Stellenbosch University http://scholar.sun.ac.za
84
solution (HBSS, excluding Ca2+ and Mg2+). Chromosomes were trypsin-digested (0.05%)
with the length of treatment varying between 1-6 minutes depending on the age of the
slide. The enzymatic action was stopped by rinsing the slides in 0.025 M phosphate
solution (pH 7.0) with 0.02% FCS followed by a brief rinse in H20. A 2% (v/v) phosphate
buffered Giemsa solution (pH 6.8) was used to stain the digested chromosomes for 3-4
minutes.
3.2.2.3 Constitutive heterochromatin banding (CBG-banding)
Regions of constitutive heterochromatin were identified using CBG-banding (Sumner,
1972). Unbaked, freshly prepared metaphase slides were used. Treatment consisted of 15-
30 minutes in 0.2 N HCl, a brief rinse in H20 followed by ~1 minute in saturated
Ba(OH)2 at 55 oC. The slides were rinsed thoroughly under running water to remove
residual Ba(OH)2 and then left for 1 hour in 2xSSC at 65 oC. Following a brief rinse with
water, the slides were stained for 4-5 minutes in a 4% Giemsa solution (phosphate
buffered, pH 6.8).
3.2.3 Standardisation of karyotypes
G- and C-banded karyotypes for the elephant, manatee and aardvark were arranged
according to previously published karyotypes (aardvark, Yang, Alkalaeva et al., 2003;
manatee, Gray, Zori et al., 2002; elephant, Houck, Kumamoto et al., 2001). Although a
G-banded karyotype for the rock hyrax has previously been reported (Prinsloo, 1993), it
has not been published and is presented here. Autosomes for P. capensis were grouped on
the basis of the position of the centromere (meta/submetacentric and acrocentric) and
then ordered by decreasing chromosome size.
3.2.4 Chromosome painting using fluorescence in situ hybridisation
3.2.4.1 Flow-sorting and generation of chromosome-specific probes
Chromosome-specific painting probes for all four taxa were generated from chromosome
suspensions flow-sorted by fluorescence activated cell sorting (FAC) using a dual laser
sorter (Ferguson-Smith, Yang et al., 1998; Yang, Carter et al., 1995) and subsequently
amplified by degenerate oligonucleotide-primed PCR (DOP, Telenius, Carter et al.,
Stellenbosch University http://scholar.sun.ac.za

85
1992). DOP-PCR amplifications followed Yang, Carter et al. (1995) with minor
modifications to the amplification protocol (F. Yang, pers. com.); these involved an
initial denaturation at 94oC for 3 minutes (1 cycle), followed by 25 cycles of 94 oC for 1
minute, 62 oC for 1 minute and 72 oC for 1.5 minutes. This was followed by a final
extension step of 72 oC for 8 minutes. Probes were labeled with biotin-16-dUTP (Roche).
3.2.4.2 Fluorescence in situ hybridisation
This technique was applied in two different ways:
1. to characterise chromosomes separated by flow-cytometry for each of the
paenungulate species (homologous or intra-FISH),
2. to delimit homologous chromosomal segments by reciprocal chromosome
painting among paenungulates (heterologous or zoo-FISH) and unidirectional
painting of paenungulate painting probes to aardvark chromosomes.
3.2.4.3 Reciprocal chromosome painting
Reciprocal hybridisations between taxa were performed using FISH with 100-150 ng of
chromosome-specific paints made up to 12 µl with hybridisation buffer (50% deionized
formamide, 10% dextran sulfate, 2X SSC, 0.5 mol/L phosphate buffer pH 7.3, and 1×
Denhardt’s solution). The probes were denatured at 70°C for 15 minutes and then
preannealed by incubation at 37°C for a minimum of 15 minutes and up to 60 minutes.
Prior to hybridisation, the freshly prepared slides underwent a series of treatments to
facilitate the annealing process between probe and target DNA:
- 1:1 fixative (methanol: acetic acid) for 5 minutes, slides allowed to air-dry,
- 100% ethanol for 5 minutes, slides air-dried,
- 0.02% pepsin (Sigma P-7000, dissolved in 10 mM HCl) for 5 minutes,
- 2x SSC repeated twice for 5 minutes each,
- 70, 80, 90, 100% ethanol series, 1.5 minutes in each, slides air-dried.
- slides were aged in 100% ethanol at 65°C for 2 minutes and air-dried.
Metaphase slides were denatured by incubation in 70% formamide/30% 2x SSC solution
at 65°C for 1.5–2 minutes, quenched in ice-cold 70% ethanol, and dehydrated through a
Stellenbosch University http://scholar.sun.ac.za
86
70, 80, 90 and 100% ethanol series. The pre-annealed paints were applied to slides,
covered with 22 x 22 mm2 cover-slips, sealed with rubber cement and incubated for 48-
72 hours at 37°C in a humid chamber. Post-hybridisation washes involved two 5-min
incubations in 50% formamide/50% 2x SSC (v/v) at 40-42°C followed by two 5-min
incubations in 2x SSC at 40-42°C. Biotin-labeled probes were visualised using Cy3-
avidin (1:500 dilution, Amersham). After detection, slides were mounted in Vectashield
mounting medium containing DAPI (4’6-diamidino-2-phenylindole, Vector
Laboratories).
Chromosome preparations examined in this study were visualised using an Olympus
BX60 fluorescence microscope with suitable excitation filters (Reichman, 1998). Images
were captured using a cooled CCD camera and analysed with the Cytovision®/GenusTM
system (version 2.7, Applied Imaging). Hybridisation signals were assigned to specific
chromosome regions as defined by DAPI banding.
FISH with either two or three colours was applied where the identification of DAPI-
banded chromosomes was problematic and required verification, and during intra-FISH
hybridisations. Further, probes that were found to perform well during interspecific
hybridisations were combined during subsequent FISH trials. Probes used in two-colour
hybridisations were labeled with either biotin- or digoxigenin (DIG)-dUTP (described
previously) and visualised with avidin-CY3 or anti-DIG-FITC (1:500 dillution,
Amersham), respectively. Where three colour FISH was employed (intra-FISH), equal
volumes of the biotin and digoxigenin were combined to produce the third colour.
3.2.4.4 Intra-FISH hybridisations
Characterisation of paenungulate flow-sorted chromosomes was identical to that for
reciprocal chromosome painting. Exceptions to the procedure used above are outlined
below.
The identity of the flow-sorted chromosomes was determined by hybridisation to G-
banded metaphase spreads of the same species using FISH. After G-banded karyotype
Stellenbosch University http://scholar.sun.ac.za
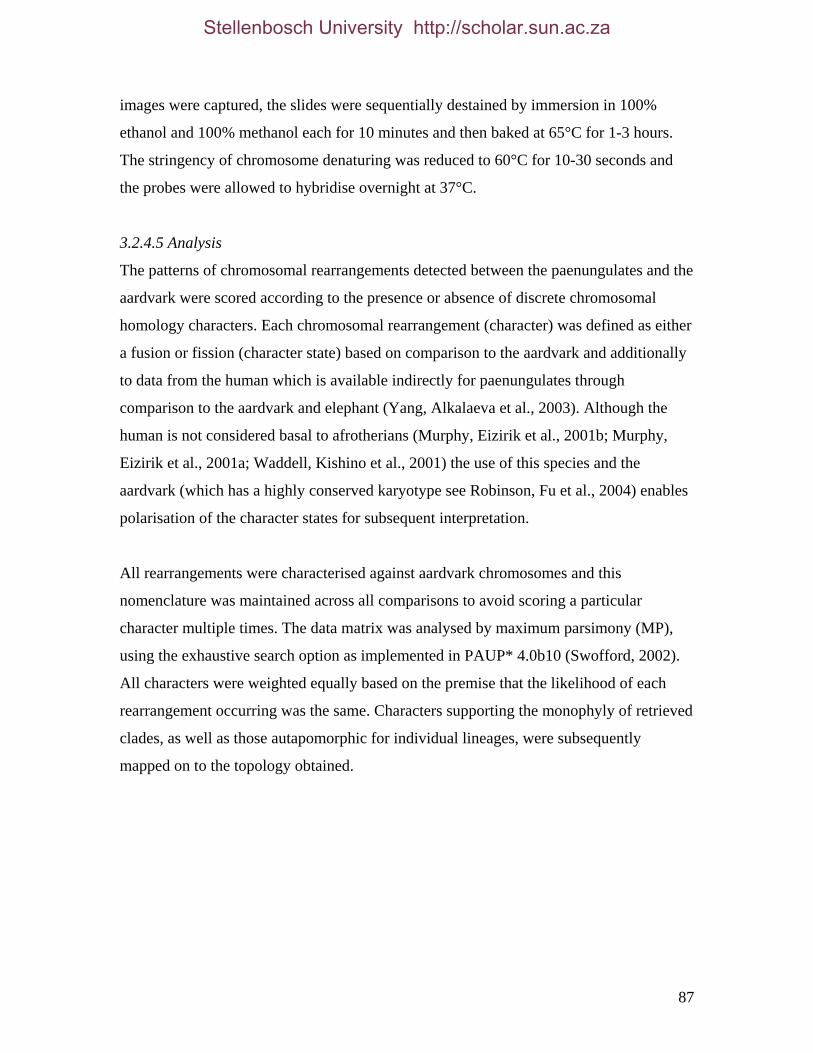
87
images were captured, the slides were sequentially destained by immersion in 100%
ethanol and 100% methanol each for 10 minutes and then baked at 65°C for 1-3 hours.
The stringency of chromosome denaturing was reduced to 60°C for 10-30 seconds and
the probes were allowed to hybridise overnight at 37°C.
3.2.4.5 Analysis
The patterns of chromosomal rearrangements detected between the paenungulates and the
aardvark were scored according to the presence or absence of discrete chromosomal
homology characters. Each chromosomal rearrangement (character) was defined as either
a fusion or fission (character state) based on comparison to the aardvark and additionally
to data from the human which is available indirectly for paenungulates through
comparison to the aardvark and elephant (Yang, Alkalaeva et al., 2003). Although the
human is not considered basal to afrotherians (Murphy, Eizirik et al., 2001b; Murphy,
Eizirik et al., 2001a; Waddell, Kishino et al., 2001) the use of this species and the
aardvark (which has a highly conserved karyotype see Robinson, Fu et al., 2004) enables
polarisation of the character states for subsequent interpretation.
All rearrangements were characterised against aardvark chromosomes and this
nomenclature was maintained across all comparisons to avoid scoring a particular
character multiple times. The data matrix was analysed by maximum parsimony (MP),
using the exhaustive search option as implemented in PAUP* 4.0b10 (Swofford, 2002).
All characters were weighted equally based on the premise that the likelihood of each
rearrangement occurring was the same. Characters supporting the monophyly of retrieved
clades, as well as those autapomorphic for individual lineages, were subsequently
mapped on to the topology obtained.
Stellenbosch University http://scholar.sun.ac.za
88
3.3 RESULTS AND DISCUSSION
3.3.1 Karyotype analysis
3.3.1.1 G- and C-banding
The diploid number obtained for L. africana, P. capensis, T . m. latirostris and O. afer
corresponds to those previously published (table 3.1). G- and C-banded karyotypes
generated in this study for species for which this data have already been published are
presented in figures 3.1 (a and b), 3.4 (not including C-bands), 3.7 and 3.8. The
karyotypes produced in this study do not show any discernable difference with those
previously published.
In agreement with a previous (but unpublished) report on the G-banded karyotype of P.
capensis (Prinsloo, 1993) the autosomal chromosomes (figure 3.2) are characterised by
21 acrocentric/telocentric pairs (1-21), three submetacentric pairs (22-24) and two
metacentric pairs (25, 26). The X chromosome is a large submetacentric and the Y a
small metacentric chromosome. The C-banded preparation of the hyrax (figure 3.3)
indicates that heterochromatin is largely centromeric and not present on all chromosomes.
Aardvark C-banding (figure 3.4) showed that heterochromatin was most often located in
the vicinity of the telomeres (chromosomes 3, 4, 5, 6, 7 and 9). Exceptions include the
presence of centromeric and pericentromeric heterochromatin in the two largest
chromosomes (1 and 2) with an apparently almost completely heterochromatic p-arm of
chromosome 1. Further, darker interstitial areas were evident on chromosomes 5 and 8,
with the Y chromosome entirely heterochromatic. Interspecific comparisons among
paenungulates indicate that patterns of C-banding overall are similar to that seen in the
hyrax with heterochromatin restricted to centromeric and pericentromeric regions. The
amounts of C-banding present in the chromosomes of the elephant and hyrax vary
considerably with some chromosomes showing almost no staining (including the Y
chromosome). In contrast, C-banding within the manatee is evident at all centromeres at
relatively similar amounts and with a C-positive Y chromosome.
Stellenbosch University http://scholar.sun.ac.za

89
Figure 3.1a Constitutive heterochromatin staining in L. africana. Y chromosome identified.
Figure 3.1b Constitutive heterochromatin staining in T. m. latirostris. Y chromosome identified.
Stellenbosch University http://scholar.sun.ac.za
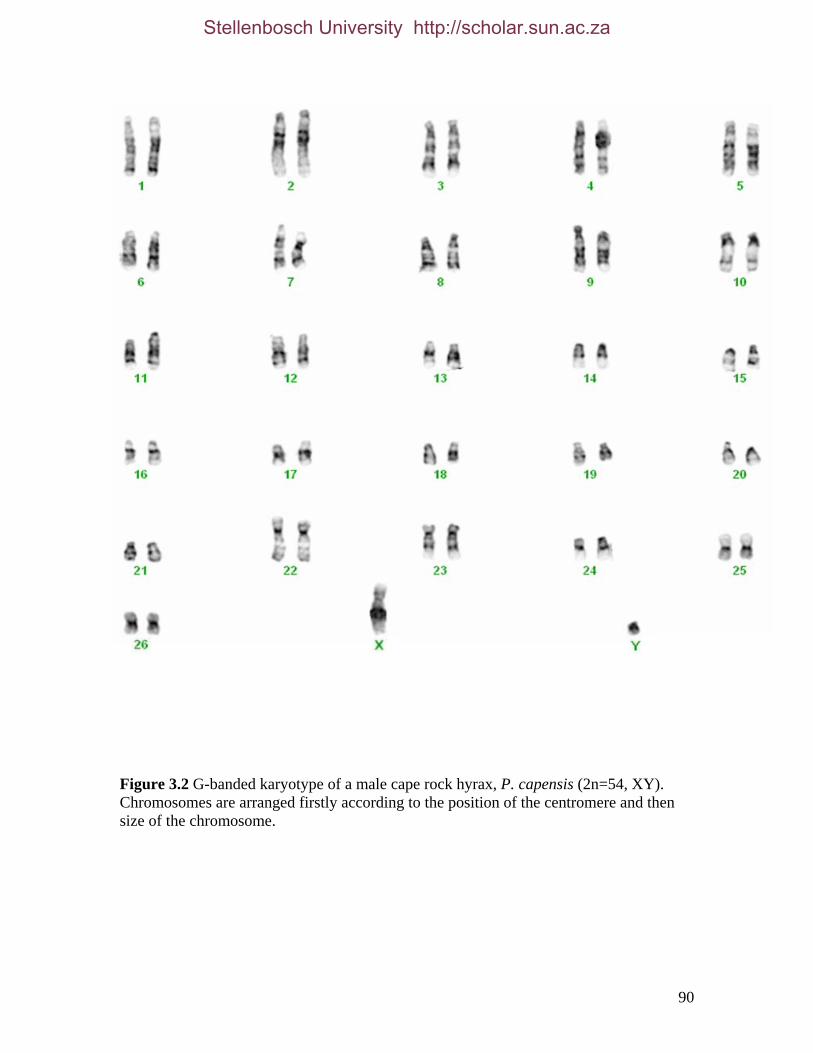
90
Figure 3.2 G-banded karyotype of a male cape rock hyrax, P. capensis (2n=54, XY). Chromosomes are arranged firstly according to the position of the centromere and then size of the chromosome.
Stellenbosch University http://scholar.sun.ac.za
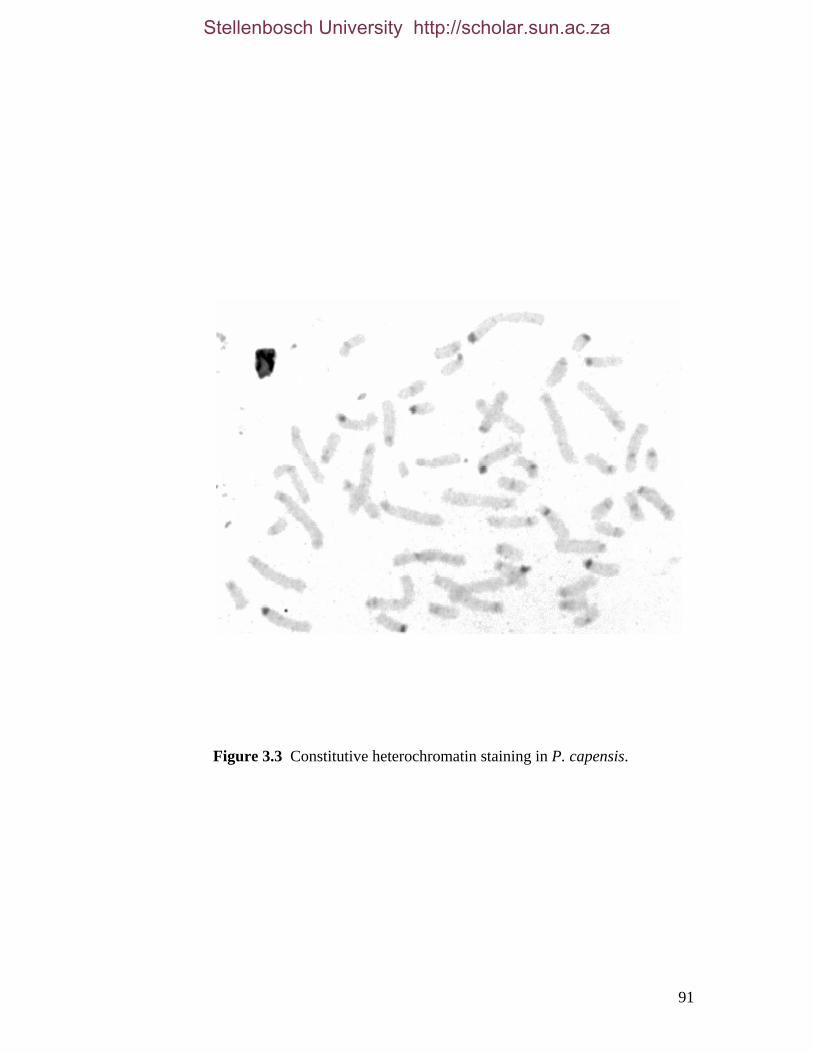
91
Figure 3.3 Constitutive heterochromatin staining in P. capensis.
Stellenbosch University http://scholar.sun.ac.za

92
Figure 3.4 Side by side comparisons of G-banded and C-banded chromosomes of the aardvark O. afer (2n=20, XY).
Stellenbosch University http://scholar.sun.ac.za
93
3.3.2 Fluorescence in situ hybridisation
3.3.2.1 Flow-sorting and assignment of paenungulate chromosomes
3.3.2.1.1 Elephant7
Chromosomes from L. africana were flow-sorted into 29 different paint probes (table 3.2)
of which 23 hybridised to a single elephant chromosome (2, 3, 5, 6, 7, 7, 8, 10, 11, 13, 15,
16, 17, 20, 21, 23, 24, 24, 25, 26, 27, X and Y) with the remaining six paints producing a
signal on more than one chromosome. In three of the latter cases (1+3, 4+5, 9+16) one of
the double signals was also available in pure form (i.e., sorted independently) facilitating
further use of these probes in FISH experiments. However, chromosomes 19 + 22 (flow
peak 21), and 12 + 14 (flow peak 27) could not be characterised as single probes and
were limited to use as a double signal. The homologues of chromosomes 7 and 24 were
each sorted separately reflecting a difference in size and/or nucleotide content which may
have been due to heterochromatic differences.
3.3.2.1.2 Hyrax
Of the 24 painting probes generated from the set of flow-sorted chromosomes of the rock
hyrax (figure 3.5), 19 hybridized to a single chromosome (no.s 1, 2, 4, 6, 7, 9, 11, 12, 13,
14, 15, 17, 18, 20, 21, 22, 23, 25, Y). Once again, homologues of certain chromosomes
(15, 16, 25) segregated into different peaks. Pure sorts of chromosomes 15 and 25 were
also isolated and pairs containing these chromosomes were consequently resolvable. Both
homologs of chromosome 16 were isolated with different chromosomes (15 and 24)
allowing for their characterisation as single markers using two-colour FISH. Two flow-
7 1) The results of the flow-sort characterisation of the elephant form part of a paper previously published:
Yang F., Alkalaeva E. Z., Perelman P. L., Pardini A. T., Harrison W. R., O’Brien P. C. M., Fu B.
Graphodatsky A. S., Ferguson-Smith M. A., Robinson T. J. (2003) Reciprocal chromosome painting among
human, aardvark, and elephant (supraorder Afrotheria) reveals the likely eutherian ancestral karyotype.
Proceedings of the National Academy of Sciences, USA. 100: 1062-1066.
2) Comparisons of chromosomes between species included in this study are done using the nomeclature
adopted by the by the International System for Human Cytogenetic Nomenclature, ISCN (1978); hence
elephant (L. africana), hyrax (P. capensis), manatee (T. m. latirostris) and aardvark (O. afer) are
abbreviated to LAF, PCA, TMA and OAF, respectively.
Stellenbosch University http://scholar.sun.ac.za
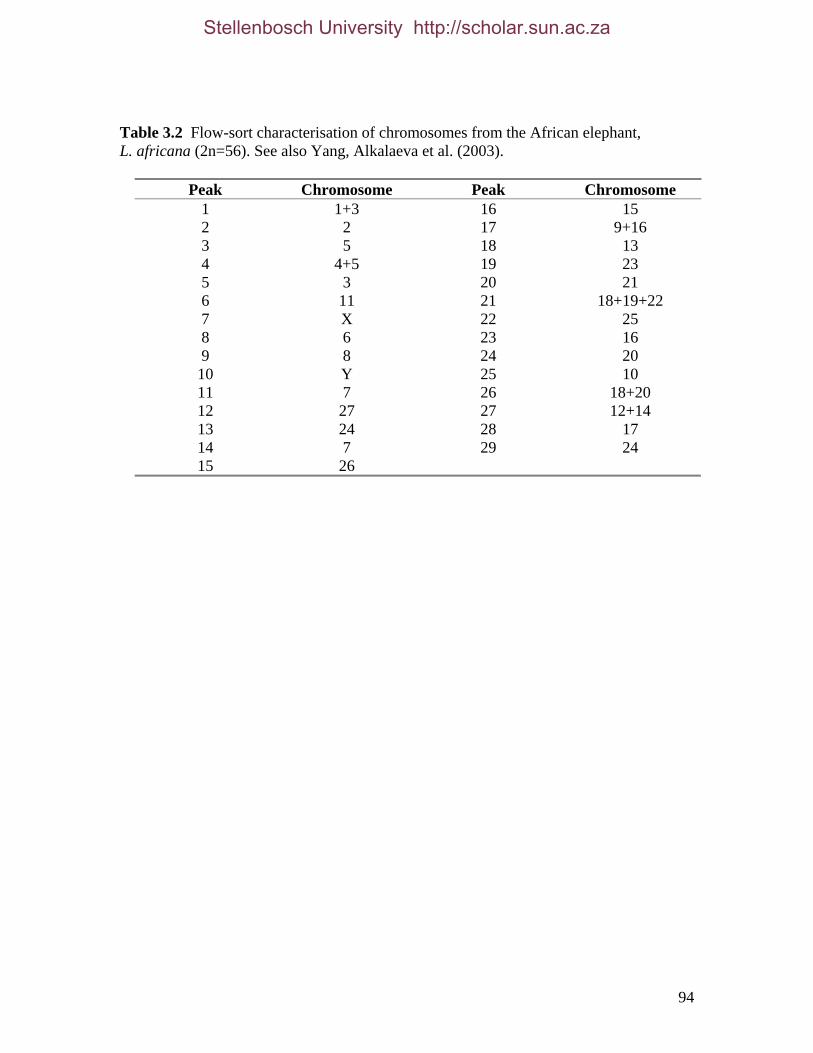
94
Table 3.2 Flow-sort characterisation of chromosomes from the African elephant, L. africana (2n=56). See also Yang, Alkalaeva et al. (2003).
Peak Chromosome Peak Chromosome 1 1+3 16 15 2 2 17 9+16 3 5 18 13 4 4+5 19 23 5 3 20 21 6 11 21 18+19+22 7 X 22 25 8 6 23 16 9 8 24 20 10 Y 25 10 11 7 26 18+20 12 27 27 12+14 13 24 28 17 14 7 29 24 15 26
Stellenbosch University http://scholar.sun.ac.za

95
0 200 400 600 800 1000 Chromomycin Fluorescence
Hoe
schs
t Flu
ores
cenc
e 0
2
00
400
600
8
00
1
000
Figure 3.5 Assignment of bivariate-sorted chromosomes of the hyrax, P. capensis (2n=54, XY) using FISH to G-banded chromosomes.
Stellenbosch University http://scholar.sun.ac.za
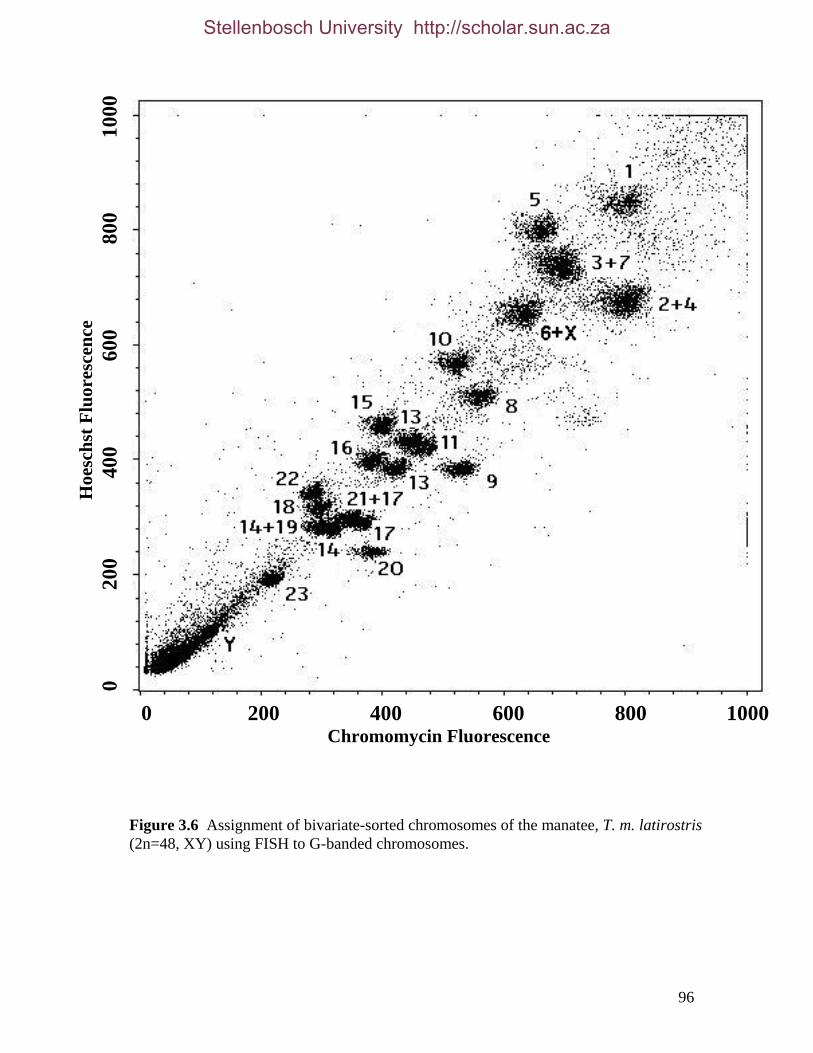
96
0 200 400 600 800 1000 Chromomycin Fluorescence 0 200 400 600 800 1000 Chromomycin Fluorescence
Hoe
schs
t Flu
ores
cenc
e 0
2
00
400
600
80
0
1
000
Figure 3.6 Assignment of bivariate-sorted chromosomes of the manatee, T. m. latirostris (2n=48, XY) using FISH to G-banded chromosomes.
Stellenbosch University http://scholar.sun.ac.za
97
peaks containing chromosomes 3+5 and 8+10 could not be resolved further.
Chromosomes 26 and the X were not present in the flow-sorted chromosomes.
3.3.2.1.3 Manatee
The 48 chromosomes of the manatee separated into 23 peaks (figure 3.6) of which 17
comprised single chromosomes (1, 5, 8-12, 14-18, 20, 20, 22-23, Y). Homologues of
chromosome 20 were present in two separate peaks. One homologue of chromosome 17
cosegregated with chromosome 21, while chromosome 19 was present in two peaks
(13+19 and 14+19). Although chromosome 19 exists with another chromosome in each
peak (13 and 14) a pure form of 14 exists which allows characterisation of chromosome
19 in interspecific hybridisations. Chromosomes 3+7, 2+4 and 6+X could not be resolved
further as single chromosome probes.
Chromosomes that were only present in mixed peaks, or not present in the flow-sort (e.g.,
hyrax X chromosome), were characterised in the subsequent zoo-FISH trials involving
multi-species comparisons. For example, hyrax chromosome 26 was not isolated during
flow-sorting yet the elephant and manatee probes that hybridise to PCA26 also hybridised
to each other, confirming that these homologies exist between all three paenungulates.
3.3.2.2 Reciprocal chromosome painting
3.3.2.2.1 Elephant
The G-banded chromosomes of the elephant with areas of homology from zoo-FISH
experiments with the hyrax and the manatee are shown in figure 3.7. The hyrax and
manatee painting probes delineated 33 and 32 conserved homologous autosomal
segments in the elephant, respectively. Twenty (2, 3, 5-9, 11-15, 17, 19-21, 23-26) and
sixteen (1-3, 7, 10-14, 16-18, 20-23) autosomal syntenic groups were apparent between
the hyrax and elephant, and the manatee and elephant, respectively. The remaining five
hyrax chromosomes (1, 4, 10, 16, 18, 22) delineated 2-3 segments each while LAF12q-
prox, LAF21q-dist and LAF20q-dist did not show any hybridisation signals when painted
with hyrax chromosomes. Seven (4, 5, 6, 8, 9, 15, 19) manatee chromosomes produced 2-
3 signals each when painted to the elephant.
Stellenbosch University http://scholar.sun.ac.za

98
Figure 3.7 G-banded metaphase chromosomes of the African elephant, L. africana with regions homologous to the manatee (right) and hyrax (left) mapped using whole chromosome painting with FISH.
Stellenbosch University http://scholar.sun.ac.za

99
LAF20q-dist did not appear to hybridise with any manatee probe. Manatee flow-peak
6+X hybridised to autosomal segments in addition to the elephant X chromosome.
3.3.2.2.2 Manatee
Areas of homology between elephant and hyrax probes to manatee metaphase
chromosomes are described in figure 3.8. Thirty-three segments (2-4, 6-13, 15, 16, 18-20,
22-27) of synteny are evident between the elephant and manatee, and 29 regions (1-9, 11-
15, 17-21, 23-26) were found between the hyrax and manatee. Elephant chromosomes 1,
5, 12, 14, 17 and 21 and hyrax chromosomes 10, 16 and 22 each produced signals on two
different chromosomes in the sirenian. Only the elephant X chromosome hybridised to
the manatee equivalent as this chromosome was not isolated during hyrax flow-sorting of
chromosomes. Hybridisation experiments with hyrax did not produce signals on regions
TMA4q-prox and TMA15q.
3.3.2.2.3 Hyrax
Hybridisation experiments of elephant and manatee painting probes to hyrax
chromosomes are depicted in figure 3.9 and yielded 32 and 29 autosomal conserved
segments, respectively. Seventeen manatee (2, 3, 5, 7, 10-19, 21-23) chromosomes and
22 elephant autosomes (2, 4-10, 12, 13, 15, 16, 18-27) and the X chromosome hybridised
in their entirety, while the remaining six manatee (1, 4, 6, 8, 9, 20) and five elephant (1,
3, 11, 14, 17) probes produced two signals each. The manatee X chromosome was flow-
sorted with chromosome 6. When this painting probe was applied to hyrax chromosomes,
a signal was produced covering the X chromosome in addition to the autosomal
segments. There are three regions present on hyrax chromosomes (10q-prox, 23p and
24p) for which no signal was detected with respect to hybridisations with both elephant
and manatee probes and may represent the missing signals on TMA15q, TMA4q-prox,
LAF12q-prox, LAF21q-dist and LAF20q-dist.
3.3.2.2.4 Aardvark
Hybridisations of painting probes of each of the three representatives of Paenungulata to
metaphase chromosome preparations of the aardvark produced similar numbers of
Stellenbosch University http://scholar.sun.ac.za
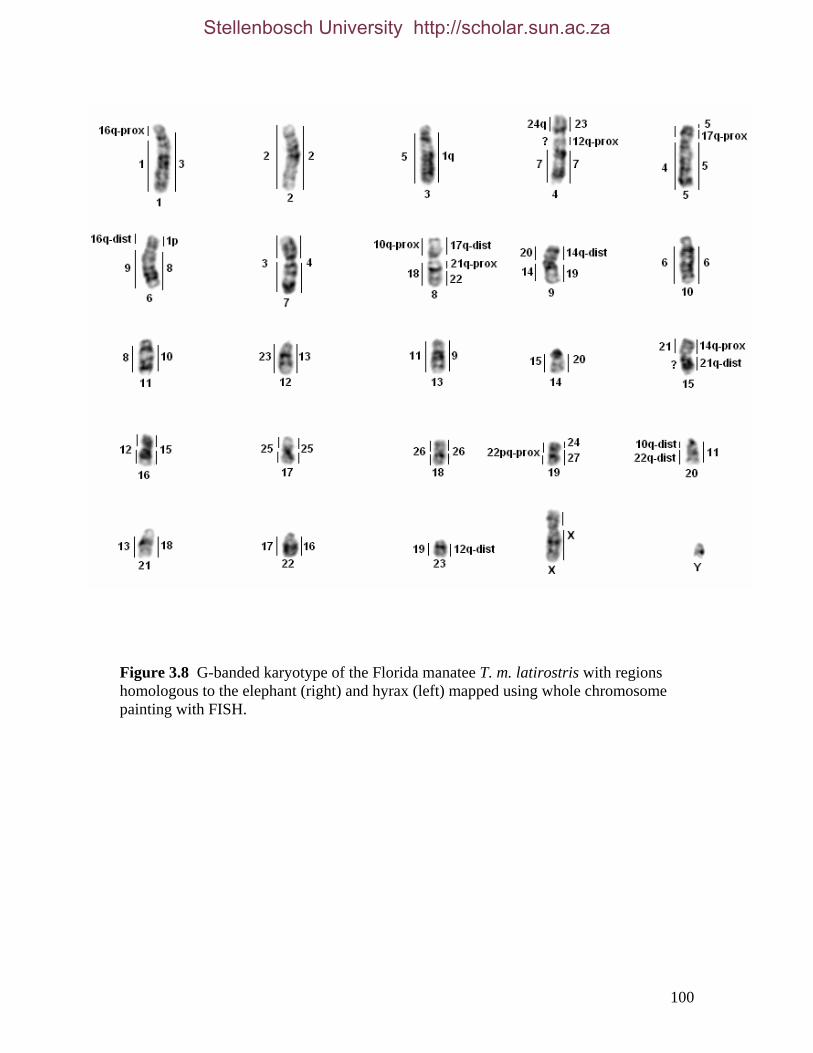
100
Figure 3.8 G-banded karyotype of the Florida manatee T. m. latirostris with regions homologous to the elephant (right) and hyrax (left) mapped using whole chromosome painting with FISH.
Stellenbosch University http://scholar.sun.ac.za
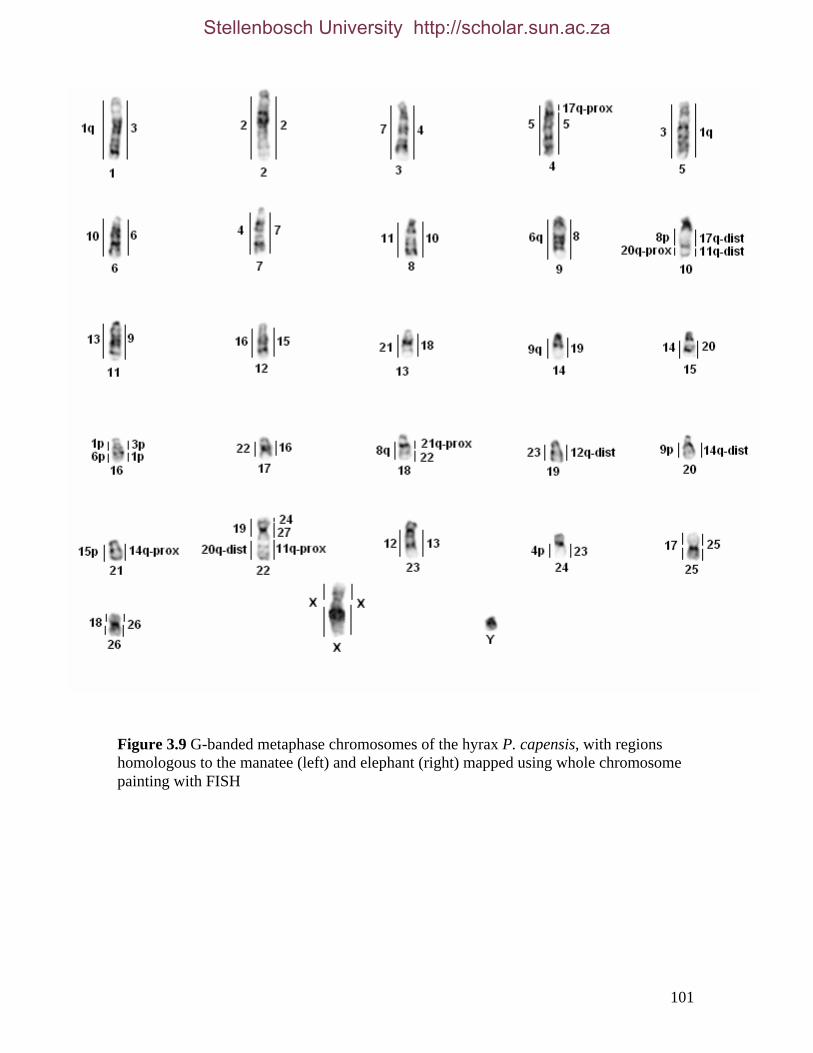
101
Figure 3.9 G-banded metaphase chromosomes of the hyrax P. capensis, with regions homologous to the manatee (left) and elephant (right) mapped using whole chromosome painting with FISH
Stellenbosch University http://scholar.sun.ac.za
102
conserved segments. These are mapped to G-banded chromosomes of the aardvark
(figure 3.10) with homologies previously obtained from human probes also shown (Yang,
Alkalaeva et al., 2003). Of the 36 different signals produced by elephant probes, 18 were
present as single signals (2-11, 15, 16, 18-20, 22-24) while the remaining nine (1, 12-14,
17, 21, 25-27) occurred in two different segments. Three (16c, 26c, 1c) of the 36 signals
delineated by the elephant were not clear from direct hybridisations but were confirmed
through multispecies comparisons. A further two signals (21i, 17i), expected from
painting results with other taxa (hyrax and manatee), were not found and also inferred
from results with other species.
Of the 32 homologous segments obtained from the hybridisation of manatee probes to
aardvark chromosomes, fourteen (1-3, 5, 7, 10, 11, 13, 14, 16, 20-23) show conserved
synteny while the remaining nine (4, 6, 8, 9, 12, 15, 17-19) yielded two separate signals.
Hybridisations of hyrax probes to aardvark delineated 33 conserved segments of which
20 (1-9, 11-15, 17-21, 24) produced a single signal, five (10, 16, 23, 25, 26) produced
two signals and a single chromosome (22) was found to hybridise to three different
aardvark chromosomes. Three different segments (26i, 26i, 17i) were not obtained
directly during hybridisation trials; chromosome 26, like the X chromosome was not
isolated during flow-sorting for the hyrax while 17 was inferred through multispecies
comparisons. A further signal which was not clear through direct hybridisations was
confirmed through multi-species comparisons (16c).
All three paenungulate species did not hybridise to a small section on the q-arm of
aardvark chromosome 1; and in addition, paints showed limited hybridisation to the
syntenic section of OAF3p. Confirmation of the latter result was through previous work
(Yang, Alkalaeva et al., 2003). A segment on OAF2q corresponding to the homologous
regions of LAF21q-dist and TMA15q which did not yield signals during hybridisation
trials with the hyrax, was also not detected during hyrax to aardvark hybridisations. The p
and q arms of TMA15 differed considerably in the intensity of their hybridisations to
elephant chromosomes. Since these chromosome arms form part of the same painting
probe and hence are subject to similar technical procedures, their differences in
Stellenbosch University http://scholar.sun.ac.za

103
Figure 3.10 G-banded chromosomes of the aardvark, O. afer (2n=20) with regions of homology (right of aardvark chromosomes) delimited by FISH to the elephant, manatee and hyrax (from left to right). Correspondence with human chromosomes is shown to the left of the aardvark chromosomes and is taken from Yang, Alkalaeva et al. (2003). Positions of break-points are indicated to the left of human and each subdivided region is marked (a-i).
Stellenbosch University http://scholar.sun.ac.za
104
hybridisation efficiency are more likely to reflect differences in homology. Consequently,
the absence of a signal between hyrax and TMA15q may be indicative of a further
reduction in homology in comparison to the elephant and manatee. A similar situation is
also apparent with regards to the missing signal to OAF1qg (from all paenungulates).
Based on Yang, Alkalaeva et al. (2003), the missing signal is expected from LAF20
which also produces a signal on OAF1pbc. In contrast to the missing signal, the
hybridisation to OAF1qbc produces an intense signal, suggesting problems of homology
as indicated in the previous example between hyrax and TMA15q. Differences in
hybridisation efficiency may be due to biological (homology) or technical factors such as
differential amplification and labeling during DOP-PCR. However, that the missing
hyrax hybridisations were evident among all paenungulate comparisons, suggests that
biological reasons are the predominant factor leading to reduced hybridisation efficiency.
Examination of the chromosome painting data (character matrix, appendix 6) revealed no
synapomorphies for intra-paenungulate relationships, as indicated by the polytomy
obtained from the MP analysis (figure 3. 11). However, synapomorphic changes specific
to Paenungulata and unique rearrangements for each of the three paenungulate orders
(described below) were characterised and mapped to the MP tree.
Examples of cross-species chromosome painting using painting probes developed
specifically for this investigation are presented in figure 3.12.
3.3.2.3 Comparison to previous studies
Comparison of the results obtained in this study to previous comparative painting trials
(Frönicke, Wienberg et al., 2003; Yang, Alkalaeva et al., 2003) show differences in the
identification of specific chromosomes as well as variation in homology assignments
(table 3.3). Differences in the identification of G-banded chromosomes are likely to
occur, particularly if there are strong similarities in the banding patterns. Alternative
assessments (second opinion) of the ambiguous G-band assignments in this study were
obtained to confirm identification. Regarding zoo-FISH experiments however, an
important concern is that within a particular study there is consistency between
Stellenbosch University http://scholar.sun.ac.za
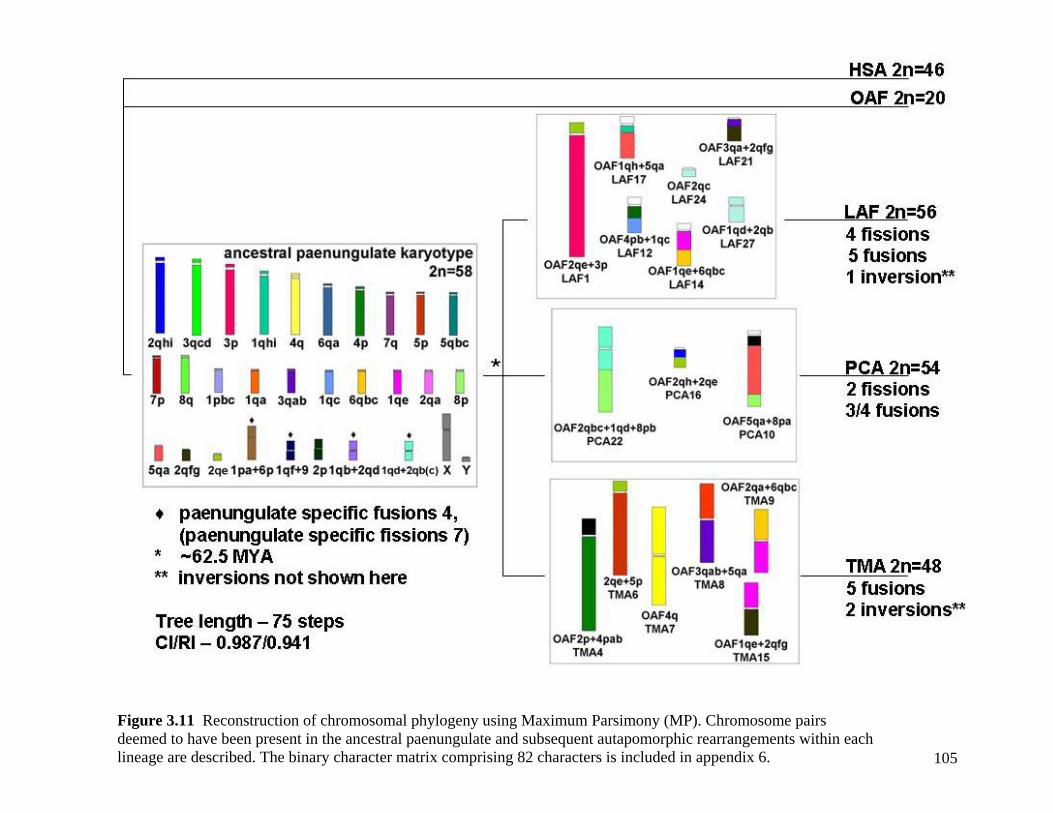
105
Figure 3.11 Reconstruction of chromosomal phylogeny using Maximum Parsimony (MP). Chromosome pairs deemed to have been present in the ancestral paenungulate and subsequent autapomorphic rearrangements within each lineage are described. The binary character matrix comprising 82 characters is included in appendix 6.
Stellenbosch University http://scholar.sun.ac.za
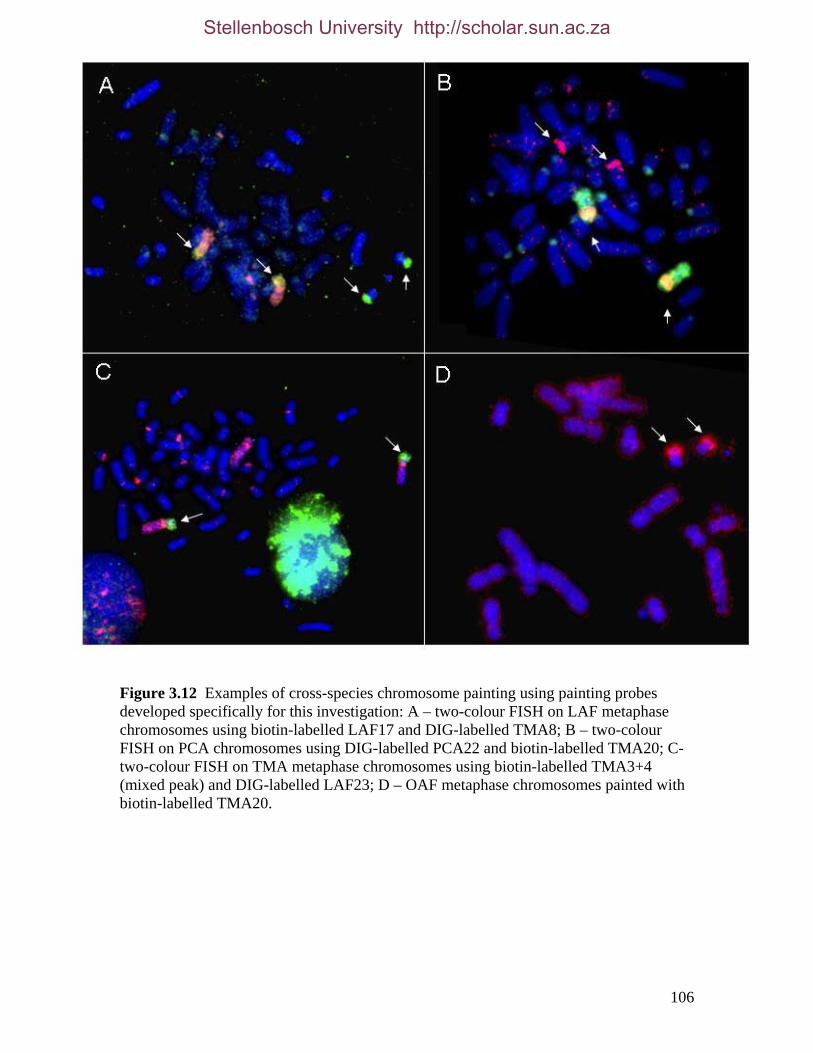
106
Figure 3.12 Examples of cross-species chromosome painting using painting probes developed specifically for this investigation: A – two-colour FISH on LAF metaphase chromosomes using biotin-labelled LAF17 and DIG-labelled TMA8; B – two-colour FISH on PCA chromosomes using DIG-labelled PCA22 and biotin-labelled TMA20; C- two-colour FISH on TMA metaphase chromosomes using biotin-labelled TMA3+4 (mixed peak) and DIG-labelled LAF23; D – OAF metaphase chromosomes painted with biotin-labelled TMA20.
Stellenbosch University http://scholar.sun.ac.za
107
assignment of chromosome flow-sorts and the identification of these based on G-banding.
Both processes were performed here, reducing the likelihood of this problem.
The majority of discrepancies between the hybridisation results among the three studies
involve small hybridisation signals (table 3.3, no.s 8-13). The level of resolution and
quality of signal obtained between zoo-FISH experiments may vary considerably due to
differences in experimental approach, chromosome preparations and quality of painting
probes, for example. A possible solution to resolving differences might be to consider the
result favoured by two of the studies to be the most likely outcome. However, zoo-FISH
is not a perfect technique and with further cross-species painting and improvements in
techniques, it would be expected that the discrepancies evident here will also be resolved.
The majority of differences in homology designations between the three different studies
are not of great consequence in terms of identifying synapomorphies, with the exception
of LAF27 + HSA2/3 (table 3.3 no.13, figure 3.13). LAF27/24 corresponds to TMA19
and PCA22pqprox, and when comparing among paenungulates following the Yang,
Alkalaeva et al. (2003) result, one possible interpretation of the chromosomal
rearrangements is as a synapomorphy for a manatee-hyrax association. Specifically, the
presence of fused segments OAF1qd and OAF2qc in both the manatee and hyrax but not
the elephant (remembering that OAF2qc does not contain LAF27 according to Yang,
Alkalaeva et al., 2003). However, this does not take into account the polarity of the
change, and when considering the outgroups (and the putative paenungulate ancestor, see
below), this result can be explained differently. Here the most parsimonious explanation
for the order of events that lead to the three respective paenungulate karyotypes is a
fusion of segments OAF1qd and OAF2qc in the paenungulate ancestor, followed by a
fission in the elephant, an additional fusion in the hyrax and no apparent further change in
the lineage leading to the manatee.
Given that the part of TMA19 that is in conflict with Yang, Alkalaeva et al. (2003)
borders a centromere, there is the possibility that non-specific hybridisation with
repetitive DNA may have occurred. However, amplification of species-specific repetitive
Stellenbosch University http://scholar.sun.ac.za
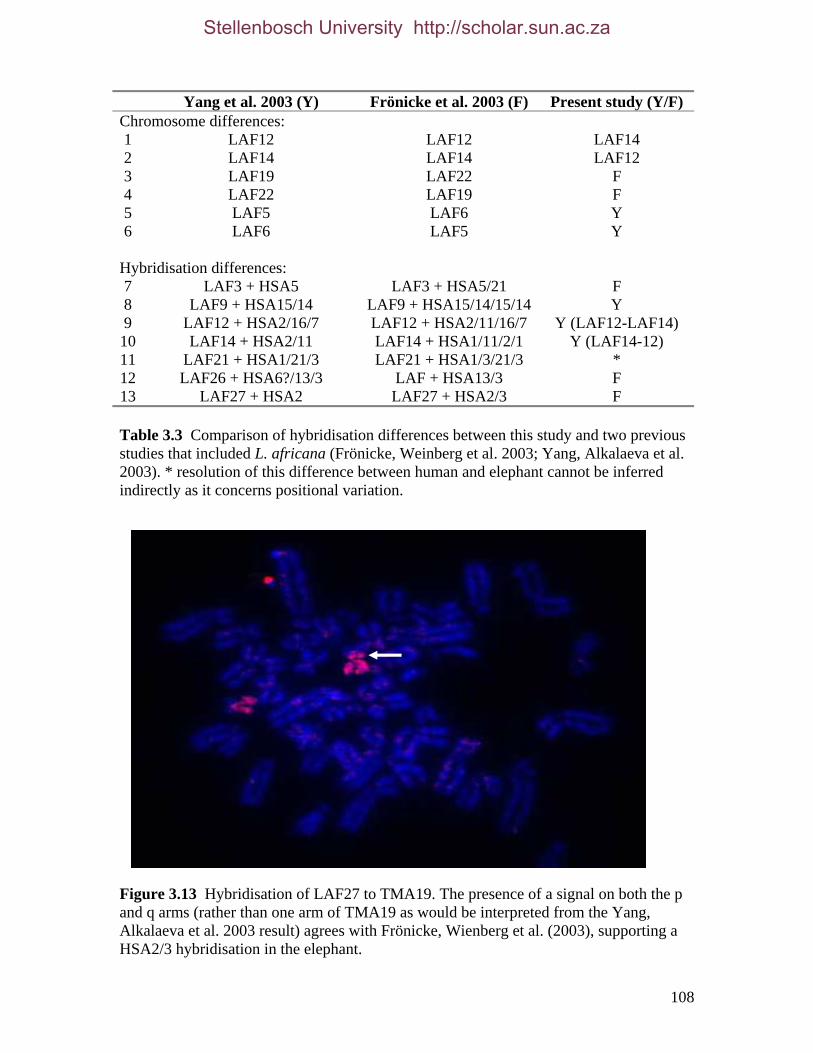
108
Yang et al. 2003 (Y) Frönicke et al. 2003 (F) Present study (Y/F) Chromosome differences: 1 LAF12 LAF12 LAF14 2 LAF14 LAF14 LAF12 3 LAF19 LAF22 F 4 LAF22 LAF19 F 5 LAF5 LAF6 Y 6 LAF6 LAF5 Y
Hybridisation differences: 7 LAF3 + HSA5 LAF3 + HSA5/21 F 8 LAF9 + HSA15/14 LAF9 + HSA15/14/15/14 Y 9 LAF12 + HSA2/16/7 LAF12 + HSA2/11/16/7 Y (LAF12-LAF14) 10 LAF14 + HSA2/11 LAF14 + HSA1/11/2/1 Y (LAF14-12) 11 LAF21 + HSA1/21/3 LAF21 + HSA1/3/21/3 * 12 LAF26 + HSA6?/13/3 LAF + HSA13/3 F 13 LAF27 + HSA2 LAF27 + HSA2/3 F Table 3.3 Comparison of hybridisation differences between this study and two previous studies that included L. africana (Frönicke, Weinberg et al. 2003; Yang, Alkalaeva et al. 2003). * resolution of this difference between human and elephant cannot be inferred indirectly as it concerns positional variation. Figure 3.13 Hybridisation of LAF27 to TMA19. The presence of a signal on both the p and q arms (rather than one arm of TMA19 as would be interpreted from the Yang, Alkalaeva et al. 2003 result) agrees with Frönicke, Wienberg et al. (2003), supporting a HSA2/3 hybridisation in the elephant.
Stellenbosch University http://scholar.sun.ac.za

109
DNA is unlikely due to the deep separation time among paenungulates. Further, although
repetitive DNA hybridisations were clear during intraspecific hybridisations during
characterisation of flow-sorted chromosomes, similar patterns were not evident during
zoo-FISH trials.
3.3.2.4 Chromosomal evolution within Paenungulata
3.3.2.4.1 The ancestral karyotype
Comparative analysis of the distribution of chromosomal rearrangements between the
paenungulates and the two outgroup taxa (aardvark, human) enabled the construction of a
putative ancestral paenungulate karyotype (APK; figure 3.11). This karyotype is
representative of a paenungulate ancestor just prior to the divergence of Proboscidea,
Hyracoidea and Sirenia, and allows for inferences on chromosomal evolution within this
group relative to non-paenungulate afrotherian taxa. It is hypothesised that the APK has a
higher diploid number of chromosomes (2n=58) than any of the extant representatives of
this group studied to date. Comparison of rearrangements across all three lineages
observed in this study reveals that there are a majority of fusions (13/14) in contrast to
fissions (6). Although closest in diploid number to the APK, L. africana has undergone
four fissions and five fusions to form the 2n=56 karyotype. Hyrax chromosomal changes
display a majority of fusions (3/4) over fissions (2) relative to the APK; however, due to
the uncertainties, the final number of changes using this approach cannot be completely
determined. Changes between the karyotype of the APK and the manatee are
characterised by five fusions and one change involving an inversion/centromere
repositioning (Amor, Bentley et al., 2004; Ventura, Weigl et al., 2004; Montefalcone,
Tempesta et al., 1999).
3.3.2.4.2 Paenungulate-specific syntenies
To obtain an estimate of the extent of chromosomal evolution occurring in the lineage
leading to Paenungulata, a comparison of the APK to that of the last common ancestor of
all other afrotherians would be required. However, construction of an afrotherian
ancestral karyotype, based on data from comparative painting, is not yet possible as data
for Tenrecomorpha is outstanding. Although the aardvark represents an extant
Stellenbosch University http://scholar.sun.ac.za
110
tubulidentate karyotype, it has been proposed that this species has retained a karyotype
that is likely most similar to that of the last common eutherian ancestor (Yang, Alkalaeva
et al., 2003), suggesting that it is conserved. Phylogenetic reconstructions of mammalian
phylogenetic relationships using nucleotide sequence data (Kitazoe, Kishino et al., 2005;
Amrine-Madsen, Koepfli et al., 2003) place the aardvark as the sister taxon to
Paenungulata. However, previous studies also indicate a close relationship between the
aardvark and elephant-shrew (Robinson, Fu et al., 2004), the elephant-shrew and
Paenungulata (Waddell and Shelley, 2003), the aardvark with a paraphyletic Afrosoricida
(Waddell and Shelley, 2003), the aardvark as sister-taxon to Afroinsectivora (Murphy,
Eizirik et al., 2001b; Waddell, Kishino et al., 2001) and the aardvark with Afrosoricida
(Nishihara, Satta et al., 2005). Consequently, the identification of a sister-taxon to the
paenungulates is uncertain. The aardvark was selected as the paenungulate sister-taxon,
based on the results from the largest sequence concatenation (including all three
paenungulate taxa) available at the onset of this study (Murphy, Eizirik et al., 2001b), to
estimate the extent of chromosomal evolution between Paenungulata and
Afroinsectiphillia. Paenungulate-specific synapomorphies were identified and their
specificity to this group was checked by previous comparisons with golden mole and
elephant shrew (Robinson, Fu et al., 2004). Confirmation of these syntenies is pending
examination of the final member of Afrotheria, Tenrecomorpha, with comparative
chromosome painting, and missing data from elephant shrew-aardvark comparisons.
A minimum estimate of 10 chromosomal changes (six fissions and four fusions) specific
to Paenungulata were identified. The syntenic associations (see figures 3.10 and 3.11,
appendix 6) include OAF6p+1pa (HSA18/19q), OAF9q+1qf (HSA8p/22q),
OAF1qd+2qb (HSA2pqprox/3) and OAF1qb+2qd (HSA3q/13) and the fissions
OAF1pa/1pb, OAF1qa/1qb, OAF 2qd/2qe, OAF2qe/2qf, OAF3qb/3qc and OAF5qa/5qb.
These were verified against data for other mammalian taxa (Frönicke, 2005). OAF6p+1pa
represents a fusion between the short arms of aardvark chromosomes 1 and 6,
OAF9q+1qf a fusion of a small segment on aardvark chromosome 1q and the whole of
chromosome 9, while the third synapomorphy unique to this group involves a fusion of
segments on the long arms of aardvark chromosomes 1 and 2. These overlap with three of
Stellenbosch University http://scholar.sun.ac.za

111
the eight previously reported (Yang, Alkalaeva et al., 2003) elephant-specific segmental
associations (HSA 3/6, 18/19, 4/15, 2/16/7, 2/11, 4/16/19, 8/22 and 6/13/3). Further,
segmental combinations (HSA3/21, 7q/16, 12/22a, 14/15, 16q/19q) that are found to be
conserved across the four mammalian supraordinal groupings were present in all three
paenungulate taxa. The segmental associations of HSA3/5/21 and 1/19p, were reported
by Robinson, Fu et al., (2004) as afrotherian-specific syntenies with a loss of
chromosomes five in the elephant. HSA1/19p was evident in all three paenungulates in
this study however, a fission within the HSA21 portion of the HSA3/5/21 synteny was
found as by Frönike, Weinberg et al., (2003), modifying this syntenic association to
HSA3/21 + HSA21/5 (OAF2qhi + OAF2qfg). This rearrangement was also present in the
manatee and hyrax8 indicating that this fission likely represents a change that occurred in
the APK and hence, is an additional synapomorphy for Paenungulata.
Within L. africana, P. capensis and T. m. latirostris, five, three and five specific
associations were found respectively. Elephant-specific syntenies HSA3/6, 4/15, 2/16/7,
2/11 reported in Yang, Alkalaeva et al. (2003) were confirmed but not 6/13/3. The
presence of HSA6 on LAF26 was ambiguous in the original study and was not found
here. Further, 2/11 involves an unclear designation in the hyrax and may be excluded
with the addition of new data. Syntenies found in the hyrax include OAF5qa+8pa
(HSA15/17), OAF1qd+8pb (HSA2pqprox/17) and OAF2qh+2qe (HSA3/21) and those
specific to the manatee comprise OAF2p+4pb (HSA11/20), OAF2qe+5p (HSA3/7),
OAF5qa+3qab (HSA1/15), OAF6qc+2qa (HSA7/16p/3) and OAF1qe+2qg
(HSA2pqprox/21). It is important to note that these are inferred through hybridisations
between human and aardvark, hence the exact (positional) homologies require
confirmation. These comparisons are of interest to gain insight into chromosomal
evolution within Afrotheria but are also reported here, using human chromosome
syntenies, in order to follow standard nomenclature and to allow for comparisons to
previous studies including afrotherians.
8 The hyrax displays a further (derived) fission within HSA21/5; data corresponding to HSA3/21 (LAF1p/21) is missing for this taxa and hence inferred.
Stellenbosch University http://scholar.sun.ac.za
112
3.3.2.4.3 Rates of chromosomal evolution
Characterisation of the number of unique changes within each paenungulate lineage
facilitates the approximation of taxon specific rates of evolution within Paenungulata
(Springer, Murphy et al., 2003b; Waddell, Cao et al., 1999a). Although estimates of
evolutionary rate among taxa are dependent on several factors (e.g., generation time)
calculation of the number of changes observed over a defined period of time enables a
comparison of the tempo of chromosomal evolution among different lineages (Dobigny,
Aniskin et al., 2005). Using this approach, a comparison of these rates indicates an
elevated rate for the elephant (0.14 changes per MY) in comparison to the hyrax
(0.09/MY) and manatee (0.08/MY) and are in agreement with the “default rate” of
mammalian chromosomal evolution estimated at one change per 10 million years
(Weinberg, 2004; O'Brien and Stanyon, 1999), although a more recent calculation sets
this value at 1.9 changes per 10 million years (Frönicke, 2005). However, estimates of
chromosomal rates deduced from zoo-FISH experiments vary considerably within
Eutheria. Elevated rates (5.8-33.3 changes/MY) have been observed within, for example,
Carnivora (Nash, Menninger et al., 2001), Perissodactyla (Yang, Fu et al., 2003),
primates (Müller, Hollatz et al., 2003), Cervidae (Yang, Obrien et al., 1997) and Muridae
(Volobouev, Aniskin et al., 2002). In contrast, much reduced rates of evolution have been
described from Rhinocerotidae (one change over 17 MY, Trifonov, Yang et al., 2003)
and Xenarthra (0.2-0.4 changes/MY, Dobigny, Yang et al., 2005), to which rates
estimated within Paenungulata are similar. Consequently, the chromosomal rates of
evolution within this clade are best described as slow to moderate in comparison to
several other mammalian groups.
3.3.2.4.4 G-band chromosome comparison based on FISH homology
A comparison of homologous chromosomes and chromosomal segments among
paenungulates (figure 3.14) indicates that the majority of whole chromosomes or
chromosome arms have also maintained good G-band homology. Where differences
occur, the changes, based on the level of resolution here, appear to be characterised by
minor rearrangements. Chromosomes that do not show characterisable G-band similarity,
often comprise autapomorphic rearrangements, for example, PCA16 and LAF12.
Stellenbosch University http://scholar.sun.ac.za

113
Figure 3.14 Comparison of G-banded chromosomes of the elephant (E), hyrax (H) and manatee (M). Numbers correspond to chromosomes in the standard karyotypes of the respective species. Horizontal bars indicate homologies as assessed by FISH. Where no bars are indicated, the G-band similarity is not obvious although chromosomal homology has been defined by FISH.
Stellenbosch University http://scholar.sun.ac.za
114
Further, in the comparison between LAF6, PCA6 and TMA10 there appears to be a
difference between the number of bands between TMA10q-dist and the corresponding
region of the other two paenungulates. The FISH results indicate complete homology of
the q-arm across all three taxa and furthermore, no C-positive regions were detected. This
suggests that this difference may be due to variation in spatial organisation, differences in
the relative compression of the chromosomes, or minor, undetectable heterochromatic
variation. Additionally, rearrangements detected with FISH that appear to be inversions
could not be unambiguously defined as such. These may potentially involve centromere
repositioning (Amor, Bentley et al., 2004; Ventura, Weigl et al., 2004; Montefalcone,
Tempesta et al., 1999) without an inversion since the banding patterns do not
convincingly support the latter. Although G-banding is an indirect assessment of
homology and differences have been shown not necessarily to reflect underlying gene
order evolution (Raudsepp and Chowdhary, 1999), the degree of homology that appears
to be maintained at the intrachromosomal level across all three taxa may be considered
further evidence of a low rate of evolution within Paenungulata.
3.3.2.4.5 Genome evolution within Paenungulata
Although FISH was performed on a single representative of each paenungulate order, the
availability of cytogenetic data for other extant paenungulates enables an approximate
intraordinal assessment of chromosomal evolution relative to the APK. In addition to
Loxodonta, Proboscidea comprises the genus, Elephas, represented by the Asian
elephant, E. maximus. The G-banded karyotype (2n=56) of E. maximus (Houck,
Kumamoto et al., 2001) is very similar to that of L. africana with differences limited to
heterochromatic and minor intrachromosomal variation indicating that almost no large
chromosomal changes have occurred since their divergence approximately six million
years ago (Vignaud, Duringer et al., 2002).
Within Hyracoidea, G-banded karyotypes exist for Heterohyrax brucei (2n=54) and
Dendrohyrax arboreus (2n=54, Prinsloo and Robinson, 1991) and show good
correspondence to the karyotype of P. capensis. In particular, the chromosomes of P.
capensis and H. brucei show a high degree of similarity both with G- and C-banding
Stellenbosch University http://scholar.sun.ac.za

115
(Prinsloo, 1993). In contrast D. arboreus displays differences most apparent in the
distribution of heterochromatin. Whereas P. capensis and H. brucei C-positive material is
limited to the centromeres, several D. arboreus autosomes have prominent
heterochromatic short arms as well as terminal blocks of heterochromatin (Prinsloo and
Robinson, 1991). Although a number of mechanisms have been suggested to explain the
evolution of heterochromatic DNA (e.g., replication slippage, rolling circle replication,
conversion-like mechanisms, Redi, Garagna et al., 2001), it is unclear without further
investigation how heterochromatin evolution might have proceeded in D. arboreus.
Based on the earliest fossil finds, a middle-late Miocene origin (~10-14 MYA) has been
suggested for the origin of the modern family Procaviidae which includes all three extant
genera and the extinct genus Gigantohyrax (Rasmussen, Pickford et al., 1996). Within the
radiation of modern hyracoids, a basal position is indicated by the fossil record for
Heterohyrax, with Dendrohyrax as the derived genus (McKenna and Bell, 1997, p. 491).
Further, estimates based on molecular data suggest a similar divergence time of 12.5-13.6
MYA between Procavia and Dendrohyrax (Springer, 1997). The level of karyotype
conservation between H. brucei and P. capensis apparent since their divergence is
consistent with the reduced rate of chromosomal evolution within Hyracoidea as
indicated by the chromosome painting data. However, a middle-late Miocene origin
provides ample opportunity for Dendrohyrax specific changes to occur. That these
changes may be associated with the divergence event (e.g., Wichman, Payne et al., 1991)
is also a consideration as although satellite sequences can remain dormant for extended
periods, they are also capable of dynamic evolutionary changes (Ugarkovic and Plohl,
2002).
Of all extant paenungulates for which cytogenetic data are available, the sirenians exhibit
the greatest variation in chromosome number (2n=48-56). In addition to the Florida
manatee (2n=48) examined in this study (Gray, Zori et al., 2002), cytogenetic data are
available for a further two of the four extant species comprising Sirenia: the amazonian
manatee, Trichechus inunguis (2n=56, Assis, Best et al., 1988) and the dugong, Dugon
dugon (2n=50, White, Harkness et al., 1976). Both G- and C-banding for the Amazonian
manatee are available for comparison to the Florida manatee. Although C-banding
Stellenbosch University http://scholar.sun.ac.za
116
patterns are restricted to the centromere for both species (Gray, Zori et al., 2002; Assis,
Best et al., 1988), differences between G-banding patterns indicate more extensive
changes. In particular the difference in chromosome number indicates that at least four
chromosomal changes separate these two taxa. Phylogenetic analysis of mitochondrial
DNA control region sequence data shows that T. inunguis and T. manatus diverged
approximately four million years ago which is also in agreement with fossil evidence
(Catanhede, Da Silva et al., 2005)9. This indicates that a far greater degree of
chromosomal change (1 change/MY) is evident over the last four million years in Sirenia
in comparison to that seen within each of the paenungulate lineages since their
divergence. Although the step-wise pattern of rearrangements occurring between T.
manatus and T. inunguis is unknown, there is evidence from interstitial telomeric signals
(ITSs) to suggest that this repatterning is more likely to be associated with T. inunguis.
ITSs have been interpreted as relics of previous chromosome rearrangements in mammals
(Dobigny, Ozouf-Costaz et al., 2003; e.g., Nash, Menninger et al., 2001; Meyne, Baker
et al., 1990); consequently, the lack of interstitial telomeric signals in T. manatus (this
study, data not shown) does not favour chromosomal change in this lineage.
A minimal estimate of the rate of chromosomal evolution in the ancestral paenungulate,
i.e., prior to the divergence of Hyracoidea, Proboscidea and Sirenia, was calculated using
the minimum number of changes uniquely present in Paenungulata (11) and the 17.5
million year time period separating the divergence of the ancestral paenungulate from
Afroinsectiphillia (~80 mya) and the radiation of the paenungulates (Springer, Murphy et
al., 2003b). A rate of 0.63 changes/MY is obtained which, although not as high as
estimates apparent in other placental mammals, is approximately 4 to 5 times that of the
fastest rate seen within paenungulates. Using these estimates of rates of change, a pattern
of paenungulate chromosomal evolution spanning 80 million years can be described. This
entails a reduction in the rate of chromosomal evolution within Paenungulata relative to
the ancestral paenungulate which is maintained across all three lineages with the
9 A more recent estimate based on cytochrome b places the T. manatus and T. inunguis divergence within the last million years (Vianna, Bonde et al., 2005). Although this is considerably different to ~4 MYA estimate it still indicates a recent increase in rate of chromosomal evolution within Sirenia.
Stellenbosch University http://scholar.sun.ac.za

117
exception of increased repatterning evident in the the last four million years of sirenian
evolution.
The maintenance of a similarly slow to moderate rate of chromosomal evolution in all
three paenungulate lineages is surprising in light of their extensive diversification. An
association between rates of chromosomal evolution and molecular evolution has been
observed (Marques-Bonet and Navarro, 2005; Eichler and Sankoff, 2003); specifically,
genomic regions with increased repatterning present higher rates of synonomous and non-
synonomous substitution (Marques-Bonet and Navarro, 2005). A comparison of
molecular rates of evolution within nuclear DNA between paenungulates and eight other
mammalian orders using relative differences in edge lengths indicates slowest rates
overall in the elephant and manatee with intermediate rates in the hyrax (Chapter 2).
Although this provides an approximate indication of overall molecular rates within
Paenungulata, it may explain the slow to moderate rates of chromosomal evolution
estimated by zoo-FISH. Furthermore, there is the proposed negative correlation between
rates of molecular evolution and generation time and body size at four-fold degenerate
nucleotide sites (but see Springer, Murphy et al., 2003b; Bromham, Rambaut et al.,
1996). Increases in body size are evident in all three paenungulate lineages (Shoshani,
1998; Gheerbrandt, Sudre et al., 1996; Rasmussen, Pickford et al., 1996) relative to that
estimated for the ancestral paenungulate (Gheerbrandt, Sudre et al., 1996) and may
account for the reduction and subsequent maintenance of a slower rate across all three
orders. Although changes in body size can be measured using fossil evidence, aspects of
biology/life-history such as generation time, are not as easily quantifiable and
consequently difficult to assess. Understanding the potential contribution (and
interconnectedness) of diverse factors to molecular evolution is not straightforward
(Bromham, Rambaut et al., 1996) and is further complicated where, as in the case of
Paenungulata, extensive differentiation has occurred following speciation.
In contrast to the apparent conservation of similar rates among the three paenungulate
lineages, is the elevated chromosomal rate evident between the Florida and Amazonian
manatees over the last four million years. A possible explanation concerns the pattern of
Stellenbosch University http://scholar.sun.ac.za
118
evolutionary change over time within a lineage. The presence of non-uniform
evolutionary rates at different levels across the genome (Marques-Bonet and Navarro,
2005 and references therein) is compelling evidence against a clock-like mode of
chromosomal evolution. Consequently, the rate of evolution will be variable over time,
resulting in periods of increased chromosomal repatterning alternating with periods of
reduced change. Information on the occurrence of these periods of increased or reduced
chromosomal evolution is lost as the method of characterising chromosome
rearrangements “averages out” this process. Despite this drawback, examples of
extensive genome repatterning over short time periods have been recorded and as
expected, most examples are apparent in lineages with relatively increased rates of
evolution. In particular, these periods of elevated chromosomal evolution have been
reported in association with, or leading to speciation events (Dobigny, Aniskin et al.,
2005; Navarro and Barton, 2003; Volobouev, Aniskin et al., 2002; Nash, Menninger et
al., 2001; Britton-Davidian, Catalan et al., 2000). Within Sirenia, the period of increased
chromosomal evolution corresponds to the divergence of T. inunguis and T. manatus
approximately four MYA and consequently might represent a phase of increased
chromosomal evolution in contrast to a stage where fewer changes have occurred,
providing an “evolutionary snapshot” of sirenid evolution.
3.4 CONCLUSION
Chromosome rearrangement data obtained using zoo-FISH were found to be constructive
for building a profile of genome evolution within Paenungulata spanning a period of ~80
MY. Chromosomal rearrangements unique to Paenungulata as well as autapomorphic
changes within each lineage were identified. However, synapomorphic changes uniting
any two paenungulates were not detected. Based on the divergence estimate of ~62.5
MYA (Springer, Murphy et al., 2003b) and the appearance of the first primitive
paenungulate a proboscidean, Phosphatherium escuilliei 55-58 MYA (Thanetian age,
Gheerbrandt, Sudre et al., 1996), a period of 4-7 million years is estimated for the
radiation of Paenungulata. In contrast, the divergence between T. manatus and T.
inunguis (~4 MYA), displays a greater level of chromosomal rearrangement than that
Stellenbosch University http://scholar.sun.ac.za
119
evident within the paenungulate divergence. The absence of synapomorphic changes
uniting any two paenungulates indicates that the divergence of Paenungulata is not
associated with significant chromosomal repatterning and consequently does not seem to
be coincident with a period/pulse of increased rate of chromosomal change as suggested
for the recent trichechid divergence and as described in other mammalian taxa. However,
this does not imply that chromosomal repatterning was completely absent but that it has
not been characterised at the level of resolution applied here. The reconstruction of the
APK allowing a rate of chromosomal change within the ancestral paenungulate to be
estimated, indicates that rates of chromosomal evolution were likely elevated prior to the
paenungulate divergence. Despite the extensive diversification within each lineage, the
reduction in evolutionary rate following divergence appears to have been maintained
across all three lineages and is also evident through conserved G-banding patterns.
Further, a comparison to other mammalian taxa indicates that chromosomal evolution
within Paenungulata is best characterised as slow to moderate.
Consequently, the delineation of chromosomal rearrangements among Hyracoidea,
Proboscidea and Sirenia through chromosome painting does not provide further insight
into phylogenetic associations within this polytomy. However, it has been possible to
establish that this limitation is due to a reduced rate of chromosomal evolution (in
comparison to both the ancestral paenungulate and other mammalian taxa) in
combination with the rapid radiation (Nishihara, Satta et al., 2005; Waddell, Kishino et
al., 2001; Amrine and Springer, 1999) suggested for this clade.
Stellenbosch University http://scholar.sun.ac.za

120
CHAPTER 4 - SUMMARY AND CONCLUDING REMARKS
Although much success has been obtained using molecular approaches to resolve
mammalian ordinal relationships, a few nodes remain problematic including
Paenungulata (Murphy, Pevzner et al., 2004; Springer, Murphy et al., 2003b; Waddell,
Kishino et al., 2001). The monophyly of Hyracoidea, Proboscidea and Sirenia is
contentious among morphologists with the hypothesis of Tethytheria (manatee and
elephant - M+E, McKenna, 1975), resulting in the exclusion of Hyracoidea, being
generally favoured. Paenungulata is well established on a molecular basis (e.g., Amrine-
Madsen, Koepfli et al., 2003; Nikaido, Nishihara et al., 2003; Waddell and Shelley,
2003), however intra-ordinal relationships are ambiguous with conflicting results from
mtDNA and nDNA data sets (Nishihara, Satta et al., 2005; Amrine-Madsen, Koepfli et
al., 2003; Murata, Nikaido et al., 2003). The morphological hypothesis of Tethytheria is
well supported by amino acid level analysis of 12 mtDNA protein-coding genes (Murata,
Nikaido et al., 2003). In contrast, large molecular data sets comprising mostly protein-
coding nDNA markers provide no further support for a sirenian-proboscidean
relationship and are characterised by unstable nodes (Scally, Madsen et al., 2001),
nonsignificant support of M+H (Murphy, Eizirik et al., 2001b) and variable support for
H+E (Amrine-Madsen, Koepfli et al., 2003; Murphy, Eizirik et al., 2001b supplementary
information; Waddell, Kishino et al., 2001). The lack of consensus among studies, despite
extensive analyses, has led several authors to suggest that the paenungulate divergence is
best characterised as a rapid radiation (Nishihara, Satta et al., 2005; Waddell and Shelley,
2003; Amrine and Springer, 1999) with the successive, short branching events limiting
the establishment of synapomorphic characters. In particular, it is unclear whether the
paenungulate trichotomy represents a hard, unresolvable polytomy, or a soft node where
phylogenetic signal is present but is obscured due to the confounding effects of
homoplasy. In the latter case, a comprehensive analysis of the data may facilitate
distinguishing phylogenetic signal from the masking effects of homoplasy. Furthermore,
the phylogenetic signal may be differentially preserved in diverse markers and the
incorporation of new markers, and at different levels of resolution, may therefore be
Stellenbosch University http://scholar.sun.ac.za
121
informative. In this study, an attempt is made to provide further insight into relationships
within Paenungulata and is addressed through two aims.
Issues of homoplasy are of particular concern to the resolution of the paenungulate node
as, in addition to the limited signal resulting from a rapid radiation, the relatively deep
divergence estimated for paenungulates ~62.5 MYA (Springer, Murphy et al., 2003b)
provides ample opportunity for signal degradation through homoplasy. The effects of
homoplasy will differ across data sets resulting in the variation of phylogenetic signal
among markers. The examination of signal heterogeneity among partitions enables the
identification of areas of conflict and support within the data. This is encapsulated in the
first aim of the study: to characterise signal structure among diverse mitochondrial and
nuclear DNA segments using a hierarchical approach to survey the data with the aim of
identifying a signal representative of a soft polytomy. Here, existing data (Amrine-
Madsen, Koepfli et al., 2003; Murata, Nikaido et al., 2003; Murphy, Eizirik et al., 2001b)
was supplemented with intron DNA sequences generated in this study.
Second, an alternative marker offering a vastly different level of resolution to that in the
first aim was investigated. Reciprocal chromosome painting using FISH was used to
delineate patterns of chromosomal rearrangements among paenungulates and an outgroup
taxon, to enable the identification of synapomorphic characters informative at the level of
intraordinal relationships. Additionally, traditional cytogenetic banding techniques were
used to provide a further level of comparison. The incorporation of both chromosomal
and DNA sequence data provide a fine-scale, though narrow view (sequence data)
complemented by a broad, genome-wide assessment (chromosomal data).
The separate and combined analysis of the total sequence data set comprising 39
individual partitions did not provide clear support for any particular paenungulate clade.
However, when assessed by genomic origin (i.e., mtDNA or nDNA), support for an M+E
association by mtDNA was confirmed. Further, the results from the hierarchical analysis
and PBS indicate that support for M+E is predominantly derived from faster-evolving
sites (third and first codon positions). Within nDNA, H+E was retrieved by the majority
Stellenbosch University http://scholar.sun.ac.za

122
of individual markers and, together with M+H, was obtained by several combined data
sets. Although the predominance of H+E in individual nDNA partitions may suggest an
overall consensus (albeit reduced), the effects of sampling and lineage sorting cannot be
discounted. However, the hierarchical analysis demonstrates robust support for H+E by
nuccod1 and to a lesser extent nuccod2 using both MP and BI. The addition of nuccod3
results in a loss of resolution, particularly evident in the MP topology, indicating a
negative effect from these faster evolving positions.
M+E obtained from the phylogenetic analysis (with stationary base composition) is the
predominant signal at mtDNAcod3 and mtDNAcod1 and is also the most common
pairwise association observed from the manual count across the different substitutional
classes. This correspondence of M+E between phylogenetic signal and proportion of
shared sites linked with nucleotide composition bias strongly suggests that support from
MP and BI is a result of a misleading signal in the presence of a limited phylogentic
signal. With the relatively deep divergence and faster rates of substitution at these sites,
the increased likelihood of nonstationarity of evolutionary processes and thus homoplasy,
is not unexpected. Moreover, the presence of a short internal edge combined with base
composition heterogeneity increases the difficulty of phylogenetic inference from
sequence data (Jermiin, Ho et al., 2004). Although the use of MP and a more generic
model for BI permitted the identification of the different signals (positive or misleading)
as well as specifc confounding factors in the data set, the next step required is a direct
optimal reconstruction using a model that takes into account base composition bias in
particular.
The support for H+E fits the profile expected for a signal from a soft polytomy: it is
limited and masked by homoplasy in combined analyses, and is well supported by a
specific set of characters with a similar evolutionary profile. If the signal was further
degraded, indicative of a hard node (i.e. less resolvable), a more random or diffuse signal
would be expected. Further, comparison of the profile of support for H+E across nDNA
codon positions corresponds to expectations of a signal established over a short internal
edge and which has had a lengthy interval for signal to be degraded. The signal is more
Stellenbosch University http://scholar.sun.ac.za
123
prevalent at faster evolving sites, i.e., nuccod1 over nuccod2, however, is absent from the
fastest evolving sites (nuccod3) as these are most likely to be affected by multiple-hits.
This is evident from the absence of H+E with nuccod3 and the reduction of support for
H+E when nuccod3 is combined with nuccod12. If H+E does not represent a
phylogenetic signal, the support from nuccod1 and 2 would suggest bias or sampling
effect. A bias may result from dependence or linkage, however, since nuccod12 is
derived from several different markers this is expected to be less likely. Comparison of
the results obtained here with additional, independent markers will enable assessment of
these factors.
The use of a hierarchical approach to characterise signal structure within the data set
draws attention to the issues/difficulties associated with the phylogenetic analysis of the
reduced signal of a polytomy. For example, due to the likely effects of lineage sorting the
use of a consensus approach to establishing relationships among paenungulates was
limited, as was evidenced by the separate analysis of markers. In particular, is the
considerable variation in phylogenetic utility among partitions (assessed through the
recovery of established clades) observed in both the separate and combined analyses. It is
noteworthy that overall, nDNA segments performed better than mtDNA in the former
analysis. Subpartitioning through the hierarchical analysis of the data allowed for
differences in evolutionary processes among markers to be taken into account (for
example, rate differences between codon positions). This provided an additional
dimension to the characterisation of signal structure (e.g., among mtDNA sites the
identification of increased support for M+E from mtDNAcod3 and 1 in particular) and by
enabling the detection of hidden or obscured support (e.g. H+E by nuccod12).
Comparative chromosome painting among Proboscidea, Hyracoidea and Sirenia yielded
four syntenic associations and seven fissions specific to Paenungulata, and ten (5 fusions,
4 fissions, 1 inversion/chromosome repositioning), five (3 fusions, 2 fission) and seven (5
fusions, 2 inversions/chromosome repositionings) autapomorphic characters specific to L.
africana, P. capensis, and T. m. latirostris, respectively. However, no synapomorphic
changes characterising an association within Paenungulata were evident. This may be due
Stellenbosch University http://scholar.sun.ac.za
124
to the loss of specific syntenies that occurred around this time, or alternatively that the
length of the internal edge between successive divergence events was too short relative to
the rate of chromosomal evolution. Comparison of the paenungulate rates of
chromosomal evolution to other mammalian taxa, and that estimated for the ancestral
paenungulate, indicates that paenungulate rates of change are reduced and consequently
that the latter situation is more likely to account for this result. A reduced rate of
chromosomal repatterning is also supported by G-banding comparisons which, in
combination with the FISH data, suggest conserved intrachromosomal homology.
Although no synapomorphic changes were evident, this may be due to the level of
resolution obtained in the present study and may change with increased resolution (e.g.,
Pevzner and Tesler, 2003).
The examination of Paenungulata using a combination of both cytogenetic and sequence
data has contributed to providing a comprehensive picture of evolution within this clade.
In particular, this is the first characterisation of chromosomal repatterning among the
three lineages and provides confirmation of the monophyly of Paenungulata with
cytogenetic characters. Although no further resolution of associations among
paenungulates was possible with a cytogenetic approach, the sequence data analysis
suggests H+E as a potential alternative to the contentious M+E (based on molecular data)
and finds in favour of a paenungulate soft polytomy. Clearly, continued investigation of
the paenungulate polytomy is warranted. This should benefit greatly from the sequencing
of the elephant genome (Roca and O'Brien, 2005) thus enabling the contextualisation of
paenunuglate genome organisation within Mammalia.
Stellenbosch University http://scholar.sun.ac.za
125
REFERENCES Akaike, H. (1973) Information theory and an extension of the maximum likelihood principle. In 2nd International Symposium on Information Theory. Petrov, B.N., and Csaki (eds.) Budapest: Akadémia Kiado, pp. 267-281.
Alfaro, M.E., Zoller, S. and Lutzoni, F. (2003) Bayes or bootstrap? A simulation study comparing the performance of Bayesian Markov chain Monte Carlo sampling and bootstrapping in assessing phylogenetic confidence. Molecular Biology and Evolution. 20: 255-266.
Amor, D.J., Bentley, K., Ryan, J., Perry, J., Wong, L., Slater, H. and Choo, K.H.A. (2004) Human centromere repositioning "in progress". Proceedings of the National Academy of Sciences, USA. 101: 6542-6547.
Amrine, H.M. and Springer, M.S. (1999) Maximum-likelihood analysis of the Tethythere hypothesis based on a multigene data set and a comparison of different models of sequence evolution. Journal of Mammalian Evolution. 6: 161-176.
Amrine-Madsen, H., Koepfli, K.P., Wayne, R.K. and Springer, M.S. (2003) A new phylogenetic marker, apolipoprotein B, provides compelling evidence for eutherian relationships. Molecular Phylogenetics and Evolution. 28: 225-240.
Archibald, J.D. and Deutschman, D.H. (2001) Quantitative analysis of the timing of the origin and diversification of extant placental orders. Journal of Mammalian Evolution. 8: 107-124.
Arnason, U. and Janke, A. (2002) Mitogenomic analyses of eutherian relationships. Cytogenetic and Genome Research. 96: 20-32.
Arnason, U., Gullberg, A. and Janke, A. (1997) Phylogenetic analyses of mitochondrial DNA suggest a sister group relationship between Xenarthra (Edentata) and Ferungulates. Molecular Biology and Evolution. 14: 762-768.
Arnason, U., Gullberg, A. and Janke, A. (1999) The mitochondrial DNA molecule of the aardvark, Orycteropus afer, and the position of the Tubulidendata in the eutherian tree. Proceedings of the Royal Society, London, B. 266: 339-345.
Arnason, U., Adegoke, J.A., Bodin, K., Born, E.W., Esa, Y.B., Gullberg, A., Nilsson, M., Short, R.V., Xu, X. and Janke, A. (2002) Mammalian mitogenomic relationships and the root of the eutherian tree. Proceedings of the National Academy of Sciences, USA. 99: 8151-8156.
Asher, R.J. (1999) A morphological basis for assessing the phylogeny of "Tenrecoidea" (Mammalia, Lipotyphla). Cladistics. 15: 231-252.
Stellenbosch University http://scholar.sun.ac.za
126
Asher, R.J. (2001) Cranial anatomy in Tenrecid Insectivorans: character evolution across competing phylogenies. American Museum Novitas. 3352: 1-54.
Asher, R.J., Novacek, M.J. and Geisler, J.H. (2003) Relationships of endemic african mammals and their fossil relatives based on morphological and molecular evidence. Journal of Mammalian Evolution. 10: 131-194.
Assis, M.F.L., Best, R.C., Barros, R.M.S. and Yonenaga-Yassuda, Y. (1988) Cytogenetic study of Trichechus inunguis (Amazonian manatee). Brazilian Journal of Genetics. 11: 41-50.
Baker, R.H., Wilkinson, G.S. and DeSalle, R. (2001) Phylogenetic utility of different types of molecular data used to infer evolutionary relationships among stalk-eyed flies (Diopsidae). Systematic Biology. 50: 87-105.
Barrett, M., Donoghue, M.J. and Sober, E. (1991) Against consensus. Systematic Zoology. 40: 486-493.
Bininda-Edmonds, O.R.P., Gittleman, J. and Purvis, A. (1999) Building large trees by combining phylogenetic information: a complete phylogeny of the extant Carnivora (Mammalia). Biological Review. 74: 143-173.
Borowik, O.A. (1995) Coding chromosomal data for phylogenetic analysis: phylogenetic resolution of the Pan-Homo-Gorilla Trichotomy. Systematic Biology. 44: 563-570.
Bos, D.H. and Posada, D. (2005) Using models of nucleotide evolution to build phylogenetic trees. Developmental and Comparative Immunology. 29: 211-227.
Brandley, M., Schmitz, A. and Reeder, T. (2005) Partitioned Bayesian analyses, partition choice, and the phylogenetic relationships of Scincid Lizards. Systematic Biology. 54: 373-390.
Britton-Davidian, J., Catalan, J., Ramalhinho, M.G., Ganem, G., Auffray, J.-C., Capela, R., Biscoito, M., Searle, J.B. and Mathias, M.L. (2000) Rapid chromosomal evolution in island mice. Nature. 403: 158.
Bromham, L., Rambaut, A. and Harvey, P.H. (1996) Determinants of rate variation in mammalian DNA sequence evolution. Journal of Molecular Evolution. 43: 610-621.
Bromham, L., Phillips, M.J. and Penny, D. (1999) Growing up with dinosaurs: molecular dates and the mammalian radiation. Trends in Ecology and Evolution. 14: 113-118.
Brown, W.M., Prager, E.M., Wang, A. and Wilson, A.C. (1982) Mitochondrial DNA sequences of primates: tempo and mode of evolution. Journal of Molecular Evolution. 18: 225-239.
Bull, J.J., Huelsenbeck, J.P., Cunningham, C.W., Swofford, D.L. and Waddell, P.J. (1993) Partitioning and combining data in phylogenetic analysis. Systematic Biology. 42: 384-397.
Stellenbosch University http://scholar.sun.ac.za

127
Burk, A., Douzery, E.J.P. and Springer, M.S. (2002) The secondary structure of mammalian mitochondrial 16S rRNA molecules: refinements based on a comparative phylogenetic approach. Journal of Mammalian Evolution. 9: 225-252.
Cao, Y., Adachi, J., Janke, A., Pääbo, S. and Hasegawa, M. (1994) Phylogenetic relationships among eutherian orders estimated from inferred sequences of mitochondrial proteins: instability of a tree based on a single gene. Journal of Molecular Evolution. 39: 519-527.
Carroll, R.L. (1988) Vertebrate Paleontology and Evolution. New York: W. H. Freeman and Company.
Castillo, A.H., Cortinas, M.N. and Lessa, E.P. (2005) Rapid diversification of South American tuco-tucos (Ctenomys; Rodentia, Ctenomyidae): contrasting mitochondrial and nuclear intron sequences. Journal of Mammalogy. 86: 170-179.
Catanhede, A.M., Da Silva, V.M.F., Farias, I.P., Hrbek, T., Lazzarini, S.M. and Alves-Gomes, J. (2005) Phylogeography and population genetics of the endangered Amazonian manatee, Trichechus inunguis Natterer, 1883 (Mammalia, Sirenia). Molecular Ecology. 14: 413.
Chamary, J.-V. and Hurst, L.D. (2005) Biased codon usage near intron-exon junctions: selection on splicing enhancers, splice-site recognition or something else? Trends in Genetics. 21: 256-259.
Collins, T.M., Wimberger, P.H. and Naylor, G.J.P. (1994) Compositional bias, character-state bias, and character-state reconstruction using parsimony. Systematic Biology. 43: 482-496.
Court, N. (1994) The periotic of Moeritherium (Mammalia, Proboscidea): homology or homoplasy in the ear region of Tethytheria McKenna, 1975? Zoological Journal of the Linnean Society. 112: 13-28.
Creer, S., Malhotra, A. and Thorpe, R.S. (2003) Assessing the phylogenetic utility of four mitochondrial genes and a nuclear intron in the asian pit viper genus, Trimeresurus: separate, simultaneous, and conditional analyses. Molecular Biology and Evolution. 20: 1240-1251.
Cummings, M., Otto, S. and Wakeley, J. (1995) Sampling properties of DNA sequence data in phylogenetic analysis. Molecular Biology and Evolution. 12: 814-822.
Cunningham, C. (1997) Can three incongruence tests predict when data should be combined? Molecular Biology and Evolution. 14: 733-740.
Darlu, P. and Lecointre, G. (2002) When does the incongruence length difference test fail? Molecular Biology and Evolution. 19: 432-437.
Stellenbosch University http://scholar.sun.ac.za
128
De Blieux, D.D. and Simons, E.L. (2002) Cranial and dental anatomy of Antilohyax pectidens: a late Eocene Hyracoid (Mammalia) from the Fayum, Egypt. Journal of Vertebrate Paleontology. 22: 122-136.
De Jong, W.W. (1998) Molecules remodel the mammalian tree. Trends in Ecology and Evolution. 13: 270-275.
De Jong, W.W., Zweers, A. and Goodman, M. (1981) Relationships of aardvark to elephants, hyraxes and sea cows from alpha-crystallin sequences. Nature. 292: 538-540.
De Oliviera, E.H.C., Neusser, M., Pieczarka, J.C., Nagamachi, C., Sbalqueiro, I.J. and Müller, S. (2005) Phylogenetic inferences of Atelinae (Platyrrhini) based on mulit-directional chromosome painting in Brachyteles arachnoides, Ateles paniscus paniscus and Ateles b. marginatus. Cytogenetic and Genome Research. 108: 183-190.
De Queiroz, A., Donoghue, M.J. and Kim, J. (1995) Separate versus combined analysis of phylogenetic evidence. Annual Review of Ecology and Systematics. 26: 657-681.
DeBry, R.W. and Seshadri, S. (2001) Nuclear intron sequences for phylogenetics of closely related mammals: an example using the phylogeny of Mus. Journal of Mammalogy. 82: 280-288.
D'Erchia, A.M., Gissi, C., Pesole, G., Saccone, C. and Arnason, U. (1996) The guinea-pig is not a rodent. Nature. 381: 567-600.
Dobigny, G., Ozouf-Costaz, C., Bonillo, C. and Voloboluev, V. (2003) Evolution of rRNA gene clusters and telomeric repeats during explosive genome repatterning in Taterillus X (Rodentia, Gerbillinae). Cytogenetic and Genome Research. 103: 94-103.
Dobigny, G., Ducroz, J.-F., Robinson, T.J. and Volobouev, V. (2004) Cytogenetics and cladistics. Systematic Biology. 53: 470-484.
Dobigny, G., Aniskin, V., Granjon, L., Cornette, R. and Volobouev, V. (2005) Recent radiation in West African Taterillus (Rodentia, Gerbillinae): the concerted role of chromosome and climatic changes. Heredity. 95: 358-368.
Dobigny, G., Yang, F., O'Brien, P.C.M., Volobouev, V., Kovács, A., Pieczarka, J.C., Ferguson-Smith, M.A. and Robinson, T.J. (2005) Low rate of genomic repatterning in Xenarthra inferred from chromosome painting data. Chromosome Research. 13: 651-663.
Domning, D.P. (1994) A phylogenetic analysis of the Sirenia. In Contributions in Marine Mammal Paleontology honoring Frank C. Whitmore, Jr. Berta, A., and Deméré, T.A. (eds.): Proc. San Diego Soc. Nat. Hist., pp. 177-189.
Domning, D.P. (2001) The earliest known fully quadrupedal sirenian. Nature. 413: 625-627.
Stellenbosch University http://scholar.sun.ac.za
129
Douady, C.J., Scally, M., Springer, M.S. and Stanhope, M.J. (2004) "Lipotyphlan" phylogeny based on the growth hormone receptor gene: a reanalysis. Molecular Phylogenetics and Evolution. 30: 778-788.
Douady, C.J., Delsuc, F., Boucher, Y., Doolittle, W.F. and Douzery, E.J.P. (2003) Comparison of Bayesian and maximum likelihood bootstrap measures of phylogenetic reliability. Molecular Biology and Evolution. 20: 248-254.
Eichler, E.E. and Sankoff, D. (2003) Structural dynamics of eukaryotic chromosome evolution. Science. 301: 793-797.
Eick, G.N., Jacobs, D.S. and Matthee, C.A. (2005) A nuclear DNA phylogenetic perspective on the evolution of echolocation and historical biogeography of extant bats (Chiroptera). Molecular Biology and Evolution. 22: 1869-1886.
Eizirik, E., Murphy, W.J. and O'Brien, S.J. (2001) Molecular dating and biogeography of the early Placental mammal radiation. Journal of Heredity. 92: 212-219.
Enders, A.C. and Carter, A.M. (2004) What can comparative studies of placental structure tell us? - A review. Placenta. 25: S3-S9.
Erixon, P., Svennblad, B., Britton, T. and Oxelman, B. (2003) Reliability of Bayesian posterior probabilities and bootstrap frequencies in phylogenetics. Systematic Biology. 52: 665-673.
Farris, J.S. (1978) Inferring phylogenetic trees from chromosomal inversion data. Systematic Zoology. 27: 275-284.
Farris, J.S. (1989) The retention index and the rescaled consistency index. Cladistics. 5: 417-419.
Farris, J.S., Kallersjo, M., Kluge, A.G. and Bult, C. (1994) Testing significance of incongruence. Cladistics. 10: 315-319.
Felsenstein, J. (1985) Confidence limits of phylogenies: an approach using the bootstrap. Evolution. 39: 783-791.
Ferguson-Smith, M.A., Yang, F. and O'Brien, P.C.M. (1998) Comparative mapping using chromosome sorting and painting. Institute for Laboratory and Animal Research Journal. 39: 68-76.
Fischer, M.S. (1990) Un trait unique de l'oreille des éléphants et des siréniens (Mammalia): un paradoxe phylogénétique. Comptes Rendus de l'Académie des Sciences, Série III, Paris. 311: 157-162.
Foster, P.G. and Hickey, D.A. (1999) Compositional bias may affect both DNA-based and protein-based phylogenetic reconstructions. Journal of Molecular Evolution. 48: 284-290.
Stellenbosch University http://scholar.sun.ac.za

130
Foster, P.G., Jermiin, L.S. and Hickey, D.A. (1997) Nucleotide composition bias affects amino acid content in proteins coded by animal mitochondria. Journal of Molecular Evolution. 44: 282-288.
Freeman, S. (1990) The evolution of the scrotum: a new hypothesis. Journal of Theoretical Biology. 145: 429-445.
Frönicke, L. (2005) Origins of primate chromosomes - as delineated by Zoo-FISH and alignments of human and mouse draft genome sequences. Cytogenetic and Genome Research. 108: 122-138.
Frönicke, L., Wienberg, J., Stone, G., Adams, L. and Stanyon, R. (2003) Towards the delineation of the ancestral eutherian genome organization: comparative genome maps of human and the African elephant (Loxodonta africana) generated by chromosome painting. Proceedings of the Royal Society of London Series B-Biological Sciences. 270: 2639-2639.
Gaeth, A.P., Short, R.V. and Renfree, M.B. (1999) The developing renal, reproductive, and respiratory systems of the African elephant suggest an aquatic ancestry. Proceedings of the National Academy of Sciences, USA. 96: 5555-5558.
Galtier, N. and Gouy, M. (1998) Inferring pattern and process: maximum-likelihood implementation of a nonhomogeneous model of DNA sequence evolution for phylogenetic analysis. Molecular Biology and Evolution. 15: 871-879.
Gatesy, J. and Arctander, P. (2000) Hidden morphological support for the phylogenetic placement of Pseudoryx nghetinhensis with bovine bovids:Acombined analysis of gross anatomical evidence and DNA sequences from five genes. Systematic Biology. 49: 515-538.
Gatesy, J. and Baker, R. (2005) Hidden likelihood support in genomic data: can forty-five wrongs make a right? Systematic Biology. 54: 483-492.
Gatesy, J., O'Grady, P. and Baker, R.H. (1999) Corroboration among data sets in simultaneous analysis: hidden support for phylogenetic relationships among higher level Artiodactyl taxa. Cladistics. 15: 271-313.
Gatesy, J., Amato, G., Norell, M., DeSalle, R. and Hayashi, C. (2003) Combined support for wholesale taxic atavism in Gavialine crocodylians. Systematic Biology. 52: 403-422.
Gaubert, P. and Veron, G. (2003) Exhaustive sample set among Viverridae reveals the sister-group of felids: the linsangs as a case of extreme morphological convergence within Feliformia. Proceedings of the Royal Society of London - Biological Sciences. 270: 2523-2530.
Gheerbrandt, E., Sudre, J. and Cappetta, H. (1996) A Palaeocene proboscidean from Morocco. Nature. 383: 68-70.
Stellenbosch University http://scholar.sun.ac.za

131
Gheerbrandt, E., Domning, D., P. and Tassy, P. (2005) Paenungulata (Sirenia, Proboscidea, Hyracoidea, and relatives). In The rise of placental mammals. Archibald, J.D., and Rose, K.D. (eds.) Baltimore and London: The John Hopkins University Press, pp. 84-105.
Gheerbrandt, E., Sudre, J., Tassy, P., Amaghzaz, M., Bouya, B. and Iarochène, M. (2005) Nouvelles données sur Phosphatherium escuilliei (Mammalia, Proboscidea de l'Éocène inférieur du Maroc, apports à la phylogénie des Proboscidea et des ongulés lophodontes. Geodiversitas. 27: 239-333.
Gibson, A., Gowri-Shankar, V., Higgs, P.G. and Rattray, M. (2005) A comprehensive analysis of mammalian mitochondrial genome base composition and improved phylogenetic methods. Molecular Biology and Evolution. 22: 251-264.
Gissi, C., Reyes, A., Pesole, G. and Saccone, C. (2000) Lineage-specific evolutionary rate in mammalian mtDNA. Molecular Biology and Evolution. 17: 1022-1031.
Glas, R., Marshall Graves, J., Toder, R., Ferguson-Smith, M.A. and O'Brien, P.C. (1999) Cross-species chromosome painting between human and marsupial directly demonstrates the ancient region of the mammalian Y chromosome. Mammalian Genome. 10: 1115-1116.
Graur, D., Hide, W.A. and Li, W.-H. (1991) Is the guinea-pig a rodent? Nature. 351: 649-652.
Gray, B.A., Zori, R.T., McGuire, J.A. and Bonde, R.K. (2002) A first generation cytogenetic ideogram for the Florida manatee (Trichechus manatus latirostris) based on multiple chromosome banding techniques. Hereditas. 137: 215-223.
Graybeal, A. (1998) Is it better to add taxa or characters to a difficult phylogenetic problem? Systematic Biology. 47: 9-17.
Greenwood, A.D., Englbrecht, C.C. and MacPhee, R.D.E. (2004) Characterization of an endogenous retrovirus class in elephants and their relatives. BMC Evolutionary Biology. 4: http://www.biomedcentral.com/1471-2148/1474/1438.
Gyllensten, U., Wharton, D., Josefsson, A. and Wilson, A.C. (1991) Paternal inheritance of mitochondrial DNA in mice. Nature. 352: 255-257.
Halanych, K.M., Demboski, J.R., van Vuuren, B.J., Klein, D.R. and Cook, J.A. (1999) Cytochrome b phylogeny of north american hares and jackrabbits (Lepus, Lagomorpha) and the effects of saturation in outgroup taxa. Molecular Phylogenetics and Evolution. 11: 213-221.
Hare, M.P. and Palumbi, S.R. (2003) High intron sequence conservation across three mammalian orders suggests functional constraints. Molecular Biology and Evolution. 20: 969-978.
Stellenbosch University http://scholar.sun.ac.za
132
Hauf, J., Waddell, P.J., Chalwatzis, N., Joger, U. and Zimmermann, F.K. (2000) The complete mitochondrial genome sequence of the African elephant (Loxodonta africana), phylogenetic relationships of Proboscidea to other mammals, and D-loop heteroplasmy. Zoology. 102: 184-195.
Helgen, K.M. (2003) Major mammalian clades: a review under consideration of molecular and palaeontolgical evidence. Mammalian Biology. 68: 1-15.
Hillis, D.M. (1987) Molecular versus morphological approaches to systematics. Annual Review in Ecology and Systematics. 18: 23-42.
Hillis, D.M. (1998) Taxonomic sampling, phylogenetic accuracy, and investigator bias. Systematic Biology. 47: 3-8.
Hoelzer, G.A. and Melnick, D.J. (1994) Patterns of speciation and limits to phylogenetic resolution. Trends in Ecology and Evolution. 9: 104-107.
Houck, M.L., Kumamoto, A.T., Gallagher Jr., D.S. and Benirschke, K. (2001) Comparative cytogenetics of the African elephant (Loxodonta africana) and Asiatic elephant (Elephas maximus). Cytogenetic and Cell Genetics. 93: 249-252.
Hsu, T.C. and Benirschke, K. (1971) An atlas of mammalian chromosomes. New York: Springer Verlag.
Hudelot, C., Gowri-Shankar, V., Jow, H., Rattray, M. and Higgs, P.G. (2003) RNA-based phylogenetic methods: application to mammalian mitochondrial RNA sequences. Molecular Phylogenetics and Evolution. 28: 241-252.
Hudson, R.R. (1983) Testing the constant-rate neutral allele model with protein sequence data. Evolution. 37: 203-217.
Huelsenbeck, J.P. and Crandall, K. (1997) Phylogeny estimation and hypothesis testing using maximum likelihood. Annual Review in Ecology and Systematics. 28: 437-466.
Huelsenbeck, J.P. and Ronquist, F. (2001) MrBayes: Bayesian inference of phylogenetic trees. Bioinformatics. 17: 754-755.
Huelsenbeck, J.P., Bull, J.J. and Cunningham, C.W. (1996) Combining data in phylogenetic analysis. Trends in Ecology and Evolution. 11: 152-158.
Hungerford, D.A. and Snyder, R.L. (1969) Chromosomes of the rock hyrax, Procavia capensis (Pallas). Experientia. 25: 870.
Inagaki, Y., Simpson, A.G.B., Dacks, J.B. and Roger, A.J. (2004) Phylogenetic artifacts can be caused by leucine, serine, and arginine codon usage heterogeneity: dinoflagellate plastid origins as a case study. Systematic Biology. 53: 582-593.
Irwin, D.M., Kocher, T.D. and Wison, A.C. (1991) Evolution of the cytochrome b gene of mammals. Journal of Molecular Evolution. 32: 128-144.
Stellenbosch University http://scholar.sun.ac.za
133
ISCN (1978) An international system for human cytogenetic nomenclature. Report of the standing committee on human cytogenetic nomenclature. Cytogenetic and Cell Genetics. 21: 309-404.
Jameson, D., Gibson, A.P., Hudelot, C. and Higgs, P.G. (2003) OGRe: a relational database for comparative analysis of mitochondrial genomes. Nucleic Acids Research. 31: 202-206.
Jauch, A., Wienberg, J., Stanyon, R., Arnold, N., Tofanelli, S., Ishida, T. and Cremer, T. (1992) Reconstruction of genomic rearrangements in great Apes and gibbons by chromosome painting. Proceedings of the National Academy of Sciences, USA. 89: 8611-8615.
Jermiin, L.S., Ho, S.Y.W., Ababneh, F., Robinson, J. and Larkum, A.W.D. (2004) The biasing effect of compositional heterogeneity on phylogenetic estimates may be underestimated. Systematic Biology. 53: 638-643.
Jukes, T.H. (1987) Transitions, transversions and the molecular clock. Journal of Molecular Evolution. 26.
Kelly, C.D. (2005) Understanding mammalian evolution using Bayesian phylogenetic inference. Mammal Review. 35: 188-198.
Kelsey, C.R., Crandall, K.A. and Voevodin, A.F. (1999) Different models, different trees: the geographic origin of PTLV-I. Molecular Phylogenetics and Evolution. 13: 336-347.
Kishino, H. and Hasegawa, M. (1989) Evaluation of maximum likelihood estimate of the evolutionary tree topologies from DNA sequence data, and the branching order in Hominoidea. Journal of Molecular Evolution. 29: 170-179.
Kitazoe, Y., Kishino, H., Okabayashi, T., Watabe, T., Nakajima, N., Okuhara, Y. and Kurihara, Y. (2005) Multidimensional vector space representation for convergent evolution and molecular phylogeny. Molecular Biology and Evolution. 22: 704-715.
Kleinschmidt, T., Czelusniak, J., Goodman, M. and Braunitzer, G. (1986) Paenungulata: a comparison of the haemoglobin sequences from elephant, hyrax, and manatee. Molecular Biology and Evolution. 3: 427-435.
Kluge, A.G. (1997) Testability and the refutation and corroboration of cladistics hypotheses. Cladistics. 13: 81-96.
Kluge, A.G. and Farris, J.S. (1969) Quantitative phyletics and the evolution of anurans. Systematic Zoology. 18: 1-32.
Kolaczkowski, B. and Thornton, J.W. (2004) Performance of maximum parsimony and likelihood phylogenetics when evolution is heterogeneous. Nature. 431: 980-984.
Kraus, F. and Miyamoto, M.M. (1991) Rapid cladogenesis among the pecoran ruminants - evidence from mitochondrial-DNA sequences. Systematic Zoology. 40: 117-130.
Stellenbosch University http://scholar.sun.ac.za
134
Kraytsberg, Y., Schwartz, M., Brown, T.A., Ebralidse, K., Kunz, W.S., Clayton, D.A., Vissing, J. and Khrapko, K. (2004) Recombination of human mitochondrial DNA. Science. 304: 981.
Lake, J. (1994) Reconstructing evolutionary trees from DNA and protein sequences: paralinear distances. Proceedings of the National Academy of Sciences, USA. 91: 1455-1459.
Lara, M.C., Patton, J.L. and Da Silva, M.N.F. (1996) The simultaneous diversification of South American echimyd rodents (Hystricognathi) based on complete cytochrome b sequences. Molecular Phylogenetics and Evolution. 5: 403-413.
Lavergne, A., Douzery, E., Stichler, T., Catzeflis, F.M. and Springer, M.S. (1996) Interordinal mammalian relationships: evidence for paenungulate monophyly is provided by complete mitochondrial 12S rRNA sequences. Molecular Phylogenetics and Evolution. 6: 245-258.
Le Gros Clark, W.E. and Sonntag, C.F. (1926) A monograph of Orycteropus afer. III. The skull, the skeleton of trunk and limbs. General summary. Proceedings of the Zoological Society of London: 445-485.
Levy, S., Hannenhalli, S. and Workman, C. (2001) Enrichment of regulatory signals in conserved non-coding genomic sequence. Bioinformatics. 17: 871-977.
Lewis, P.O., Holder, M.T. and Holsinger, K.E. (2005) Polytomies and Bayesian phylogenetic inference. Systematic Biology. 54: 241-253.
Lin, Y., Waddell, P.J. and Penny, D. (2002) Pika and vole mitochondrial genomes increase support for both rodent monophyly and glires. Gene. 294: 119-129.
Lin, Y.-H., McLenachan, P.A., Gore, A.R., Phillips, M.J., Ota, R., Hendy, M.D. and Penny, D. (2002) Four new mitochondrial genomes and the increased stability of evolutionary rrees of mammals from improved taxon sampling. Molecular Biology and Evolution. 19: 2060-2070.
Liu, F.-G.R., Miyamoto, M.M., Freire, N.P., Ong, P.Q., Tennant, M.R., Young, T.S. and Gugel, K.F. (2001) Molecular and morphological supertrees for eutherian (placental) mammals. Science. 291: 1786-1789.
Lockhart, P., Steel, M., Hendy, M. and Penny, D. (1994) Recovering evolutionary trees under a more realistic model of sequence evolution. Molecular Biology and Evolution. 11: 605-612.
Loomis, W. and Smith, D. (1990) Molecular phylogeny of Dictyostelium discodeum by protein sequence comparison. Proceedings of the National Academy of Sciences, USA. 87: 9093-9097.
Stellenbosch University http://scholar.sun.ac.za
135
Loughman, W.D., Frye, F.L. and Herald, E.S. (1970) The chromosomes of a male manatee. International Zoo Yearbook. 10: 151-152.
Maddison, W.P. and Maddison, D.R. (1989) Interactive analysis of phylogeny and character evolution using the computer program MacClade. Folia Primatologica. 53: 190-202.
Madsen, O., Deen, P., Pesole, G., Saccone, C. and de Jong, W. (1997) Molecular evolution of mammalian aquaporin-2: further evidence that elephant shrew and aardvark join the paenungulate clade. Molecular Biology and Evolution. 14: 363-371.
Madsen, O., Scally, M., Douady, C.J., Kao, D.J., DeBry, R.W., Adkins, R., Amrine, H.M., Stanhope, M.J., de Jong, W.W. and Springer, M.S. (2001) Parallel adaptive radiations in two major clades of placental mammals. Nature. 409: 610-614.
Malia, M.J.J., Adkins, R.M. and Allard, M.W. (2002) Molecular support for Afrotheria and the polyphyly of Lipotyphla based on analyses of the growth hormone receptor gene. Molecular Phylogenetics and Evolution. 24: 91-100.
Marques-Bonet, T. and Navarro, A. (2005) Chromosomal rearrangements are associated with higher rates of molecular evolution in mammals. Gene. 353: 147-154.
Martin, A.P. and Burg, T.M. (2002) Perils of paralogy: using HSP70 genes for inferring organismal phylogenies. Systematic Biology. 51: 570-587.
Matthee, C.A. and Davis, S.K. (2001) Molecular insights into the evolution of the family Bovidae: a nuclear DNA perspective. Molecular Biology and Evolution. 18: 1220-1230.
Matthee, C.A., Burzlaff, J.D., Taylor, J.F. and Davis, S.K. (2001) Mining the mammalian genome for Artiodactyl systematics. Systematic Biology. 50: 367-390.
Matthee, C.A., van Vuuren, B.J., Bell, D. and Robinson, T.J. (2004) A molecular supermatrix of the rabbits and hares (Leporidae) allows for the identification of five intercontinental exchanges during the Miocene. Systematic Biology. 53: 433-447.
McCracken, K.G. and Sorenson, M.D. (2005) Is homoplasy or lineage sorting the source of incongruent mtDNA and nuclear gene trees in the stiff-tailed ducks (Nomonyx-Oxyura)? Systematic Biology. 54: 35-55.
McKenna, M. (1975) Toward a phylogenetic classification of the Mammalia. In Phylogeny of the Primates. Luckett, W.P., and Szalay, F.S. (eds.) New York: Plenum Press, pp. 21-46.
McKenna, M.C. and Bell, S.K. (1997) Classification of mammals above the species level. New York: Columbia University Press.
McPhee, R.D.E. (1994) Morphology, adaptations, and relationships of Plesiorycteropus, and a diagnosis of a new order of eutherian mammals. Bull. Am. Mus. Nat. Hist. 220: 1-214.
Stellenbosch University http://scholar.sun.ac.za
136
Meyne, J., Ratliff, R.L. and Moyzis, R.K. (1989) Conservation of the Human Telomere Sequence (TTAGGG)n among Vertebrates. Proceedings of the National Academy of Sciences, USA. 86: 7049-7053.
Meyne, J., Baker, R.J., Hobart, H.H., Hsu, T.C., Ryder, O.A., Ward, O.G., Wiley, J.E., Wursterhill, D.H., Yates, T.L. and Moyzis, R.K. (1990) Distribution of nontelomeric sites of the (TTAGGG)n telomeric sequence in vertebrate chromosomes. Chromosoma. 99: 3-10.
Miyamoto, M.M. and Goodman, M. (1986) Biomolecular systematics of eutherian mammals: phylogenetics patterns and classification. Systematic Zoology. 35: 230-240.
Miyamoto, M.M. and Fitch, W.M. (1995) Testing species phylogenies and phylogenetic methods with congruence. Systematic Biology. 44: 64-76.
Montefalcone, G., Tempesta, S., Rocchi, M. and Archidiacono, N. (1999) Centromere repositioning. Genome Research. 9: 1184-1188.
Mooers, A.O. and Holmes, E.C. (2000) The evolution of base composition and phylogenetic inference. Trends in Ecology & Evolution. 15: 365-369.
Moore, W.S. (1995) Inferring phylogenies from mtDNA variation: mitochondrial-gene trees versus nuclear-gene trees. Evolution. 49: 718-726.
Moritz, C., Dowling, T.E. and Brown, W.M. (1987) Evolution of animal mitochondrial DNA: relevance for population biology and systematics. Annual Review in Ecology and Systematics. 18: 269-292.
Mouchaty, S.K., Gullberg, A., Janke, A. and Arnason, U. (2000) The phylogenetic position of the Talpidae within Eutheria based on analysis of complete mitochondrial sequences. Molecular Biology and Evolution. 17: 60-67.
Müller, S., Hollatz, M. and Wienberg, J. (2003) Chromosomal phylogeny and evolution of gibbons (Hylobatidae). Human Genetics. 113: 493-501.
Murata, Y., Nikaido, M., Sasaki, T., Cao, Y., Fukumoto, Y., Hasegawa, M. and Okada, N. (2003) Afrotherian phylogeny as inferred from complete mitochondrial genomes. Molecular Phylogenetics and Evolution. 28: 253-260.
Murphy, W.J., Pevzner, P.A. and O'Brien, S.J. (2004) Mammalian phylogenomics comes of age. Trends in Genetics. 20: 631-639.
Murphy, W.J., Frönicke, L., O'Brien, S.J. and Stanyon, R. (2003) The origin of human chromosome 1 and its homologs in Placental mammals. Genome Research. 13: 1880 - 1888.
Murphy, W.J., Eizirik, E., Johnson, W.E., Zhang, Y.P., Ryder, O.A. and O'Brien, S.J. (2001a) Molecular phylogenetics and the origins of placental mammals. Nature. 409: 614-618.
Stellenbosch University http://scholar.sun.ac.za

137
Murphy, W.J., Eizirik, E., O'Brien, S.J., Madsen, O., Scally, M., Douady, C.J., Teeling, E., Ryder, O.A., Stanhope, M.J., de Jong, W.W. and Springer, M.S. (2001b) Resolution of the early placental mammal radiation using Bayesian phylogenetics. Science. 294: 2348-2351.
Nash, W.G., Menninger, J.C., Wienberg, J., Padilla-Nash, H.M. and O'Brien, S.J. (2001) The pattern of phylogenomic evolution of the Canidae. Cytogenetic and Cell Genetics. 95: 10-224.
Navarro, A. and Barton, N.H. (2003) Chromosomal speciation and molecular divergence - accelerated evolution in rearranged chromosomes. Science. 300: 321-324.
Naylor, G.J.P. and Brown, W.M. (1998) Amphioxus mitochondrial DNA, chordate phylogeny, and the limits of inference based on comparison of sequences. Systematic Biology. 47: 61-76.
Nessov, L.A., Zhegallo, V.I. and Averianov, A.O. (1998) A new locality of Late Cretaceous snakes, mammals and other vertebrates in Africa (western Libya). Annales de Paléontologie. 84: 265-274.
Nikaido, M., Nishihara, H., Hukumoto, Y. and Okada, N. (2003) Ancient SINEs from african endemic mammals. Molecular Biology and Evolution. 20: 522-527.
Nikaido, M., Cao, Y., Harada, M., Okada, N. and Hasegawa, M. (2003) Mitochondrial phylogeny of hedgehogs and monophyly of Eulipotyphla. Molecular Phylogenetics and Evolution. 28: 276-284.
Nikaido, M., Kawai, K., Cao, Y., Harada, M., Tomita, S., Okada, N. and Hasegawa, M. (2001) Maximum likelihood analysis of the complete mitochondrial genomes of eutherians and a reevaluation of the phylogeny of bats and insectivores. Journal of Molecular Evolution. 52: 508-516.
Nishihara, H., Satta, Y., Nikaido, M., Thewissen, J.G.M., Stanhope, M.J. and Okada, N. (2005) A retroposon analysis of afrotherian phylogeny. Molecular Biology and Evolution. 22: 1823-1833.
Notredame, C., Higgins, D. and Heringa, J. (2000) T-COFFEE: a novel method for multiple sequence alignments. Molecular Biology and Evolution. 302: 205-217.
Novacek, M.J. (1992) Mammalian phylogeny: shaking the tree. Nature. 356: 121-125.
Novacek, M.J. (2001) Mammalian phylogeny: genes and supertrees. Current Biology. 11: R573-R575.
Nylander, J.A.A., Ronquist, F., Huelsenbeck, J.P. and Nieves-Aldrey, J.L. (2004) Bayesian phylogenetic analysis of combined data. Systematic Biology. 53: 47-67.
O'Brien, S.J. and Stanyon, R. (1999) Phylogenomics: Ancestral primate viewed. Nature. 402: 365-366.
Stellenbosch University http://scholar.sun.ac.za

138
Otells, M.O. (1995) Phylogenetic analysis of G-banded karyotypes among South American subterranean rodents of the genus Ctenomys (Caviomorpha, Octodontidae), with special reference to chromosomal evolution and speciation. Biological Journal of the Linnean Society. 54: 43-70.
Penny, D., Hasegawa, M., Waddell, P.J. and Hendy, M.D. (1999a) Mammalian evolution: timing and implications from using the LogDeterminant transform for proteins of differing amino acid composition. Systematic Biology. 48: 76-93.
Penny, D., Hasegawa, M., Waddell, P.J. and Hendy, M.D. (1999b) Mammalian evolution: timing and implications from using the Log Determinant transform for proteins of differing amino acid composition. Systematic Biology. 48: 76-93.
Pevzner, P. and Tesler, G. (2003) Human and mouse genomic sequences reveal extensive breakpoint reuse in mammalian evolution. Proceedings of the National Academy of Sciences, USA. 100: 7627-7677.
Piganeau, G., Gardner, M. and Eyre-Walker, A. (2004) A broad survey of recombination in animal mitochondria. Molecular Biology and Evolution. 21: 2319-2325.
Pollock, D.D., Zwickl, D.J., McGuire, J.A. and Hillis, D.M. (2002) Increased taxon sampling is advantageous for phylogenetic inference. Systematic Biology. 51: 664-671.
Porter, C.A., Goodman, M. and Stanhope, M.J. (1996) Evidence on mammalian phylogeny from sequences of exon 28 of the von Willebrand factor gene. Molecular Phylogenetics and Evolution. 5: 89-101.
Posada, D. and Crandall, K. (1998) Modeltest: Testing the model of DNA substitution. Bioinformatics. 14: 817-818.
Prinsloo, P. (1993) Molecular and chromosomal phylogeny of the Hyracoidea. In Department of Zoology Pretoria: University of Pretoria, pp. 130.
Prinsloo, P. and Robinson, T.J. (1991) Comparative cytogenetics of the Hyracoidea: chromosomes of two Hyrax species from South Africa. Zeitschrieft fuer Säugetierkunde. 56: 331-338.
Qumsiyeh, M.B. and Baker, R.J. (1988) Comparative cytogenetics and the determination of primitive karyotypes. Cytogenetics and cell genetics. 47: 100-103.
Rage, J.-C. and Cappetta, H. (2002) Vertebrates from the Cenomanian, and the geological age of the Draa Ubari fauna (Libya). Annales de Paléontologie. 88: 79-84.
Rainey, W.E., Lowenstein, J.M., Sarich, V.M. and Magor, D.M. (1984) Sirenian molecular systematics - including the extinct Steller's sea cow (Hydrodamalis gigas). Naturwissenschaften. 71: 586-588.
Stellenbosch University http://scholar.sun.ac.za
139
Rasmussen, T.D., Pickford, M., Mein, P., Senut, B. and Conroy, G.C. (1996) Earliest known Procaviid hyracoid from the late Miocene of Namibia. Journal of Mammalogy. 77: 745-754.
Raudsepp, T. and Chowdhary, B.P. (1999) Construction of chromosome-specific paints for meta- and submetacentric autosomes and the sex chromosomes in the horse and their use to detect homologous chromosomal segments in the donkey. Chromosome Research. 7: 103-114.
Redi, C.A., Garagna, S., Zacharias, H., Zuccotti, M. and Capanna, E. (2001) The other chromatin. Chromosoma. 110: 136-147.
Reichman, J. (1998) Handbook of optical filters for fluorescence microscopy: Chroma Technology Corp.
Reyes, A., Pesole, G. and Saccone, C. (2000) Long-branch attraction phenomenon and the impact of among-site rate variation on rodent phylogeny. Gene. 259: 177-187.
Reyes, A., Gissi, C., Pesole, G. and Saccone, C. (1998) Asymmetrical directional mutation pressure in the mitochondrial genome of mammals. Molecular Biology and Evolution. 15: 957-966.
Reyes, A., Gissi, C., Catzeflis, F., Nevo, E., Pesole, G. and Saccone, C. (2004) Congruent mammalian trees from mitochondrial and nuclear genes using Bayesian methods. Molecular Biology and Evolution. 21: 397-403.
Rich, T.H., Vickers-Rich, P., Constantine, A., Flannery, T.F., Kool, L. and Van Klaveren, N. (1997) A tribosphenic mammal from the Mesozoic of Australia. Science. 278: 1438-1442.
Richard, F., Lombard, M. and Dutrillaux, B. (2003) Reconstruction of the ancestral karyotype of eutherian mammals. Chromosome Research. 11: 605-618.
Robinson, T.J. and Seiffert, E.R. (2004) Afrotherian origins and interrelationships: new views and future prospects. Current Topics in Developmental Biology. 63: 37-60.
Robinson, T.J., Fu, B., Ferguson-Smith, M.A. and Yang, F. (2004) Cross-species chromosome painting in the golden mole and elephant-shrew: support for the mammalian clades of Afrotheria and Afroinsectiphillia but not Afroinsectivora. Proceedings of the Royal Society of London - Biological Sciences. 271: 1477-1484.
Roca, A.L. and O'Brien, S.J. (2005) Genomic inferences from Afrotheria and the evolution of elephants. Current Opinion in Genetics and Development. 15: 1-8.
Rokas, A. and Holland, P.W.H. (2000) Rare genomic changes as a tool for phylogenetics. Trends in Ecology and Evolution. 15: 454-459.
Rokas, A., Ladoukakis, E. and Zouros, E. (2003) Animal mitochondrial DNA recombination revisited. Trends in Ecology and Evolution. 18: 411-417.
Stellenbosch University http://scholar.sun.ac.za

140
Ronquist, F. and Huelsenbeck, J. (2003) MRBAYES 3: Bayesian phylogenetic inference under mixed models. Bioinformatics. 19: 1572-1574.
Sato, A., Nakada, K., Akimoto, M., Ishikawa, K., Ono, T., Shitara, H., Yonekawa, H. and Hayashi, J.-I. (2005) Rare creation of recombinant mtDNA haplotypes in mammalian tissues. Proceedings of the National Academy of Sciences, USA. 102: 6057-6062.
Savage, R.J.G., Domning, D.P. and Thewissen, J.G.M. (1994) Fossil Sirenia of the west Atlantic and Caribbean region. V. The most primitive known sirenian, Prorastomus sirenoides Owen, 1855. Journal of Vertebrate Paleontology. 14: 427-449.
Sawyer, J.R., Lukacs, J.L., Munshi, N., Desikan, K.R., Singhal, S., Mehta, J., Siegel, D., Shaughnessy, J. and Barlogie, B. (1998) Identification of new nonrandom translocations in multiple myeloma withmulticolor spectral karyotyping. Blood. 92: 4269-4278.
Scally, M., Madsen, O., Douady, C.J., Jong, W.W.d., Stanhope, M.J. and Springer, M.S. (2001) Molecular evidence for the major clades of placental mammals. Journal of Mammalian Evolution. 8: 239-277.
Scherthan, H., Cremer, T., Arnason, U., Weier, H.U., Limade-Faria, A. and Froenicke, L. (1994) Comparative chromosome painting discloses homologous segments in distantly related mammals. Nature Genetics. 6: 342-347.
Schmitz, J., Ohme, M. and Zischler, H. (2002) The complete mitochondrial sequence of Tarsius bancanus: evidence for an extensive nucleotide compositional plasticity of primate mitochondrial DNA. Molecular Biology and Evolution. 19: 544-553.
Schwarzacher, H.G., Wolf, U. and Passarge, E. (1974) Methods in human genetics. Berlin: Spinger-Verlag.
Seabright, M. (1971) A rapid banding technique for human chromosomes. Lancet. 2: 971-972.
Seiffert, E.R. (2003) A phylogenetic analysis of living and extant Afrotherian placentals. In Department of Biological Anthropology and Anatomy: Duke University, pp. 239.
Shoshani, J. (1986) Mammalian phylogeny: comparison of morphological and molecular results. Molecular Biology and Evolution. 3: 222-242.
Shoshani, J. (1993) Hyracoidea-Tethytheria affinity based on myological data. In Mammal Phylogeny: Placentals. Szalay, F.S., Novacek, M.J., and McKenna, M. (eds.) New York: Springer-Verlag.
Shoshani, J. (1998) Understanding proboscidean evolution: a formidable task. Trends in Ecology and Evolution. 13: 480-487.
Simons, E.L., Holroyd, P.A. and Bown, T.M. (1991) Early Tertiary elephant-shrews from Egypt and the origin of the Macroscelidea. Proceedings of the National Academy of Sciences, USA. 88: 9734-9737.
Stellenbosch University http://scholar.sun.ac.za
141
Simpson, G.G. (1945) The principles of classification and a classification of mammals. Bulletin of the American Museum of Natural History. 85: 1-350.
Singer, G.A.C. and Hickey, D.A. (2000) Nucleotide bias causes a genomewide bias in the amino acid composition of proteins. Molecular Biology and Evolution. 17: 1581-1588.
Sorenson, M.D. (1999) TreeRot, version 2. In Boston University, Boston, Massachusets.
Springer, M.S. (1997) Molecular clocks and the timing of the Placental and Marsupial radiations in relation to the Cretaceous/Tertiary Boundary. Journal of Mammalian Evolution. 4: 285-302.
Springer, M.S. and Kirsch, J.A.W. (1993) A molecular perspective on the phylogeny of placental mammals based on mitochondrial 12S rRNA sequences with special reference to the problem of the Paenungulata. Journal of Mammalian Evolution. 1: 146-166.
Springer, M.S., Amrine, H.M., Burk, A. and Stanhope, M.J. (1999) Additional support for Afrotheria and Paenungulata, the performance of mitochondrial versus nuclear genes, and the impact of data partitions with heterogeneous base composition. Systematic Biology. 48: 65-75.
Springer, M.S., Murphy, W.J., Eizirik, E. and O'Brien, S.J. (2003a) Placental mammal diversification and the Cretaceous-Tertiary boundary. Proceedings of the National Academy of Sciences of the United States of America. 100: 1056-1061.
Springer, M.S., Murphy, W.J., Eizirik, E. and O'Brien, S.J. (2003b) Placental mammal diversification and the Cretaceous-Tertiary boundary. Proceedings of the National Academy of Sciences, USA. 100: 1056-1061.
Springer, M.S., Burk, A., Kavanagh, J.R., Waddell, V.G. and Stanhope, M.J. (1997) The interphotoreceptor retinoid binding protein gene in therian mammals: Implications for higher level relationships and evidence for loss of function in the marsupial mole. Proceedings of the National Academy of Sciences, USA. 94: 13754-13759.
Springer, M.S., Cleven, G.C., Madsen, O., De Jong, W.W., Waddell, V.G., Amrine, H.M. and Stanhope, M.J. (1997) Endemic African mammals shake the phylogenetic tree. Nature. 388: 61-64.
Springer, M.S., DeBry, R.W., Douady, C., Amrine, H.M., Madsen, O., de Jong, W.W. and Stanhope, M.J. (2001) Mitochondrial versus nuclear gene sequences in deep-level mammalian phylogeny reconstruction. Molecular Biology and Evolution. 18: 132-143.
Stanhope, M.J., Czelusniak, J., Si, J.-S., Nickerson, J. and Goodman, M. (1992) A molecular perspective on mammalian evolution from the gene encoding Interphotoreceptor Retinoid Binding Protein, with convincing evidence for bat monophyly. Molecular Phylogenetics and Evolution. 1: 148-160.
Stellenbosch University http://scholar.sun.ac.za
142
Stanhope, M.J., Smith, M.R., Waddell, V.G., Porter, C.A., Shivji, M.S. and Goodman, M. (1996) Mammalian evolution and the Interphotoreceptor Retinoid Binding Protein (IRBP) gene: convincing evidence for several superordinal. Journal of Molecular Evolution. 43: 83-92.
Stanhope, M.J., Madsen, O., Waddell, V.G., Cleven, G.C., De Jong, W.W. and Springer, M.S. (1998) Highly congruent molecular support for a diverse superordinal clade of endemic african mammals. Molecular Phylogenetics and Evolution. 9: 501-508.
Stanhope, M.J., Waddell, P.J., Madsen, O., De Jong, W.W., Hedges, S.B., Cleven, G.C., Kao, D. and Springer, M.S. (1998) Molecular evidence for multiple origins of Insectivora and for a new order of endemic African insectivore mammals. Proceedings of the National Academy of Sciences, USA. 95: 9967-9972.
Stanyon, R., Koehler, U. and Consigliere, S. (2002) Chromosome painting reveals that galagos have highly derived karyotypes. American Journal of Physical Anthropology. 117: 319-326.
Sullivan, J. (1996) Combining data with different distributions of among-site variation. Systematic Biology. 45: 375-380.
Sullivan, J. and Swofford, D.L. (1997) Are guinea pigs rodents? The importance of adequate models in molecular phylogenetics. Journal of Mammalian Evolution. 4: 77-86.
Sullivan, J., Swofford, D.L. and Naylor, G.J.P. (1999) The effects of taxon sampling on estimating rate heterogeneity parameters of maximum-likelihood models. Molecular Biology and Evolution. 16: 1347-1356.
Sumner, A.T. (1972) A simple technique for demonstrating centromeric heterochromatin. Experimental Cell Research. 75: 304-306.
Susko, E., Spencer, M. and Roger, A. (2005) Biases in phylogenetic estimation can be caused by random sequence segments. Journal of Molecular Evolution. 61: 351-359.
Svartman, M., Stone, G., Page, J.E. and Stanyon, R. (2004) A chromosome painting test of the basal Eutherian karyotype. Chromosome Research. 12: 45-53.
Swofford, D.L. (2002) PAUP*. Phylogenetic Analysis Using Parsimony (*and other methods). In Sunderland, Massachusetts: Sinaur Associates.
Swofford, D.L., Olsen, G., J., Waddell, P.J. and Hillis, D., M. (1996) Phylogenetic inference. In Molecular Systematics. Hillis, D.M., Moritz, C., and Mable, B., K. (eds.) Sunderland, MA: Sinaur Associates, Inc., pp. 407-514.
Tabuce, R., Coiffait, B., Coiffait, P.-E., Mahboubi, M. and Jaeger, J.-J. (2001) A new genus of Macroscelidea (Mammalia) from the Eocene of Algeria: a possible origin for elephant-shrews. Journal of Vertebrate Paleontology. 21: 535-546.
Stellenbosch University http://scholar.sun.ac.za
143
Tassy, P. and Shoshani, J. (1988) The Tethytheria: elephant and their relatives. In Phylogeny and classification of the tetrapods. Benton, M.J. (ed.) Oxford: Clarendon Press, pp. 283-315.
Telenius, H., Carter, N.P., Bebb, C.E., Nordenskjöld, M., Ponder, B.A.J. and Tunnacliffe, A. (1992) Degenerate oligonucleotide-primed PCR: general amplification of target DNA by a single degenerate primer. Genomics. 13: 718-725.
Telenius, H., Pelmear, A.H., Tunnaclife, A., Carter, N.P., Behmel, A., Ferguson-Smith, M.A., Nordenskjöld, M., Pfranger, R. and Ponder, B. (1992) Cytogenetic analysis by chromosome painting using DOP-PCR amplified flow-sorted chromosomes. Genes Chromosomes and Cancer. 4: 257-263.
Thewissen, J.G.M. and Simons, E.L. (2001) Skull of Megalohyrax eocaenus (Hyracoidea, Mammalia) from the Oligocene of Egypt). Journal of Vertebrate Paleontology. 21: 98-106.
Trifonov, V., Yang, F., Ferguson-Smith, M.A. and Robinson, T.J. (2003) Cross-species chromosome painting in the Perissodactyla: delimitation of homologous regions in Burchell’s zebra (Equus burchellii) and the white (Ceratotherium simum) and black rhinoceros (Diceros bicornis). Cytogenetic and Genome Research. 103: 104-110.
Ugarkovic, D. and Plohl, M. (2002) Variation in satellite DNA profiles - causes and effects. The EMBO Journal. 21: 5955-5959.
Van Dijk, M.A.M., Madsen, O., Catzeflis, F.M., Stanhope, M.J., De jong, W.W. and Pagel, M. (2001) Protein signatures support the African clade of mammals. Proceedings of the National Academy of Sciences of the United States of America. 98: 188-193.
Vawter, L. and Brown, W.M. (1986) Nuclear and mitochondrial DNA comparison reveal extreme rate variation in the molecular clock. Science. 234: 194-196.
Venter, J.C., Adams, M.D., Myers, E.W., Li, P.W., Mural, R.J., Sutton, G.G., Smith, H.O., Yandell, M., Evans, C.A., Holt, R.A., et al (2001) The sequence of the human genome. Science. 291: 1304-1351.
Ventura, M., Weigl, S., Carbone, L., Cardone, M.F., Misceo, D., Teti, M., D'Addabbo, P., Wandall, A., Bjorck, E., De Jong, P.J., et al (2004) Recurrent sites for new centromere seeding. Genome Research. 14: 1696-1703.
Vianna, J.A., Bonde, R.K., Caballero, S., Giraldo, J.P., Lima, R.P., Clark, A., Marmontel, M., Morales-Vela, B., De Souza, M.J., Parr, L., et al (2005) Phylogeography, phylogeny and hybridization in trichechid sirenians: implications for manatee conservation. Molecular Ecology. 15: 433-447.
Viegas-Péquignot, E., Dutrillaux, B., Prod-Homme, M. and Petter, F. (1983) Chromosomal phylogeny of Muridae: a study of 10 genera. Cytogenetic and Cell Genetics. 35: 269-278.
Stellenbosch University http://scholar.sun.ac.za
144
Vignaud, P., Duringer, P., Mackaye, H.T., Likius, A., Blondel, C., Boisserie, J.-R., de Bonis, L., Eisenmann, V., Etienne, M.-E., Geraads, D., et al (2002) Geology and palaeontology of the Upper Miocene Toros-Menalla hominid locality, Chad. Nature. 418: 152-155.
Volobouev, V.T., Aniskin, V.M., Lecompte, E. and Ducroz, J.-F. (2002) Patterns of karyotype evolution in complexes of sibling species within three genera of African murid rodents inferred from the comparison of cytogenetic and molecular data. Cytogenetic and Genome Research. 96: 261-275.
Waddell, P.J. and Steel, M.A. (1997) General Time-Reversible distances with unequal rates across sites: mixing gamma and inverse Gaussian distributions with invariant sites. Molecular Phylogenetics and Evolution. 8: 398-414.
Waddell, P.J. and Shelley, S. (2003) Evaluating placental inter-ordinal phylogenies with novel sequences including RAG1, [gamma]-fibrinogen, ND6, and mt-tRNA, plus MCMC-driven nucleotide, amino acid, and codon models. Molecular Phylogenetics and Evolution. 28: 197-224.
Waddell, P.J., Okada, N. and Hasegawa, M. (1999) Towards resolving the interordinal relationships of Placental mammals. Systematic Biology. 48: 1-5.
Waddell, P.J., Kishino, H. and Ota, R. (2001) A phylogenetic foundation for comparative mammalian genomics. Genome Informatics. 12: 141-145.
Waddell, P.J., Kishino, H. and Ota, R. (2002) Very fast algorithms for evaluating the stability of ML and Bayesian phylogenetic trees from sequence data. Genome Informatics. 13: 82-92.
Waddell, P.J., Cao, Y., Hasegawa, M. and Mindell, D.P. (1999a) Assessing the Cretaceous superordinal divergence times within birds and placental mammals by using whole mitochondrial protein sequences and an extended statistical framework. Systematic Biology. 48: 119-137.
Waddell, P.J., Cao, Y., Hauf, J. and Hasegawa, M. (1999b) Using novel phylogenetic methods to evaluate mammalian mtDNA, including amino acid-invariant sites-LogDet plus site stripping, to detect internal conflicts in the data, with special reference to the position of hedghog, armadillo, and elephant. Systematic Biology. 48: 31-53.
Waters, P.D., Kirby, P.J. and Graves, J.A.M. (2001) Assignment of the SMARCF1 gene to tammar wallaby chromosome 5p by fluorescence in situ hybridisation. Cytogenetics and cell genetics. 93: 315-316.
Waters, P.D., Dobigny, G., Pardini, A.T. and Robinson, T.J. (2004) LINE-1 distribution in Afrotheria and Xenarthra: implications for understanding the evolution of LINE-1 in eutherian genomes. Chromosoma. 113: 137-144.
Stellenbosch University http://scholar.sun.ac.za

145
Weinberg, J. (2004) The evolution of eutherian chromosomes. Current Opinion in Genetics and Development. 14: 657-666.
Weinberg, J., Jauch, A., Stanyon, R. and Cremer, T. (1990) Molecular cytotaxonomy of primates by chromosomal in situ suppression of hybridization. Genomics. 8: 347-350.
Weinberg, J., Stanyon, R., Nash, W.G., O'Brien, P.C., Yang, F., O'Brien, S.J. and Ferguson-Smith, M.A. (1997) Conservation of human vs. feline genome organization revealed by reciprocal chromosome painting. Cytogenetic and Cell Genetics. 77: 211-217.
Weitz, B. (1953) Serological relationships of hyrax and elephant. Nature. 171: 261.
Werdelin, L. and Nilsonne, Å. (1999) The evolution of the scrotum and testicular descent in Mammals: a phylogenetic view. Journal of Theoretical Biology. 196: 61-72.
West, J.B., Fu, Z., Gaeth, A.P. and Short, R.V. (2003) Fetal lung development in the elephant reflects the adaptations required for snorkeling in adult life. Respiratory Physiology and Neurobiology. 138: 325-333.
Whidden, H.P. (2002) Extrinsic snout musculature in Afrotheria and Lipotyphla. Journal of Mammalian Evolution. 9: 161-184.
White, J.R., Harkness, D.R., Isaacks, R.E. and Duffield, D.A. (1976) Some studies on blood of the Florida manatee, Trichechus manatus latirostris. Comparative Biochemistry and Physiology. 55A: 413-417.
Wichman, H.A., Payne, C.T., Ryder, O.A., Hamilton, M.J., Maltbie, M. and Baker, R.J. (1991) Genomic distribution of heterochromatic sequences in Equids: implications to rapid chromosomal evolution. Journal of Heredity. 82: 369-377.
Willows-Munro, S., Robinson, T.J. and Matthee, C.A. (2005) Utility of nuclear DNA intron markers at lower taxonomic levels: phylogenetic resolution among nine Tragelaphus spp. Molecular Phylogenetics and Evolution. 35: 624-636.
Yang, F., Carter, N.P., Shi, L. and Ferguson-Smith, M.A. (1995) A comparative study of karyotypes of muntjacs by chromosome painting. Chromosoma. 103: 642-652.
Yang, F., Obrien, P.C.M., Wienberg, J., Neitzel, H., Lin, C.C. and Ferguson-Smith, M.A. (1997) Chromosomal evolution of the Chinese muntjac (Muntiacus reevesi). Chromosoma. 106: 37-43.
Yang, F., Fu, B., O'Brien, P.C.M., Robinson, T.J., Ryder, O.A. and Ferguson-Smith, M.A. (2003) Karyotypic relationships of horses and zebras: results of cross-species chromosome painting. Cytogenetic and Genome Research. 102: 235-243.
Yang, F., Alkalaeva, E.Z., Perelman, P.L., Pardini, A.T., Harrison, W.R., O'Brien, P.C.M., Fu, B., Graphodatsky, A.S., Ferguson-Smith, M.A. and Robinson, T.J. (2003) Reciprocal chromosome painting among human, aardvark, and elephant (superorder
Stellenbosch University http://scholar.sun.ac.za

146
Afrotheria) reveals the likely eutherian ancestral karyotype. Proceedings of the National Academy of Sciences, USA. 100: 1062-1066.
Yang, Z. (1996) Among-site rate variation and its impact on phylogenetic analyses. Trends in Ecology & Evolution. 11: 367-372.
Yoder, A.D., Irwin, J.A. and Payseur, B.A. (2001) Failure of the ILD to determine data combinability for slow loris phylogeny. Systematic Biology. 50: 408-424.
Stellenbosch University http://scholar.sun.ac.za
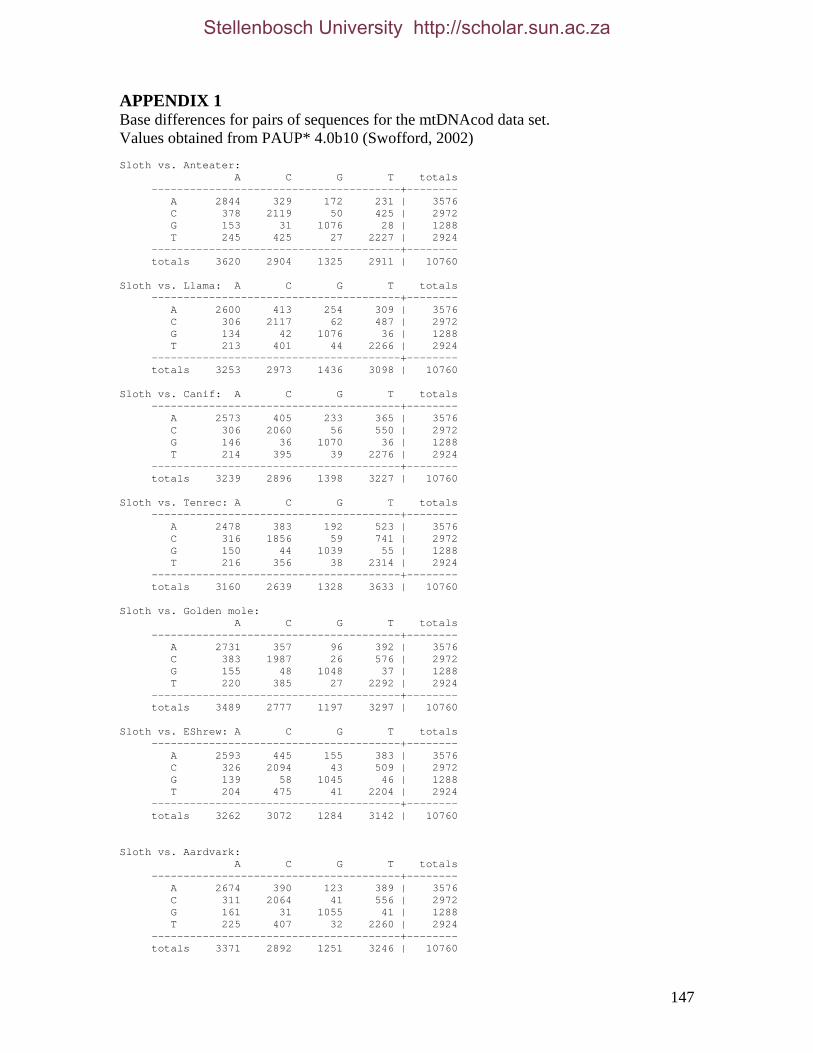
147
APPENDIX 1 Base differences for pairs of sequences for the mtDNAcod data set. Values obtained from PAUP* 4.0b10 (Swofford, 2002) Sloth vs. Anteater: A C G T totals ---------------------------------------+-------- A 2844 329 172 231 | 3576 C 378 2119 50 425 | 2972 G 153 31 1076 28 | 1288 T 245 425 27 2227 | 2924 ---------------------------------------+-------- totals 3620 2904 1325 2911 | 10760 Sloth vs. Llama: A C G T totals ---------------------------------------+-------- A 2600 413 254 309 | 3576 C 306 2117 62 487 | 2972 G 134 42 1076 36 | 1288 T 213 401 44 2266 | 2924 ---------------------------------------+-------- totals 3253 2973 1436 3098 | 10760 Sloth vs. Canif: A C G T totals ---------------------------------------+-------- A 2573 405 233 365 | 3576 C 306 2060 56 550 | 2972 G 146 36 1070 36 | 1288 T 214 395 39 2276 | 2924 ---------------------------------------+-------- totals 3239 2896 1398 3227 | 10760 Sloth vs. Tenrec: A C G T totals ---------------------------------------+-------- A 2478 383 192 523 | 3576 C 316 1856 59 741 | 2972 G 150 44 1039 55 | 1288 T 216 356 38 2314 | 2924 ---------------------------------------+-------- totals 3160 2639 1328 3633 | 10760 Sloth vs. Golden mole: A C G T totals ---------------------------------------+-------- A 2731 357 96 392 | 3576 C 383 1987 26 576 | 2972 G 155 48 1048 37 | 1288 T 220 385 27 2292 | 2924 ---------------------------------------+-------- totals 3489 2777 1197 3297 | 10760 Sloth vs. EShrew: A C G T totals ---------------------------------------+-------- A 2593 445 155 383 | 3576 C 326 2094 43 509 | 2972 G 139 58 1045 46 | 1288 T 204 475 41 2204 | 2924 ---------------------------------------+-------- totals 3262 3072 1284 3142 | 10760 Sloth vs. Aardvark: A C G T totals ---------------------------------------+-------- A 2674 390 123 389 | 3576 C 311 2064 41 556 | 2972 G 161 31 1055 41 | 1288 T 225 407 32 2260 | 2924 ---------------------------------------+-------- totals 3371 2892 1251 3246 | 10760
Stellenbosch University http://scholar.sun.ac.za
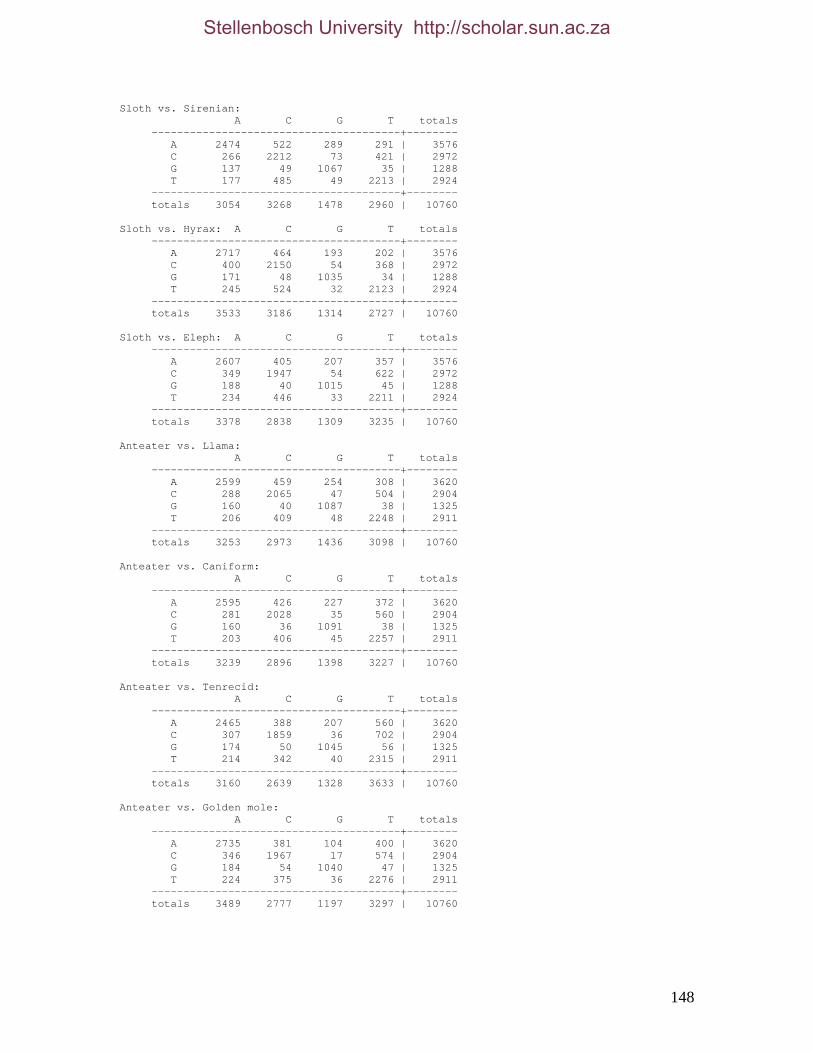
148
Sloth vs. Sirenian: A C G T totals ---------------------------------------+-------- A 2474 522 289 291 | 3576 C 266 2212 73 421 | 2972 G 137 49 1067 35 | 1288 T 177 485 49 2213 | 2924 ---------------------------------------+-------- totals 3054 3268 1478 2960 | 10760 Sloth vs. Hyrax: A C G T totals ---------------------------------------+-------- A 2717 464 193 202 | 3576 C 400 2150 54 368 | 2972 G 171 48 1035 34 | 1288 T 245 524 32 2123 | 2924 ---------------------------------------+-------- totals 3533 3186 1314 2727 | 10760 Sloth vs. Eleph: A C G T totals ---------------------------------------+-------- A 2607 405 207 357 | 3576 C 349 1947 54 622 | 2972 G 188 40 1015 45 | 1288 T 234 446 33 2211 | 2924 ---------------------------------------+-------- totals 3378 2838 1309 3235 | 10760 Anteater vs. Llama: A C G T totals ---------------------------------------+-------- A 2599 459 254 308 | 3620 C 288 2065 47 504 | 2904 G 160 40 1087 38 | 1325 T 206 409 48 2248 | 2911 ---------------------------------------+-------- totals 3253 2973 1436 3098 | 10760 Anteater vs. Caniform: A C G T totals ---------------------------------------+-------- A 2595 426 227 372 | 3620 C 281 2028 35 560 | 2904 G 160 36 1091 38 | 1325 T 203 406 45 2257 | 2911 ---------------------------------------+-------- totals 3239 2896 1398 3227 | 10760 Anteater vs. Tenrecid: A C G T totals ---------------------------------------+-------- A 2465 388 207 560 | 3620 C 307 1859 36 702 | 2904 G 174 50 1045 56 | 1325 T 214 342 40 2315 | 2911 ---------------------------------------+-------- totals 3160 2639 1328 3633 | 10760 Anteater vs. Golden mole: A C G T totals ---------------------------------------+-------- A 2735 381 104 400 | 3620 C 346 1967 17 574 | 2904 G 184 54 1040 47 | 1325 T 224 375 36 2276 | 2911 ---------------------------------------+-------- totals 3489 2777 1197 3297 | 10760
Stellenbosch University http://scholar.sun.ac.za

149
Anteater vs. Ele shrew: A C G T totals ---------------------------------------+-------- A 2554 512 154 400 | 3620 C 326 2062 39 477 | 2904 G 167 55 1050 53 | 1325 T 215 443 41 2212 | 2911 ---------------------------------------+-------- totals 3262 3072 1284 3142 | 10760 Anteater vs. Aardvark: A C G T totals ---------------------------------------+-------- A 2674 414 125 407 | 3620 C 290 2032 32 550 | 2904 G 179 49 1056 41 | 1325 T 228 397 38 2248 | 2911 ---------------------------------------+-------- totals 3371 2892 1251 3246 | 10760 Anteater vs. Sirenian: A C G T totals ---------------------------------------+-------- A 2453 566 293 308 | 3620 C 250 2144 54 456 | 2904 G 153 60 1080 32 | 1325 T 198 498 51 2164 | 2911 ---------------------------------------+-------- totals 3054 3268 1478 2960 | 10760 Anteater vs. Hyrax: A C G T totals ---------------------------------------+-------- A 2698 514 194 214 | 3620 C 367 2131 39 367 | 2904 G 213 41 1036 35 | 1325 T 255 500 45 2111 | 2911 ---------------------------------------+-------- totals 3533 3186 1314 2727 | 10760 Anteater vs. Elephant: A C G T totals ---------------------------------------+-------- A 2600 430 215 375 | 3620 C 312 1908 41 643 | 2904 G 230 48 1004 43 | 1325 T 236 452 49 2174 | 2911 ---------------------------------------+-------- totals 3378 2838 1309 3235 | 10760 Llama vs. Caniform: A C G T totals ---------------------------------------+-------- A 2520 276 197 260 | 3253 C 291 2115 40 527 | 2973 G 229 47 1114 46 | 1436 T 199 458 47 2394 | 3098 ---------------------------------------+-------- totals 3239 2896 1398 3227 | 10760 Llama vs. Tenrecid: A C G T totals ---------------------------------------+-------- A 2327 277 186 463 | 3253 C 338 1881 49 705 | 2973 G 242 66 1054 74 | 1436 T 253 415 39 2391 | 3098 ---------------------------------------+-------- totals 3160 2639 1328 3633 | 10760
Stellenbosch University http://scholar.sun.ac.za

150
Llama vs. Golden mole: A C G T totals ---------------------------------------+-------- A 2536 287 93 337 | 3253 C 400 1993 28 552 | 2973 G 259 57 1060 60 | 1436 T 294 440 16 2348 | 3098 ---------------------------------------+-------- totals 3489 2777 1197 3297 | 10760 Llama vs. Ele shrew: A C G T totals ---------------------------------------+-------- A 2427 385 133 308 | 3253 C 353 2081 42 497 | 2973 G 225 75 1072 64 | 1436 T 257 531 37 2273 | 3098 ---------------------------------------+-------- totals 3262 3072 1284 3142 | 10760 Llama vs. Aardvark: A C G T totals ---------------------------------------+-------- A 2514 306 122 311 | 3253 C 362 2055 35 521 | 2973 G 247 64 1062 63 | 1436 T 248 467 32 2351 | 3098 ---------------------------------------+-------- totals 3371 2892 1251 3246 | 10760 Llama vs. Sirenian: A C G T totals ---------------------------------------+-------- A 2339 391 254 269 | 3253 C 297 2231 61 384 | 2973 G 225 68 1104 39 | 1436 T 193 578 59 2268 | 3098 ---------------------------------------+-------- totals 3054 3268 1478 2960 | 10760 Llama vs. Hyrax: A C G T totals ---------------------------------------+-------- A 2522 391 165 175 | 3253 C 424 2151 51 347 | 2973 G 280 58 1060 38 | 1436 T 307 586 38 2167 | 3098 ---------------------------------------+-------- totals 3533 3186 1314 2727 | 10760 Llama vs. Elephant: A C G T totals ---------------------------------------+-------- A 2424 313 193 323 | 3253 C 385 1972 48 568 | 2973 G 307 56 1027 46 | 1436 T 262 497 41 2298 | 3098 ---------------------------------------+-------- totals 3378 2838 1309 3235 | 10760 Caniform vs. Tenrecid: A C G T totals ---------------------------------------+-------- A 2311 310 184 434 | 3239 C 326 1844 52 674 | 2896 G 227 55 1048 68 | 1398 T 296 430 44 2457 | 3227 ---------------------------------------+-------- totals 3160 2639 1328 3633 | 10760
Stellenbosch University http://scholar.sun.ac.za

151
Caniform vs. Golden mole: A C G T totals ---------------------------------------+-------- A 2543 300 88 308 | 3239 C 392 1972 17 515 | 2896 G 227 59 1062 50 | 1398 T 327 446 30 2424 | 3227 ---------------------------------------+-------- totals 3489 2777 1197 3297 | 10760 Caniform vs. Ele shrew: A C G T totals ---------------------------------------+-------- A 2403 412 126 298 | 3239 C 360 2054 45 437 | 2896 G 201 57 1073 67 | 1398 T 298 549 40 2340 | 3227 ---------------------------------------+-------- totals 3262 3072 1284 3142 | 10760 Caniform vs. Aardvark: A C G T totals ---------------------------------------+-------- A 2513 321 106 299 | 3239 C 343 2024 36 493 | 2896 G 218 44 1078 58 | 1398 T 297 503 31 2396 | 3227 ---------------------------------------+-------- totals 3371 2892 1251 3246 | 10760 Caniform vs. Sirenian: A C G T totals ---------------------------------------+-------- A 2329 419 253 238 | 3239 C 282 2162 67 385 | 2896 G 204 65 1091 38 | 1398 T 239 622 67 2299 | 3227 ---------------------------------------+-------- totals 3054 3268 1478 2960 | 10760 Caniform vs. Hyrax: A C G T totals ---------------------------------------+-------- A 2549 382 152 156 | 3239 C 413 2098 48 337 | 2896 G 221 63 1073 41 | 1398 T 350 643 41 2193 | 3227 ---------------------------------------+-------- totals 3533 3186 1314 2727 | 10760 Caniform vs. Elephant: A C G T totals ---------------------------------------+-------- A 2447 311 189 292 | 3239 C 358 1920 52 566 | 2896 G 268 54 1015 61 | 1398 T 305 553 53 2316 | 3227 ---------------------------------------+-------- totals 3378 2838 1309 3235 | 10760 Tenrecid vs. Golden mole: A C G T totals ---------------------------------------+-------- A 2482 265 97 316 | 3160 C 327 1838 32 442 | 2639 G 185 59 1039 45 | 1328 T 495 615 29 2494 | 3633 ---------------------------------------+-------- totals 3489 2777 1197 3297 | 10760
Stellenbosch University http://scholar.sun.ac.za

152
Tenrecid vs. Ele shrew: A C G T totals ---------------------------------------+-------- A 2337 375 153 295 | 3160 C 317 1902 43 377 | 2639 G 189 57 1036 46 | 1328 T 419 738 52 2424 | 3633 ---------------------------------------+-------- totals 3262 3072 1284 3142 | 10760 Tenrecid vs. Aardvark: A C G T totals ---------------------------------------+-------- A 2421 295 126 318 | 3160 C 306 1867 40 426 | 2639 G 192 52 1034 50 | 1328 T 452 678 51 2452 | 3633 ---------------------------------------+-------- totals 3371 2892 1251 3246 | 10760 Tenrecid vs. Sirenian: A C G T totals ---------------------------------------+-------- A 2257 376 272 255 | 3160 C 235 2026 74 304 | 2639 G 184 64 1050 30 | 1328 T 378 802 82 2371 | 3633 ---------------------------------------+-------- totals 3054 3268 1478 2960 | 10760 Tenrecid vs. Hyrax: A C G T totals ---------------------------------------+-------- A 2446 342 181 191 | 3160 C 354 1952 48 285 | 2639 G 219 50 1028 31 | 1328 T 514 842 57 2220 | 3633 ---------------------------------------+-------- totals 3533 3186 1314 2727 | 10760 Tenrecid vs. Elephant: A C G T totals ---------------------------------------+-------- A 2348 313 197 302 | 3160 C 344 1772 53 470 | 2639 G 225 57 991 55 | 1328 T 461 696 68 2408 | 3633 ---------------------------------------+-------- totals 3378 2838 1309 3235 | 10760 Golden mole vs. Ele shrew: A C G T totals ---------------------------------------+-------- A 2578 431 151 329 | 3489 C 298 2016 34 429 | 2777 G 88 27 1051 31 | 1197 T 298 598 48 2353 | 3297 ---------------------------------------+-------- totals 3262 3072 1284 3142 | 10760 Golden mole vs. Aardvark: A C G T totals ---------------------------------------+-------- A 2684 327 131 347 | 3489 C 271 2006 33 467 | 2777 G 90 22 1053 32 | 1197 T 326 537 34 2400 | 3297 ---------------------------------------+-------- totals 3371 2892 1251 3246 | 10760
Stellenbosch University http://scholar.sun.ac.za
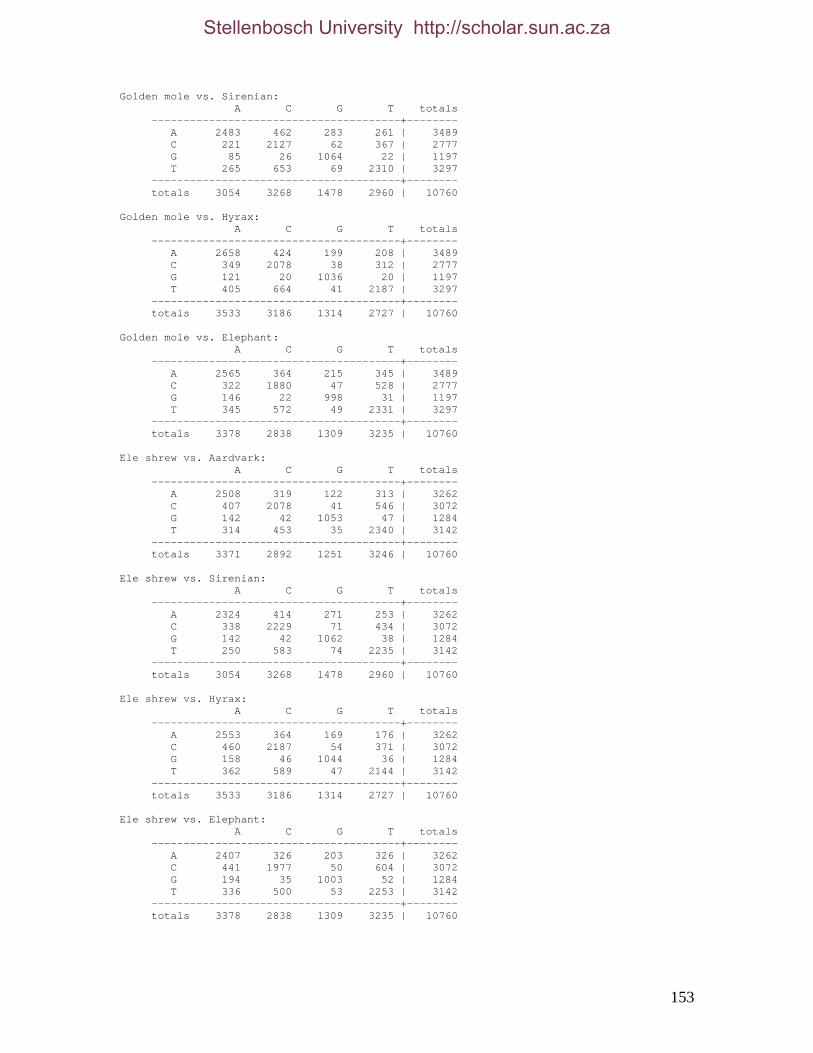
153
Golden mole vs. Sirenian: A C G T totals ---------------------------------------+-------- A 2483 462 283 261 | 3489 C 221 2127 62 367 | 2777 G 85 26 1064 22 | 1197 T 265 653 69 2310 | 3297 ---------------------------------------+-------- totals 3054 3268 1478 2960 | 10760 Golden mole vs. Hyrax: A C G T totals ---------------------------------------+-------- A 2658 424 199 208 | 3489 C 349 2078 38 312 | 2777 G 121 20 1036 20 | 1197 T 405 664 41 2187 | 3297 ---------------------------------------+-------- totals 3533 3186 1314 2727 | 10760 Golden mole vs. Elephant: A C G T totals ---------------------------------------+-------- A 2565 364 215 345 | 3489 C 322 1880 47 528 | 2777 G 146 22 998 31 | 1197 T 345 572 49 2331 | 3297 ---------------------------------------+-------- totals 3378 2838 1309 3235 | 10760 Ele shrew vs. Aardvark: A C G T totals ---------------------------------------+-------- A 2508 319 122 313 | 3262 C 407 2078 41 546 | 3072 G 142 42 1053 47 | 1284 T 314 453 35 2340 | 3142 ---------------------------------------+-------- totals 3371 2892 1251 3246 | 10760 Ele shrew vs. Sirenian: A C G T totals ---------------------------------------+-------- A 2324 414 271 253 | 3262 C 338 2229 71 434 | 3072 G 142 42 1062 38 | 1284 T 250 583 74 2235 | 3142 ---------------------------------------+-------- totals 3054 3268 1478 2960 | 10760 Ele shrew vs. Hyrax: A C G T totals ---------------------------------------+-------- A 2553 364 169 176 | 3262 C 460 2187 54 371 | 3072 G 158 46 1044 36 | 1284 T 362 589 47 2144 | 3142 ---------------------------------------+-------- totals 3533 3186 1314 2727 | 10760 Ele shrew vs. Elephant: A C G T totals ---------------------------------------+-------- A 2407 326 203 326 | 3262 C 441 1977 50 604 | 3072 G 194 35 1003 52 | 1284 T 336 500 53 2253 | 3142 ---------------------------------------+-------- totals 3378 2838 1309 3235 | 10760
Stellenbosch University http://scholar.sun.ac.za
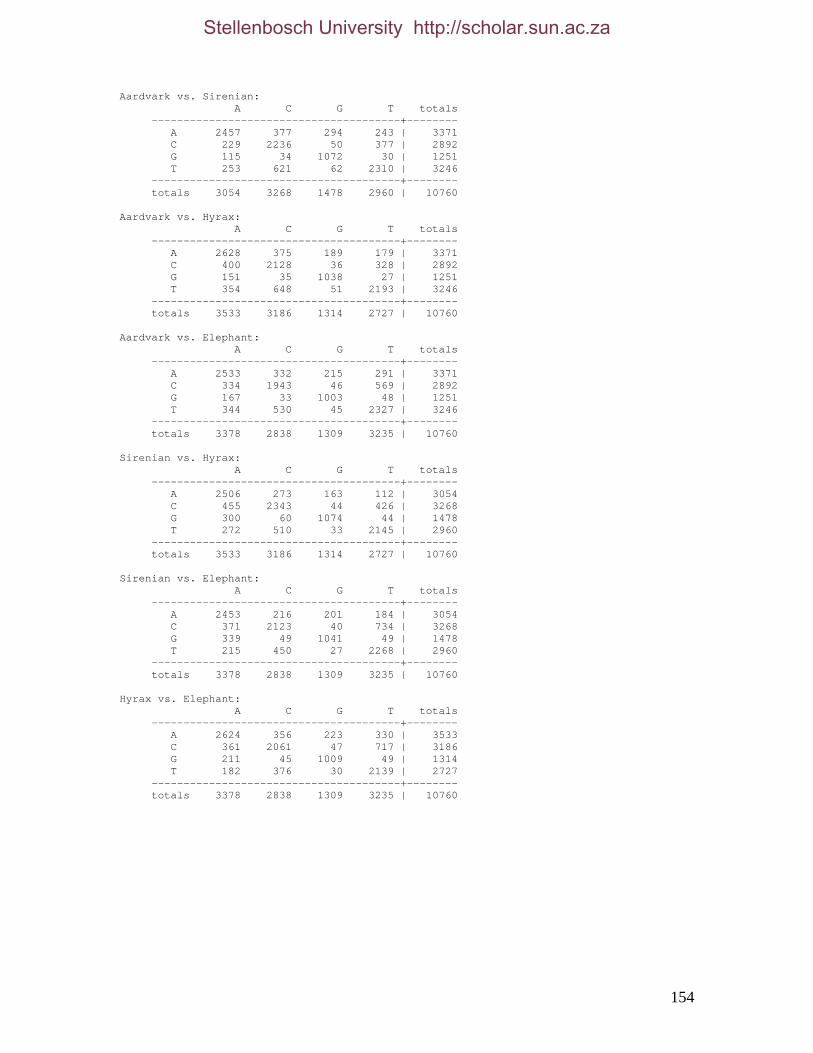
154
Aardvark vs. Sirenian: A C G T totals ---------------------------------------+-------- A 2457 377 294 243 | 3371 C 229 2236 50 377 | 2892 G 115 34 1072 30 | 1251 T 253 621 62 2310 | 3246 ---------------------------------------+-------- totals 3054 3268 1478 2960 | 10760 Aardvark vs. Hyrax: A C G T totals ---------------------------------------+-------- A 2628 375 189 179 | 3371 C 400 2128 36 328 | 2892 G 151 35 1038 27 | 1251 T 354 648 51 2193 | 3246 ---------------------------------------+-------- totals 3533 3186 1314 2727 | 10760 Aardvark vs. Elephant: A C G T totals ---------------------------------------+-------- A 2533 332 215 291 | 3371 C 334 1943 46 569 | 2892 G 167 33 1003 48 | 1251 T 344 530 45 2327 | 3246 ---------------------------------------+-------- totals 3378 2838 1309 3235 | 10760 Sirenian vs. Hyrax: A C G T totals ---------------------------------------+-------- A 2506 273 163 112 | 3054 C 455 2343 44 426 | 3268 G 300 60 1074 44 | 1478 T 272 510 33 2145 | 2960 ---------------------------------------+-------- totals 3533 3186 1314 2727 | 10760 Sirenian vs. Elephant: A C G T totals ---------------------------------------+-------- A 2453 216 201 184 | 3054 C 371 2123 40 734 | 3268 G 339 49 1041 49 | 1478 T 215 450 27 2268 | 2960 ---------------------------------------+-------- totals 3378 2838 1309 3235 | 10760 Hyrax vs. Elephant: A C G T totals ---------------------------------------+-------- A 2624 356 223 330 | 3533 C 361 2061 47 717 | 3186 G 211 45 1009 49 | 1314 T 182 376 30 2139 | 2727 ---------------------------------------+-------- totals 3378 2838 1309 3235 | 10760
Stellenbosch University http://scholar.sun.ac.za
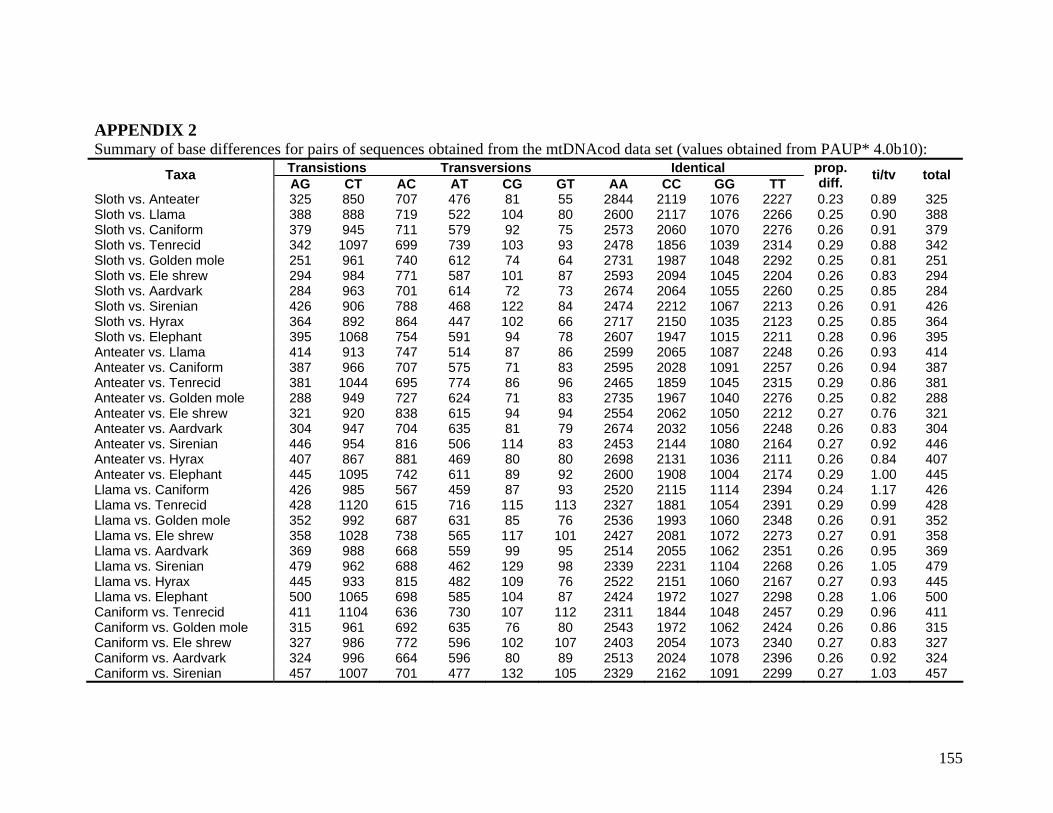
155
APPENDIX 2 Summary of base differences for pairs of sequences obtained from the mtDNAcod data set (values obtained from PAUP* 4.0b10):
Transistions Transversions Identical Taxa AG CT AC AT CG GT AA CC GG TT prop. diff. ti/tv total
Sloth vs. Anteater 325 850 707 476 81 55 2844 2119 1076 2227 0.23 0.89 325 Sloth vs. Llama 388 888 719 522 104 80 2600 2117 1076 2266 0.25 0.90 388 Sloth vs. Caniform 379 945 711 579 92 75 2573 2060 1070 2276 0.26 0.91 379 Sloth vs. Tenrecid 342 1097 699 739 103 93 2478 1856 1039 2314 0.29 0.88 342 Sloth vs. Golden mole 251 961 740 612 74 64 2731 1987 1048 2292 0.25 0.81 251 Sloth vs. Ele shrew 294 984 771 587 101 87 2593 2094 1045 2204 0.26 0.83 294 Sloth vs. Aardvark 284 963 701 614 72 73 2674 2064 1055 2260 0.25 0.85 284 Sloth vs. Sirenian 426 906 788 468 122 84 2474 2212 1067 2213 0.26 0.91 426 Sloth vs. Hyrax 364 892 864 447 102 66 2717 2150 1035 2123 0.25 0.85 364 Sloth vs. Elephant 395 1068 754 591 94 78 2607 1947 1015 2211 0.28 0.96 395 Anteater vs. Llama 414 913 747 514 87 86 2599 2065 1087 2248 0.26 0.93 414 Anteater vs. Caniform 387 966 707 575 71 83 2595 2028 1091 2257 0.26 0.94 387 Anteater vs. Tenrecid 381 1044 695 774 86 96 2465 1859 1045 2315 0.29 0.86 381 Anteater vs. Golden mole 288 949 727 624 71 83 2735 1967 1040 2276 0.25 0.82 288 Anteater vs. Ele shrew 321 920 838 615 94 94 2554 2062 1050 2212 0.27 0.76 321 Anteater vs. Aardvark 304 947 704 635 81 79 2674 2032 1056 2248 0.26 0.83 304 Anteater vs. Sirenian 446 954 816 506 114 83 2453 2144 1080 2164 0.27 0.92 446 Anteater vs. Hyrax 407 867 881 469 80 80 2698 2131 1036 2111 0.26 0.84 407 Anteater vs. Elephant 445 1095 742 611 89 92 2600 1908 1004 2174 0.29 1.00 445 Llama vs. Caniform 426 985 567 459 87 93 2520 2115 1114 2394 0.24 1.17 426 Llama vs. Tenrecid 428 1120 615 716 115 113 2327 1881 1054 2391 0.29 0.99 428 Llama vs. Golden mole 352 992 687 631 85 76 2536 1993 1060 2348 0.26 0.91 352 Llama vs. Ele shrew 358 1028 738 565 117 101 2427 2081 1072 2273 0.27 0.91 358 Llama vs. Aardvark 369 988 668 559 99 95 2514 2055 1062 2351 0.26 0.95 369 Llama vs. Sirenian 479 962 688 462 129 98 2339 2231 1104 2268 0.26 1.05 479 Llama vs. Hyrax 445 933 815 482 109 76 2522 2151 1060 2167 0.27 0.93 445 Llama vs. Elephant 500 1065 698 585 104 87 2424 1972 1027 2298 0.28 1.06 500 Caniform vs. Tenrecid 411 1104 636 730 107 112 2311 1844 1048 2457 0.29 0.96 411 Caniform vs. Golden mole 315 961 692 635 76 80 2543 1972 1062 2424 0.26 0.86 315 Caniform vs. Ele shrew 327 986 772 596 102 107 2403 2054 1073 2340 0.27 0.83 327 Caniform vs. Aardvark 324 996 664 596 80 89 2513 2024 1078 2396 0.26 0.92 324 Caniform vs. Sirenian 457 1007 701 477 132 105 2329 2162 1091 2299 0.27 1.03 457
Stellenbosch University http://scholar.sun.ac.za

156
Transistions Transversions Identical Taxa AG CT AC AT CG GT AA CC GG TT
prop. diff. ti/tv total
Caniform vs. Hyrax 373 980 795 506 111 82 2549 2098 1073 2193 0.26 0.91 373 Caniform vs. Elephant 457 1119 669 597 106 114 2447 1920 1015 2316 0.28 1.06 457 Tenrecid vs. Golden mole 282 1057 592 811 91 74 2482 1838 1039 2494 0.27 0.85 282 Tenrecid vs. Ele shrew 342 1115 692 714 100 98 2337 1902 1036 2424 0.28 0.91 342 Tenrecid vs. Aardvark 318 1104 601 770 92 101 2421 1867 1034 2452 0.28 0.91 318 Tenrecid vs. Sirenian 456 1106 611 633 138 112 2257 2026 1050 2371 0.28 1.05 456 Tenrecid vs. Hyrax 400 1127 696 705 98 88 2446 1952 1028 2220 0.29 0.96 400 Tenrecid vs. Elephant 422 1166 657 763 110 123 2348 1772 991 2408 0.30 0.96 422 Golden mole v Ele shrew 239 1027 729 627 61 79 2578 2016 1051 2353 0.26 0.85 239 Golden mole v Aardvark 221 1004 598 673 55 66 2684 2006 1053 2400 0.24 0.88 221 Golden mole v Sirenian 368 1020 683 526 88 91 2483 2127 1064 2310 0.26 1.00 368 Golden mole v Hyrax 320 976 773 613 58 61 2658 2078 1036 2187 0.26 0.86 320 Golden mole v Elephant 361 1100 686 690 69 80 2565 1880 998 2331 0.28 0.96 361 Ele shrew vs. Aardvark 264 999 726 627 83 82 2508 2078 1053 2340 0.26 0.83 264 Ele shrew vs. Sirenian 413 1017 752 503 113 112 2324 2229 1062 2235 0.27 0.97 413 Ele shrew vs. Hyrax 327 960 824 538 100 83 2553 2187 1044 2144 0.26 0.83 327 Ele shrew vs. Elephant 397 1104 767 662 85 105 2407 1977 1003 2253 0.29 0.93 397 Aardvark vs. Sirenian 409 998 606 496 84 92 2457 2236 1072 2310 0.25 1.10 409 Aardvark vs. Hyrax 340 976 775 533 71 78 2628 2128 1038 2193 0.26 0.90 340 Aardvark vs. Elephant 382 1099 666 635 79 93 2533 1943 1003 2327 0.27 1.01 382 Sirenian vs. Hyrax 463 936 728 384 104 77 2506 2343 1074 2145 0.25 1.08 463 Sirenian vs. Elephant 540 1184 587 399 89 76 2453 2123 1041 2268 0.27 1.50 540 Hyrax vs. Elephant 434 1093 717 512 92 79 2624 2061 1009 2139 0.27 1.09 434
Stellenbosch University http://scholar.sun.ac.za

157
APPENDIX 3 Values for proportion of invariant sites (I) and gamma shape parameter (G) used to calculate ti/tv estimates in section 2.3.1.3. All values were obtained from Modeltest 3.06 where a GTR+I+G model was selected except for the nuccod1 and nuccod3 data sets which returned a GTR+G model. Here MrBayes 3.1 was used to obtain values for I. The G values obtained from both Modeltest and MrBayes 3.1 are included in the table for comparison.
Data set Invariant sites (I) Gamma (G) Nuccod 0.121 0.764 Nuccod1 BI 0.533 BI 0.439 (Mt 0.428) Nuccod2 0.348 0.864 Nuccod3 BI 0.174 BI 1.642 (Mt 1.629)
MtDNAcod 0.047 0.195 MtDNAcod1 0.435 1.190 MtDNAcod2 0.556 0.496 MtDNAcod3 0.010 0.341
Stellenbosch University http://scholar.sun.ac.za

158
APPENDIX 4 Incongruent length differences (ILD) for the pairwise comparisons among the 39 fragments included in this study. Numbers in bold indicate statistical significance at P<0.05.
Stellenbosch University http://scholar.sun.ac.za

159
ND2 ND3 ND4L ND4 ND5 CO1 CO2 CO3 CytB ATP8 ATP6 12SrRNA 16SrRNA tRNAval ADORA3 A2AB ADRB2 ATP7a ND1 0.549 0.335 0.630 0.630 0.311 0.700 0.212 0.676 0.901 0.428 0.423 0.582 0.755 0.993 0.935 0.724 0.322 0.663 ND2 0.333 0.775 0.706 0.302 0.891 0.381 0.198 0.854 0.582 0.163 0.634 0.976 0.903 0.993 0.986 0.994 0.891 ND3 0.563 0.755 0.789 0.372 0.658 0.795 0.450 0.865 0.596 0.081 0.251 0.814 0.200 0.009 0.016 0.001
ND4L 0.704 0.613 0.823 0.389 0.501 0.803 0.144 0.606 0.036 0.084 0.501 0.506 0.022 0.045 0.002 ND4 0.931 0.982 0.505 0.326 0.945 0.542 0.269 0.244 0.654 0.793 0.998 0.462 0.810 0.250 ND5 0.945 0.223 0.854 0.842 0.746 0.328 0.081 0.795 0.936 0.997 0.107 0.523 0.056 CO1 0.782 0.958 0.943 0.832 0.825 0.679 0.967 0.987 0.973 0.471 0.905 0.358 CO2 0.276 0.423 0.145 0.139 0.521 0.234 0.998 0.183 0.044 0.045 0.004 CO3 0.051 0.689 0.844 0.510 0.761 0.976 0.788 0.003 0.033 0.007 CytB 0.650 0.116 0.513 0.864 0.844 0.998 0.783 0.938 0.295 ATP8 0.052 0.190 0.564 0.650 0.326 0.092 0.066 0.006 ATP6 0.032 0.140 0.495 0.430 0.006 0.029 0.003
12SrRNA 0.254 0.942 0.254 0.093 0.056 0.062 16SrRNA 0.697 0.523 0.548 0.230 0.044 tRNAval 0.081 0.269 0.079 0.011 ADORA3 0.351 0.882 0.053
A2AB 0.530 0.250 ADRB2 0.071 ATP7a BDNF
BRCA1 CNR1 EDG1 IRBP PNOC RAG1 RAG2 TYR VWF ZFX
APOB APP BMI1 CREM PLCB4 MGF
PKRC1 STAT
Stellenbosch University http://scholar.sun.ac.za
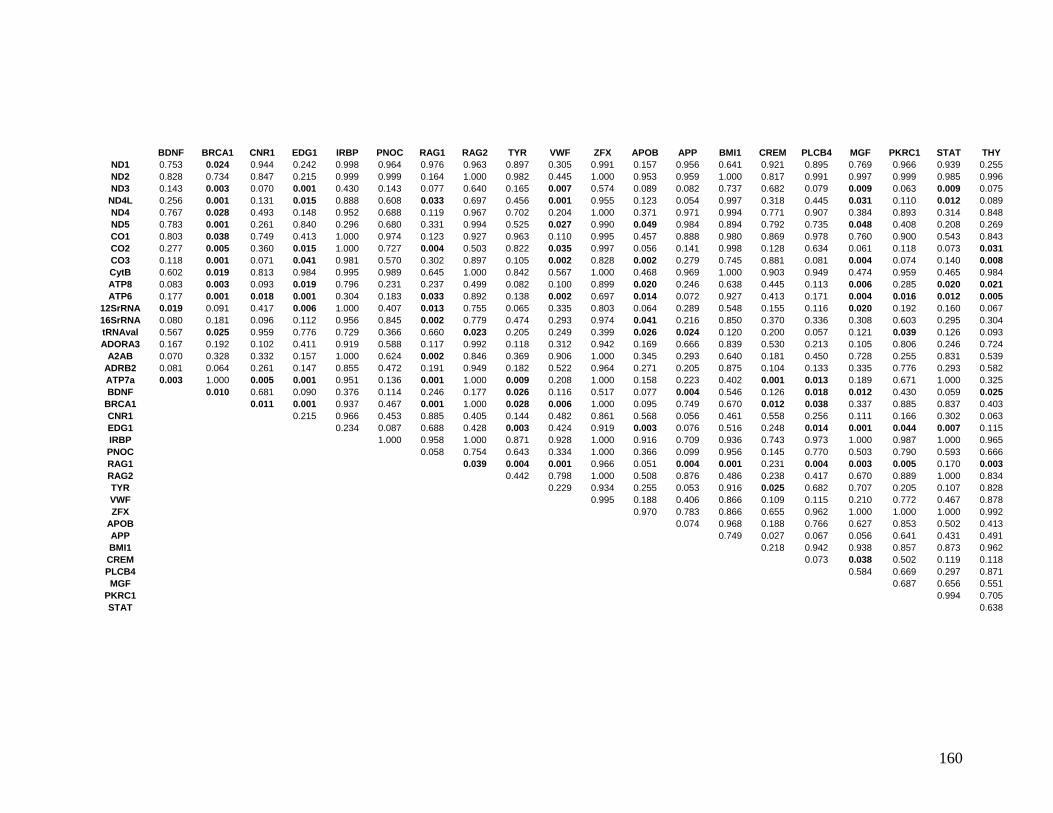
160
BDNF BRCA1 CNR1 EDG1 IRBP PNOC RAG1 RAG2 TYR VWF ZFX APOB APP BMI1 CREM PLCB4 MGF PKRC1 STAT THY
ND1 0.753 0.024 0.944 0.242 0.998 0.964 0.976 0.963 0.897 0.305 0.991 0.157 0.956 0.641 0.921 0.895 0.769 0.966 0.939 0.255 ND2 0.828 0.734 0.847 0.215 0.999 0.999 0.164 1.000 0.982 0.445 1.000 0.953 0.959 1.000 0.817 0.991 0.997 0.999 0.985 0.996 ND3 0.143 0.003 0.070 0.001 0.430 0.143 0.077 0.640 0.165 0.007 0.574 0.089 0.082 0.737 0.682 0.079 0.009 0.063 0.009 0.075
ND4L 0.256 0.001 0.131 0.015 0.888 0.608 0.033 0.697 0.456 0.001 0.955 0.123 0.054 0.997 0.318 0.445 0.031 0.110 0.012 0.089 ND4 0.767 0.028 0.493 0.148 0.952 0.688 0.119 0.967 0.702 0.204 1.000 0.371 0.971 0.994 0.771 0.907 0.384 0.893 0.314 0.848 ND5 0.783 0.001 0.261 0.840 0.296 0.680 0.331 0.994 0.525 0.027 0.990 0.049 0.984 0.894 0.792 0.735 0.048 0.408 0.208 0.269 CO1 0.803 0.038 0.749 0.413 1.000 0.974 0.123 0.927 0.963 0.110 0.995 0.457 0.888 0.980 0.869 0.978 0.760 0.900 0.543 0.843 CO2 0.277 0.005 0.360 0.015 1.000 0.727 0.004 0.503 0.822 0.035 0.997 0.056 0.141 0.998 0.128 0.634 0.061 0.118 0.073 0.031 CO3 0.118 0.001 0.071 0.041 0.981 0.570 0.302 0.897 0.105 0.002 0.828 0.002 0.279 0.745 0.881 0.081 0.004 0.074 0.140 0.008 CytB 0.602 0.019 0.813 0.984 0.995 0.989 0.645 1.000 0.842 0.567 1.000 0.468 0.969 1.000 0.903 0.949 0.474 0.959 0.465 0.984 ATP8 0.083 0.003 0.093 0.019 0.796 0.231 0.237 0.499 0.082 0.100 0.899 0.020 0.246 0.638 0.445 0.113 0.006 0.285 0.020 0.021 ATP6 0.177 0.001 0.018 0.001 0.304 0.183 0.033 0.892 0.138 0.002 0.697 0.014 0.072 0.927 0.413 0.171 0.004 0.016 0.012 0.005
12SrRNA 0.019 0.091 0.417 0.006 1.000 0.407 0.013 0.755 0.065 0.335 0.803 0.064 0.289 0.548 0.155 0.116 0.020 0.192 0.160 0.067 16SrRNA 0.080 0.181 0.096 0.112 0.956 0.845 0.002 0.779 0.474 0.293 0.974 0.041 0.216 0.850 0.370 0.336 0.308 0.603 0.295 0.304 tRNAval 0.567 0.025 0.959 0.776 0.729 0.366 0.660 0.023 0.205 0.249 0.399 0.026 0.024 0.120 0.200 0.057 0.121 0.039 0.126 0.093 ADORA3 0.167 0.192 0.102 0.411 0.919 0.588 0.117 0.992 0.118 0.312 0.942 0.169 0.666 0.839 0.530 0.213 0.105 0.806 0.246 0.724
A2AB 0.070 0.328 0.332 0.157 1.000 0.624 0.002 0.846 0.369 0.906 1.000 0.345 0.293 0.640 0.181 0.450 0.728 0.255 0.831 0.539 ADRB2 0.081 0.064 0.261 0.147 0.855 0.472 0.191 0.949 0.182 0.522 0.964 0.271 0.205 0.875 0.104 0.133 0.335 0.776 0.293 0.582 ATP7a 0.003 1.000 0.005 0.001 0.951 0.136 0.001 1.000 0.009 0.208 1.000 0.158 0.223 0.402 0.001 0.013 0.189 0.671 1.000 0.325 BDNF 0.010 0.681 0.090 0.376 0.114 0.246 0.177 0.026 0.116 0.517 0.077 0.004 0.546 0.126 0.018 0.012 0.430 0.059 0.025
BRCA1 0.011 0.001 0.937 0.467 0.001 1.000 0.028 0.006 1.000 0.095 0.749 0.670 0.012 0.038 0.337 0.885 0.837 0.403 CNR1 0.215 0.966 0.453 0.885 0.405 0.144 0.482 0.861 0.568 0.056 0.461 0.558 0.256 0.111 0.166 0.302 0.063 EDG1 0.234 0.087 0.688 0.428 0.003 0.424 0.919 0.003 0.076 0.516 0.248 0.014 0.001 0.044 0.007 0.115 IRBP 1.000 0.958 1.000 0.871 0.928 1.000 0.916 0.709 0.936 0.743 0.973 1.000 0.987 1.000 0.965 PNOC 0.058 0.754 0.643 0.334 1.000 0.366 0.099 0.956 0.145 0.770 0.503 0.790 0.593 0.666 RAG1 0.039 0.004 0.001 0.966 0.051 0.004 0.001 0.231 0.004 0.003 0.005 0.170 0.003 RAG2 0.442 0.798 1.000 0.508 0.876 0.486 0.238 0.417 0.670 0.889 1.000 0.834 TYR 0.229 0.934 0.255 0.053 0.916 0.025 0.682 0.707 0.205 0.107 0.828 VWF 0.995 0.188 0.406 0.866 0.109 0.115 0.210 0.772 0.467 0.878 ZFX 0.970 0.783 0.866 0.655 0.962 1.000 1.000 1.000 0.992
APOB 0.074 0.968 0.188 0.766 0.627 0.853 0.502 0.413 APP 0.749 0.027 0.067 0.056 0.641 0.431 0.491 BMI1 0.218 0.942 0.938 0.857 0.873 0.962 CREM 0.073 0.038 0.502 0.119 0.118 PLCB4 0.584 0.669 0.297 0.871 MGF 0.687 0.656 0.551
PKRC1 0.994 0.705 STAT 0.638
Stellenbosch University http://scholar.sun.ac.za
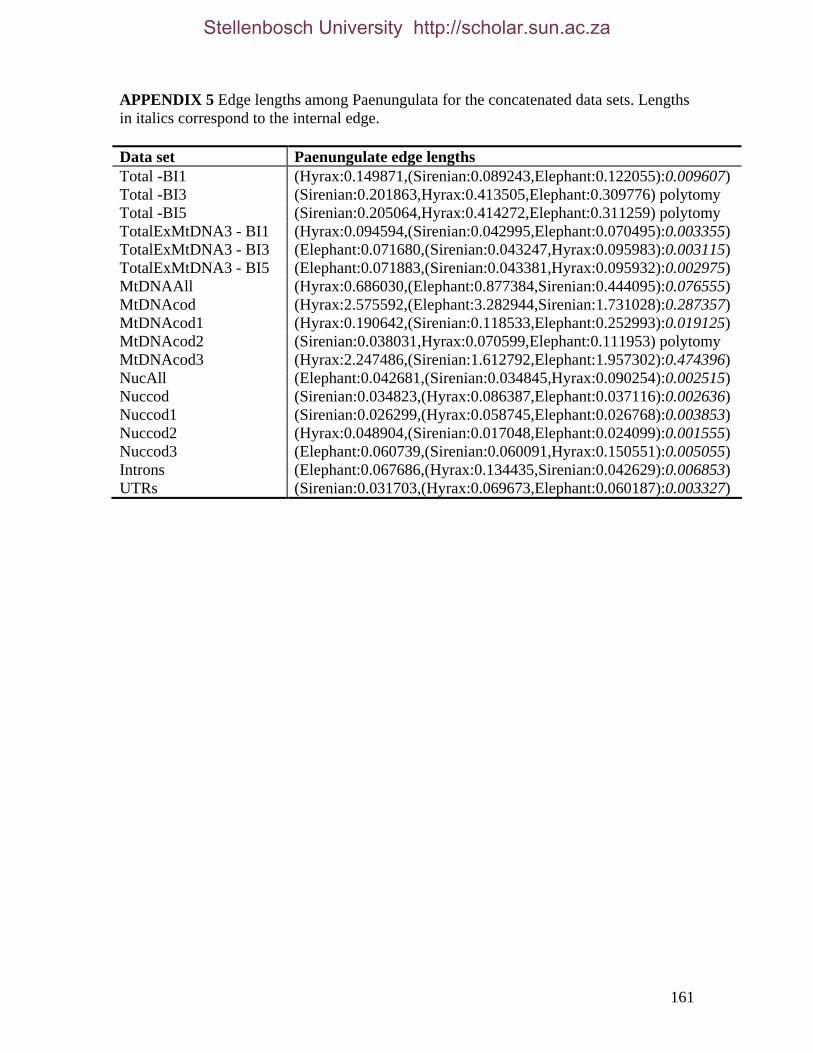
161
APPENDIX 5 Edge lengths among Paenungulata for the concatenated data sets. Lengths in italics correspond to the internal edge. Data set Paenungulate edge lengths Total -BI1 (Hyrax:0.149871,(Sirenian:0.089243,Elephant:0.122055):0.009607) Total -BI3 (Sirenian:0.201863,Hyrax:0.413505,Elephant:0.309776) polytomy Total -BI5 (Sirenian:0.205064,Hyrax:0.414272,Elephant:0.311259) polytomy TotalExMtDNA3 - BI1 (Hyrax:0.094594,(Sirenian:0.042995,Elephant:0.070495):0.003355) TotalExMtDNA3 - BI3 (Elephant:0.071680,(Sirenian:0.043247,Hyrax:0.095983):0.003115) TotalExMtDNA3 - BI5 (Elephant:0.071883,(Sirenian:0.043381,Hyrax:0.095932):0.002975) MtDNAAll (Hyrax:0.686030,(Elephant:0.877384,Sirenian:0.444095):0.076555) MtDNAcod (Hyrax:2.575592,(Elephant:3.282944,Sirenian:1.731028):0.287357) MtDNAcod1 (Hyrax:0.190642,(Sirenian:0.118533,Elephant:0.252993):0.019125) MtDNAcod2 (Sirenian:0.038031,Hyrax:0.070599,Elephant:0.111953) polytomy MtDNAcod3 (Hyrax:2.247486,(Sirenian:1.612792,Elephant:1.957302):0.474396) NucAll (Elephant:0.042681,(Sirenian:0.034845,Hyrax:0.090254):0.002515) Nuccod (Sirenian:0.034823,(Hyrax:0.086387,Elephant:0.037116):0.002636) Nuccod1 (Sirenian:0.026299,(Hyrax:0.058745,Elephant:0.026768):0.003853) Nuccod2 (Hyrax:0.048904,(Sirenian:0.017048,Elephant:0.024099):0.001555) Nuccod3 (Elephant:0.060739,(Sirenian:0.060091,Hyrax:0.150551):0.005055) Introns (Elephant:0.067686,(Hyrax:0.134435,Sirenian:0.042629):0.006853) UTRs (Sirenian:0.031703,(Hyrax:0.069673,Elephant:0.060187):0.003327)
Stellenbosch University http://scholar.sun.ac.za
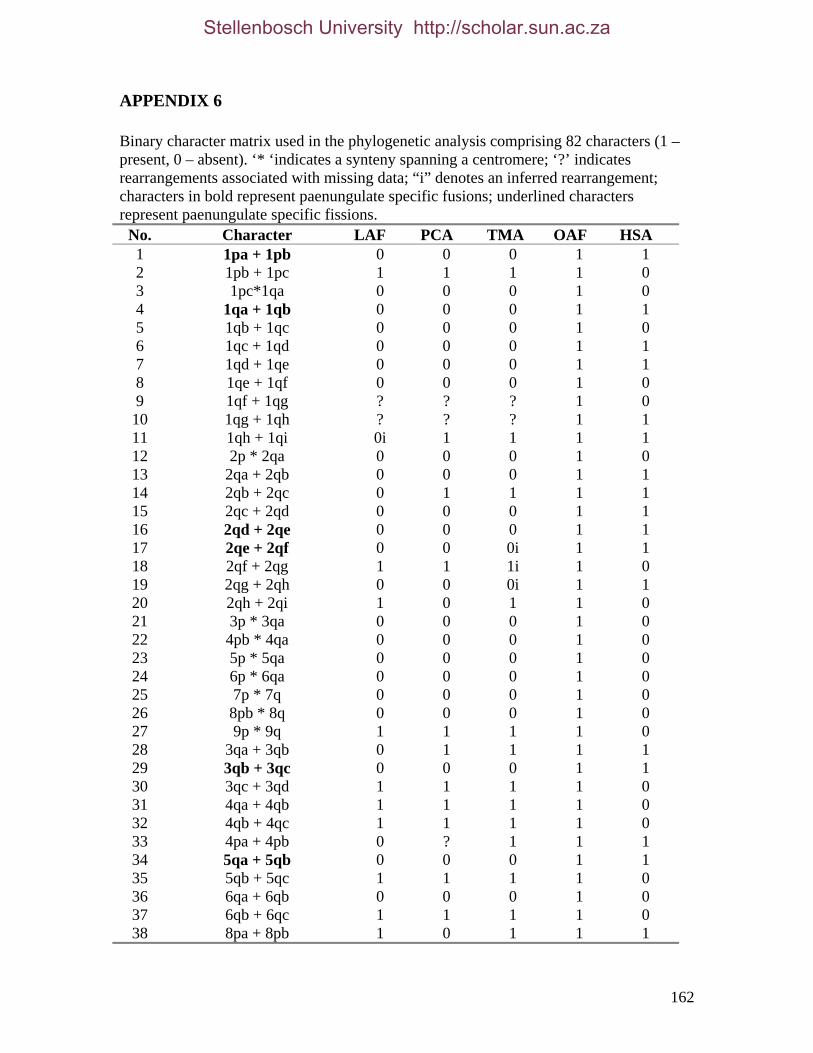
162
APPENDIX 6 Binary character matrix used in the phylogenetic analysis comprising 82 characters (1 – present, 0 – absent). ‘* ‘indicates a synteny spanning a centromere; ‘?’ indicates rearrangements associated with missing data; “i” denotes an inferred rearrangement; characters in bold represent paenungulate specific fusions; underlined characters represent paenungulate specific fissions.
No. Character LAF PCA TMA OAF HSA 1 1pa + 1pb 0 0 0 1 1 2 1pb + 1pc 1 1 1 1 0 3 1pc*1qa 0 0 0 1 0 4 1qa + 1qb 0 0 0 1 1 5 1qb + 1qc 0 0 0 1 0 6 1qc + 1qd 0 0 0 1 1 7 1qd + 1qe 0 0 0 1 1 8 1qe + 1qf 0 0 0 1 0 9 1qf + 1qg ? ? ? 1 0 10 1qg + 1qh ? ? ? 1 1 11 1qh + 1qi 0i 1 1 1 1 12 2p * 2qa 0 0 0 1 0 13 2qa + 2qb 0 0 0 1 1 14 2qb + 2qc 0 1 1 1 1 15 2qc + 2qd 0 0 0 1 1 16 2qd + 2qe 0 0 0 1 1 17 2qe + 2qf 0 0 0i 1 1 18 2qf + 2qg 1 1 1i 1 0 19 2qg + 2qh 0 0 0i 1 1 20 2qh + 2qi 1 0 1 1 0 21 3p * 3qa 0 0 0 1 0 22 4pb * 4qa 0 0 0 1 0 23 5p * 5qa 0 0 0 1 0 24 6p * 6qa 0 0 0 1 0 25 7p * 7q 0 0 0 1 0 26 8pb * 8q 0 0 0 1 0 27 9p * 9q 1 1 1 1 0 28 3qa + 3qb 0 1 1 1 1 29 3qb + 3qc 0 0 0 1 1 30 3qc + 3qd 1 1 1 1 0 31 4qa + 4qb 1 1 1 1 0 32 4qb + 4qc 1 1 1 1 0 33 4pa + 4pb 0 ? 1 1 1 34 5qa + 5qb 0 0 0 1 1 35 5qb + 5qc 1 1 1 1 0 36 6qa + 6qb 0 0 0 1 0 37 6qb + 6qc 1 1 1 1 0 38 8pa + 8pb 1 0 1 1 1
Stellenbosch University http://scholar.sun.ac.za

163
39 INV LAF3 1 0 0 0 0 40 2qe + 3p 1 0 0 0 0 41 4pb + 1qc 1 ? 0 0 0 42 6p + 1pa 1 1 1 0 0 43 1qe+ 6qb 1 0 0 0 0 44 1qh + 5qa 1 0 0 0 0 45 3qa + 2qg 1 0 0 0 0 46 1pc + 1qg 1 ? ? 0 0 47 9q * 1qf 1 1 1 0 0 48 1qb * 2qd 1 1 1 0 0 49 2qb(c) + 1qd 1 1 1 0 0 50 PCA10pprox + 5qa ?/0 ? ? ? ? 51 5qa + 8pa 0 1 0 0 0 52 2qh + 2qe 0 1 0 0 0 53 2qb * 1qd 1 1 1 0 0 54 1qd + 8pb 0 1 0 0 0 55 PCA24p * 2p ?/0 1 ? ? ? 56 2p * 4pb 0 0 1 0 0 57 2qe + 5p 0 0 1 0 0 58 INV TMA7 * 0 0 1 0 0 59 5qa * 3qa 0 0 1 0 0 60 6qc * 2qa 0 0 1 0 0 61 1qe * 2qg 0 0 1 0 0 62 INV TMA5 0 0 1 0 0 63 3qb + 3qc inv 0 0 0 0 1 64 3qa + 3qb inv 0 0 0 0 1 65 1qe + 6qa 0 0 0 0 1 66 2qa + 2qc 0 0 0 0 1 67 2qb + 2qc inv 0 0 0 0 1 68 2qc + 2qb inv 0 0 0 0 1 69 2qa + 2qf 0 0 0 0 1 70 2qd + 2qe inv 0 0 0 0 1 71 6qb + 5pb inv 0 0 0 0 1 72 5p * 6qb inv 0 0 0 0 1 73 6qb + 5p inv 0 0 0 0 1 74 5p + 6qb inv 0 0 0 0 1 75 6qb + 5p inv 0 0 0 0 1 76 1qf * 7p 0 0 0 0 1 77 4qa * 8q 0 0 0 0 1 78 4qb + 9p 0 0 0 0 1 79 1qb + 1qa inv 0 0 0 0 1 80 6qc * 1pc 0 0 0 0 1 81 3qd * 1pb 0 0 0 0 1 82 9q + 4qc 0 0 0 0 1
Stellenbosch University http://scholar.sun.ac.za