Embed Size (px)
Citation preview

ii
Genetics of quality and yield related traits in spring wheat
(Triticum aestivum L.) under terminal heat stress conditions
By
Shadab Shaukat
M.Sc. (Hons.) Agri.
2011-ag-563
A thesis submitted in partial fulfillment of the
requirements for the degree of
DOCTOR OF PHELOSOPHY
IN
PLANT BREEDING AND GENETICS
DEPARMENT OF PLANT BREEDING AND GENETICS
FACULTY OF AGRICULTURE
UNIVERSITY OF AGRICULTURE, FAISALABAD
PAKISTAN
2018

iii

iv
v

vi
vii
This humble effort is
Dedicated
To
My Beloved
PARENTS
viii
ACKNOWLEDGEMENTS
All praise is due to Allah, The Compassionate, and The Merciful, Who gave me
health, thought, affectionate parents, loveable siblings, talented teachers, helping friends and
opportunity to complete this work. In addition, with all humility and reverence, I present my
regards before the Holy Prophet (P.B.U.H) for whose sake this universe was created.
I am highly indebted to my supervisor Prof. Dr. Abdus Salam Khan,
Principal/Project Director, Sub campus Burewala-Vehari, University of Agriculture
Faisalabad, and Co- supervisor Dr. Makhdoom Hussain, Wheat Research Institute, AARI,
Faisalabad who extended their guidance and assistance generously and tried to remove the
difficulties faced during these studies. In short, this would have been impossible without their
valuable support and criticism.
I like to express my humble gratitude to Dr. Muhammad Kashif, Assistant
Professor, Department of Plant Breeding and Genetics and Dr. Nisar Ahmed, Associate
Professor, Center of Agricultural Biotechnology and Biochemistry, University of
Agriculture, Faisalabad for their proper guidance and valuable comments at various
occasions.
I am also thankful to Prof. Dr. Kulvinder Gill, Washington State University,
Pullman, USA, for training to learnt different bioinformatics and biotechnological tools and
techniques for wheat improvement. I am obliged to USPCAS-AFS, for providing funds to
avail this opportunity of visiting Washington State University, Pullman USA.
I have no words to express my feelings to my affectionate parents, loving brothers,
sister and brother in law especially to my father Shaukat Ali and brothers Dr. Rizwan
Shukat, Dr. Irfan Shaukat, Imran Shaukat, and Dr. Aftab Shaukat for being there every
time for me, for their encouragement and for their deep loves and care.
Good friends are blessings of ALLAH ALMIGHTY. I shall ever pride on having very nice,
co-operative and sincere friends, seniors and class fellows who shared many of my tough
hours during my stay at university. May Allah give them long, prosperous and happy life!
Shadab Shaukat

ix
x
LIST OF TABLES
Table No. TITLE Page No.
2.1 Reduction (%) in Various Wheat Traits under Heat Stress Conditions
8
2.2 Change in Total Crop Duration Due to Rise in Temperature 10
2.3 Chemicals, metabolites, and hormones involved in plant stress responses
17
2.4 Trait wise summary of literature review 19-20
3.1 List of wheat genotypes used in the screening experiment 21-25
3.2 List of selected lines and testers 29
3.3 List of crosses for line × tester mating design 30
3.4 Morpho–physiological and quality traits studied under normal and heat stress conditions
32
3.5 Crossing plan for line × tester mating design 40
3.6 Analysis of variance for line × tester 40
4.1 Mean sum of squares of all screened traits under normal and heat stressed conditions
42
4. 2 Mean data of some traits studied in 120 wheat genotypes under normal conditions
44-46
4. 3 Mean data of some traits studied in 120 wheat genotypes under heat stressed conditions
48-50
4.4 Cluster Centroids for eleven variables under Normal (N) and Heat Stressed (H) conditions
59
4.5 Principal Component Analysis of eleven traits under normal conditions
64
4.6 Eigenvectors of eleven traits under normal conditions 64

xi
4.7 Principal Component Analysis of eleven traits under heat stressed conditions
65
4.8 Eigenvectors of eleven traits under heat stressed conditions 65
4.9 Correlation among indicators under normal conditions 69
4.10 Correlation among indicators under heats stressed conditions 70
4.11 Mean square values of line × tester analysis for various traits under normal conditions
75
4.12 Mean square values of line × tester analysis for various traits under heat stressed conditions
76
4.13 Estimation of genetic components of variation under normal and heat stress conditions
77
4.14 Proportional Contribution of Lines, Testers and their Interaction under normal and heat stress conditions
78
4.15 Estimation of General Combining Ability Effects of parents for Agronomic, Physiological and quality Traits under Normal Conditions
81
4.16 Estimation of General Combining Ability Effects of parents for Agronomic, Physiological and quality Traits under heat stress Conditions
82
4.17 Specific combining ability estimates of Cell Membrane thermostability under normal and heat stress conditions
83
4.18 Specific combining ability estimates normalized difference vegetation index at vegetative stage under normal and heat stress conditions
86
4.19 Specific combining ability estimates of normalized difference vegetation index at grain filling under normal and heat stress conditions
89
4.20 Specific combining ability estimates of canopy temperature at vegetative stage under normal and heat stress conditions
92
4.21 Specific combining ability estimates of canopy temperature at grain filling stage under normal and heat stress conditions
95
4.22 Specific combining ability estimates of relative water contents under normal and heat stress conditions
97

xii
4.23 Specific combining ability estimates of plant height under normal and heat stress conditions
100
4.24 Specific combining ability estimates of flag leaf area under normal and heat stress conditions
103
4.25 Specific combining ability estimates of peduncle length under normal and heat stress conditions
106
4.26 Specific combining ability estimates of spike length under normal and heat stress conditions
109
4.27 Specific combining ability estimates of fertile tillers per plant under normal and heat stress conditions
112
4.28 Specific combining ability estimates of days to heading under normal and heat stress conditions
115
4.29 Specific combining ability estimates of days to maturity under normal and heat stress conditions
117
4.30 Specific combining ability estimates of spikelets per spike under normal and heat stress conditions
120
4.31 Specific combining ability estimates of grains per spike under normal and heat stress conditions
123
4.32 Specific combining ability estimates of 1000-grain weight under normal and heat stress conditions
125
4.33 Specific combining ability estimates of grain yield per plant under normal and heat stress conditions
128
4.34 Specific combining ability estimates of protein under normal and heat stress conditions
131
4.35 Specific combining ability estimates of moisture under normal and heat stress conditions
133
4.36 Specific combining ability estimates of ash under normal and heat stress conditions
135
4.37 Specific combining ability estimates of gluten under normal and heat stress conditions
137
4.38 Specific combining ability estimates of starch under normal and heat stress conditions
139
4.39 Specific combining ability estimates of test weight under normal and heat stress conditions
142

xiii
LIST OF FIGURES
Fig. No. TITLE Page No.
2.1 Heat stress incidence, plant response and adaptation strategies 7
2.2 Major effects of high temperature on plants 10
4.1.1 Mean performance of lines and testers for cell membrane thermostability under both normal (NOR) and heat stress (HS) conditions
52
4.1.2 Mean performance of lines and testers for normalized difference vegetation index at vegetative stage under both normal (NOR) and heat stress (HS) conditions
53
4.1.3 Mean performance of lines and testers for canopy temperature at vegetative stage under both normal (NOR) and heat stress (HS) conditions
54
4.1.4 Mean performance of lines and testers for relative water content under both normal (NOR) and heat stress (HS) conditions
55
4.2.1 Dendogram of different traits under normal conditions 60
4.2.2 Dendogram of different traits under heat stress conditions 61

xiv
List of Appendix
Appendix TITLE Page No.
I Mean data of Morpho–physiological and quality traits studied in lines, testers and their crosses under normal conditions.
172-174
II Mean data of Morpho–physiological and quality traits studied in lines, testers and their crosses under heat stressed conditions.
175-177

xv
List of Abbreviations
Abbreviations Full Name
GCA General Combining Ability
SCA Specific Combining Ability
CMT Cell Membrane Thermo-stability
NDVIV Normalized Difference Vegetation Index at vegetative stage
NDVIG Normalized Difference Vegetation Index at grain filling stage
CTV Canopy Temperature at vegetative stage
CTG Canopy Temperature at grain filling stage
RWC Relative Water Content PH Plant height FLA Flag leaf area
PL Peduncle length
SL Spike length
FTP Fertile tillers per plant
DTH Days to heading
DTM Days to maturity
SPS Spikelets per spike
GPS Grains per spike
TGW 1000-grain weight
GYP Grain yield per plant
PRO Protein MOI Moisture contents ASH Ash GLU Gluten
STR Starch
TW Test weight
WRI Wheat Research Institute, Faisalabad
AARI Ayub Agricultural Research institute, Faisalabad
HT Heat trial (Experiment coding for genotypes)
IPCC Inter-Governmental Panel on Climatic Change
PCSIR Pakistan Council of Scientific and Industrial Research
RVU Rapid Visco Units
RVA Rapid Visco Analyzer
PCA Principal Component Analysis
Fig Figure

xvi
ABSTRACT
Wheat crop is a basic staple food in many of countries all over the world. To overcome the need and supply gap of food it is necessary to improve wheat yield against different stresses such as heat stress. This study was performed to enhance the knowledge about genetics of heat tolerance in wheat using different agro-morphological parameters for screening of wheat. Line × tester mating design was used to access the genetic variability of wheat for combining ability against normal and heat stressed conditions. One hundred twenty genotypes were sown in research area of Wheat Research Institute (WRI) of Auyb Agriculture Research Institute (AARI) Faisalabad during growing season of 2014-15 in field and tunnel, which was covered during grain filling stage to provide high temperature stress. Ten lines and five testers were selected after proper screening by using different screening parameters such as cell membrane thermostability, normalized difference at vegetative stage, canopy temperature at vegetative stage and relative water content. The selected lines and testers were crossed in Line × Tester mating fashion. In next growing season (2015-16), parents along with their F1 hybrids were sown in triplicated randomized complete block design (RCBD) under normal and tunnel conditions. Data were recorded for both normal and heat stressed conditions for following traits i.e. cell membrane thermostability, normalized difference at vegetative stage, normalized difference at grain filling stage, canopy temperature at vegetative stage, canopy temperature at grain filling stage, relative water content, plant height, flag leaf area, peduncle length, spike length, number of fertile tillers per plant, days to heading, days to maturity, spikelets per spike, grains per spike, thousand grain weight, grain yield per plant and other quality traits like protein , moisture contents, starch, ash, gluten and test weight. Combining ability as used to investigate genotypes with best GCA and SCA. These parameters can help breeders in wheat crop improvement. All traits in this study showed dominance type of gene action under both normal and heat stressed environments. Results showed that the parents V-12103, Miraj-08, Faislabad-08, V-12082, Millat-11 and Chenab-2000 were good general combiner for grain yield and quality traits under both normal and heat stressed conditions. Among different crosses, V-13013 × ND643, SW89.52277 × Chenab-2000 and V-13013 × V-12082 showed better performance for grain yield and quality related traits that can be used in further breeding program for improvement of grain yield and quality parameters of wheat.
Chapter 1 INTRODUCTION
Wheat (Triticum aestivum L.) belongs to Poaceae family and is one of the oldest cereal crops
cultivated on large scale. It has been domesticated about 8000 years ago. Wheat is a staple
food of different nations (North Africa, West Indies and Europe) across the globe. It is grown
globally and is consumed by 33% of the world population (including Pakistan) because of its
nutritional importance; range of enduse products and especially for its storage qualities.
Wheat is utilized in bread making. Wheat grains contain most of the essential components
such as carbohydrates (60 to 80%), moisture (12%), fats (1.5 to 2%) and proteins (8 to 15%)
as reported by Anjum et al., (2005).
Wheat fulfils 21% caloric requirement and 20% protein requirements of 4.5 billion people
and mostly these people belong to developing countries as reported by Braun et al. (2010).
About 36% of world population consume wheat on daily basis and it is grown under wide
range of climates and soils. According to FAO report of 2015, wheat was sown on an area of
220 million hectares with global production of 690 million tonnes, having average grain yield
of 2700 kg ha-1. Wheat crop is well adapted in temperate climates where annual rainfall
remains within 30-60 cm, latitudes from the range of 30 to 60° N as well as 27 to 40° S.
Wheat crop is grown mostly all around the world, with its genetically diverse genotypes that
show compatibility to grow in diverse environmental conditions (FAO, 2015).
Wheat contributes 9.6 % in the value addition of agriculture and 1.9% in GDP of Pakistan.
Area under wheat cultivation has been decreased from 9224 thousand hectares (2015-16) to
9205 thousand hectares (2016-17), which shows a decrease of 1.9%. The production of wheat
in 2016-2017 was 25.750 million tonnes, which is 0.5% higher than last year (Anonymous,
2016-17). Pakistan has all the favorable conditions of soils, irrigation water and climate but
crops yield is far less than the major wheat growing countries due to many reasons.
Biotic and abiotic stresses are major crop yield limiting factors worldwide. Different
scientists may define heat stress in different ways. According to Wahid et al. (2007), “Heat
stress is a function of the magnitude and rate of temperature increase, as well as the duration
2
of exposure to the raised temperature.” Heat stress can also be described as “the increase in
temperature above a threshold level for the duration of time which is sufficient to cause
irreversible damage to plant growth and development” (Hall, 2001).
The causes of lower yield of wheat in our country are temperature variations, poor
understanding about variety selection and shortage of good quality seed and unavailability of
advance technology, late sowing, irrigation problems, heat and drought stress. Among all
these stresses, heat stress is the main hazard to crop yield especially at the reproductive stage
(Hall, 2001).
Increase of ambient temperature is causing climate change, since the start of this century.
According to forecast of global climatic model, the rise of average ambient temperature will
lie between 1.8 to 5.8°C at the end of this era (Anonymous, 2007). Heat stress can be caused
by increase of temperature that can cause hazards for crop productivity that also disturb
cropping pattern. Over the previous thirty years, constant increase of the global temperature
has resulted in significant decrease in yield of many crops. Additionally, results forecast that
frequent occurrence of heat waves also effects in yield reduction (Pittock, 2003). Rising
global temperatures and gradual increase of frequent heat waves are expected to have same
negative properties on this normal climatic system in the tropics as well as on the subtropics.
It has been reported that mean temperature is rising up to 0.3°C per decade globally (Jones et
al., 1999). It is expected that temperature will increase approximately 1°C and 3°C above the
normal temperature by years 2025 and 2100, respectively (Wahid et al., 2007). Climate
resonance is the ability to survive in different climatic stresses. There is need of Crop
resilience against different environmental stresses. Crops with higher plasticity from
emergence to their maturity are considered resilient against different environmental stressed
conditions. Climate vulnerability threatens food security systems of Pakistan. Rainfed areas
of Pakistan are more exposed to the effects of climatic instability due to extreme variation of
climate. In the recent years, high variability in the rainfall and increased temperature has
been observed in rainfed areas.
Taxonomically wheat is classified in two groups such as winter wheat and spring wheat. In
winter wheat, plant experience cold winter temperature before heading starts (Curtis, 2002)
3
whereas spring wheat (which is grown in Pakistan) requires little bit higher temperature.
Plant have their mechanism for stress regulation in the form of gene expression that results in
alteration in protein synthesis that control different biological functions. Role of gene
expression in different stresses and response mechanism has limited knowledge and has not
yet been explained properly because of multiple functions of some of the genes (Bray, 2002).
In stressed environments, plants have their defense mechanism of cell turgor maintenance.
Successful key for adaptation to climate change is through efficient plant breeding strategies.
It is very important to select optimum sowing time along with those varieties that gives
maximum yield in all environmental conditions. If there is any fluctuation in environmental
factors from normal range, it will limit crop productivity and ultimately final yield will be
reduced. Environmental stresses give rise to various physical and physiological hindrances in
the plant growth and development. The decline in wheat production is impressively owed to
various climatic variations.
A global population of 9 billion (in 2050) will be fed by wheat. Thus 70 to 100% increase in
its supply is desired to cope this future scenario (Godfray et al., 2010). Extensive cultivation
of crop with high yield is required to assure food security of future (Parry et al., 2011;
Reynolds et al., 2011). Temperature rise upto 30°C at anthesis may cause the reduction of
seed set even if there are differences among cultivars (Dawson and Wardlaw, 1989). Change
in environmental temperature is the major limiting factor in in crop productivity in different
crop growing seasons. Lobell et al. (2008) reported that 3 to 17% of the loss in yield
followed by 1°C rise in temperature in north and west zones of India and Pakistan, due to
global warming. High temperature can cause reduced crop yield, short life cycle, compact
biomass, decrease in the number of grains/spike, reduction in the grain weight and test
weight, all of these eventually result in decrease in grain yield and are threatening to food
security for wheat (the most important staple food in Pakistan). Cell membrane
thermostability is an indicator for screening of wheat varieties against heat stress (Ibrahim
and Quick, 2001). High temperature can cause damage to cell membrane integrity, influence
primary photosynthetic process, which ultimately results in changes in lipid composition and
protein denaturation (Wahid et al., 2007). Local climatic conditions and rise of temperature
due to global warming is the key problem for breeder to enhancing the yield potential of crop

4
(Semenov et al., 2014). Wheat is more delicate to cold (Frost) and hot (Heat stressed)
conditions at reproductive stage (Alghabari et al., 2014; Vara Prasad and Djanaguiraman,
2014). Relative water content osmotic potential, water potential, and grain yield are the most
important indicators of heat tolerance in wheat (Ram et al., 2017). Relative water content
could be used as efficient selection measure for various stress resistance mechanisms (Rad et
al., 2013). Heat stress during generative (reproductive) stage as well as grain-filling stage of
wheat imposes several threats to wheat productivity. Scientists predicted that due to climatic
changes there was increase in temperature which caused the wheat yield reduction range upto
20 to 30 % (Rosegrant and Agcaoili, 2010). In Pakistan, wheat plants exposed to high
temperature mostly face the decrease yield. Terminal heat stress is one of the main problem,
which occur during grain filling period and causes reduction of crop productivity from 10 to
15%.
For development and improvement of different genotypes, plant breeders exploit available
genetic resources of wheat. Newly developed genotypes will depict resistance mechanism
towards biotic and abiotic stresses via wheat breeding through hybridization and other
combination of desirable genes. Primary requirement for developing new varieties in wheat
is to investigate and utilize the available genetic material (which has diversity and potential).
Such genotypes should have the potential to be adapted to different environmental extremes
with high yield. For the development of tolerant cultivars, selection of superior genotypes is a
basic step for the production of different desirable genetic combinations. Suitable
information is required for the selection of genotypes, based on the nature of genes, which
control the expression of selected traits.
Screening of wheat genotypes is mainly based on diverse agro-morphological, physiological
as well as quality parameters that can perform better in heat stressed conditions. Exploitation
of many physiological traits is however yet needed. Yield loss and poor quality of grains
resulted by high temperature stress in wheat is the consequence for heat stressed conditions at
the time of grain-filling stage. The investigation was aimed with the main objective of
cataloguing of different wheat genotypes for normal as well as terminal heat stressed
environments. Wheat genotypes possessed potential differences under both heat stress and
5
normal conditions and their inter-relationship with different traits towards heat stress will be
very helpful to evolve heat tolerant genotypes.
Wheat breeders adopted several biometrical techniques that are required for the productive
wheat breeding programe. Line × Tester mating technique developed by Kempthorne (1957)
provide data for early generations based information on genetic tools involved in trait
expression. Present studies were planned to explore the heat tolerant genotypes having best
traits that results better in high temperature stress conditions and to investigate genetic nature
of these traits by mating them in suitable design according to line × tester mating technique.
Combing ability was also studied in these wheat genotypes. The line × tester mating design is
best one as a beneficial breeding approach that gives statistical information about genetic
mechanism and combining ability of these traits. These heat tolerant genotypes after proper
evaluation could be used to develop heat tolerant cultivars.
Heat stress at grain filling stage disturbs grain maturity as well as grain weight which
eventually causing deterioration of quality and grain yield (Khan et al., 2007; Wahid et al.,
2007). According to an estimate increase of 1°C temperature causes 3-10% loss in grain yield
of wheat (You et al., 2009) and approximately 40% of wheat (36 million hectares) grown in
temperate environment is facing terminal heat stress (Reynolds el al., 2011). Series of
experiments were conducted to evaluate the hypothesis that heat stress has impact at different
growth and developmental stages (vegetative and grain filling) in wheat with respect to
quality traits as well.
This research was planned to evaluate and identify heat tolerant wheat genotypes based on
different morphological, physiological and qualities evaluation.
The objectives of the study were following:
1. To assess variability by screening under terminal heat stress and to select superior/tolerant
wheat genotypes from available germplasm.
2. To find out the genetics of terminal heat stress tolerance to design proper screening
method for future breeding programs.
3. To evaluate the genetic behavior of selected desirable genotypes for future breeding
strategies.
6
Chapter 2 REVIEW OF LITERATURE
Plants respond differently in different environmental stresses by displaying the induction of
complete set of molecular changes. These changes are then depicted in the morphology of
plant, which ultimately manifest the stress responses. The outline of review of literature is as
follows,
2.1. Global scenario of temperature increase
2.2. Response of plant to heat stress
2.3. Genetic variability
2.4. Heat tolerance studies in wheat
2.5. Cell Membrane Thermostability (CMT)
2.6. Canopy Temperature (CT)
2.7. Normalized Difference Vegetation Index (NDVI)
2.8. Relative water content (RWC)
2.9. Effects of heat stress on morphological and physiological traits
2.10. Terminal heat stress in wheat
2.11. Genetics of heat tolerance
2.12. Combining Ability
2.13. Correlation
2.1. Global scenario of temperature increase
As reported by Inter-Governmental Panel on Climatic Change (IPCC), universal average
temperature of this world is rising via 0.3oC each decade (Houghton et al., 1990). It clearly
indicates an increase of 3oC than the present value by the year of 2100, which will lead to
extensive warming across the globe. Exposure adoptability of this supraoptimal temperature
for long time period to plants exerts heat stress and induce permanent damage in crop growth
and development. Heat stress condition created by 10 to 15oC increased the temperature
beyond the normal level. Increasing temperature causes limitation in plant productivity. It is
need of the present day to explore the causes and impacts of heat stress on plants. Patterns of
plant growth changes quickly and continuously due to rise of ambient temperature as

7
reported by Porter, 2005. Some relevant literature interrelates the impact of heat stress on
wheat plant (Fig. 2.1).
Fig. 2.1. Heat stress incidence, plant response and adaptation strategies (Akter and Rafiqul
Islam, 2017).
2.2. Response of plant to heat stress
Plants respond to different stress by different mechanisms such as avoidance, acclimatization
and resistance. Long-term interaction of high temperature to severe situations plants
experience catastrophic breakdown in cellular organization. Alteration in geographical
distribution caused by heat stress and crop maturity on early basis (Schoffl et al., 1999;
Howarth, 2005; Porter, 2005) that cause reduction of global yield reduction (Hall, 2001).
Impact of heat stress on yield related morphological traits were discussed in Table 2.1.

8
Table 2.1. Reduction (%) in Various Wheat Traits under Heat Stress Conditions (Sareen et
al., 2012) Trait Heat stress
Plant height 6.5
Productive tillers -31.1
Days to heading 10.1
Days to anthesis 10.1
Days to maturity 10.7
Grain filling duration 11.3
Number of grains per spike 3.3
Grain weight per spike 16.8
Thousand grain weight 14.1
Grain yield 26.4
2.3. Genetic variability
Genetic variation is a pre- basic requirement for successful running of crop improvement that
mainly depends upon its magnitude for desired heritability of desired traits as studied by
Kahrizi et al., 2010. In this world with increasing population, there is demands to enhance
the agricultural production under stressed conditions. Heat stress is a major problem in wheat
due to late harvesting of cotton and rice. There is the need of varietal development that has
not only the capability to avoid, escape and tolerance against different stress but also have the
potential that give more grain yields in heat stressed conditions.
In world, wheat is grown in different climatic regimes because to its broader range of
farming pattern have many harms for yield. High temperature stress is main hazard to wheat
cultivation. Plant breeder have great opportunity to investigate yield and other yield related
traits for the selection of parents that should provide best cross combinations for the
development of wheat varieties with better yield, environments especially in heat stress
conditions. A huge number of researchers investigated line × tester mating design for
9
understanding about the nature of gene action in better way. Wheat have wide range of
variations in genetic material across the world for different parameters like yield and its
components. Previous studies supported the breeders to run effective breeding programmes,
so they can improve multi-diverse gene pool (genetic material) that can accommodate
universally with improved yield. Ambreen et al., (2002) and Singh and Paroda, (1985)
detected variations in wheat genetic pool.
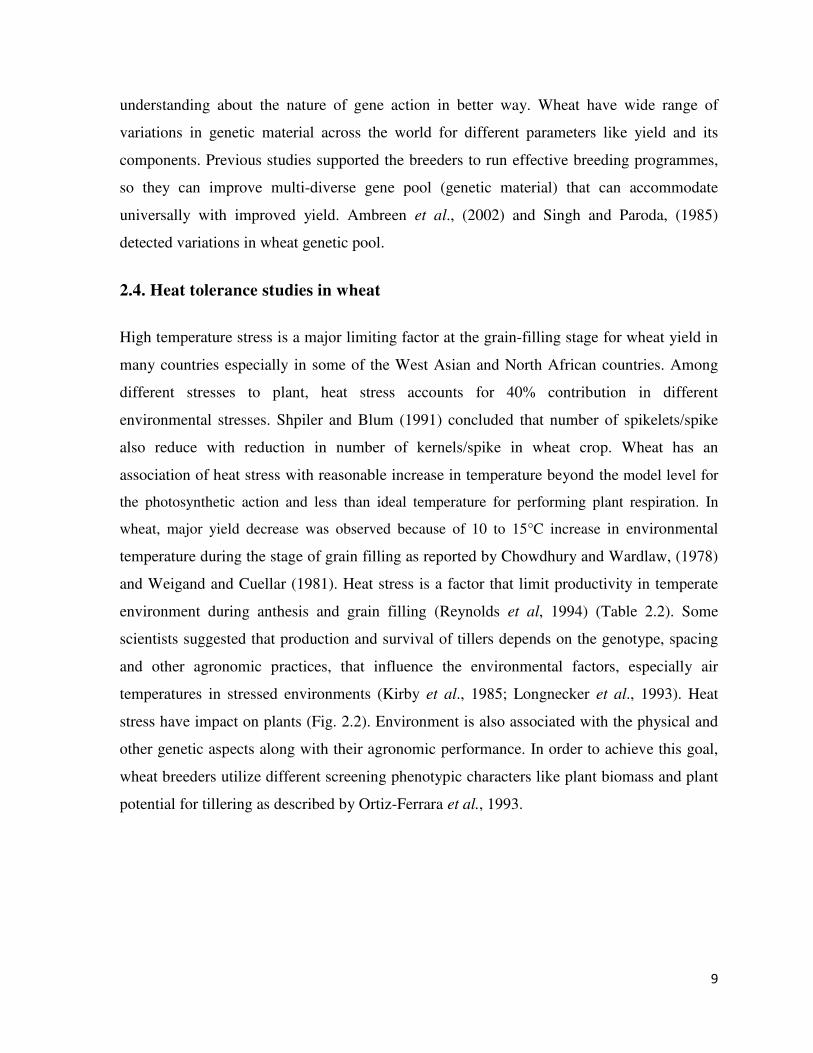
2.4. Heat tolerance studies in wheat
High temperature stress is a major limiting factor at the grain-filling stage for wheat yield in
many countries especially in some of the West Asian and North African countries. Among
different stresses to plant, heat stress accounts for 40% contribution in different
environmental stresses. Shpiler and Blum (1991) concluded that number of spikelets/spike
also reduce with reduction in number of kernels/spike in wheat crop. Wheat has an
association of heat stress with reasonable increase in temperature beyond the model level for
the photosynthetic action and less than ideal temperature for performing plant respiration. In
wheat, major yield decrease was observed because of 10 to 15°C increase in environmental
temperature during the stage of grain filling as reported by Chowdhury and Wardlaw, (1978)
and Weigand and Cuellar (1981). Heat stress is a factor that limit productivity in temperate
environment during anthesis and grain filling (Reynolds et al, 1994) (Table 2.2). Some
scientists suggested that production and survival of tillers depends on the genotype, spacing
and other agronomic practices, that influence the environmental factors, especially air
temperatures in stressed environments (Kirby et al., 1985; Longnecker et al., 1993). Heat
stress have impact on plants (Fig. 2.2). Environment is also associated with the physical and
other genetic aspects along with their agronomic performance. In order to achieve this goal,
wheat breeders utilize different screening phenotypic characters like plant biomass and plant
potential for tillering as described by Ortiz-Ferrara et al., 1993.
10
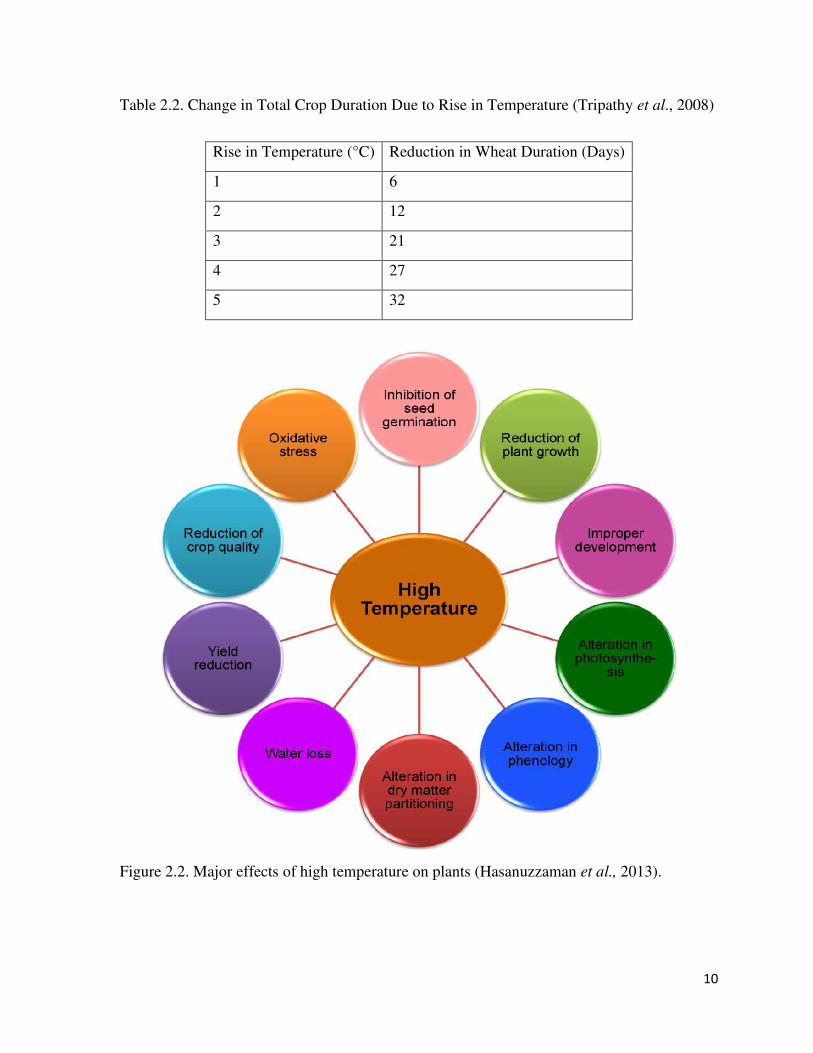
Table 2.2. Change in Total Crop Duration Due to Rise in Temperature (Tripathy et al., 2008)
Rise in Temperature (°C) Reduction in Wheat Duration (Days)
1 6
2 12
3 21
4 27
5 32
Figure 2.2. Major effects of high temperature on plants (Hasanuzzaman et al., 2013).
11
2.5. Cell Membrane Thermostability (CMT)
In heat stress, ions leakage and movement of organic solute across the membranes occur, that
interrupts photosynthesis and respiration (Christiansen, 1978). CMT is the measure of
electrolyte leakage from the leaves. It is an efficient tool for screening of wheat germplasm
against heat stress (Shanahan et al., 1990). Under heat stress, there was an association
between thermo-tolerance with respect to cell membrane stability (CMS), as estimated by
electrical conductivity method and the rate of reduction in grain weight per spike. Thermo-
tolerance as cell membrane thermostability (CMT) has shown positive association in seedling
and grain filling stage for plant survival in field under stress conditions. Negative association
between reduction in grain weight per ear (RGWPE), and cell membrane thermostability
(CMT) at seedling and flowering stages was observed (Fokar et al., 1998). Recombinant
Inbred Lines (RIL) differ significantly for cell membrane stability and biomass for yield and
other related traits under heat stressed and normal conditions. Cell membrane stability
remained positively correlated with biomass and yield under heat stress. No correlation was
observed for yield with biomass under non-heat stress environment. Blum et al., (2001)
studied cell membrane stability and yield and found significant correlations across the
different wheat lines. Any type of stress occurrence in plants firstly targeted cell membranes
and if plant retain integrity and stability under stress conditions, that is fit against stresses.
Bajji et al., (2001) concluded that organic acids present in durum wheat reduce the pH of leaf
tissues specifically when treated with Poly Ethylene Glycol (PEG). Different protocols and
procedures for the assessment of electrolyte leakage have been reported in literature for the
development of heat tolerant wheat cultivars. Cell membrane thermostability was measured
by electrolyte leakage method (Sullivan and Ross, 1979).
Durum wheat have higher cell membrane thermostability in comparison to bread wheat.
Severe heat stress causes denaturation of membrane proteins and melting of lipids in
membranes that cause rupture of cell membrane and ultimately cellular contents are lost.
Heat stress or water stress alone are not as dangerous as their interaction of heat and drought
cause severe damage of cell membrane stability (Kaur et al., 2008). Yildirim et al., (2009)
investigated different developmental growth stages in different genotypes of spring wheat. It
was noticed that membrane stability and relative injury give almost similar pattern of results
during three growth stages (seedling, stem elongation and early milk stage). In GS71,
12
correlation between grain yield and membrane stability was highly significant. Cell
membrane thermostability (CMT) practice on flag leaf in spring wheat plants in thermo-
tolerant lines resulted in significant increase in the wheat yield (Shanahan et al., 1990).
Decrease in thermo-stability of cell membrane reduce the growth and development of wheat
plants up to 70%. They also studied that heat shock of 2 hours at 42°C caused the highest
accumulation of H2O2. The highest (72%) cell membrane stability (CMS) was observed at
vegetative stage when temperature outside was about 25°C. Similarly, thermo-stability was
decreased in CMT during pollination stage, milking stage, dough stage and seed maturing
stage respectively. Strong positive association was recorded for grain weight/spike and cell
membrane stability in heat stress (Kumar et al., 2012).
Different changes in cellular membrane during germination of wheat seeds under heat stress
showed that rise in temperature caused significant increase in electrolyte level and proline
content. Cell membrane thermostability results also showed that wheat seeds have higher
electrolyte leakage under heat stress (Al-Jebory 2013). Shanahan et al., (1990) explored
electrolyte leakage method as phenomena of heat tolerance in spring wheat that was based on
CMT values of different genotypes, which were grouped as Heat Tolerant (HT) and Heat
Sensitive (HS). Accumulative response of Faislabad-2008, Lasani-2008, Sussui and AARI-
2011 performed better results in terms of proline accumulation, better antioxidant response
mechanism, Photosynthates stem reserves (PSR), Membrane Stability Index (MSI) and grain
yield under both stress and non-stress environments. Khan et al., (2013) observed lowest
membrane stability index in Faislabad-2008. It was also observed that cell membrane
thermo-stability showed two groups of gene action that control CMT are additive-
dominance-epistatic of major genes and additive-dominance-epistatic of polygenes. Low
damage percentage shown in Parula × Blue Silver depicted high value of CMT (Ullah et al.,
2014). The highest membrane Stability Index (MSI) and better osmotic adjustment for more
proline accumulation was observed in AS-2002 but Inqalab-91 showed best MSI. Heat stress
caused 75% and 40% yield reduction at anthesis and milking stage respectively (Khan at al.,
2015). Electrical conductivity was used as baseline of cell membrane thermostability for
identification of tolerant genotypes in wheat against heat stress. Bala and sikder (2017)
worked on wheat, evaluated cell membrane thermostability test under high temperature
13
conditions and concluded that strong positive relationship was observed in membrane
stability and grain weight/spike in high temperature stress tolerance conditions.
2.6. Canopy Temperature (CT)
Organ temperature depression and grain yield showed strong positive correlation with
canopy temperature depression. While canopy temperature depression and Organ
temperature depression showed positive correlation with the FLA index. Canopy temperature
depression was studied by Ayeneh et al., (2002) and observed higher association with days to
anthesis and days to maturity. Durum wheat is cooler than bread wheat during heat stress
conditions while canopy temperature depression is positively correlated with grain yield
components like, spike yield and grain numbers per spike. Grain yield, harvest index, and
spike numbers are higher in bread wheat than durum wheat. Canopy temperature and harvest
index have non-significant correlation in durum wheat. CT values have positive correlation
with grain yield, spike yield and grain number per spike (Bilge et al., 2008).
CT calculated by using IR thermometer that estimate CT and Area Under Canopy
Temperature Depression Progress Curve (AUCTDPC). Genetic variation was shown for spot
blotch resistance with heat stress tolerance. AUCTDPC was found to be associated parameter
for both stresses that can be used for the further screening program and for selecting of stress
tolerant varieties in humid environmental conditions (Rosyara et al., 2008). Karimizadeh and
Mohammadi (2011) studied positive and significant correlation among grain yield per plant,
mean productivity, stress susceptibility index, geometric mean productivity, stress tolerance
index and canopy temperature depression. They concluded that more effective selection
criteria is CT for identification of high yield genotypes under both irrigated and rainfed
conditions. Their results showed that mean value of canopy temperature depression changed
at Zadoks Growth Scale 69 stage with the range of 3.3 to 5.3oC. Leaf chlorophyll content and
canopy temperature showed high significant correlation. Canopy temperature showed high
correlation with width of leaf under all environmental conditions. Grain yield show positive
correlation with canopy temperature in both normal and late sown plants, which showed that
canopy temperature always has a role in grain yield of wheat.
14
Mohammadi et al., (2012) also reported strong association between crop yield and canopy
temperature depression against different drought and high temperature conditions.
Genotypes having high CTD numbers showed significant correlation with high Chlorophyll
Content (CHL) values. CTD showed negative correlation with yield under drought. Epure et
al., (2017) used canopy temperature depression (CTD) and Chlorophyll Content (CHL) for
estimation of drought resistant winter wheat lines and concluded that CTD or CHL alone are
not an effective screening approach but CTD and CHL in combination along with yield
provide an effective screening approach against stress. Canopy temperature depression is
main character that is used by a breeder to select best wheat lines against tolerance to heat as
well as drought stress. The effect of stimulation to heat stress was studied with maximum
crop canopy temperature. Webber et al., (2017) studied gain for the negative effects of heat
stress on net change, remobilization of non-structural carbohydrates (NSC) to grains during
grain filling increased and measured vibrant to ensuring yield during high temperature
stresses.
2.7. Normalized Difference Vegetation Index (NDVI)
In heat stress conditions, plants are provided with the ability to maintain their chlorophyll
content with NDVI and showed a significant association with crop yield. Normalized
difference vegetation index is a good aided tool for screening parameters in heat stress.
Cossani and Reynolds (2012) reported characterization of some favorable group of alleles
against heat stress. Heat stress caused the reduction in days taken to heading of wheat plant.
Combined effect of drought and heat stress caused reduction of grain productivity of the
plants by 60% and 40% respectively. Negative inter-relationship was found between the
yield and days taken to heading, canopy temperature at grain-filling, days to maturity.
Lopes and Reynolds (2012) evaluated the capability of genotypes to stay green with their
designated modification of genotypes toward stress with the aid of NDVI. Normalized
difference vegetation index (NDVI) is a strong tool to study stay green in plants. Maximum
NDVI value was observed at 220 kg/ha. Furthermore, positive association was observed
between NDVI and grain yield at booting stage then grain filling and maturity stage (Sultana
et al., 2014). Normalized Difference Vegetation Index (NDVI), Normalized Difference

15
Water Index (NDWI) and Water Index (WI) are positive significantly correlated with the
biomass and grain yield of triticales. Water index is a best parameter to monitor water stress
in triticale as compared with the NDVI and NDWI (Munjonji et al., 2017). Plants performed
better in heat stressed environments with high yield. Wheat plant showed early biomass
(estimated by NDVI), more grain filling rates and low canopy temperatures. Correlation
between leaf respiration and leaf temperature was reported to be associated negatively with
yield under high temperature during anthesis and grain filling stage. Leaf respiration
increases as temperature increases and plant grows. Pinto et al., (2017) investigated heat
tolerant lines having genetic diversity for morphological (leaf respiration) and physiological
traits in the context of heat tolerance.
2.8. Relative water content (RWC)
At anthesis stage of plants, water stress was artificially applied and results showed that RWC,
chlorophyll and mineral concentration of K and Na produce some differences among
resistance and susceptible genotypes. Reduction in plant vigor was observe reduction of
RWC in crops under drought stressed conditions (Arjenaki et al., 2012). Water stress have
more influence on different morphological traits such as variation in grain yield, variation in
biomass, variation in number of spikes and variation in relative water contents as compared
to other physiological traits (Ghatak et al., 2017). Different Normalized relative canopy
temperature based plant model values were recognized in their study to evaluate and forecast
relative water contents, canopy water content and grain yield.
Elsayed et al., (2017) worked on remote sensing and thermal imaging to study the grain yield
of wheat and estimation of water status under different irrigated conditions during growth of
wheat plant. Interaction between genotype × environment showed that the grain yield of plant
reduction was significant under the influence of water stress. Terminal heat stress and water
stress conditions showed significant decline in grain yield. It was concluded that osmotic
potential, water potential and grain yield are the most important traits indicating tolerant
wheat genotype (Ram et al., 2017). Claussen (2005) confirmed that close link exists between
relative water contents (RWC) and Proline. Stressed conditions causes lowering the osmotic
potential in response to osmolytic maintenance of turgor pressure. According to Carceller et
16
al., (1999) increase in contents of proline follow the decrease in RWC in water stressed
leaves.
2.9. Effects of heat stress on morphological and physiological traits
The effect of heat stress on varieties that encountered high temperature resulted in low starch
synthesis that leads to the reduction in 1000-kernel weight and relatively increased protein
contents. Glutenin to gliadins ratio was also reduced as discussed by Blumenthal et al.,
(1995). Exposure to heat stressed environment after 50% anthesis caused extensive decline in
the harvest index and grain yield in wheat. However, exposure at 82 days after sowing
increased spikes dry weight. Therefore, at mid anthesis time fertilization of grain and setting
of grain was maximum visible at ambient temperature (Ferris et al., 1998). Exposure of heat
and drought stress before the onset of filling of grain caused decrease in the grain filling
time, decreased 1000-kernel weight and grain weight also. Less influence was observed in
harvest index of nitrogen from dry matter harvest index that resulted in higher protein content
(Gooding et al., 2003).
High temperature at shooting stage directly cause significant yield loss and decrease in
number of grains. Results of Balla et al., (2009) revealed reduction of glutenin to gliadin
percentage plus un-extractable polymeric protein with increase of protein contents in wheat.
Majoul et al., (2003) studied that protein significantly decreased after heat treatment due to
glucose-1-phosphate adenyl transferase that plays a role in synthesis of starch. Heat stress
responses the process of grain weight reduction. 17% changes were monitored in the proteins
of mature grain of wheat under heat stress. Radmehr et al., (2004) revealed that all of the
genotypes had no sink constraint. Different chemical, metabolic, and hormonal changes are
involved in plants to respond against different stresses (Table 2.3). On the other hand, source
restriction exhibited 0 to 34% change by some genotypes in favorable normal conditions and
5.7 to 41.2% change under terminal heat stressed conditions. It means 6% more changes due
to the effect of heat stress. Khan et al., (2004) observed that plants with early sowing gave
higher yield of wheat. He also observed gradual decrease in yield with late planting. Peduncle
length of wheat is a significant morphological characteristic that has positive desired correlation
17
for early maturity. For the development of early maturing wheat cultivars, the plant breeders
should have to select such desired plants with a superior peduncle length and high yield.
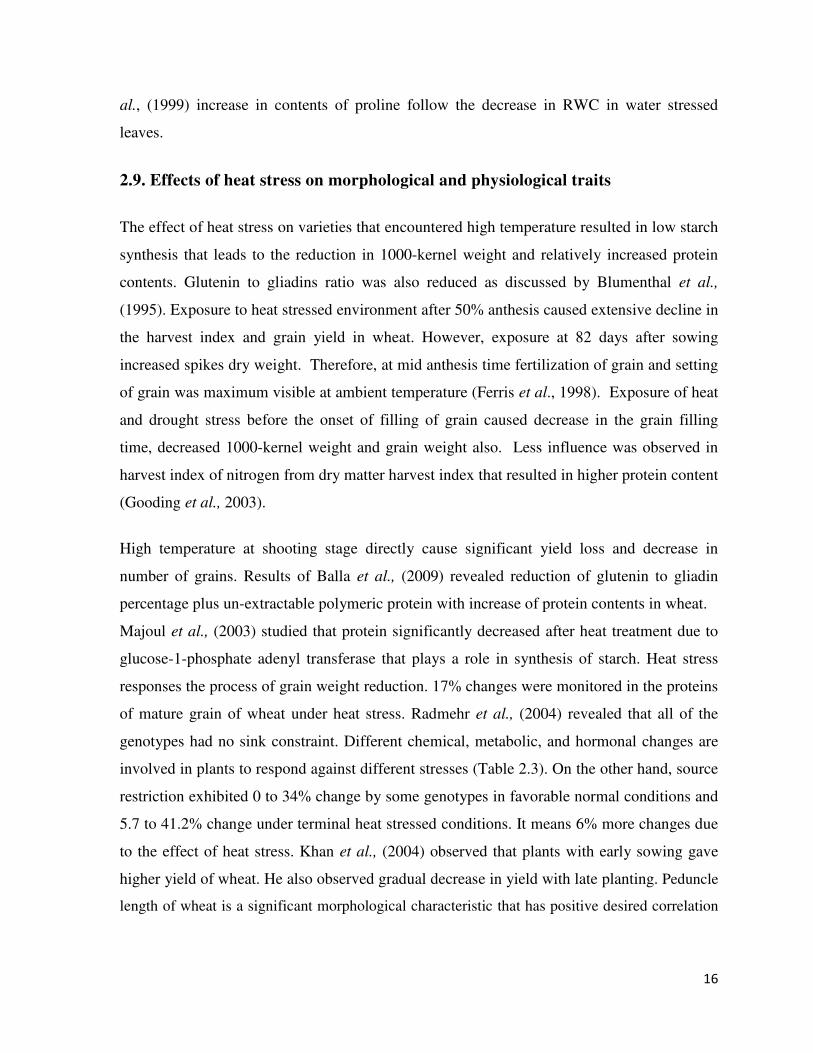
Table 2.3. Chemicals, metabolites, and hormones involved in plant stress responses.
Compounds Stress response References
ROS Biotic and abiotic stress (Wang et al., 2009)
H2O2 Drought, heat, chilling, and salinity (Gong et al., 2001, Savvides et al.,
2016)
H2S Abiotic stress (Jin et al., 2017)
Strobilurin Abiotic stress (Diaz-Espejo et al., 2012)
NOSH-aspirin Abiotic stress (Antoniou et al., 2014)
NaHS Heat stress (Christou et al., 2014, Min et al., 2016)
2.10. Terminal Heat stress in wheat
Studies showed that early maturing genotypes possess greater kernel weight and higher grain
formation period, so early maturing genotypes have the ability to tolerate heat stress in a
better way than long duration genotypes. Sandeep et al., (2000), reported significant
correlation between genotypes and date of planting with respect to cell membrane
thermostability. Change of sowing time reduced plant height, heading and maturity days,
spikelets/spike, grains/spike and yield of grains as results of two average sowing extremes
(Mahboob et al., 2005). Likewise results for grain yield of wheat crop also greatly decreased
due to sowing in latter days (which cause terminal heat stress) as described by Arain et al.,
(2002.)
2.11. Genetics of heat tolerance
Different proteins like heat shock proteins (Hsps) and other enzymes of antioxidants have
great importance in facing heat stress among plants. Under high temperature stress,
upregulation of numerous enzymatic as well as non-enzymatic antioxidants as well as
stability maintenance of cell membrane, different compatible solutes synthesis with hormonal

18
variabilities occurs (Asthir 2015). In heat stressed conditions, plants collect diverse range of
metabolites like antioxidants, osmo protectants, heat-shock proteins (Hsps) and metabolites
from different pathways as studied by Bokszczanin and Fragkostefanakis 2013. Several
reports have recognized the availability of heat-tolerant genes among them various are
quantitative trait loci (QTL) (Rodriguez et al., 2005). Membrane fluidity in heat tolerance
was explained by mutation analysis as well as transgenic and physiological studies. For
example, a soybean mutant deficient in fatty acid unsaturation showed strong tolerance to HT
(Pastore et al., 2007).
2.12. Combining Ability
Combining ability is the ability of a parent to transmit desirable performance to the resultant
hybrid after crossing (Sprague and Tautum, 1942). It has two types (i) general combining
ability (GCA) and (ii) specific combining ability (SCA). The GCA refers to the relative
performance of individuals, in a similar group of organisms, when crossed with a
heterogeneous tester. The SCA refers to the progeny performance resulting from a particular
cross as related to the performance of other particular crosses of a similar nature (Sprague
and Tautum, 1942).
2.13. Correlation
Correlation studies are useful for understanding the stress tolerance as yield traits can be used
as subordinate criteria for selection in wheat to improve yields in different stressed
environmental conditions. Gupta et al. (2001) observed positive correlations of physiological
and yield traits at both booting and anthesis stages, whereas negative correlations was also
seen leaf canopy temperature with grain yield per plant. Bahar et al., (2011) reported
significant negative correlation of canopy temperature depression (CTD) with grain yield
(GY). From results presented by (Jatoi et al., 2012) showed higher correlation was observed
under stressed whereas under non-stressed environments it showed weaker correlation among
traits. Positive correlation observed by some physiological and yield related traits with
relative water content and stomatal conductance showed negative correlation with all yield
traits under stressed conditions. Dhanda and Munjal (2012) described positive correlation of
19
cell membrane thermostability observed with grain yield in bread wheat. Bhutto et al., (2016)
reported that plant height showed significantly positively correlation with spikelets per spike,
number of tillers per plant and grains per spike. Azimi et al., (2017) observed positive
significant correlation of late sown (cause terminal heat stress) wheat for grain yield with all
other yield contributing traits among genotypic at phenotypic components of variation.
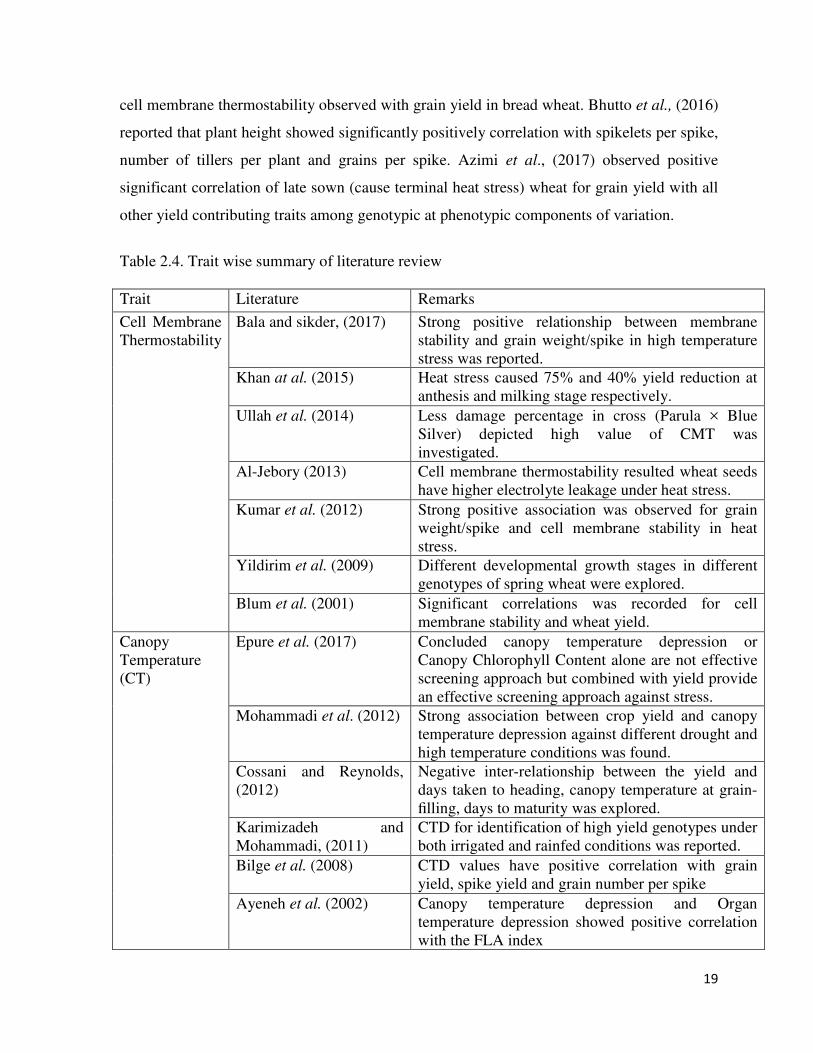
Table 2.4. Trait wise summary of literature review
Trait Literature Remarks
Cell Membrane Thermostability
Bala and sikder, (2017) Strong positive relationship between membrane stability and grain weight/spike in high temperature stress was reported.
Khan at al. (2015) Heat stress caused 75% and 40% yield reduction at anthesis and milking stage respectively.
Ullah et al. (2014) Less damage percentage in cross (Parula × Blue Silver) depicted high value of CMT was investigated.
Al-Jebory (2013) Cell membrane thermostability resulted wheat seeds have higher electrolyte leakage under heat stress.
Kumar et al. (2012) Strong positive association was observed for grain weight/spike and cell membrane stability in heat stress.
Yildirim et al. (2009) Different developmental growth stages in different genotypes of spring wheat were explored.
Blum et al. (2001) Significant correlations was recorded for cell membrane stability and wheat yield.
Canopy Temperature (CT)
Epure et al. (2017) Concluded canopy temperature depression or Canopy Chlorophyll Content alone are not effective screening approach but combined with yield provide an effective screening approach against stress.
Mohammadi et al. (2012) Strong association between crop yield and canopy temperature depression against different drought and high temperature conditions was found.
Cossani and Reynolds, (2012)
Negative inter-relationship between the yield and days taken to heading, canopy temperature at grain-filling, days to maturity was explored.
Karimizadeh and Mohammadi, (2011)
CTD for identification of high yield genotypes under both irrigated and rainfed conditions was reported.
Bilge et al. (2008) CTD values have positive correlation with grain yield, spike yield and grain number per spike
Ayeneh et al. (2002) Canopy temperature depression and Organ temperature depression showed positive correlation with the FLA index
20
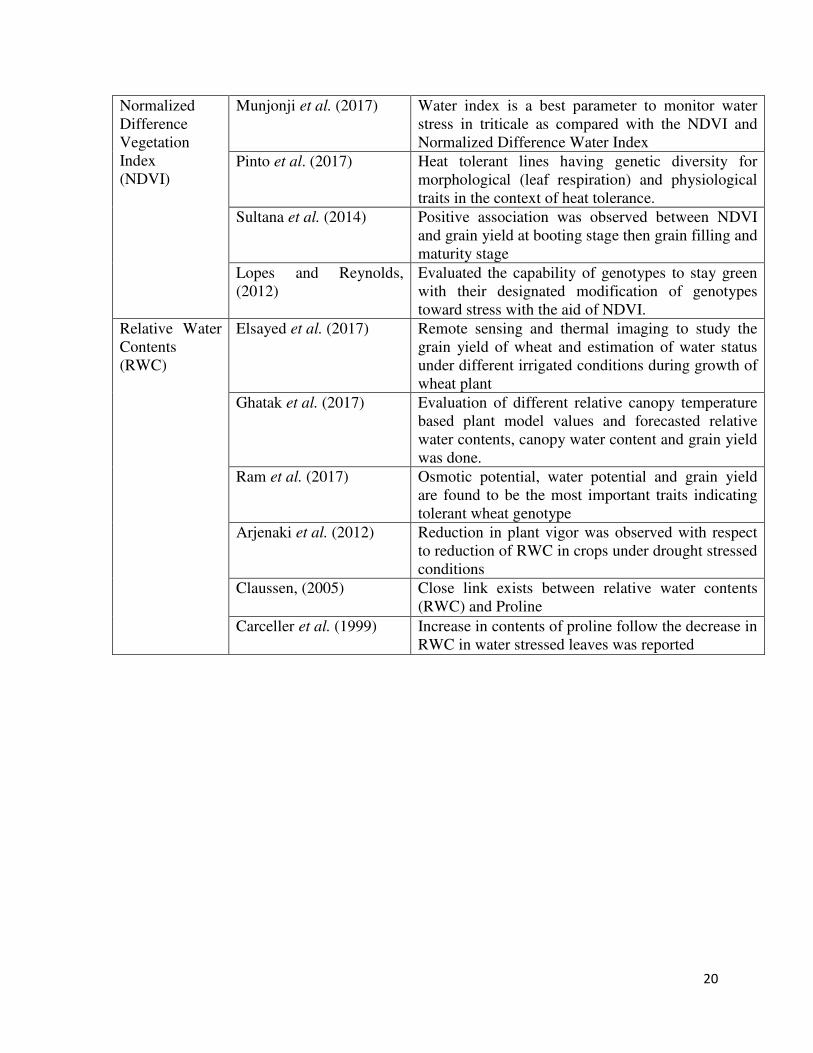
Normalized Difference Vegetation Index (NDVI)
Munjonji et al. (2017) Water index is a best parameter to monitor water stress in triticale as compared with the NDVI and Normalized Difference Water Index
Pinto et al. (2017) Heat tolerant lines having genetic diversity for morphological (leaf respiration) and physiological traits in the context of heat tolerance.
Sultana et al. (2014) Positive association was observed between NDVI and grain yield at booting stage then grain filling and maturity stage
Lopes and Reynolds, (2012)
Evaluated the capability of genotypes to stay green with their designated modification of genotypes toward stress with the aid of NDVI.
Relative Water Contents (RWC)
Elsayed et al. (2017) Remote sensing and thermal imaging to study the grain yield of wheat and estimation of water status under different irrigated conditions during growth of wheat plant
Ghatak et al. (2017) Evaluation of different relative canopy temperature based plant model values and forecasted relative water contents, canopy water content and grain yield was done.
Ram et al. (2017) Osmotic potential, water potential and grain yield are found to be the most important traits indicating tolerant wheat genotype
Arjenaki et al. (2012) Reduction in plant vigor was observed with respect to reduction of RWC in crops under drought stressed conditions
Claussen, (2005) Close link exists between relative water contents (RWC) and Proline
Carceller et al. (1999) Increase in contents of proline follow the decrease in RWC in water stressed leaves was reported
21
Chapter 3 MATERIALS AND METHODS
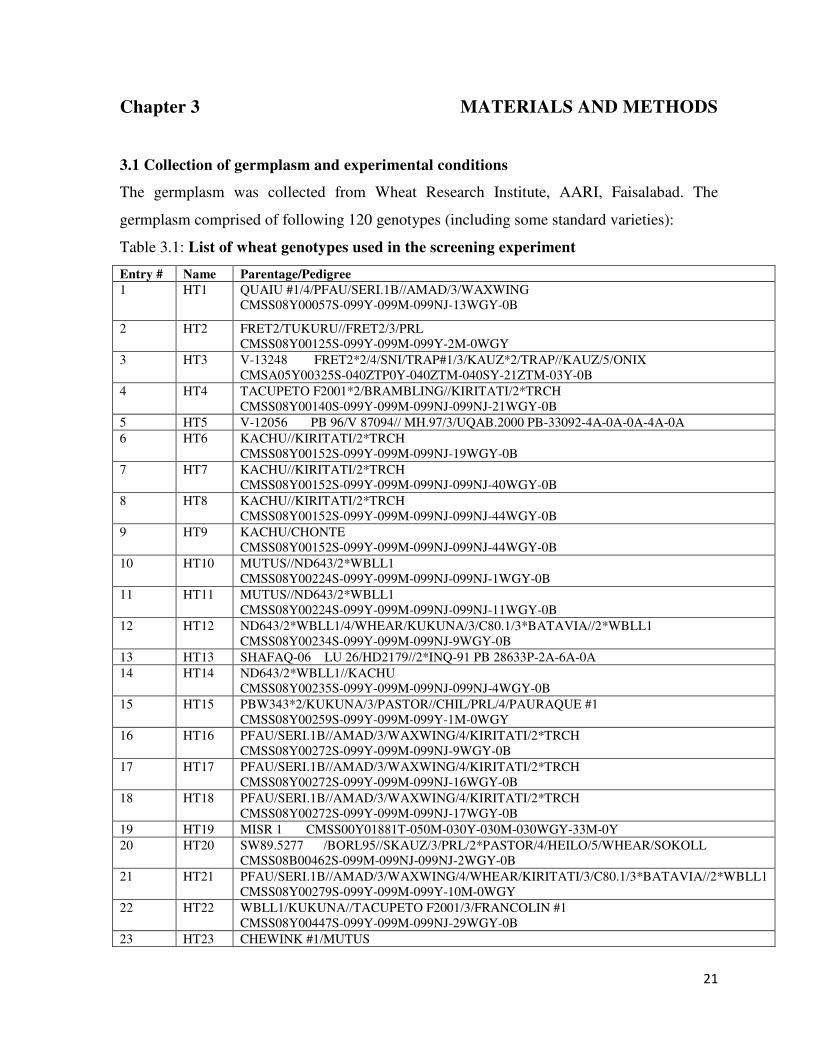
3.1 Collection of germplasm and experimental conditions
The germplasm was collected from Wheat Research Institute, AARI, Faisalabad. The
germplasm comprised of following 120 genotypes (including some standard varieties):
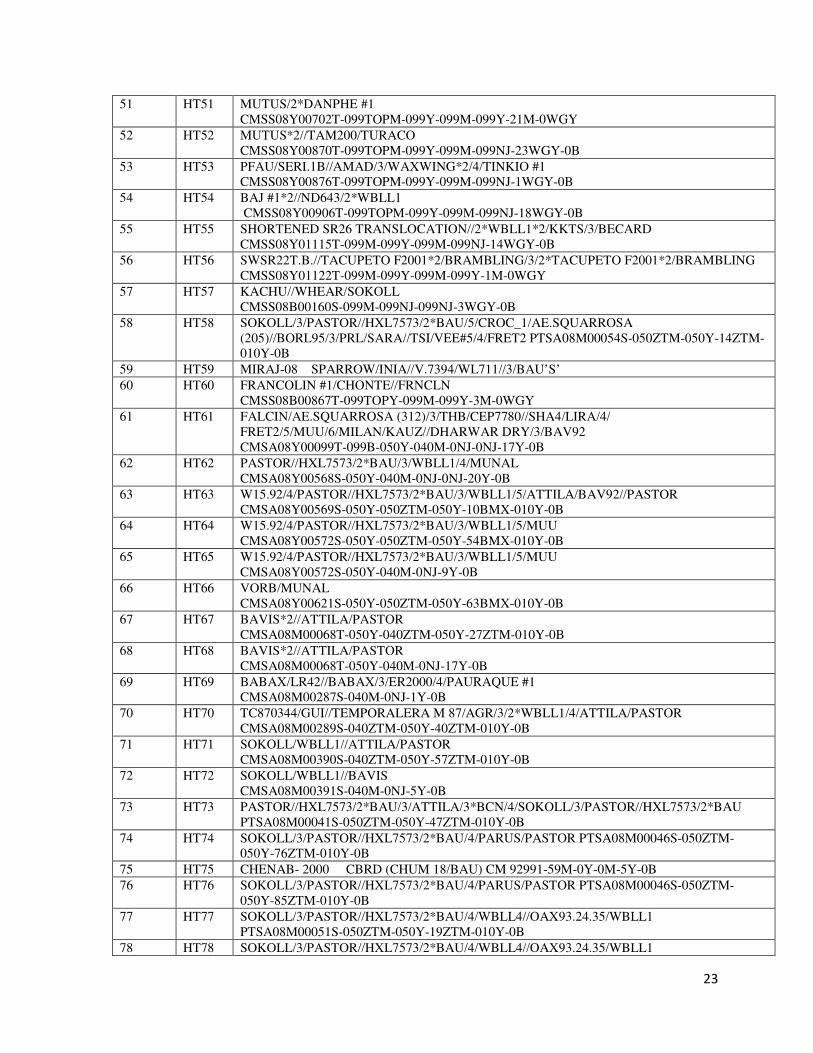
Table 3.1: List of wheat genotypes used in the screening experiment
Entry # Name Parentage/Pedigree 1 HT1 QUAIU #1/4/PFAU/SERI.1B//AMAD/3/WAXWING
CMSS08Y00057S-099Y-099M-099NJ-13WGY-0B
2 HT2 FRET2/TUKURU//FRET2/3/PRL CMSS08Y00125S-099Y-099M-099Y-2M-0WGY
3 HT3 V-13248 FRET2*2/4/SNI/TRAP#1/3/KAUZ*2/TRAP//KAUZ/5/ONIX CMSA05Y00325S-040ZTP0Y-040ZTM-040SY-21ZTM-03Y-0B
4 HT4 TACUPETO F2001*2/BRAMBLING//KIRITATI/2*TRCH CMSS08Y00140S-099Y-099M-099NJ-099NJ-21WGY-0B
5 HT5 V-12056 PB 96/V 87094// MH.97/3/UQAB.2000 PB-33092-4A-0A-0A-4A-0A 6 HT6 KACHU//KIRITATI/2*TRCH
CMSS08Y00152S-099Y-099M-099NJ-19WGY-0B 7 HT7 KACHU//KIRITATI/2*TRCH
CMSS08Y00152S-099Y-099M-099NJ-099NJ-40WGY-0B 8 HT8 KACHU//KIRITATI/2*TRCH
CMSS08Y00152S-099Y-099M-099NJ-099NJ-44WGY-0B 9 HT9 KACHU/CHONTE
CMSS08Y00152S-099Y-099M-099NJ-099NJ-44WGY-0B 10 HT10 MUTUS//ND643/2*WBLL1
CMSS08Y00224S-099Y-099M-099NJ-099NJ-1WGY-0B 11 HT11 MUTUS//ND643/2*WBLL1
CMSS08Y00224S-099Y-099M-099NJ-099NJ-11WGY-0B 12 HT12 ND643/2*WBLL1/4/WHEAR/KUKUNA/3/C80.1/3*BATAVIA//2*WBLL1
CMSS08Y00234S-099Y-099M-099NJ-9WGY-0B 13 HT13 SHAFAQ-06 LU 26/HD2179//2*INQ-91 PB 28633P-2A-6A-0A 14 HT14 ND643/2*WBLL1//KACHU
CMSS08Y00235S-099Y-099M-099NJ-099NJ-4WGY-0B 15 HT15 PBW343*2/KUKUNA/3/PASTOR//CHIL/PRL/4/PAURAQUE #1
CMSS08Y00259S-099Y-099M-099Y-1M-0WGY 16 HT16 PFAU/SERI.1B//AMAD/3/WAXWING/4/KIRITATI/2*TRCH
CMSS08Y00272S-099Y-099M-099NJ-9WGY-0B 17 HT17 PFAU/SERI.1B//AMAD/3/WAXWING/4/KIRITATI/2*TRCH
CMSS08Y00272S-099Y-099M-099NJ-16WGY-0B 18 HT18 PFAU/SERI.1B//AMAD/3/WAXWING/4/KIRITATI/2*TRCH
CMSS08Y00272S-099Y-099M-099NJ-17WGY-0B 19 HT19 MISR 1 CMSS00Y01881T-050M-030Y-030M-030WGY-33M-0Y 20 HT20 SW89.5277 /BORL95//SKAUZ/3/PRL/2*PASTOR/4/HEILO/5/WHEAR/SOKOLL
CMSS08B00462S-099M-099NJ-099NJ-2WGY-0B 21 HT21 PFAU/SERI.1B//AMAD/3/WAXWING/4/WHEAR/KIRITATI/3/C80.1/3*BATAVIA//2*WBLL1
CMSS08Y00279S-099Y-099M-099Y-10M-0WGY 22 HT22 WBLL1/KUKUNA//TACUPETO F2001/3/FRANCOLIN #1
CMSS08Y00447S-099Y-099M-099NJ-29WGY-0B 23 HT23 CHEWINK #1/MUTUS

22
CMSS08Y00485S-099Y-099M-099Y-5M-0WGY 24 HT24 FRNCLN*2/KINGBIRD #1
CMSS08Y00777T-099TOPM-099Y-099M-099NJ-1WGY-0B 25 HT25 BATHUR- 08 URES/JUN//KAUZ
CM96818-1-0Y-0M-0B-2Y-2Y-0M 26 HT26 WHEAR/VIVITSI//WHEAR/3/FRNCLN
CMSS08Y00491S-099Y-099M-099NJ-37WGY-0B 27 HT27 QUAIU//2*BRBT1*2/KIRITATI
CMSS08Y00623T-099TOPM-099Y-099M-099NJ-099NJ-7WGY-0B 28 HT28 QUAIU/3/KIRITATI//PBW65/2*SERI.1B/4/DANPHE #1
CMSS08Y00626T-099TOPM-099Y-099M-099Y-7M-0WGY 29 HT29 QUAIU*2/KINDE
CMSS08Y00627T-099TOPM-099Y-099M-099NJ-5WGY-0B 30 HT30 QUAIU*2/KINDE
CMSS08Y00627T-099TOPM-099Y-099M-099NJ-6WGY-0B 31 HT31 QUAIU*2/KINDE
CMSS08Y00627T-099TOPM-099Y-099M-099NJ-16WGY-0B 32 HT32 QUAIU*2/KINDE
CMSS08Y00627T-099TOPM-099Y-099M-099NJ-37WGY-0B 33 HT33 QUAIU*2/KINDE
CMSS08Y00627T-099TOPM-099Y-099M-099NJ-38WGY-0B 34 HT34 MUTUS*2/CHONTE
CMSS08Y00704T-099TOPM-099Y-099Y-11M-0WGY 35 HT35 PFAU/SERI.1B//AMAD/3/WAXWING/4/BAJ #1
CMSS07Y00195S-0B-099Y-099M-099Y-16M-0WGY 36 HT36 SHAHKAR-13 CMH84.3379/CMH78.578 //MILAN
CMSS93Y006285-7Y-010Y-010M-010Y-010M-0Y-3KBY-0KBY 37 HT37 WHEAR/KUKUNA/3/C80.1/3*BATAVIA//2*WBLL1*2/4/KBIRD
CMSS08Y00803T-099TOPM-099Y-099M-099NJ-36WGY-0B 38 HT38 WHEAR/KUKUNA/3/C80.1/3*BATAVIA//2*WBLL1*2/4/KBIRD
CMSS08Y00803T-099TOPM-099Y-099M-099NJ-099NJ-5WGY-0B 39 HT39 MUNAL*2/WESTONIA
CMSS08Y00833T-099TOPM-099Y-099M-099NJ-099NJ-11WGY-0B 40 HT40 MUNAL/3/HUW234+LR34/PRINIA//PFAU/WEAVER/4/MUNAL #1
CMSS08Y00888T-099TOPM-099Y-099M-099NJ-20WGY-0B 41 HT41 TIMBA/ELVIRA/3/BERKUT//PBW343*2/KUKUNA
CMSS08B00133S-099M-099Y-12M-0WGY 42 HT42 WBLL1*2/KURUKU//TACUPETO F2001*2/BRAMBLING
CMSS08B00167S-099M-099Y-9M-0WGY 43 HT43 QUAIU #1/BECARD
CMSS08B00181S-099M-099NJ-099NJ-34WGY-0B 44 HT44 TACUPETO F2001*2/BRAMBLING/3/KIRITATI//PBW65 /2*SERI.1B/4/TACUPETO
F2001*2/BRAMBLING CMSS08Y00675T-099TOPM-099Y-099M-099Y-3M-0WGY
45 HT45 WHEAR/SOKOLL/4/PRINIA/PASTOR//HUITES/3/MILAN/OTUS//ATTILA/3*BCN CMSS08B00507S-099M-099NJ-099NJ-21WGY-0B
46 HT46 WHEAR//2*PRL/2*PASTOR/3/WHEAR/SOKOLL CMSS08B00513S-099M-099NJ-099NJ-19WGY-0B
47 HT47 MUTUS//KIRITATI/2*TRCH/3/WHEAR/KRONSTAD F2004 CMSS08B00764T-099TOPY-099M-099NJ-27WGY-0B
48 HT48 BAVIS//ATTILA*2/PBW65 CMSA08Y00378S-050Y-050ZTM-050Y-2BMX-010Y-0B
49 HT49 MILLAT-11 CHENAB2000/INQ.91 50 HT50 FRANCOLIN #1*2//ND643/2*WBLL1
CMSS08B00866T-099TOPY-099M-099NJ-099NJ-40WGY-0B
23
51 HT51 MUTUS/2*DANPHE #1 CMSS08Y00702T-099TOPM-099Y-099M-099Y-21M-0WGY
52 HT52 MUTUS*2//TAM200/TURACO CMSS08Y00870T-099TOPM-099Y-099M-099NJ-23WGY-0B
53 HT53 PFAU/SERI.1B//AMAD/3/WAXWING*2/4/TINKIO #1 CMSS08Y00876T-099TOPM-099Y-099M-099NJ-1WGY-0B
54 HT54 BAJ #1*2//ND643/2*WBLL1 CMSS08Y00906T-099TOPM-099Y-099M-099NJ-18WGY-0B
55 HT55 SHORTENED SR26 TRANSLOCATION//2*WBLL1*2/KKTS/3/BECARD CMSS08Y01115T-099M-099Y-099M-099NJ-14WGY-0B
56 HT56 SWSR22T.B.//TACUPETO F2001*2/BRAMBLING/3/2*TACUPETO F2001*2/BRAMBLING CMSS08Y01122T-099M-099Y-099M-099Y-1M-0WGY
57 HT57 KACHU//WHEAR/SOKOLL CMSS08B00160S-099M-099NJ-099NJ-3WGY-0B
58 HT58 SOKOLL/3/PASTOR//HXL7573/2*BAU/5/CROC_1/AE.SQUARROSA (205)//BORL95/3/PRL/SARA//TSI/VEE#5/4/FRET2 PTSA08M00054S-050ZTM-050Y-14ZTM-010Y-0B
59 HT59 MIRAJ-08 SPARROW/INIA//V.7394/WL711//3/BAU’S’ 60 HT60 FRANCOLIN #1/CHONTE//FRNCLN
CMSS08B00867T-099TOPY-099M-099Y-3M-0WGY 61 HT61 FALCIN/AE.SQUARROSA (312)/3/THB/CEP7780//SHA4/LIRA/4/
FRET2/5/MUU/6/MILAN/KAUZ//DHARWAR DRY/3/BAV92 CMSA08Y00099T-099B-050Y-040M-0NJ-0NJ-17Y-0B
62 HT62 PASTOR//HXL7573/2*BAU/3/WBLL1/4/MUNAL CMSA08Y00568S-050Y-040M-0NJ-0NJ-20Y-0B
63 HT63 W15.92/4/PASTOR//HXL7573/2*BAU/3/WBLL1/5/ATTILA/BAV92//PASTOR CMSA08Y00569S-050Y-050ZTM-050Y-10BMX-010Y-0B
64 HT64 W15.92/4/PASTOR//HXL7573/2*BAU/3/WBLL1/5/MUU CMSA08Y00572S-050Y-050ZTM-050Y-54BMX-010Y-0B
65 HT65 W15.92/4/PASTOR//HXL7573/2*BAU/3/WBLL1/5/MUU CMSA08Y00572S-050Y-040M-0NJ-9Y-0B
66 HT66 VORB/MUNAL CMSA08Y00621S-050Y-050ZTM-050Y-63BMX-010Y-0B
67 HT67 BAVIS*2//ATTILA/PASTOR CMSA08M00068T-050Y-040ZTM-050Y-27ZTM-010Y-0B
68 HT68 BAVIS*2//ATTILA/PASTOR CMSA08M00068T-050Y-040M-0NJ-17Y-0B
69 HT69 BABAX/LR42//BABAX/3/ER2000/4/PAURAQUE #1 CMSA08M00287S-040M-0NJ-1Y-0B
70 HT70 TC870344/GUI//TEMPORALERA M 87/AGR/3/2*WBLL1/4/ATTILA/PASTOR CMSA08M00289S-040ZTM-050Y-40ZTM-010Y-0B
71 HT71 SOKOLL/WBLL1//ATTILA/PASTOR CMSA08M00390S-040ZTM-050Y-57ZTM-010Y-0B
72 HT72 SOKOLL/WBLL1//BAVIS CMSA08M00391S-040M-0NJ-5Y-0B
73 HT73 PASTOR//HXL7573/2*BAU/3/ATTILA/3*BCN/4/SOKOLL/3/PASTOR//HXL7573/2*BAU PTSA08M00041S-050ZTM-050Y-47ZTM-010Y-0B
74 HT74 SOKOLL/3/PASTOR//HXL7573/2*BAU/4/PARUS/PASTOR PTSA08M00046S-050ZTM-050Y-76ZTM-010Y-0B
75 HT75 CHENAB- 2000 CBRD (CHUM 18/BAU) CM 92991-59M-0Y-0M-5Y-0B 76 HT76 SOKOLL/3/PASTOR//HXL7573/2*BAU/4/PARUS/PASTOR PTSA08M00046S-050ZTM-
050Y-85ZTM-010Y-0B 77 HT77 SOKOLL/3/PASTOR//HXL7573/2*BAU/4/WBLL4//OAX93.24.35/WBLL1
PTSA08M00051S-050ZTM-050Y-19ZTM-010Y-0B 78 HT78 SOKOLL/3/PASTOR//HXL7573/2*BAU/4/WBLL4//OAX93.24.35/WBLL1

24
PTSA08M00051S-050ZTM-050Y-26ZTM-010Y-0B 79 HT79 SOKOLL/3/PASTOR//HXL7573/2*BAU/4/SOKOLL/WBLL1 PTSA08M00053S-050ZTM-
050Y-49ZTM-010Y-0B 80 HT80 SOKOLL/3/PASTOR//HXL7573/2*BAU/4/SOKOLL/WBLL1 PTSA08M00053S-050ZTM-
050Y-113ZTM-010Y-0B 81 HT81 WBLL1*2/BRAMBLING//CHYAK
CMSS07B00374S-099M-099NJ-099NJ-8WGY-0B 82 HT82 NAC/TH.AC//3*PVN/3/MIRLO/BUC/4/2*PASTOR/5/T.DICOCCON
PI94624/AE.SQUARROSA (409)//BCN/6/WBLL4//BABAX.1B.1B*2/PRL/3/PASTOR CMSS06B01043T-099TOPY-099Y-39M-0Y-2B-0Y
83 HT83 AARI- 11 SH.88/90A204//MH.97 84 HT84 TOBA97/PASTOR*2//AKURI
CMSS07Y01094T-099TOPM-099Y-099M-099NJ-099NJ-17WGY-0B 85 HT85 BAJ #1*2/HUIRIVIS #1
CMSS07Y01097T-099TOPM-099Y-099M-099Y-26M-0WGY 86 HT86 FRNCLN/3/GUAM92//PSN/BOW/4/PAURAQ
CMSS07Y01218T-099TOPM-099Y-099M-099Y-1M-0WGY 87 HT87 CHIBIA//PRLII/CM65531/3/FISCAL/4/ND643/2*WBLL1
CMSS07B00311S-099M-099Y-099M-4WGY-0B 88 HT88 FAISALABAD-08 PBW65/2*PASTOR CGSS97Y000367-099TOPB-067Y-099M-099Y-
099B-16Y-0B 89 HT89 SUP152/CHYAK1
CMSS07B00339S-099M-099Y-099M-11WGY-0B 90 HT90 PBW65/2*PASTOR/3/KIRITATI//PBW65/2*SERI.1B/4/DANPHE #1 CMSS07B00513T-
099TOPY-099M-099Y-099M-12WGY-0B 91 HT91 PUNJAB- 11 AMSEL/ATTILA// INQ.91/PEW’S’ 92 HT92 LASANI- 08 LUAN/KOH97 PBP.29645-14A-18A-8A-4A-2A-0A 93 HT93 NARC- 11 OASIS/SKAUZ//4*BC/3/2* PASTOR CMSS00Y01881T-050M-030Y-030M-
030WGY-33M-0Y-01D 94 HT94 SALEEM- 2000 CHAM6//KITE/PGO ICW93-0032-7F-0K-0F. 95 HT95 BARS- 09 PFAU/SERI//BOW CM85295-101TOPY-2M-0Y-0M-3Y-0M-0SY [or
CMSS97M00306S-0P5M-095Y-90M-010Y] 96 HT96 IMDAD-05 CHIL/2*STAR CM112793-0TOPY-8M-020-010M-3Y-010M-10Y 97 HT97 FAREED-06 PTS/3/TOB/LFN// BB/4/BB/HD-832-5//ON/GV/ALD'S'/ /HPO'S'BR-3385-3B-1B-
0B 98 HT98 HEILO//MILAN/MUNIA/3/KIRITATI/2*TRCH
CMSS08Y00127S-099Y-099M-099NJ-30WGY-0B 99 HT99 KACHU//KIRITATI/2*TRCH
CMSS08Y00152S-099Y-099M-099Y-2M-0WGY 100 HT100 SEHER-06 CHIL/2*STAR/4/BOW/CROW//BUC/PVN/3/ 2*VEE#10 CMSS9Y00645-100Y-
200M-17Y-10M-0Y-0P-PAK 101 HT101 ND643 /2*WBLL1//ATTILA*2/PBW65/3/MUNAL
CMSS07B00807T-099TOPY-099M-099NJ-099NJ-1WGY-0B 102 HT102 TACUPETO F2001*2/KIRITATI//BLOUK #1
CMSS07Y00111S-0B-099Y-099M-099Y-9M-0RGY 103 HT103 WBLL1*2/BRAMBLING//SUP152 CMSS07Y00311S-0B-099Y-099M-099NJ-099NJ-5RGY-0B 104 HT104 V-13005 EGA BONNIE ROCK/6/CPI8/GEDIZ/3/GOO//ALB/ CRA/4/ AE.SQ (208 ) /
5/2*WESTONIA CMSA05M00023S-0130ZTM-039(LR34HOM+HET)ZTY-040ZTM-040SY-15ZTM-0Y-0B
105 HT105 V-13013 BAJ #1*2/HUIRIVIS #1 CMSS07Y01097T-099TOPM-099Y-099M-099Y-26M-0WGY
106 HT106 V-13016 ND643/2*WBLL1//ATTILA*2/PBW65/3/MUNAL CMSS07B00807T-099TOPY-099M-099NJ-099NJ-1WGY-0B
107 HT107 V-12126 ROLF07*2/KACHU #1 CMSS06Y00883T-099TOPM-099Y-099ZTM-099Y-099M-7WGY-0B

25
108 HT108 V-12120 WBLL1*2/KURUKU//HEILO CMSS06Y00351S-0B-099Y-099ZTM-099Y-099M-25WGY-0B
109 HT109 V-12082 MILAN/KAUZ//PRINIA/3/BAV92/5/TRAP#1/BOW// VEE#5/SARA/3/ZHE JIANG 4/4/DUCULA CMSA05Y00199S-040ZTP0Y-040ZTM-040SY-15ZTM-04Y-0B
110 HT110 GALAXY -13 PB96/87094/MH-97 111 HT111 ND643/2*WBLL1//KACHU
CMSS08Y00235S-099Y-099M-099NJ-1WGY-0B 112 HT112 V-12130 WBLL1*2/BRAMBLING//KACHU
CMSS06B00161S-0Y-099ZTM-099Y-099M-11WGY-0B 113 HT113 V-12053 PB 96/V 87094// MH.97/3/UQAB.2000 PB-33092-2A-0A-0A-2A-0A 114 HT114 V-13241 SOKOLL//PBW343*2/KUKUNA/3/ATTILA/PASTOR
CMSA05Y01188T-040M-040ZTP0Y-040ZTM-040SY-17ZTM-04Y-0B 115 HT115 KACHU #1//WBLL1*2/KUKUNA
CMSS07Y00129S-0B-099Y-099M-099NJ-099NJ-12WGY-0B 116 HT116 V-13255 TRCH/5/REH/HARE//2*BCN/3/CROC_1/AE.SQUARROSA
(213)//PGO/4/HUITES CMSS05B00742S-099Y-099M-099Y-099ZTM-5WGY-0B
117 HT117 V-13258 SAUAL/3/MILAN/S87230//BAV92 CMSS05B00593S-099Y-099M-099Y-099ZTM-14WGY-0B
118 HT118 V-12066 F 60314.76/ MRL// CNO 79/3/ LUCO-M/4/HEI/3* CNO 79//2* SERI/5/ KAUZ// BOW/NKT PB- 33188-2A-0A-0A-1A-0A
119 HT119 MARVI-2000 CMH-77A917/PKV1600//RL6010/68SKA 120 HT120 V-12103 WBLL1*2/KURUKU//HEILO
CMSS06Y00351S-0B-099Y-099ZTM-099Y-0FUS-11WGY-0B HT = Heat Trial (Experiment coding for genotypes)
3.2. Experiment # 1 (Screening of Germplasm)
This study was conducted in the experimental area of Wheat Research Institute, AARI,
Faisalabad during the crop season 2014-15 with sowing date of Nov 15, 2015. The
germplasm of wheat comprising of 120 lines/varieties was planted in two different sets of
environmental conditions. One set of genotypes sown in the tunnel and other set of genotypes
was sown in the field under normal environmental conditions. Sowing of each genotype in
row by keeping distance of 30 cm as well as 7.5 cm row to row and plant to plant,
respectively. Three seeds/hill were placed at the sowing time and then in future thinned to a
single seedling at the time of two-leaf stage. Application of fertilizer with NPK at the ratio of
120-90-60 kg/ha. All the additional standard agronomic practices were adopted when needed
in both environmental conditions. Heat stress was applied to wheat plants at the anthesis
stage by covering the tunnel with the sheet (plastic sheet). Temperature was recorded on
daily basis both inner and outer side of the tunnel and maintained at > 40°C inside the tunnel.
26
During application of heat stress samples from each entry were randomly selected from both
normal and heat stress conditions, data for the following characters were recorded and then
average was calculated.
1. Cell Membrane Thermo-stability (CMT)
2. Normalized Difference Vegetation Index at vegetative stage (NDVIV)
3. Normalized Difference Vegetation Index at grain filling stage (NDVIG)
4. Canopy Temperature at vegetative stage (CTV)
5. Canopy Temperature at grain filling stage (CTG)
6. Relative Water Content (RWC)
7. Flag leaf area
8. Number of grains per spike
9. Number of spikelets per spike
10. Grain yield per plant
11. 1000-grains weight
3.2.1 Cell Membrane Thermostability (CMT):
CMT was recorded by using the method, which was proposed by Saadalla et al., (1990) then
improved by Petcu and Ciuca, (2009). From selected plants, fully extended leaf sections were
taken before anthesis stage and leaf discs with size of 10mm diameter put in each falcon
tubes with five discs in each tube. Two to three times leaf discs were washed with deionized
water. Fill each tube with 20-milliliter water (deionized) then put at normal temperature for
almost two hours then after gentle mixing, initial electrical conductance (C1) was recorded.
Then autoclave samples @ 121°C for 15 minutes and then kept overnight on normal room
temperature to record second electrical conductance (C2) observation.
CMT was measured using the formula:
CMT = 1 - (C1/C2) × 100
Where C1 and C2 indicate the first and the second reading of electrical conductance,
respectively.

27
3.2.2. Normalized difference vegetation index at vegetative stage (NDVIV)
NDVI is the recording of the quantity of green vegetation in that area. NDVI worked on the
principle that rapidly growing green plants that have powerfully absorption of radiation in
visible (VIS) area of the spectrum (the “PAR,” or “photosynthetically active radiation”),
while strongly reflecting radiation in the near-infrared (NIR) region. When plants reached at
booting stage, ground cover was estimated with the help of GreenSeeker hand held crop
sensor that measures normalized difference vegetation index. Distance from canopy was kept
50 cm and leveled horizontally.
3.2.3 Canopy Temperature at vegetative stage (CTV)
At booting stage of crop, a hand-held digital Infrared thermometer LT300 was used to
measure canopy temperature in centigrade. The distance from the canopy was kept 50 cm
and the slope was 45°, taking care that laser light should only focus on canopy. Data was
recorded on open sunny day during 10:00 a.m. to 2:00 p.m.
3.2.4. Normalized difference vegetation index at grain filling stage (NDVIG)
Data were recorded at mid grain filling stage with the help of GreenSeeker with same
precautions as mentioned in 3.2.1.
3.2.5. Canopy Temperature at grain filling stage (CTG) (°C)
Data were recorded at mid grain filling stage with the help of infrared thermometer with
same procedure and precautions as mentioned in 3.2.3.
3.2.6. Relative water content:
The flag leaf of five selected plants were weighed fresh (WF), floated on distilled water at
room temperature in the dark for 4 h, weighed again (WT), and finally dried at 80°C for 48 h
for dry weight determination (WD) for calculating RWC. Relative water content was
calculated by the following formula as given:
(WF- WD) RWC (%) = -------------------- ×100 (WT – WD)

28
3.2.7. Flag leaf area (cm2)
Flag leaves of fully matured selected plants of each genotypes were used for this purpose.
Maximum length and width of this leaves were measured in cm2. Leaf area was calculated by
following the formula described by Muller (1991) as under.
Flag leaf area = Flag leaf length × Flag leaf Width × 0.74
3.2.8. Number of grains per spike
The spike of the mother shoot was threshed manually and numbers of grains per spike were
counted for each genotype.
3.2.9. Number of spikelets per spike
In wheat plant, spike’s smaller units are known as spikelets and those spikelets have 3 to 5
florets. Spikelets/spike were counted from selected mother spike and mean values were
calculated.
3.2.10. Grain yield per plant (g)
Thrashing of all spikes from plant then with the use of electric balance, (Compax- Cx-600)
weighted. Mean data of grain yield/plant was calculated from replications.
3.2.11. 1000-grain weight (g)
Ten plants were randomly selected from all replications of each entry and bulked separately.
Thousand grains were taken from bulk seeds and were weighted by using electric balance
(Compax- Cx-600) to record 1000-grain weight.
29
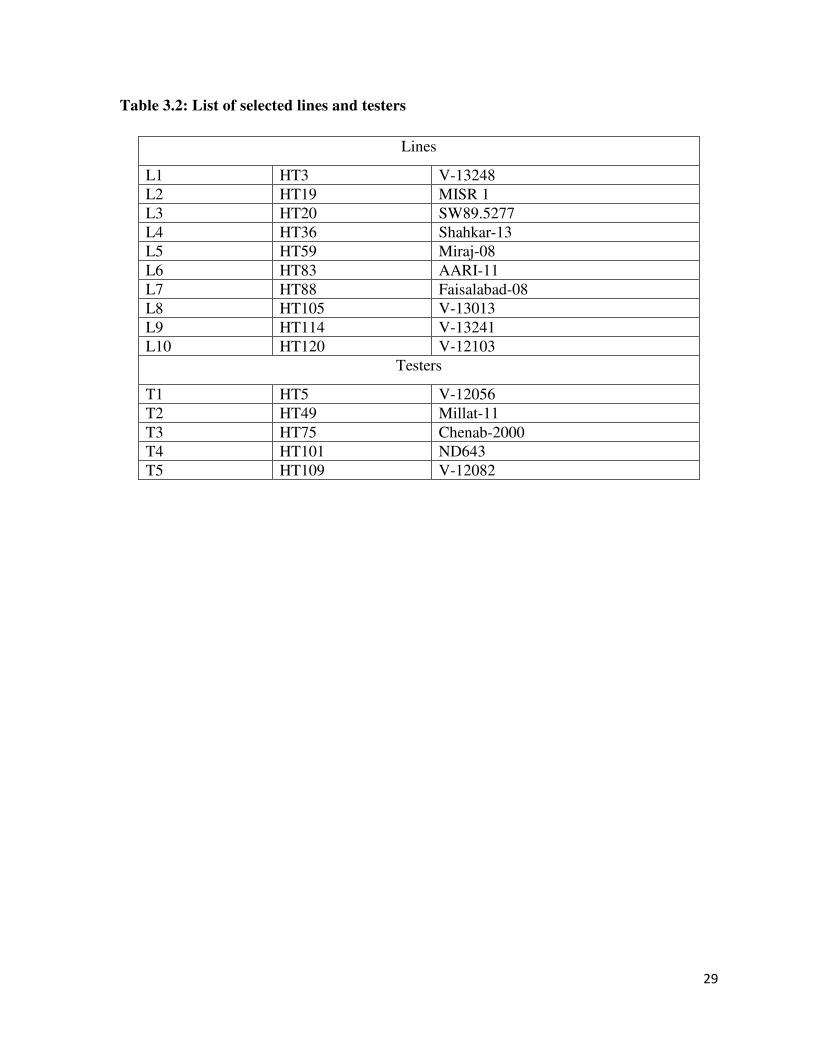
Table 3.2: List of selected lines and testers
Lines
L1 HT3 V-13248 L2 HT19 MISR 1 L3 HT20 SW89.5277 L4 HT36 Shahkar-13 L5 HT59 Miraj-08 L6 HT83 AARI-11 L7 HT88 Faisalabad-08 L8 HT105 V-13013 L9 HT114 V-13241 L10 HT120 V-12103
Testers
T1 HT5 V-12056 T2 HT49 Millat-11 T3 HT75 Chenab-2000 T4 HT101 ND643 T5 HT109 V-12082

30
Table 3.3: List of crosses for line × tester mating design
V-13248 × V-12056 V-13248 × MILLAT-11 V-13248 × CHENAB-2000 V-13248 × ND643 V-13248 × V-12082 MISR 1 × V-12056 MISR 1 × MILLAT-11 MISR 1 × CHENAB-2000 MISR 1 × ND643 MISR 1 × V-12082 SW89.5277 × V-12056 SW89.5277 × MILLAT-11 SW89.5277 × CHENAB-2000 SW89.5277 × ND643 SW89.5277 × V-12082 SHAHKAR-13 × V-12056 SHAHKAR-13 × MILLAT-11 SHAHKAR-13 × CHENAB-2000 SHAHKAR-13 × ND643 SHAHKAR-13 × V-12082 MIRAJ-08 × V-12056 MIRAJ-08 × MILLAT-11 MIRAJ-08 × CHENAB-2000 MIRAJ-08 × ND643 MIRAJ-08 × V-12082 AARI-11 × V-12056 AARI-11 × MILLAT-11 AARI-11 × CHENAB-2000 AARI-11 × ND643 AARI-11 × V-12082 FAISALABAD-08 × V-12056 FAISALABAD-08 × MILLAT-11 FAISALABAD-08 × CHENAB-2000 FAISALABAD-08 × ND643 FAISALABAD-08 × V-12082 V-13013 × V-12056 V-13013 × MILLAT-11 V-13013 × CHENAB-2000 V-13013 × ND643 V-13013 × V-12082 V-13241 × V-12056 V-13241 × MILLAT-11 V-13241 × CHENAB-2000 V-13241 × ND643 V-13241 × V-12082 V-12103 × V-12056 V-12103 × MILLAT-11 V-12103 × CHENAB-2000 V-12103 × ND643 V-12103 × V-12082

31
3.3. Experiment# 2
3.3.1. Experimental layout
Selected lines and testers along with their crosses were sown using randomized complete
block design replicated thrice in the field and tunnel during the crop season 2015-16 with
sowing date of Nov 20, 2016. The gross plot size was kept two rows six meter each, distance
between rows was 30 cm while a net plot size of two rows of five meter each were harvested
to record data for grain yield. Normal agronomic and cultural practices were applied to the
experiment throughout the growing season.

32
3.3.2. Data recording
Data were recorded for the following plant parameters of selected plants.
Table-3.4: Morpho–physiological and quality traits studied under normal and heat stress conditions
Serial No. Trait 1 Cell Membrane Thermo-stability (CMT)
2 Normalized Difference Vegetation Index at vegetative stage (NDVIV)
3 Normalized Difference Vegetation Index at grain filling stage (NDVIG)
4 Canopy Temperature at vegetative stage (CTV)
5 Canopy Temperature at grain filling stage (CTG)
6 Relative Water Content (RWC)
7 Plant height (cm)
8 Flag leaf area (cm2)
9 Peduncle length (cm)
10 Spike length (cm)
11 Fertile tillers per plant
12 Days to heading
13 Days to maturity
14 Spikelets per spike
15 Grains per spike
16 1000-grain weight (g)
17 Grain yield per plant (g)
18 Test weight (kg/hl)
19 Protein (%)
20 Moisture content
21 Ash (%)
22 Gluten (%)
23 Starch (%)
33
3.3.3. Cell Membrane Thermostability:
Cell Membrane Thermostability was measured as described in section 3.2.1.
3.3.4. Normalized difference vegetation index at vegetative stage (NDVIV)
Normalized difference vegetation index at vegetative stage noted as described in section
3.2.2.
3.3.5. Canopy temperature at vegetative stage (CTV) (°C)
Canopy temperature at vegetative stage was recorded as described in section 3.2.3.
3.3.6. Normalized difference vegetation index at grain filling stage (NDVIG)
Normalized difference vegetation index at grain filling stage measured as described in
section 3.2.4.
3.3.7. Canopy Temperature at grain filling stage (CTG) (°C)
Canopy temperature at grain filling stage measured as described in section 3.2.5.
3.3.8. Relative water content:
Relative water content was calculated as described in section 3.2.6.
3.3.9. Plant height (cm)
Height of randomly selected ten plants from three replications of each entry from top (tip of
spike without awns) to bottom. Mean data of these plants was used for future statistical
analysis.
3.3.10. Flag leaf area (cm2)
Flag leaf area calculated as described in section 3.2.7.
3.3.11. Peduncle length (cm)
From selected plants, peduncle length was recorded at maturity from node to base of spike.
Mean data of these plants for peduncle length was used for future statistical analysis.
3.3.12. Spike length (cm)
Spike length was noted from selected mother plants in centimeters (cm) from base to the tip
of spike excluding awns. Average of spike length was used.
3.3.13. Number of tillers per plant
From selected plants, numbers of tillers from each genotypes were recorded at crop maturity
with each replication and mean data was used.
34
3.3.14. Days to heading
Days to heading was counted from date of sowing up to the date when it have more than 50
percent plants with completed heading.
3.3.15. Days to maturity
From selected plants, days taken to maturity recorded as the duration from sowing to
maturity dates when plants were physiologically mature.
3.3.16. Number of spikelets per spike
Number of spikelets per spike noted as described in section 3.2.9.
3.3.17. Number of grains per spike
Number of grains per spike recorded as described in section 3.2.8.
3.3.18. 1000-grains weight (g)
1000-grains weight was measured as described in section 3.2.10.
3.3.19. Grain yield per plant (g)
Grain yield per plant was calculated as described in section 3.2.11.
3.4. Quality Traits
3.4.1. Protein (%)
kjeldahl apparatus (D-40599, Behr Labor Technik, Gmbh-Germany) was used to assess the
nitrogen percentage in the raw samples by following ACCA (2000) method number 46-12.
Accordingly, 2g of moisture free sample (wheat flour) was added in 30 ml of concentrated
H2SO4 and then 5g digestion mixture (K2SO4: FeSO4: CuSo4 at 100:5:10 ratio) was added
and kept for 3-4 hours, until the color was light greenish. Dilution of the digested material
was done in a 250 ml volumetric flask using distilled water. Then 10 ml of dilution from 250
ml volumetric flask was taken and 10 ml alkali (40% NaOH) was added in the distillation
apparatus to get the nitrogen samples of the contents in the form of NH4OH. The ammonia
thus liberated was collected in a beaker containing 10 ml of 4% boric acid solution using
methyl red as an indicator. This resulted in the formation of ammonium borate that was used
for the nitrogen determination in samples. Nitrogen was estimated by titrating the distillate in
the receiver flask against 0.1N H2SO4 till light pink end color. Protein (%) was calculated by
multiplying nitrogen percentage (N %) with factor 6.25 as given bellow:
35
Vol. of 0.1N H2SO4 × 0.0014 × Vol. of Dilution (250 ml) N (%) = --------------------------------------------------------------------------------- × 100 Vol. of distillate taken × Wt. of Sample
Crude protein (%) = Nitrogen (%) × 6.25
3.4.2. Starch (%)
For starch percentage determination, method number 22-08 as described in AACC (2000)
applied. Wheat flour of 3.5grams sample mixed with water (25 ml) for slurry formation.
Rapid visco analyzer (RVA) stirred heated slurry (heated at 60 to 95°C for 6 minutes). Peak
values of viscosity were noted from rapid visco analyzer as they make a curve. Starch
viscosity was indicated by measuring the resistance of slurry (water and flour) in RVA. After
heating slurry, granules of starch make thicker slurry. Highest peak viscosity was observed in
thicker slurry that have more resistance during stirring. Results of RVA during high heating
cycle highest viscosity was observed in rapid visco units (RVU).
3.4.3. Ash
The ash content of raw samples were estimated according to the procedures described in
AACC (2000) Method No. 08-01. 5g of sample was taken in pre-weighted crucibles and
directly charred on flame until there was no fumes coming out. Afterwards sample was
ignited in muffle furnace (MF-1/02, PCSIR, Pakistan) at 550-600oC for 5-6 hours until
grayish white residues were obtained. Ash content after cooling in desiccators was calculated
as:
Wt. of residues (g) Ash (%) = ------------------------------- × 100 Wt. of samples (g)
3.4.4. Moisture
The moisture content of raw samples was determined following method described by AACC
(2000) method No. 44-15A. Accordingly, 5g sample was placed in already weighted china
dish and dried it in a hot air oven (Model: DO-1-30/02, PCSIR, Pakistan) at the temperature
of 105 ± 5oC for 24 hours. The samples were cooled in desiccator. The moisture percentage
was calculated by using following formula.
Wt. of original samples (g) - Wt. of dried samples (g) Moisture (%) = ----------------------------------------------------------------------- × 100 Wt. of original samples (g)

36
3.4.5. Gluten (%)
The gluten content of raw samples was determined by following AACC (2000) method No.
38-12A. Already weighted sample of 10 grams wheat flour of 10 and put in glutomatic
washing chamber on top of the polyester screen. Mix sample and wash samples with salt
solution (2%) for 5 minutes. After washing wet gluten was removed from chamber and then
placed into centrifuge for centrifugation. From top of screen, collected residues were
weighted. The gluten percentage (%) was calculated by the formula given below
Weight of wet gluten obtained (g) Wet gluten % = ------------------------------------------ × 100
Weight of flour (10g)
3.4.6. Test weight (kg/hl)
The test weight of samples was determined by following AACC (2000) method No. 55-10.
Test weight was recorded in kilogram per hectoliter by using test weight apparatus.
3.5. Statistical analysis:
3.5.1. Analysis of variance
Different stages of plants were used to collect data for almost all different agro-
morphological, physiological and quality parameters under normal and heat stress conditions
for analysis of variance (Steel et al., 1997). Traits showing significant genotypic differences
were further subjected to analysis for genetic components determination.
3.5.2. Cluster Analysis
Cluster analysis clarifies the data into groups which are significantly different from each
other but have similarity among the members of each group. These groups are also called
clusters. Similar items are placed in single cluster. For this purpose, various techniques were
used to group the data into cluster form. Partitioning and Hierarchical clustering are two
types of clustering analysis. Through Hierarchical methods, we can gather small clusters of
items that are much more similar. Through these smaller clusters, we can gather larger
clusters of items, which are much more dissimilar. We can interpret the results of
Hierarchical method through graphical approach called Dendogram (Ward, 1963).
Hierarchical method can be further classified into two types; one that divides the larger
clusters into two smaller clusters and further subdivides each cluster into two clusters until
desired level of clustering is obtained. Second method adopts the clustering in opposite
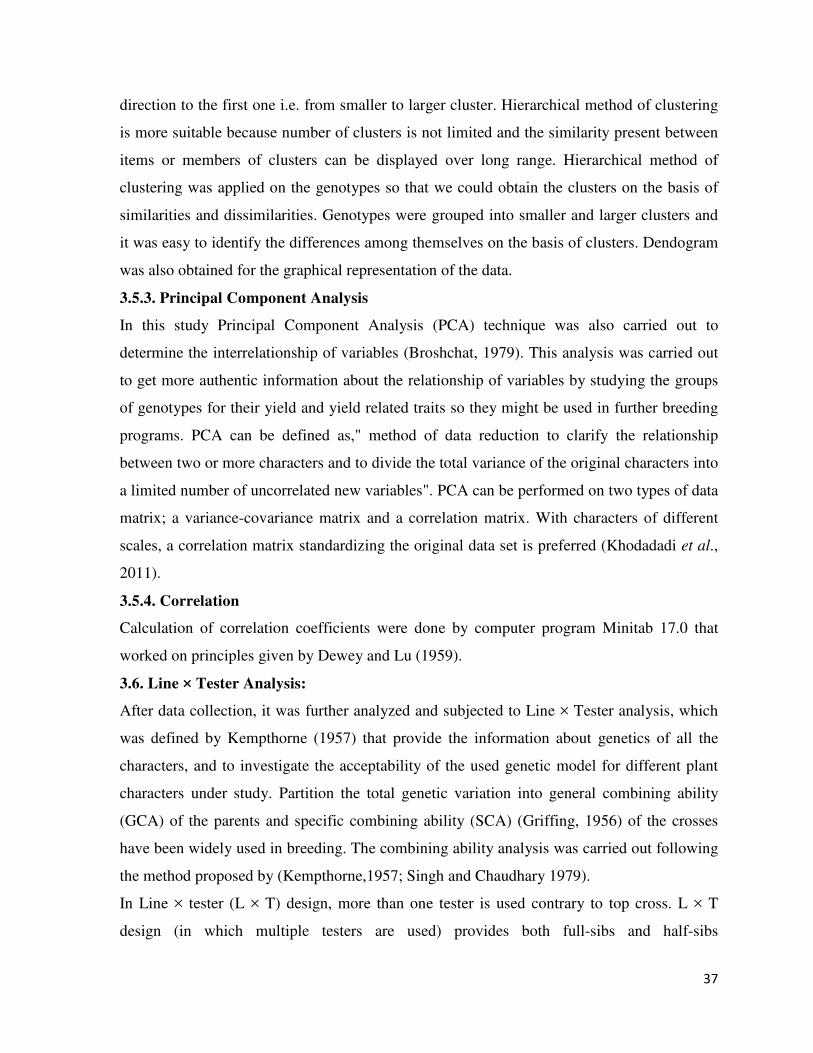
37
direction to the first one i.e. from smaller to larger cluster. Hierarchical method of clustering
is more suitable because number of clusters is not limited and the similarity present between
items or members of clusters can be displayed over long range. Hierarchical method of
clustering was applied on the genotypes so that we could obtain the clusters on the basis of
similarities and dissimilarities. Genotypes were grouped into smaller and larger clusters and
it was easy to identify the differences among themselves on the basis of clusters. Dendogram
was also obtained for the graphical representation of the data.
3.5.3. Principal Component Analysis
In this study Principal Component Analysis (PCA) technique was also carried out to
determine the interrelationship of variables (Broshchat, 1979). This analysis was carried out
to get more authentic information about the relationship of variables by studying the groups
of genotypes for their yield and yield related traits so they might be used in further breeding
programs. PCA can be defined as," method of data reduction to clarify the relationship
between two or more characters and to divide the total variance of the original characters into
a limited number of uncorrelated new variables". PCA can be performed on two types of data
matrix; a variance-covariance matrix and a correlation matrix. With characters of different
scales, a correlation matrix standardizing the original data set is preferred (Khodadadi et al.,
2011).
3.5.4. Correlation
Calculation of correlation coefficients were done by computer program Minitab 17.0 that
worked on principles given by Dewey and Lu (1959).
3.6. Line × Tester Analysis:
After data collection, it was further analyzed and subjected to Line × Tester analysis, which
was defined by Kempthorne (1957) that provide the information about genetics of all the
characters, and to investigate the acceptability of the used genetic model for different plant
characters under study. Partition the total genetic variation into general combining ability
(GCA) of the parents and specific combining ability (SCA) (Griffing, 1956) of the crosses
have been widely used in breeding. The combining ability analysis was carried out following
the method proposed by (Kempthorne,1957; Singh and Chaudhary 1979).
In Line × tester (L × T) design, more than one tester is used contrary to top cross. L × T
design (in which multiple testers are used) provides both full-sibs and half-sibs

38
simultaneously. The design provides SCA of each cross and GCA of both the lines and of the
testers. Both the lines and testers have different sets of genotypes (Farhan et al., 2012). A
significant L × T interaction provides evidence that the ranking of experimental lines differ
depending on the tester used (Packer, 2007), hence an appropriate tester must be selected to
evaluate new germplasm lines (Ali et al., 2011). The testers that can be used in a breeding
program may either be genetically narrow or broad-based, related or unrelated (to the lines
being evaluated) or may have high or low frequency of favorable alleles and high or low
yielding (Ali et al., 2011; Packer, 2007).
In general, the combining ability study between the line and the tester determines the
performance of hybrids. Packer (2007) pointed out that an effective tester should correctly
rank inbred lines for the performance in hybrid combination, and that it should maximize the
variance between testcross progeny to allow for efficient refinement of new inbred lines.
Consequently, lines with poor combining abilities are discarded and only good performing
lines are advanced in the program (Shahab et al., 2011). Several researchers (Shushay et al.,
2013; Udaykumar et al., 2014; Gouda et al., 2013) with different findings on general and
specific combining abilities for grain yield and other agronomic traits conducted line × tester
studies.
Various statistical steps included in this procedure:
� Analysis of variance (ANOVA)
� Treatment sum of squares
� Line × Tester Analysis
� Estimation of GCA effects for lines and Testers
� Estimation of SCA effects for crosses
� Standard errors for combining ability effects
� Genetic components of Variation
� Proportional contribution of lines, testers and their interactions to total variance.
3.6.1. Estimation of GCA effects
Lines: gi = {(xi../tr) - (x.../ltr)}
Tetsers: gt = {(x.j./1r) — (x../ltr)}
Where,
l= number of lines

39
t = number of testers
r = number of replications
xj.. = Total of F1 resulting from crossing ith lines with all the testers
x.j. = Total of testers
x.. = Total of all the crosses
3.6.2. Estimation of SCA effects
Sij = {(xij.)/r) - (xi../tr) - (x.j./lr) + (x../ltr)}
Where,
xij. = Total of F1 resulting from crossing ith lines with jth tester
xi = Total of all the crosses of ith line with all the testers
x.j. = Total of all the crosses of jth tester with all the lines
3.6.3. Standard error for combining ability effects
S.E. (gca for lines) = (Me/r × t) 0.5
S.E. (gca for testers) = (Me/r × l) 0.5
S. E. (sca for effects) = (Me/r) 0.5
3.6.4 Genetic components of variation
Cov H. S. (line) = Ml – M l × t /r t
Cov H.S. (tester) = Mt – M l × t /r t
Cov H.S. (average) = [1/r (2lt-l-t)] [({(l-1) (Ml) + (t-1) (Mt)}/ (l+t-2)) – M l × t
Additive and dominance genetic variances (δ2A and δ2D respectively) were calculated by
taking inbreeding coefficient (F) equal to one; i.e. F = 1 because both lines and testers were
inbred.
3.6.4. Proportional contribution of lines, testers and their interaction to total variance
Contribution of Lines = {SS (l)/SS (crosses)) × 100
Contribution of Testers = {SS (t)/SS (crosses)) × 100
Contribution of l×t = SS (l×t)/SS (crosses)) × 100
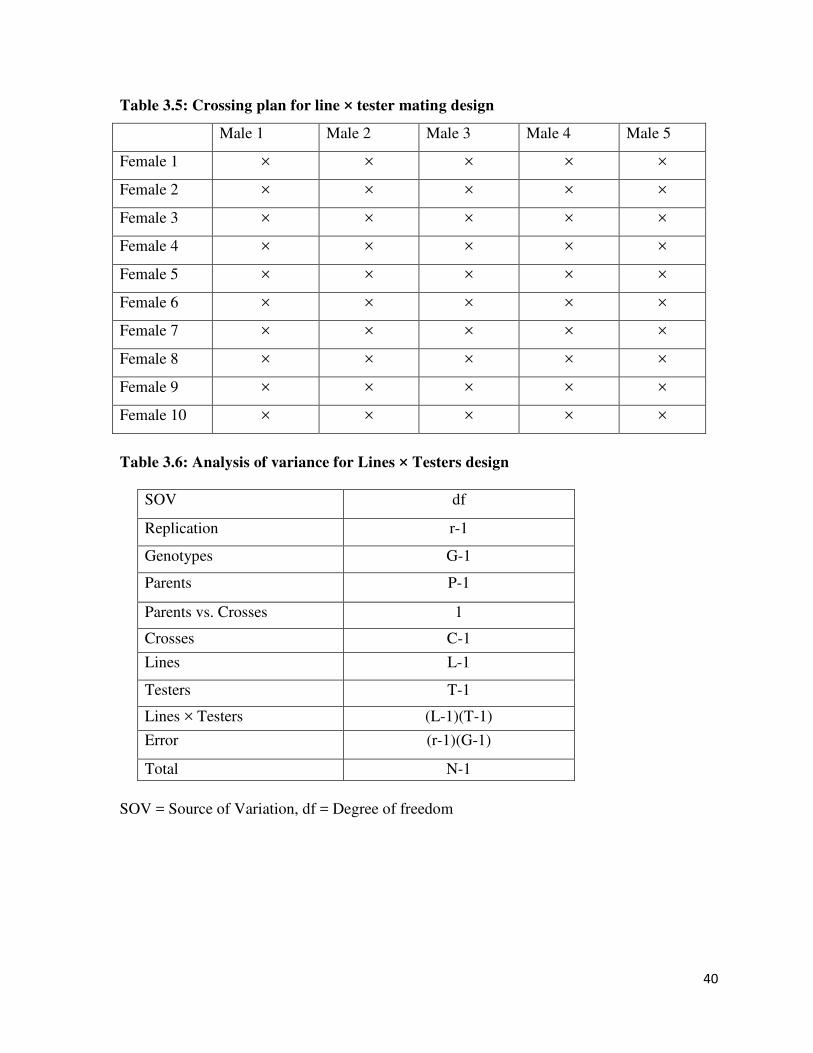
40
Table 3.5: Crossing plan for line × tester mating design
Male 1 Male 2 Male 3 Male 4 Male 5
Female 1 × × × × ×
Female 2 × × × × ×
Female 3 × × × × ×
Female 4 × × × × ×
Female 5 × × × × ×
Female 6 × × × × ×
Female 7 × × × × ×
Female 8 × × × × ×
Female 9 × × × × ×
Female 10 × × × × ×
Table 3.6: Analysis of variance for Lines × Testers design
SOV df
Replication r-1
Genotypes G-1
Parents P-1
Parents vs. Crosses 1
Crosses C-1
Lines L-1
Testers T-1
Lines × Testers (L-1)(T-1)
Error (r-1)(G-1)
Total N-1 SOV = Source of Variation, df = Degree of freedom

41
Chapter 4 RESULTS AND DISCUSSION
Genetic study of plant architecture is very crucial to increase the plant productivity for
catering the basic food requirement of rapidly emerging world population. Improvement in
different quantitative and qualitative traits should be under focus. For the development of
high yielding varieties with new and diverse range of genetic material and improvement of
existing varieties so for that plant breeders should have complete understanding for the
inheritance pattern of yield as well as yield related traits in all types of diverse range
environmental conditions. Different yield related traits in cereals are plant high, flag leaf
area, tillers number per plant, days to heading, days to maturity, length of spike, spikelets per
plant, plant grain yield and weight of 1000 grains. High temperature stressed conditions is
one of the main concerns for productivity and crop improvement. Identification of the better
parents with required morphological and physiological traits in segregating generation is
necessary breeding strategy to start an excellent breeding program.
Several wheat scientists have achieved their objectives have successfully through combining
ability analysis. The present study is based on the estimation of gene action and inheritance
of traits directly to yield and its contributing traits in bread wheat by the use of line × tester
analysis of combing ability that was developed by Kempthorne (1957) Singh and Choudhry
(1979). Line × tester analysis is used to evaluate vast number of parents for GCA and SCA.
This practice was applied to 50 crosses comprising 10 line and 5 testers. Data collected for
various plant characters was subjected to analysis of variance and line × tester analysis.
4.1. Experiment # 1 (Screening of germplasm)
The results of the screening trial after application of high temperature to create heat stress in
a tunnel that show range of variation can be observed in analysis of variance table 4.1.1.
4.1.1. Analysis of variance (ANOVA)
ANOVA showed highly significant differences were observed for CMT, NDVIV, NDVIG,
CTV, CTG, RWC, FLA, SPS, GPS, 1000 grain weight and GYP (Table 4.1). Among lines,
testers and their crosses depicted highly significant differences for most of the traits desired.
Screening was done on the mean basis by using primary screening parameters as CMT,
NDVIV, CTV and RWC.
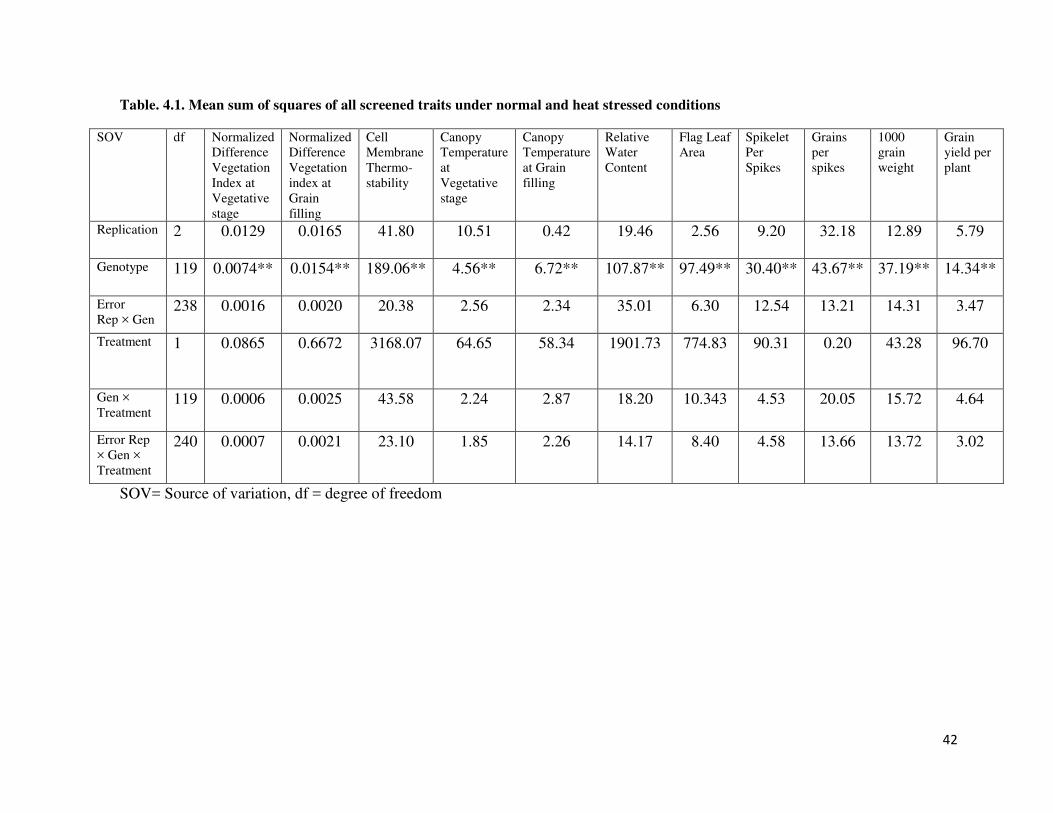
42
Table. 4.1. Mean sum of squares of all screened traits under normal and heat stressed conditions
SOV df Normalized Difference Vegetation Index at Vegetative stage
Normalized Difference Vegetation index at Grain filling
Cell Membrane Thermo- stability
Canopy Temperature at Vegetative stage
Canopy Temperature at Grain filling
Relative Water Content
Flag Leaf Area
Spikelet Per Spikes
Grains per spikes
1000 grain weight
Grain yield per plant
Replication 2 0.0129
0.0165 41.80
10.51 0.42 19.46 2.56 9.20 32.18 12.89 5.79
Genotype 119 0.0074**
0.0154** 189.06**
4.56** 6.72** 107.87** 97.49** 30.40** 43.67** 37.19** 14.34**
Error Rep × Gen
238 0.0016
0.0020 20.38
2.56 2.34 35.01 6.30 12.54 13.21 14.31 3.47
Treatment 1 0.0865
0.6672 3168.07
64.65 58.34 1901.73 774.83 90.31 0.20 43.28 96.70
Gen × Treatment
119 0.0006
0.0025 43.58 2.24 2.87 18.20 10.343 4.53 20.05 15.72 4.64
Error Rep × Gen × Treatment
240 0.0007 0.0021 23.10 1.85 2.26 14.17 8.40 4.58 13.66 13.72 3.02
SOV= Source of variation, df = degree of freedom

43
4.1.2. Mean comparisons
4.1.2.1. Normal conditions
Mean data obtained for normal and heat stressed conditions is displayed in Table 4.2 and
4.1.3. Genotype 120 show outstanding results for cell membrane thermostability and grain
yield per plant. Under normal conditions cell membrane thermostability showed higher value
by genotype HT120 (69.32) while minimum value was observed by HT101 (42.84). For
NDVIV showed maximum value by genotype 83 (0.83) and 101 minimum (0.61). Genotype
101 showed minimum values for cell membrane thermostability and NDVIV. For NDVIG
genotype 20 showed maximum (0.73) and genotype 5 showed minimum (0.48) reading.
Canopy temperature is an important parameter for determination of heat stress tolerance in
wheat. Canopy temperature at vegetative stage exhibited minimum observation for HT102
(27.88) and minimum for HT5 (22.10). Wheat canopy temperature increases at the time of
grain filling due to more heat stress and dryness of environment. Maximum values for
canopy temperature at grain filling stage was observed in genotype 13 (29.50), while
minimum by HT110 (22.71). Relative water content showed highest value in genotype 117
(74.79) followed by genotype 59 (74.16) and lowest in genotype 75 (51.83). Maximum
reading for flag leaf area observed by HT19 (45.21) and minimum values was exhibited by
genotype number 75 (24.58). Genotype 5 showed minimum values for Canopy temperature
at vegetative stage and spikelets per spike. For spikelets per spike maximum value was
showed by HT79 (23.00) while minimum was see by HT5 (13.00). Genotype number 36
showed highest reading (63.67) for grain per spikes whereas genotype number 49 showed
lowest reading. For 1000 gain weight, extreme value was observed by genotype 101 (49.97)
while minimum value was seen in genotype 75 (34.00). Grain yield per plant depicted
highest peak value (27.21) in genotype 120 and HT65 represent lowest peak value (17.67)
followed by HT68 (18.59).
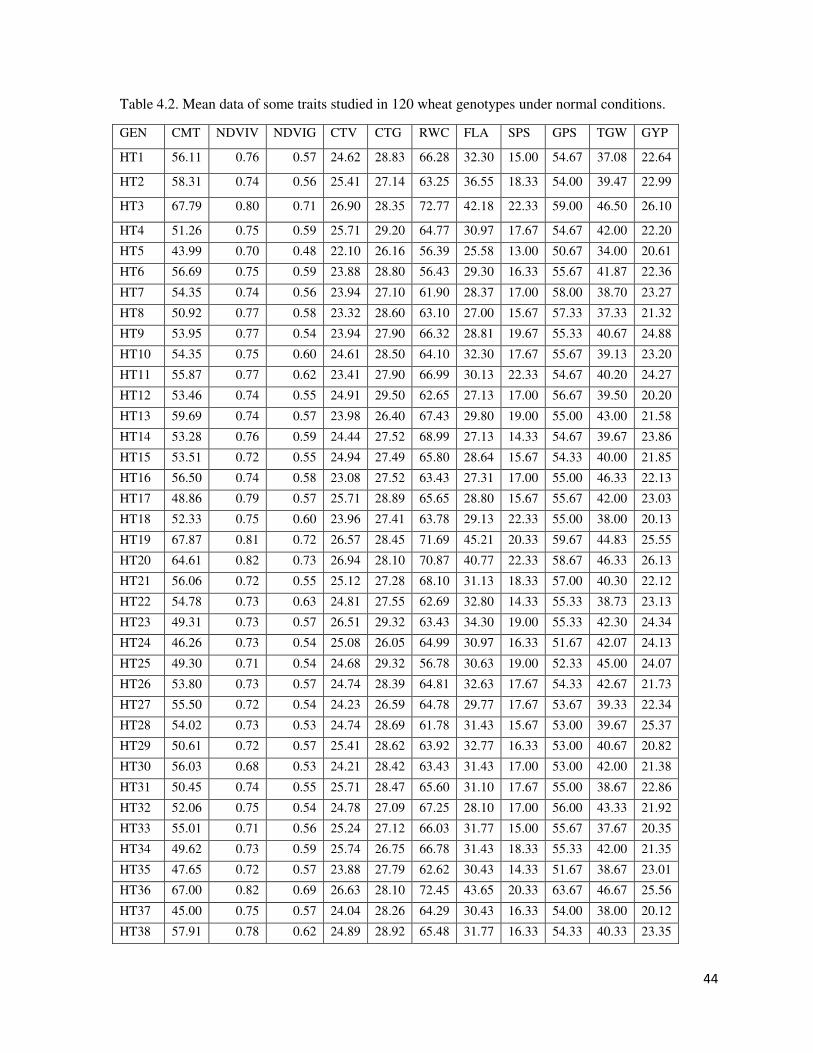
44
Table 4.2. Mean data of some traits studied in 120 wheat genotypes under normal conditions.
GEN CMT NDVIV NDVIG CTV CTG RWC FLA SPS GPS TGW GYP
HT1 56.11 0.76 0.57 24.62 28.83 66.28 32.30 15.00 54.67 37.08 22.64
HT2 58.31 0.74 0.56 25.41 27.14 63.25 36.55 18.33 54.00 39.47 22.99
HT3 67.79 0.80 0.71 26.90 28.35 72.77 42.18 22.33 59.00 46.50 26.10
HT4 51.26 0.75 0.59 25.71 29.20 64.77 30.97 17.67 54.67 42.00 22.20
HT5 43.99 0.70 0.48 22.10 26.16 56.39 25.58 13.00 50.67 34.00 20.61
HT6 56.69 0.75 0.59 23.88 28.80 56.43 29.30 16.33 55.67 41.87 22.36
HT7 54.35 0.74 0.56 23.94 27.10 61.90 28.37 17.00 58.00 38.70 23.27
HT8 50.92 0.77 0.58 23.32 28.60 63.10 27.00 15.67 57.33 37.33 21.32
HT9 53.95 0.77 0.54 23.94 27.90 66.32 28.81 19.67 55.33 40.67 24.88
HT10 54.35 0.75 0.60 24.61 28.50 64.10 32.30 17.67 55.67 39.13 23.20
HT11 55.87 0.77 0.62 23.41 27.90 66.99 30.13 22.33 54.67 40.20 24.27
HT12 53.46 0.74 0.55 24.91 29.50 62.65 27.13 17.00 56.67 39.50 20.20
HT13 59.69 0.74 0.57 23.98 26.40 67.43 29.80 19.00 55.00 43.00 21.58
HT14 53.28 0.76 0.59 24.44 27.52 68.99 27.13 14.33 54.67 39.67 23.86
HT15 53.51 0.72 0.55 24.94 27.49 65.80 28.64 15.67 54.33 40.00 21.85
HT16 56.50 0.74 0.58 23.08 27.52 63.43 27.31 17.00 55.00 46.33 22.13
HT17 48.86 0.79 0.57 25.71 28.89 65.65 28.80 15.67 55.67 42.00 23.03
HT18 52.33 0.75 0.60 23.96 27.41 63.78 29.13 22.33 55.00 38.00 20.13
HT19 67.87 0.81 0.72 26.57 28.45 71.69 45.21 20.33 59.67 44.83 25.55
HT20 64.61 0.82 0.73 26.94 28.10 70.87 40.77 22.33 58.67 46.33 26.13
HT21 56.06 0.72 0.55 25.12 27.28 68.10 31.13 18.33 57.00 40.30 22.12
HT22 54.78 0.73 0.63 24.81 27.55 62.69 32.80 14.33 55.33 38.73 23.13
HT23 49.31 0.73 0.57 26.51 29.32 63.43 34.30 19.00 55.33 42.30 24.34
HT24 46.26 0.73 0.54 25.08 26.05 64.99 30.97 16.33 51.67 42.07 24.13
HT25 49.30 0.71 0.54 24.68 29.32 56.78 30.63 19.00 52.33 45.00 24.07
HT26 53.80 0.73 0.57 24.74 28.39 64.81 32.63 17.67 54.33 42.67 21.73
HT27 55.50 0.72 0.54 24.23 26.59 64.78 29.77 17.67 53.67 39.33 22.34
HT28 54.02 0.73 0.53 24.74 28.69 61.78 31.43 15.67 53.00 39.67 25.37
HT29 50.61 0.72 0.57 25.41 28.62 63.92 32.77 16.33 53.00 40.67 20.82
HT30 56.03 0.68 0.53 24.21 28.42 63.43 31.43 17.00 53.00 42.00 21.38
HT31 50.45 0.74 0.55 25.71 28.47 65.60 31.10 17.67 55.00 38.67 22.86
HT32 52.06 0.75 0.54 24.78 27.09 67.25 28.10 17.00 56.00 43.33 21.92
HT33 55.01 0.71 0.56 25.24 27.12 66.03 31.77 15.00 55.67 37.67 20.35
HT34 49.62 0.73 0.59 25.74 26.75 66.78 31.43 18.33 55.33 42.00 21.35
HT35 47.65 0.72 0.57 23.88 27.79 62.62 30.43 14.33 51.67 38.67 23.01
HT36 67.00 0.82 0.69 26.63 28.10 72.45 43.65 20.33 63.67 46.67 25.56
HT37 45.00 0.75 0.57 24.04 28.26 64.29 30.43 16.33 54.00 38.00 20.12
HT38 57.91 0.78 0.62 24.89 28.92 65.48 31.77 16.33 54.33 40.33 23.35
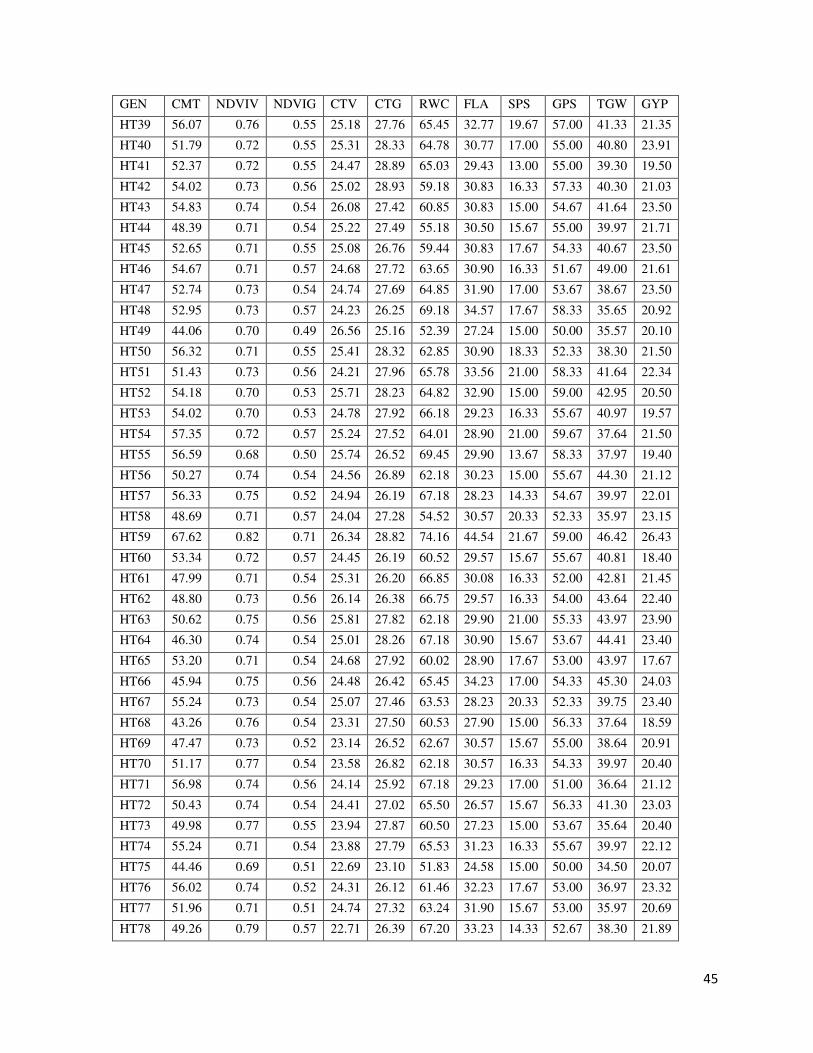
45
GEN CMT NDVIV NDVIG CTV CTG RWC FLA SPS GPS TGW GYP
HT39 56.07 0.76 0.55 25.18 27.76 65.45 32.77 19.67 57.00 41.33 21.35
HT40 51.79 0.72 0.55 25.31 28.33 64.78 30.77 17.00 55.00 40.80 23.91
HT41 52.37 0.72 0.55 24.47 28.89 65.03 29.43 13.00 55.00 39.30 19.50
HT42 54.02 0.73 0.56 25.02 28.93 59.18 30.83 16.33 57.33 40.30 21.03
HT43 54.83 0.74 0.54 26.08 27.42 60.85 30.83 15.00 54.67 41.64 23.50
HT44 48.39 0.71 0.54 25.22 27.49 55.18 30.50 15.67 55.00 39.97 21.71
HT45 52.65 0.71 0.55 25.08 26.76 59.44 30.83 17.67 54.33 40.67 23.50
HT46 54.67 0.71 0.57 24.68 27.72 63.65 30.90 16.33 51.67 49.00 21.61
HT47 52.74 0.73 0.54 24.74 27.69 64.85 31.90 17.00 53.67 38.67 23.50
HT48 52.95 0.73 0.57 24.23 26.25 69.18 34.57 17.67 58.33 35.65 20.92
HT49 44.06 0.70 0.49 26.56 25.16 52.39 27.24 15.00 50.00 35.57 20.10
HT50 56.32 0.71 0.55 25.41 28.32 62.85 30.90 18.33 52.33 38.30 21.50
HT51 51.43 0.73 0.56 24.21 27.96 65.78 33.56 21.00 58.33 41.64 22.34
HT52 54.18 0.70 0.53 25.71 28.23 64.82 32.90 15.00 59.00 42.95 20.50
HT53 54.02 0.70 0.53 24.78 27.92 66.18 29.23 16.33 55.67 40.97 19.57
HT54 57.35 0.72 0.57 25.24 27.52 64.01 28.90 21.00 59.67 37.64 21.50
HT55 56.59 0.68 0.50 25.74 26.52 69.45 29.90 13.67 58.33 37.97 19.40
HT56 50.27 0.74 0.54 24.56 26.89 62.18 30.23 15.00 55.67 44.30 21.12
HT57 56.33 0.75 0.52 24.94 26.19 67.18 28.23 14.33 54.67 39.97 22.01
HT58 48.69 0.71 0.57 24.04 27.28 54.52 30.57 20.33 52.33 35.97 23.15
HT59 67.62 0.82 0.71 26.34 28.82 74.16 44.54 21.67 59.00 46.42 26.43
HT60 53.34 0.72 0.57 24.45 26.19 60.52 29.57 15.67 55.67 40.81 18.40
HT61 47.99 0.71 0.54 25.31 26.20 66.85 30.08 16.33 52.00 42.81 21.45
HT62 48.80 0.73 0.56 26.14 26.38 66.75 29.57 16.33 54.00 43.64 22.40
HT63 50.62 0.75 0.56 25.81 27.82 62.18 29.90 21.00 55.33 43.97 23.90
HT64 46.30 0.74 0.54 25.01 28.26 67.18 30.90 15.67 53.67 44.41 23.40
HT65 53.20 0.71 0.54 24.68 27.92 60.02 28.90 17.67 53.00 43.97 17.67
HT66 45.94 0.75 0.56 24.48 26.42 65.45 34.23 17.00 54.33 45.30 24.03
HT67 55.24 0.73 0.54 25.07 27.46 63.53 28.23 20.33 52.33 39.75 23.40
HT68 43.26 0.76 0.54 23.31 27.50 60.53 27.90 15.00 56.33 37.64 18.59
HT69 47.47 0.73 0.52 23.14 26.52 62.67 30.57 15.67 55.00 38.64 20.91
HT70 51.17 0.77 0.54 23.58 26.82 62.18 30.57 16.33 54.33 39.97 20.40
HT71 56.98 0.74 0.56 24.14 25.92 67.18 29.23 17.00 51.00 36.64 21.12
HT72 50.43 0.74 0.54 24.41 27.02 65.50 26.57 15.67 56.33 41.30 23.03
HT73 49.98 0.77 0.55 23.94 27.87 60.50 27.23 15.00 53.67 35.64 20.40
HT74 55.24 0.71 0.54 23.88 27.79 65.53 31.23 16.33 55.67 39.97 22.12
HT75 44.46 0.69 0.51 22.69 23.10 51.83 24.58 15.00 50.00 34.50 20.07
HT76 56.02 0.74 0.52 24.31 26.12 61.46 32.23 17.67 53.00 36.97 23.32
HT77 51.96 0.71 0.51 24.74 27.32 63.24 31.90 15.67 53.00 35.97 20.69
HT78 49.26 0.79 0.57 22.71 26.39 67.20 33.23 14.33 52.67 38.30 21.89
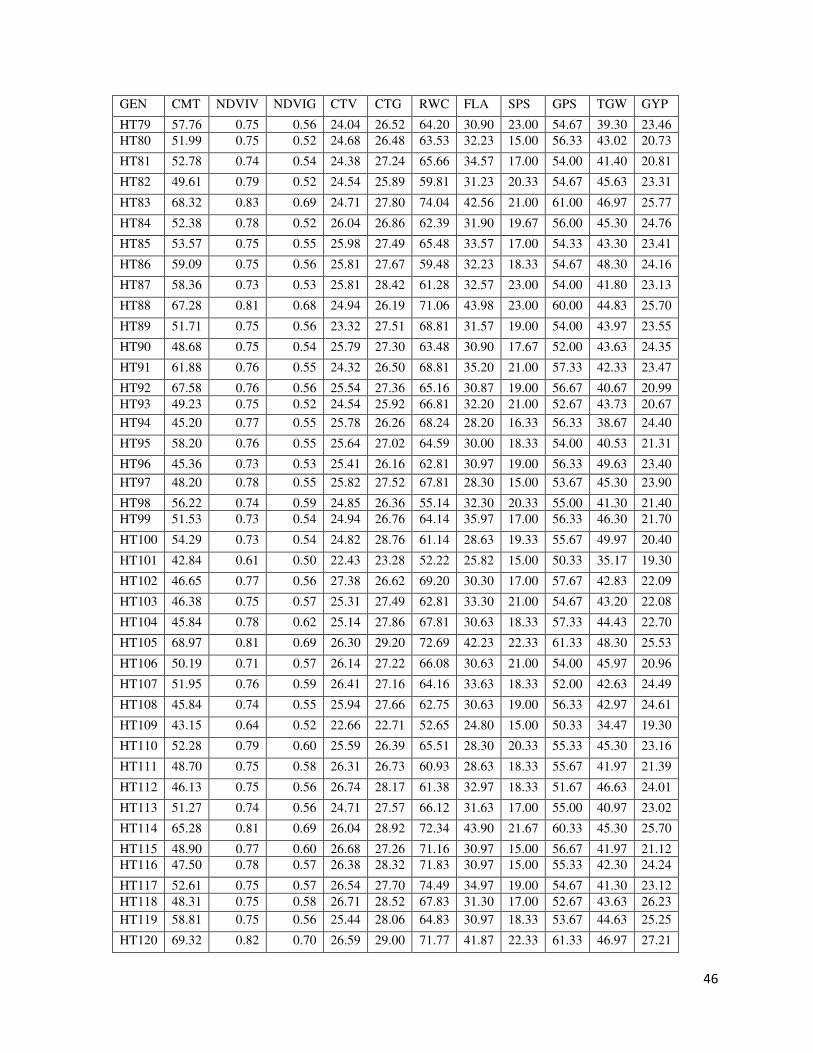
46
GEN CMT NDVIV NDVIG CTV CTG RWC FLA SPS GPS TGW GYP
HT79 57.76 0.75 0.56 24.04 26.52 64.20 30.90 23.00 54.67 39.30 23.46 HT80 51.99 0.75 0.52 24.68 26.48 63.53 32.23 15.00 56.33 43.02 20.73
HT81 52.78 0.74 0.54 24.38 27.24 65.66 34.57 17.00 54.00 41.40 20.81
HT82 49.61 0.79 0.52 24.54 25.89 59.81 31.23 20.33 54.67 45.63 23.31
HT83 68.32 0.83 0.69 24.71 27.80 74.04 42.56 21.00 61.00 46.97 25.77
HT84 52.38 0.78 0.52 26.04 26.86 62.39 31.90 19.67 56.00 45.30 24.76
HT85 53.57 0.75 0.55 25.98 27.49 65.48 33.57 17.00 54.33 43.30 23.41
HT86 59.09 0.75 0.56 25.81 27.67 59.48 32.23 18.33 54.67 48.30 24.16
HT87 58.36 0.73 0.53 25.81 28.42 61.28 32.57 23.00 54.00 41.80 23.13
HT88 67.28 0.81 0.68 24.94 26.19 71.06 43.98 23.00 60.00 44.83 25.70
HT89 51.71 0.75 0.56 23.32 27.51 68.81 31.57 19.00 54.00 43.97 23.55
HT90 48.68 0.75 0.54 25.79 27.30 63.48 30.90 17.67 52.00 43.63 24.35
HT91 61.88 0.76 0.55 24.32 26.50 68.81 35.20 21.00 57.33 42.33 23.47
HT92 67.58 0.76 0.56 25.54 27.36 65.16 30.87 19.00 56.67 40.67 20.99 HT93 49.23 0.75 0.52 24.54 25.92 66.81 32.20 21.00 52.67 43.73 20.67
HT94 45.20 0.77 0.55 25.78 26.26 68.24 28.20 16.33 56.33 38.67 24.40
HT95 58.20 0.76 0.55 25.64 27.02 64.59 30.00 18.33 54.00 40.53 21.31
HT96 45.36 0.73 0.53 25.41 26.16 62.81 30.97 19.00 56.33 49.63 23.40
HT97 48.20 0.78 0.55 25.82 27.52 67.81 28.30 15.00 53.67 45.30 23.90
HT98 56.22 0.74 0.59 24.85 26.36 55.14 32.30 20.33 55.00 41.30 21.40 HT99 51.53 0.73 0.54 24.94 26.76 64.14 35.97 17.00 56.33 46.30 21.70
HT100 54.29 0.73 0.54 24.82 28.76 61.14 28.63 19.33 55.67 49.97 20.40
HT101 42.84 0.61 0.50 22.43 23.28 52.22 25.82 15.00 50.33 35.17 19.30
HT102 46.65 0.77 0.56 27.38 26.62 69.20 30.30 17.00 57.67 42.83 22.09
HT103 46.38 0.75 0.57 25.31 27.49 62.81 33.30 21.00 54.67 43.20 22.08
HT104 45.84 0.78 0.62 25.14 27.86 67.81 30.63 18.33 57.33 44.43 22.70
HT105 68.97 0.81 0.69 26.30 29.20 72.69 42.23 22.33 61.33 48.30 25.53
HT106 50.19 0.71 0.57 26.14 27.22 66.08 30.63 21.00 54.00 45.97 20.96
HT107 51.95 0.76 0.59 26.41 27.16 64.16 33.63 18.33 52.00 42.63 24.49
HT108 45.84 0.74 0.55 25.94 27.66 62.75 30.63 19.00 56.33 42.97 24.61
HT109 43.15 0.64 0.52 22.66 22.71 52.65 24.80 15.00 50.33 34.47 19.30
HT110 52.28 0.79 0.60 25.59 26.39 65.51 28.30 20.33 55.33 45.30 23.16
HT111 48.70 0.75 0.58 26.31 26.73 60.93 28.63 18.33 55.67 41.97 21.39
HT112 46.13 0.75 0.56 26.74 28.17 61.38 32.97 18.33 51.67 46.63 24.01
HT113 51.27 0.74 0.56 24.71 27.57 66.12 31.63 17.00 55.00 40.97 23.02
HT114 65.28 0.81 0.69 26.04 28.92 72.34 43.90 21.67 60.33 45.30 25.70
HT115 48.90 0.77 0.60 26.68 27.26 71.16 30.97 15.00 56.67 41.97 21.12 HT116 47.50 0.78 0.57 26.38 28.32 71.83 30.97 15.00 55.33 42.30 24.24
HT117 52.61 0.75 0.57 26.54 27.70 74.49 34.97 19.00 54.67 41.30 23.12 HT118 48.31 0.75 0.58 26.71 28.52 67.83 31.30 17.00 52.67 43.63 26.23 HT119 58.81 0.75 0.56 25.44 28.06 64.83 30.97 18.33 53.67 44.63 25.25
HT120 69.32 0.82 0.70 26.59 29.00 71.77 41.87 22.33 61.33 46.97 27.21
47
4.1.2.2. Heat stressed conditions
Under heat stressed conditions, mean data showed range of variation among genotypes sown.
Genotype 36 showed highest observation (68.28) whereas genotype 109 showed lowest
(36.45) for cell membrane thermostability. Normalized difference vegetation index at
vegetative stage results showed that genotype 83 perform better in both normal and heat
stressed conditions. For normalized difference vegetation index at vegetative stage, HT83
depicted highest peak value (0.82) and HT101 represent lowest peak value (0.62). Maximum
value for normalized difference vegetation index at grain filling stage was observed by
genotype 19 (0.72) while minimum in genotype 58 (0.41). Under heat stressed conditions
genotype 98 showed highest values for canopy temperature at vegetative stage and canopy
temperature at grain filling stage. Canopy temperature at vegetative stage depicted highest
reading by HT98 (27.58) and minimum values by HT101 (22.39). Highest value for canopy
temperature at grain filling stage was observed in HT98 (30.63) and lowest in HT101
(23.00). HT105 depicted highest readings for relative water content and grain yield per plant.
Genotype 105 showed maximum value (72.80) whereas minimum by genotype 57 (50.36) for
relative water content. For flag leaf area HT3 showed highest peak value (43.63) and lowest
peak vale was observed in HT68 (22.90). Spikelet per spikes for genotype 83 represent
maximum (23.00) and minimum value by genotype 6 (13.00). Grains per spike depicted
highest observation in HT94 (66.33) while in HT1 (45.33) lowest value for this trait. Highest
value was represented by HT88 (47.83) whereas lowest value seen in HT101 (33.83) for
1000 grain weight. For grain yield per plant genotype 105 showed maximum value (27.00)
and genotype 80 showed minimum value (18.75) as shown in Table 4.3.
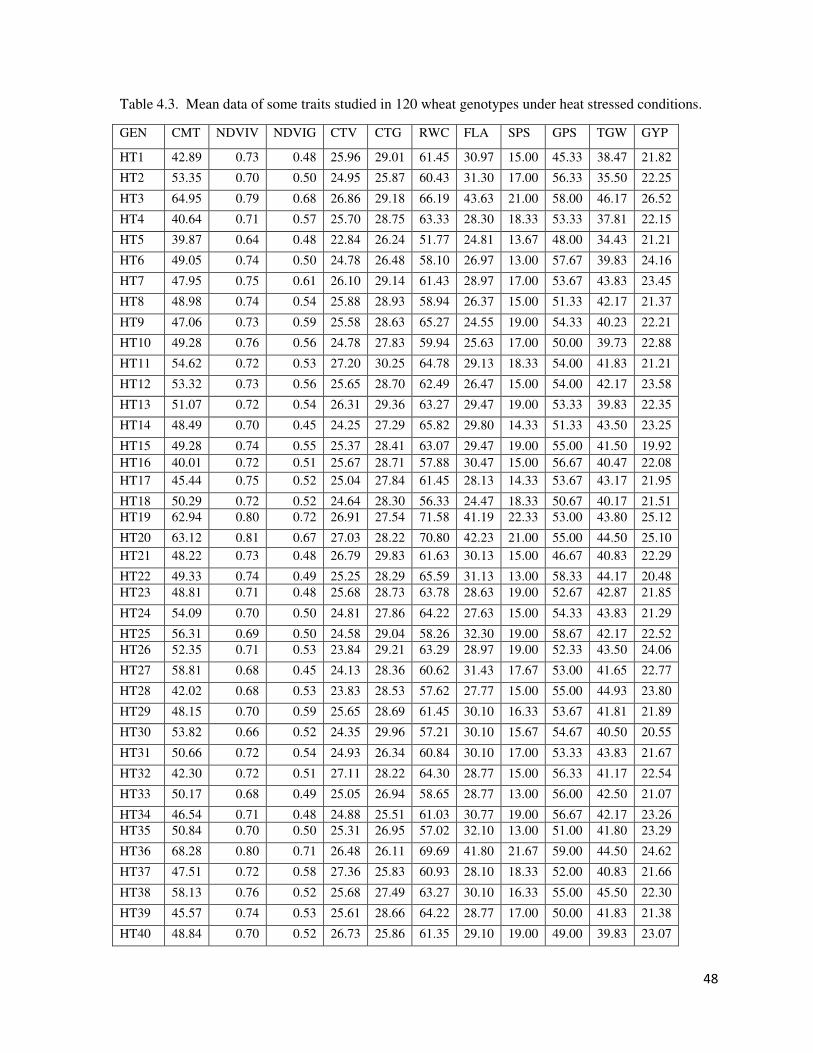
48
Table 4.3. Mean data of some traits studied in 120 wheat genotypes under heat stressed conditions.
GEN CMT NDVIV NDVIG CTV CTG RWC FLA SPS GPS TGW GYP
HT1 42.89 0.73 0.48 25.96 29.01 61.45 30.97 15.00 45.33 38.47 21.82
HT2 53.35 0.70 0.50 24.95 25.87 60.43 31.30 17.00 56.33 35.50 22.25
HT3 64.95 0.79 0.68 26.86 29.18 66.19 43.63 21.00 58.00 46.17 26.52
HT4 40.64 0.71 0.57 25.70 28.75 63.33 28.30 18.33 53.33 37.81 22.15
HT5 39.87 0.64 0.48 22.84 26.24 51.77 24.81 13.67 48.00 34.43 21.21
HT6 49.05 0.74 0.50 24.78 26.48 58.10 26.97 13.00 57.67 39.83 24.16
HT7 47.95 0.75 0.61 26.10 29.14 61.43 28.97 17.00 53.67 43.83 23.45
HT8 48.98 0.74 0.54 25.88 28.93 58.94 26.37 15.00 51.33 42.17 21.37
HT9 47.06 0.73 0.59 25.58 28.63 65.27 24.55 19.00 54.33 40.23 22.21
HT10 49.28 0.76 0.56 24.78 27.83 59.94 25.63 17.00 50.00 39.73 22.88
HT11 54.62 0.72 0.53 27.20 30.25 64.78 29.13 18.33 54.00 41.83 21.21
HT12 53.32 0.73 0.56 25.65 28.70 62.49 26.47 15.00 54.00 42.17 23.58
HT13 51.07 0.72 0.54 26.31 29.36 63.27 29.47 19.00 53.33 39.83 22.35
HT14 48.49 0.70 0.45 24.25 27.29 65.82 29.80 14.33 51.33 43.50 23.25
HT15 49.28 0.74 0.55 25.37 28.41 63.07 29.47 19.00 55.00 41.50 19.92 HT16 40.01 0.72 0.51 25.67 28.71 57.88 30.47 15.00 56.67 40.47 22.08 HT17 45.44 0.75 0.52 25.04 27.84 61.45 28.13 14.33 53.67 43.17 21.95
HT18 50.29 0.72 0.52 24.64 28.30 56.33 24.47 18.33 50.67 40.17 21.51 HT19 62.94 0.80 0.72 26.91 27.54 71.58 41.19 22.33 53.00 43.80 25.12
HT20 63.12 0.81 0.67 27.03 28.22 70.80 42.23 21.00 55.00 44.50 25.10 HT21 48.22 0.73 0.48 26.79 29.83 61.63 30.13 15.00 46.67 40.83 22.29
HT22 49.33 0.74 0.49 25.25 28.29 65.59 31.13 13.00 58.33 44.17 20.48 HT23 48.81 0.71 0.48 25.68 28.73 63.78 28.63 19.00 52.67 42.87 21.85
HT24 54.09 0.70 0.50 24.81 27.86 64.22 27.63 15.00 54.33 43.83 21.29
HT25 56.31 0.69 0.50 24.58 29.04 58.26 32.30 19.00 58.67 42.17 22.52 HT26 52.35 0.71 0.53 23.84 29.21 63.29 28.97 19.00 52.33 43.50 24.06
HT27 58.81 0.68 0.45 24.13 28.36 60.62 31.43 17.67 53.00 41.65 22.77
HT28 42.02 0.68 0.53 23.83 28.53 57.62 27.77 15.00 55.00 44.93 23.80
HT29 48.15 0.70 0.59 25.65 28.69 61.45 30.10 16.33 53.67 41.81 21.89
HT30 53.82 0.66 0.52 24.35 29.96 57.21 30.10 15.67 54.67 40.50 20.55
HT31 50.66 0.72 0.54 24.93 26.34 60.84 30.10 17.00 53.33 43.83 21.67
HT32 42.30 0.72 0.51 27.11 28.22 64.30 28.77 15.00 56.33 41.17 22.54
HT33 50.17 0.68 0.49 25.05 26.94 58.65 28.77 13.00 56.00 42.50 21.07
HT34 46.54 0.71 0.48 24.88 25.51 61.03 30.77 19.00 56.67 42.17 23.26 HT35 50.84 0.70 0.50 25.31 26.95 57.02 32.10 13.00 51.00 41.80 23.29
HT36 68.28 0.80 0.71 26.48 26.11 69.69 41.80 21.67 59.00 44.50 24.62
HT37 47.51 0.72 0.58 27.36 25.83 60.93 28.10 18.33 52.00 40.83 21.66
HT38 58.13 0.76 0.52 25.68 27.49 63.27 30.10 16.33 55.00 45.50 22.30
HT39 45.57 0.74 0.53 25.61 28.66 64.22 28.77 17.00 50.00 41.83 21.38
HT40 48.84 0.70 0.52 26.73 25.86 61.35 29.10 19.00 49.00 39.83 23.07

49
GEN CMT NDVIV NDVIG CTV CTG RWC FLA SPS GPS TGW GYP
HT41 42.32 0.70 0.51 26.05 27.08 56.77 26.77 13.00 49.33 43.98 20.95
HT42 56.24 0.68 0.48 26.48 28.18 59.15 27.83 16.33 60.33 41.65 21.05
HT43 53.20 0.68 0.49 25.43 27.20 60.34 25.50 15.00 64.67 42.98 22.31
HT44 46.47 0.69 0.49 25.78 27.14 62.00 31.17 18.33 57.33 38.98 22.91
HT45 51.78 0.68 0.46 26.41 28.28 64.07 29.17 17.00 57.00 41.27 20.36
HT46 54.83 0.69 0.55 26.11 27.55 61.31 26.23 15.67 56.00 38.98 20.61
HT47 42.94 0.68 0.59 26.28 27.48 61.38 28.90 16.33 54.33 42.98 21.61
HT48 42.57 0.71 0.55 26.81 28.37 57.27 27.90 14.33 59.67 41.32 22.11
HT49 40.72 0.68 0.47 23.13 25.24 51.32 24.86 13.00 49.00 35.52 19.82
HT50 42.83 0.69 0.49 26.75 27.68 58.87 29.57 18.33 52.00 42.32 21.78
HT51 41.64 0.71 0.49 26.70 29.75 64.02 28.28 21.00 58.00 41.93 22.32
HT52 50.72 0.68 0.44 26.21 29.26 62.80 27.21 15.00 56.33 41.32 21.97
HT53 44.73 0.68 0.42 27.11 30.16 62.02 26.23 14.33 57.33 41.72 22.32
HT54 51.69 0.70 0.42 25.05 28.09 62.91 28.23 19.00 55.33 42.65 20.01
HT55 51.87 0.66 0.45 25.93 27.60 61.39 29.90 13.00 59.00 40.65 21.49
HT56 51.95 0.77 0.51 25.31 28.36 63.25 30.23 19.00 57.33 44.28 22.59 HT57 48.44 0.72 0.46 25.88 28.93 60.25 25.57 15.00 58.00 43.27 20.07 HT58 47.71 0.68 0.41 26.15 27.62 50.36 31.90 19.00 54.67 42.50 22.23
HT59 60.95 0.82 0.65 26.50 28.73 71.99 42.58 21.00 60.00 43.57 26.17
HT60 59.24 0.70 0.44 25.61 28.66 58.91 30.90 13.67 58.33 42.32 21.46
HT61 47.25 0.72 0.49 25.92 28.97 61.43 26.90 17.00 50.67 39.93 20.11
HT62 47.81 0.71 0.44 26.05 26.38 67.81 28.23 16.33 59.00 43.32 20.74 HT63 48.46 0.72 0.49 26.48 26.79 58.02 26.23 17.67 55.00 41.60 21.00
HT64 50.19 0.71 0.46 24.45 26.51 56.95 26.32 15.67 51.00 42.98 20.10
HT65 50.28 0.69 0.46 25.78 27.11 51.37 24.90 17.00 51.67 39.93 21.56
HT66 44.04 0.73 0.51 25.01 26.22 61.29 31.23 18.33 54.67 43.32 20.77 HT67 44.24 0.71 0.52 26.31 26.96 59.37 25.57 15.67 54.33 43.32 21.60
HT68 49.08 0.74 0.49 24.25 27.29 56.37 22.90 15.67 56.67 42.65 20.75 HT69 43.47 0.71 0.45 25.59 28.64 59.98 29.23 15.67 52.67 40.96 21.14
HT70 43.43 0.74 0.48 24.51 27.56 58.02 26.43 17.67 59.00 39.65 22.72
HT71 53.98 0.78 0.50 26.91 28.48 62.17 27.47 20.33 59.33 40.93 20.99
HT72 48.88 0.72 0.45 26.26 27.26 64.82 29.48 15.00 58.67 39.30 20.72
HT73 50.49 0.74 0.48 24.88 27.93 63.07 24.23 15.00 57.67 40.65 20.47
HT74 55.04 0.69 0.44 24.81 27.86 61.37 23.57 17.00 56.33 41.32 22.53
HT75 40.72 0.67 0.48 22.78 23.43 50.61 24.90 15.67 51.67 35.62 19.40
HT76 50.98 0.72 0.46 23.77 25.85 63.03 27.90 19.00 51.67 43.65 20.05
HT77 41.28 0.69 0.45 23.41 27.80 64.17 28.57 15.67 55.00 39.98 19.47
HT78 48.69 0.77 0.47 24.56 27.61 59.85 23.57 15.67 58.00 44.65 21.19
HT79 46.23 0.73 0.43 26.66 27.95 60.04 25.57 21.00 55.67 43.98 21.31
HT80 46.75 0.73 0.50 26.17 27.27 55.55 29.23 15.67 56.67 38.98 18.57
HT81 50.31 0.72 0.48 26.40 29.44 61.50 24.57 15.00 55.33 44.27 20.42
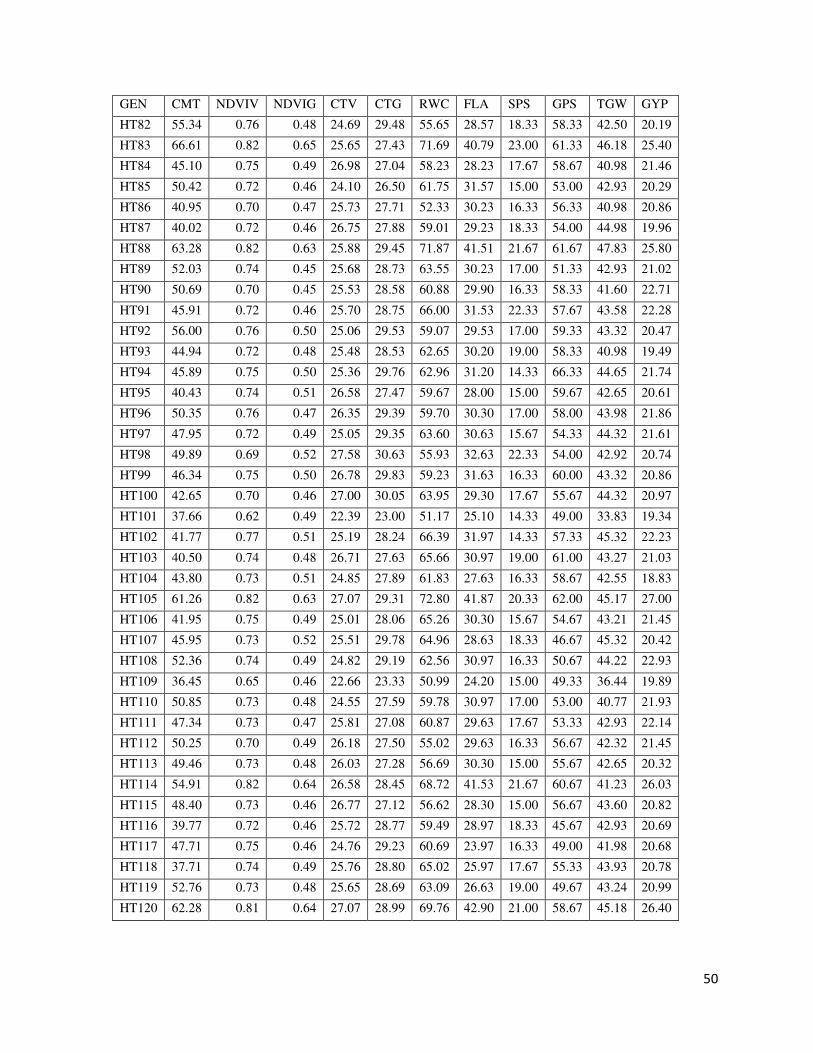
50
GEN CMT NDVIV NDVIG CTV CTG RWC FLA SPS GPS TGW GYP
HT82 55.34 0.76 0.48 24.69 29.48 55.65 28.57 18.33 58.33 42.50 20.19
HT83 66.61 0.82 0.65 25.65 27.43 71.69 40.79 23.00 61.33 46.18 25.40
HT84 45.10 0.75 0.49 26.98 27.04 58.23 28.23 17.67 58.67 40.98 21.46
HT85 50.42 0.72 0.46 24.10 26.50 61.75 31.57 15.00 53.00 42.93 20.29
HT86 40.95 0.70 0.47 25.73 27.71 52.33 30.23 16.33 56.33 40.98 20.86
HT87 40.02 0.72 0.46 26.75 27.88 59.01 29.23 18.33 54.00 44.98 19.96
HT88 63.28 0.82 0.63 25.88 29.45 71.87 41.51 21.67 61.67 47.83 25.80
HT89 52.03 0.74 0.45 25.68 28.73 63.55 30.23 17.00 51.33 42.93 21.02
HT90 50.69 0.70 0.45 25.53 28.58 60.88 29.90 16.33 58.33 41.60 22.71
HT91 45.91 0.72 0.46 25.70 28.75 66.00 31.53 22.33 57.67 43.58 22.28
HT92 56.00 0.76 0.50 25.06 29.53 59.07 29.53 17.00 59.33 43.32 20.47
HT93 44.94 0.72 0.48 25.48 28.53 62.65 30.20 19.00 58.33 40.98 19.49
HT94 45.89 0.75 0.50 25.36 29.76 62.96 31.20 14.33 66.33 44.65 21.74
HT95 40.43 0.74 0.51 26.58 27.47 59.67 28.00 15.00 59.67 42.65 20.61
HT96 50.35 0.76 0.47 26.35 29.39 59.70 30.30 17.00 58.00 43.98 21.86
HT97 47.95 0.72 0.49 25.05 29.35 63.60 30.63 15.67 54.33 44.32 21.61
HT98 49.89 0.69 0.52 27.58 30.63 55.93 32.63 22.33 54.00 42.92 20.74
HT99 46.34 0.75 0.50 26.78 29.83 59.23 31.63 16.33 60.00 43.32 20.86
HT100 42.65 0.70 0.46 27.00 30.05 63.95 29.30 17.67 55.67 44.32 20.97
HT101 37.66 0.62 0.49 22.39 23.00 51.17 25.10 14.33 49.00 33.83 19.34
HT102 41.77 0.77 0.51 25.19 28.24 66.39 31.97 14.33 57.33 45.32 22.23
HT103 40.50 0.74 0.48 26.71 27.63 65.66 30.97 19.00 61.00 43.27 21.03
HT104 43.80 0.73 0.51 24.85 27.89 61.83 27.63 16.33 58.67 42.55 18.83
HT105 61.26 0.82 0.63 27.07 29.31 72.80 41.87 20.33 62.00 45.17 27.00
HT106 41.95 0.75 0.49 25.01 28.06 65.26 30.30 15.67 54.67 43.21 21.45
HT107 45.95 0.73 0.52 25.51 29.78 64.96 28.63 18.33 46.67 45.32 20.42
HT108 52.36 0.74 0.49 24.82 29.19 62.56 30.97 16.33 50.67 44.22 22.93
HT109 36.45 0.65 0.46 22.66 23.33 50.99 24.20 15.00 49.33 36.44 19.89
HT110 50.85 0.73 0.48 24.55 27.59 59.78 30.97 17.00 53.00 40.77 21.93
HT111 47.34 0.73 0.47 25.81 27.08 60.87 29.63 17.67 53.33 42.93 22.14
HT112 50.25 0.70 0.49 26.18 27.50 55.02 29.63 16.33 56.67 42.32 21.45
HT113 49.46 0.73 0.48 26.03 27.28 56.69 30.30 15.00 55.67 42.65 20.32
HT114 54.91 0.82 0.64 26.58 28.45 68.72 41.53 21.67 60.67 41.23 26.03
HT115 48.40 0.73 0.46 26.77 27.12 56.62 28.30 15.00 56.67 43.60 20.82
HT116 39.77 0.72 0.46 25.72 28.77 59.49 28.97 18.33 45.67 42.93 20.69
HT117 47.71 0.75 0.46 24.76 29.23 60.69 23.97 16.33 49.00 41.98 20.68
HT118 37.71 0.74 0.49 25.76 28.80 65.02 25.97 17.67 55.33 43.93 20.78
HT119 52.76 0.73 0.48 25.65 28.69 63.09 26.63 19.00 49.67 43.24 20.99
HT120 62.28 0.81 0.64 27.07 28.99 69.76 42.90 21.00 58.67 45.18 26.40

51
4.1.2.3. Cell Membrane Thermostability
Cell Membrane Thermostability plays a vital role for plant stresses. Electrolytes leakage
from cell membranes as results of stresses (e.g. Drought and Heat stress). Heat stress cause
the activation of stress mechanisms in plants. Resistance in plants at protoplast level results
cellular membrane integrity. These electrolyte levels are also affected by degree of hardening
(Stress) in plant species. Cell membranes firstly directed as a result of stress and
sustainability of that integrity under heat stress is major key factor for heat stress in wheat.
Degree of injury to cell membrane was estimated by electrolytes leakage from cell. Cell
Membrane Thermostability (CMT) is therefore, quick and efficient screening technique
against assessment of thermo tolerance. Analysis of variance for CMT was presented in
Table 4.1.1 and Table 4.1.2 which showed significant differences among all genotypes used
for screening experiment under both normal and heat stressed conditions. Genotype HT-120
show maximum value for CMT (69.32) under normal and genotype HT-101 showed
minimum value for trait (42.84) as shown in Fig.4.1.1. In heat stressed conditions genotype
HT-36 show maximum mean value (68.28) whereas genotype HT-109 show minimum value
that is (36.45) shown in Table 4.1.3. Range for CMT tend to decrease little bit in heat
stressed conditions. High temperature stress cause kinetic energy of molecules and their
movements across membranes studied by Savchenko et al. (2002). Higher values of CMT
explained their tolerance against the heat stress as discussed by Bala and Sikder (2017).
These results accordance with the Khan et al., (2013) and Kaur et al., (2008) as they studies
that membrane stability Values decreased with the increase of temperature. Cell membrane
stability by use of electrical conductivity method against screening of tolerant genotypes
against heat stress in wheat reported by Blum and Ebercon, (1981) while CMT is used in
different genotypes for tolerance evaluation to heat stress in various crop plants (Blum,
1988).

52
Fig.4.1.1: Mean performance of lines and testers for cell membrane thermostability under both normal (NOR) and heat stress (HS) conditions
4.1.2.4. Normalized Difference Vegetation Index at Vegetative Stage
NDVI determine the greenness vegetation of that area. This trait related to the green leaf
biomass of plant, chlorophyll content and for the grain yield prediction (Sultana et al., 2014).
Mean performance values were shown in Table 4.1.3 for normal while for heat stress shown
in Table 4.1.4. ANOVA Table 4.1.1 and 4.1.2 major contributing differences among mostly
all genotypes under normal and heat stressed conditions. Depicted mean performance under
normal environment was maximum in genotype HT-83 with value 0.83 whereas minimum in
genotype HT-5 with value of 0.61 (Fig.4.1.2). Under heat stressed conditions genotype HT-5
showed higher vale (0.82) but minimum value was observed by genotype HT-101 with mean
vale of 0.62. Under stressed conditions data showed to decrease in NDVI value at vegetative
stage of plants. Greater NDVI shown at different vegetative growth stages as booting and
heading is the outcome for good health of these plants before entering into the reproductive
stage. Lopes and Reynolds (2012) studied NDVI as efficient screening traits against stresses
that measure capability of plants to stay green which confirm these findings that higher value
of NDVI could be used as detection of heat tolerant wheat genotypes.

53
Fig.4.1.2: Mean performance of lines and testers for normalized difference vegetation index at vegetative stage under both normal (NOR) and heat stress (HS) conditions
4.1.2.5. Canopy Temperature (Vegetative Stage)
Heat stress stimulation cause maximum effects on canopy temperature Epure et al., (2017).
Crop plant with cooler canopies can tolerate stress in an efficient mode than others with
warmer crop canopies (Mohammadi et al., 2012). Under normal and heat stressed conditions
significant differences observed among the all genotypes for CTV. The highest value for
normal climatic conditions was recorded in genotype HT-20 (26.94) while minimum value
was observed in genotype HT-5 (22.10). Under high temperature stress, mean performance
was highest in genotype HT-120 (27.07) but lowest in genotype HT-101 (22.39) as described
in Fig.4.1.3. Ju et al. (2005) also found similar pattern of increased canopy temperature under
stress conditions at vegetative stage as our results showed under heat stressed conditions.

54
Fig.4.1.3: Mean performance of lines and testers for canopy temperature at vegetative stage under both normal (NOR) and heat stress (HS) conditions
4.1.2.6. Relative Water Content
Relative water content provide precise information about the amount of leaf water shortfall
that specify the degree of stress stated under both the drought and heat stress. RWC add the
leaf water potential to the effects of osmotic adjustment as the measurement of plant water
status in stress. In response to the heat and drought stress decrease in RWC for different
plants was reported by Almeselmani et al., (2012); Saxena et al., (2014) and Ramani et al.,
(2017). There were significant differences among genotypes. From mean performance shown
in Table 4.1.1 for normal conditions maximum value observed by genotype HT-59 (74.16)
while minimum scored by genotype HT-5 (51.83) as shown in Fig.4.1.4. High temperature
maximum value for genotype HT-105 (72.80) while minimum in HT-75 (50.61). Ram et al.,
(2017) concluded that with the increase of temperature there were decrease in relative water
content that show as similar kind of findings as has been reported in this case.
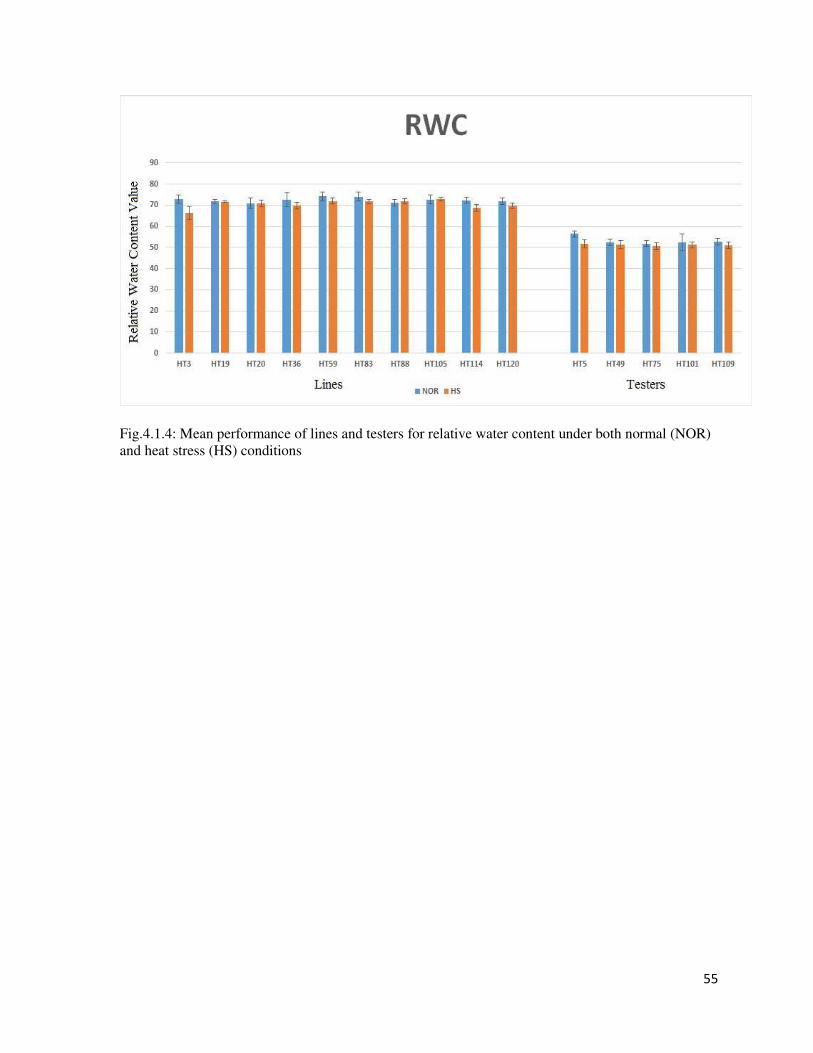
55
Fig.4.1.4: Mean performance of lines and testers for relative water content under both normal (NOR) and heat stress (HS) conditions

56
4.1.3. CLUSTER ANALYSIS
Khodadadi et al., (2011), used cluster analysis to study different traits. In this study, 11 traits
and 120 genotypes were used for screening. Genotypes were grouped into five clusters
(Table 4.4) after cluster analysis upon observing dendogram (Fig 4.1.1 and 4.1.2). Clear-cut
differences in dendogram were observed in both normal and heat stressed conditions
indicated variations among genotypes for trait expression in different environments.
4.1.3.1. Normal environment
Cluster from normal environmental conditions shown in dendogram Fig. 4.2.1. Dendogram
of 120 genotypes with five clusters represent that in cluster number one forty genotypes are
present while in second cluster only seventeen genotypes ranked, in third cluster ten
genotypes while forth cluster contain largest group of genotypes as forty four and in last
cluster number five only nine genotypes were present. From these observations it was seen
that cluster one and four maintain more amount of genetic diversity for different traits under
study. Less diversity in cluster five whereas in cluster number three and two have medium
genetic diversity. As we go toward cluster, number five from cluster one there was similarity
level decreases that show lot of diversity of genotypes under study. Genotypes of different
origin grouped in the same cluster designate the existence of some part of ancestral
relationship between genotypes (Sharma et al., 1998).
In cluster, these traits like thousand-grain weight showed maximum value and cell membrane
thermostability with minimum effects. Small amount of diversity for most of traits shown in
the same cluster (Dotlacil et al., 2000). In this cluster only one trait, canopy temperature at
grain filling stage show positive value except that all show negative effects (Table 4.4).
On second cluster, flag leaf area have maximum and canopy temperature at grain filling stage
show minimum value among all traits. All traits show positive effects in this cluster (Table
4.4). Cluster number three depicted highest negative value for thousand-grain weight while
minimum effects observed for canopy temperature at grain filling stage.

57
In third cluster, five traits show negative values are CMT, NDVIG, CTG, FLA and GPS.
While remaining six traits NDVIV, CTV, RWC, SPS, GYP and TGW shown positive values.
In cluster four, the highest peak value observed by CTG followed by RWC and minimum
value was observed for grain yield per plant. All traits showed negative effects.
Fifth cluster maximum value depicted with negative number of normalized difference at
vegetative stage and minimum effects by canopy temperature at grain filling stage. In this
last cluster, all traits have negative values except cell membrane thermostability, canopy
temperature at vegetative stage, relative water contents, and grains per spike.
4.1.3.2 Heat stressed environment
High temperature at the time of grain filling cause severe yield loss in wheat indicated by
Wahid et al., (2007). Similarity index of heat stressed genotypes from clustering resulted a
dendogram by using one twenty genotype in five diverse clusters shown in fig 4.2.2 that
show decrees of similarity index as we move from cluster one toward five. In first cluster
twenty-eight genotypes, second cluster forty, third with ten, thirty-seven in fourth and last
fifth cluster contain only five genotypes. The highest number of genotypes observed in
cluster number two. High estimates of genetic diversity was obtained in clusters two, four
and one whereas cluster number three and five have lesser number of genotypes.
For heat stress in cluster number one highest value for grains per spike and lowest in cell
membrane thermostability followed by flag leaf area. Except canopy temperature at grain
filing stage, relative water contents and thousand grain weight all traits show negative value
(Table 4.4).
In cluster two maximum value by relative water contents followed by thousand grain weight
and minimum effects by normalized difference at grain filling stage followed by grains per
spike. All traits of second cluster show negative values except normalized difference at grain
filling stage, canopy temperature at vegetative stage and grain yield per plant. In cluster
three, all traits show positive values. Maximum value with thousand grain weight and
minimum with normalized difference at grain filling stage.

58
Last fifth cluster highest value shown by grains per spike with minimum normalized
difference at vegetative stage. Except cell membrane thermostability, normalized difference
at grain filling stage, flag leaf area, spikelets per spike and grain yield per plant all other
show positive values.
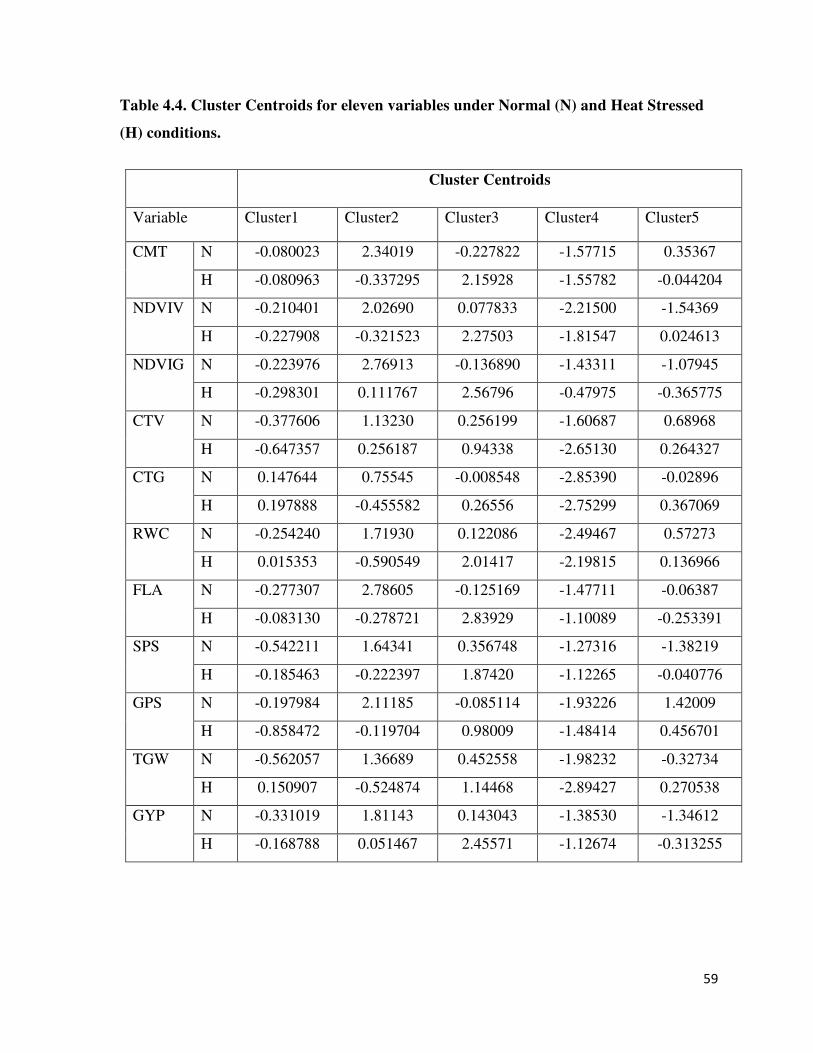
59
Table 4.4. Cluster Centroids for eleven variables under Normal (N) and Heat Stressed
(H) conditions.
Cluster Centroids
Variable Cluster1 Cluster2 Cluster3 Cluster4 Cluster5
CMT N -0.080023 2.34019 -0.227822 -1.57715 0.35367
H -0.080963 -0.337295 2.15928 -1.55782 -0.044204
NDVIV N -0.210401 2.02690 0.077833 -2.21500 -1.54369
H -0.227908 -0.321523 2.27503 -1.81547 0.024613
NDVIG N -0.223976 2.76913 -0.136890 -1.43311 -1.07945
H -0.298301 0.111767 2.56796 -0.47975 -0.365775
CTV N -0.377606 1.13230 0.256199 -1.60687 0.68968
H -0.647357 0.256187 0.94338 -2.65130 0.264327
CTG N 0.147644 0.75545 -0.008548 -2.85390 -0.02896
H 0.197888 -0.455582 0.26556 -2.75299 0.367069
RWC N -0.254240 1.71930 0.122086 -2.49467 0.57273
H 0.015353 -0.590549 2.01417 -2.19815 0.136966
FLA N -0.277307 2.78605 -0.125169 -1.47711 -0.06387
H -0.083130 -0.278721 2.83929 -1.10089 -0.253391
SPS N -0.542211 1.64341 0.356748 -1.27316 -1.38219
H -0.185463 -0.222397 1.87420 -1.12265 -0.040776
GPS N -0.197984 2.11185 -0.085114 -1.93226 1.42009
H -0.858472 -0.119704 0.98009 -1.48414 0.456701
TGW N -0.562057 1.36689 0.452558 -1.98232 -0.32734
H 0.150907 -0.524874 1.14468 -2.89427 0.270538
GYP N -0.331019 1.81143 0.143043 -1.38530 -1.34612
H -0.168788 0.051467 2.45571 -1.12674 -0.313255
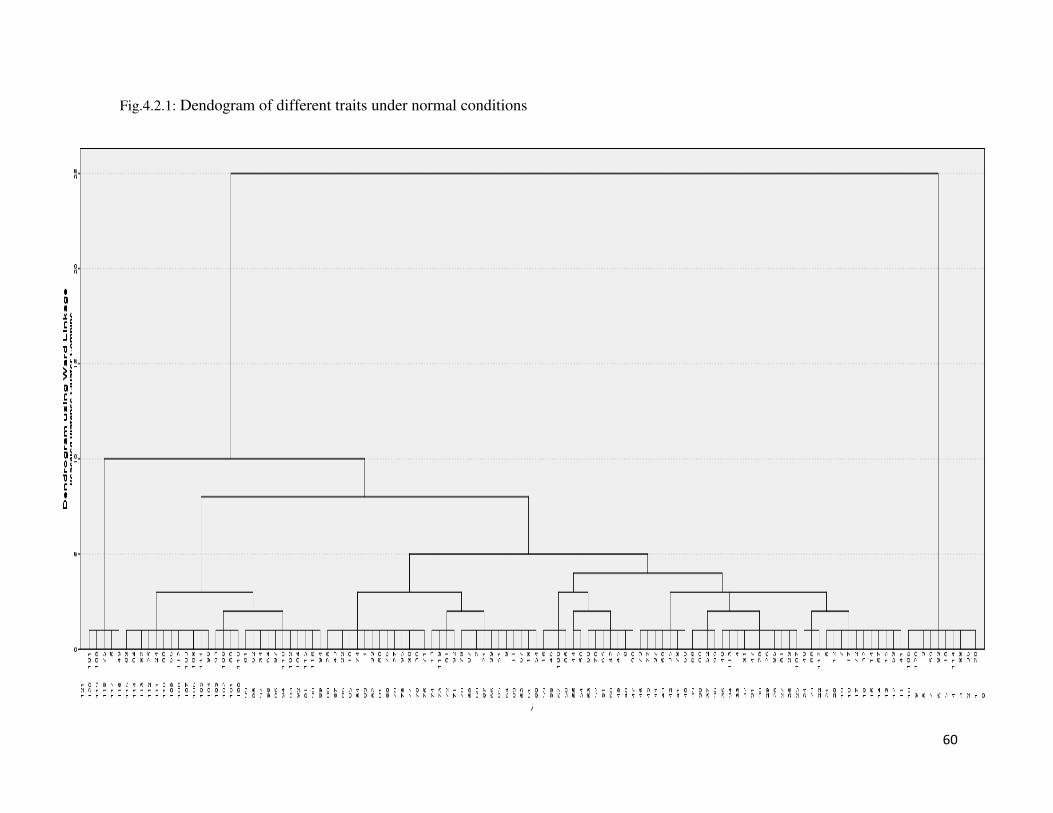
60
Fig.4.2.1: Dendogram of different traits under normal conditions

61
Fig.4.2.2: Dendogram of different traits under heat stress conditions

62
4.1.4. PRINCIPAL COMPONENT ANALYSIS
Principal component analysis classify genotypes into different number of categories based on
their performance. PCA also used for purpose to categorize genotypes into desirable yield
and yield related grouped traits. For PCA analysis mean data is needed. Data matrix 11×120
used in this analysis for both normal and high temperature stress. PCA also used to access the
contribution and relationship among trait at once.
4.1.4.1. Normal conditions
In first principal component flag leaf area, spikelets per spike, grains per spike and grain
yield per plant plays an impotent role and contribute 52.8% to the total variation. PC indicate
positive value for all eleven traits (Table 4.6). NDVIV, NDVIG and FLA were most
important variation contributing traits. NDVIV and NDVIG could be adequate to
differentiate the genotypes (Ali et al., 2008). Second PC variation was observed 62.2%,
including traits CTV, TGW and CMT as major contributors. PC3, PC4, PC5, PC6, PC7,
PC8, PC9, PC10 and PC11 contributed to the total variation 70.3%, 76.4%, 82.1%, 86.7%,
90.2%, 93.4% 96.1%, 98.4% and 100% respectively (Table 4.5).
High value of variation in first three PCs observed by Maqbool et al. 2010 and Sakin et al.
2011. High value in PC1 and PC2 indicated that the genotypes can be selected among these
groups for the excellent breeding program. PCs having more than one eigen value are
important and contribute significantly for the genetic diversity and potential for the yield
improvement reported by Kraic et al. 2009.
4.1.4.2. PCA for heat stress conditions
PCA was used to classify the genotypes of different screening methods for heat stressed
environments. From eleven PCs just first two PCs show more than one eigen value that
contribute significantly for yield traits. Nazari and Pakniyat 2010 mentioned that high value
of PC1 and PC2 were good for selction of genotypes in these PCs all other traits with low
value from these genotypes based on PCs could unproductive.
63
In first PC NDVIV, RWC, FLA and GYP most important yield related traits major
contributors of variations obtained 47.4%. In this PC, all values were positive attraction
(Table 4.4.8). Second PC 60.0% variation observed NDVIG, CTV, CTG and TGW traits
showing major contribution toward variation. Richards 1996 and Quarrie et al., 1999
suggested that improvement in genetics of yield done via genetic development of
physiological traits. PC3, PC4, PC5, PC6, PC7, PC8, PC9, PC10 and PC11 contributed to the
total variation 68.0%, 74.5%, 79.7%, 84.8%, 88.6%, 92.2%, 95.4%, 97.7% and 100%
respectively.
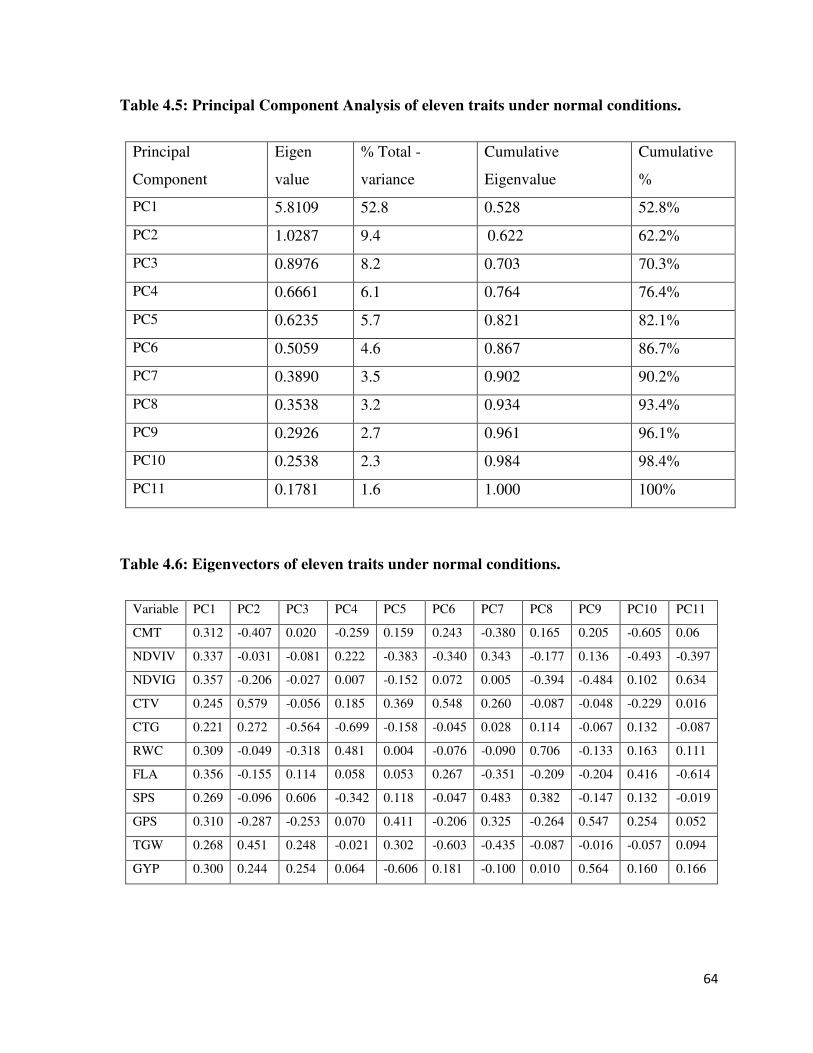
64
Table 4.5: Principal Component Analysis of eleven traits under normal conditions.
Principal
Component
Eigen
value
% Total -
variance
Cumulative
Eigenvalue
Cumulative
%
PC1 5.8109 52.8 0.528 52.8%
PC2 1.0287 9.4 0.622 62.2%
PC3 0.8976 8.2 0.703 70.3%
PC4 0.6661 6.1 0.764 76.4%
PC5 0.6235 5.7 0.821 82.1%
PC6 0.5059 4.6 0.867 86.7%
PC7 0.3890 3.5 0.902 90.2%
PC8 0.3538 3.2 0.934 93.4%
PC9 0.2926 2.7 0.961 96.1%
PC10 0.2538 2.3 0.984 98.4%
PC11 0.1781 1.6 1.000 100%
Table 4.6: Eigenvectors of eleven traits under normal conditions.
Variable PC1 PC2 PC3 PC4 PC5 PC6 PC7 PC8 PC9 PC10 PC11
CMT 0.312 -0.407 0.020 -0.259 0.159 0.243 -0.380 0.165 0.205 -0.605 0.06
NDVIV 0.337 -0.031 -0.081 0.222 -0.383 -0.340 0.343 -0.177 0.136 -0.493 -0.397
NDVIG 0.357 -0.206 -0.027 0.007 -0.152 0.072 0.005 -0.394 -0.484 0.102 0.634
CTV 0.245 0.579 -0.056 0.185 0.369 0.548 0.260 -0.087 -0.048 -0.229 0.016
CTG 0.221 0.272 -0.564 -0.699 -0.158 -0.045 0.028 0.114 -0.067 0.132 -0.087
RWC 0.309 -0.049 -0.318 0.481 0.004 -0.076 -0.090 0.706 -0.133 0.163 0.111
FLA 0.356 -0.155 0.114 0.058 0.053 0.267 -0.351 -0.209 -0.204 0.416 -0.614
SPS 0.269 -0.096 0.606 -0.342 0.118 -0.047 0.483 0.382 -0.147 0.132 -0.019
GPS 0.310 -0.287 -0.253 0.070 0.411 -0.206 0.325 -0.264 0.547 0.254 0.052
TGW 0.268 0.451 0.248 -0.021 0.302 -0.603 -0.435 -0.087 -0.016 -0.057 0.094
GYP 0.300 0.244 0.254 0.064 -0.606 0.181 -0.100 0.010 0.564 0.160 0.166

65
Table 4.7: Principal Component Analysis of eleven traits under heat stressed
conditions.
Principal
Component
Eigen
value
% Total -
variance
Cumulative
Eigenvalue
Cumulative
%
PC1 5.2192 47.4 0.474 47.4%
PC2 1.3849 12.6 0.600 60.0%
PC3 0.8771 8.0 0.680 68.0%
PC4 0.7138 6.5 0.745 74.5%
PC5 0.5751 5.2 0.797 79.7%
PC6 0.5531 5.0 0.848 84.8%
PC7 0.4273 3.9 0.886 88.6%
PC8 0.3870 3.5 0.922 92.2%
PC9 0.3516 3.2 0.954 95.4%
PC10 0.2585 2.3 0.977 97.7%
PC11 0.2524 2.3 1.000 100%
Table 4.8: Eigenvectors of eleven traits under heat stressed conditions.
Variable PC1 PC2 PC3 PC4 PC5 PC6 PC7 PC8 PC9 PC10 PC11
CMT 0.314 -0.167 -0.217 0.218 0.195 -0.620 -0.363 -0.290 -0.363 0.014 0.095
NDVIV 0.356 -0.011 -0.023 0.136 -0.257 0.376 0.026 -0.562 0.087 -0.527 0.211
NDVIG 0.320 -0.372 0.141 -0.100 0.194 0.327 0.031 -0.352 0.078 0.650 -0.175
CTV 0.241 0.397 0.244 -0.638 0.204 0.150 -0.421 0.045 -0.237 -0.075 0.115
CTG 0.194 0.579 0.306 0.198 0.355 -0.272 0.416 -0.224 0.217 0.023 -0.153
RWC 0.352 0.059 0.045 0.194 -0.133 0.193 0.425 0.322 -0.693 0.082 0.078
FLA 0.369 -0.216 -0.042 -0.071 0.072 -0.020 -0.043 0.267 0.093 -0.387 -0.757
SPS 0.292 -0.116 0.327 -0.304 -0.637 -0.451 0.136 0.058 0.208 0.120 0.114
GPS 0.196 0.254 -0.814 -0.346 -0.063 -0.031 0.256 -0.039 0.132 0.158 0.002
TGW 0.283 0.368 -0.074 0.471 -0.270 0.169 -0.490 0.264 0.253 0.284 -0.030
GYP 0.336 -0.277 -0.008 0.032 0.430 0.007 0.092 0.418 0.371 -0.128 0.535
66
4.1.5. CORRELATION STUDIES
Correlation measures the intensity of relationship among two or more random variables.
Correlation most commonly used tool in statistical analysis. Correlation determine the
intensity and direction of inter-relationship of yield and its contributing parameters those
were important and useful components for crop improvement. It used to investigate
interdependence existing among characters under study. Correlations for both normal and
heat stressed environment were calculated between physiology, grain yield, and yield related
traits. Correlation results are more reliable and accurately used for character response
prediction these are required for running of efficient breeding program.
Change in one variable as increase or decrease ultimately results the increase or decrease of
other variable, correlation results were positive. On the other hand in negative correlation, if
there was increase in one variable results in the decrease of other one. Correlation for some
traits under study in the experiment were shown in Table 4.9 for normal and for heat stress in
Table 4.10.
Under normal climatic conditions, cell membrane thermostability showed highly significant
correlations with all other traits under study. Our results showed significant correlations with
yield and related traits as Fokar et al., (1998) and Yildirim et al., (2009) also absorbed
similar trend for trait. Normalized difference vegetative index at vegetative and grain fill
stage showed highly positive significant differences with yield traits. Sultana et al. (2014);
Munjonji et al., 2017 also found similar results for NDVI. Highly significant correlations
were observed by canopy temperature at vegetative stage and grain filling stage with yield
and yield related traits. Karimizadeh and Mohammadi (2011) also found significant results
and showed accordance with our results. Khan et al. (2014) observed positive non-
significant correlation between CTV and CTG with GYP that show contradiction with our
results. Relative water content have significant correlations with all other yield and related
traits under study. Highly significant positive correlation of flag leaf area with spikelet per
spike, grains per spike, grain yield per plant and thousand-grain weight. Positive significant
correlations of flag leaf area with grain yield per plant and Azami et al., 2017 that show
similar kind of results as ours, reported thousand-grain weight. Spikelet per spike show
67
highly positive significant correlations with grains per spike, grain yield per plant and
thousand-grain weight. Positive significant correlations as observed in this study were also
reported by some previous scientists like Mohsen et al. (2012); Tsegaye et al. (2012), Munir
et al. (2007), Mohammad et al. (2001) and Haq et al. (2010); Kashif and Khaliq (2004),
Khaliq et al. (2004) and Haq et al. (2010). Highly significant and positive correlation of
grains per spike with grain yield per plant and thousand-grain weight. Iftikhar et al. (2012)
reported positive and significant correlation of grains per spike with spike length that show
accordance with results. Highly significant correlated of grains per spike with all yield and
related traits under study. Our results show similarities with results of Khodarahmpour et al.,
(2011); Munir et al. (2007) found positive and significant results of mean productivity and
grain yield. Thousand-grain weight showed highly significant correlation with all other traits.
Aycicek and Yildirim (2006); Hussain et al. (2012); Nasri et al. (2014) also reported similar
positive significant association of thousand grain weight with yield.
Under high temperature stress, correlation of CMT was positive and highly significant with
yield and related traits. Sikder et al., (2001); Sairam and Srivastava (2001) detected highly
significant differences that show accordance with results. Clarke et al., 1992; Guttieri et al.,
2001 also used stress susceptibility index for stress evaluation. Normalized difference
vegetative index at vegetative stage showed highly positive significant correlation with yield
traits under heat stressed conditions. Pask et al., 2014 suggested NDVI effective tool for
selection in breeding. Foulkes et al., 2007 concluded that genotypes NDVI valued show
tolerant to heat stress under high temperature confirm our findings. Highly significant
correlation of canopy temperature at vegetative stage and grain filling stage with yield and
related traits was observed in this study. Ayeneh et al., (2002): Bilge et al., (2008) observed
similar positive significant results. Normalized difference vegetative index at vegetative
stage showed non-significant correlation with CT and GPS. Highly positive significant
correlation was observed by relative water content with other screening parameters. Relative
water content showed correlation with early and late when compared with other normal
sowing (Bhesaniya, 2005). Under heat stress relative water content tend to decline and show
negative correlation with yield as reported by Savicka and Skute (2012); Sairam et al., (2000)
and Ram et al., (2017) show conflict with our results. Flag leaf area showed positive
significant correlations with yield traits. Gupta et al., (2001) also reported positive
68
correlations between flag leaf area and grain yield and showed agreement with our results.
Spikelets/spike showed non-significant correlation with grains per spikes. Positive significant
correlation of grains per spike with grain yield per plant and thousand-grain weight. Subhani
and Chowdhry (2000) that reported negative significant correlation and show contradiction
with our results. Grain yield per plant showed highly significant correlation with yield.
Positive correlation of grain yield per plant reported by Munir et al. (2007) and show
accordance with our results. Positive and highly significant correlation with all traits. Results
of Dokuyucu et al. (2004), Abdelmula et al. (2011), Aslani and Mehrvar (2012) also show
positive significant correlation of TGW with GYP in heat stress that show accordance with
our results.
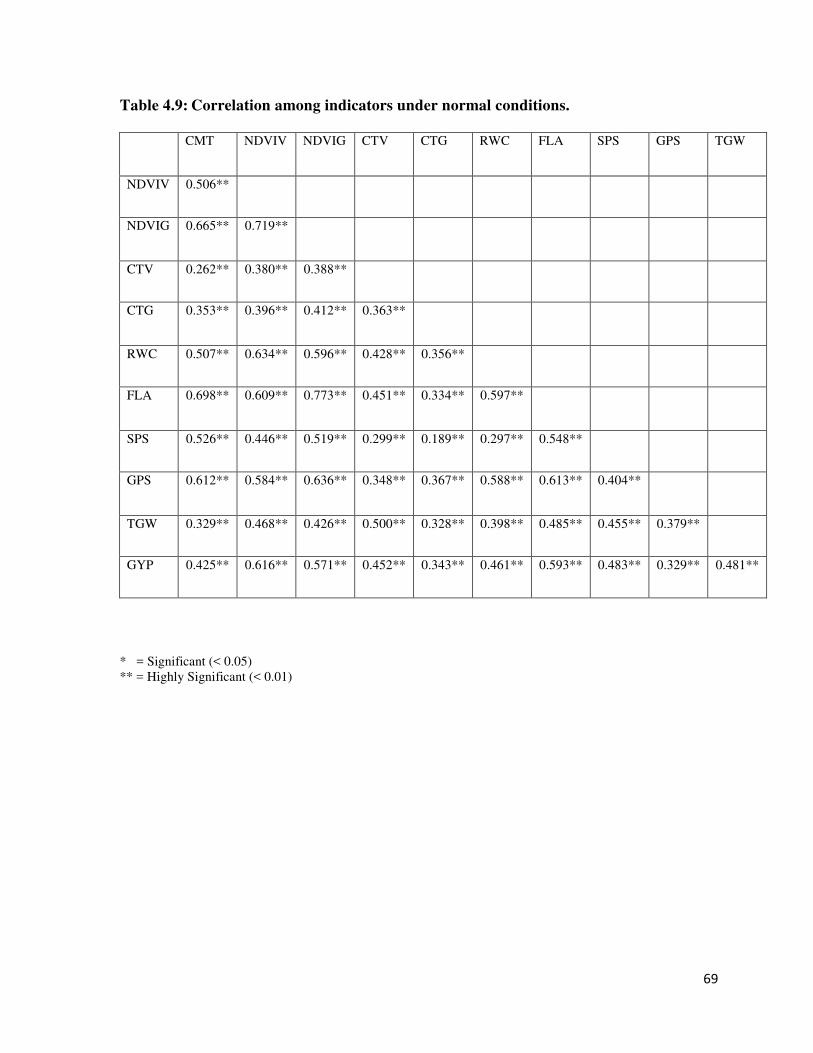
69
Table 4.9: Correlation among indicators under normal conditions.
CMT NDVIV NDVIG CTV CTG RWC FLA SPS GPS TGW
NDVIV 0.506**
NDVIG 0.665**
0.719**
CTV 0.262**
0.380**
0.388**
CTG 0.353**
0.396**
0.412**
0.363**
RWC 0.507**
0.634**
0.596**
0.428**
0.356**
FLA 0.698**
0.609**
0.773**
0.451**
0.334**
0.597**
SPS 0.526**
0.446**
0.519**
0.299**
0.189**
0.297**
0.548**
GPS 0.612**
0.584**
0.636**
0.348**
0.367**
0.588**
0.613**
0.404**
TGW 0.329**
0.468**
0.426**
0.500**
0.328**
0.398**
0.485**
0.455**
0.379**
GYP 0.425**
0.616**
0.571**
0.452**
0.343**
0.461**
0.593**
0.483**
0.329**
0.481**
* = Significant (< 0.05) ** = Highly Significant (< 0.01)
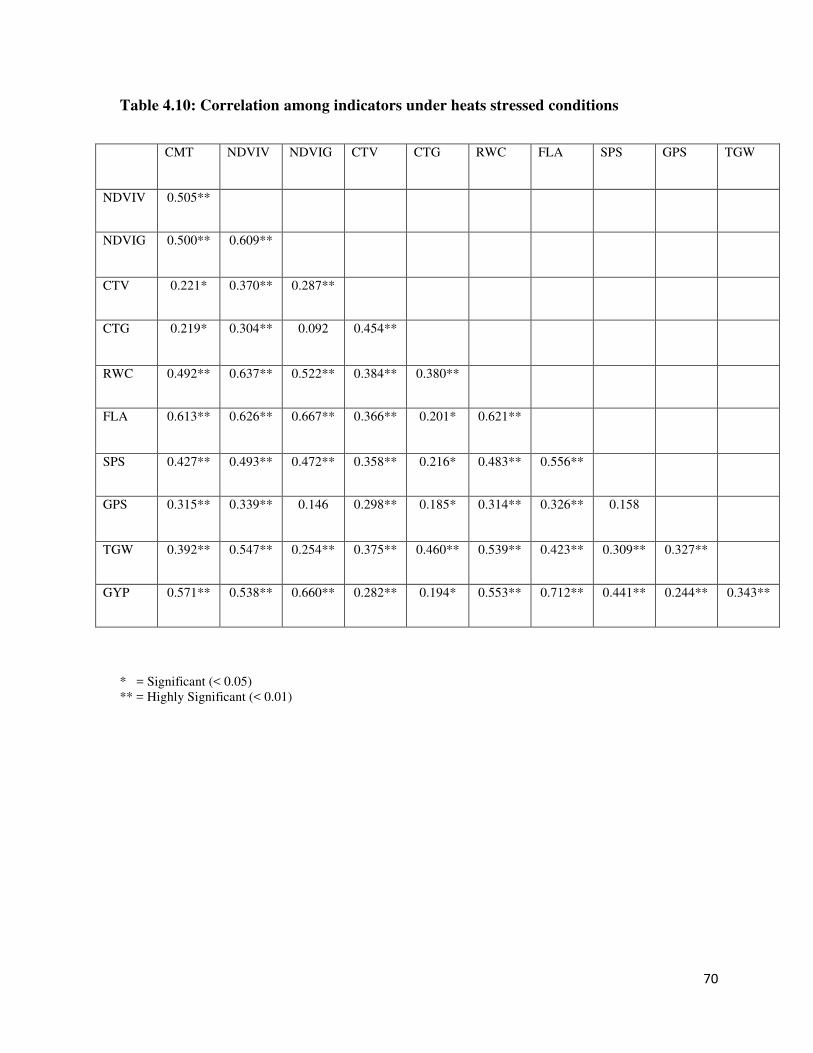
70
Table 4.10: Correlation among indicators under heats stressed conditions
CMT NDVIV NDVIG CTV CTG RWC FLA SPS GPS TGW
NDVIV 0.505**
NDVIG 0.500** 0.609**
CTV 0.221*
0.370**
0.287**
CTG 0.219* 0.304** 0.092
0.454**
RWC 0.492**
0.637**
0.522**
0.384**
0.380**
FLA 0.613** 0.626**
0.667**
0.366**
0.201* 0.621**
SPS 0.427**
0.493**
0.472**
0.358**
0.216*
0.483**
0.556**
GPS 0.315**
0.339**
0.146
0.298**
0.185*
0.314**
0.326**
0.158
TGW 0.392**
0.547**
0.254**
0.375** 0.460**
0.539**
0.423**
0.309**
0.327**
GYP 0.571**
0.538**
0.660**
0.282**
0.194*
0.553**
0.712**
0.441**
0.244**
0.343**
* = Significant (< 0.05) ** = Highly Significant (< 0.01)

71
4.2. Experiment # 2
4.2.1. Analysis of Variance for Line × Tester mating design under normal conditions.
Line to tester analysis is a valuable mating design for understanding genetics like GCA and
SCA and other traits controlled by additive and non-additive gene action controlling certain
traits. Mean square values are used for all types of assessment given in ANOVA Table 4.11.
Results shown from analysis explained that all genotypes exhibit highly significant
differences for cell membrane thermostability, normalized difference at vegetative stage,
normalized difference at grain filling stage, canopy temperature at vegetative stage, canopy
temperature at grain filling stage, relative water content, plant height, flag leaf area, peduncle
length, spike length, number of fertile tillers per plant, days to heading, days to maturity,
spikelets per spike, grains per spike, thousand grain weight, grain yield per plant and other
quality traits like protein ,moisture, starch ash, gluten and test weight (Table 4.11).
Mean square values of ANOVA for females parents (Lines) explained that canopy
temperature at vegetative stage and canopy temperature at grain filling stag show no
significant differences whereas all other traits like cell membrane thermostability, normalized
difference at grain filling stage, relative water content, plant height, flag leaf area, peduncle
length, spike length, number of fertile tillers per plant, days to heading, days to maturity,
spikelets per spike, grains per spike, thousand grain weight, grain yield per plant and other
quality traits like protein, moisture, starch ash, gluten and test weight have highly significant
differences among all traits for all the genotypes.
Mean square values of ANOVA for testers (male parents) showed that canopy temperature
at vegetative stage, canopy temperature at grain filling stag and number of spikelets per spike
show no significant differences whereas all other traits like cell membrane thermostability,
normalized difference at grain filling stage, relative water content, plant height, flag leaf area,
peduncle length, spike length, number of fertile tillers per plant, days to heading, days to
maturity, grains per spike, thousand grain weight, grain yield per plant and other quality traits
like protein, moisture, starch ash, gluten and test weight have highly significant differences
among all traits for all the genotypes.
72
Highly significant differences were described for line × tester interaction in all traits except
canopy temperature at vegetative stage. Parents those exhibit highly significant difference for
traits except Canopy temperature at grain filling stage and spikelets per spikes show no
differences among all used genotypes (Table 4.11). In crosses showed highly significant
differences in all traits. Almost all traits under study showed highly significant differences
for parents vs crosses while some traits like grain yield per plant and gluten show no
significant differences among these traits in all genotypes (Table 4.11).
Genetic variation is the key to all breeding program. As all the results show handsome
amount of differences among all traits of the genotypes. The main concern for breeding
material focuses on yield of the genotypes. Yield contributing traits are usually analyzed for
the potential of yield. The traits used in this study were cell membrane thermostability,
normalized difference at vegetative stage, normalized difference at grain filling stage, canopy
temperature at vegetative stage, canopy temperature at grain filling stage, relative water
content, plant height, flag leaf area, peduncle length, spike length, number of fertile tillers per
plant, days to heading, days to maturity, spikelets per spike, grains per spike, thousand grain
weight, grain yield per plant and other quality traits like protein ,moisture, starch ash, gluten
and test weight. All these traits showed maximum significant differences among each other
in all the genotypes.
These traits actually contributed for the genetic variability. It is concluded that all these
genotypes could be possibly used in any further breeding program. These results show
similarity with results of some other researchers like Saleem and El-Sawai (2006), Srivsatava
et al., (2006), Jain and Sastry (2012), Majeed et al., (2013), Sanjeev et al., (2005), Kashif and
Khaliq (2005). They also stated that genetic variability is the main requirement of a breeder
to run a successful breeding program.
4.2.2. Analysis of Variance for Line × Tester mating design under heat stress.
Under heat stress, mean square values used for all types of assessment given in ANOVA
Table 4.12. Results shown from analysis explained that all genotypes exhibit highly
significant differences for all traits under study. Mean sum of square values of ANOVA for
females parents (Lines) explain that CTG and ash show no significant differences whereas all

73
other traits like cell membrane thermostability, CTV, NDVIV, NDVIG, relative water
content, plant height, flag leaf area, peduncle length, spike length, number of fertile tillers per
plant, days to heading, days to maturity, spikelets per spike, grains per spike, thousand grain
weight, grain yield per plant and other quality traits like protein, moisture, starch, gluten and
test weight have highly significant differences among all traits for all the genotypes.
Mean square values of ANOVA for testers (male parents) that spikelets per spike and starch
show no significant differences whereas all other traits like canopy temperature at vegetative
stage, canopy temperature at grain filling stage, cell membrane thermostability, normalized
difference at grain filling stage, relative water content, plant height, flag leaf area, peduncle
length, spike length, number of fertile tillers per plant, days to heading, days to maturity,
grains per spike, thousand grain weight, grain yield per plant and other quality traits like
protein, moisture, ash, gluten and test weight have highly significant differences among all
traits for all the genotypes (Table 4.12).
Highly significant differences were observed for line × tester interaction for all genotypes in
all traits under study. Parents showed highly significant difference for all traits except
spikelets per spike and moisture show no differences among all used genotypes (Table 4.12).
Parents versus crosses exhibit highly significant difference for almost all traits except fertile
tillers per plant, grain yield per plant and gluten show no differences among all used
genotypes. In crosses, highly significant differences were observed in most of traits.
Spikelets per spike showed no significant difference among all genotypes used. These results
shown accordance with some researchers finding as Jain and Sastry (2012), Majeed et al.,
(2013), Sanjeev et al., (2005), Kashif and Khaliq (2005).
4.2.3. Estimation of genetic components of variation under normal and heat stress
conditions
Genetic components for numerous traits measured under both normal and heat stressed
conditions are given in the Table 4.13. Variance due to general combining ability is superior
in all traits viz CMT, NDVIV, NDVIG, CTV, CTG, RWC, PH, FLA, PL, SL, FTP, DTH,
DTM, SPS, GPS, TGW, GYP and other quality traits like protein ,moisture, starch ash,
gluten and test weight indicating the dominance role under normal conditions. Traits like
74
normalized difference at vegetative stage, canopy temperature at vegetative stage, canopy
temperature at grain filling stage, peduncle length, days to maturity, grain yield per plant,
gluten and test weight suggested the direction of dominance toward lower parents while rest
all others dominance measured toward dominance parents.
High temperature conditions high estimates of variation due to GCA for CMT, NDVIV,
NDVIG, CTV, CTG, RWC, PH, FLA, PL, SL, FTP, DTH, DTM, SPS, GPS, TGW, GYP and
other quality traits like protein ,moisture, starch ash, gluten and test weight represent
dominance. Traits like normalized difference at vegetative stage, relative water content, days
to heading, days to maturity, grain yield per plant, moisture and starch suggested the route of
dominance concerning lower parents while rest all others dominance measured toward
dominance parents.
4.2.4. Contribution of lines, testers and their interaction towards character expression
under normal and heat stressed conditions.
Proportional contribution of lines, testers and their interaction studied and expression of
phenotypes for different characters given in Table 4.14. Under normal environmental
conditions lines showed more contribution for NDVIG (35.52%), Number of fertile tillers per
plant (51.44), Days to heading (24.44), Grains per spike (28.86), Moisture (28.08), 1000-
grain weight (34.66), Starch (31.11) and Ash (35.17), while L × T interaction show greater
contribution for Normalized difference vegetation index at vegetative stage (87.72%),
Canopy temperature at vegetative stage (84.93%), Canopy temperature at grain filling stage
(82.28%), Peduncle length (81.88%), Grain yield per plant (87.59%) and Test weight
(84.00%). Tester show minimum contribution for all the traits under study.
Under heat stress conditions manifestation of cell membrane thermostability (27.25%),
NDVIG (34.89%), plant height (24.21%), spikelets per spike (26.09), Flag leaf area
(29.97%), Number of fertile tillers per plant (38.02%), Grains per spike (30.83%) and 1000-
grain weight (40.73%), while L × T interaction show contribution NDVIV (87.77%), CTV
(72.40%), CTG (72.93%), days to heading (75.88%) and days to maturity (87.28%). All
show minimum values by testers as shown in Table 4.5.4.
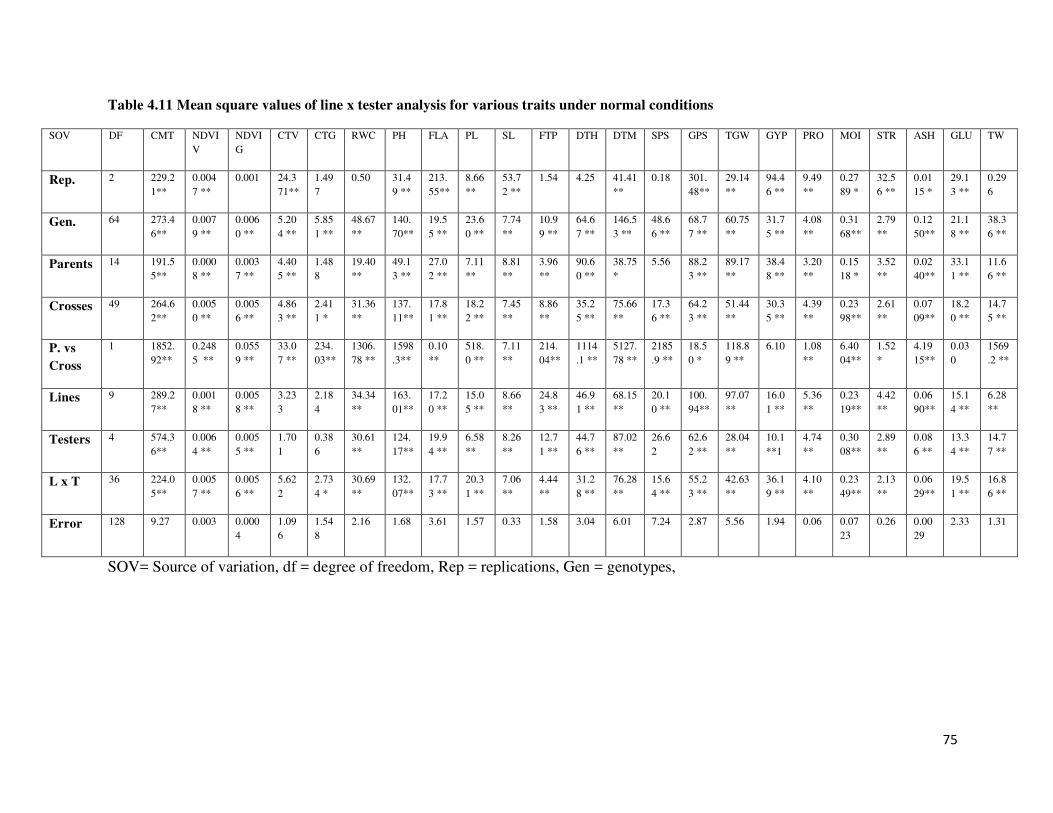
75
Table 4.11 Mean square values of line x tester analysis for various traits under normal conditions
SOV DF CMT NDVIV
NDVIG
CTV CTG RWC PH FLA PL SL FTP DTH DTM SPS GPS TGW GYP PRO MOI STR ASH GLU TW
Rep. 2 229.21**
0.0047 **
0.001 24.371**
1.497
0.50 31.49 **
213.55**
8.66 **
53.72 **
1.54 4.25 41.41 **
0.18 301.48**
29.14 **
94.46 **
9.49 **
0.2789 *
32.56 **
0.0115 *
29.13 **
0.296
Gen. 64 273.46**
0.0079 **
0.0060 **
5.204 **
5.851 **
48.67**
140.70**
19.55 **
23.60 **
7.74 **
10.99 **
64.67 **
146.53 **
48.66 **
68.77 **
60.75 **
31.75 **
4.08 **
0.3168**
2.79 **
0.1250**
21.18 **
38.36 **
Parents 14 191.55**
0.0008 **
0.0037 **
4.405 **
1.488
19.40 **
49.13 **
27.02 **
7.11 **
8.81 **
3.96 **
90.60 **
38.75 *
5.56 88.23 **
89.17 **
38.48 **
3.20 **
0.1518 *
3.52 **
0.0240**
33.11 **
11.66 **
Crosses 49 264.62**
0.0050 **
0.0056 **
4.863 **
2.411 *
31.36 **
137.11**
17.81 **
18.22 **
7.45 **
8.86 **
35.25 **
75.66 **
17.36 **
64.23 **
51.44 **
30.35 **
4.39 **
0.2398**
2.61 **
0.0709**
18.20 **
14.75 **
P. vs
Cross
1 1852.92**
0.2485 **
0.0559 **
33.07 **
234.03**
1306.78 **
1598.3**
0.10 **
518.0 **
7.11 **
214.04**
1114.1 **
5127.78 **
2185.9 **
18.50 *
118.89 **
6.10 1.08 **
6.4004**
1.52 *
4.1915**
0.030
1569.2 **
Lines 9 289.27**
0.0018 **
0.0058 **
3.233
2.184
34.34 **
163.01**
17.20 **
15.05 **
8.66 **
24.83 **
46.91 **
68.15 **
20.10 **
100.94**
97.07 **
16.01 **
5.36 **
0.2319**
4.42 **
0.0690**
15.14 **
6.28 **
Testers 4 574.36**
0.0064 **
0.0055 **
1.701
0.386
30.61 **
124.17**
19.94 **
6.58 **
8.26 **
12.71 **
44.76 **
87.02 **
26.62
62.62 **
28.04 **
10.1 **1
4.74 **
0.3008**
2.89 **
0.086 **
13.34 **
14.77 **
L x T 36 224.05**
0.0057 **
0.0056 **
5.622
2.734 *
30.69 **
132.07**
17.73 **
20.31 **
7.06 **
4.44 **
31.28 **
76.28 **
15.64 **
55.23 **
42.63 **
36.19 **
4.10 **
0.2349**
2.13 **
0.0629**
19.51 **
16.86 **
Error 128 9.27 0.003 0.0004
1.096
1.548
2.16 1.68 3.61 1.57 0.33 1.58 3.04 6.01 7.24 2.87 5.56 1.94 0.06 0.0723
0.26 0.0029
2.33 1.31
SOV= Source of variation, df = degree of freedom, Rep = replications, Gen = genotypes,

76
Table 4.12. Mean square values of line x tester analysis for various traits under heat stressed conditions
SOV DF CMT NDVIV
NDVIG
CTV CTG RWC PH FLA PL SL FTP DTH DTM SPS GPS TGW GYP PRO MOI STR ASH GLU TW
Rep. 2 10.40 0.0180 **
0.0012 *
13..858**
0.399
3.22 46.50 **
16.26 **
9.56 **
38.04 **
61.06 **
68.40 **
76.06 **
19.77
7.40 48.53 **
43.33 **
8.25 **
0.918
32.81 **
1.92 *
23.77 **
0.122
Gen. 64 114.31 **
0.0049 **
0.0046 **
5.963 **
7.077 **
50.720 **
128.45**
21.87 **
19.76 **
7.89 **
7.79 **
49.76 **
106.71 **
18.12 **
56.27 **
103.81 **
14.72 **
4.10 **
0.690 **
2.50 **
0.09 **
20.33 **
30.29 **
Parents 14 247.51 **
0.0018 **
0.0026 **
2.097
3.670 **
22.69 **
53.02 **
13.89 **
13.05 **
7.38 **
7.08 **
17.97 **
38.27 **
11.46
15.08 **
82.65 **
19.98 **
3.03 **
0.121
2.52 **
0.02 **
22.16 **
5.91 **
Crosses 49 78.58 **
0.0040 **
0.0037 **
6.147 **
4.976 **
24.57 **
140.20**
12.41 **
15.96 **
7.14 **
7.96 **
40.68 **
60.87 **
17.68
31.10 **
103.47 **
13.49 **
4.48 **
0.734 **
2.47 **
0.062 **
20.13 **
12.84 **
P. vs
Cross
1 0.61 **
0.0964 **
0.0773 **
51.090**
158.4 **
1724.88 **
609.89 *
596.83**
300.0 **
51.63 *
9.36 940.0 **
3310.9 *
132.97**
1866.0 **
417.16 **
1.31 0.418 *
6.512 **
3.57 **
2.38 **
4.36 1226.9 **
Lines 9 116.58 **
0.0031 **
0.0058 **
5.180 **
2.65 11.83 **
184.79**
20.25 **
18.18 **
8.66 **
16.48 **
41.91 **
36.91 **
25.12 **
52.20 **
229.43 **
13.48 **
5.48 **
0.689 **
3.16 **
0.053
16.26 **
11.90 *
Testers 4 62.06 **
0.0008 **
0.0034 **
9.130 **
10.776**
19.09 **
97.14 **
5.75 **
23.37 **
5.62 **
7.02 **
25.88 **
11.81 **
12.04
24.04 **
81.65 **
7.29 **
4.24 **
0.701 *
0.83 0.102 **
31.63 **
21.68 **
L x T 36 70.91 **
0.0045 **
0.0032 **
6.057 **
4.939 **
28.36 **
133.84**
11.19 **
14.58 **
6.94 **
5.93 **
42.02 **
72.31 **
16.45 **
26.61 **
74.40 **
14.19 **
4.25 **
0.749 **
2.48 **
0.059 **
19.82 **
12.06 **
Error 128 3.77 0.0002
0.0003
1.1115
1.354
3.24 2.301
1.71 2.87 0.836
2.56 5.32 5.53 6.38 5.68 8.08 2.51 0.062
0.219
0.468
0.028
3.63 2.39
df = degree of freedom, Rep = replications, Gen = genotypes,
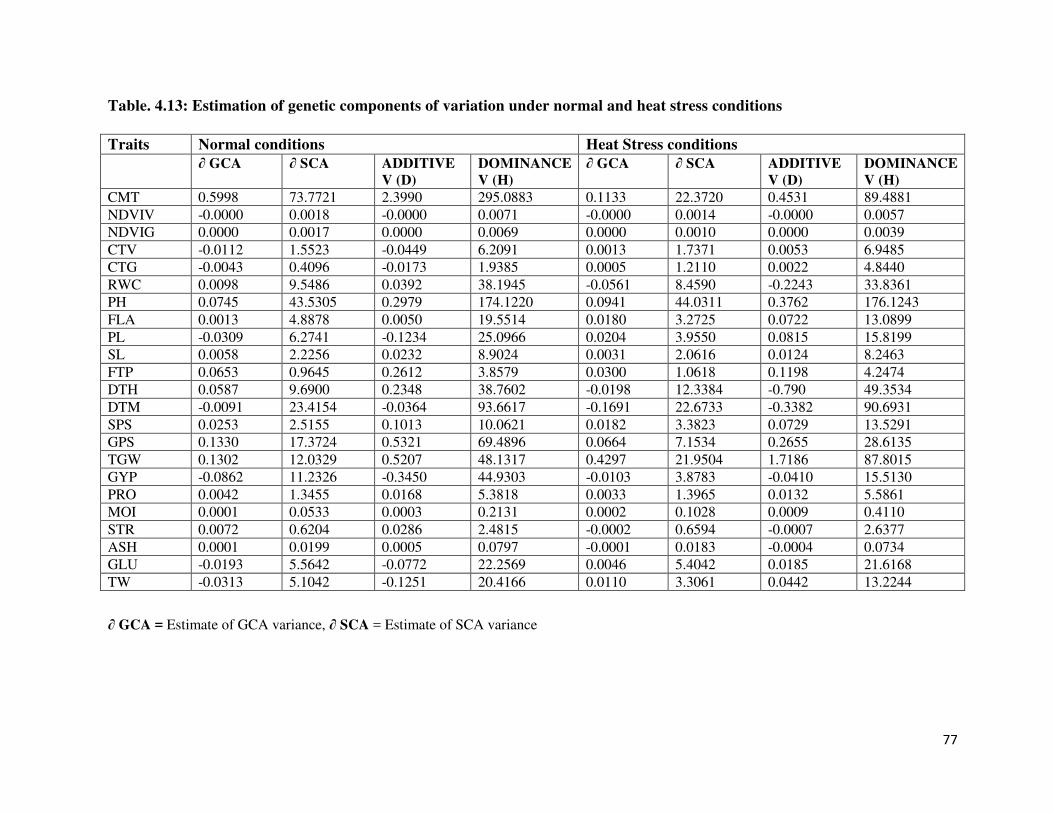
77
Table. 4.13: Estimation of genetic components of variation under normal and heat stress conditions
Traits Normal conditions Heat Stress conditions
∂ GCA ∂ SCA ADDITIVE
V (D)
DOMINANCE
V (H)
∂ GCA ∂ SCA ADDITIVE
V (D)
DOMINANCE
V (H)
CMT 0.5998 73.7721 2.3990 295.0883 0.1133 22.3720 0.4531 89.4881 NDVIV -0.0000 0.0018 -0.0000 0.0071 -0.0000 0.0014 -0.0000 0.0057 NDVIG 0.0000 0.0017 0.0000 0.0069 0.0000 0.0010 0.0000 0.0039 CTV -0.0112 1.5523 -0.0449 6.2091 0.0013 1.7371 0.0053 6.9485 CTG -0.0043 0.4096 -0.0173 1.9385 0.0005 1.2110 0.0022 4.8440 RWC 0.0098 9.5486 0.0392 38.1945 -0.0561 8.4590 -0.2243 33.8361 PH 0.0745 43.5305 0.2979 174.1220 0.0941 44.0311 0.3762 176.1243 FLA 0.0013 4.8878 0.0050 19.5514 0.0180 3.2725 0.0722 13.0899 PL -0.0309 6.2741 -0.1234 25.0966 0.0204 3.9550 0.0815 15.8199 SL 0.0058 2.2256 0.0232 8.9024 0.0031 2.0616 0.0124 8.2463 FTP 0.0653 0.9645 0.2612 3.8579 0.0300 1.0618 0.1198 4.2474 DTH 0.0587 9.6900 0.2348 38.7602 -0.0198 12.3384 -0.790 49.3534 DTM -0.0091 23.4154 -0.0364 93.6617 -0.1691 22.6733 -0.3382 90.6931 SPS 0.0253 2.5155 0.1013 10.0621 0.0182 3.3823 0.0729 13.5291 GPS 0.1330 17.3724 0.5321 69.4896 0.0664 7.1534 0.2655 28.6135 TGW 0.1302 12.0329 0.5207 48.1317 0.4297 21.9504 1.7186 87.8015 GYP -0.0862 11.2326 -0.3450 44.9303 -0.0103 3.8783 -0.0410 15.5130 PRO 0.0042 1.3455 0.0168 5.3818 0.0033 1.3965 0.0132 5.5861 MOI 0.0001 0.0533 0.0003 0.2131 0.0002 0.1028 0.0009 0.4110 STR 0.0072 0.6204 0.0286 2.4815 -0.0002 0.6594 -0.0007 2.6377 ASH 0.0001 0.0199 0.0005 0.0797 -0.0001 0.0183 -0.0004 0.0734 GLU -0.0193 5.5642 -0.0772 22.2569 0.0046 5.4042 0.0185 21.6168 TW -0.0313 5.1042 -0.1251 20.4166 0.0110 3.3061 0.0442 13.2244
∂ GCA = Estimate of GCA variance, ∂ SCA = Estimate of SCA variance
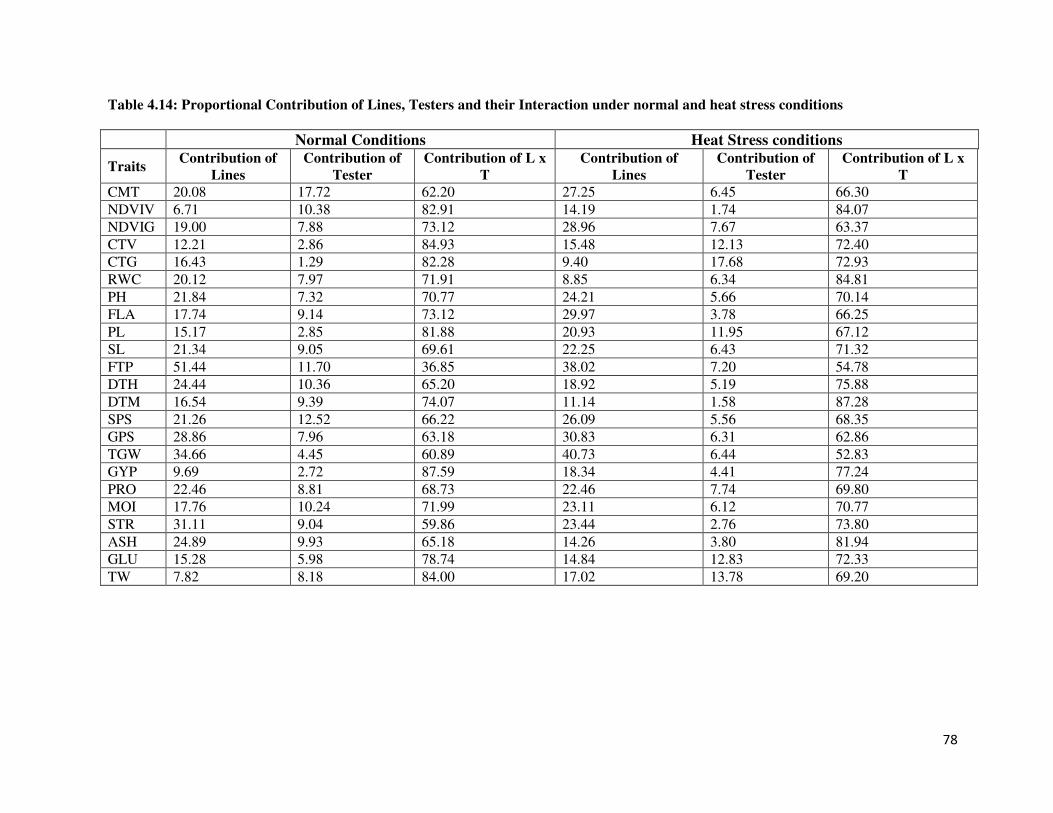
78
Table 4.14: Proportional Contribution of Lines, Testers and their Interaction under normal and heat stress conditions
Normal Conditions Heat Stress conditions
Traits Contribution of
Lines
Contribution of
Tester
Contribution of L x
T
Contribution of
Lines
Contribution of
Tester
Contribution of L x
T
CMT 20.08 17.72 62.20 27.25 6.45 66.30 NDVIV 6.71 10.38 82.91 14.19 1.74 84.07 NDVIG 19.00 7.88 73.12 28.96 7.67 63.37 CTV 12.21 2.86 84.93 15.48 12.13 72.40 CTG 16.43 1.29 82.28 9.40 17.68 72.93 RWC 20.12 7.97 71.91 8.85 6.34 84.81 PH 21.84 7.32 70.77 24.21 5.66 70.14 FLA 17.74 9.14 73.12 29.97 3.78 66.25 PL 15.17 2.85 81.88 20.93 11.95 67.12 SL 21.34 9.05 69.61 22.25 6.43 71.32 FTP 51.44 11.70 36.85 38.02 7.20 54.78 DTH 24.44 10.36 65.20 18.92 5.19 75.88 DTM 16.54 9.39 74.07 11.14 1.58 87.28 SPS 21.26 12.52 66.22 26.09 5.56 68.35 GPS 28.86 7.96 63.18 30.83 6.31 62.86 TGW 34.66 4.45 60.89 40.73 6.44 52.83 GYP 9.69 2.72 87.59 18.34 4.41 77.24 PRO 22.46 8.81 68.73 22.46 7.74 69.80 MOI 17.76 10.24 71.99 23.11 6.12 70.77 STR 31.11 9.04 59.86 23.44 2.76 73.80 ASH 24.89 9.93 65.18 14.26 3.80 81.94 GLU 15.28 5.98 78.74 14.84 12.83 72.33 TW 7.82 8.18 84.00 17.02 13.78 69.20
79
4.2.5. Cell membrane thermostability
Cell membrane thermostability is most important physiological tool for determination of heat
tolerance in wheat. Islam et al., (2011), also discussed the importance of CMT for adaptation
of plants to high temperature stress. Plant breeds would also use CMT as an efficient
selection marker in the breeding program for development of heat tolerant wheat genotypes.
General combing ability of lines and testers for CMT under normal and heat stressed
conditions were shown in Table 4.15 and Table 4.16 respectively. For cell membrane
thermostability, positive GCA effects are desirable. Range of variation was observed in
general combining ability among Lines and testers used in the experiment. For CMT GCA
values range from -7.27 to 6.69 under normal conditions. Highest positively significant value
shown by V-13241 (6.69) followed by MISR1 (4.32), AARI-11 (3.65), Miraj-08 (1.71) and
Shahkar-13 (1.44) under normal conditions. Under normal conditions values of GCA testers
range from -5.81 to 6.02. Among testers, significant positive value was observed by V-12082
(6.02) and Chennab-2000 (1.72). Under heat stressed conditions GCA estimates range of -
4.12 to 5.32 represents the existence of broad range of variation for CMT in lines. For CMT,
MISR 1 (5.32), Shahkar-13 (1.84), Faislabad-08 (1.83) and AARI-11 (1.65) showed positive
significant values for lines. Range of GCA in testers for CMT under heat stress was -2.17 to
1.53. The highest positive values for tester were reported in Chenab-2000 (1.53) and V-
12082 (1.03).
SCA effects for cell membrane thermostability shown in Table 4.17 as they exhibited a great
range of variation among all crosses from negative to positive values i.e. (-14.81 to 15.17).
Crosses show highly positive and significant values for SCA in CMT under normal
conditions are V-13013 × ND643 (15.17), MISR 1 × ND643 (11.85), Miraj-08 × Chenab-
2000 (11.22) and Shahkar-13 × V-12082 (11.18). Specific combing ability effects under heat
stress range from -8.37 to 10.46. Significant and positive SCA effects were observed in
following crosses Faisalabad-08 × Chenab-2000 (10.46) followed by V-13241 × V-12056
(7.56), Miraj-2008 × Millat-11(6.96) and V-13248 × V-12082(6.80).
Degree of dominance depends on ratio of SCA variance to GCA variance in line x tester
analysis. Higher value of SCA variance then GCA variance for cell membrane
80
thermostability was confirmed non-additive gene action for this trait under both normal and
heat stressed environments. Yildrim et al., (2009) and Dhanda and Munjal, (2009) found
non-additive genetic effects for cell membrane thermostability. Findings of these researchers
also supported that result of these studies.
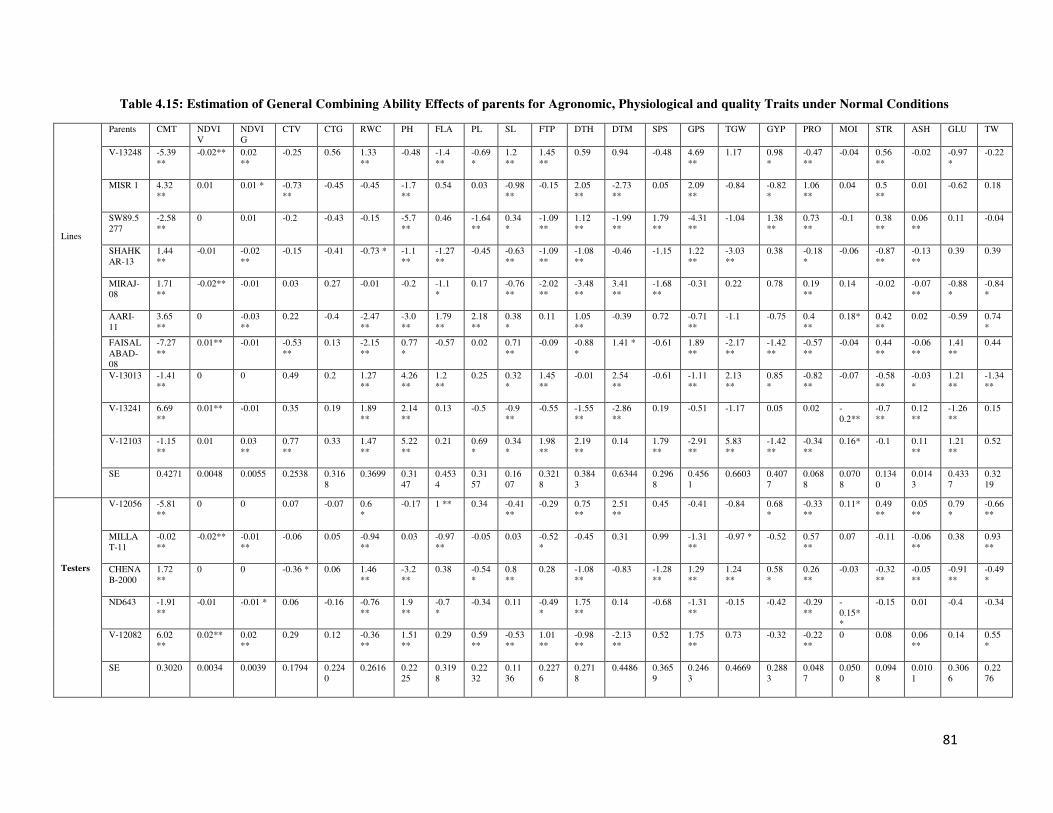
81
Table 4.15: Estimation of General Combining Ability Effects of parents for Agronomic, Physiological and quality Traits under Normal Conditions
Lines
Parents CMT NDVIV
NDVIG
CTV CTG RWC PH FLA PL SL FTP DTH DTM SPS GPS TGW GYP PRO MOI STR ASH GLU TW
V-13248 -5.39 **
-0.02** 0.02 **
-0.25
0.56
1.33 **
-0.48 -1.4 **
-0.69 *
1.2 **
1.45 **
0.59
0.94 -0.48 4.69 **
1.17 0.98 *
-0.47 **
-0.04
0.56 **
-0.02
-0.97 *
-0.22
MISR 1 4.32 **
0.01 0.01 *
-0.73 **
-0.45
-0.45 -1.7 **
0.54 0.03 -0.98 **
-0.15
2.05 **
-2.73 **
0.05 2.09 **
-0.84 -0.82 *
1.06 **
0.04
0.5 **
0.01
-0.62 0.18
SW89.5277
-2.58 **
0 0.01
-0.2
-0.43
-0.15 -5.7 **
0.46 -1.64 **
0.34 *
-1.09 **
1.12 **
-1.99 **
1.79 **
-4.31 **
-1.04 1.38 **
0.73 **
-0.1
0.38 **
0.06 **
0.11 -0.04
SHAHKAR-13
1.44 **
-0.01 -0.02 **
-0.15
-0.41
-0.73 * -1.1 **
-1.27 **
-0.45 -0.63 **
-1.09 **
-1.08 **
-0.46 -1.15 1.22 **
-3.03 **
0.38 -0.18 *
-0.06
-0.87 **
-0.13 **
0.39 0.39
MIRAJ-08
1.71 **
-0.02** -0.01
0.03
0.27
-0.01 -0.2 -1.1 *
0.17 -0.76 **
-2.02 **
-3.48 **
3.41 **
-1.68 **
-0.31
0.22 0.78 0.19 **
0.14
-0.02 -0.07 **
-0.88 *
-0.84 *
AARI-11
3.65 **
0 -0.03 **
0.22
-0.4
-2.47 **
-3.0 **
1.79 **
2.18 **
0.38 *
0.11
1.05 **
-0.39 0.72 -0.71 **
-1.1 -0.75 0.4 **
0.18* 0.42 **
0.02
-0.59 0.74 *
FAISALABAD-08
-7.27 **
0.01** -0.01
-0.53 **
0.13
-2.15 **
0.77 *
-0.57 0.02 0.71 **
-0.09
-0.88 *
1.41 * -0.61 1.89 **
-2.17 **
-1.42 **
-0.57 **
-0.04
0.44 **
-0.06 **
1.41 **
0.44
V-13013 -1.41 **
0 0
0.49
0.2
1.27 **
4.26 **
1.2 **
0.25 0.32 *
1.45 **
-0.01
2.54 **
-0.61 -1.11 **
2.13 **
0.85 *
-0.82 **
-0.07
-0.58 **
-0.03 *
1.21 **
-1.34 **
V-13241 6.69 **
0.01** -0.01
0.35
0.19
1.89 **
2.14 **
0.13 -0.5 -0.9 **
-0.55
-1.55 **
-2.86 **
0.19 -0.51
-1.17 0.05 0.02 -0.2**
-0.7 **
0.12 **
-1.26 **
0.15
V-12103 -1.15 **
0.01 0.03 **
0.77 **
0.33
1.47 **
5.22 **
0.21 0.69 *
0.34 *
1.98 **
2.19 **
0.14 1.79 **
-2.91 **
5.83 **
-1.42 **
-0.34 **
0.16*
-0.1 0.11 **
1.21 **
0.52
SE 0.4271 0.0048 0.0055 0.2538 0.3168
0.3699 0.3147
0.4534
0.3157
0.1607
0.3218
0.3843
0.6344 0.2968
0.4561
0.6603 0.4077
0.0688
0.0708
0.1340
0.0143
0.4337
0.3219
Testers
V-12056 -5.81 **
0 0
0.07 -0.07 0.6 *
-0.17 1 ** 0.34 -0.41 **
-0.29 0.75 **
2.51 **
0.45 -0.41 -0.84 0.68 *
-0.33 **
0.11* 0.49 **
0.05 **
0.79 *
-0.66 **
MILLAT-11
-0.02 **
-0.02** -0.01 **
-0.06
0.05
-0.94 **
0.03 -0.97 **
-0.05 0.03
-0.52 *
-0.45
0.31 0.99 -1.31 **
-0.97 * -0.52 0.57 **
0.07
-0.11 -0.06 **
0.38 0.93 **
CHENAB-2000
1.72 **
0 0
-0.36 *
0.06
1.46 **
-3.2 **
0.38 -0.54 *
0.8 **
0.28 -1.08 **
-0.83 -1.28 **
1.29 **
1.24 **
0.58 *
0.26 **
-0.03
-0.32 **
-0.05 **
-0.91 **
-0.49 *
ND643 -1.91 **
-0.01 -0.01 *
0.06
-0.16
-0.76 **
1.9 **
-0.7 *
-0.34 0.11
-0.49 *
1.75 **
0.14 -0.68 -1.31 **
-0.15 -0.42 -0.29 **
-0.15**
-0.15 0.01
-0.4 -0.34
V-12082 6.02 **
0.02** 0.02 **
0.29
0.12
-0.36 **
1.51 **
0.29 0.59 **
-0.53 **
1.01 **
-0.98 **
-2.13 **
0.52 1.75 **
0.73 -0.32
-0.22 **
0
0.08 0.06 **
0.14 0.55 *
SE 0.3020 0.0034 0.0039 0.1794 0.2240
0.2616 0.2225
0.3198
0.2232
0.1136
0.2276
0.2718
0.4486 0.3659
0.2463
0.4669 0.2883
0.0487
0.0500
0.0948
0.0101
0.3066
0.2276

82
Table 4.16: Estimation of General Combining Ability Effects of parents for Agronomic, Physiological and quality Traits under heat stress
Conditions
Lines
Parents CMT NDVIV
NDVIG
CTV CTG RWC PH FLA PL SL FTP DTH DTM SPS GPS TGW GYP PRO MOI STR ASH GLU TW
V-13248 -1.53 **
0
-0.04 **
-0.66 **
0.51
1.04 *
-1.94 **
-0.86 **
-0.18
0.41
1.15 **
-0.7 -1.91 **
0.44
2.95 **
-1.43
0.48
-0.43 **
-0.26 **
-0.03
-0.06 **
-1.68 **
1 **
MISR 1 5.32 **
-0.01 * 0 -0.69 **
0.35
-0.24
-3.71 **
0.54
-0.99 *
-1.39 **
0.61
1.23 * -0.51 -0.49
0.55
-3.48 **
0.16
1.07 **
0.13 0.39 *
0.01
-0.45
0.04
SW89.5277
-4.12 **
-0.01 **
-0.01 **
-0.01
0.18
-0.46
-6.63 **
-0.44
-0.84 *
0.58 *
-0.59
0.1 -1.65 **
-1.69 *
-1.12
2.76 **
1.31 **
0.72 **
0.31 **
0.27
0.04 *
0.01
0.83 *
SHAHKAR-13
1.84 **
0
0.02 **
0.21
-0.76 *
0.43
0.45 -0.59
-0.91 *
-0.36
-0.65
-1.9 **
0.42 -1.16
-0.79
0.44
-1.8 **
-0.22 **
-0.08 -0.98 **
-0.04 *
0.4
-0.69
MIRAJ-08
-1.09 * 0
-0.01 **
-0.04
-0.23
-0.29
-0.26 -1.79 **
-0.06
-0.32
-1.79 **
2.23 **
1.89 **
-0.36
-0.92
7.86 **
0.3
0.11
-0.03 -0.13
0.01
-0.9
-0.9 *
AARI-11
1.65 **
-0.02 **
-0.01 *
1.03 **
0.23
-0.57
-0.06 -0.66 *
1.33 **
0.72 **
1.35 **
-0.3 -0.18 0.17
-2.45 **
0.36
-0.86 *
0.49 **
0.04 0.27 **
0.05 *
-0.59
0.64
FAISALABAD-08
1.83 **
0.02 **
0.01 **
-0.66 **
-0.38
-1.76 **
1.58 **
-0.01
1.62 **
0.97 **
0.61
-2.97 **
2.42 **
1.11
0.81
-5.36 **
-0.24
-0.58 **
-0.03 0.71
-0.05 *
1.46 **
1.25 **
V-13013 -3.18 **
0.01 *
0.02 **
-0.27
-0.07
-0.17
4.07 **
2.39 **
1.05 *
0.1
0.88 *
0.1 1.02 -1.56 *
0.61
-0.52
1.3 **
-0.83 **
0.12 -0.05
-0.08 **
1.11 *
-1.17 **
V-13241 0.45 0.01
0.02 **
0.59 *
0.45
1.00 *
1.13 **
0.36
0.58
-0.99 **
-0.92 *
-0.17 -2.11 **
2.17 **
-2.32 **
-3.81 **
-0.12
0.01
-0.31 **
-0.31
0.06 **
-0.65
-0.9 *
V-12103 -1.17 * 0.02 **
0 0.48 *
-0.27
1.03 *
5.36 **
1.06 **
-1.59 **
0.29
-0.65
2.37 **
0.62 1.37 *
2.68 **
3.19 **
-0.55
-0.35 **
0.1 -0.14 0.05 *
1.28 *
-0.11
SE 0.5036 0.0040 0.0040 0.2375
0.2951 0.4463 0.3416
0.3031
0.4259
0.2245
0.4283
0.5777
0.5353 0.6485
0.5862 0.7551
0.4130
0.0680
0.0759
0.1845
0.0198
0.4905
0.3810
Testers
V-12056 0.01 0
0 0.25
0.66 **
0.1
-0.32 0.41
-1.12 **
-0.35 *
0.31
1.07 * 0.52 -0.49
-0.75
-2.44 **
-0.45
-0.32 **
-0.1 0.2
-0.01
0.93 **
-1.15 **
MILLAT-11
-2.17 **
-0.01 * -0.02 **
-0.55 **
-0.26
-0.94 **
-1.18 **
-0.52 *
-0.57
-0.01
-0.42
0.17 -0.41 -0.16
-0.92 *
-0.68
-0.48
0.56 **
-0.05 0.03
-0.01
0.65
-0.3
CHENAB-2000
1.53 **
0.01 *
0.01 **
-0.57 **
-0.74 **
0.91 **
-2.14 **
0.47 *
0
0.63 **
-0.42
-0.57 0.02 -0.29
1.05 * 1.11 *
0.7 *
0.21 **
0 -0.26 *
0.05 **
-1.25 **
0.82 **
ND643 -0.41 0
0 0.17
-0.24
0.6
2.17 **
-0.34
0.61 **
0.17
-0.15
0.6 0.69 -0.16
-0.19
1.79 **
-0.01
-0.27 **
0.16 **
-0.03
-0.02
-0.97 **
0.86 **
V-12082 1.03 **
0
0.01 * 0.71 **
0.57 **
-0.67 * 1.47 **
-0.02
1.08 **
-0.44 **
0.68 *
-1.27 **
-0.81 * 1.11 *
0.81
0.21
0.24
-0.18 **
-0.01 0.06
-0.02
0.65
-0.23
SE 0.3561 0.0028 0.0028 0.1679
0.2087 0.3156 0.2415
0.2143
0.3011
0.1587
0.3029
0.4085
0.3785 0.4585
0.4145 0.5339
0.2920
0.0481
0.0536
0.1305
0.0140
0.3468
0.2694
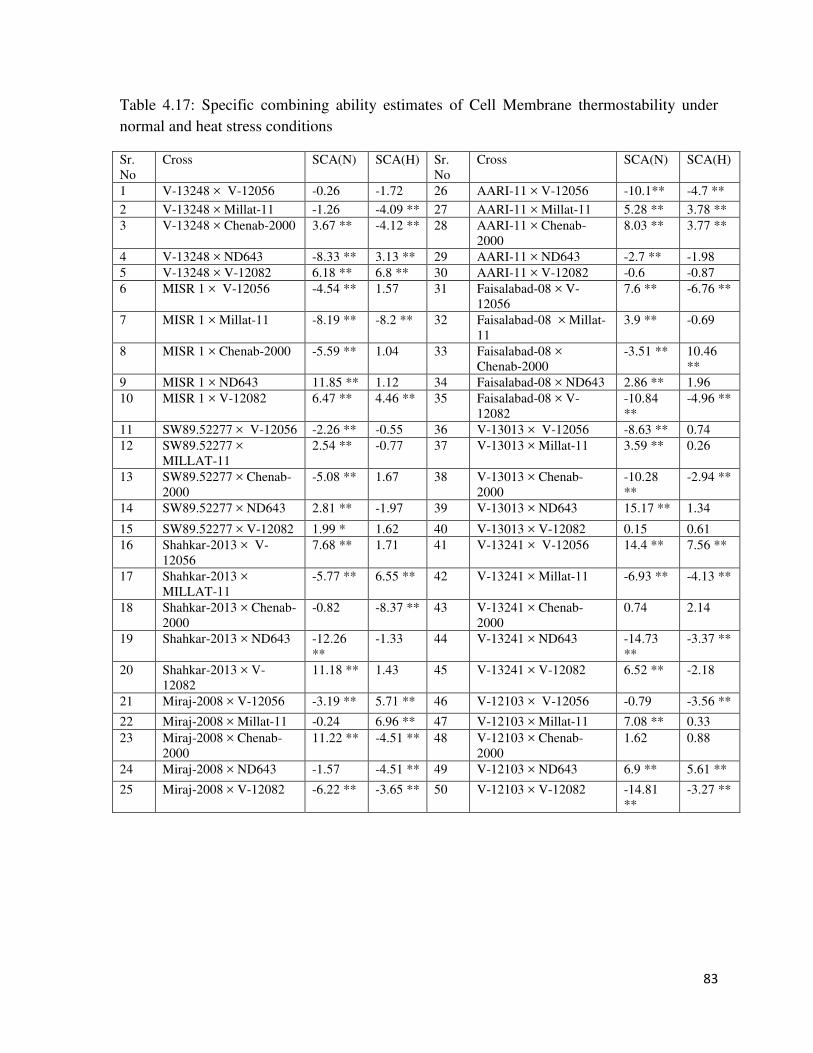
83
Table 4.17: Specific combining ability estimates of Cell Membrane thermostability under normal and heat stress conditions
Sr. No
Cross SCA(N) SCA(H) Sr. No
Cross SCA(N) SCA(H)
1 V-13248 × V-12056 -0.26 -1.72 26 AARI-11 × V-12056 -10.1** -4.7 **
2 V-13248 × Millat-11 -1.26 -4.09 ** 27 AARI-11 × Millat-11 5.28 ** 3.78 ** 3 V-13248 × Chenab-2000 3.67 ** -4.12 ** 28 AARI-11 × Chenab-
2000 8.03 ** 3.77 **
4 V-13248 × ND643 -8.33 ** 3.13 ** 29 AARI-11 × ND643 -2.7 ** -1.98 5 V-13248 × V-12082 6.18 ** 6.8 ** 30 AARI-11 × V-12082 -0.6 -0.87 6 MISR 1 × V-12056 -4.54 ** 1.57 31 Faisalabad-08 × V-
12056 7.6 ** -6.76 **
7 MISR 1 × Millat-11 -8.19 ** -8.2 ** 32 Faisalabad-08 × Millat-11
3.9 ** -0.69
8 MISR 1 × Chenab-2000 -5.59 ** 1.04 33 Faisalabad-08 × Chenab-2000
-3.51 ** 10.46 **
9 MISR 1 × ND643 11.85 ** 1.12 34 Faisalabad-08 × ND643 2.86 ** 1.96 10 MISR 1 × V-12082 6.47 ** 4.46 ** 35 Faisalabad-08 × V-
12082 -10.84 **
-4.96 **
11 SW89.52277 × V-12056 -2.26 ** -0.55 36 V-13013 × V-12056 -8.63 ** 0.74 12 SW89.52277 ×
MILLAT-11 2.54 ** -0.77 37 V-13013 × Millat-11 3.59 ** 0.26
13 SW89.52277 × Chenab-2000
-5.08 ** 1.67 38 V-13013 × Chenab-2000
-10.28 **
-2.94 **
14 SW89.52277 × ND643 2.81 ** -1.97 39 V-13013 × ND643 15.17 ** 1.34
15 SW89.52277 × V-12082 1.99 * 1.62 40 V-13013 × V-12082 0.15 0.61 16 Shahkar-2013 × V-
12056 7.68 ** 1.71 41 V-13241 × V-12056 14.4 ** 7.56 **
17 Shahkar-2013 × MILLAT-11
-5.77 ** 6.55 ** 42 V-13241 × Millat-11 -6.93 ** -4.13 **
18 Shahkar-2013 × Chenab-2000
-0.82 -8.37 ** 43 V-13241 × Chenab-2000
0.74 2.14
19 Shahkar-2013 × ND643 -12.26 **
-1.33 44 V-13241 × ND643 -14.73 **
-3.37 **
20 Shahkar-2013 × V-12082
11.18 ** 1.43 45 V-13241 × V-12082 6.52 ** -2.18
21 Miraj-2008 × V-12056 -3.19 ** 5.71 ** 46 V-12103 × V-12056 -0.79 -3.56 **
22 Miraj-2008 × Millat-11 -0.24 6.96 ** 47 V-12103 × Millat-11 7.08 ** 0.33 23 Miraj-2008 × Chenab-
2000 11.22 ** -4.51 ** 48 V-12103 × Chenab-
2000 1.62 0.88
24 Miraj-2008 × ND643 -1.57 -4.51 ** 49 V-12103 × ND643 6.9 ** 5.61 **
25 Miraj-2008 × V-12082 -6.22 ** -3.65 ** 50 V-12103 × V-12082 -14.81 **
-3.27 **

84
4.2.6. Normalized Difference Vegetation index at Vegetative Stage
NDVI tells about greenness (Plant health) of the plant. Value of normalized difference
vegetation index lies between 0 to 1. Higher value 1 indicate more green portion presence in
plants as values lower will represent lower greenness of plants while the value near to 0
express lesser or negligible portion of greenness in plant. Sultana et al., 2014 studied
relationship of chlorophyll content with green leaf biomass and grain yield prediction. In
plants, photosynthesis rate is directly proportional to green portion. Heat stress affects green
portion of plant by altering the chlorophyll contents of the plants and ultimately cause the
reduction in photosynthesis.
GCA of lines and testers for NDVIV under normal and heat stressed conditions are shown in
Table 4.15 and Table 4.16 respectively. For normalized difference vegetation index at
vegetative stage, GCA values range from -0.02 to 0.01. The highest positively significant
value shown by V-13241 (0.01) and Faisalabad-08 (0.01) under normal conditions. Rest of
all lines show no significance and undesirability for trait when we consider positive
significance for results. Under normal conditions values of GCA testers range from -0.02 to
0.02. Among testers significant positive value observed by V-12082 (0.02). Under heat
stressed conditions NDVIV show range of GCA for lines -0.01 to 0.02. Positive significant
values observed for parents Faislabad-08 (0.02), V-12103 (0.02) and V-13013 (0.01). NDVI
have direct relation with plant health so positive and significant observations required for
utilization in future breeding program. Range for testers under high temperature stress was -
0.01 to 0.01. Chenab-2000 show only positive significant result, while all others are negative
and undesirable. The range of NDVI value decreased in genotypes sown under high
temperature conditions at vegetative stage.
Specific combining ability range under normal conditions is -0.08 to 0.07. Maximum positive
and significant results shown by following crosses Shahkar-2013 × ND643 (0.07),
SW89.52277 × Chenab-2000 (0.06), MISR 1 × Chenab -2000 (0.06) and V-13241 × ND643
(0.06). Under heat stressed conditions range of SCA is -0.07 to 0.07. V-12103 × V-12056
(0.07), V-13248 × Millat-11 (0.06), Shahkar-2013 × Millat-11 (0.05) and Faisalabad-08 ×
ND643 (0.05) crosses indicated desirable significant values for this trait. Higher NDVI value
85
at vegetative growth stages corresponding booting and heading shown an excellent and good
indicator for plant health before entering into the reproductive stage (Table 4.18).
Higher estimates of specific combing ability to general combing ability represent dominance
variation for this trait under normal and heat stressed conditions. Parents with lesser
magnitude of GCA effects have potential of exploitation via hybrid breeding in greater
general combiner.
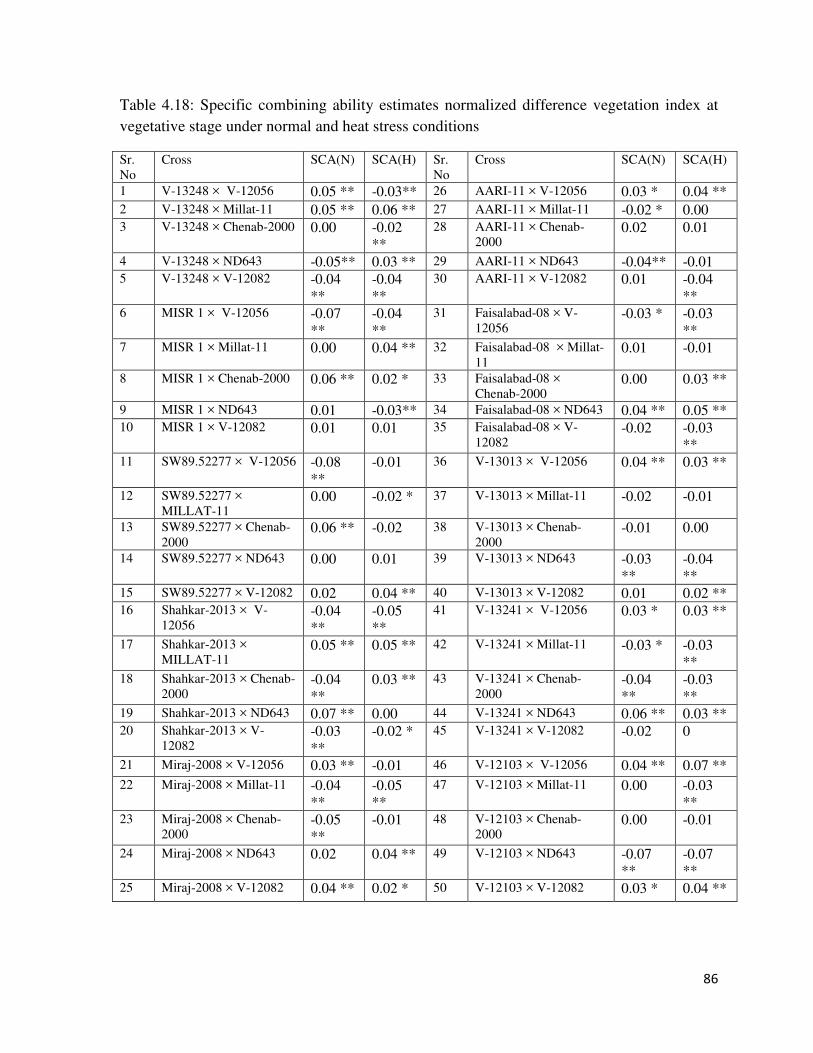
86
Table 4.18: Specific combining ability estimates normalized difference vegetation index at vegetative stage under normal and heat stress conditions
Sr. No
Cross SCA(N) SCA(H) Sr. No
Cross SCA(N) SCA(H)
1 V-13248 × V-12056 0.05 ** -0.03** 26 AARI-11 × V-12056 0.03 * 0.04 ** 2 V-13248 × Millat-11 0.05 ** 0.06 ** 27 AARI-11 × Millat-11 -0.02 * 0.00 3 V-13248 × Chenab-2000 0.00 -0.02
** 28 AARI-11 × Chenab-
2000 0.02 0.01
4 V-13248 × ND643 -0.05** 0.03 ** 29 AARI-11 × ND643 -0.04** -0.01 5 V-13248 × V-12082 -0.04
** -0.04 **
30 AARI-11 × V-12082 0.01 -0.04 **
6 MISR 1 × V-12056 -0.07 **
-0.04 **
31 Faisalabad-08 × V-12056
-0.03 * -0.03 **
7 MISR 1 × Millat-11 0.00 0.04 ** 32 Faisalabad-08 × Millat-11
0.01 -0.01
8 MISR 1 × Chenab-2000 0.06 ** 0.02 * 33 Faisalabad-08 × Chenab-2000
0.00 0.03 **
9 MISR 1 × ND643 0.01 -0.03** 34 Faisalabad-08 × ND643 0.04 ** 0.05 ** 10 MISR 1 × V-12082 0.01 0.01 35 Faisalabad-08 × V-
12082 -0.02 -0.03
** 11 SW89.52277 × V-12056 -0.08
** -0.01 36 V-13013 × V-12056 0.04 ** 0.03 **
12 SW89.52277 × MILLAT-11
0.00 -0.02 * 37 V-13013 × Millat-11 -0.02 -0.01
13 SW89.52277 × Chenab-2000
0.06 ** -0.02 38 V-13013 × Chenab-2000
-0.01 0.00
14 SW89.52277 × ND643 0.00 0.01 39 V-13013 × ND643 -0.03 **
-0.04 **
15 SW89.52277 × V-12082 0.02 0.04 ** 40 V-13013 × V-12082 0.01 0.02 ** 16 Shahkar-2013 × V-
12056 -0.04 **
-0.05 **
41 V-13241 × V-12056 0.03 * 0.03 **
17 Shahkar-2013 × MILLAT-11
0.05 ** 0.05 ** 42 V-13241 × Millat-11 -0.03 * -0.03 **
18 Shahkar-2013 × Chenab-2000
-0.04 **
0.03 ** 43 V-13241 × Chenab-2000
-0.04 **
-0.03 **
19 Shahkar-2013 × ND643 0.07 ** 0.00 44 V-13241 × ND643 0.06 ** 0.03 ** 20 Shahkar-2013 × V-
12082 -0.03 **
-0.02 * 45 V-13241 × V-12082 -0.02 0
21 Miraj-2008 × V-12056 0.03 ** -0.01 46 V-12103 × V-12056 0.04 ** 0.07 ** 22 Miraj-2008 × Millat-11 -0.04
** -0.05 **
47 V-12103 × Millat-11 0.00 -0.03 **
23 Miraj-2008 × Chenab-2000
-0.05 **
-0.01 48 V-12103 × Chenab-2000
0.00 -0.01
24 Miraj-2008 × ND643 0.02 0.04 ** 49 V-12103 × ND643 -0.07 **
-0.07 **
25 Miraj-2008 × V-12082 0.04 ** 0.02 * 50 V-12103 × V-12082 0.03 * 0.04 **

87
4.2.7. Normalized Difference Vegetation index at Grain Filling Stage
NDVI calculated with use of wavelengths in the NIR (near infrared) and VIS (visible)
regions of the electromagnetic spectrum. NDVI narrates to the chlorophyll content due to
absorption features of the cells, and hence measure the photosynthetic capacity of the plant.
Normalized difference vegetation index higher value results more stay greenness of plants
during grain filling proved the yield superiority under both abiotic and biotic stress (Lopes
and Reynolds, 2012) and also under biotic stress (Farooq et al., 2011).
Significant results needed for normalized difference vegetation index at grain filling stage so
only positive significant results were desirable all others are undesirable as they exhibits non-
significant and negative values. Under normal conditions range for general combing ability
varies from -0.03 to 0.03. Parents with positive significant values are V-12103 (0.03), V-
13248 (0.02), MISR 1 (0.01) and SW89.5277 (0.01) rest of all show non- significant and
negative values for lines. Range for tester -0.01 to 0.02. Among testers V-12082 (0.02) show
positive significant values rest of all show undesirable results for NDVIG as they show
negative or non-significance for this trait (Table 4.15). Under heat stress environment GCA
ranges from -0.04 to 0.02. Lines with positive significant results are Shahkar-13 (0.02), V-
13013 (0.02), V-13241 (0.02) and Faisalabad-08 (0.01). All other lines are undesirable
results as they have non- significant or negative observations. Testers show range of variation
from -0.02 to 0.01. Positive significant values are Chenab-2000 (0.01) and V-12082. All
other testers show negative and non-significant results (Table 4.16).
SCA under normal conditions NDVIG show range of observations -0.08 to 0.06 that have
both negative to positive values. Higher positive significant values shown by different
crosses for NDVIG were observed for MISR 1 × ND643 (0.06), MISR 1 × Millat-11 (0.05),
Miraj-2008 × Millat-11 (0.05) and V-13241 × V-12082 (0.05). Heat stressed environment
show range of results from -0.07 to 0.05. V-13248 × Millat-11 (0.05), SW89.52277 × V-
12082 (0.05), Shahkar-2013 × Millat-11 (0.05) and MISR 1 × V-12082 (0.04) (Table 4.19).
Genotypes that have ability to stay green more during the stage of grain filling under heat
stress improve grain yield by increase of grain filling duration so, efficiently use of this trait
as selection parameter in the breeding of genotypes against heat tolerant would be very
effective. Nawaz et al. (2013) also have similar findings for this trait. Among genotypes used

88
in this study also represent vide range of genetic variability and grown under both normal
and heat stressed conditions and resulted that some yield or its yield components cause
reduction but general performance of plant was remain better as reported by Al-Khatib and
Paulsen (1984); Barnaba´s et al., (2007).
As our results show non-additive, type of gene action as more magnitude of SCA then GCA
for both normal and heat stressed environments, this trait goes toward dominance gene
action. Variance due to SCA was greater than GCA for the character indicating the
importance of non-additive gene action for this trait.
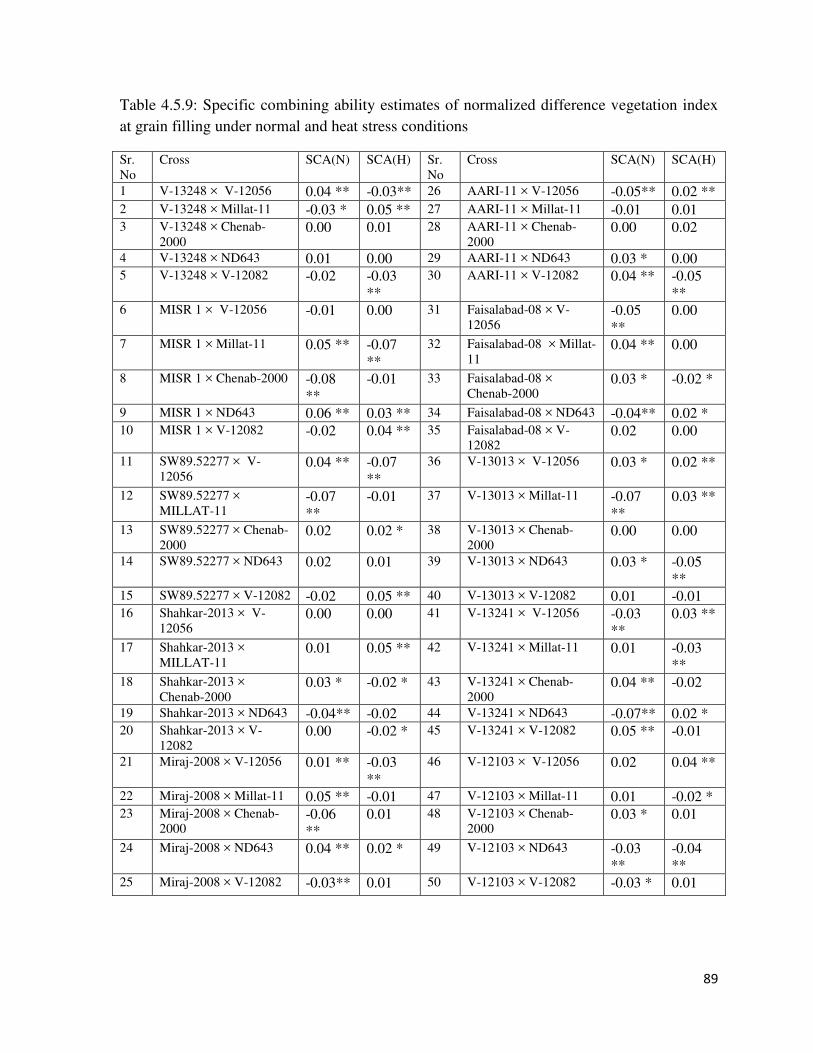
89
Table 4.5.9: Specific combining ability estimates of normalized difference vegetation index at grain filling under normal and heat stress conditions
Sr. No
Cross SCA(N) SCA(H) Sr. No
Cross SCA(N) SCA(H)
1 V-13248 × V-12056 0.04 ** -0.03** 26 AARI-11 × V-12056 -0.05** 0.02 ** 2 V-13248 × Millat-11 -0.03 * 0.05 ** 27 AARI-11 × Millat-11 -0.01 0.01 3 V-13248 × Chenab-
2000 0.00 0.01 28 AARI-11 × Chenab-
2000 0.00 0.02
4 V-13248 × ND643 0.01 0.00 29 AARI-11 × ND643 0.03 * 0.00 5 V-13248 × V-12082 -0.02 -0.03
** 30 AARI-11 × V-12082 0.04 ** -0.05
** 6 MISR 1 × V-12056 -0.01 0.00 31 Faisalabad-08 × V-
12056 -0.05 **
0.00
7 MISR 1 × Millat-11 0.05 ** -0.07 **
32 Faisalabad-08 × Millat-11
0.04 ** 0.00
8 MISR 1 × Chenab-2000 -0.08 **
-0.01 33 Faisalabad-08 × Chenab-2000
0.03 * -0.02 *
9 MISR 1 × ND643 0.06 ** 0.03 ** 34 Faisalabad-08 × ND643 -0.04** 0.02 * 10 MISR 1 × V-12082 -0.02 0.04 ** 35 Faisalabad-08 × V-
12082 0.02 0.00
11 SW89.52277 × V-12056
0.04 ** -0.07 **
36 V-13013 × V-12056 0.03 * 0.02 **
12 SW89.52277 × MILLAT-11
-0.07 **
-0.01 37 V-13013 × Millat-11 -0.07 **
0.03 **
13 SW89.52277 × Chenab-2000
0.02 0.02 * 38 V-13013 × Chenab-2000
0.00 0.00
14 SW89.52277 × ND643 0.02 0.01 39 V-13013 × ND643 0.03 * -0.05 **
15 SW89.52277 × V-12082 -0.02 0.05 ** 40 V-13013 × V-12082 0.01 -0.01 16 Shahkar-2013 × V-
12056 0.00 0.00 41 V-13241 × V-12056 -0.03
** 0.03 **
17 Shahkar-2013 × MILLAT-11
0.01 0.05 ** 42 V-13241 × Millat-11 0.01 -0.03 **
18 Shahkar-2013 × Chenab-2000
0.03 * -0.02 * 43 V-13241 × Chenab-2000
0.04 ** -0.02
19 Shahkar-2013 × ND643 -0.04** -0.02 44 V-13241 × ND643 -0.07** 0.02 * 20 Shahkar-2013 × V-
12082 0.00 -0.02 * 45 V-13241 × V-12082 0.05 ** -0.01
21 Miraj-2008 × V-12056 0.01 ** -0.03 **
46 V-12103 × V-12056 0.02 0.04 **
22 Miraj-2008 × Millat-11 0.05 ** -0.01 47 V-12103 × Millat-11 0.01 -0.02 * 23 Miraj-2008 × Chenab-
2000 -0.06 **
0.01 48 V-12103 × Chenab-2000
0.03 * 0.01
24 Miraj-2008 × ND643 0.04 ** 0.02 * 49 V-12103 × ND643 -0.03 **
-0.04 **
25 Miraj-2008 × V-12082 -0.03** 0.01 50 V-12103 × V-12082 -0.03 * 0.01

90
4.2.8. Canopy temperature at vegetative stages
Canopy temperature is most important parameter for determination against heat stress in
wheat plant. During heat stress conditions, wheat plant maintains transpiration from the plant
canopy due to this the crop canopy becomes cooler. If there is more transpiration, plant
canopies become cooler.
General combining ability of CTV values for lines under normal conditions ranged from -
0.73 to 0.77. Highest positive significant value was observed for V-12103 (0.77) whereas
negatively significant MISR1 (-0.73). Tester show the range of -0.36 to 0.29. Among testers
only negative significant value represented by Chenab-2000 (-0.36) (Table 4.15). Rest all
other testers show no significance for this trait. Under heat stress, conditions maximum
variation is present with range of -0.69 to 1.03. Higher positive and significant value for lines
exhibited by AARI-11 (1.03) followed by V-13241 (0.59) and V-12103 (0.48). Highest
negative significant value represented by MISR-1 (-0.69). For testers range is -0.57 to 0.71.
Highest positively significant value exhibited by V-12082 (0.71) and highest significant
negative value exhibited by Chenab-2000 (-0.57) (Table 4.16).
Specific combining ability effects were estimated for both normal and heat stressed
environments and shown in table 4.5.10. Under normal conditions for CTV ranges from -
2.27 to 2.17. Highest positive and significant values exhibited by crosses: V-13248 × V-
12056 (2.17) followed by crosses MISR 1 × Chenab-2000 (2.10), MISR 1 × V-12056 (2.05).
Negative and significant values showed by SW89.52277 × V-12056 (-2.15) followed by
MISR 1 × ND643 (-1.94) and V-13241 × V-12056 (-1.87). Under heat stress, conditions
range for specific combining ability of CTV was -2.22 to 2.25. Highest positively significant
value was observed for V-12103 × Millat-11 (2.25), followed by Miraj-2008 × ND643 (2.08)
and V-13248 × V-12056 (1.82). Maximum negatively significant values were observed by
crosses, V-12103 × V-12056 (-2.22), MISR 1 × ND643 (-2.17) and V-13013 × Millat-11 (-
1.97) as depicted in Table 4.20.
From these results, it was suggested that non-additive type of gene action observed from
canopy temperature. Higher estimates of specific combing ability to general combing ability
represent dominance variation for this trait. Our results show accordance with Pierre et al.,
91
(2010) found non-additive kind of results while working on wheat under diverse (both
normal and heat stressed) environmental conditions.
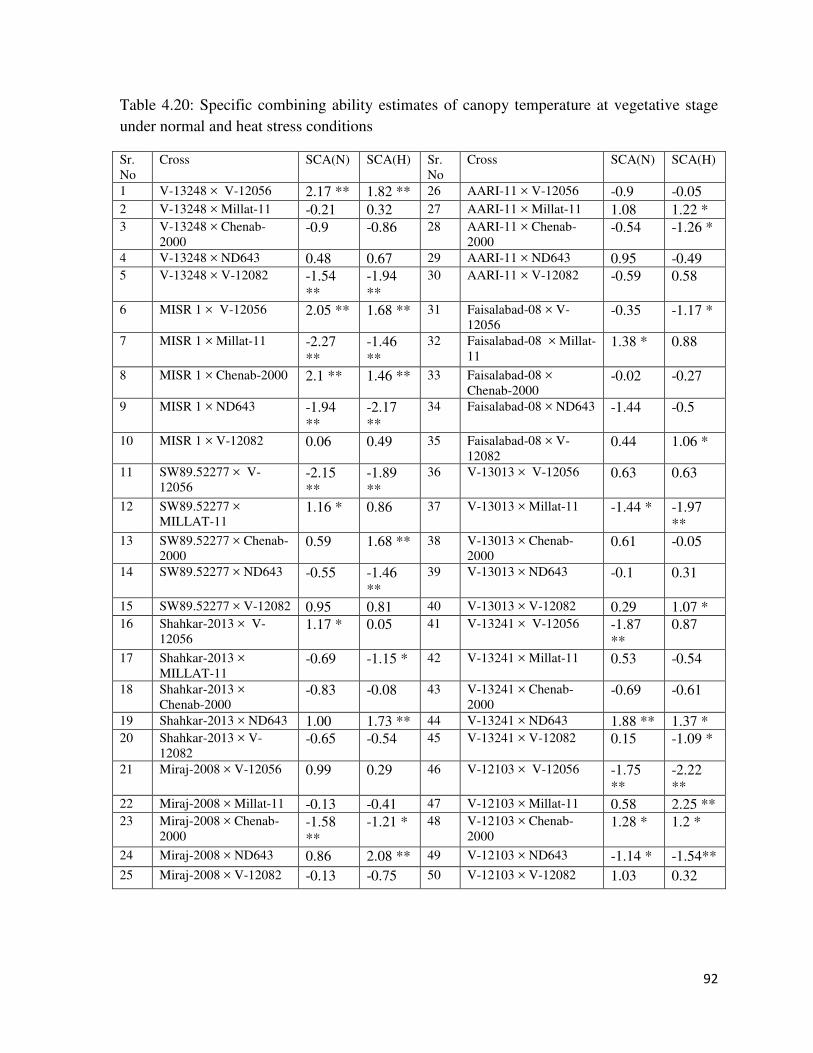
92
Table 4.20: Specific combining ability estimates of canopy temperature at vegetative stage under normal and heat stress conditions
Sr. No
Cross SCA(N) SCA(H) Sr. No
Cross SCA(N) SCA(H)
1 V-13248 × V-12056 2.17 ** 1.82 ** 26 AARI-11 × V-12056 -0.9 -0.05 2 V-13248 × Millat-11 -0.21 0.32 27 AARI-11 × Millat-11 1.08 1.22 * 3 V-13248 × Chenab-
2000 -0.9 -0.86 28 AARI-11 × Chenab-
2000 -0.54 -1.26 *
4 V-13248 × ND643 0.48 0.67 29 AARI-11 × ND643 0.95 -0.49 5 V-13248 × V-12082 -1.54
** -1.94 **
30 AARI-11 × V-12082 -0.59 0.58
6 MISR 1 × V-12056 2.05 ** 1.68 ** 31 Faisalabad-08 × V-12056
-0.35 -1.17 *
7 MISR 1 × Millat-11 -2.27 **
-1.46 **
32 Faisalabad-08 × Millat-11
1.38 * 0.88
8 MISR 1 × Chenab-2000 2.1 ** 1.46 ** 33 Faisalabad-08 × Chenab-2000
-0.02 -0.27
9 MISR 1 × ND643 -1.94 **
-2.17 **
34 Faisalabad-08 × ND643 -1.44 -0.5
10 MISR 1 × V-12082 0.06 0.49 35 Faisalabad-08 × V-12082
0.44 1.06 *
11 SW89.52277 × V-12056
-2.15 **
-1.89 **
36 V-13013 × V-12056 0.63 0.63
12 SW89.52277 × MILLAT-11
1.16 * 0.86 37 V-13013 × Millat-11 -1.44 * -1.97 **
13 SW89.52277 × Chenab-2000
0.59 1.68 ** 38 V-13013 × Chenab-2000
0.61 -0.05
14 SW89.52277 × ND643 -0.55 -1.46 **
39 V-13013 × ND643 -0.1 0.31
15 SW89.52277 × V-12082 0.95 0.81 40 V-13013 × V-12082 0.29 1.07 * 16 Shahkar-2013 × V-
12056 1.17 * 0.05 41 V-13241 × V-12056 -1.87
** 0.87
17 Shahkar-2013 × MILLAT-11
-0.69 -1.15 * 42 V-13241 × Millat-11 0.53 -0.54
18 Shahkar-2013 × Chenab-2000
-0.83 -0.08 43 V-13241 × Chenab-2000
-0.69 -0.61
19 Shahkar-2013 × ND643 1.00 1.73 ** 44 V-13241 × ND643 1.88 ** 1.37 * 20 Shahkar-2013 × V-
12082 -0.65 -0.54 45 V-13241 × V-12082 0.15 -1.09 *
21 Miraj-2008 × V-12056 0.99 0.29 46 V-12103 × V-12056 -1.75 **
-2.22 **
22 Miraj-2008 × Millat-11 -0.13 -0.41 47 V-12103 × Millat-11 0.58 2.25 ** 23 Miraj-2008 × Chenab-
2000 -1.58 **
-1.21 * 48 V-12103 × Chenab-2000
1.28 * 1.2 *
24 Miraj-2008 × ND643 0.86 2.08 ** 49 V-12103 × ND643 -1.14 * -1.54** 25 Miraj-2008 × V-12082 -0.13 -0.75 50 V-12103 × V-12082 1.03 0.32
93
4.2.9. Canopy Temperature at grain filling stage
For wheat crop, most critical and economical stage for grain yield is grain-filling stage. Grain
filling stage significantly affected by canopy temperature of crop positive significant results
are desirable. If at the time of grain filling, canopy temperature is high so it will affect the
quality as well as quantity of wheat grains. Wheat canopy temperature increases at the time
of grain filling due to more heat stress and dryness of environment with respect to leaves.
Crop canopy temperature that measures the whole canopy temperature. For checking of
difference of canopy temperature, we have investigated at two diverse stages. First at
vegetative and then at grain filling stage. Analysis showed significant results for genotypes
for parents and crosses at both stages.
Genotypes exhibited a range of variation for GCA under normal conditions. It was -0.45 to
0.56 with no significant value of GCA. Testers showed range of values from -16 to 12 with
no significant results. Range of lines for CTG under heat stress was -0.76 to 0.51 (Table
4.15). The results showed Shahkar-13 have negative significance value of -0.73 while all
other lines were having non-significant GCA values. Range of testers for CTG under heat
stressed conditions showed -0.74 to 0.66. Highest positive significant value was observed in
V-12056 (0.66) followed by V-12082 (0.57). Highest negative significant value was
observed in Chenab-2000 (-0.74) (Table 4.16).
SCA show range of values from -1.51 to 2.10 under normal climatic conditions (Table
4.5.11). Highest positive significant value was observed in V-13248 × V-12056 (2.10)
followed by Shahkar-2013 × V-12056 (1.71) and SW89.52277 × V-12082 (1.54). Negative
significant value was recorded as AARI-11 × Chenab-2000 (-1.51) and Faisalabad-08 × V-
12056 (-1.43). More variation is present for potential of transpiration among genotypes.
Selection procedure can be affected with small difference in the crop canopy temperature. In
wheat mostly two stages ate very critical with respect to yield view point. Among them first
stage is from vegetative to anthesis and second is grain filling stage. In these two growth and
developmental stages of wheat, the canopy of the plant should be cool that can help
transpiration. Ultimately yield of the plant will not be affected. Range of lines for CTG under
heat stress conditions was -2.21 to 2.41. Highest positive significant value was observed in
V-13241 × ND643 (2.41) followed by V-12103 × Chenab-2000 (1.70) and V-13013 ×
94
ND643 (1.64). Negative significant value was recorded as V-12103 × V-12056 (-2.21) and
V-13248 × V-12082 (-2.16) (Table 4.21). From genotypes under study, some showed
maximum canopy temperature at vegetative stage and some showed high canopy temperature
at grain filling stage because of rapid leaves loss. High temperature stress greatly affects
canopy temperature. Temperature of the whole canopy of the crop plant that also involve
leaves and stem is the canopy temperature for canopy temperature determination.
Higher estimates of specific combing ability to general combing ability represent dominance
variation for this trait under normal and heat stressed conditions. Pierre et al., (2010) found
similar kind of non-additive results while working on wheat under diverse environmental
conditions.

95
Table 4.5.11: Specific combining ability estimates of canopy temperature at grain filling stage under normal and heat stress conditions
Sr. No
Cross SCA(N) SCA(H) Sr. No
Cross SCA(N) SCA(H)
1 V-13248 × V-12056 2.10 ** 1.33 * 26 AARI-11 × V-12056 -0.39 0.41 2 V-13248 × Millat-11 -0.6 0.83 27 AARI-11 × Millat-11 0.83 -0.59 3 V-13248 × Chenab-
2000 -0.02 -0.85 28 AARI-11 × Chenab-
2000 -1.51 * -0.77
4 V-13248 × ND643 -0.27 0.84 29 AARI-11 × ND643 0.68 -0.29 5 V-13248 × V-12082 -1.2 -2.16
** 30 AARI-11 × V-12082 0.4 1.23
6 MISR 1 × V-12056 0.55 -0.24 31 Faisalabad-08 × V-12056
-1.43 * -0.33
7 MISR 1 × Millat-11 0.06 -1.15 32 Faisalabad-08 × Millat-11
1.33 0.96
8 MISR 1 × Chenab-2000 0.13 1.46 * 33 Faisalabad-08 × Chenab-2000
-0.12 -0.26
9 MISR 1 × ND643 -0.2 -1.21 34 Faisalabad-08 × ND643 0.18 -0.33 10 MISR 1 × V-12082 -0.54 1.13 35 Faisalabad-08 × V-
12082 0.04 -0.04
11 SW89.52277 × V-12056
-1.22 -0.98 36 V-13013 × V-12056 0.07 0.5
12 SW89.52277 × MILLAT-11
-0.04 1.22 37 V-13013 × Millat-11 -1.03 -1.45 *
13 SW89.52277 × Chenab-2000
0.58 1.31 * 38 V-13013 × Chenab-2000
0.85 -0.81
14 SW89.52277 × ND643 -0.86 -1.4 * 39 V-13013 × ND643 0.13 1.64 * 15 SW89.52277 × V-12082 1.54 * -0.15 40 V-13013 × V-12082 -0.02 0.12 16 Shahkar-2013 × V-
12056 1.71 * 1.09 41 V-13241 × V-12056 -1.18 0.17
17 Shahkar-2013 × MILLAT-11
-0.34 -1.03 42 V-13241 × Millat-11 -0.18 -1.28
18 Shahkar-2013 × Chenab-2000
-1.01 0.79 43 V-13241 × Chenab-2000
0.85 -1.5 **
19 Shahkar-2013 × ND643 0.71 -1.07 44 V-13241 × ND643 0.8 2.41 ** 20 Shahkar-2013 × V-
12082 -1.07 0.22 45 V-13241 × V-12082 -0.29 0.2
21 Miraj-2008 × V-12056 0.13 0.24 46 V-12103 × V-12056 -0.32 -2.21 * 22 Miraj-2008 × Millat-11 -0.18 0.87 47 V-12103 × Millat-11 0.15 1.63 * 23 Miraj-2008 × Chenab-
2000 -0.29 -1.09 48 V-12103 × Chenab-
2000 0.54 1.7 *
24 Miraj-2008 × ND643 0.08 -0.69 49 V-12103 × ND643 -1.24 0.1 25 Miraj-2008 × V-12082 0.27 0.68 50 V-12103 × V-12082 0.88 -1.22

96
4.2.10. Relative water content
Positive significant effects are desired for relative water contents while negative and non-
significant values are undesired for this trait. Range of GCA for RWC was noted as -2.47 to
1.89. Highest positive significant values were observed by V-13241 (1.89), V-12103 (1.47),
V-13248 (1.33) and V-13013 (1.27). Testers showed the range of -0.94 to 1.46 for GCA
(Table 4.5.5). Highest positive value was observed by Chenab-2000 (1.46) and V-12056
(0.60) as shown in table 4.15. Rest of all show undesirability for this trait. Under heat, stress
conditions GCA effects of RWC showed the range of -1.76 to 1.04. Highest positive
significant values were by V-13248 (1.04), V-12103 (1.03) followed by V-13241 (1.00).
Testers showed the range of -0.94 to 0.91 (Table 4.16). Highest positive value was observed
by Chenab-2000 (0.91) while rest all showed undesirability for RWC. Result for this trait
show accordance with work of previous scientists (Dhanda and Sethi, 1998; Mather and
Jinks, 1982; Rebetzke et al., 2003; Farshadfar et al., 2001; Farshadfar et al., 2013; Ijaz et al.,
2013) whereas in literature some conflicting results reported (Golparvar et al., 2006; Kumar
and Sharma, 2007).
Range of SCA for RWC is -5.93 to 5.69. Highest positive significant values were for V-
13248 × MILLAT-1 (5.69), SW89.52277 × Millat-11 (5.02), SW89.52277 × ND643 (4.90)
and V-13241 × V-12056 (3.36). Some researchers reported similar findings for SCA (Farooq
and Azam, 2006 and Ghobadi et al., 2011) whereas some dissimilar kind od results as
concluded by Rahman et al., 2000. SCA under heat stress conditions for RWC showed
effects range of -5.60 to 6.60. Highest positive significant values were observed in
SW89.52277 × Millat-11 (6.60), Faisalabad-08 × V-12056 (4.38), V-13241 × Millat-11
(4.14) and MISR 1 × V-12082 (3.77).
As our results show more magnitude of SCA then GCA for both environments this trait goes
toward non-additive type of gene action. From our results, it was concluded that dominance
gene action for relative water content as results were also reported in literature by Golparvar
et al., (2006); Kumar and Sharma, (2007).

97
Table 4.22: Specific combining ability estimates of relative water contents under normal and heat stress conditions
Sr. No
Cross SCA(N) SCA(H) Sr. No
Cross SCA(N) SCA(H)
1 V-13248 × V-12056 -1.89 * 1.94 26 AARI-11 × V-12056 -0.49 -2.17** 2 V-13248 × Millat-11 5.69 ** -0.05 27 AARI-11 × Millat-11 -0.36 -2.4 ** 3 V-13248 × Chenab-2000 1.48 -1.05 28 AARI-11 × Chenab-
2000 0.91 3.56 **
4 V-13248 × ND643 -0.34 0.81 29 AARI-11 × ND643 -2.50 **
0.49
5 V-13248 × V-12082 -4.95 **
-1.64 30 AARI-11 × V-12082 2.44 ** 0.51
6 MISR 1 × V-12056 1.77 * -1.5 31 Faisalabad-08 × V-12056
3.32 ** 4.38 **
7 MISR 1 × Millat-11 -4.96 **
-5.1 ** 32 Faisalabad-08 × Millat-11
-2.82 **
-3.64 **
8 MISR 1 × Chenab-2000 1.37 -0.34 33 Faisalabad-08 × Chenab-2000
2.6 ** 1.66
9 MISR 1 × ND643 2.82 ** 3.16 ** 34 Faisalabad-08 × ND643 -5.93 **
-5.17 **
10 MISR 1 × V-12082 -1.01 3.77 ** 35 Faisalabad-08 × V-12082
2.83 ** 2.76 **
11 SW89.52277 × V-12056
-5.33 **
-3.56 **
36 V-13013 × V-12056 -2.8 ** -2.22 **
12 SW89.52277 × MILLAT-11
5.02 ** 6.6 ** 37 V-13013 × Millat-11 2.86 ** 1.89
13 SW89.52277 × Chenab-2000
-1.23 0.92 38 V-13013 × Chenab-2000
-0.51 -1.95
14 SW89.52277 × ND643 4.9 ** 1.64 39 V-13013 × ND643 -1.08 1.29 15 SW89.52277 × V-12082 -3.37
** -5.6 ** 40 V-13013 × V-12082 1.53 1.00
16 Shahkar-2013 × V-12056
0.2 0.37 41 V-13241 × V-12056 3.36 ** -0.34
17 Shahkar-2013 × MILLAT-11
1.67 ** 1.74 42 V-13241 × Millat-11 -0.86 4.14 **
18 Shahkar-2013 × Chenab-2000
-1.46 -1.12 43 V-13241 × Chenab-2000
-3.33 **
1.69
19 Shahkar-2013 × ND643 -1.29 -0.13 44 V-13241 × ND643 0.66 -1.54 20 Shahkar-2013 × V-
12082 0.88 -0.86 45 V-13241 × V-12082 0.17 -3.94
** 21 Miraj-2008 × V-12056 -0.81 -0.16 46 V-12103 × V-12056 2.66 ** 3.27 ** 22 Miraj-2008 × Millat-11 -3.02** -0.72 47 V-12103 × Millat-11 -3.24** -2.46** 23 Miraj-2008 × Chenab-
2000 -1.00 -2.74
** 48 V-12103 × Chenab-
2000 1.17 -0.63
24 Miraj-2008 × ND643 3.35 ** 0.96 49 V-12103 × ND643 -0.59 -1.51 25 Miraj-2008 × V-12082 1.48 2.66 ** 50 V-12103 × V-12082 -0.01 1.33

98
4.2.11. Plant Height
Negative significant GCA effects are desirable for plant height because in case of selection in
segregating generations, importance was given to short stature plants, as these were more
lodging tolerance. GCA range under normal conditions for this trait from -5.70 to 5.22.
Negative significant values observed in SW89.5277 (-5.70), AARI-11 (-3.00) and MISR 1 (-
1.70) while rest all other lines show positive or non-significant values for this trait. From
testers range is -3.20 to 1.51 (Table 4.15). Negative significant results observed by Chenab-
2000 (-3.20). Under heat, stressed conditions range of GCA for lines was -6.63 to 5.36.
Negative significant values were desired and observed by SW89.5277 (-6.63), MISR 1 (-
3.71) and V-13248 (-1.94). For testers range of GCA -2.14 to 2.17. Chenab-2000 (-2.41) and
Millat-11 (-1.18) showed negative and significant effects rest all others are positive or non-
significant (Table 4.5.13) (Table 4.16). From results, it was interpreted that among lines,
MISR1 and SW89.5277 show efficient results under normal as well as heat stressed
environments while in case of testers Chenab-2000 show good results in both environments.
Our findings show similarity with results of khan et al., (2007) and Kapoor et al., (2011).
Range of SCA was -13.36 to 12.61 with SE of 0.7038 under normal conditions. The highest
negative significant effects were observed in cross V-13241 × Millat-11 (-13.36) followed by
V-13248 × V-12082 (-7.19). For positive values AARI-11 × Chenab-2000 (12.61) show
highest significant results. Meena and Sastry (2003) and Jag et al., (2003) have also reported
positive SCA effects for plant height and spikes per plant. Heat stress affects plant height that
mainly causes the change in turgor pressure when the turgor pressure is not normal, cells are
unable to divide because low number of cells divide which results in reduced plant height.
Under heat stressed conditions SCA ranged from -13.65 to 11.63. Highest positive significant
effect was observed in cross Faisalabad-08 × V-12056 (11.63). Highest negative significant
values observed in V-13241 × Millat-11 (-13.65) and AARI-11 × V-12082 (-13.43) as
described in Table 4.5.13. Findings from this study showed contradiction with results of
Garjanovic and Balalic (2005), Garjanovic at al (2007) and Yao et al., (2004) while the
earlier finding of Singh and Singh (2003) and Chowdhry et al., (2005). Sheikh and Singh
(2000) and Noorka and Saba (2015).supported our results
99
Higher estimates of SCA than GCA represent dominance type of gene action for this trait in
normal as well as heat stress conditions. As our results show dominance variance, possess
higher estimations then additive variance that show non-additive behavior for plant height.
Ours results show accordance with the findings of Borghi and Perenzin (1994), Mishra et al.
(1994) and Chowdhry et al. (2005) as they also find non-additive gene action for plant
height. However, additive genetic effects were observed that observed and show
contradiction with our results observed by Chowdhry and Ahmed, (1990); Rajara and
Maheshwari, (1996).
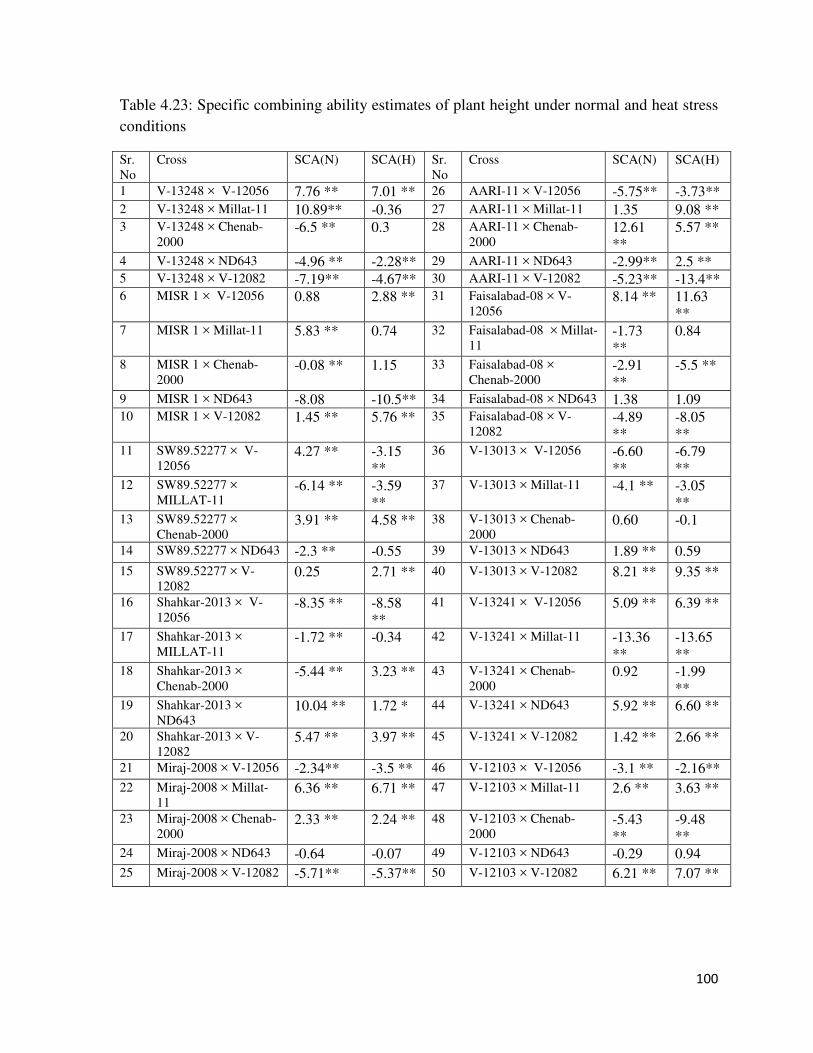
100
Table 4.23: Specific combining ability estimates of plant height under normal and heat stress conditions
Sr. No
Cross SCA(N) SCA(H) Sr. No
Cross SCA(N) SCA(H)
1 V-13248 × V-12056 7.76 ** 7.01 ** 26 AARI-11 × V-12056 -5.75** -3.73** 2 V-13248 × Millat-11 10.89** -0.36 27 AARI-11 × Millat-11 1.35 9.08 ** 3 V-13248 × Chenab-
2000 -6.5 ** 0.3 28 AARI-11 × Chenab-
2000 12.61 **
5.57 **
4 V-13248 × ND643 -4.96 ** -2.28** 29 AARI-11 × ND643 -2.99** 2.5 ** 5 V-13248 × V-12082 -7.19** -4.67** 30 AARI-11 × V-12082 -5.23** -13.4** 6 MISR 1 × V-12056 0.88 2.88 ** 31 Faisalabad-08 × V-
12056 8.14 ** 11.63
** 7 MISR 1 × Millat-11 5.83 ** 0.74 32 Faisalabad-08 × Millat-
11 -1.73 **
0.84
8 MISR 1 × Chenab-2000
-0.08 ** 1.15 33 Faisalabad-08 × Chenab-2000
-2.91 **
-5.5 **
9 MISR 1 × ND643 -8.08 -10.5** 34 Faisalabad-08 × ND643 1.38 1.09 10 MISR 1 × V-12082 1.45 ** 5.76 ** 35 Faisalabad-08 × V-
12082 -4.89 **
-8.05 **
11 SW89.52277 × V-12056
4.27 ** -3.15 **
36 V-13013 × V-12056 -6.60 **
-6.79 **
12 SW89.52277 × MILLAT-11
-6.14 ** -3.59 **
37 V-13013 × Millat-11 -4.1 ** -3.05 **
13 SW89.52277 × Chenab-2000
3.91 ** 4.58 ** 38 V-13013 × Chenab-2000
0.60 -0.1
14 SW89.52277 × ND643 -2.3 ** -0.55 39 V-13013 × ND643 1.89 ** 0.59 15 SW89.52277 × V-
12082 0.25 2.71 ** 40 V-13013 × V-12082 8.21 ** 9.35 **
16 Shahkar-2013 × V-12056
-8.35 ** -8.58 **
41 V-13241 × V-12056 5.09 ** 6.39 **
17 Shahkar-2013 × MILLAT-11
-1.72 ** -0.34 42 V-13241 × Millat-11 -13.36 **
-13.65 **
18 Shahkar-2013 × Chenab-2000
-5.44 ** 3.23 ** 43 V-13241 × Chenab-2000
0.92 -1.99 **
19 Shahkar-2013 × ND643
10.04 ** 1.72 * 44 V-13241 × ND643 5.92 ** 6.60 **
20 Shahkar-2013 × V-12082
5.47 ** 3.97 ** 45 V-13241 × V-12082 1.42 ** 2.66 **
21 Miraj-2008 × V-12056 -2.34** -3.5 ** 46 V-12103 × V-12056 -3.1 ** -2.16** 22 Miraj-2008 × Millat-
11 6.36 ** 6.71 ** 47 V-12103 × Millat-11 2.6 ** 3.63 **
23 Miraj-2008 × Chenab-2000
2.33 ** 2.24 ** 48 V-12103 × Chenab-2000
-5.43 **
-9.48 **
24 Miraj-2008 × ND643 -0.64 -0.07 49 V-12103 × ND643 -0.29 0.94 25 Miraj-2008 × V-12082 -5.71** -5.37** 50 V-12103 × V-12082 6.21 ** 7.07 **

101
4.2.12. Flag Leaf Area
General combining ability is the mean performance of lines and testers in series of crosses.
The trait, such as higher flag leaf area are mostly preferred in crop improvement program. So
a higher significant positive value of the GCA for flag leaf area is suggested.
GCA range under normal conditions for flag leaf area -1.40 to 1.79. Highest positive
significant values were observed in AARI-11 (1.79) and V-13013 (1.20). Rest all others
showed negative and non-significant effects. The GCA value of testers ranged from -0.97 to
1.00 (Table 4.15). Highest positive significant value was observed for V-12056 (0.58) as
represented in Table 4.15. The finding of Awan et al., (2005), supports these results. Under
heat stressed conditions range of GCA for lines was -1.79 to 2.39. The highest positive
significant values observed by V-13013 (2.39) and V-12103 (1.06). For testers range of GCA
was -0.52 to 0.47. Chenab-2000 (0.47) showed positive and significant effects as shown in
table 4.16. All other testers showed undesirable effects. Results recorded that among line V-
13013 showed the highest positive significance effects under both normal and heat stressed
conditions. According to Singh et al., (2011) flag leaf area is significantly influenced by heat
stress. Under heat stress, there was influence of source and sink activities that causes the
decrease of flag leaf area and its photosynthetic activity per unit area, which resulted in
reduction of dry weight of wheat (Hossain et al., 2013).
Range of SCA was -4.85 to 3.64 under normal conditions. Highest positive significant effects
observed in crosses are, MISR 1 × V-12056 (3.64), MISR 1 × Millat-11 (3.43), V-13248 ×
V-12082 (3.11) and V-12103 × ND643 (2.70) as represented in Table 4.24. Our results show
similar trends as observed by Saeed et al (2001), Nisar et al., (2007) and Chowdhry et al.,
(2005). Under heat stressed conditions, SCA ranged from -4.07 to 3.18. Highest positive
significant effects observed in following crosses; V-13248 × Millat-11 (3.18), V-13241 × V-
12082 (3.09), Faisalabad-08 × V-12056 (2.97) and MISR 1 × V-12056 (2.27) (Table 4.5.14).
MISR 1 × V-12056 perform well under both normal and heat stress conditions. Khan and
Rizwan (2000), Cheema et al., (2007) and Golparvar et al., (2011) reported similar results for
this trait.
102
This study revealed that SCA variance was much greater than GCA variance showing the
non-additive genetic control for flag leaf area under diverse environments. This suggest
hybrid development for wheat. Some scientists study additive genetic effects for the control
of flag leaf area that show contradiction with our results as reported by Mahmood and
Chowdhry, (2002); Bhutta et al., (1997).
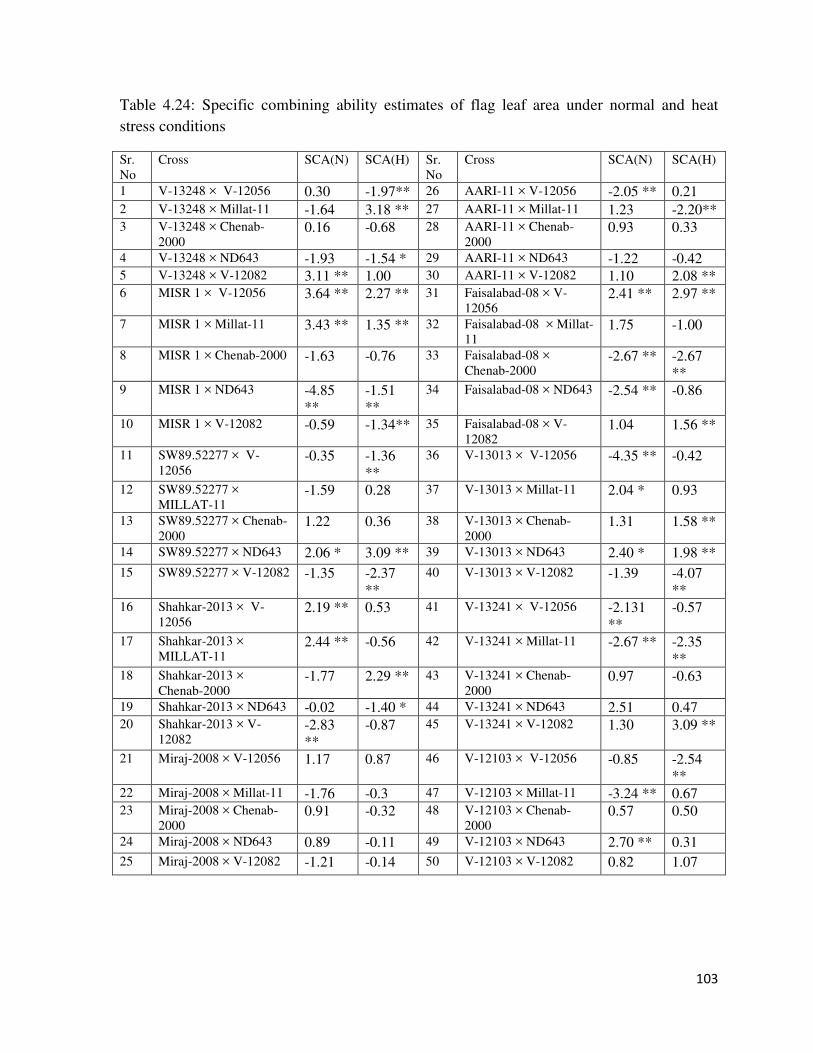
103
Table 4.24: Specific combining ability estimates of flag leaf area under normal and heat stress conditions
Sr. No
Cross SCA(N) SCA(H) Sr. No
Cross SCA(N) SCA(H)
1 V-13248 × V-12056 0.30 -1.97** 26 AARI-11 × V-12056 -2.05 ** 0.21 2 V-13248 × Millat-11 -1.64 3.18 ** 27 AARI-11 × Millat-11 1.23 -2.20** 3 V-13248 × Chenab-
2000 0.16 -0.68 28 AARI-11 × Chenab-
2000 0.93 0.33
4 V-13248 × ND643 -1.93 -1.54 * 29 AARI-11 × ND643 -1.22 -0.42 5 V-13248 × V-12082 3.11 ** 1.00 30 AARI-11 × V-12082 1.10 2.08 ** 6 MISR 1 × V-12056 3.64 ** 2.27 ** 31 Faisalabad-08 × V-
12056 2.41 ** 2.97 **
7 MISR 1 × Millat-11 3.43 ** 1.35 ** 32 Faisalabad-08 × Millat-11
1.75 -1.00
8 MISR 1 × Chenab-2000 -1.63 -0.76 33 Faisalabad-08 × Chenab-2000
-2.67 ** -2.67 **
9 MISR 1 × ND643 -4.85 **
-1.51 **
34 Faisalabad-08 × ND643 -2.54 ** -0.86
10 MISR 1 × V-12082 -0.59 -1.34** 35 Faisalabad-08 × V-12082
1.04 1.56 **
11 SW89.52277 × V-12056
-0.35 -1.36 **
36 V-13013 × V-12056 -4.35 ** -0.42
12 SW89.52277 × MILLAT-11
-1.59 0.28 37 V-13013 × Millat-11 2.04 * 0.93
13 SW89.52277 × Chenab-2000
1.22 0.36 38 V-13013 × Chenab-2000
1.31 1.58 **
14 SW89.52277 × ND643 2.06 * 3.09 ** 39 V-13013 × ND643 2.40 * 1.98 ** 15 SW89.52277 × V-12082 -1.35 -2.37
** 40 V-13013 × V-12082 -1.39 -4.07
** 16 Shahkar-2013 × V-
12056 2.19 ** 0.53 41 V-13241 × V-12056 -2.131
** -0.57
17 Shahkar-2013 × MILLAT-11
2.44 ** -0.56 42 V-13241 × Millat-11 -2.67 ** -2.35 **
18 Shahkar-2013 × Chenab-2000
-1.77 2.29 ** 43 V-13241 × Chenab-2000
0.97 -0.63
19 Shahkar-2013 × ND643 -0.02 -1.40 * 44 V-13241 × ND643 2.51 0.47 20 Shahkar-2013 × V-
12082 -2.83 **
-0.87 45 V-13241 × V-12082 1.30 3.09 **
21 Miraj-2008 × V-12056 1.17 0.87 46 V-12103 × V-12056 -0.85 -2.54 **
22 Miraj-2008 × Millat-11 -1.76 -0.3 47 V-12103 × Millat-11 -3.24 ** 0.67 23 Miraj-2008 × Chenab-
2000 0.91 -0.32 48 V-12103 × Chenab-
2000 0.57 0.50
24 Miraj-2008 × ND643 0.89 -0.11 49 V-12103 × ND643 2.70 ** 0.31 25 Miraj-2008 × V-12082 -1.21 -0.14 50 V-12103 × V-12082 0.82 1.07

104
4.2.13. Peduncle length
Maximum positive significant effects were required for improvement of this trait. GCA of
peduncle length range from -1.64 to 2.18. Highest positive significant effects were observed
in parents AARI-11 (2.18) and V-12103 (0.69). For testers range of GCA was -0.54 to 0.59
(Table 4.15). Only V-12082 showed significantly positive effects among testers while all
others showed undesirable effects. Under heat stressed conditions range was -1.59 to 1.62.
Among lines, positively and highest significant effects were observed in Faisalabad-08
(1.62), AARI-11 (1.33) and V-13013 (1.05) (Table 4.16). Range of testers was obvious as -
1.12 to 1.08. Positive significant values were observed in V-12082 (1.08) and ND643 (0.61),
while undesirable effects were shown in all other testers. AARI-11 from lines and V-12082
from testers performed excellently under both heat stressed and normal conditions as well.
These genotypes could be further used for varietal development and improvement. Similar
results were presented by (Khan et al., 2000) and contradictory results were presented by
(Ullah et al., 2010; Farshadfar et al., 2013).
Maximum positive significant estimated are required and range of specific combining ability
form normal environment was -4.51 to 4.37. Highest positive significant values were
observed in MISR 1 × Millat-11 (4.37), V-12103 × V-12082 (3.98), Faisalabad-08 × V-
12082 (3.81) and SW89.52277 × ND643 (3.30). Highest negative significant values were
observed in following crosses SW89.52277 × V-12082 (-4.51) and AARI-11 × V-12082 (-
4.35). Under heat stressed conditions, range of SCA was observed as -3.51 to 4.37. Highest
negatively significant values were observed in following crosses Shahkar-2013 × V-12056 (-
3.51) and V-13013 × Millat-11 (-3.39). Positive and significant values with highest estimates
were observed as follow; V-12103 × Millat-11 (4.37), MISR 1 × Millat-11 (4.06), AARI-11
× V-12056 (3.33) and Faisalabad-08 × Millat-11 (2.77) (Table 4.25). Specific combining
ability effects show highest positive significant values can be used for hybrid wheat
development. MISR 1 × Millat-11 show highest positive significant estimates in both
environmental conditions and can be efficiently in future breeding programs. Various
researchers reported similar results as in this work Yadav et al., (1988), Ahmad and
Srivastava (1991), Dhayal and Sastry (2003) and Harer and Bapat (1982).
105
Under both climatic conditions, our results showed dominance variance, possess higher
estimations then additive variance that show non-additive behavior for this trait. Importance
of hybrid wheat for peduncle length to improve grain yield in numerous cross combinations
was reported by Kumar and Ganguli, (1993); Chowdhry et al., (2001) and Chowdhry et al.,
(2005) and conform results of this study. Additive type of gene action was involved in
controlling this trait reported by Atiq-ur-Rehman et al., (2002); Rahim et al., (2006).
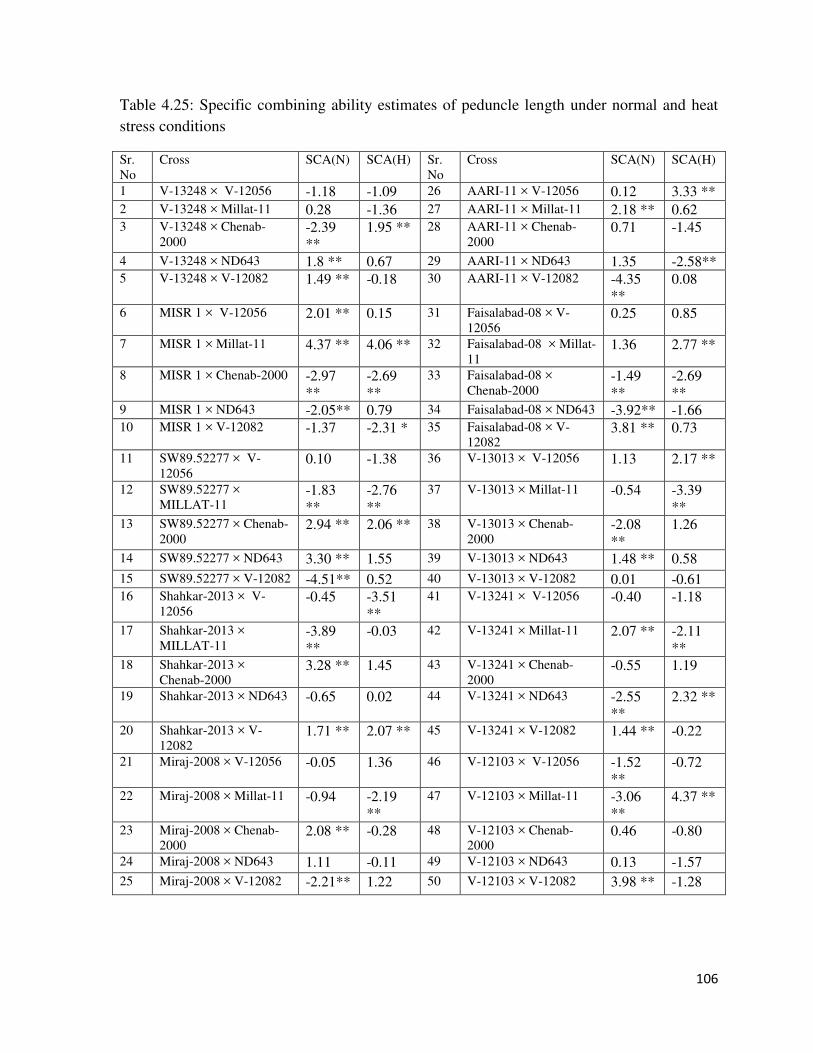
106
Table 4.25: Specific combining ability estimates of peduncle length under normal and heat stress conditions
Sr. No
Cross SCA(N) SCA(H) Sr. No
Cross SCA(N) SCA(H)
1 V-13248 × V-12056 -1.18 -1.09 26 AARI-11 × V-12056 0.12 3.33 ** 2 V-13248 × Millat-11 0.28 -1.36 27 AARI-11 × Millat-11 2.18 ** 0.62 3 V-13248 × Chenab-
2000 -2.39 **
1.95 ** 28 AARI-11 × Chenab-2000
0.71 -1.45
4 V-13248 × ND643 1.8 ** 0.67 29 AARI-11 × ND643 1.35 -2.58** 5 V-13248 × V-12082 1.49 ** -0.18 30 AARI-11 × V-12082 -4.35
** 0.08
6 MISR 1 × V-12056 2.01 ** 0.15 31 Faisalabad-08 × V-12056
0.25 0.85
7 MISR 1 × Millat-11 4.37 ** 4.06 ** 32 Faisalabad-08 × Millat-11
1.36 2.77 **
8 MISR 1 × Chenab-2000 -2.97 **
-2.69 **
33 Faisalabad-08 × Chenab-2000
-1.49 **
-2.69 **
9 MISR 1 × ND643 -2.05** 0.79 34 Faisalabad-08 × ND643 -3.92** -1.66 10 MISR 1 × V-12082 -1.37 -2.31 * 35 Faisalabad-08 × V-
12082 3.81 ** 0.73
11 SW89.52277 × V-12056
0.10 -1.38 36 V-13013 × V-12056 1.13 2.17 **
12 SW89.52277 × MILLAT-11
-1.83 **
-2.76 **
37 V-13013 × Millat-11 -0.54 -3.39 **
13 SW89.52277 × Chenab-2000
2.94 ** 2.06 ** 38 V-13013 × Chenab-2000
-2.08 **
1.26
14 SW89.52277 × ND643 3.30 ** 1.55 39 V-13013 × ND643 1.48 ** 0.58 15 SW89.52277 × V-12082 -4.51** 0.52 40 V-13013 × V-12082 0.01 -0.61 16 Shahkar-2013 × V-
12056 -0.45 -3.51
** 41 V-13241 × V-12056 -0.40 -1.18
17 Shahkar-2013 × MILLAT-11
-3.89 **
-0.03 42 V-13241 × Millat-11 2.07 ** -2.11 **
18 Shahkar-2013 × Chenab-2000
3.28 ** 1.45 43 V-13241 × Chenab-2000
-0.55 1.19
19 Shahkar-2013 × ND643 -0.65 0.02 44 V-13241 × ND643 -2.55 **
2.32 **
20 Shahkar-2013 × V-12082
1.71 ** 2.07 ** 45 V-13241 × V-12082 1.44 ** -0.22
21 Miraj-2008 × V-12056 -0.05 1.36 46 V-12103 × V-12056 -1.52 **
-0.72
22 Miraj-2008 × Millat-11 -0.94 -2.19 **
47 V-12103 × Millat-11 -3.06 **
4.37 **
23 Miraj-2008 × Chenab-2000
2.08 ** -0.28 48 V-12103 × Chenab-2000
0.46 -0.80
24 Miraj-2008 × ND643 1.11 -0.11 49 V-12103 × ND643 0.13 -1.57 25 Miraj-2008 × V-12082 -2.21** 1.22 50 V-12103 × V-12082 3.98 ** -1.28

107
4.2.14. Spike length
Spikelets per spike has been adopted as indicator of yield by a number of researchers. Spike
length is a character of considerable importance as the larger spike is likely to produce more
grains and eventually the higher yield (Ahmed et al., 2007; Sheikh et al., 2000). Akbar et al.,
(2009) have reported positive GCA effects for 1000-grain weight and spike length in bread
wheat.
Maximum positive significant effects were required for improvement of this trait. Under
normal conditions range of general combining ability for spike length was observed as -0.98
to 1.20. Highest positive and significant values were observed in V-13248 (1.20) followed by
SW89.5277 (0.34), V-12103 (0.34) and V-13013 (0.32) with negative value of MISR1 (-
0.98). For testers range of GCA was -0.53 to 0.80. Only one positive and one negative
significant values were observed as Chenab-2000 (0.80) and V-12082 (-0.53) respectively
(Table 4.15). High temperature stress causes reduction of yield and the range of GCA for
lines -1.39 to 0.97. Highest positive significant values were there as Faisalabad-08 (0.97),
AARI11 (0.72) and SW89.5277 (0.58). Negatively significant values were MISR1 (-1.39)
and V-13241 (-0.99). Range of testers for GCA under heat stressed conditions was – 0.44 to
0.63 (Table 4.16). Highest positive significant values were Chenab-2000 (0.63) and V-12082
(-0.44) show negative significant effects for testers. Among lines SW89.5277 and from
testers Chenab-2000 showed highest positive significant effects for spike length under
normal and heat stressed conditions. Spike length was found as one of important
components of grain yield by various researchers (Kahaliq et.al., 2004; Shahid et al., 2002)
and the positive GCA effects were generally observed for spike length.
Range of SCA for Spike length under normal conditions was -2.28 to 5.56. Negative
significant values were observed in V-12103 × Chenab-2000 (-2.28) and V-13248 × V-12056
(-2.33). Positive and highest significant values were observed in V-13248 × Chenab-2000
(2.56), V-12103 × Millat-11 (2.49), MISR 1 × ND643 (2.43) and Shahkar-2013 × V-12056
(2.08). The negative SCA effects on the spike length consequences of the current study are
additional in similar with Larik et al., (1999), Singh et al., (2008) and Singh et al., (2011).
Range of SCA under heat stressed conditions for lines was -2.47 to 2.36. Highest positive

108
and significant values were observed in following crosses; V-12103 × Millat-11 (2.36), V-
13241 × ND643 (2.06), V-13013 × V-12082 (1.98) and MISR 1 × ND643 (1.61) (Table
4.26). Cross V-12103 × Millat-11 showed good results for both environments. Grain yield
improvement is final target of a plant breeder which can be achieved by increasing spike
length and positive general combining ability are required. Similar type of studies have also
been discussed by (Tosun et al., 1995; Malik et al., 2005; Hasnain et al., 2006).
Our results show non-additive effects for spike length in wheat under normal and heat stress
as confirmed by the findings of Rahim et al., (2006). Contradictory results as additive gene
type of action was involved for spike length in wheat reported by Chowdhry et al., (2005);
Malik et al., (2005).
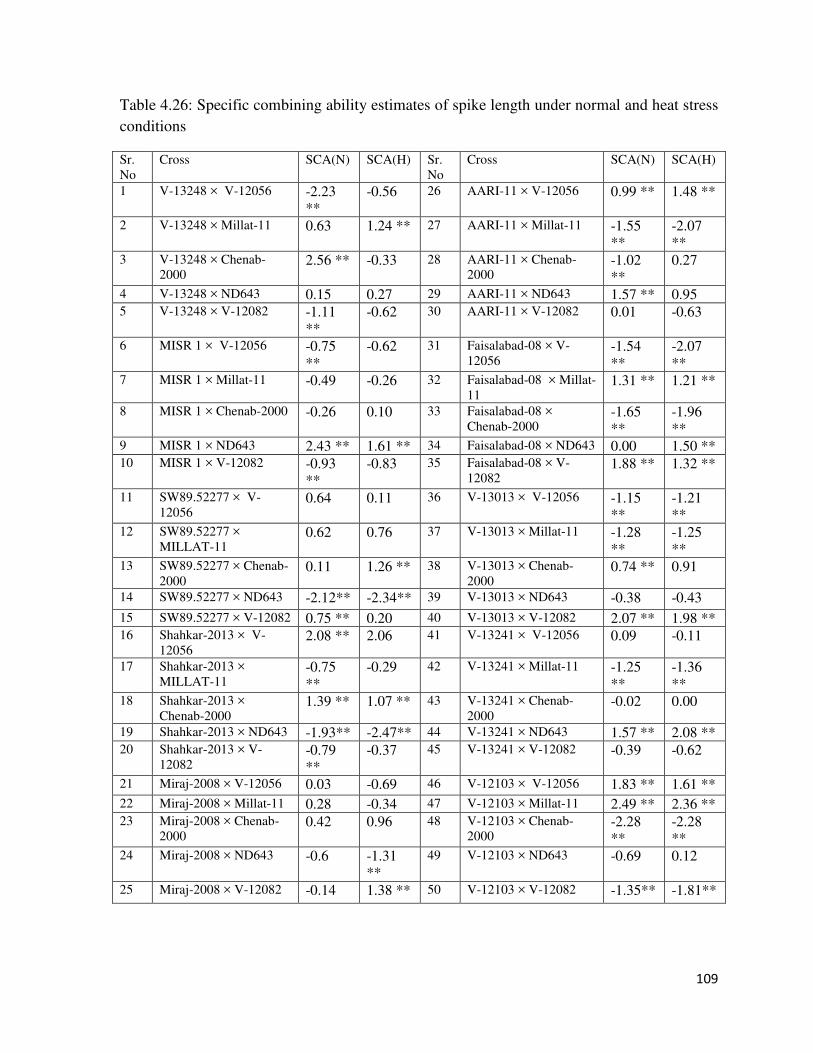
109
Table 4.26: Specific combining ability estimates of spike length under normal and heat stress conditions
Sr. No
Cross SCA(N) SCA(H) Sr. No
Cross SCA(N) SCA(H)
1 V-13248 × V-12056 -2.23 **
-0.56 26 AARI-11 × V-12056 0.99 ** 1.48 **
2 V-13248 × Millat-11 0.63 1.24 ** 27 AARI-11 × Millat-11 -1.55 **
-2.07 **
3 V-13248 × Chenab-2000
2.56 ** -0.33 28 AARI-11 × Chenab-2000
-1.02 **
0.27
4 V-13248 × ND643 0.15 0.27 29 AARI-11 × ND643 1.57 ** 0.95 5 V-13248 × V-12082 -1.11
** -0.62 30 AARI-11 × V-12082 0.01 -0.63
6 MISR 1 × V-12056 -0.75 **
-0.62 31 Faisalabad-08 × V-12056
-1.54 **
-2.07 **
7 MISR 1 × Millat-11 -0.49 -0.26 32 Faisalabad-08 × Millat-11
1.31 ** 1.21 **
8 MISR 1 × Chenab-2000 -0.26 0.10 33 Faisalabad-08 × Chenab-2000
-1.65 **
-1.96 **
9 MISR 1 × ND643 2.43 ** 1.61 ** 34 Faisalabad-08 × ND643 0.00 1.50 ** 10 MISR 1 × V-12082 -0.93
** -0.83 35 Faisalabad-08 × V-
12082 1.88 ** 1.32 **
11 SW89.52277 × V-12056
0.64 0.11 36 V-13013 × V-12056 -1.15 **
-1.21 **
12 SW89.52277 × MILLAT-11
0.62 0.76 37 V-13013 × Millat-11 -1.28 **
-1.25 **
13 SW89.52277 × Chenab-2000
0.11 1.26 ** 38 V-13013 × Chenab-2000
0.74 ** 0.91
14 SW89.52277 × ND643 -2.12** -2.34** 39 V-13013 × ND643 -0.38 -0.43 15 SW89.52277 × V-12082 0.75 ** 0.20 40 V-13013 × V-12082 2.07 ** 1.98 ** 16 Shahkar-2013 × V-
12056 2.08 ** 2.06 41 V-13241 × V-12056 0.09 -0.11
17 Shahkar-2013 × MILLAT-11
-0.75 **
-0.29 42 V-13241 × Millat-11 -1.25 **
-1.36 **
18 Shahkar-2013 × Chenab-2000
1.39 ** 1.07 ** 43 V-13241 × Chenab-2000
-0.02 0.00
19 Shahkar-2013 × ND643 -1.93** -2.47** 44 V-13241 × ND643 1.57 ** 2.08 ** 20 Shahkar-2013 × V-
12082 -0.79 **
-0.37 45 V-13241 × V-12082 -0.39 -0.62
21 Miraj-2008 × V-12056 0.03 -0.69 46 V-12103 × V-12056 1.83 ** 1.61 ** 22 Miraj-2008 × Millat-11 0.28 -0.34 47 V-12103 × Millat-11 2.49 ** 2.36 ** 23 Miraj-2008 × Chenab-
2000 0.42 0.96 48 V-12103 × Chenab-
2000 -2.28 **
-2.28 **
24 Miraj-2008 × ND643 -0.6 -1.31 **
49 V-12103 × ND643 -0.69 0.12
25 Miraj-2008 × V-12082 -0.14 1.38 ** 50 V-12103 × V-12082 -1.35** -1.81**
110
4.2.15. Fertile tillers per plant
There were direct significant effects of number of tillers per plant on the grain yield of plant.
The increase in number of fertile tillers per plant results in higher yield for plants. Significant
results with positive effects are desirable for fertile tillers per plant as more number of fertile
tillers are associated with high yield.
Range of GCA for number of tillers per plant of line under normal environmental conditions
was -2.02 to 1.98. The highest positive significant values were there as V-12103 (1.98), V-
13248 (1.45) and V-13013 (1.45). Range of testers was -0.52 to 1.01. Positive significant
effects were observed in V-12082 (1.01) (Table 4.15). The findings of Qari et al. (1986),
Sarkar et al. (1987), Zubair et al. (1987) and Usman (1998) supported the results reported
here. Under heat stress, genotypes exhibited GCA values ranged from -1.79 to 135. Highest
positive significant values were observed in AARI-11 (1.35), V-13248 (1.15) and V-1303
(0.88) with negative significant value of Miraj-08 (-1.79). For testers range of GCA was -
0.42 to 0.68 (Table 4.16). Only positive and significant value was observed in V-12082
(0.68), while all others showed undesirable effects. Significant values of combining ability
(general and specific combining ability) effects for tillers per plant reported by Chowdhry et
al., 1996.
Range of SCA for fertile tillers per plant under normal conditions showed up to be -1.95 to
2.99. Highest negative significant value was observed in cross Shahkar-2013 × Millat-11 (-
1.95). Highest positive significant values were shown in crosses; Miraj-2008 × Millat-11
(2.99), Shahkar-2013 × V-12056 (2.49), Faisalabad-08 × V-12082 (1.52) and V-13013 ×
ND643 (1.49). These results are in agreement with the finding of Sarkar et al. (1987),
Chowdhry et al. (1992) and Usman (1998). At the time of rooting, if there was rise of
temperature than ambient temperature it causes reduction in number of fertile tillers per
plant. Under high temperature stress range of SCA was -3.28 to 2.55. Highest positive and
significant values were observed in V-13013 × ND643 (2.55), V-13241 × V-12082 (2.19)
and Faisalabad-08 × Millat-11 (2.05). Negative significant value was observed in V-13013 ×
V-12082 (-3.28) (Table 4.27).
111
Fertile tillers per plant displayed higher dominance variance than additive representing non-
additive gene action for this trait under normal and heat stress. Li et al. (1991) and Senapati
et al. (1994) reported for importance of non-additive genetic effects for fertile tillers per plant
also support our findings. Previous researchers find additive genetic effects control fertile
tillers per plant in wheat and these show contradictory results with this study (Chowdhry et
al., (1996); Mahmood and Chowdhry, (2002); Chowdhry et al., (2005)).
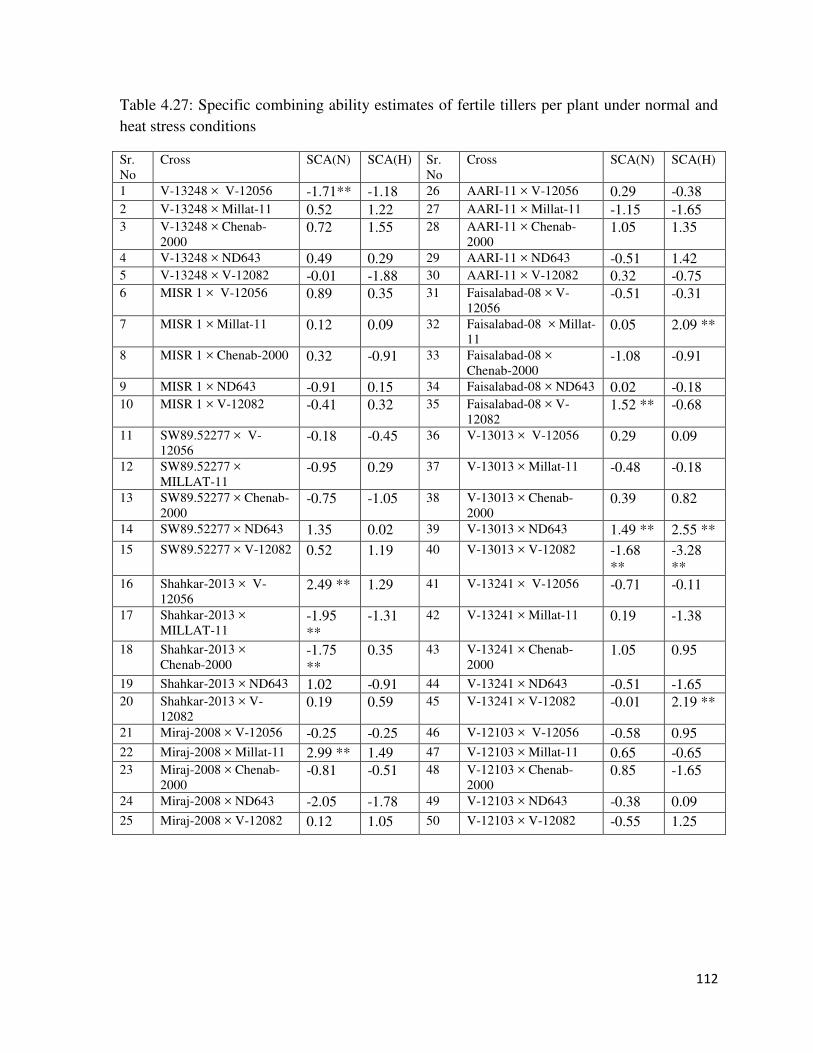
112
Table 4.27: Specific combining ability estimates of fertile tillers per plant under normal and heat stress conditions
Sr. No
Cross SCA(N) SCA(H) Sr. No
Cross SCA(N) SCA(H)
1 V-13248 × V-12056 -1.71** -1.18 26 AARI-11 × V-12056 0.29 -0.38 2 V-13248 × Millat-11 0.52 1.22 27 AARI-11 × Millat-11 -1.15 -1.65 3 V-13248 × Chenab-
2000 0.72 1.55 28 AARI-11 × Chenab-
2000 1.05 1.35
4 V-13248 × ND643 0.49 0.29 29 AARI-11 × ND643 -0.51 1.42 5 V-13248 × V-12082 -0.01 -1.88 30 AARI-11 × V-12082 0.32 -0.75 6 MISR 1 × V-12056 0.89 0.35 31 Faisalabad-08 × V-
12056 -0.51 -0.31
7 MISR 1 × Millat-11 0.12 0.09 32 Faisalabad-08 × Millat-11
0.05 2.09 **
8 MISR 1 × Chenab-2000 0.32 -0.91 33 Faisalabad-08 × Chenab-2000
-1.08 -0.91
9 MISR 1 × ND643 -0.91 0.15 34 Faisalabad-08 × ND643 0.02 -0.18 10 MISR 1 × V-12082 -0.41 0.32 35 Faisalabad-08 × V-
12082 1.52 ** -0.68
11 SW89.52277 × V-12056
-0.18 -0.45 36 V-13013 × V-12056 0.29 0.09
12 SW89.52277 × MILLAT-11
-0.95 0.29 37 V-13013 × Millat-11 -0.48 -0.18
13 SW89.52277 × Chenab-2000
-0.75 -1.05 38 V-13013 × Chenab-2000
0.39 0.82
14 SW89.52277 × ND643 1.35 0.02 39 V-13013 × ND643 1.49 ** 2.55 ** 15 SW89.52277 × V-12082 0.52 1.19 40 V-13013 × V-12082 -1.68
** -3.28 **
16 Shahkar-2013 × V-12056
2.49 ** 1.29 41 V-13241 × V-12056 -0.71 -0.11
17 Shahkar-2013 × MILLAT-11
-1.95 **
-1.31 42 V-13241 × Millat-11 0.19 -1.38
18 Shahkar-2013 × Chenab-2000
-1.75 **
0.35 43 V-13241 × Chenab-2000
1.05 0.95
19 Shahkar-2013 × ND643 1.02 -0.91 44 V-13241 × ND643 -0.51 -1.65 20 Shahkar-2013 × V-
12082 0.19 0.59 45 V-13241 × V-12082 -0.01 2.19 **
21 Miraj-2008 × V-12056 -0.25 -0.25 46 V-12103 × V-12056 -0.58 0.95 22 Miraj-2008 × Millat-11 2.99 ** 1.49 47 V-12103 × Millat-11 0.65 -0.65 23 Miraj-2008 × Chenab-
2000 -0.81 -0.51 48 V-12103 × Chenab-
2000 0.85 -1.65
24 Miraj-2008 × ND643 -2.05 -1.78 49 V-12103 × ND643 -0.38 0.09 25 Miraj-2008 × V-12082 0.12 1.05 50 V-12103 × V-12082 -0.55 1.25

113
4.2.16. Days to heading
Days to heading is most important to determine life of plant and days taken for anthesis. For
normal conditions general combining ability estimates range in lines from -2.86 to 3.41. The
highest positive effects were observed in Miraj-08 (3.41) followed by Faislabad-08 (1.41)
while maximum negative significant estimates estimated in V-13241 (-2.86) and MISR 1 (-
2.73). From testers range of GCA was estimated -2.13 to 2.51. Highest positive effects was
observed in V-12.52 (2.51) while maximum negative significant estimates estimated in V-
12082(-2.13). Under heat stress conditions GCA range for lines was -2.97 to 2.37. Higher
positive effect were observed by V-12103 (2.37) followed by Miraj-08 (2.23) and MISR1
(1.23) while maximum negative significant estimates estimated in Faislabad-08 (-2.97) and
Shahkar-13 (-1.90). From testers range of GCA was estimated -1.27 to 1.07. The highest
positive effects was observed in V-12056 (1.07) while maximum negative significant
estimates estimated in V-12082 (-1.27). Drikvand et al., (2005) also reported higher negative
values for general combining ability for days to heading.
High positive values would be of importance for all measurements in traits except days to
heading and maturity where, high negative effects would be useful from the breeder point of
view. Under normal conditions range of SCA was -4.82 to 6.05. The highest positive
significant effects were observed in crosses viz. Faisalabad-08 × Millat-11 (6.05), V-13241 ×
V-12082(5.91), V-13241 × ND643 (4.51) and Miraj-2008 × Chenab-2000 (4.28) with highest
negative significant value Faisalabad-08 × Chenab-2000 (-4.82) and SW89.52277 × V-12056
(-4.49). Vanpariya et al., (2006) supported results of this study for the days to heading under
normal sowing conditions. Range of SCA under heat stressed environments was -7.47 to
6.53. Highest negative significant value SW89.52277 × V-12056 (-7.47) and MISR 1 × V-
12082 (-4.27) with highest positive significant effects were observed in crosses viz.
SW89.52277 × V-12082 (6.53), V-13013 × V-12056 (4.20), V-13248 × ND643 (4.13) and
V-13241 × V-12082 (4.12). Sial et al. (2005), Saleem et al. (2006), Hakim et al. (2012), and
Lopes and Reynolds (2012) also noticed decline in days to heading as concerns of heat stress
that also support our results.
From this experiment, days to heading under both normal and heat stressed environments
depicted non-additive variance. Parent combination with slight GCA effects may have the

114
potential can be exploited through hybridization with better general combiner and our results
show accordance with the work of Ivanovseka et al., (2000): Singh et al., (2006) and Mishra
et al., (1994).
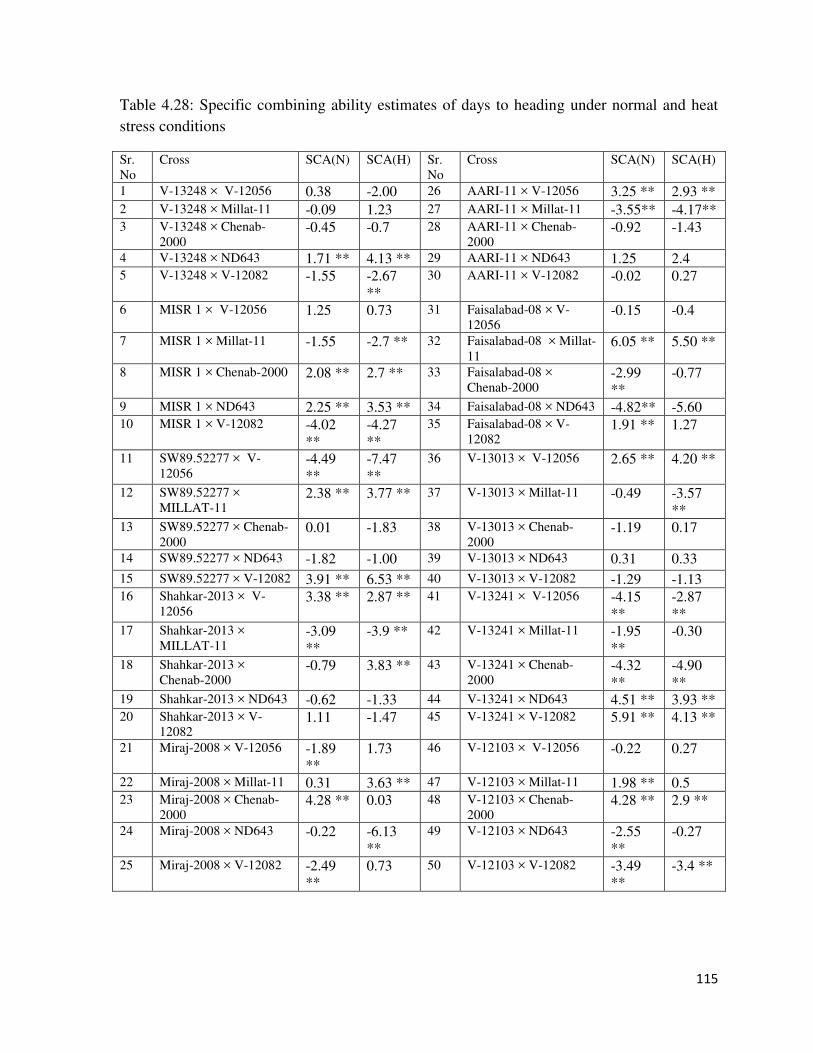
115
Table 4.28: Specific combining ability estimates of days to heading under normal and heat stress conditions
Sr. No
Cross SCA(N) SCA(H) Sr. No
Cross SCA(N) SCA(H)
1 V-13248 × V-12056 0.38 -2.00 26 AARI-11 × V-12056 3.25 ** 2.93 ** 2 V-13248 × Millat-11 -0.09 1.23 27 AARI-11 × Millat-11 -3.55** -4.17** 3 V-13248 × Chenab-
2000 -0.45 -0.7 28 AARI-11 × Chenab-
2000 -0.92 -1.43
4 V-13248 × ND643 1.71 ** 4.13 ** 29 AARI-11 × ND643 1.25 2.4 5 V-13248 × V-12082 -1.55 -2.67
** 30 AARI-11 × V-12082 -0.02 0.27
6 MISR 1 × V-12056 1.25 0.73 31 Faisalabad-08 × V-12056
-0.15 -0.4
7 MISR 1 × Millat-11 -1.55 -2.7 ** 32 Faisalabad-08 × Millat-11
6.05 ** 5.50 **
8 MISR 1 × Chenab-2000 2.08 ** 2.7 ** 33 Faisalabad-08 × Chenab-2000
-2.99 **
-0.77
9 MISR 1 × ND643 2.25 ** 3.53 ** 34 Faisalabad-08 × ND643 -4.82** -5.60 10 MISR 1 × V-12082 -4.02
** -4.27 **
35 Faisalabad-08 × V-12082
1.91 ** 1.27
11 SW89.52277 × V-12056
-4.49 **
-7.47 **
36 V-13013 × V-12056 2.65 ** 4.20 **
12 SW89.52277 × MILLAT-11
2.38 ** 3.77 ** 37 V-13013 × Millat-11 -0.49 -3.57 **
13 SW89.52277 × Chenab-2000
0.01 -1.83 38 V-13013 × Chenab-2000
-1.19 0.17
14 SW89.52277 × ND643 -1.82 -1.00 39 V-13013 × ND643 0.31 0.33 15 SW89.52277 × V-12082 3.91 ** 6.53 ** 40 V-13013 × V-12082 -1.29 -1.13 16 Shahkar-2013 × V-
12056 3.38 ** 2.87 ** 41 V-13241 × V-12056 -4.15
** -2.87 **
17 Shahkar-2013 × MILLAT-11
-3.09 **
-3.9 ** 42 V-13241 × Millat-11 -1.95 **
-0.30
18 Shahkar-2013 × Chenab-2000
-0.79 3.83 ** 43 V-13241 × Chenab-2000
-4.32 **
-4.90 **
19 Shahkar-2013 × ND643 -0.62 -1.33 44 V-13241 × ND643 4.51 ** 3.93 ** 20 Shahkar-2013 × V-
12082 1.11 -1.47 45 V-13241 × V-12082 5.91 ** 4.13 **
21 Miraj-2008 × V-12056 -1.89 **
1.73 46 V-12103 × V-12056 -0.22 0.27
22 Miraj-2008 × Millat-11 0.31 3.63 ** 47 V-12103 × Millat-11 1.98 ** 0.5 23 Miraj-2008 × Chenab-
2000 4.28 ** 0.03 48 V-12103 × Chenab-
2000 4.28 ** 2.9 **
24 Miraj-2008 × ND643 -0.22 -6.13 **
49 V-12103 × ND643 -2.55 **
-0.27
25 Miraj-2008 × V-12082 -2.49 **
0.73 50 V-12103 × V-12082 -3.49 **
-3.4 **
116
4.2.17. Days to maturity
For manipulation of days to maturity, utilization of additive or additive × additive gene
effects for development of high yielding cultivars under extensive range of environmental
conditions as reported by Przulj and Maladenov, 1999.
For normal conditions GCA estimates of days to maturity range in lines from -3.48 to 2.19.
Highest positive effects were observed in V-12103 (2.19) followed by MISR1 (2.05),
SW89.5277 (1.12) and AARI-11 (1.05) while maximum negative significant values were
estimated in Miraj-08 (-3.48) and V-13241 (-1.55). From testers range of GCA was estimated
-1.08 to 1.75. Highest positive effects were observed in ND643 (1.75) and V-12056 (0.75)
while maximum negative significant values were estimated in Chenab-2000 (-1.08) V-12082
(-0.98) (Table 4.15). Under heat stress conditions days to maturity range for lines was -2.11
to 2.42. Highest positive effects observed in Faisalabad-08 (2.42) and Miraj-08 (1.89), while
maximum negative significant estimates estimated in V-13013 (-2.11), V-13248 (-1.91) and
SW89.5277 (-1.65). From testers range of GCA was estimated -0.81 to 0.96. Among parents
no one showed positive significance values from testers while V-12082 (-0.81) showed
negative and highest significant value (Table 4.16).
Under normal conditions, range of SCA was -7.61 to 9.26. Highest positive significant
effects were observed in crosses viz. MISR 1 × ND643 (9.26), V-13013 × V-12082 (7.93),
SW89.52277 × Millat-11 (7.03) and Faisalabad-08 × Millat-11 (6.63) with highest negative
significant value V-13241 × ND643 (-7.61) and V-13013 × MILLAT-11(-6.17). Range of
SCA under heat stressed environments was -8.45 to 9.15. Highest negative significant value
Miraj-2008 × Millat-11 (-8.45) and Faisalabad-08 × V-12082 (-7.59) with highest positive
significant effects were observed in crosses viz. V-13013 × V-12082 (9.15), MISR 1 ×
ND643 (7.18) and Faisalabad-08 × V-12056 (6.75) as represented in Table 4.29.
Results represent the presence of dominance variance genetic effects for both environments
that show non-additive behavior for days to maturity in wheat. Rahman et al. (2003) and
Inamullah et al. (2005) reported Additive type of gene action that show contradiction with
result of this study.

117
Table 4.29: Specific combining ability estimates of days to maturity under normal and heat stress conditions
Sr. No
Cross SCA(N) SCA(H) Sr. No
Cross SCA(N) SCA(H)
1 V-13248 × V-12056 -0.44 2.08 26 AARI-11 × V-12056 -4.11** 0.68 2 V-13248 × Millat-11 2.09 0.68 27 AARI-11 × Millat-11 -3.91** 0.61 3 V-13248 × Chenab-
2000 0.23 -4.42
** 28 AARI-11 × Chenab-
2000 -2.44 -0.82
4 V-13248 × ND643 -0.41 -1.09 29 AARI-11 × ND643 6.26 ** -4.49** 5 V-13248 × V-12082 -1.47 2.75 ** 30 AARI-11 × V-12082 4.19 ** 4.01 ** 6 MISR 1 × V-12056 -5.77
** -6.99 **
31 Faisalabad-08 × V-12056
2.76 6.75 **
7 MISR 1 × Millat-11 -4.24 **
1.28 32 Faisalabad-08 × Millat-11
6.63 ** 4.35 **
8 MISR 1 × Chenab-2000 0.23 1.85 33 Faisalabad-08 × Chenab-2000
-2.24 -0.42
9 MISR 1 × ND643 9.26 ** 7.18 ** 34 Faisalabad-08 × ND643 -2.87 **
-3.09 **
10 MISR 1 × V-12082 0.53 -3.32 **
35 Faisalabad-08 × V-12082
-4.27 **
-7.59 **
11 SW89.52277 × V-12056
1.16 4.15 ** 36 V-13013 × V-12056 5.29 ** -6.52 **
12 SW89.52277 × MILLAT-11
7.03 ** 0.75 37 V-13013 × Millat-11 -6.17 **
0.08
13 SW89.52277 × Chenab-2000
2.16 2.31 38 V-13013 × Chenab-2000
-6.04 **
-4.02 **
14 SW89.52277 × ND643 -4.81 **
-3.35 **
39 V-13013 × ND643 -1.01 1.31
15 SW89.52277 × V-12082 -5.54 **
-3.85 **
40 V-13013 × V-12082 7.93 ** 9.15 **
16 Shahkar-2013 × V-12056
2.29 -5.25 **
41 V-13241 × V-12056 2.69 -0.39
17 Shahkar-2013 × MILLAT-11
-3.51 **
-1.99 42 V-13241 × Millat-11 4.56 ** 5.88 **
18 Shahkar-2013 × Chenab-2000
6.29 ** 4.25 ** 43 V-13241 × Chenab-2000
-1.64 -1.89
19 Shahkar-2013 × ND643 -4.34 **
4.58 ** 44 V-13241 × ND643 -7.61 **
-7.55 **
20 Shahkar-2013 × V-12082
-0.74 -1.59 45 V-13241 × V-12082 1.99 3.95 **
21 Miraj-2008 × V-12056 -5.24** 3.61 ** 46 V-12103 × V-12056 1.36 1.88 22 Miraj-2008 × Millat-11 2.29 -8.45
** 47 V-12103 × Millat-11 -4.77
** -3.19 **
23 Miraj-2008 × Chenab-2000
6.09 ** 5.78 ** 48 V-12103 × Chenab-2000
-2.64 -2.62 **
24 Miraj-2008 × ND643 -0.87 2.11 49 V-12103 × ND643 6.39 ** 4.38 ** 25 Miraj-2008 × V-12082 -2.27 -3.05** 50 V-12103 × V-12082 -0.34 -0.45
118
4.2.18. Spikelet per spike
Under normal conditions, range of general combining ability for spikelet per spike was
observed as -1.68 to 1.79. Highest positive and significant values were observed in
SW89.5277 (1.79) and V-12103 (1.79) with negative value of Miraj-08 (-1.68). For testers
range of GCA was -1.28 to 0.99. No positive significant value was observed for testers under
spikelets per spike and one negative significant value was observed as Chenab-2000 (-1.28)
(Table 4.15). Positive GCA values of SPS were desirable and therefore our results are in the
agreement with the results reported by (Tosun et al., 1995; Saeed et al., 2001; Malik et al.,
2005; Chowdhary et al., 2007). Range of GCA for lines under heat stressed conditions was -
1.69 to 2.17. The highest positive significant values were there as V-13241 (2.17) and V-
12103 (1.37). SW89.5277 (-1.69) show highest negative significant value. Range of testers
for GCA under heat stressed conditions was –0.49 to 1.11. Highest positive significant value
was V-12082 (1.11) represented in Table 4.16. Rest of all others showed undesirable results
for this trait under heat stressed conditions.
Range of SCA for Spikelet per spike under normal conditions was -3.32 to 4.48. Negative
significant values were observed in V-13248 × ND643 (-3.32) and Miraj-2008 × V-12082 (-
3.32). Positive and highest significant values were observed in cross V-13248 × V-12082
(3.48) followed by MISR 1 × ND643 (3.48). For a number of spikelet per spike, positive
specific combining ability effects were desirable. These results are in the conformity with
those of (Singh et al., 2003); (Mahantashivayogayya et al., 2010). Usually Specific
combining ability effects do not have noticeable contribution in self-pollinated crops like
wheat, except wherever exploitation for the commercial heterosis is needed (Menon and
Sharma 1997; Singh 2002). Range of SCA under heat stressed conditions for lines was -4.11
to 3.63. Highest positive and significant values were observed in following crosses; V-13248
× Millat-11 (3.63) and V-13241 × V-12056 (3.56), negative highest significant values were
observed in following crosses V-13241 × Millat-11 (-4.11) and V-13241 × ND643 (-4.11)
(Table 4.30).
For gene action occurrence of non-additive genetic effects due to the more SCA mean
squares of normal and heat stress show higher dominance variance for the variance studies.
Genetic analysis showed that spikelets per spike was controlled by non-additive type of gene
119
action under both normal and heat stressed conditions, as estimates of SCA were high in both
conditions then GCA. Tosun et al., (1995); Bhutta et al., (1997) studied additive gene action
for spikelet per spike that show contradiction with result for this trait.
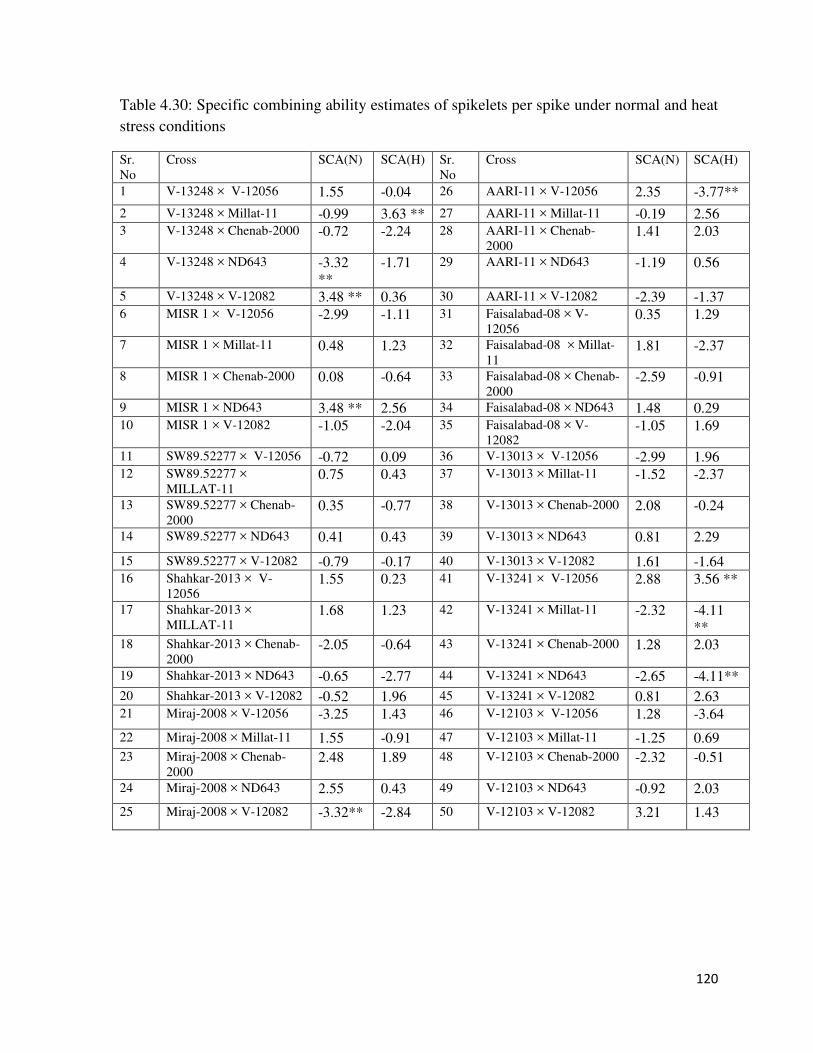
120
Table 4.30: Specific combining ability estimates of spikelets per spike under normal and heat stress conditions
Sr. No
Cross SCA(N) SCA(H) Sr. No
Cross SCA(N) SCA(H)
1 V-13248 × V-12056 1.55 -0.04 26 AARI-11 × V-12056 2.35 -3.77**
2 V-13248 × Millat-11 -0.99 3.63 ** 27 AARI-11 × Millat-11 -0.19 2.56 3 V-13248 × Chenab-2000 -0.72 -2.24 28 AARI-11 × Chenab-
2000 1.41 2.03
4 V-13248 × ND643 -3.32 **
-1.71 29 AARI-11 × ND643 -1.19 0.56
5 V-13248 × V-12082 3.48 ** 0.36 30 AARI-11 × V-12082 -2.39 -1.37 6 MISR 1 × V-12056 -2.99 -1.11 31 Faisalabad-08 × V-
12056 0.35 1.29
7 MISR 1 × Millat-11 0.48 1.23 32 Faisalabad-08 × Millat-11
1.81 -2.37
8 MISR 1 × Chenab-2000 0.08 -0.64 33 Faisalabad-08 × Chenab-2000
-2.59 -0.91
9 MISR 1 × ND643 3.48 ** 2.56 34 Faisalabad-08 × ND643 1.48 0.29 10 MISR 1 × V-12082 -1.05 -2.04 35 Faisalabad-08 × V-
12082 -1.05 1.69
11 SW89.52277 × V-12056 -0.72 0.09 36 V-13013 × V-12056 -2.99 1.96 12 SW89.52277 ×
MILLAT-11 0.75 0.43 37 V-13013 × Millat-11 -1.52 -2.37
13 SW89.52277 × Chenab-2000
0.35 -0.77 38 V-13013 × Chenab-2000 2.08 -0.24
14 SW89.52277 × ND643 0.41 0.43 39 V-13013 × ND643 0.81 2.29
15 SW89.52277 × V-12082 -0.79 -0.17 40 V-13013 × V-12082 1.61 -1.64 16 Shahkar-2013 × V-
12056 1.55 0.23 41 V-13241 × V-12056 2.88 3.56 **
17 Shahkar-2013 × MILLAT-11
1.68 1.23 42 V-13241 × Millat-11 -2.32 -4.11 **
18 Shahkar-2013 × Chenab-2000
-2.05 -0.64 43 V-13241 × Chenab-2000 1.28 2.03
19 Shahkar-2013 × ND643 -0.65 -2.77 44 V-13241 × ND643 -2.65 -4.11** 20 Shahkar-2013 × V-12082 -0.52 1.96 45 V-13241 × V-12082 0.81 2.63 21 Miraj-2008 × V-12056 -3.25 1.43 46 V-12103 × V-12056 1.28 -3.64
22 Miraj-2008 × Millat-11 1.55 -0.91 47 V-12103 × Millat-11 -1.25 0.69 23 Miraj-2008 × Chenab-
2000 2.48 1.89 48 V-12103 × Chenab-2000 -2.32 -0.51
24 Miraj-2008 × ND643 2.55 0.43 49 V-12103 × ND643 -0.92 2.03
25 Miraj-2008 × V-12082 -3.32** -2.84 50 V-12103 × V-12082 3.21 1.43

121
4.2.19. Number of Grains per Spike
In case of wheat, yield and yield related characters were considered to be the desirable ones
as studied by Anwar et al., 2011.
General combining ability for number of grains per spike range from -4.31 to 4.69 under
normal conditions. The highest positive significant effects were observed in parents V-
13248(4.69), MISR1 (2.09) followed by Faisalabad-08 (1.89) and Shahkar-13 (1.22). Highest
negative significant values were observed in SW89.5277 (-4.31) and V-12103 (-2.91). For
testers range of GCA was -1.31 to 1.75. Highest positive significant GCA was observed in V-
12082 (1.75) and Chenab-2000 (1.29) while all others showed undesirable effects (Table
4.15). For number of grains per spike there was to improve because if the amount of grains
will be more, grain yield will also be increased. Therefore, positive GCA effects were
important due to their positive contribution of grain yield. These results match with the
findings of (Saeed et al., 2001; Singh et al., 2003; Hassan et al., 2007; Iqbal, 2007). Under
heat stressed conditions range was -2.45 to 2.95. Among lines, positively and highest
significant effects were observed in V-12248 (2.95) and V-12103 (2.68) while all others
showed negative or non-significant results. Range of testers was obvious as -0.92 to 1.05.
Positive significant values were observed in Chenab-2000 (1.05) (Table 4.16) while
undesirable effects were shown in all other testers. V-13248 from lines and Chenab-2000
from testers performed excellently under both heat stressed and normal conditions as well.
These genotypes could be further used for varietal development and improvement.
Range of specific combining ability form normal environment was -6.95 to 9.91. The highest
positive significant values were observed in cross V-12103 × ND643 (9.91) followed by V-
13013 × Millat-11(9.11), MISR 1 × ND643 (5.91) and SW89.52277 × V-12056 (5.41).
Highest negative significant values were observed in these crosses Faisalabad-08 × V-12082
(-6.95) and V-13013 × Chenab-2000 (-6.49). The findings of (Iqbal 2007) supported the
results reported here. Under heat stressed conditions range of SCA was observed as -4.01 to
5.92. Highest negatively significant values were observed in following crosses Miraj-2008 ×
Millat-11 (-4.01) and V-13013 × V-12082 (-3.95). Positive and significant values with
highest estimates were observed as follow; Miraj-2008 × ND643 (5.92), SW89.52277 ×
Millat-11 (5.52), Faisalabad-08 × Millat-11 (4.25) and V-13013 × Millat-11 (4.12) (Table
122
4.31). V-13013 × Millat-11 show highest positive significant estimates in both environmental
conditions and can be efficiently used for further breeding programs. Sial et al., (2005)
recorded same the loos of grain yield under heat stress.
Higher estimates of SCA than GCA represented dominance type of gene action for GPS
under diverse environments. Results showed dominance variance, possess higher estimations
than additive variance, which show non-additive behavior for number of grains per spike.
Some studies to understand non-additive genetic behavior for this trait were conducted by
Rajara and Maheshwari, 1996; Shahzad et al., 1998; Chowdhry et al., 1999) and their results
confirmed our findings as non- additive gene action.

123
Table 4.31: Specific combining ability estimates of grains per spike under normal and heat stress conditions
Sr. No
Cross SCA(N) SCA(H) Sr. No
Cross SCA(N) SCA(H)
1 V-13248 × V-12056 0.41 0.95 26 AARI-11 × V-12056 -2.19** -0.31 2 V-13248 × Millat-11 3.31 ** 0.79 27 AARI-11 × Millat-11 -3.29** -2.48 3 V-13248 × Chenab-
2000 1.71 1.82 28 AARI-11 × Chenab-
2000 3.11 ** 1.55
4 V-13248 × ND643 -2.69** -2.61** 29 AARI-11 × ND643 -2.29** -2.55 5 V-13248 × V-12082 -2.75
** -0.95 30 AARI-11 × V-12082 4.65 ** 3.79 **
6 MISR 1 × V-12056 -4.99 **
-1.65 31 Faisalabad-08 × V-12056
3.21 ** 1.09
7 MISR 1 × Millat-11 -2.09 **
-2.48 32 Faisalabad-08 × Millat-11
2.11 ** 4.25 **
8 MISR 1 × Chenab-2000 -1.69 -1.11 33 Faisalabad-08 × Chenab-2000
1.51 1.29
9 MISR 1 × ND643 5.91 ** 2.79 ** 34 Faisalabad-08 × ND643 0.11 -3.48** 10 MISR 1 × V-12082 2.85 ** 2.45 35 Faisalabad-08 × V-
12082 -6.95 **
-3.15 **
11 SW89.52277 × V-12056
5.41 ** -0.98 36 V-13013 × V-12056 5.21 ** 2.95 **
12 SW89.52277 × MILLAT-11
-0.69 5.52 ** 37 V-13013 × Millat-11 9.11 ** 4.12 **
13 SW89.52277 × Chenab-2000
-0.29 -2.11 38 V-13013 × Chenab-2000
-6.49 **
-3.51 **
14 SW89.52277 × ND643 -1.69 0.45 39 V-13013 × ND643 -5.89** 0.39 15 SW89.52277 × V-12082 -2.75 -2.88** 40 V-13013 × V-12082 -1.95 -3.95** 16 Shahkar-2013 × V-
12056 -0.12 -1.31 41 V-13241 × V-12056 -2.39
** -2.45
17 Shahkar-2013 × MILLAT-11
-2.22 **
-1.81 42 V-13241 × Millat-11 -0.49 -2.61 **
18 Shahkar-2013 × Chenab-2000
1.18 0.89 43 V-13241 × Chenab-2000
2.91 ** 2.42
19 Shahkar-2013 × ND643 -1.22 -1.55 44 V-13241 × ND643 -2.49** 0.99 20 Shahkar-2013 × V-
12082 2.38 ** 3.79 ** 45 V-13241 × V-12082 2.45 ** 1.65
21 Miraj-2008 × V-12056 -3.59 **
-1.51 46 V-12103 × V-12056 -0.99 3.22 **
22 Miraj-2008 × Millat-11 -0.69 -4.01 **
47 V-12103 × Millat-11 -5.09 **
-1.28
23 Miraj-2008 × Chenab-2000
2.71 ** 0.02 48 V-12103 × Chenab-2000
-4.69 **
-1.25
24 Miraj-2008 × ND643 0.31 5.92 ** 49 V-12103 × ND643 9.91 ** -0.35 25 Miraj-2008 × V-12082 1.25 -0.41 50 V-12103 × V-12082 0.85 -0.35
124
4.2.20. 1000-Grain Weight
Positive and significant effects are desirable for 1000 gain weight. GCA range under normal
conditions for TGW -3.03 to 5.83. The highest positive significant values observed in V-
12103 (5.83) followed by V-13013 (2.13). Highest negatively significant values were
observed in Shahkar-13 (-3.03) and Faisalabad-08 (-2.17). From testers range is -0.97 to
1.24. Highest positive significant values observed by Chenab-2000 (1.24). Highest negatively
significant values was observed in Millat-11 (-0.97) (Table 4.5.5). Akbar et al., (2009) have
reported positive GCA effects for 1000-grain weight and spike length in bread wheat. Under
heat stressed conditions range of GCA for lines was -5.36 to 7.86. Highest positive
significant values were observed by Miraj-08 (7.86), V-12103 (3.19) and SW89.5277 (2.76).
Highest negatively significant values were observed in Faisalabad-08 (-5.36) and V-13241 (-
3.81) (Table 4.5.6). For testers range of GCA was -2.44 to 1.79. Shahkar-13 (1.79) and
SW89.5277 (1.11) showed positive and significant effects. Highest negatively significant
values were observed in V-13248 (-2.44).
Range of SCA was -5.62 to 6.55 under normal conditions. The highest positive significant
effects were observed in crosses viz. V-13241 × ND643 (6.55) followed by V-13013 × V-
12056 (5.30), V-12103 × V-12082 (4.67) and SW89.52277 × V-12082 (4.54) was with
highest negative significant value V-13013 × V-12082 (-5.62) and SW89.52277 × V-12056
(-4.88). In case of wheat, different for yield and yield related characters were considered as
desirable characters as studied by Anwar et al., 2011. Under heat stressed conditions SCA
ranged from -11.12 to 8.43. Highest positive significant effects were observed in following
crosses; Shahkar-2013 × Chenab-2000 (8.43), MISR 1 × V-12056 (6.07), Shahkar-2013 ×
ND643 (5.85) and SW89.52277 × Millat-11 (5.50) (Table 4.5.22). The highest negative
significant values were observed in Shahkar-2013 × Millat-11 (-11.12).
Our results represent the presence of dominance variance genetic effects that show non-
additive behavior for thousand-grain weight under both environments in wheat. The results
are supported by the findings of Rajara and Maheshwari (1996). Dhadhal et al. (2008) who
found that significant of non-additive and additive gene actions for almost all yield related
traits.
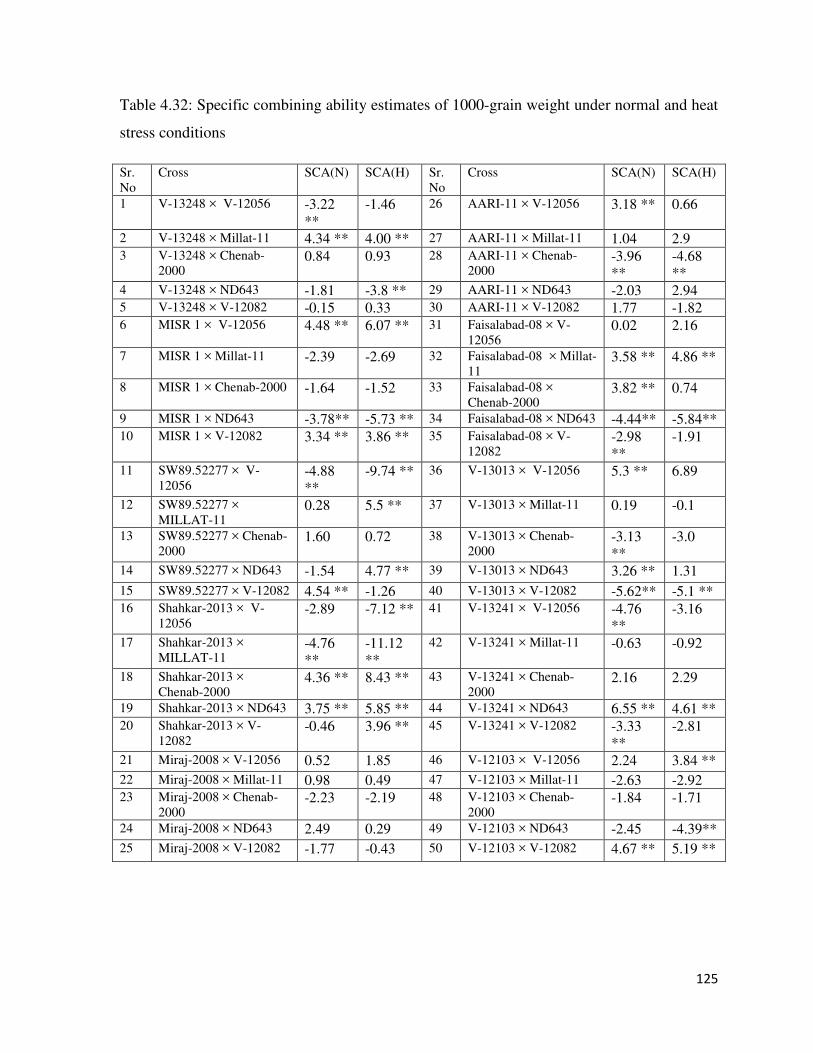
125
Table 4.32: Specific combining ability estimates of 1000-grain weight under normal and heat
stress conditions
Sr. No
Cross SCA(N) SCA(H) Sr. No
Cross SCA(N) SCA(H)
1 V-13248 × V-12056 -3.22 **
-1.46 26 AARI-11 × V-12056 3.18 ** 0.66
2 V-13248 × Millat-11 4.34 ** 4.00 ** 27 AARI-11 × Millat-11 1.04 2.9 3 V-13248 × Chenab-
2000 0.84 0.93 28 AARI-11 × Chenab-
2000 -3.96 **
-4.68 **
4 V-13248 × ND643 -1.81 -3.8 ** 29 AARI-11 × ND643 -2.03 2.94 5 V-13248 × V-12082 -0.15 0.33 30 AARI-11 × V-12082 1.77 -1.82 6 MISR 1 × V-12056 4.48 ** 6.07 ** 31 Faisalabad-08 × V-
12056 0.02 2.16
7 MISR 1 × Millat-11 -2.39 -2.69 32 Faisalabad-08 × Millat-11
3.58 ** 4.86 **
8 MISR 1 × Chenab-2000 -1.64 -1.52 33 Faisalabad-08 × Chenab-2000
3.82 ** 0.74
9 MISR 1 × ND643 -3.78** -5.73 ** 34 Faisalabad-08 × ND643 -4.44** -5.84** 10 MISR 1 × V-12082 3.34 ** 3.86 ** 35 Faisalabad-08 × V-
12082 -2.98 **
-1.91
11 SW89.52277 × V-12056
-4.88 **
-9.74 ** 36 V-13013 × V-12056 5.3 ** 6.89
12 SW89.52277 × MILLAT-11
0.28 5.5 ** 37 V-13013 × Millat-11 0.19 -0.1
13 SW89.52277 × Chenab-2000
1.60 0.72 38 V-13013 × Chenab-2000
-3.13 **
-3.0
14 SW89.52277 × ND643 -1.54 4.77 ** 39 V-13013 × ND643 3.26 ** 1.31 15 SW89.52277 × V-12082 4.54 ** -1.26 40 V-13013 × V-12082 -5.62** -5.1 ** 16 Shahkar-2013 × V-
12056 -2.89 -7.12 ** 41 V-13241 × V-12056 -4.76
** -3.16
17 Shahkar-2013 × MILLAT-11
-4.76 **
-11.12 **
42 V-13241 × Millat-11 -0.63 -0.92
18 Shahkar-2013 × Chenab-2000
4.36 ** 8.43 ** 43 V-13241 × Chenab-2000
2.16 2.29
19 Shahkar-2013 × ND643 3.75 ** 5.85 ** 44 V-13241 × ND643 6.55 ** 4.61 ** 20 Shahkar-2013 × V-
12082 -0.46 3.96 ** 45 V-13241 × V-12082 -3.33
** -2.81
21 Miraj-2008 × V-12056 0.52 1.85 46 V-12103 × V-12056 2.24 3.84 ** 22 Miraj-2008 × Millat-11 0.98 0.49 47 V-12103 × Millat-11 -2.63 -2.92 23 Miraj-2008 × Chenab-
2000 -2.23 -2.19 48 V-12103 × Chenab-
2000 -1.84 -1.71
24 Miraj-2008 × ND643 2.49 0.29 49 V-12103 × ND643 -2.45 -4.39** 25 Miraj-2008 × V-12082 -1.77 -0.43 50 V-12103 × V-12082 4.67 ** 5.19 **
126
4.2.21. Grain yield per plant
Positive and significant effects are desirable for grain yield per plant. GCA range for grain
yield per plant from -1.42 to 1.38 under normal conditions as shown in Table 4.5.5. The
highest positive significant values were observed in SW89.5277 (1.38) and V-13248 (0.98).
Rest of all others showed negative and non-significant effects. From testers range is -0.42 to
0.68. Highest positive significant values were observed by V-12056 (0.68) and Chenab-2000
(0.58). It surpassed the best performing parents and possessed the most desirable SCA effect
for grain yield. These results are in uniformity with those obtained by El-Hossary et al.,
(2000), Hamada et al., (2002), Koumber et al., (2006), Moussa and Morad (2009). Our
results also show similarities with those of Jatav et al., (2014) who also reported that general
combining ability effects change with various traits and pointed that high GCA value for
lines are important for traits like grain yield should be used in future breeding programs to
improve wheat yield. Under heat stressed conditions range of GCA for lines was -1.80 to
1.31. Highest positive significant values observed by SW89.5277 (1.31) and V-13013 (1.30).
Rest of all other showed negative and non-significant effects. For testers range of GCA -0.45
to 0.70. Chenab-2000 (0.70) (Table 4.16) showed positive and significant effects. All other
testers showed undesirable effects. Results revealed that among line SW89.5277 showed
highest positive significance effects under both normal and heat stressed conditions. From
testers Chenab-2000 performed best all type of environments. For grain yield per plant
positive estimates needed for general combining ability effects. Similar results were also
found by (Khan and Khan, 1999) and (Malik et al., 2005).
Range of SCA was noted -6.88 to 6.12 under normal conditions. High positive significant
effects were observed in crosses viz. Shahkar-2013 × V-12056 (6.12), Shahkar-2013 ×
Chenab-2000 (5.22), V-13248 × ND643 (4.62), V-13241 × Millat-11 (4.32) with highest
negative significant value for cross Shahkar-2013 × V-12082 was -6.88. Similar results were
also reported by (Saeed et al., 2001; Awan et al., 2005; Hassan et al., 2007; Iqbal 2007;
Singh et al., 2007; Akbar et al., 2009). Under heat stressed conditions SCA ranged from -
3.67 to 3.64. The highest positive significant effects were observed in following crosses;
Shahkar-2013 × Millat-11 (3.64), V-13241 × V-12056 (3.60), MISR 1 × V-12056 (2.66) and
Faisalabad-08 × V-12082 (2.36). Highest negative significant values observed in V-13248 ×
127
V-12056 (-3.67) (Table 4.33). Corral (1983), Sarkar et al., (1987) and Usman (1998) have
also reported similar results.
These studies displayed higher dominance variance than additive representing non-additive
gene action for this trait under normal and heat stressed conditions. Higher estimates of SCA
then GCA represent dominance type of gene action for grain yield per plant. Some scientists
also emphasize the presence of non-additive genetic control in wheat for grain yield (Mishra
et al., 1994; Chowdhry et al., 1999).
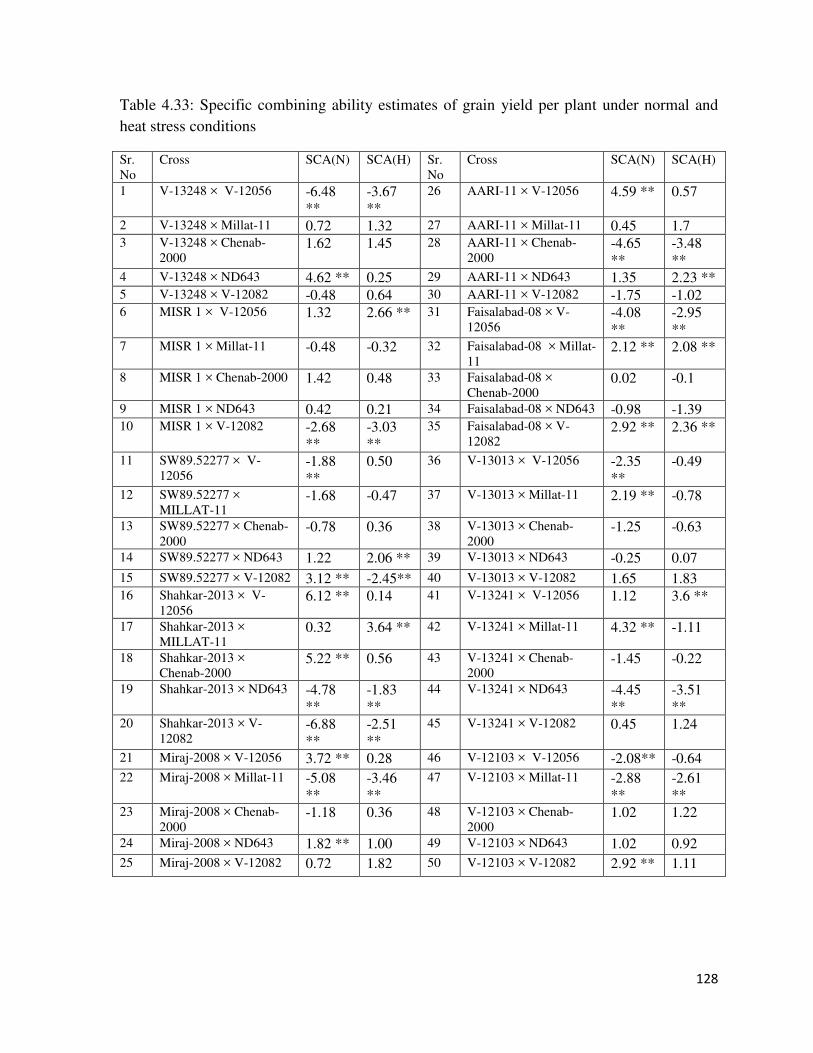
128
Table 4.33: Specific combining ability estimates of grain yield per plant under normal and heat stress conditions
Sr. No
Cross SCA(N) SCA(H) Sr. No
Cross SCA(N) SCA(H)
1 V-13248 × V-12056 -6.48 **
-3.67 **
26 AARI-11 × V-12056 4.59 ** 0.57
2 V-13248 × Millat-11 0.72 1.32 27 AARI-11 × Millat-11 0.45 1.7 3 V-13248 × Chenab-
2000 1.62 1.45 28 AARI-11 × Chenab-
2000 -4.65 **
-3.48 **
4 V-13248 × ND643 4.62 ** 0.25 29 AARI-11 × ND643 1.35 2.23 ** 5 V-13248 × V-12082 -0.48 0.64 30 AARI-11 × V-12082 -1.75 -1.02 6 MISR 1 × V-12056 1.32 2.66 ** 31 Faisalabad-08 × V-
12056 -4.08 **
-2.95 **
7 MISR 1 × Millat-11 -0.48 -0.32 32 Faisalabad-08 × Millat-11
2.12 ** 2.08 **
8 MISR 1 × Chenab-2000 1.42 0.48 33 Faisalabad-08 × Chenab-2000
0.02 -0.1
9 MISR 1 × ND643 0.42 0.21 34 Faisalabad-08 × ND643 -0.98 -1.39 10 MISR 1 × V-12082 -2.68
** -3.03 **
35 Faisalabad-08 × V-12082
2.92 ** 2.36 **
11 SW89.52277 × V-12056
-1.88 **
0.50 36 V-13013 × V-12056 -2.35 **
-0.49
12 SW89.52277 × MILLAT-11
-1.68 -0.47 37 V-13013 × Millat-11 2.19 ** -0.78
13 SW89.52277 × Chenab-2000
-0.78 0.36 38 V-13013 × Chenab-2000
-1.25 -0.63
14 SW89.52277 × ND643 1.22 2.06 ** 39 V-13013 × ND643 -0.25 0.07 15 SW89.52277 × V-12082 3.12 ** -2.45** 40 V-13013 × V-12082 1.65 1.83 16 Shahkar-2013 × V-
12056 6.12 ** 0.14 41 V-13241 × V-12056 1.12 3.6 **
17 Shahkar-2013 × MILLAT-11
0.32 3.64 ** 42 V-13241 × Millat-11 4.32 ** -1.11
18 Shahkar-2013 × Chenab-2000
5.22 ** 0.56 43 V-13241 × Chenab-2000
-1.45 -0.22
19 Shahkar-2013 × ND643 -4.78 **
-1.83 **
44 V-13241 × ND643 -4.45 **
-3.51 **
20 Shahkar-2013 × V-12082
-6.88 **
-2.51 **
45 V-13241 × V-12082 0.45 1.24
21 Miraj-2008 × V-12056 3.72 ** 0.28 46 V-12103 × V-12056 -2.08** -0.64 22 Miraj-2008 × Millat-11 -5.08
** -3.46 **
47 V-12103 × Millat-11 -2.88 **
-2.61 **
23 Miraj-2008 × Chenab-2000
-1.18 0.36 48 V-12103 × Chenab-2000
1.02 1.22
24 Miraj-2008 × ND643 1.82 ** 1.00 49 V-12103 × ND643 1.02 0.92 25 Miraj-2008 × V-12082 0.72 1.82 50 V-12103 × V-12082 2.92 ** 1.11

129
4.2.22. Protein
High protein had direct and positive association with quality of bread making with respect to
structure of proteins (Gooding et al., 2003).
Under normal climatic conditions GCA showed range for lines from -0.82 to 1.06. The
highest positive significant values were observed in MISR1 (1.06) followed by SW89.5277
(0.73), AARI-11 (0.40) and Miraj-08 (0.19). Range for testers was -0.33 to 0.57. High
positive significant values were observed in Millat-11 (0.57) and Chenab- 2000 (0.26). Under
heat stress conditions range of GCA for lines was -0.83 to 1.07. Highest negative significant
value was observed by V-1303 (-0.83) (Table 4.15). From lines highest positive significant
values were observed by MISR1 (1.07), SW89.5277 (0.72) and AARI-11 (0.49). Testers
showed range of -0.32 to 0.56. Highest positive significant values were recorded in Millat-11
(0.56) and Chenab-2000 (0.21). These results show from parents (Lines) MISR1, SW89.5277
and AARI-11 show highest positive significance under both environmental conditions but
from testers Millat-11 and Chenab-2000 performed best as depicted in Table 4.16.
Range of SCA under normal conditions showed -2.25 to 2.29. The highest positive
significant results were recorded in cross AARI-11 × V-12082 (2.29) followed by V-13241 ×
V-12056 (1.89), Shahkar-2013 × ND643 (1.34) and MISR 1 × V-12056 (1.25). Highest
negative significant value was exhibited as AARI-11 × V-12056 (-2.25). Usually Specific
combining ability effects do not have noticeable contribution in self-pollinated crops like
wheat, except wherever exploitation for the commercial heterosis is needed (Menon and
Sharma 1997; Singh 2002). Under high temperature stress, range of SCA for protein was
observed as -2.25 to 2.16. Highest positive significant values were observed in following
crosses; V-13248 × Chenab-2000 (2.16), V-13241 × V-12056 (1.88), V-13248 × ND643
(1.57) and Miraj-2008 × V-12056 (1.28). Negative estimates were observed as highly
significant in cross AARI-11 × V-12056 (-2.15) (Table 4.34). Some researchers found
increase in the protein contents in response to heat stress during grain filling stage
(Blumenthal et al. (1995), Gooding et al. (2003), Spiertz et al. (2006), Abdullah et al. (2007),
Dias et al. (2008), Balla et al. (2009), Hakim et al. (2012).
High dominance estimates from additive variance show presence of non-additive gene action
in this study. Kraljevic-Balalic et al., (1982) observed the non-additive type of gene action
130
and show similar kind of results as shown in this study. Wang and Lu (1991), Rong et al.,
(2001), Joshi et al., (2004), Lysa (2009) and Akram et al., (2011) reported additive gene
action for protein in wheat that depicted different find of results from these findings.

131
Table 4.34: Specific combining ability estimates of protein under normal and heat stress conditions
Sr. No
Cross SCA(N) SCA(H) Sr. No
Cross SCA(N) SCA(H)
1 V-13248 × V-12056 0.03 -0.28 26 AARI-11 × V-12056 -2.25** -2.10** 2 V-13248 × Millat-11 -0.82** -0.86** 27 AARI-11 × Millat-11 0.71 ** 0.91 ** 3 V-13248 × Chenab-
2000 0.09 0.09 28 AARI-11 × Chenab-
2000 0.31 ** 0.27
4 V-13248 × ND643 1.14 ** 1.57 ** 29 AARI-11 × ND643 -1.05 **
-1.24 **
5 V-13248 × V-12082 -0.43** -0.52** 30 AARI-11 × V-12082 2.29 ** 2.16 ** 6 MISR 1 × V-12056 1.25 ** 1.22 ** 31 Faisalabad-08 × V-
12056 -0.73 **
-0.73 **
7 MISR 1 × Millat-11 0.35 ** 0.02 32 Faisalabad-08 × Millat-11
0.98 ** 0.99 **
8 MISR 1 × Chenab-2000 -0.64 **
-0.61 **
33 Faisalabad-08 × Chenab-2000
-0.72 **
-0.66 **
9 MISR 1 × ND643 0.21 0.17 34 Faisalabad-08 × ND643 -0.30 -0.32** 10 MISR 1 × V-12082 -1.16
** -0.81 **
35 Faisalabad-08 × V-12082
0.76 ** 0.73 **
11 SW89.52277 × V-12056
0.27 0.27 36 V-13013 × V-12056 0.03 0.02
12 SW89.52277 × MILLAT-11
-0.12 -0.11 37 V-13013 × Millat-11 -0.37 **
-0.36 **
13 SW89.52277 × Chenab-2000
0.98 ** 1.04 ** 38 V-13013 × Chenab-2000
0.54 ** 0.59 **
14 SW89.52277 × ND643 0.34 ** 0.31 ** 39 V-13013 × ND643 0.39 ** 0.37 ** 15 SW89.52277 × V-12082 -1.47
** -1.50 **
40 V-13013 × V-12082 -0.58 **
-0.62 **
16 Shahkar-2013 × V-12056
-0.72 **
-0.69 **
41 V-13241 × V-12056 1.89 ** 1.88 **
17 Shahkar-2013 × MILLAT-11
-1.88 **
-1.84 **
42 V-13241 × Millat-11 0.39 ** 0.40 **
18 Shahkar-2013 × Chenab-2000
0.89 ** 0.98 ** 43 V-13241 × Chenab-2000
0.8 ** 0.85 **
19 Shahkar-2013 × ND643 1.34 ** 1.19 ** 44 V-13241 × ND643 -1.75 **
-1.77 **
20 Shahkar-2013 × V-12082
0.37 ** 0.37 ** 45 V-13241 × V-12082 -1.32 **
-1.36 **
21 Miraj-2008 × V-12056 1.1 ** 1.28 ** 46 V-12103 × V-12056 -0.85 **
-0.86 **
22 Miraj-2008 × Millat-11 1.02 ** 1.10 ** 47 V-12103 × Millat-11 -0.25 -0.24 23 Miraj-2008 × Chenab-
2000 -1.79 **
-2.15 **
48 V-12103 × Chenab-2000
-0.44 **
-0.39 **
24 Miraj-2008 × ND643 -0.82 **
-0.77 **
49 V-12103 × ND643 0.51 ** 0.49 **
25 Miraj-2008 × V-12082 0.5 ** 0.54 ** 50 V-12103 × V-12082 1.04 ** 1.00 **
132
4.2.23. Moisture
Under normal climatic conditions, lines showed range of GCA from -0.20 to 0.18. Positive
significant estimates were observed in AARI 11 (0.18) and V-12103 (0.16). Only one value
of V-13241 (-0.20) showed negative and high significance. Range of GCA for testers was -
0.15 to 0.11 (Table 4.15). Only one positive and highly significant value V-12056 (0.11) and
negatively significant value ND643 (-0.15) were observed. Under heat stress, lines showed
range of variation for GCA as -0.31 to 0.31. Positive significant value was observed in
SW89.5277 (0.31) while negatively significant value was observed in V-13241 (-0.31)
(Table 4.16). For testers range of variation was -0.05 to 0.16. Highly positive significant
values were observed in ND643 (0.16) and negatively significant value was Millat-11 (-
0.05).
SCA range under normal conditions was -0.64 to 0.51. Highly positive significant values
were observed in Faisalabad-08 × ND643 (0.51) and SW89.52277 × V-12082 (0.42).
Negatively high significant values were observed in Faisalabad-08 × V-12082 (-0.64) and
FAISALABAD-08 × MILLAT-11 (-0.35). Under heat stressed conditions range of SCA
showed to -0.59 to 0.95. Highest positive significant values were observed in SHAHKAR-
2013 × V-12082 (0.95), V-13013 × MILLAT-11 (0.58), V-13248 × Millat-11 (0.56) and
AARI-11 × ND643 (0.49) (Table 4.35). Negative and significant values were V-13013 × V-
12082 (-0.59) and Shahkar-2013 × Chenab-2000 (-0.51).
Higher estimates of dominance variance then additive variance represent non-additive gene
action for moisture contents in wheat grain. Barnard et al., (2002) while working on wheat
for quality traits reported similar non-additive type of gene action for moisture as findings
from this study showed similar result for this trait.

133
Table 4.35: Specific combining ability estimates of moisture under normal and heat stress conditions
Sr. No
Cross SCA(N) SCA(H) Sr. No
Cross SCA(N) SCA(H)
1 V-13248 × V-12056 -0.05 0.19 26 AARI-11 × V-12056 0.03 0.12 2 V-13248 × Millat-11 0.02 0.56 ** 27 AARI-11 × Millat-11 -0.03 -0.24 3 V-13248 × Chenab-
2000 0.29 -0.18 28 AARI-11 × Chenab-
2000 -0.03 -0.16
4 V-13248 × ND643 -0.33** -0.21 29 AARI-11 × ND643 -0.08 0.49 ** 5 V-13248 × V-12082 0.06 -0.37
** 30 AARI-11 × V-12082 0.11 -0.2
6 MISR 1 × V-12056 -0.2 0.12 31 Faisalabad-08 × V-12056
0.22 -0.26
7 MISR 1 × Millat-11 0.11 -0.09 32 Faisalabad-08 × Millat-11
-0.35 **
-0.02
8 MISR 1 × Chenab-2000 -0.22 -0.1 33 Faisalabad-08 × Chenab-2000
0.26 0.01
9 MISR 1 × ND643 0.03 0.15 34 Faisalabad-08 × ND643 0.51 ** -0.06 10 MISR 1 × V-12082 0.28 -0.08 35 Faisalabad-08 × V-
12082 -0.64 **
0.33
11 SW89.52277 × V-12056
-0.16 0.08 36 V-13013 × V-12056 0.04 -0.1
12 SW89.52277 × MILLAT-11
0.05 -0.27 37 V-13013 × Millat-11 0.25 0.58 **
13 SW89.52277 × Chenab-2000
0.09 0.39 ** 38 V-13013 × Chenab-2000
0.25 -0.22
14 SW89.52277 × ND643 -0.4 ** -0.13 39 V-13013 × ND643 -0.33 **
0.32
15 SW89.52277 × V-12082 0.42 ** -0.07 40 V-13013 × V-12082 -0.21 -0.59** 16 Shahkar-2013 × V-
12056 0.00 -0.33 41 V-13241 × V-12056 0.04 0.17
17 Shahkar-2013 × MILLAT-11
0.17 ** -0.32 42 V-13241 × Millat-11 -0.26 -0.06
18 Shahkar-2013 × Chenab-2000
-0.39 **
-0.51 **
43 V-13241 × Chenab-2000
0.05 -0.01
19 Shahkar-2013 × ND643 0.32 0.21 44 V-13241 × ND643 0.26 -0.18 20 Shahkar-2013 × V-
12082 -0.09 0.95 ** 45 V-13241 × V-12082 -0.08 0.09
21 Miraj-2008 × V-12056 0.04 0.21 46 V-12103 × V-12056 0.04 -0.2 22 Miraj-2008 × Millat-11 0.11 0.07 47 V-12103 × Millat-11 -0.05 -0.22 23 Miraj-2008 × Chenab-
2000 -0.39 0.41 ** 48 V-12103 × Chenab-
2000 0.09 0.38 **
24 Miraj-2008 × ND643 0.33 -0.26 49 V-12103 × ND643 -0.3 -0.34 **
25 Miraj-2008 × V-12082 -0.08 -0.44 **
50 V-12103 × V-12082 0.22 0.37 **
134
4.2.24. Ash
General combining ability values for ash showed the range of -0.13 to 0.12. High positive
significant values were as under; V-13241 (0.12), V-12103 (0.11) and SW89.5277 (0.06).
Negative and significant values were observed for Shahkar-13 (-0.13) and Miraj-08 (-0.07).
For testers range of general combining ability ranges from -0.06 to 0.06. Positive significant
values were for testers Miraj-08 (0.06) and V-13248 (0.05) as shown in Table 4.15. Under
heat stressed conditions range of general combining ability falls as -0.08 to 0.06. Positively
highest significant values were V-13241 (0.06), AARI 11(00.05), V-12103 (0.05) and
SW89.5277 (0.04). For testers range of GCA was -0.02 to 0.05. Only Chenab-2000 showed
positive significant values of (0.05) of testers under heat stressed conditions (Table 4.16).
Specific combining ability estimates ranged from -0.27 to 0.23. High positive significant
values were V-13013 × ND643 (0.23), SW89.52277 × ND643 (0.21), AARI-11 × Chenab-
2000 (0.18) and MISR 1 × V-12082 (0.17). SCA under heat stressed conditions showed the
range of estimates as -0.31 to 0.33. The highest negative significant value was observed by
cross V-13013 × Chenab-2000 (-0.31). Highest positive significant values were observed by
V-13013 × ND643 (0.33), V-13248 × Chenab-2000 (0.24), Shahkar-2013 × V-12056 (0.22)
and V-13241 × Millat-11 (0.19) (Table 4.36).
Higher SCA variance observed then GCA variance for this trait representing dominance type
of variance. Analysis shown dominance gene action for ash parentage in wheat for both
normal and heat stressed conditions that show similar findings with results of Padhar et al.
(2010) and Adel et al. (2013). Whereas over dominance for ash was reported by Gami, et al.
(2011). Parent genotypes having low GCA variance may have the potential indicators that
these can be exploited through hybridization with better general combiner.

135
Table 4.36: Specific combining ability estimates of ash under normal and heat stress conditions
Sr. No
Cross SCA(N) SCA(H) Sr. No
Cross SCA(N) SCA(H)
1 V-13248 × V-12056 0.02 0.01 26 AARI-11 × V-12056 0.09 ** 0.06 2 V-13248 × Millat-11 0.06 0.01 27 AARI-11 × Millat-11 -0.10 ** 0.06 3 V-13248 × Chenab-
2000 -0.03 0.24 ** 28 AARI-11 × Chenab-
2000 0.18 ** -0.05
4 V-13248 × ND643 -0.15 **
-0.15 **
29 AARI-11 × ND643 -0.23 ** -0.08
5 V-13248 × V-12082 0.10 ** -0.11 **
30 AARI-11 × V-12082 0.06 0.02
6 MISR 1 × V-12056 0.15 ** -0.07 31 Faisalabad-08 × V-12056
0.04 -0.06
7 MISR 1 × Millat-11 0.00 -0.16 **
32 Faisalabad-08 × Millat-11
0.01 -0.10 **
8 MISR 1 × Chenab-2000 -0.16 **
0.13 ** 33 Faisalabad-08 × Chenab-2000
0.12 ** 0.14 **
9 MISR 1 × ND643 -0.16 **
-0.02 34 Faisalabad-08 × ND643 -0.01 0.13 **
10 MISR 1 × V-12082 0.17 ** 0.11 ** 35 Faisalabad-08 × V-12082
-0.16 ** -0.10 **
11 SW89.52277 × V-12056
-0.02 -0.03 36 V-13013 × V-12056 0.04 -0.02
12 SW89.52277 × MILLAT-11
-0.24 -0.13 **
37 V-13013 × Millat-11 0.13 ** -0.01
13 SW89.52277 × Chenab-2000
-0.02 0.09 ** 38 V-13013 × Chenab-2000
-0.13 ** -0.31 **
14 SW89.52277 × ND643 0.21 ** 0.03 39 V-13013 × ND643 0.23 ** 0.33 ** 15 SW89.52277 × V-12082 0.07 ** 0.03 40 V-13013 × V-12082 -0.27 ** 0.01 16 Shahkar-2013 × V-
12056 -0.09 **
0.22 ** 41 V-13241 × V-12056 -0.04 -0.15 **
17 Shahkar-2013 × MILLAT-11
0.11 ** -0.05 42 V-13241 × Millat-11 0.12 ** 0.19 **
18 Shahkar-2013 × Chenab-2000
0.04 -0.01 43 V-13241 × Chenab-2000
-0.07 ** 0.06
19 Shahkar-2013 × ND643 -0.15** -0.13** 44 V-13241 × ND643 0.09 ** 0.05 20 Shahkar-2013 × V-
12082 0.10 ** -0.04 45 V-13241 × V-12082 -0.1 ** -0.15
** 21 Miraj-2008 × V-12056 -0.09
** -0.01 46 V-12103 × V-12056 -0.11 ** 0.05
22 Miraj-2008 × Millat-11 0.08 ** 0.14 ** 47 V-12103 × Millat-11 -0.17 ** 0.05 23 Miraj-2008 × Chenab-
2000 -0.01 -0.19
** 48 V-12103 × Chenab-
2000 0.10 ** -0.10
** 24 Miraj-2008 × ND643 0.12 ** -0.04 49 V-12103 × ND643 0.04 -0.12
** 25 Miraj-2008 × V-12082 -0.11
** 0.10 ** 50 V-12103 × V-12082 0.14 ** 0.13 **
136
4.2.25. Gluten
Under normal conditions, general combining ability for lines showed range of -1.26 to 1.41.
The highest positive significant values were observed by Faisalabad-08 (1.41) followed by
V-13013 (1.21) and V-12103 (1.21). Rest of all other lines showed negative or non-
significant results. Among testers range for general combining ability showed to -0.91 to
0.79. Only one tester V-12056 showed (0.97) (Table 4.15). All others were undesirable
results for the said trait. Under heat stressed conditions range of lines for general combining
ability effects was -1.68 to 1.46. Highest positively significant values were Faisalabad-08
(1.460, V-12103 (1.28) and V-13013 (1.11). Range of general combining ability for testers
showed -1.25 to 0.93. Only one tester showed positive significance as V-12056 (0.93) (Table
4.16). All others testers were undesirable for the trait under study.
Usually Specific combining ability effects do not have noticeable contribution in self-
pollinated crops like wheat, except wherever exploitation for the commercial heterosis is
needed (Menon and Sharma 1997; Singh 2002). Range of SCA for normal environment was -
4.04 to 4.05. Positive significant effects with peak values were observed by cross V-12103 ×
V-12082 (4.05) followed by AARI-11 × V-12056 (3.70), V-13013 × V-12082 (3.57) and
Shahkar-2013 × Chenab-2000 (3.43). Under stressed conditions range of SCA varies from -
4.29 to 3.67. Highest positive significant values were depicted in following crosses viz.
Shahkar-2013 × Chenab-2000 (3.67), MISR 1 × V-12082 (3.61), AARI-11 × V-12056 (3.48)
and Faisalabad-08 × ND643 (3.33) (Table 4.37).
Results concluded that higher estimates of specific combining ability than general combining
ability estimates represent the presence of dominance gene action for gluten parentage in
wheat for both normal and heat stressed conditions. Gami, et al. (2011) reported over
dominance for this trait. Non-additive genetic effects were observed in this study and
reported by some previous scientists as Padhar et al. (2010) and Adel et al. (2013) for gluten
in wheat grain that measure wheat quality.
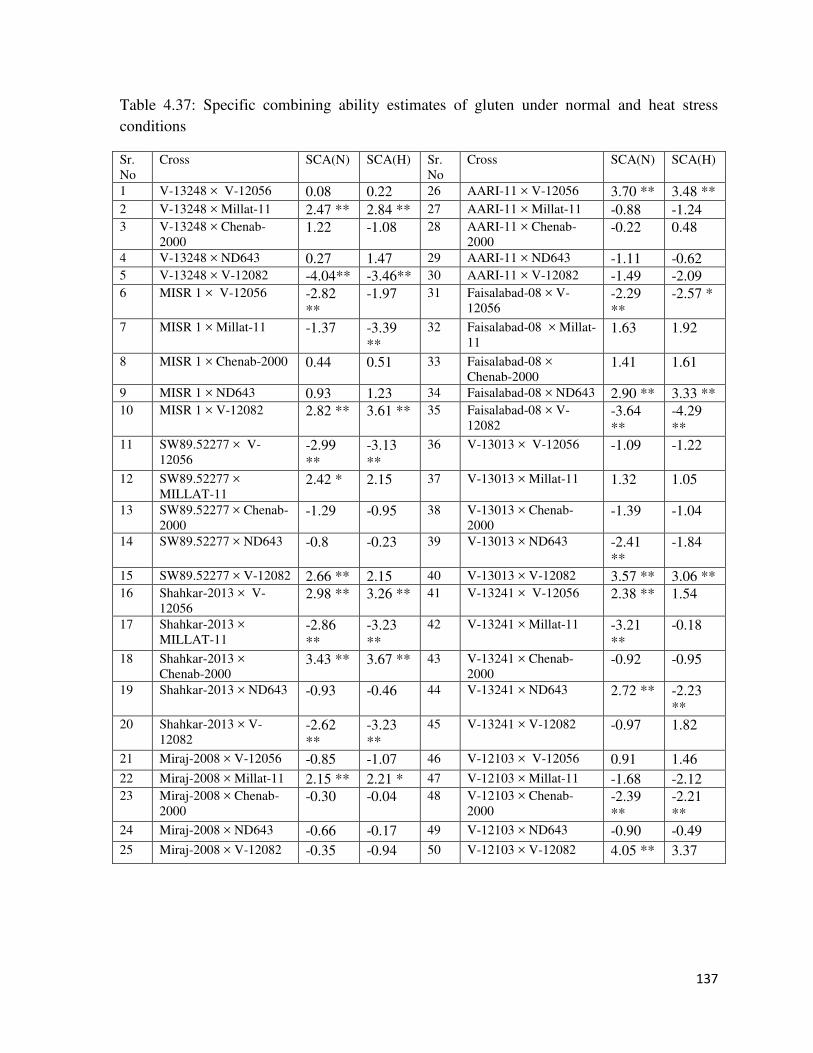
137
Table 4.37: Specific combining ability estimates of gluten under normal and heat stress conditions
Sr. No
Cross SCA(N) SCA(H) Sr. No
Cross SCA(N) SCA(H)
1 V-13248 × V-12056 0.08 0.22 26 AARI-11 × V-12056 3.70 ** 3.48 ** 2 V-13248 × Millat-11 2.47 ** 2.84 ** 27 AARI-11 × Millat-11 -0.88 -1.24 3 V-13248 × Chenab-
2000 1.22 -1.08 28 AARI-11 × Chenab-
2000 -0.22 0.48
4 V-13248 × ND643 0.27 1.47 29 AARI-11 × ND643 -1.11 -0.62 5 V-13248 × V-12082 -4.04** -3.46** 30 AARI-11 × V-12082 -1.49 -2.09 6 MISR 1 × V-12056 -2.82
** -1.97 31 Faisalabad-08 × V-
12056 -2.29 **
-2.57 *
7 MISR 1 × Millat-11 -1.37 -3.39 **
32 Faisalabad-08 × Millat-11
1.63 1.92
8 MISR 1 × Chenab-2000 0.44 0.51 33 Faisalabad-08 × Chenab-2000
1.41 1.61
9 MISR 1 × ND643 0.93 1.23 34 Faisalabad-08 × ND643 2.90 ** 3.33 ** 10 MISR 1 × V-12082 2.82 ** 3.61 ** 35 Faisalabad-08 × V-
12082 -3.64 **
-4.29 **
11 SW89.52277 × V-12056
-2.99 **
-3.13 **
36 V-13013 × V-12056 -1.09 -1.22
12 SW89.52277 × MILLAT-11
2.42 * 2.15 37 V-13013 × Millat-11 1.32 1.05
13 SW89.52277 × Chenab-2000
-1.29 -0.95 38 V-13013 × Chenab-2000
-1.39 -1.04
14 SW89.52277 × ND643 -0.8 -0.23 39 V-13013 × ND643 -2.41 **
-1.84
15 SW89.52277 × V-12082 2.66 ** 2.15 40 V-13013 × V-12082 3.57 ** 3.06 ** 16 Shahkar-2013 × V-
12056 2.98 ** 3.26 ** 41 V-13241 × V-12056 2.38 ** 1.54
17 Shahkar-2013 × MILLAT-11
-2.86 **
-3.23 **
42 V-13241 × Millat-11 -3.21 **
-0.18
18 Shahkar-2013 × Chenab-2000
3.43 ** 3.67 ** 43 V-13241 × Chenab-2000
-0.92 -0.95
19 Shahkar-2013 × ND643 -0.93 -0.46 44 V-13241 × ND643 2.72 ** -2.23 **
20 Shahkar-2013 × V-12082
-2.62 **
-3.23 **
45 V-13241 × V-12082 -0.97 1.82
21 Miraj-2008 × V-12056 -0.85 -1.07 46 V-12103 × V-12056 0.91 1.46 22 Miraj-2008 × Millat-11 2.15 ** 2.21 * 47 V-12103 × Millat-11 -1.68 -2.12 23 Miraj-2008 × Chenab-
2000 -0.30 -0.04 48 V-12103 × Chenab-
2000 -2.39 **
-2.21 **
24 Miraj-2008 × ND643 -0.66 -0.17 49 V-12103 × ND643 -0.90 -0.49 25 Miraj-2008 × V-12082 -0.35 -0.94 50 V-12103 × V-12082 4.05 ** 3.37

138
4.2.26. Starch
For starch, positive GCA estimates are needed are positive while negative and other non-
significant are undesirable. GCA values show wide range of variation in this trait for both
lines and testers. Range of GCA under normal conditions for starch was -0.87 to 0.56 (Table
4.15). Higher positive significant GCA effects were shown by following lines; V-13248
(0.56), MISR-1 (0.50), Faisalabad-08 (0.44) and AARI-11 (0.42). The testers showed range
of estimates as -0.32 to 0.49. Positive significant estimates represented by V-12056 (0.49).
Under high temperature, stress lines showed range of -0.98 to 0.39. Highest positive
significant GCA effects were noticed in MISR-1 (0.39) and AARI-11 (0.27), while all others
showed negative and non-significant results. The testers showed range of -0.26 to 0.20 with
no positive significant value (Table 4.16). This represents that testers showed undesirable
results for this trait.
Specific combining ability for starch desirable effects are positive and significant while
negative and non-significant are undesirable and not needed. SCA showed wide range of
variation for this trait. Range of SCA under normal conditions represented -1.67 to 1.25.
Highest positive significant value were represented in these crosses; V-13248 × V-12056
(1.25), V-13241 × Millat-11 (1.21), V-13013 × Chenab-2000 (1.01) and AARI-11 × ND643
(0.93). Under heat, stressed conditions range of effects was -2.43 to 1.95 (Table 4.38). (–
2.43) was expressed in V-13013 × ND643 as highest negatively significant value. Highest
positively significant value for this trait was expressed in these crosses; AARI-11 × ND643
(1.95), V-13241 × Millat-11 (1.26), V-13013 × V-12082 (1.08) and V-13248 × V-12082
(0.96).
Higher estimates of SCA then GCA represent dominance type of gene action for this trait in
normal as well as heat stress conditions. As results show dominance variance, possess higher
estimations than additive variance that show non-additive behavior for starch percentage in
wheat grain quality.
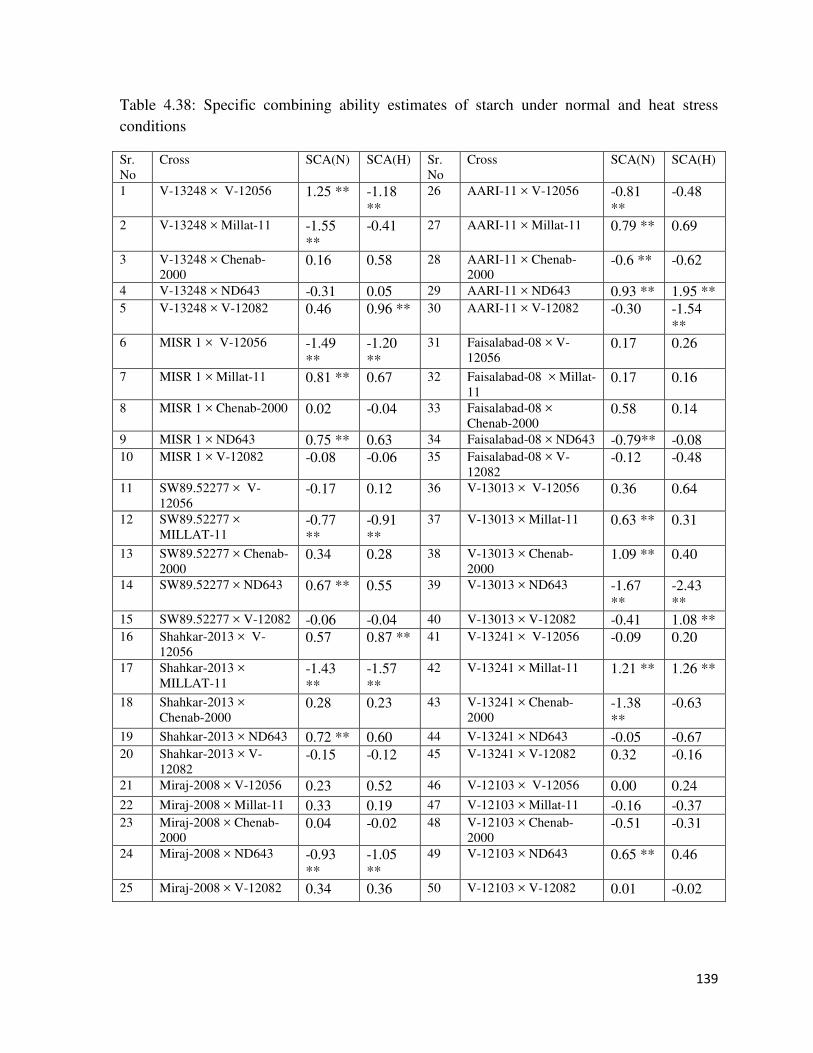
139
Table 4.38: Specific combining ability estimates of starch under normal and heat stress conditions
Sr. No
Cross SCA(N) SCA(H) Sr. No
Cross SCA(N) SCA(H)
1 V-13248 × V-12056 1.25 ** -1.18 **
26 AARI-11 × V-12056 -0.81 **
-0.48
2 V-13248 × Millat-11 -1.55 **
-0.41 27 AARI-11 × Millat-11 0.79 ** 0.69
3 V-13248 × Chenab-2000
0.16 0.58 28 AARI-11 × Chenab-2000
-0.6 ** -0.62
4 V-13248 × ND643 -0.31 0.05 29 AARI-11 × ND643 0.93 ** 1.95 ** 5 V-13248 × V-12082 0.46 0.96 ** 30 AARI-11 × V-12082 -0.30 -1.54
** 6 MISR 1 × V-12056 -1.49
** -1.20 **
31 Faisalabad-08 × V-12056
0.17 0.26
7 MISR 1 × Millat-11 0.81 ** 0.67 32 Faisalabad-08 × Millat-11
0.17 0.16
8 MISR 1 × Chenab-2000 0.02 -0.04 33 Faisalabad-08 × Chenab-2000
0.58 0.14
9 MISR 1 × ND643 0.75 ** 0.63 34 Faisalabad-08 × ND643 -0.79** -0.08 10 MISR 1 × V-12082 -0.08 -0.06 35 Faisalabad-08 × V-
12082 -0.12 -0.48
11 SW89.52277 × V-12056
-0.17 0.12 36 V-13013 × V-12056 0.36 0.64
12 SW89.52277 × MILLAT-11
-0.77 **
-0.91 **
37 V-13013 × Millat-11 0.63 ** 0.31
13 SW89.52277 × Chenab-2000
0.34 0.28 38 V-13013 × Chenab-2000
1.09 ** 0.40
14 SW89.52277 × ND643 0.67 ** 0.55 39 V-13013 × ND643 -1.67 **
-2.43 **
15 SW89.52277 × V-12082 -0.06 -0.04 40 V-13013 × V-12082 -0.41 1.08 ** 16 Shahkar-2013 × V-
12056 0.57 0.87 ** 41 V-13241 × V-12056 -0.09 0.20
17 Shahkar-2013 × MILLAT-11
-1.43 **
-1.57 **
42 V-13241 × Millat-11 1.21 ** 1.26 **
18 Shahkar-2013 × Chenab-2000
0.28 0.23 43 V-13241 × Chenab-2000
-1.38 **
-0.63
19 Shahkar-2013 × ND643 0.72 ** 0.60 44 V-13241 × ND643 -0.05 -0.67 20 Shahkar-2013 × V-
12082 -0.15 -0.12 45 V-13241 × V-12082 0.32 -0.16
21 Miraj-2008 × V-12056 0.23 0.52 46 V-12103 × V-12056 0.00 0.24 22 Miraj-2008 × Millat-11 0.33 0.19 47 V-12103 × Millat-11 -0.16 -0.37 23 Miraj-2008 × Chenab-
2000 0.04 -0.02 48 V-12103 × Chenab-
2000 -0.51 -0.31
24 Miraj-2008 × ND643 -0.93 **
-1.05 **
49 V-12103 × ND643 0.65 ** 0.46
25 Miraj-2008 × V-12082 0.34 0.36 50 V-12103 × V-12082 0.01 -0.02

140
4.2.27. Test Weight
Test weight provide information about flexibility to survive of a genotype in an environment.
It depends on various characters like size of grain, shape and density of seed (Costa et al.,
2013). Increased in the mass of hectoliter resulted more dense and compact voulume of
grains. Positive significant GCA values of test weight normally desired while negative and
non-significant values are undesirable.
Range of GCA for test weight was recorded in this experiment under normal conditions as -
1.34 to 0.74 for different lines as shown in Table 4.15. Highest positive significant values
was observed for Faislabad-08 (0.74), while all remaining values showed undesirable results
for other lines. Testers showed the range of -0.66 to 0.93. Millat-11 (0.93) and V-12082
(0.55) observed highest positive value for this trait. Rest of all testers showed undesirable
characteristics for this trait. Under heat stressed conditions, the effect of GCA showed a
range of -01.17 to 1.25 for lines. Highest GCA estimates for lines were observed in
Faisalabad-08 (1.25), V-13248 (1.00) and SW89.5277 (0.83). Range of GCA for testers was -
0.30 to 0.86 (Table 4.5.6). Among testers ND643, show maximum GCA values as 0.86
followed by Chenab-2000 (0.82). Khan et al. (2007) reported the influence of heat stress by
increasing test weight due to the effect of small seed size, more number of seeds which were
present in that unit volume.
Under normal climatic conditions, test weight show range of observations for SCA -3.48 to
4.53 that have both negative to positive values. Higher positive significant values shown by
different crosses for test weight were as Miraj-2008 × V-12056 (4.53), AARI-11 × Chenab-
2000 (3.71), V-13013 × V-12056 (3.69) and Faisalabad-08 × Millat-11 (3.53). Heat stressed
environment show range of results from-3.49 to 3.53. Following crosses, show higher
positive significant values such as Shahkar-2013 × V-12082 (3.53), Miraj-2008 × V-12056
(3.20), SW89.52277 × Millat-11 (2.96) and V-13248 × Chenab-2000 (2.43) shown in Table
4.39. Due to heat stress, there was decrease in test weight due to compressed growth period
and Kumar et al., (2013) observed shrinking of grains in wheat.
Dominance type of gene action was observed in test weight as resulted in our studies for
normal and high temperature stressed conditions. Singh (2003), Chaman et al., (2005),
Heidari et al., (2006), Kumar et al., (2011) and Singh et al., (2012) also found non-additive
141
genetic effects for test weight in wheat. The findings of these researchers also supported
these results.
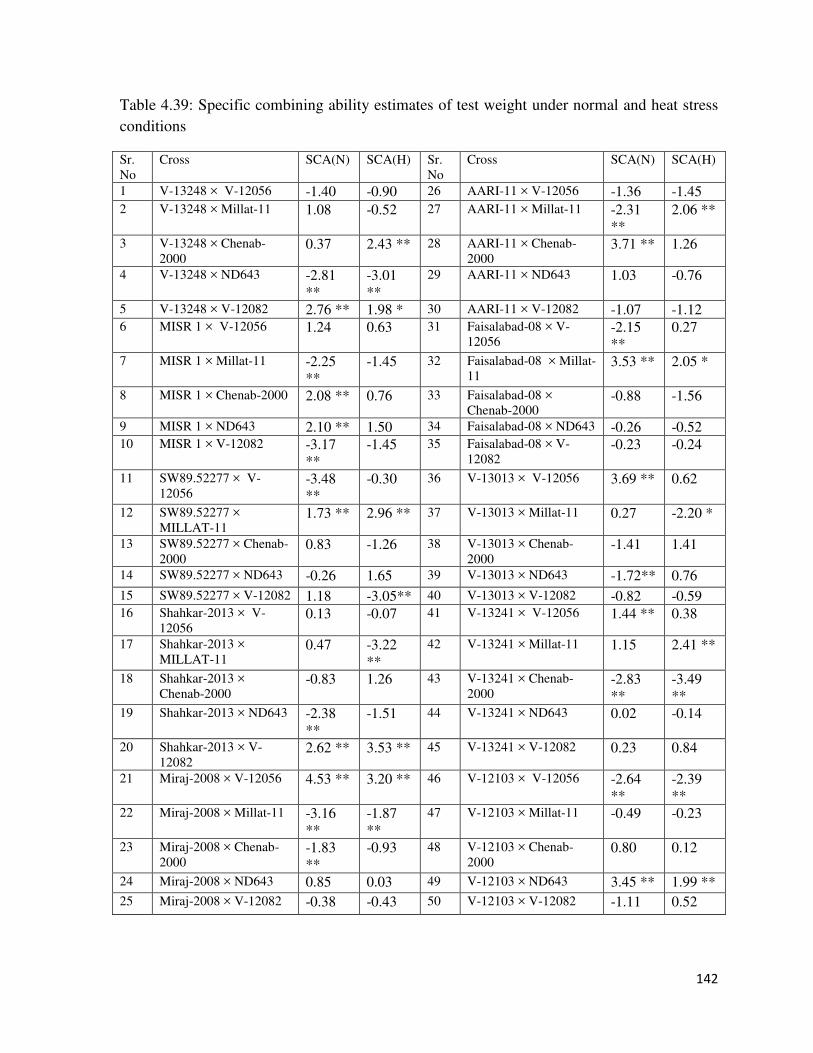
142
Table 4.39: Specific combining ability estimates of test weight under normal and heat stress conditions
Sr. No
Cross SCA(N) SCA(H) Sr. No
Cross SCA(N) SCA(H)
1 V-13248 × V-12056 -1.40 -0.90 26 AARI-11 × V-12056 -1.36 -1.45 2 V-13248 × Millat-11 1.08 -0.52 27 AARI-11 × Millat-11 -2.31
** 2.06 **
3 V-13248 × Chenab-2000
0.37 2.43 ** 28 AARI-11 × Chenab-2000
3.71 ** 1.26
4 V-13248 × ND643 -2.81 **
-3.01 **
29 AARI-11 × ND643 1.03 -0.76
5 V-13248 × V-12082 2.76 ** 1.98 * 30 AARI-11 × V-12082 -1.07 -1.12 6 MISR 1 × V-12056 1.24 0.63 31 Faisalabad-08 × V-
12056 -2.15 **
0.27
7 MISR 1 × Millat-11 -2.25 **
-1.45 32 Faisalabad-08 × Millat-11
3.53 ** 2.05 *
8 MISR 1 × Chenab-2000 2.08 ** 0.76 33 Faisalabad-08 × Chenab-2000
-0.88 -1.56
9 MISR 1 × ND643 2.10 ** 1.50 34 Faisalabad-08 × ND643 -0.26 -0.52 10 MISR 1 × V-12082 -3.17
** -1.45 35 Faisalabad-08 × V-
12082 -0.23 -0.24
11 SW89.52277 × V-12056
-3.48 **
-0.30 36 V-13013 × V-12056 3.69 ** 0.62
12 SW89.52277 × MILLAT-11
1.73 ** 2.96 ** 37 V-13013 × Millat-11 0.27 -2.20 *
13 SW89.52277 × Chenab-2000
0.83 -1.26 38 V-13013 × Chenab-2000
-1.41 1.41
14 SW89.52277 × ND643 -0.26 1.65 39 V-13013 × ND643 -1.72** 0.76 15 SW89.52277 × V-12082 1.18 -3.05** 40 V-13013 × V-12082 -0.82 -0.59 16 Shahkar-2013 × V-
12056 0.13 -0.07 41 V-13241 × V-12056 1.44 ** 0.38
17 Shahkar-2013 × MILLAT-11
0.47 -3.22 **
42 V-13241 × Millat-11 1.15 2.41 **
18 Shahkar-2013 × Chenab-2000
-0.83 1.26 43 V-13241 × Chenab-2000
-2.83 **
-3.49 **
19 Shahkar-2013 × ND643 -2.38 **
-1.51 44 V-13241 × ND643 0.02 -0.14
20 Shahkar-2013 × V-12082
2.62 ** 3.53 ** 45 V-13241 × V-12082 0.23 0.84
21 Miraj-2008 × V-12056 4.53 ** 3.20 ** 46 V-12103 × V-12056 -2.64 **
-2.39 **
22 Miraj-2008 × Millat-11 -3.16 **
-1.87 **
47 V-12103 × Millat-11 -0.49 -0.23
23 Miraj-2008 × Chenab-2000
-1.83 **
-0.93 48 V-12103 × Chenab-2000
0.80 0.12
24 Miraj-2008 × ND643 0.85 0.03 49 V-12103 × ND643 3.45 ** 1.99 ** 25 Miraj-2008 × V-12082 -0.38 -0.43 50 V-12103 × V-12082 -1.11 0.52
143
Chapter 5 Summary
Plant breeder can improve wheat production by efficient utilization of variation that have
broader genetic base for new varietal development, which can enhance performance under
various environmental stresses. This study was conducted to evaluate the effect of heat stress
tolerance on wheat for yield and related components and quality traits of wheat. For this
study, one hundred and twenty different wheat genotypes consisting of approved varieties,
land races and advanced lines were used as screening material against high temperature
stress.
Ten lines and five testers were selected by using different screening parameters such as
CMT, NDVIV, CTV and RWC. Among parents, selected lines were V-13248, MISR 1,
SW89.5277, Shahkar-2013, Miraj-08, AARI-11, Faislabad-08, V-13013, V-13241 and V-
12103 and selected testers were V-12056, Millat-11, Chenab-2000, ND643 and V-12082.
These lines and testers were crossed by using Line × Tester mating design. These fifteen
parents along with their F1 hybrids were sown at Wheat Research Institute, Ayub Agriculture
Research Institute (AARI) Faisalabad under normal and heat stressed conditions by using
triplicate randomized complete block design (RCBD).
Data at different crop growth and developmental stages was recorded for different parameters
i.e. cell membrane thermostability, NDVIV, NDVIG, CTV, CTG, relative water content,
plant height, flag leaf area, peduncle length, spike length, number of fertile tillers per plant,
days to heading, days to maturity, spikelets per spike, grains per spike, thousand grain
weight, grain yield per plant and quality traits like protein, moisture, starch ash, gluten and
test weight.
The results of basic analysis of variance showed that there exist highly significant differences
for all traits under the study. Furthermore, line × tester analysis was carried out to find the
relationship between different traits of wheat to access combining ability and gene action
from these wheat genotypes as described by Kempthorne (1957). Highly significant
144
differences were found among parents, crosses, parents versus crosses, line, testers, line ×
tester interaction; for most of the traits in this study.
Among different lines, V-12103 and Faislabad-08 showed highest positive significant GCA
values under normal conditions whereas under heat stressed conditions, Faislabad-08 and
MISR 1 lines showed highest positive significant GCA over other lines. Highest grain yield
per plant was observed in Miraj-08 and V-12013 under both normal and heat stressed
conditions (as Shown in Appendix I and II). Among all other lines Faisalabad-08 and Miraj-
08 performed better under both normal and heat stressed conditions being recommended for
sowing.
Among different testers, V-12082, showed better performance in normal conditions in terms
of highest positive significant GCA values. Under high temperature stress, Chenab-2000
showed highest positive significant GCA values and showed superiority over all other testers
under heat stressed conditions. Grain yield per plant was depicted highest in Millat-11 and
V-12056 (as Shown in Appendix I and II). Among testers, Millat-11, V-12082 and Chenab-
2000 were best under both normal and heat stressed conditions with high grain yield per
plant and positive significant GCA values.
Among different crosses, highest positive significant SCA values under normal conditions
were shown by crosses V-13248 × V-12056 and V-13013 × ND643. Under heat stress,
highest positive significant SCA values were shown by V-13248 × Millat-11, V-13013 ×
ND643 and V-12103 × Millat-11 (as Shown in Appendix I and II). Among crosses, V-13013
× ND643 show high performance for SCA under both normal and heat stressed conditions.
The results of this study shortlisted different parent (V-12103, Faislabad-08, Miraj-08, V-
12082, Millat-11 and Chenab-2000) and crosses (V-13013 × ND643, SW89.52277 ×
Chenab-2000 and V-13013 × V-12082) that showed excellent performance under both
normal and heats stressed conditions for combining ability. Utilization of these better parents
and crosses for further breeding plans for improvement of crop yield and productivity of
wheat.

145
The lower GCA variance to the SCA variance ratio for almost all the traits showed
governance of non-additive gene action in the inheritance of the traits. Expression of non-
additive genetic effect was due to the more SCA mean square values of normal and heat
stress conditions for gene action. The results of this investigation concluded that mostly traits
were showing dominance type of gene action for all traits in both environments. Significant
differences were observed for SCA for almost all traits under study.
High SCA variances noted for different traits under study for both environments (Normal and
Heat stress) depicted the non- additive type of genetic effects for such traits and resulted
selection procedure can be delayed for these traits improvement in next (latter) generations
for the fixation of these genes and full exploitation.
Conclusions
• Significant positive association of flag leaf area and grain yield per plant with plant
yield and grain quality characters revealed that these parameters may be used as
screening criterion to develop heat tolerant wheat varieties.
• Positive correlation of flag leaf area with grain yield per plant predicts that the genes,
which are involved to sustain flag leaf area in plants, are also indirectly involved in
grain yield per plant.
• Parents V-12103, Miraj-08, Faislabad-08, V-12082, Millat-11 and Chenab-2000 were
good general combiner for grain yield and quality traits under both normal and heat
stressed conditions.
• Crosses, V-13013 × ND643, SW89.52277 × Chenab-2000 and V-13013 × V-12082
showed better performance for grain yield and quality related traits.
• Non-allelic interaction found in yield, quality and heat stress tolerance related traits
showed that selection of plants with desirable traits should be delayed until 4th and 5th
segregating generation when allelic combinations are fixed.
146
LITERATURE CITED:
AACC 2000. Approved Methods of the American Association of Cereal Chemists, 10th ed.
Methods 46-12, 22-08, 08-01, 44-15A, 38-12A and 55-10, AACC St. Paul, MN.
Abdelmula, A.A., M.O.M. Jaber and S.M. Gasim, 2011. Differential response of some bread wheat (Triticum aestivum L.) genotypes for yield and yield components to terminal heat stress under Sudan conditions. In: Proceedings of the Tropical (Tropentag2011) Conference; International Research on Food Security, Natural Resource Management and Rural Development, October 5 -7, 2010, University of Bonn (Germany).
Abdullah, M., Aziz-Ur-Rehman, N. Ahmad and I. Rasul. 2007. Planting time effect on grain and quality characteristics of wheat. Pak. J. Agri. Sci. 44 (2): 200-202.
Adel, M.M. and E.A. Ali. 2013. Gene action and combining ability in six parent diallel cross of wheat. Asian J. Crop Sci. 5 (1): 14-23.
Ahmad, Z. and J.K. Srivastava. 1991. Partial diallel analysis for some quality and physiological traits related to productivity in wheat. Golden Jubillee symp. Genetics Res. Edu. Current trends and the next five years, New Delhi, pp 12-15.
Ahmed, N., M.A. Chowdhry, I. Khaliq and M. Maekawa. 2007. The inheritance of yield and yield components of five wheat hybrid populations under drought conditions. Indonesian J. Agric. Sci. 8(2): 53-59.
Akbar, M., A. Rehman, M.H. Chaudhry and M. Hussain. 1997. Prepotency judgment of diallel crosses in F1 generation for wheat improvement. Sci. Int. 47: 303-305.
Akbar, M., J. Anwar, M. Hussain, M.H. Qureshi and S. Khan. 2009. Line × Tester analysis in bread wheat (Triticum aestivum). J. Agri. Res. 47(1):411-420.
Akram, Z., S.U. Ajmal, K.S. Khan, R. Qureshi and M. Zubair. 2011. Combining ability estimates of some yield and quality related traits in spring wheat (Triticum aestivum L.). Pak. J. Bot. 43:221-231.
Akter, N. and Rafiqul Islam M. 2017. Heat stress effects and management in wheat. A review. 547 Agronomy for Sustainable Development 37, 37.
Alghabari, F, M. Lukac, H.E. Jones, M.J. Gooding. 2014. Effect of Rht alleles on the tolerance of wheat grain set to high temperature and drought stress during booting and anthesis. J. Agro. Crop Sci. 200, 36–45.
147
Ali, F., Muneer, M. Rahman, H. Noor, M. Durrishahwar, S.S. Yan. 2011. Heritability Estimates for Yield and Related Traits Based on Testcross Progeny Performance of Resistant Maize Inbred Lines. J. Food Agric. Environ. Res. 9: 438-443.
Ali, Y., B.M. Atta, J. Akhter, P. Monneveux and Z. Lateef. 2008. Genetic variability, association and diversity studies in wheat (Triticum aestivum L.) germplasm. Pak. J. Bot. 40(5): 2087-2097.
Al-Jebory, E.I. 2013. Changes in cellular membrane tolerance due to heat stress during Triticum sativum L. seeds germination. magazin of alkufa university for biology 5(2): 234-239.
Al-Khatib, K., G.M. Paulsen. 1984. Mode of high temperature injury to wheat during grain development. Plant Physiol. 61:363–368.
Almeselmani, M., A. Saud, K. Al-Zubi, F. Abdullah, F. Hareri, M. Nassan, M.A. Ammar and O. Kanbar. 2012. Physiological performance of different durum wheat varieties grown under rainfed condition. Global J. Sci. Frontier Res. 12: 55-63.
Ambreen, A., M.A. Chowdhry, I. Khaliq and R. Ahmad. 2002. Genetic determination for some drought related leaf traits in bread wheat. Asian J. Pl. Sci. 1(3): 232-234.
Anjum, F.M., I. Ahmad, M.S. Butt, M.A. Sheikh and I. Pasha. 2005. Amino acid composition of spring wheats and losses of lysine during chapatti baking. J. Food Comp. Anal. 18: 523-532.
Anonymous. 2007. Climate change 2007: Impacts, adaptation and vulnerability. Working group II contribution to the intergovernmental panel on climate change (IPCC) fourth assessment report Brussels.
Anonymous. 2016-17. Ministry of Finance, Govt. of Pakistan. (http://www.finance.gov.pk/survey/chapter_12/02-Agriculture.pdf).
Antoniou, C., G. Chatzimichail, K. Kashfi and V. Fotopoulos. 2014. P77: Exploring the potential of NOSH-aspirin as a plant priming agent against abiotic stress factors. Nitric Oxide 39: S39.
Anwar, J., M. Akbar, M. Hussain, S. Asghar, J. Ahmad. 2011. Combining ability estimates for grain yield in wheat. Lahore J. Agric. Res. 49: 437-445.
Arain, M.A., M.A. Sial and M.A. Javed. 2002. Influence of different seeding rates and row spacings on yield contributing traits in wheat. Pak. J. Seed Tech. 1: 01-6.
148
Arjenaki, F.G., R. Jabbari, A. Morshedi. 2012. Evaluation of Drought Stress on Relative Water Content, Chlorophyll Content and Mineral Elements of Wheat (Triticum
aestivum L.) Varieties. Intl. J. Agri. Crop Sci. 4 (11): 726-729.
Aslani, F. and M.R. Mehrvar. 2012. Responses of wheat genotypes as affected by different sowing dates. Asian J. Agric. Sci. 4(1): 72-74.
Asthir B. 2015. Protective mechanisms of heat tolerance in crop plants. J. Plant Interact. 10(1): 202-210.
Atiq-ur-Rehman, I. Khaliq, M.A. Chowdhry and R.I. Khushnood. 2002. Combining ability studies for polygenic characters in Aestivum species. Int. J. Argic. Biol. 4: 171-1174.
Awan, S.I., M.F.A. Malik, M. Siddique. 2005. Combining ability analysis in intervarietal crosses for component traits in hexaploid wheat. J. Agric. Social Sci. 1: 316-317.
Aycicek, M. and T. Yildirim. 2006. Path coefficient analysis of yield and yield components in bread wheat (Triticum aestivum L.) genotypes. Pak. J. Bot. 38(2): 417-424.
Ayeneh, A., M.V. Ginkel, M.P. Reynolds and A. Ammar. 2002. Comparison of Leaf, Spike, Peduncle and Canopy Temperature Depression in Wheat under Heat Stress, Field Crops Res. (79): 173-184.
Azimi, A.M., S. Marker and I. Bhattacharjee. 2017. Genotypic and phenotypic variability and correlation analysis for yield and its components in late sown wheat (Triticum
aestivum L.), J. Pharmaco. Phytochem. 6(4): 167-173.
Bahar, B., M. Yildirim and C. Yucel. 2011. Heat and drought resistance criteria in spring bread wheat (Triticum aestivum L.): Morpho-physiological parameters for heat tolerance. Scientific Research and Essay. 6(10):2212-2220.
Bajji, M., K. Jean-Marie and S. Lutts. 2001. The use of the electrolyte leakage method for assessing cell membrane stability as a water stress tolerance test in durum wheat. Plant Growth Regulation. 00: 1–10.
Bakhsh, A., A. Hussain and A.S. Khan. 2003. Genetic studies of plant height, yield and its components in bread wheat. Sarhad J. Agric. 19: 529-534.
Bala, P. and S. Sikder. 2017, Evaluation of Heat Tolerance of Wheat Genotypes through Membrane Thermostability Test, MAYFEB. J. Agri. Sci. 2: 1-6.

149
Balla, K., I. Karsai and O. Veisz. 2009. Analysis of the quality of wheat varieties at extremely high temperatures. In: VIII. Alps-Adria Sceintific Workshop. 27th April – 2nd May 2009, Neum, Bosnia-Herczegovina. 37: 13-16.
Barnabas, B., K. Jager, A. Feher. 2007. The effect of drought and heat stress on reproductive processes in cereals. Plant Cell Environ. 31: 11–38.
Barnard, A.D., M.T. Labuschagne and H.A. Van-Niekerk. 2002. Heritavility estimates of bread wheat quality traits in the western cape province of South Africa. Euphytica. 127: 115–122.
Behl, R .K., H. S. Nainawatee , and K. P. Singh. 1993. “High temperature tolerance in wheat”. In: Intl Crop Sci. Crop Science Society of America, USA.
Bhesaniya, S.V. 2005. Effect of high temperature on biochemical changes in different genotypes of wheat (Triticum aestivum L.). M. Sc. Thesis (Unpublished). Junagadh Agricultural University, Junagadh. Gujarat, India.
Bhutta, M.A., S. Azher and M.A. Chowdhry. 1997. Combining ability studies for yield and its components in spring wheat (Triticum aestivum L.). J. Agric. Res. 35: 353-9.
Bhutto, A.H., A.A. Rajpar, S.A. Kalhoro, A. Ali, F.A. Kalhoro, M. Ahmed, S. Raza and N.A. Kalhoro. 2016. Correlation and Regression Analysis for Yield Traits in Wheat (Triticum aestivum L.) Genotypes. Natural Science. 8:96-104.
Bilge, B., M. Yildirim, C. Barutcular, I. Genc. 2008. Effect of Canopy Temperature Depression on Grain Yield and Yield Components in Bread and Durum Wheat, Not. Bot. Hort. Agrobot. Cluj. 36 (1): 34-37.
Blum, A. 1988. Heat tolerance. In: Plant breeding for stress environments. CRC Press. Inc., Boca Raton, Florida, USA.
Blum, A. and A. Ebercon. 1981. Cell membrane stability as a measure of drought and heat tolerance in wheat. Crop Sci. 21:43-47.
Blum, A., N. Klueva and H.T. Nguyen. 2001, Wheat cellular thermotolerance is related to yield under heat stress. Euphytica. 117: 117–123.
Blumenthal, C., F. Bekes, P.W. Gras, E.W.R. Barlow and C.W. Wrigley. 1995. Influence of wheat genotypes tolerant to the effects of heat stress on grain quality. Cereal Chem. 72: 539-544.
150
Bokszczanin KL and S. Fragkostefanakis. 2013. Perspectives on deciphering mechanisms underlying plant heat stress response and thermotolerance. Front Plant Sci. 4:315– 335.
Borghi, B. and M. Perenzin. 1994. Diallel analysis to predict heterosis and combining ability for grain yield, yield components and bread making quality in bread wheat (Triticum
aestivum L.). Theor. Appl. Genet. 89: 975–981.
Braun, H.J., G. Atlin and T. Payne. 2010. Multi-location testing as a tool to identify plant response to global climate change. In: Reynolds, CRP. (ed.). Climate change and crop production, CABI, London, UK.
Bray, E. A. 2002. Classification of genes differentially expressed during water-deficit stress in Arabidopsis thaliana: an analysis using Microarray and differential expression data. Ann. Bot. 89: 803-811.
Broschat, T.K. 1979. Principal Component Analysis in Horticultural Research. Hort. Sci. 14: 114-117.
Carceller, M., P. Prystupa and J. H. Lemcoff. 1999. Remobilization of proline and other nitrogen compounds from senescing leaves of maize under water stress. J. Agron. Crop Sci. 183: 61-66.
Chaman, S., S.K. Gupta and D.R. Satija. 2005. Genetic architecture for some quality traits in wheat (T. aestivum L.). Indian J. Genet. Plant Breed. 65 (4): 278–80.
Cheema, N.M., M. Ihsan, M.A. Mian, G. Rabbani, M.A. Tariq and A. Mahmood. 2007. Gene action studies for some economic traits in spring wheat. Pak. J. Agri. Res. 20:99-104.
Chen, X.Y., Q. Sun and C.Z. Sun. 2000. Performance and evaluation of spring wheat heat tolerance. J. China. Agri. Uni. 5(1): 43-49.
Chowdhry, M.A. and B. Ahmad. 1990. Combining ability in a seven parent diallel cross of spring wheat. Pak. J. Sci. Res. 42: 18–24.
Chowdhry, M.A., G. Taqi and N.M. Cheema. 1991. Correlation analysis and path co-efficient for grain yield and yield components in bread wheat. J. Agric. Res. 29: 151–8.
Chowdhry, M.A., M. Iqbal, G. M. Subhani and I. Khaliq. 2001. Heterosis, inbreeding depression and line performance in crosses of Triticum aestivum. Pak. J. Biol. Sci. 4: 56-58.

151
Chowdhry, M.A., M.A. Chaudhry, S.M.M. Gilani and M. Ahsan. 2001. Genetic control of some yield attributes in bread wheat. Pak. J. Biol. Sci. (4): 980-982.
Chowdhry, M.A., M.S. Saeed, I. Khaliq and M. Ahsan. 2005. Combining ability analysis for some polygenic traits in a 5 × 5 diallel cross of bread wheat (Triticum aestivum L.). Asian J. Pl. Sci. 4: 405–408.
Chowdhry, M.A., M.T. Mahmood, N. Mahmood and I. Khaliq. 1996. Genetic analysis of some drought and yield related characters in Pakistani spring wheat varieties. Wheat Inform. Ser. 82: 11-18.
Chowdhury, S.I and I.F. Wardlaw. 1978. The effect of temperature on kernel development in cereals. Aust. J. Agric. 29: 205-23.
Christiansen, M.N. 1978. The physiology of plant tolerance to temperature extremes. p. 173-191. In G.A. Jung (ed.) Crop tolerance to suboptimal land conditions. Am. Soc. Agron. Madison. WI.
Christou, A., P. Filippou, G.A. Manganaris and V. Fotopoulos. 2014. Sodium hydrosulfide induces systemic thermotolerance to strawberry plants through transcriptional regulation of heat shock proteins and aquaporin. BMC Plant Biol. 14:42.
Ciuca, M. and E. Petcu. 2009. SSR markers associated with membrane stability in wheat (Triticum aestivum L.). Rom. Agric. Res. 26: 21–24.
Clarke, J.M., R.M. De Pauw, T.M. Townley- Smith. 1992. Evaluation of methods for quantification of drought tolerance in wheat. Crop Sci. 32:728-732.
Claussen, W. 2005. Proline as a measure of stress in tomato plants. Plant Sci. 168:241-248.
Corral, L.R. 1983. Influence of competition on combining ability estimates and subsequent prediction of progeny in wheat (Triticum aesivum L. em Thell). Dis. Abst. Int. B., 43: 3132 B (Pl. Br. Abst., 53: 7921; 1983).
Cossani, C.M. and M.P. Reynolds. 2012. Physiological traits for improving heat tolerance in wheat. Plant physiol. 160: 1710-1718.
Costa, R., N. Pinheiro, A.S. Almeida, C. Gomes, J. Coutinho, J. Coco and A. Costa. 2013. Effect of sowing date and seeding rate on bread wheat yield and test weight under Mediterranean conditions. Emir. J. Food Agric. 25 (12): 951-961.
152
Curtis, B.C. 2002. Wheat in the world. In: Bread Wheat Improvement and Production (Eds. B. C. Curtis, S. Rajaram and H. Gómez Macpherson). Food and Agriculture Organization of the United Nations. Rome, Italy. p. 1–17.
Dalrymple, D.G. 1986. Development and spread of high-yielding wheat varieties in developing countries. Bureau for Science and Technology Agency for International Development Washington. D.C.
Dawson, I.A. and I.F. Wardlaw. 1989. The tolerance of wheat to high temperatures during reproductive growth, Booting to anthesis. Aust J. Agri. Res. 40: 965- 980.
Dewey, J.R. and K.H. Lu. 1959. A correlation and path coefficient analysis components of crested wheat grass seed production. Agron. J. 51: 515-518.
Dhadhal, B., K. Dobariya, H. Ponkia and L. Jivani. 2008. Gene action and combining ability over environments for grain yield and its attributes in bread wheat (Triticum aestivum
L.). Int. J. Agri. Sci. 4(1):66-72.
Dhanda, S.S. and G.S. Sethi. 1998. Inheritance of excised-leaf water loss and relative water content in bread wheat (Triticum aestivum). Euphytica. 104: 39-47.
Dhanda, S.S. and R. Munjal. 2009. Cell membrane stability: Combining ability and gene effects under heat stress conditions. J. Cereal Res. Commun. 37(3): 409-417.
Dhanda, S.S., R. Munjal. 2012. Heat tolerance in relation to acquired thermotolerance for membrane lipids in bread wheat. Field Crops Res. 135:30–37.
Dhayal, L.S. and E.V.D. Sastry. 2003. Combining ability in bread wheat (Triticum aestivum
L.) under salinity and normal conditions. Indian J. Genet. 63: 69-70.
Dias, A.S., A.S. Bagulho and F.C. Lidon. 2008. Ultrastructure and biochemical traits of bread and durum wheat grains under heat stress. Braz. J. Plant Physiol. 20(4): 323-333.
Diaz-Espejo, A., M.V. Cuevas, M. Ribas-Carbo, J. Flexas, S. Martorell, J. E. Fernández. 2012. The effect of strobilurins on leaf gas exchange, water use efficiency and ABA content in grapevine under field conditions. J. Plant Physiol. 169: 379-386.
Dokuyucu, T., A. Akkaya and D. Yigitoglu. 2004. The effect of different sowing dates on growing periods, yield and yield components of some bread wheat (Triticum aestivum L.) cultivars grown in the East- Mediterranean region of Turkey. J. Agron. 3(2): 126-130.
153
Doru-Gabriel, E., M. Becheritu, C. Cristian-Florinel. 2017. Prediction Of Drought Resistant Lines Of Winter Wheat Using Canopy Temperature Depression And Chlorophyll Content Analizis. Agro-life Sci. J. 6:104-111.
Dotlacil, L., J. Hermuth, Z. Stehno, and M. Maner. 2000. Diversity in European winter wheat landraces and obsolete cultivars. Czech J. Genet. Plant Breed. 36(2): 29-36.
Drikvand, R.. E. Farshadfar and F. Nazarian. 2005. Genetic study of some morpho-physiological traits in bread wheat lines under dry land conditions using diallel crossing. Seed and Plant. 4 (20): 429-444.
El-Hossary, A.A., M.E. Riad, Nagwa, R. Abd El-Fattah and M. A. Hassan. 2000. Heterosis and combining ability in durum wheat. Proc. 9th Conf. Agron., Minufiya Univ. 1(2): 101-117.
Elsayed, S., M. Elhoweity, H.H. Ibrahim, Y.H. Dewir, H.M. Migdadi and U. Schmidhalter. 2017. Thermal imaging and passive reflectance sensing to estimate the water status and grain yield of wheat under different irrigation regimes, Agric. Water Manag. (189): 98–110.
Epure, Doru-Gabriel, M. Becheritu, C. Cristian-Florinel. 2017, Prediction Of Drought Resistant Lines Of Winter Wheat Using Canopy Temperature Depression And Chlorophyll Content Analizis. Agro-life Sci. J. 6.104-111.
F. Álvaro, J. Isidro, D. Villegas, L.F. García Del Moral and C. Royo, 2008 Breeding effects on grain filling, biomass partitioning, and demobilization in Mediterranean durum wheat,” Agron. J. 100: 361–370.
FAO. 2015. FAOSTAT. Online statistical database. (available at http://faostat.fao.org). Farhan, A., Irfan Ahmed, S., Hidayat, U. R., Mohammad, N., Durrishahwar, Muhammad, Y.
K., Ihteram, U. and Jianbing, Y. 2012. Heterosis for Yield and Agronomic Attributes in Diverse Maize Germplasm. Aust. J. Crop Sci. 6: 455-462.
Farooq, J. and I. Khaliq. 2004. Estimation of heterosis and heterobeltiosis of some quantitative characters in bread wheat. Asian J. Pl. Sci. 3(4): 508-511.
Farooq, J., I. Khaliq, M. Akbar, M. Kashif and S. Mahpara. 2013. Hybrid vigor studies for different yield contributing traits in wheat under normal and heat stress conditions. Comun. Sci. 4: 139-152.
Farooq, M., H. Bramley, J.A. Palta, K.H.M. Siddique. 2011. Heat stress in wheat during reproductive and grain-filling phases. Crit. Rev. Plant Sci. 30, 491-507.

154
Farshadfar, E., F. Rafiee and H. Hasheminasab. 2013. Evaluation of genetic parameters of agronomic and morpho-physiological indicators of drought tolerance in bread wheat (Triticum aestivum L.) using diallel mating design. Aus. J. Crop Sci. 7: 268-275.
Farshadfar, E., Ghanadha, J. Sutka and M. Zahravi. 2001. Generation mean analysis of drought tolerance in wheat (Triticum aestivum L.). Acta Agron. Hung. 49: 59-66.
Ferris, R., R.H. Ellis, T.R. Wheeler and P. Hadley. 1998. Effect of high temperature stress and anthesis on grain yield and biomass of field-grown crops of wheat. Ann.Botany.82: 631-639.
Fokar, M., A. Blum, and N.T. Nguyen. 1998. Heat tolerance in spring wheat. II. Grain filling, Euphytica, 104: 9–15.
Fonseca, S. and F.L. Patterson. 1968. Hybrid vigour in seven parental diallel cross in common wheat. (Triticum aestivum L.) Crop Sci., 8: 85-88.
Foulkes, M. J., J. W. Snape, V. J. Shearman, M. P. Reynolds, O. Gaju and R. S. Bradley. 2007. Genetic progress in yield potential in wheat: recent advances and future prospects. J. Agric. Sci. 145,17–29
Freeman, G.F. 1919. Heredity of quantitative characters in wheat. Genetics. 4: 1-93.
Gami, R.A., C.J. Tank, S.S. Patel, R.M. Chauhan and H.N. Patel. 2011. Combining ability analysis for grain yield and quality component traits in durum wheat (Triticum durum
Desf.). Res. on Crops, 12 (2): 502-504.
Ghatak, A., P. Chaturvedi and W. Weckwerth, 2017. Cereal Crop Proteomics: Systemic Analysis of Crop Drought Stress Responses towards Marker-Assisted Selection Breeding. Front. Plant Sci. 8:757.
Godfray, H.C.J., J.R. Beddington, I.R. Crute, L. Haddad, D. Lawrence, C. Toulmin. 2010. Food security: the challenge of feeding 9 billion people. Sci. 327: 812–818.
Golparvar, A.R., A. Ghasemi-Pirbalouti and H. Madani. 2006. Genetic control of some physiological attributes in wheat under drought stress conditions. Pak. J. Bio. Sci., 9: 1442-1446.
Golparvar, A.R., O. Lotfifar and S. Mottaghi. 2011. Diallel analysis of grain yield and its components in bread wheat genotypes under drought stress conditions. Plant. Prod. Tech., 11(1): 51-61.
155
Gong, M., B. Chen, Z.G. Li, L.H. Guo. 2001. Heat-shock-induced cross adaptation to heat, chilling, drought and salt stress in maize seedlings and involvement of H2O2. J. Plant Physiol. 158: 1125-1130.
Gooding, M.J., R.H. Ellis, P.R. Shewry and J.D. Schofield. 2003. Effects of restricted water availability and increased temperature on the grain filling, drying and quality of winter wheat. J. Cereal Sci., 37: 295–309.
Gorjanovic B. M., M. M. N., N. Sad, Kraljevic-Balalic. 2007. Inheritance of plant height, spike length and number of spikelets per spike in durum wheat. Plants Genet Breed 112: 27–33.
Gorjanovic, B. and M.K. Balalic. 2005. Inheritance of plant height and spike length in wheat. Genetika, 37: 25–31
Gouda, K., U. Kage, H.C. Lohithaswa, B.G. Shekara. 2013. Combining Ability Studies in Maize (Zea Mays L.). Molecular Plant Breed., 3(14): 116-127.
Griffing,. 1956. Concepts of general and specific combining ability in relation to diallel crossing system. Aust. J. Biol. Sci. 9: 463-493.
Gupta, N.K., S. Gupta and A. Kumar, 2001. Effect of water stress on physiological attributes and their relationship with growth and yield of wheat cultivars at different stages. J. Agron. Crop Sci., 186: 55-62.
Guttieri M. J., J.C. Stark, K. Brien, E. Souza. 2001. Relative sensitivity of spring wheat grain yield and quality parameters to moisture deficit. Crop Sci. 41:327–335
Hakim, M.A., A. Hossain., J.A.T.D. Silva, V.P. Zvolinsky and M.M. Khan. 2012. Yield, protein and starch contents of twenty wheat (Triticum aestivum L.) genotypes exposed to high temperature under late sowing conditions. J. Sci. Res.. 4(2): 477-489.
Hall, A.E., 2001. Crop Responses to Environment. CRC Press LLC, Boca Raton, Florida.
Hamada, A. A.; H. L. Hendawy and M. A. H. Megahed, 2002. General and specific combining ability and its interactions with two plant densities for yield and yield components, protein content and total carbohydrates in bread wheat. Annals of Agric. Sci., Moshtohor, 40(2): 803 – 829.
Haq, W., M, Munir and Z. Akram. 2010. Estimation of interrelationships among yield and yield related attributes in wheat lines. Pak. J. Bot., 42: 567-573.
156
Harer P. N. and D. R. Bapat, Line × tester analysis of combining ability in grain Sorghum. J Maharastra Agric Univ. 1982; 7:230-232.
Hasanuzzaman, M., K. Nahar, M.M Alam, R. Roychowdhury and M. Fujita. 2013. Physiological, biochemical, and molecular mechanisms of heat stress tolerance in plants. Int. J. Mol. Sci. 14, 9643–9684.
Hasnain, Z., G. Abbas, A. Saeed, A. Shakeel, A. Muhammad, M.A. Rahim, 2006. Combining ability for plant height and yield related traits in wheat (Triticum aestivum L.). J. Agric. Res. 44: 167-1175.
Hassan G, F. Mohamma, S. S. Afridi and I. Khalil. 2007. Combining ability in the F1 generations of diallel cross for yield and yield components in wheat. Sarhad J Agri. (4): 937-94.
Heidari, B., A. Rezai, and S.A.M.M. Maibody. 2006. Diallel analysis for the estimation of genetic parameters for grain yield and grain yield components in bread wheat. J. Sci. Techno. Agricul. Natural Res., 10 (2): 121-40.
Hossain, A., M. Sarker, M. Saifuzzaman, J.A. Teixeira da Silva, M.V. Lozovskaya and M.M. Akhter. 2013. Evaluation of growth, yield, relative performance and heat susceptibility of eight wheat (Triticum aestivum L.) genotypes grown under heat stress. Int. J. Plant Prod., 7(3): 615-636.
Houghton, J.T., G.J. Jenkin and J.J. Ephramus. 1990. Climate change: the IPCC Scientific assessment Cambridge University Press, New York
Howarth, C.J. 2005. Genetic improvement of growth and survival at high temperature In: Ashraf, M., Harris, P.J.C. (Eds.), Abiotic Stresses: Plant Resistance through Breeding and Molecular Approaches. Howarth Press Inc., New York, pp. 277-300.
Hussain, M., A.S. Khan, I. Khaliq, and M. Maqsood. 2012. Correlation studies of some qualitative and quantitative traits with grain yield in spring wheat across two environments. Pak. J. Agri. Sci., 49(1): 1-4.
Ibrahim, A., and J.S. Quick. 2001. Genetic control of High temperature tolerance in wheat as measured by membrane thermal. Crop Sci., 41:1405–7.
Iftikhar, R., I. Khaliq, M. Ijaz and M.A.R. Rashid. 2012. Association analysis of grain yield and its components in Spring Wheat (Triticum aestivum L.). J. Agric. and Environ. Sci. 12: 389-392.
157
Ijaz, U., Smiullah and M. Kashif. 2013. Generation means analysis for five physiological traits of bread wheat under rainfed condition. Universal J. Plant Sci. 1: 21-26.
Inamullah, F. Mohammad and G. Hassan. 2005. Genetics of important traits in bread wheat using diallel analysis. Sarhad J. Agric., 21: 617–622.
Iqbal, M.M., 2007. Combining ability analysis in wheat. Pakistan Journal of Agricultural Sciences 44, 1-5.
Islam, M. A., N. C. Barma, D. M. A. Hakim, and D. K. R. Sarker. 2011. Genetic Variability and Selection Response of heat tolerance through Membrane thermostability in Spring wheat (Triticum aestivum L.) ”. Bangladesh J. Pl. Breed. Genet., 23(2):15- 22.
Ivanovska, S., C. Stojkovski, L. Marinkovic. 2000. Inheritance mode and gene effect on spikelets number per spike in wheat. Macedonian Agri. Rev., 47(1/2):1–8.
Jag, S., L. Khant and R.P. Singh. 2003. Winter and spring wheat: An analysis of combining ability. Cereal Res. Com., 31: 347-354.
Jain S. K. and E. V. D. Sastry. 2012. Heterosis and combining ability for grain yield and its contributing traits in bread wheat (Triticum aestivum L.). RRJAAS, vol. 1, pp. 17–22, 2012.
Jatav, M., S.K. Jatav and V.S. Kandalkar. 2014. Combining ability and heterosis analysis of morpho-physiological characters in wheat. Ann. Plant Soil Res., 16: 79-83.
Jatoi, W.A., M.J. Baloch, M.B. Kumbhar and M.I. Keerio. 2012. Heritability and correlation studies of morpho-physiological traits for drought tolerance in spring wheat. Pak. J. Agri. Agril. Engg. Vet. Sci. 28: 100-114.
Jin, Z., Z. Wang, Q. Ma, L. Sun, L. Zhang, Z. Liu, D. Liu, X. Hao and Y. Pei. 2017. Hydrogen sulfide mediates ion fluxes inducing stomatal closure in response to drought stress in Arabidopsis thaliana. Plant Soil. 419: 141-152
Jones, P.D., M. New, D.E. Parker, S. Mortin, I.G. Rigor. 1999. Surface area temperature and its change over the past 150 years. Rev. Geophys., 37, 173–199.
Joshi, S.K., S.N. Sharma, D.L. Singhania and R.S. Sain. 2004. Combining ability in the F1 and F2 generations of diallel cross in hexaploid wheat (Triticum aestivum L. em. Thell). Hereditas. 141:115-121.

158
Ju, C.Z., Z.S. Wu, W.L. Quan and M. Fang. 2005. Effect of fertilization on the canopy temperature of winter wheat and its relationship with biological characteristics. Acta Ecol. Sin. 25(1): 18-22.
Kahrizi, D., K. Cheghamirza, M. Kakaei, R. Mohammadi, and A. Ebadi. 2010. Heritability and genetic gain of some morphophysiological variables of durum wheat (Triticum
turgidum var. durum). African J. Biotech. 9:4687-4691.
Kapoor, E., S.K. Mandal T. and Dey. 2011. Combining ability analysis for yield and yield contributing traits in winter and spring wheat combinations. J. Wheat Res., 3(1): 52-58.
Karimizadeh, R. and M. Mohammadi. 2011, Association of canopy temperature depression with yield of durum wheat genotypes under supplementary irrigated and rainfed conditions, Aust J Crop Sci., 5(2):138-146.
Kashif, M. and I. Khaliq. 2004. Heritability, correlation and path coefficient analysis for some metric traits in wheat. Int. J. Agric. Biol., 6(1): 138-142.
Kaur, V., R.K. Behl, T. Shinano and M. Osaki. 2008. Interacting Effects of High Temperature and Drought Stresses in Wheat Genotypes under Semiarid Tropics- An Appraisal, TROPICS, 17(3): 225-234.
Kempthorne, O., 1957. An introduction to Genetic Statistics. John willy and Sons, Inc., New York.
Khaliq, I., N. Parveen, M.A. Chowdhry. 2004. Correlation and Path Coefficient Analyses in Bread Wheat. Int. J. Agrıc. Bıo., 6(4):633–635.
Khan F.U. and F. Mohammad. 2016. Application of Stress Selection Indices for Assessment of Nitrogen Tolerance in Wheat (Triticum Aestivum L.), J. Anim. Plant Sci. 26(1): 201-210.
Khan, A.A., N.C.D. Barma, M.M. Hasan, M.A. Alam and M.K. Alam. 2014. Correlation study on some heat tolerant traits of spring wheat (Triticum aestivum L.) under late sowing conditions. J. Agric. Res. 52(1): 11-23.
Khan, A.S. and A. Rizwan. 2000. Combining ability analysis of physio-morphological traits in wheat (Triticum aestivum L.). Int. J. Agri. Biol., 2(1): 77-79.
Khan, A.S., M. Khan, R. Kashif and T.M. Khan. 2000. Genetic analysis of plant height, grain yield and other traits in wheat (Triticum aestivum L.). Int. J. Agric. Biol. 2: 129-132.
159
Khan, M. F., Khan, M. K. and Mushtaq, Kazmi, 2004. Genetic variability among wheat cultivars for yield and yield components under the agro-ecological condition of district rawalakot azad Kashmir, Pakistan. Sarhad J. of Agric., 20 (3): 391-394
Khan, M.A., N. Ahmad, M. Akbar, A. Rehman and M.M. Iqbal. 2007. Combining ability analysis in wheat. Pak. J. Agric. Sci., 44: 1-5.
Khan, M.K.R. and A.S. Khan, 1999. Graphical analysis of spike characters related to grain yield in bread wheat (Triticum aestivum L.). Pak. J. Bio. Sci., 2: 340-343.
Khan, N.I. and M.A. Bajwa, 1989. Potential of hybrid wheat in Punjab. Sarhad J. Agri., 5: 381-386.
Khan, S., U., Jalal-Ud-Din, A. Gurman, R. Qayyum and H. Khan, 2013. Heat Tolerance Evaluation of Wheat (Triticum aestivum L.) Genotypes Based on Some Potential Heat Tolerance Indicators, J. Chem. Soc. Pak., 35(3): 647-653.
Khan, S.U., J.U. Din, A. Qayyum, N E. Jan and M.A. Jenks, 2015. Heat Tolerance Indicators In Pakistani Wheat (Triticum Aestivum L.) Genotypes, Acta Bot. Croat., 74 (1): 109–121.
Khodadadi, M., M.H. Fotokian and M. Miransari. 2011. Genetic diversity of wheat (Triticum
aestivum L.) genotypes based on cluster and principal component analyses for breeding strategies. Aust. J. Crop Sci., 5:17-24.
Khodarahmpour, Z., R. Choukan, M.R. Bihamta, E.M. Hervan. 2011. Determination of the best heat stress tolerance indices in maize (Zea mays L.) inbred lines and hybrids under Khuzestan province conditions. J. Agric. Sci. Tech., 13:111-121.
Kirby, E.J.M., M. Appleyard and 0. Fellowes. 1985. Variation in development of wheat and barley in response to sowing date and variety. J. Agric. Sci. 104: 383-396.
Knobel, H. A., M.T. Labuschange and C.S. Derenter. 1997. The expression of heterosis in the F1 generation of a diallel cross of diverse hard red winter wheat genotypes. Cereal Res., Comm. 25: 911-915.
Koumber, R.M., I.M.A.EL-Beially and G.A.EL-Shaarawy. 2006. Study of genetic parameters and path coefficients for some quantitative characters in wheat under two levels of nitrogen feretilizer . Al-Azhar J. Agric. Res.(43): 99-122
Kraic, F., J. Mocak, T. Rohacik and J. Sokolovicova. 2009. Chemometric characterization and classification of new wheat genotypes. Nova Biotech. 9: 101-106.
160
Kraljevic-Balalic, M., D. Stajner and O. Gasic. 1982. Inheritance of grain proteins in wheat. Theor. Appl. Genet. 63:121-124
Krystkowiak, K., T. Adamski, M. Surma and Z. Kaczmarek, 2008. Relationship between phenotypic and genetic diversity of parental genotypes and the specific combining ability and heterosis effects in wheat (Triticum aestivum L.). Euphytica, 165: 419-434.
Kumar, A. and S. Sharma. 2007. Genetics of excised-leaf water loss and relative water content in bread wheat (Triticum aestivum L.). Cereal Res. Commun. 35: 43-52.
Kumar, A., V. Mishra, R.P. Vyas and V. Singh. 2011. Heterosis and combining ability analysis in bread wheat (Triticum aestivum L.). J. Plant Breed. Crop Sci., 3(10): 209–17.
Kumar, N., B.S. Khatkar and R. Kaushik. 2013. Effect of reducing agents on wheat gluten and quality characteristics of flour and cookies. Annals Univer Dunarea de Jos of Galati - Food Tech 37(2):68–81.
Kumar, R. R., S. Goswami, K.S. Sharma, K. Singh, K.A. Gadpayle, N. Kumar, G.K. Rai, M. Singh and R.D. Rai. 2012. Protection against heat stress in wheat involves change in cell membrane stability, antioxidant enzymes, osmolyte, H2O2 and transcript of heat shock protein. Int. J. of Plant Phys. and Biochem. 4(4), 83-91.
Kumar, S. and D.K. Ganguli. 1993. Heterosis and inbreeding depression in bread wheat. In heterosis breeding in crop plants–theory and application: short communications: symposium, Ludhiana, India; Crop Improvement Society of India: 62-63.
Larik, A.S., A.R. Mahar, A.A. Kakar and M.A. Shafkh. 1999. Heterosis, Inbreeding Depression and Combining Ability in Triticum Aestivum L. Journal of Plant Genetics, 25, 455-450.
Li, L.Z., D.B. Lu and D.Q. Cui. 1991. Study on the combining ability for yield and quality characters in winter wheat. Acta Agric. University Henanensis, 25: 372–8.
Lobell, D.B., M.B. Burke, C. Tebaldi, M.D. Mastrandrea, W.P. Falcon and R.L. Naylor. 2008. Prioritizing climate change adaptation needs for food security in 2030. Science 319: 607–610.
Longnecker, N., E.J.M. Kirby and A. Robson. 1993. Leaf emergence, tiller growth, and apical development of nitrogen-deficient spring wheat. Crop Sci. 33: 154-160.
161
Lopes, M.S. and M.P. Reynolds. 2012. Stay-green in spring wheat can be determined by spectral reflectance measurements (normalized difference vegetation index) independently from phenology. J. Exp. Bot. 63: 3789–3798.
Lysa, L.L. 2009. Identification of the genetic controlling system of the protein content in the grain of winter wheat. Cytol. Genet. 43:258-261.
Mahantashivayogayya K, R. Hanchinal and P. Salimath. 2010. Combining ability in dicoccum wheat. Karnataka J. Agri. Sci., 17(4): 781-786
Mahboob, A.S., M.A. Arain, S. Khanzada, M.A. Naqvi, M.U. Dahot and N.A. Nizami. 2005. Yield and quality parameters of wheat genotypes as affected by sowing date and temperature stress. Pak. J. Bot., 37(3): 575-584.
Mahmood, N. and M.A. Chowdhry. 2002. Ability of bread wheat genotypes to combine for high yield under varying sowing conditions. J. Genet. Breed., 56: 119–25.
Majeed S., M. Sajjad, S. H. Khan. 2011. Exploitation of non-additive gene actions of yield traits for hybrid breeding in spring wheat. J. Agric. Social Sci., 7: 131–135.
Majoul, T., E. Bancel, E. Triboi, J.B. Hamida and G. Branlard. 2004. Proteomic analysis of the effect of heat stress on hexaploid wheat grain: characterization of heat-responsive proteins from total endosperm. Proteomics 4(2): 505-513.
Malik, M. F.A., S. Iqbal and S. Ali. 2005. Genetic behavior and analysis of quantitative traits in five wheat genotypes. Journal of Agriculture and Social Sciences 1(4): 313-315.
Maqbool, R., M. Sajjad, I. Khaliq, A. Rehman, A.S. Khan and S.H. Khan. 2010. Morphological diversity and traits association in bread wheat. J. Agric. Environ. Sci. 8: 216-224.
Mather, K.V. and J.L. Jinks. 1982. Introduction to biometrical genetics. Chapman and Hall Ltd., London.
Meena, B.S., and E.V.D. Sastry. 2003. Combining ability in bread wheat (Triticum aestivum
L.). Ann. J. Bio. 19(2): 205-208.
Menon, U. and S.N. Sharma. 1997. Genetics of yield determining factors in spring wheat over environments. Indian J. Genet. 57: 301-306.
Min, Y., B.P. Qin, W. Ping, M.L. Li, L.L Chen, L.T. Chen, A.Q. Sun, Z.L. Wang and Y.P. Yin. 2016. Foliar application of sodium hydrosulfide (NaHS), a hydrogen sulfide
162
(H2S) donor, can protect seedlings against heat stress in wheat (Triticum aestivum L.). J. Integr. Agric. 15: 2745-2758.
Mishra, P. C., T. B. Singh, D. P. Nema, 1994. Combining ability analysis of grain yield and some of its attributes in bread wheat under late sown condition. Crop Res. Hisar. 7(3):413–423.
Mishra, P.C., T.B. Singh, O.P. Singh and S.K. Jain. 1994. Combining ability analysis of grain yield and some of its attributes in bread wheat under timely sown condition. Int.
J. Trop. Agric., 12: 188–194.
Mohammad, F., H. Deniel, K. Shahzad and H. Khan. 2001. Heritability estimates for yield and its components in wheat. Sarhad J. Agric. 17(2): 227-234.
Mohammadi M., R. Karimizadeh, N. Sabaghnia and M.K. Shefazadeh. 2012, Effective application of canopy temperature for wheat genotypes screening under different water availability in warm environments, Bulgarian J. Agric. Sci. 18 (6): 934-941.
Mohsen A. A. A., S.R. Abo-Hegazy and M.H. Taha. 2012. Genotypic and Phenotypic Correlations among Grain Yield and Yield Components In Ten Egyptian Bread Wheat Genotypes. Egypt Journal of Plant Breeding. 15(5):43-58.
Mossua, A.M. and A.A. Morad. 2009. Estimation of combining ability for yield and its components in bread wheat (Triticum aestivum L.) using Line x Tester analysis. Minufiya J. Agric. Res., 34 (3), 1191-1205.
Muller, J. 1991. Determining leaf surface area by means of a wheat osmoregulation water use: the challenge. Agric. Meterolo. 14: 311-320.
Munir M., M. Chowdhry and T.A. Malik. 2007. Correlation Studies among Yield and its Components in Bread Wheat under Drought Conditions. Inter. J. Agric. Bio. 1560–8530/09–2–287–290.
Munjonji L., K.K. Ayisi, B. Vandewalle, I. Dhau, P. Boeckx and G. Haesaert. 2017. Yield Performance, Carbon Assimilation and Spectral Response of Triticale to Water Stress, Expl. Agric., 53 (1), 100–117.
Nasri, R., A. Kashani, F. Paknejad, S. Vazan and M. Barary. 2014. Correlation, path analysis and stepwise regression in yield and yield component in wheat (Triticum aestivum l.) under the temperate climate of Ilam province, Iran. Ind. J. Fund. Appl. Life Sci. 4(4): 188-198.
163
Nawaz, A., M. Farooq, S.A. Cheema and A. Wahid. 2013. Differential response of wheat cultivars to terminal heat stress. Int. J. Agric. Biol. 15: 1354‒1358.
Nazari, L. and H. Pakniyat. 2010. Assessment of drought tolerance in barley genotypes. J. Appl. Sci. 10: 151-156.
Nisar, A., M. A. Chowdhry, I. Khaliq and M. Maekawa. 2007. The inheritance of yield and yield components of five wheat hybrid populations under drought conditions. J. Agri. Sci., 8 (2): 53-59.
Noorka, I. R. and S. Tabasum 2015. Dose-response behavior of water scarcity towards genetical and morphological plant traits in spring wheat (Triticum aestivum L.) Pak. J. Bot. 47(3):1225-1230.
Ortiz-Ferrara, G., R. Rajaram and M.G. Mosaad. 1993. Breeding strategies for improving wheat in heat- stressed environments. p. 24-32. In D.A. Saunders and G.P. Hettel (ed). Wheat in heat stressed environments: Irrigated, Dry Areas and Rice-Wheat farming systems. UNDP/ARC/BARI/CIMMYT, Mexico.
Ozakan, H., T. Yagbasanlar and I. Gene. 1997. Genetic analysis of yield components, harvest index and biological yield on bread wheat under medetiterranean climatic conditions. Rachi, 16: 49-52.
Packer, D. J. 2007. Comparing the Performance of F1 Testers Versus Their Inbred Line Parents in Evaluating Experimental Sorghum R and B Lines in Testcrosses. Vol. Master of science plant breeding: Brigham Young University.
Padhar, P. R., R.B. Madaria, J.H. Vachhani and K.L. Dobariya. 2010. Combining ability analysis of grain yield and its contributing characters in bread wheat (Triticum
aestivum L. em. Thell) under late sown condition. Intl. J. Agrl. Sci., 6(1): 267-272.
Parry M. A., M.P. Reynolds, M.E. Salvucci, C. Raines, P.J. Andralojc, X-G. Zhu, G.D. Price, A.G. Condon, R.T. Furbank. 2011. Raising yield otential of wheat. II. Increasing photosynthetic capacity and efficiency. J. Exp. Bot. 62: 453–467.
Pask, A., A.K. Joshi, Y. Manes, I. Sharma, R. Chatrath G.P. Singh. 2014. A wheat phenotyping network to incorporate physiological traits for climate change in South Asia. Field Crops Res. 168:156–167.
Pastore, A, S.R. Martin, A. Politou, K.C. Kondapalli and T. Stemmler. 2007. Unbiased cold denaturation: low- and high-temperature unfolding of yeast frataxin under physiological conditions. J Am Chem Soc. 129:5374–5375.
164
Pierre, C. S., J. Crossa, Y. Manes and M.P. Reynolds, 2010. Gene action of canopy temperature in bread wheat under diverse environments. Theor. Appl. Genet. 120: 1107–1117.
Pinto, R. S., Molero G. and Renyolds M. P., 2017, Identification of Heat Tolerant Wheat Lines Showing Genetic Variation in Leaf Respiration and Other Physiological Traits, Euphytica, 213:76.
Pittock, B. 2003. Climate Change: An Australian Guide to the Science and Potential of Impacts. Department for the Environment and Heritage, Australian Greenhouse Office, Canberra, ACT.
Porter, J.R. 2005. Rising temperatures are likely to reduce crop yields. Nature, 436: 174.
Powers, Leroy. 1944. An expansion of jones theory for the explanation of heterosis. Amer. Nat., 78: 275-280.
Przuli, N. and N. Mladenov. 1999. Inheritance of grain filling duration in spring wheat. Plant Breed 118:517-521.
Qari, M.S., N.I. Khan and A.G. Khan. 1986. Combining ability analysis for yield and yield components in spring wheat diallel crosses. Pakistan J. Agric. Res., 22: 95–9.
Quarrie S.A., J. Stojanovic and S. Pekic. 1999. Improving drought tolerance in small-grain cereals: A case study, progress and prospects. Plant Growth Regulation. 29: 1-21.
Rad, M.R.N., M.A. Kadir, M.R. Yusop, H.Z. Jaafar and M. Danaee. 2013. Gene action for physiological parameters and use of relative water content (RWC) for selection of tolerant and high yield genotypes in F2 population of wheat. Austr. J. Crop Sci. 7: 407-413.
Radmehr, M., G.A.L. Aeyneh and A. Naderi. 2004. A study on source-sink relationship of wheat genotypes under favorable and terminal heat stress conditions in Khuzestan. Iranian J. Crop Sci. 6(2): 101-113.
Rahim, M.A., A. Salam., A. Saeed and A. Shakeel. 2006. Combining ability for flag leaf area, yield and yield components in bread wheat. J. Agric. Res. 44(3): 175-180.
Rahman, M.A., N.A. Siddquie, M.R. Alam, A.S.M.M.R. Khan and M.S. Alam. 2003. Genetic analysis of some yield contributing and quality characters in spring wheat (Triticum aestivum L.). Asian J. Plant Sci., 2: 277–282
165
Rajara, M.P. and R.V. Maheshwari. 1996. Combining ability in wheat using line × tester analysis. Madras Agric. J., 83: 107–110.
Ram K., R. Munjal, Sunita and N. Kumar. 2017. Combine Effects of Drought and High Temperature on Water Relation Traits in Wheat Genotypes under Late and Very Late Sown Condition, Int. J. Curr. Microbiol. App. Sci. 6(8): 567-576.
Ramani, H.R., M.K. Mandavia, R.A. Dave, R.P. Bambharolia, H. Silungwe and N.H. Garaniya. 2017. Biochemical and physiological constituents and their correlation in wheat (Triticum aestivum L.) genotypes under high temperature at different development stages. Int. J. Plant Physiology and Biochemistry. 9(1): 1-8.
Rasul, I., A.S. Khan and Z. Ali. 2002. Estimation of heterosis for yield and some yield components in bread wheat. Int. J. Biol. Sci. 4(2): 214-216.
Rebetzke, G.J., A.G. Condon, R.A. Richards and G.D. Farquhar. 2003. Gene action for leaf conductance in three wheat crosses. Crop Pasture Sci. 54: 381-387.
Reynolds, M. P., M. Belota., M. I. B. Delgado, I. Amani and R. A. Fischer. 1994. Physiological and morphological traits associated with spring wheat yield under hot, irrigated conditions. Aust. J. Pl. Physiol. 21: 717-730.
Reynolds, M.P, D. Bonnett, S.C. Chapman, R.T. Furbank, Y. Manès, D.E. Mather, M.A.J. Parry. 2011. Raising yield potential of wheat. Overview of a consortium approach and breeding strategies. J. Exp. Bot. 62: 439–452.
Richards R. A., 1996. Defining selection criteria to improve yield under drought. Plant Growth Regulation. 20: 157-166.
Rodriguez M, E. Canales, O. Borras-Hidalgo. 2005. Molecular aspects of abiotic stress in plants. Biotechnol Appl. 22:1–10.
Rong, G.Z., L.Q. Xie and J.T. Gu. 2001. Heredity study on grain protein content of different type winter wheat varieties. Journal of Agricultural University of Hebei 24:9-12.
Rosegrant, M.W. and M. Agcaoili. 2010. Global food demand, supply and price prospectus to 2010. International Food Policy Research Institute, Washington, D. C. USA.
Rosyara, U.R., D. Vromman and E. Duveiller. 2008. Canopy temperature depression as an indication of correlative measure of spot blotch resistance and heat stress tolerance in spring wheat. J. Plant Pathol. 90(1): 103-107.
166
Saadalla, M. M., J. F. Shanahan and J. S. Quick. 1990. Heat tolerance in winter wheat.II. Membrane thermostability and field performance. Crop Sci. 30:1248-1251.
Saeed A, Chaudhry MA, Saeed N, Khaliq I, Johar MZ. 2001. Line × tester analysis for some morpho-physiological traits in bread wheat. Int. J. Agric. Biol., 3: 444-447.
Said, A.A. 2014. Generation mean analysis in wheat (Triticum aestivum L.) under drought stress conditions. Annals Agri. Sci. 59: 177-184.
Sairam R. K., G.C Srivastva and DC Saxena 2000. Increased antioxidant activity under elevated temperature: a mechanism of heat stress tolerance in wheat genotypes. Biologia-Plantarum (Czech Republic.) 43(2):245-251.
Sairam, R.K. and G.C. Srivastava. 2001. Water Stress Tolerance of Wheat (Triticum
aestivum L.): Variations in Hydrogen Peroxide Accumulation and Antioxidant Activity in Tolerant and Susceptible Genotypes. J. Agron. Crop Sci. 186: 63-70.
Sajnani, D.N. 1968. Studies of hybrid vigour and combining ability in wheat diallel crosses. Diss. Absts. 28(68): 4641 B.
Sakin, M.A., C. Akinci, O. Duzdemir and E. Donmez. 2011. Assessment of genotype x environment interaction on yield and yield components of durum wheat genotypes by multivariate analyses. Afr. J. Biotech. 10: 2875-2885.
Saleem, S.A. and S.A. El-Sawai. 2006. Line × tester analysis for grain yield and its components in bread wheat. Minufiya J. Agri. Res. 31(1):75-87.
Saleem, U., I. Khaliq, T. Mahmood and M. Rafique. 2006. Phenotypic and correlation coefficients between yield and yield components in wheat. J. Agric. Res., 44:1-6.
Sandeep, K., M. Singh and R.S. Verma. 2000. Studies on heat tolerance in wheat genotypes. Gujrat Agri. Uni Res. J.26 (1): 16-22.
Sanjeev, R., S. Prasad and M.A. Billore. 2005. Combining ability studies for yield and its attributes in Triticum durum. Madras Agric. J. 92(1-3):7-11.
Sareen, S., B.S. Tyagi, V. Tiwari and I. Sharma. 2012. Response Estimation of Wheat Synthetic Lines to Terminal Heat Stress Using Stress Indices. J. Agri. Sci. 4: 97 – 104.
Sarkar, D.D., D.J. Joardar and M. Hossain, 1987. Combining ability analysis in wheat. Envir.
and Ecol., 5: 808–19.
167
Savchenko, G.E., Klyuchareva, E.A., Abrabchik, L.M. and Serdyuchenko, E.V. (2002). Effect of periodic heat shock on the membrane system of etioplasts. Russ. J. Plant Physiol., 49: 349–359.
Savicka M, Skute N (2012). Some morphological, physiological and biochemical characteristics of wheat seedling Triticum aestivum L. organs after high-temperature treatment. Ekologija 58(1):9-21.
Savvides, A., S. Ali, M. Tester, V. Fotopoulos. 2016. Chemical priming of plants against multiple abiotic stresses: Mission possible? Trends Plant Sci. 21: 329-340.
Saxena, J., Minaxi and A. Jha. 2014. Impact of a phosphate solubilising bacterium and an arbuscular mycorrhizal fungus (Glomus etunicatum) on growth, yield and P concentration in wheat plants. CLEAN – Soil, Air, Water, 42: 1248–1252.
Schoffl, F., R. Prandl and A. Reindl. 1999. Molecular responses to heat stress. In: Shinozaki, K., Yamaguchi-Shinozaki, K. (Eds.), Molecular Responses to Cold, Drought, Heat and Salt Stress in Higher Plants. R.G. Landes Co., Austin, Texas, pp. 81–98.
Semenov M.A, P. Stratonovitch, F. Alghabari, M.J. Gooding. 2014. Adapting wheat in Europe for climate change. Journal of Cereal Science 59, 245–256.
Senapati, N., S.K. Swain and N.C. Patnaik. 1994. Genetics of yield and its components in wheat. Madras Agric. J., 81: 502–4.
Shah, S. M. A., M. S. Swati, T. Shahzad and I.H. Khalil. 2004. Heterosis for yield and related traits in spring wheat. Sarhad J. Agi. 20(4): 537-542.
Shahab, S., H. Mehdi, S.H. Mehdi, M. Mani and K.M. Seyed. 2011. Genetic Study of Some Agronomic Traits in Maize Via Testcross Analysis in Climatic Conditions of Khuzestan-Iran. World Appl. Sci. J. 15: 1018-1023.
Shahid M., F. Mohammad, M. Tahir. 2002. Path coefficient analysis in wheat. Sarhad J. Agrirc. 18: 385-388.
Shahzad, K., Z. Mohy-ud-din, M.A. Chowdhry and D. Hussain, 1998. Genetic analysis for some yield traits in (Triticum aestivum L.) Pakistan J. Biol. Sci., 1: 237–40.
Shanahan, J. F., I. B. Edwards, J. S. Quick and J. R. Fenwick. 1990. Membrane thermostability and heat tolerance of spring wheat. Crop Sci. 30: 247-251.
Sharma, J. R. (2006). Statistical and biometrical techniques in plant breeding. New Delhi. India: New age international.

168
Sharma, P.K., P.K. Gupta, and H.S. Balyan, 1998. Genetic diversity in a large collection of wheats (Triticum spp.). Ind. J. Genet. Pl. Breed. 58(3): 271-278.
Sheikh, S. and I. Singh, 2000. Combining ability analysis in wheat plant characters and harvest index. Intl. J. Tropic. Agri. 18(1):29-37.
Shpiler, L., and A. Blum. 1991. Heat tolerance for yield and its components in different wheat cultivars. Euphytica. 51: 257-263.
Shushay, W., Abrha, H. Z., Zeleke and Gissa, D. W. 2013. Line × tester analysis of maize inbred lines for grain yield and yield related traits. Asian J. Plant Sc. Res. 3(5): 321-342.
Sial, M.A., M.A. Arain, S.K.M.H. Naqvi, M.U. Dahot and N.A. Nizamani, 2005. Yield and quailty paramertes of wheat genotypes as influenced by sowing dates and high temperature stress. Pak. J. Bot. 37(3): 575-584.
Singh, A., A. Kumar, E. Ahmad and J.P. Jaiswal, 2012. Combining ability and gene action studies for seed yield, its components and quality traits in bread wheat (Triticum
aestivum L. em Thell.). Electronic J. Plant Breed., 3(4): 964-972.
Singh, H. 2002. Genetic architecture of yield and its associated traits in bread wheat. PhD Thesis, Rajasthan Agriculture Univ., Bikaner, Rajasthan, India
Singh, H., S.N. Sharma and R.S. Sain, 2004. Heterosis Studies for Yield and Its Components in Bread Wheat over Environments. Hereditas, 141: 106-114.
Singh, H., S.N. Sharma, and R.S. Sain, 2011. Combining Ability for Some Quantitative Characters in Hexaploid Wheat (Triticum aestivum L. em. Thell). Procedings of 4th International Crop Science Congress, Brisbane, 26 September-1 October 2004.
Singh, I. and R. S. Paroda. 1985. Partial diallel analysis for combining ability in wheat. Indian J. Genet. 45: 492–498.
Singh, K., S.N. Sharma and Y. Sharma, 2011. Effect of high temperature on yield attributing traits in bread wheat. Bangladesh J. Agril. Res. 36(3): 415-426.
Singh, R.K., and B.D. Chaudhary, 1979. Biometrical Methods in Quantitative Genetic Analysis. Kalyani Publishers, New Delhi.

169
Singh, R.M., L.C. Prasad, M.Z. Abdin, A.K. Joshi, 2007. Combining ability analysis for grain filling duration and yield traits in spring wheat (Triticum aestivum L. em. Thell.). Genetics Molec. Bio., 30: 411-416.
Singh, S.K., 2003. Gene action and combining ability in relation to development of hybrids in wheat. Farm Sci. J., 12 (2):118–21.
Singh, S.P., L.R. Singh, S. Devendra and K. Rajendra. 2003. Combining ability in common wheat (Triticum aestivum L.) grown on sodic soil. Progressive Agri., 3: 78-80.
Singh, S.P., M. Singh H.K. Yadav, 2006. Diallel analysis for seed yield and its component traits in Cuphea procumbens. Genetika. 38(1):9-22
Singh, V., R. Krishna, S. Singh and P. Vikram, 2008. Combining Ability and Heterosis Analysis for Yield Traits in Bread Wheat (Triticum aestivum). Indian J. Agric. Sci., 82: 56-63.
Skider S., Ahmed J U., Hossain T., 2001. Heat Tolerance and Relative Yield Performance of Wheat Varieties under Late Seeded Conditions. Indian J. Agric. Res. 35(3):141-148.
Spiertz, J.H.J., R.J. Hamer, H. Xu, C. Primo-Martin, C. Don and P.E.L. Putten, 2006. Heat stress in wheat (Triticum aestivum L.): Effects on grain growth and quality traits. Eur. J. Agron., 25: 8-–95.
Sprague, G.F. and L. A. Tautum, 1942. General Vs Specific Combining Ability in Single Crosses of Corn. American Soc. Agron., 34: 923-932.
Srivastava, M. K., D. Singh, and S. Sharma, 2012. Combining ability and gene action for seed yield and its components in bread wheat (Triticum aestivum L. Em. Thell]. Electronic J. Pl. Bred., 3: 606-611.
Steel, R.G.D., J.H. Torrie and D.A. Dickey. 1997. Principles and procedures of statistics: A biometrical approach, 3rd ed. McGraw Hill Book Co., New York.
Subhani, G.M. and M.A. Chowdhry. 2000. Correlation and path coefficient analysis in bread wheat under drought stress and normal conditions. Pak. J. Biol. Sci. 3: 72-77.
Subhani, G.M., M. A. Chowdhry and S. M. M. Gillani. 2000. Manifestation of heterosis in bread wheat under irrigated and drought conditions. Pak. J. Biol. Sci. 3(6): 971-974.
170
Sullivan, C.Y. and W.M. Ross. 1979. Selecting for drought and heat resistance in grain sorghum. In Mussell, H. and Staples, R (eds) Stress physiology in Crop plants. New York, USA: John Wiley.
Sultana, S. R., A. Ali, A. Ahmad, M. Mubeen, M. Zia-Ul-Haq, S. Ahmad, S. Ercisli, and H. Z. E. Jaafar. 2014. Normalized difference vegetation index as a tool for wheat yield estimation: A case study from Faisalabad, Pakistan. Sci. World J., 8 pages.
Tosun, M., I. Demir, C. Server and A. Gurel, 1995. Line × Tester analysis in some wheat crosses. Anadolu, 5: 52–63.
Tripathy, Rojalin, S.S. Ray and A.K. Singh. 2008. Analysing the Impact of Rising Temperature and CO2 on Growth and Yield of Major Cereals Crops using Simulation Model. Paper presented at Workshop on Impact of Climate Change on Agriculture, 17-18 December, 2009, organised by Space Applications Centre (ISRO) and Indian Society of Remote Sensing, Ahmedabad.
Tsegaye, D., T. Dessalegn, Y. Dessalegn and G. Share, 2012. Genetic variability, correlation and path analysis in durum wheat germplasm (Triticum durum Desf). Agric. Res. Rev., 1(4): 107-112.
Udaykumar, K., M.C. Wali, M. Deepa, M. Laxman and G. Prakash, 2014. Combining Ability Studies for Yield and Its Related Traits in Newly Derived Inbred Lines of Maize (Zea Mays L.). Molecular Plant Breed., 4(8): 71-76.
Ullah, I. 2004. Inheritance of important traits in bread wheat using diallel analysis. PhD. Thesis, KPK Agri. Univ., Peshawar, Pakistan.
Ullah, K., N.U. Khan, S.J. Khan, I.M. Khan, I.U. Khan, S. Gul, Habib-Ur-Rahman and R, Ullah, R.U. Khan. 2014. Cell Membrane Thermo-Stability Studies through Joint Segregation Analysis in Various Wheat Populations. Pak. J. Bot. 46(4): 1243-1252.
Ullah, S., A.S. Khan, A. Raza and S. Sadique. 2010. Gene action analysis of yield and yield related traits in spring wheat (Triticum aestivum). Int. J. Agric. Biol. 12: 125-128.
Usman, M. 1998. Line × tester analysis for combining ability in wheat. M.Sc. Thesis, Deptt. Pl. Br. Genet. Univ. of Agri., Faisalabad.
Vanpariya, L.G., V.P. Chovatia, and D.R. Mehta. 2006. Combining ability studies in bread wheat (Triticum aestivum L.) National J. Plant Improv. 8: (2) 132-137.
171
Vara, P.V., M. Djanaguiraman. 2014. Response of floret fertility and individual grain weight of wheat to high temperature stress: sensitive stages and thresholds for temperature and duration. Funct. Plant Bio. 41; 1261–1269.
Wahid, A., S. Gelani, M. Ashraf and M.R. Foolad. 2007. Heat tolerance in plants: an overview. Environ. Exp. Bot. 61: 199–223.
Wang, Y, Z. Yang, Q. Zhang, J. Li. 2009. Enhanced chilling tolerance in Zoysia matrella by pre-treatment with salicylic acid, calcium chloride, hydrogen peroxide or 6-benzylaminopurine. Biol. Plant. 53: 179 –182.
Wang, Z.Y. and S.Y. Lu. 1991. Genetic analysis of quality and yield characters of wheat. J. of Agri. Uni. Hebei., 14:1-5.
Ward, J.H. 1963. Hierarchical grouping to optimize an objective function. J. Am. Stat. Assoc. 58(30): 236-244.
Webber, H., P. Martre, S. Asseng, B. Kimball, J. White, M. Ottman, G.W. Wall, G.D. Sanctis, J. Doltra, R. Grant, B. Kassie, A. Maiorano, J. E. Olesen, D. Ripoche, E.E. Rezaei, M.A. Semenov, P. Stratonovitch, F. Ewerta. 2017. Canopy temperature for simulation of heat stress in irrigated wheat in a semi-arid environment: A multi-model comparison. Field Crops Res. 202: 21–35.
Weigand, C.L. and J.A. Cuellar. 1981. Duration of grain filling and kernel weight of wheat as affected by temperature. Crop Sci. 21: 95-101.
Yadav, M.S., I Singh, S.K. Sharma, K.P. Singh 1988. Combining ability in bread wheat. (Triticum aestivum L.). Int. J. Trop. Agri. 6:102-105.
Yao, J.B., H.X. Ma, L.J. Ren, P.P. Zhang, X.M. Yang, G.C. Yao, P. Zhang, P. Zhou. 2011. Genetic analysis of plant height and its components in diallel crosses of bread wheat (Triticum aestivum L.). Aust. J. Crop Sci. 5: 1408–1418.
Yildirim, M., B. Bahar, M. Koç and C. Barutçular. 2009. Membrane Thermal Stability at Different Developmental Stages of Spring Wheat Genotypes and Their Diallel Cross Populations, Tarim Bilimleri Dergisi, 15(4): 293-300.
You, L., M.W. Rosegrant, S. Wood and D. Sun. 2009. Impact of growing season temperature on wheat productivity in China. Agricultural and Forest Meteorology. 149: 1009–1014.
Zubair, M., A.R. Chowdhry, I.A. Khan and A. Bakhah. 1987. Combining ability studies in bread wheat (Triticum aestivum L.). Pak. J. Bot. 19: 75–80.

172
Appendix- I. Mean data of Morpho–physiological and quality traits studied in lines, testers and their crosses under normal conditions.
Genotype
CMT NDVIV
NDVIG
CTV CTG RWC PH FLA PL SL FTP DTH DTM SPS GPS TGW GYP PRO MOI STR ASH GLU TW
L1 61.61 0.72 0.59 23.07 21.58 52.92 89.69 28.80 36.25 11.02 9.00 90.00 112.67 11.00 47.67 38.99 13.33 13.13 7.27 54.47 1.53 35.52 72.90
L2 62.28 0.70 0.68 22.83 20.92 55.40 94.08 25.28 39.16 11.12 9.33 94.67 117.00 9.00 44.67 36.94 17.33 11.63 7.03 53.97 1.45 32.52 76.87
L3 61.22 0.71 0.64 21.90 21.49 59.36 97.50 31.10 39.32 10.32 10.67 98.00 119.67 11.00 48.67 35.94 18.33 12.13 7.53 54.47 1.52 36.52 75.07
L4 66.58 0.71 0.63 22.43 20.78 56.59 92.25 32.17 38.12 11.12 10.67 93.33 117.00 11.00 54.67 50.94 19.33 13.63 7.67 55.37 1.62 39.52 79.17
L5 59.25 0.71 0.57 22.43 22.21 54.41 98.61 25.99 39.59 12.32 10.00 98.67 114.00 11.00 59.67 45.94 23.33 14.23 7.23 56.17 1.50 32.52 72.37
L6 62.90 0.71 0.58 22.82 21.99 56.87 100.62 30.10 37.88 15.12 9.00 100.33 115.33 11.67 59.67 36.94 17.33 12.75 7.80 54.47 1.61 32.33 75.07
L7 60.25 0.73 0.55 21.23 22.10 54.76 92.08 26.96 36.36 10.42 11.00 100.67 116.00 11.00 60.67 35.94 14.33 15.13 7.53 55.37 1.45 30.52 78.50
L8 57.77 0.71 0.58 25.43 21.48 57.28 98.12 27.54 39.35 11.12 9.00 97.33 115.00 13.00 60.33 44.94 11.33 13.13 7.20 53.78 1.26 39.52 77.17
L9 59.58 0.70 0.62 21.73 21.83 59.24 89.08 25.55 38.94 11.02 11.67 88.00 125.00 11.00 62.67 37.94 18.33 13.73 7.30 53.07 1.51 34.52 75.57
L10 64.58 0.71 0.56 23.73 21.80 57.57 98.18 27.48 35.24 12.12 9.00 85.67 115.00 11.00 51.67 45.94 20.33 14.63 7.17 56.27 1.45 33.52 75.43
T1 47.76 0.71 0.63 21.73 22.46 59.17 99.07 28.16 40.01 14.37 12.00 95.00 113.67 11.00 55.67 35.10 19.33 13.63 7.37 55.37 1.42 38.52 75.73
T2 40.58 0.74 0.59 22.05 22.50 59.42 102.50 30.82 36.35 14.38 10.00 87.33 112.33 12.33 57.67 32.89 24.33 13.03 7.53 56.07 1.37 32.52 77.37
T3 49.73 0.67 0.62 20.18 20.76 56.99 96.75 32.39 38.42 11.62 10.67 87.00 117.00 11.00 59.67 36.86 17.33 12.33 7.40 53.87 1.42 31.52 74.33
T4 45.55 0.71 0.60 21.78 22.52 51.25 98.75 25.45 36.82 14.92 11.00 96.67 121.67 13.00 53.67 34.76 13.33 14.03 7.77 56.87 1.50 30.52 75.53
T5 47.79 0.69 0.57 21.43 23.24 53.58 99.50 35.26 39.83 10.62 8.00 85.33 121.00 15.00 58.67 32.78 18.33 15.03 7.50 55.17 1.45 39.52 78.47
L1 × T1 37.72 0.83 0.71 23.33 27.03 62.51 110.35 28.71 40.45 11.12 12.00 100.67 132.00 21.00 59.67 37.82 13.22 12.89 7.87 57.07 1.86 34.51 80.43
L1 × T2 42.51 0.81 0.62 20.82 24.45 68.55 113.68 24.81 41.52 14.42 14.00 99.00 132.33 19.00 61.45 45.26 19.33 12.93 7.90 53.67 1.80 36.49 84.50
L1 × T3 49.18 0.78 0.66 19.83 25.05 66.74 93.00 27.96 38.36 17.12 15.00 98.00 129.33 17.00 62.67 43.96 23.11 13.53 8.07 55.17 1.71 33.95 82.37
L1 × T4 33.55 0.72 0.67 21.63 24.58 62.70 99.71 24.78 42.75 14.02 14.00 103.00 129.67 15.00 55.87 39.92 23.33 14.03 7.33 54.87 1.66 33.52 79.33
L1 × T5 55.98 0.76 0.67 19.85 23.93 58.49 97.08 30.82 43.37 12.12 15.00 97.00 126.33 23.00 58.67 42.47 18.26 12.53 7.87 55.87 1.95 29.74 85.80
L2 × T1 43.14 0.73 0.65 22.73 24.47 64.39 102.17 34.00 44.36 10.42 13.00 103.00 123.00 17.00 51.67 43.51 19.33 15.63 7.80 54.27 2.03 31.96 83.47
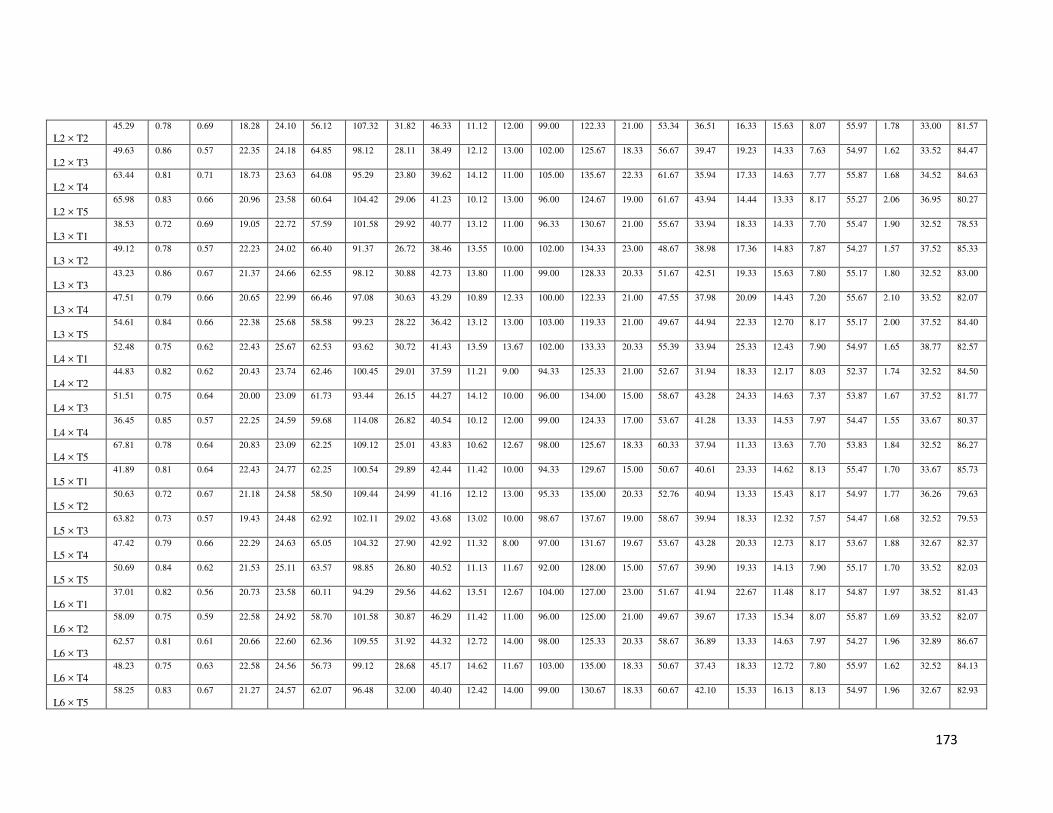
173
L2 × T2 45.29 0.78 0.69 18.28 24.10 56.12 107.32 31.82 46.33 11.12 12.00 99.00 122.33 21.00 53.34 36.51 16.33 15.63 8.07 55.97 1.78 33.00 81.57
L2 × T3 49.63 0.86 0.57 22.35 24.18 64.85 98.12 28.11 38.49 12.12 13.00 102.00 125.67 18.33 56.67 39.47 19.23 14.33 7.63 54.97 1.62 33.52 84.47
L2 × T4 63.44 0.81 0.71 18.73 23.63 64.08 95.29 23.80 39.62 14.12 11.00 105.00 135.67 22.33 61.67 35.94 17.33 14.63 7.77 55.87 1.68 34.52 84.63
L2 × T5 65.98 0.83 0.66 20.96 23.58 60.64 104.42 29.06 41.23 10.12 13.00 96.00 124.67 19.00 61.67 43.94 14.44 13.33 8.17 55.27 2.06 36.95 80.27
L3 × T1 38.53 0.72 0.69 19.05 22.72 57.59 101.58 29.92 40.77 13.12 11.00 96.33 130.67 21.00 55.67 33.94 18.33 14.33 7.70 55.47 1.90 32.52 78.53
L3 × T2 49.12 0.78 0.57 22.23 24.02 66.40 91.37 26.72 38.46 13.55 10.00 102.00 134.33 23.00 48.67 38.98 17.36 14.83 7.87 54.27 1.57 37.52 85.33
L3 × T3 43.23 0.86 0.67 21.37 24.66 62.55 98.12 30.88 42.73 13.80 11.00 99.00 128.33 20.33 51.67 42.51 19.33 15.63 7.80 55.17 1.80 32.52 83.00
L3 × T4 47.51 0.79 0.66 20.65 22.99 66.46 97.08 30.63 43.29 10.89 12.33 100.00 122.33 21.00 47.55 37.98 20.09 14.43 7.20 55.67 2.10 33.52 82.07
L3 × T5 54.61 0.84 0.66 22.38 25.68 58.58 99.23 28.22 36.42 13.12 13.00 103.00 119.33 21.00 49.67 44.94 22.33 12.70 8.17 55.17 2.00 37.52 84.40
L4 × T1 52.48 0.75 0.62 22.43 25.67 62.53 93.62 30.72 41.43 13.59 13.67 102.00 133.33 20.33 55.39 33.94 25.33 12.43 7.90 54.97 1.65 38.77 82.57
L4 × T2 44.83 0.82 0.62 20.43 23.74 62.46 100.45 29.01 37.59 11.21 9.00 94.33 125.33 21.00 52.67 31.94 18.33 12.17 8.03 52.37 1.74 32.52 84.50
L4 × T3 51.51 0.75 0.64 20.00 23.09 61.73 93.44 26.15 44.27 14.12 10.00 96.00 134.00 15.00 58.67 43.28 24.33 14.63 7.37 53.87 1.67 37.52 81.77
L4 × T4 36.45 0.85 0.57 22.25 24.59 59.68 114.08 26.82 40.54 10.12 12.00 99.00 124.33 17.00 53.67 41.28 13.33 14.53 7.97 54.47 1.55 33.67 80.37
L4 × T5 67.81 0.78 0.64 20.83 23.09 62.25 109.12 25.01 43.83 10.62 12.67 98.00 125.67 18.33 60.33 37.94 11.33 13.63 7.70 53.83 1.84 32.52 86.27
L5 × T1 41.89 0.81 0.64 22.43 24.77 62.25 100.54 29.89 42.44 11.42 10.00 94.33 129.67 15.00 50.67 40.61 23.33 14.62 8.13 55.47 1.70 33.67 85.73
L5 × T2 50.63 0.72 0.67 21.18 24.58 58.50 109.44 24.99 41.16 12.12 13.00 95.33 135.00 20.33 52.76 40.94 13.33 15.43 8.17 54.97 1.77 36.26 79.63
L5 × T3 63.82 0.73 0.57 19.43 24.48 62.92 102.11 29.02 43.68 13.02 10.00 98.67 137.67 19.00 58.67 39.94 18.33 12.32 7.57 54.47 1.68 32.52 79.53
L5 × T4 47.42 0.79 0.66 22.29 24.63 65.05 104.32 27.90 42.92 11.32 8.00 97.00 131.67 19.67 53.67 43.28 20.33 12.73 8.17 53.67 1.88 32.67 82.37
L5 × T5 50.69 0.84 0.62 21.53 25.11 63.57 98.85 26.80 40.52 11.13 11.67 92.00 128.00 15.00 57.67 39.90 19.33 14.13 7.90 55.17 1.70 33.52 82.03
L6 × T1 37.01 0.82 0.56 20.73 23.58 60.11 94.29 29.56 44.62 13.51 12.67 104.00 127.00 23.00 51.67 41.94 22.67 11.48 8.17 54.87 1.97 38.52 81.43
L6 × T2 58.09 0.75 0.59 22.58 24.92 58.70 101.58 30.87 46.29 11.42 11.00 96.00 125.00 21.00 49.67 39.67 17.33 15.34 8.07 55.87 1.69 33.52 82.07
L6 × T3 62.57 0.81 0.61 20.66 22.60 62.36 109.55 31.92 44.32 12.72 14.00 98.00 125.33 20.33 58.67 36.89 13.33 14.63 7.97 54.27 1.96 32.89 86.67
L6 × T4 48.23 0.75 0.63 22.58 24.56 56.73 99.12 28.68 45.17 14.62 11.67 103.00 135.00 18.33 50.67 37.43 18.33 12.72 7.80 55.97 1.62 32.52 84.13
L6 × T5 58.25 0.83 0.67 21.27 24.57 62.07 96.48 32.00 40.40 12.42 14.00 99.00 130.67 18.33 60.67 42.10 15.33 16.13 8.13 54.97 1.96 32.67 82.93

174
L7 × T1 43.69 0.78 0.59 20.53 23.08 64.24 111.98 31.65 42.59 11.32 11.67 98.67 135.67 19.67 59.67 37.72 13.33 12.03 8.13 55.87 1.84 34.52 80.33
L7 × T2 45.79 0.80 0.66 22.14 25.95 56.56 102.32 29.03 43.30 14.62 12.00 103.67 137.33 21.67 57.67 41.15 18.33 14.64 7.53 55.27 1.71 38.02 87.60
L7 × T3 40.11 0.81 0.66 20.43 24.52 64.37 97.85 25.95 39.96 12.42 11.67 94.00 127.33 15.00 59.67 43.60 17.33 12.63 8.03 55.47 1.82 36.52 81.77
L7 × T4 42.86 0.84 0.58 19.43 24.60 53.63 107.30 25.00 37.74 13.39 12.00 95.00 127.67 19.67 55.67 33.94 15.33 12.50 8.17 54.27 1.75 38.52 82.53
L7 × T5 37.08 0.81 0.67 21.55 24.74 62.79 100.63 29.58 46.39 14.62 15.00 99.00 124.00 18.33 51.67 36.29 19.33 13.63 7.17 55.17 1.65 32.52 83.47
L8 × T1 33.33 0.83 0.67 22.53 24.64 61.53 100.74 26.66 43.70 11.32 14.00 102.33 139.33 16.33 58.67 47.29 17.33 12.53 7.93 55.05 1.88 35.52 84.40
L8 × T2 51.34 0.76 0.56 20.33 23.67 65.65 103.43 31.09 41.64 11.63 13.00 98.00 125.67 18.33 61.67 42.06 20.67 13.03 8.10 54.72 1.86 37.52 82.57
L8 × T3 39.20 0.79 0.64 22.08 25.56 64.68 104.84 31.71 39.61 14.42 14.67 96.67 124.67 19.67 48.67 40.94 18.33 13.63 8.00 54.97 1.60 33.52 79.47
L8 × T4 61.04 0.75 0.66 21.79 24.62 61.90 111.30 31.71 43.37 12.62 15.00 101.00 130.67 19.00 46.67 45.94 18.33 12.93 7.30 52.37 2.02 33.00 79.30
L8 × T5 53.94 0.82 0.68 22.41 24.75 64.90 117.22 28.92 42.84 14.42 13.33 96.67 137.33 21.00 53.67 37.94 20.33 12.03 7.57 53.87 1.58 39.52 81.10
L9 × T1 64.45 0.83 0.60 19.89 23.38 68.32 110.32 27.83 41.35 11.32 11.00 94.00 131.33 23.00 51.67 33.94 20.00 15.23 7.80 54.47 1.94 36.52 83.63
L9 × T2 48.92 0.76 0.63 22.16 24.50 62.56 92.06 25.31 43.43 10.42 11.67 95.00 131.00 18.33 52.67 37.94 22.00 14.63 7.47 55.17 2.00 30.52 84.93
L9 × T3 58.32 0.77 0.67 20.64 25.54 62.48 103.05 30.30 40.32 12.42 13.33 92.00 123.67 19.67 58.67 42.94 17.33 14.73 7.67 52.37 1.81 31.52 79.53
L9 × T4 39.23 0.86 0.55 23.63 25.28 64.25 113.22 30.76 38.52 13.32 11.00 103.67 118.67 16.33 50.67 45.94 13.33 11.63 7.77 53.87 2.03 35.67 82.53
L9 × T5 68.40 0.81 0.70 22.13 24.47 64.16 108.32 30.54 43.44 10.72 13.00 102.33 126.00 21.00 58.67 36.94 18.33 12.13 7.57 54.47 1.89 32.52 83.63
L10 × TI 41.42 0.84 0.70 20.43 24.38 67.20 105.20 29.18 41.50 14.32 13.67 101.67 133.00 23.00 50.67 47.94 15.33 12.13 8.17 55.17 1.87 37.52 79.93
L10 × T2 55.09 0.79 0.67 22.63 24.97 59.76 111.10 24.82 39.56 15.42 14.67 102.67 124.67 21.00 45.67 42.94 13.33 13.63 8.03 54.40 1.71 34.52 83.67
L10 × T3 51.36 0.80 0.70 23.03 25.37 66.57 99.78 29.98 42.59 11.42 15.67 104.33 125.67 17.67 48.67 45.94 18.33 13.13 8.07 53.85 1.98 32.52 83.53
L10 × T4 53.02 0.73 0.63 21.03 23.37 62.59 110.08 31.03 42.47 12.32 13.67 100.33 135.67 19.67 60.67 43.94 17.33 13.53 7.57 55.17 1.98 34.52 86.33
L10 × T5 39.23 0.85 0.66 23.43 25.77 63.57 116.18 30.14 47.24 11.02 15.00 96.67 126.67 25.00 54.67 51.94 19.33 14.13 8.23 54.77 2.13 40.00 82.67
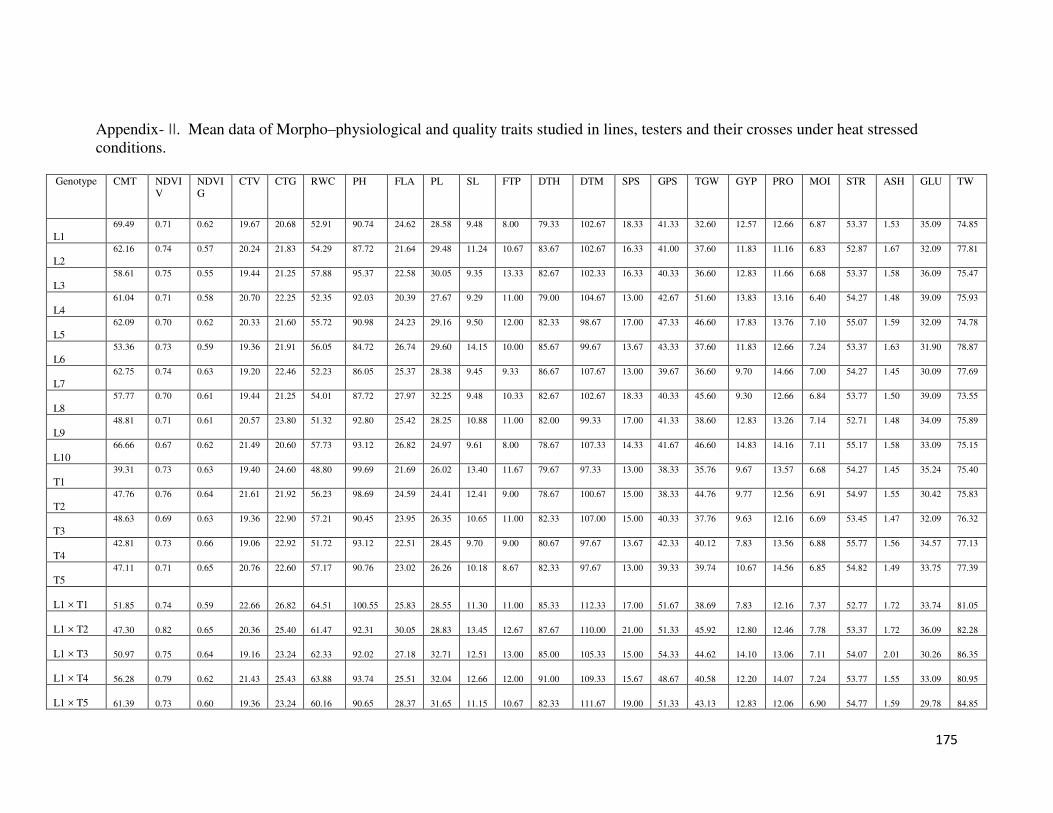
175
Appendix- II. Mean data of Morpho–physiological and quality traits studied in lines, testers and their crosses under heat stressed conditions.
Genotype
CMT NDVIV
NDVIG
CTV CTG RWC PH FLA PL SL FTP DTH DTM SPS GPS TGW GYP PRO MOI STR ASH GLU TW
L1 69.49 0.71 0.62 19.67 20.68 52.91 90.74 24.62 28.58 9.48 8.00 79.33 102.67 18.33 41.33 32.60 12.57 12.66 6.87 53.37 1.53 35.09 74.85
L2 62.16 0.74 0.57 20.24 21.83 54.29 87.72 21.64 29.48 11.24 10.67 83.67 102.67 16.33 41.00 37.60 11.83 11.16 6.83 52.87 1.67 32.09 77.81
L3 58.61 0.75 0.55 19.44 21.25 57.88 95.37 22.58 30.05 9.35 13.33 82.67 102.33 16.33 40.33 36.60 12.83 11.66 6.68 53.37 1.58 36.09 75.47
L4 61.04 0.71 0.58 20.70 22.25 52.35 92.03 20.39 27.67 9.29 11.00 79.00 104.67 13.00 42.67 51.60 13.83 13.16 6.40 54.27 1.48 39.09 75.93
L5 62.09 0.70 0.62 20.33 21.60 55.72 90.98 24.23 29.16 9.50 12.00 82.33 98.67 17.00 47.33 46.60 17.83 13.76 7.10 55.07 1.59 32.09 74.78
L6 53.36 0.73 0.59 19.36 21.91 56.05 84.72 26.74 29.60 14.15 10.00 85.67 99.67 13.67 43.33 37.60 11.83 12.66 7.24 53.37 1.63 31.90 78.87
L7 62.75 0.74 0.63 19.20 22.46 52.23 86.05 25.37 28.38 9.45 9.33 86.67 107.67 13.00 39.67 36.60 9.70 14.66 7.00 54.27 1.45 30.09 77.69
L8 57.77 0.70 0.61 19.44 21.25 54.01 87.72 27.97 32.25 9.48 10.33 82.67 102.67 18.33 40.33 45.60 9.30 12.66 6.84 53.77 1.50 39.09 73.55
L9 48.81 0.71 0.61 20.57 23.80 51.32 92.80 25.42 28.25 10.88 11.00 82.00 99.33 17.00 41.33 38.60 12.83 13.26 7.14 52.71 1.48 34.09 75.89
L10 66.66 0.67 0.62 21.49 20.60 57.73 93.12 26.82 24.97 9.61 8.00 78.67 107.33 14.33 41.67 46.60 14.83 14.16 7.11 55.17 1.58 33.09 75.15
T1 39.31 0.73 0.63 19.40 24.60 48.80 99.69 21.69 26.02 13.40 11.67 79.67 97.33 13.00 38.33 35.76 9.67 13.57 6.68 54.27 1.45 35.24 75.40
T2 47.76 0.76 0.64 21.61 21.92 56.23 98.69 24.59 24.41 12.41 9.00 78.67 100.67 15.00 38.33 44.76 9.77 12.56 6.91 54.97 1.55 30.42 75.83
T3 48.63 0.69 0.63 19.36 22.90 57.21 90.45 23.95 26.35 10.65 11.00 82.33 107.00 15.00 40.33 37.76 9.63 12.16 6.69 53.45 1.47 32.09 76.32
T4 42.81 0.73 0.66 19.06 22.92 51.72 93.12 22.51 28.45 9.70 9.00 80.67 97.67 13.67 42.33 40.12 7.83 13.56 6.88 55.77 1.56 34.57 77.13
T5 47.11 0.71 0.65 20.76 22.60 57.17 90.76 23.02 26.26 10.18 8.67 82.33 97.67 13.00 39.33 39.74 10.67 14.56 6.85 54.82 1.49 33.75 77.39
L1 × T1 51.85 0.74 0.59 22.66 26.82 64.51 100.55 25.83 28.55 11.30 11.00 85.33 112.33 17.00 51.67 38.69 7.83 12.16 7.37 52.77 1.72 33.74 81.05
L1 × T2 47.30 0.82 0.65 20.36 25.40 61.47 92.31 30.05 28.83 13.45 12.67 87.67 110.00 21.00 51.33 45.92 12.80 12.46 7.78 53.37 1.72 36.09 82.28
L1 × T3 50.97 0.75 0.64 19.16 23.24 62.33 92.02 27.18 32.71 12.51 13.00 85.00 105.33 15.00 54.33 44.62 14.10 13.06 7.11 54.07 2.01 30.26 86.35
L1 × T4 56.28 0.79 0.62 21.43 25.43 63.88 93.74 25.51 32.04 12.66 12.00 91.00 109.33 15.67 48.67 40.58 12.20 14.07 7.24 53.77 1.55 33.09 80.95
L1 × T5 61.39 0.73 0.60 19.36 23.24 60.16 90.65 28.37 31.65 11.15 10.67 82.33 111.67 19.00 51.33 43.13 12.83 12.06 6.90 54.77 1.59 29.78 84.85
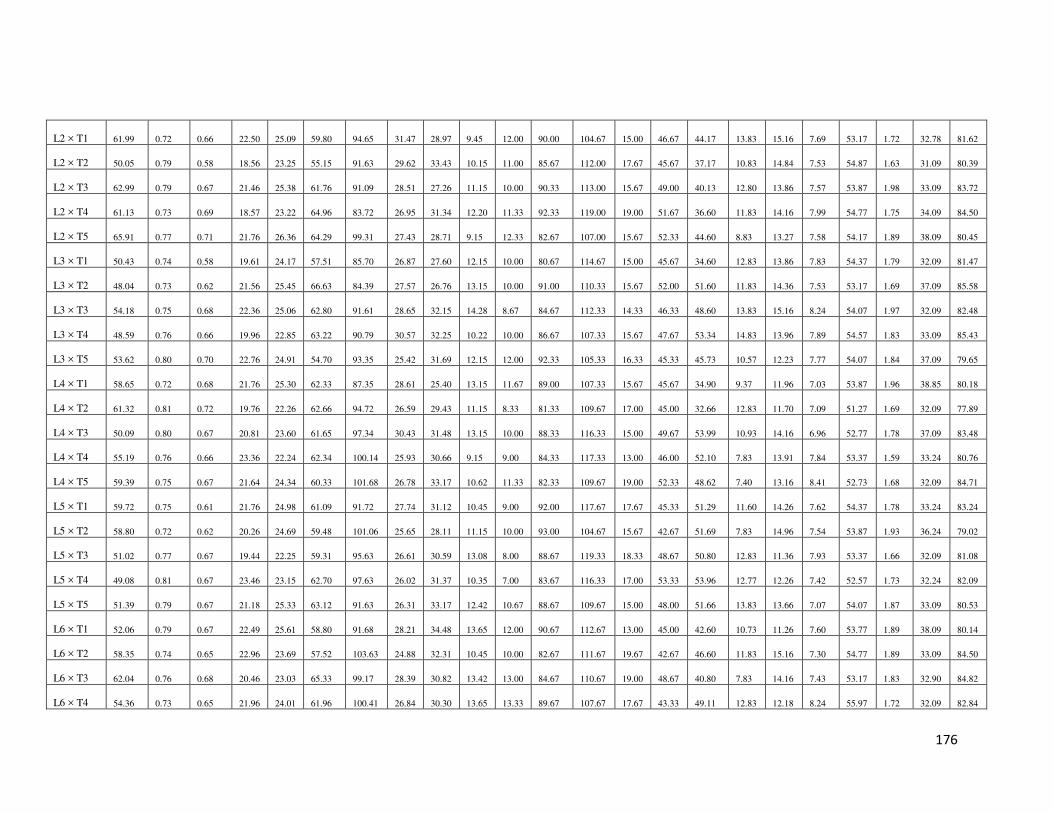
176
L2 × T1 61.99 0.72 0.66 22.50 25.09 59.80 94.65 31.47 28.97 9.45 12.00 90.00 104.67 15.00 46.67 44.17 13.83 15.16 7.69 53.17 1.72 32.78 81.62
L2 × T2 50.05 0.79 0.58 18.56 23.25 55.15 91.63 29.62 33.43 10.15 11.00 85.67 112.00 17.67 45.67 37.17 10.83 14.84 7.53 54.87 1.63 31.09 80.39
L2 × T3 62.99 0.79 0.67 21.46 25.38 61.76 91.09 28.51 27.26 11.15 10.00 90.33 113.00 15.67 49.00 40.13 12.80 13.86 7.57 53.87 1.98 33.09 83.72
L2 × T4 61.13 0.73 0.69 18.57 23.22 64.96 83.72 26.95 31.34 12.20 11.33 92.33 119.00 19.00 51.67 36.60 11.83 14.16 7.99 54.77 1.75 34.09 84.50
L2 × T5 65.91 0.77 0.71 21.76 26.36 64.29 99.31 27.43 28.71 9.15 12.33 82.67 107.00 15.67 52.33 44.60 8.83 13.27 7.58 54.17 1.89 38.09 80.45
L3 × T1 50.43 0.74 0.58 19.61 24.17 57.51 85.70 26.87 27.60 12.15 10.00 80.67 114.67 15.00 45.67 34.60 12.83 13.86 7.83 54.37 1.79 32.09 81.47
L3 × T2 48.04 0.73 0.62 21.56 25.45 66.63 84.39 27.57 26.76 13.15 10.00 91.00 110.33 15.67 52.00 51.60 11.83 14.36 7.53 53.17 1.69 37.09 85.58
L3 × T3 54.18 0.75 0.68 22.36 25.06 62.80 91.61 28.65 32.15 14.28 8.67 84.67 112.33 14.33 46.33 48.60 13.83 15.16 8.24 54.07 1.97 32.09 82.48
L3 × T4 48.59 0.76 0.66 19.96 22.85 63.22 90.79 30.57 32.25 10.22 10.00 86.67 107.33 15.67 47.67 53.34 14.83 13.96 7.89 54.57 1.83 33.09 85.43
L3 × T5 53.62 0.80 0.70 22.76 24.91 54.70 93.35 25.42 31.69 12.15 12.00 92.33 105.33 16.33 45.33 45.73 10.57 12.23 7.77 54.07 1.84 37.09 79.65
L4 × T1 58.65 0.72 0.68 21.76 25.30 62.33 87.35 28.61 25.40 13.15 11.67 89.00 107.33 15.67 45.67 34.90 9.37 11.96 7.03 53.87 1.96 38.85 80.18
L4 × T2 61.32 0.81 0.72 19.76 22.26 62.66 94.72 26.59 29.43 11.15 8.33 81.33 109.67 17.00 45.00 32.66 12.83 11.70 7.09 51.27 1.69 32.09 77.89
L4 × T3 50.09 0.80 0.67 20.81 23.60 61.65 97.34 30.43 31.48 13.15 10.00 88.33 116.33 15.00 49.67 53.99 10.93 14.16 6.96 52.77 1.78 37.09 83.48
L4 × T4 55.19 0.76 0.66 23.36 22.24 62.34 100.14 25.93 30.66 9.15 9.00 84.33 117.33 13.00 46.00 52.10 7.83 13.91 7.84 53.37 1.59 33.24 80.76
L4 × T5 59.39 0.75 0.67 21.64 24.34 60.33 101.68 26.78 33.17 10.62 11.33 82.33 109.67 19.00 52.33 48.62 7.40 13.16 8.41 52.73 1.68 32.09 84.71
L5 × T1 59.72 0.75 0.61 21.76 24.98 61.09 91.72 27.74 31.12 10.45 9.00 92.00 117.67 17.67 45.33 51.29 11.60 14.26 7.62 54.37 1.78 33.24 83.24
L5 × T2 58.80 0.72 0.62 20.26 24.69 59.48 101.06 25.65 28.11 11.15 10.00 93.00 104.67 15.67 42.67 51.69 7.83 14.96 7.54 53.87 1.93 36.24 79.02
L5 × T3 51.02 0.77 0.67 19.44 22.25 59.31 95.63 26.61 30.59 13.08 8.00 88.67 119.33 18.33 48.67 50.80 12.83 11.36 7.93 53.37 1.66 32.09 81.08
L5 × T4 49.08 0.81 0.67 23.46 23.15 62.70 97.63 26.02 31.37 10.35 7.00 83.67 116.33 17.00 53.33 53.96 12.77 12.26 7.42 52.57 1.73 32.24 82.09
L5 × T5 51.39 0.79 0.67 21.18 25.33 63.12 91.63 26.31 33.17 12.42 10.67 88.67 109.67 15.00 48.00 51.66 13.83 13.66 7.07 54.07 1.87 33.09 80.53
L6 × T1 52.06 0.79 0.67 22.49 25.61 58.80 91.68 28.21 34.48 13.65 12.00 90.67 112.67 13.00 45.00 42.60 10.73 11.26 7.60 53.77 1.89 38.09 80.14
L6 × T2 58.35 0.74 0.65 22.96 23.69 57.52 103.63 24.88 32.31 10.45 10.00 82.67 111.67 19.67 42.67 46.60 11.83 15.16 7.30 54.77 1.89 33.09 84.50
L6 × T3 62.04 0.76 0.68 20.46 23.03 65.33 99.17 28.39 30.82 13.42 13.00 84.67 110.67 19.00 48.67 40.80 7.83 14.16 7.43 53.17 1.83 32.90 84.82
L6 × T4 54.36 0.73 0.65 21.96 24.01 61.96 100.41 26.84 30.30 13.65 13.33 89.67 107.67 17.67 43.33 49.11 12.83 12.18 8.24 55.97 1.72 32.09 82.84
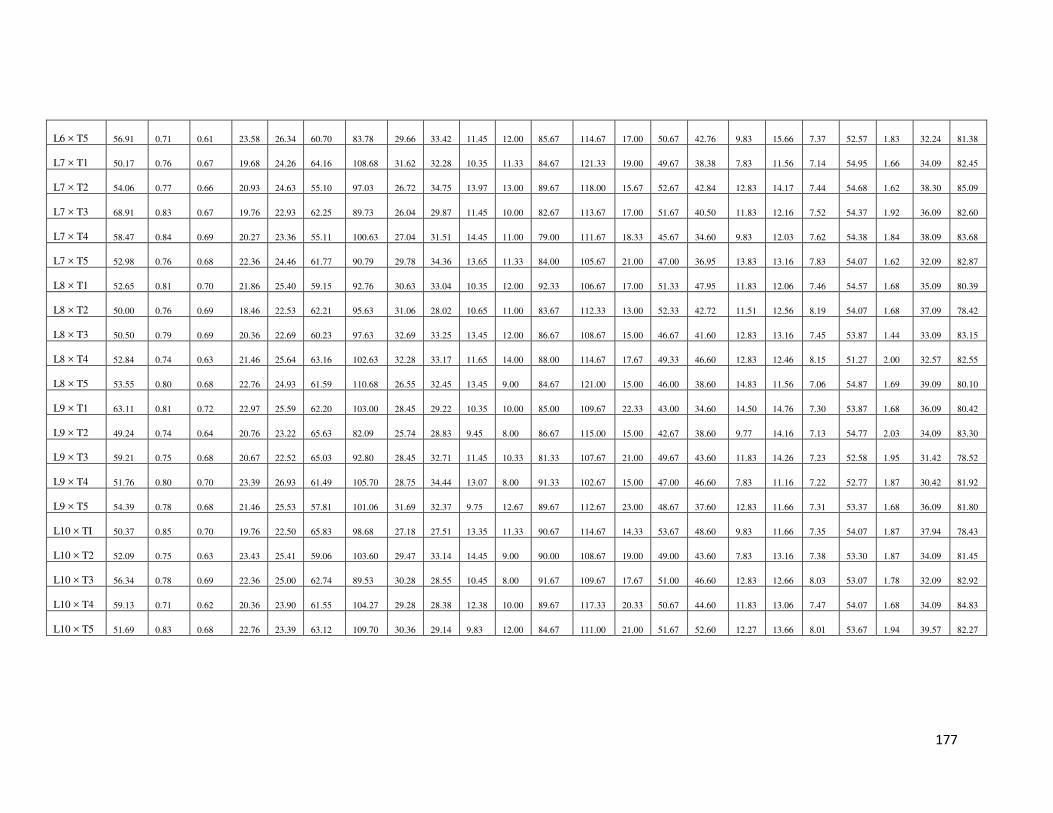
177
L6 × T5 56.91 0.71 0.61 23.58 26.34 60.70 83.78 29.66 33.42 11.45 12.00 85.67 114.67 17.00 50.67 42.76 9.83 15.66 7.37 52.57 1.83 32.24 81.38
L7 × T1 50.17 0.76 0.67 19.68 24.26 64.16 108.68 31.62 32.28 10.35 11.33 84.67 121.33 19.00 49.67 38.38 7.83 11.56 7.14 54.95 1.66 34.09 82.45
L7 × T2 54.06 0.77 0.66 20.93 24.63 55.10 97.03 26.72 34.75 13.97 13.00 89.67 118.00 15.67 52.67 42.84 12.83 14.17 7.44 54.68 1.62 38.30 85.09
L7 × T3 68.91 0.83 0.67 19.76 22.93 62.25 89.73 26.04 29.87 11.45 10.00 82.67 113.67 17.00 51.67 40.50 11.83 12.16 7.52 54.37 1.92 36.09 82.60
L7 × T4 58.47 0.84 0.69 20.27 23.36 55.11 100.63 27.04 31.51 14.45 11.00 79.00 111.67 18.33 45.67 34.60 9.83 12.03 7.62 54.38 1.84 38.09 83.68
L7 × T5 52.98 0.76 0.68 22.36 24.46 61.77 90.79 29.78 34.36 13.65 11.33 84.00 105.67 21.00 47.00 36.95 13.83 13.16 7.83 54.07 1.62 32.09 82.87
L8 × T1 52.65 0.81 0.70 21.86 25.40 59.15 92.76 30.63 33.04 10.35 12.00 92.33 106.67 17.00 51.33 47.95 11.83 12.06 7.46 54.57 1.68 35.09 80.39
L8 × T2 50.00 0.76 0.69 18.46 22.53 62.21 95.63 31.06 28.02 10.65 11.00 83.67 112.33 13.00 52.33 42.72 11.51 12.56 8.19 54.07 1.68 37.09 78.42
L8 × T3 50.50 0.79 0.69 20.36 22.69 60.23 97.63 32.69 33.25 13.45 12.00 86.67 108.67 15.00 46.67 41.60 12.83 13.16 7.45 53.87 1.44 33.09 83.15
L8 × T4 52.84 0.74 0.63 21.46 25.64 63.16 102.63 32.28 33.17 11.65 14.00 88.00 114.67 17.67 49.33 46.60 12.83 12.46 8.15 51.27 2.00 32.57 82.55
L8 × T5 53.55 0.80 0.68 22.76 24.93 61.59 110.68 26.55 32.45 13.45 9.00 84.67 121.00 15.00 46.00 38.60 14.83 11.56 7.06 54.87 1.69 39.09 80.10
L9 × T1 63.11 0.81 0.72 22.97 25.59 62.20 103.00 28.45 29.22 10.35 10.00 85.00 109.67 22.33 43.00 34.60 14.50 14.76 7.30 53.87 1.68 36.09 80.42
L9 × T2 49.24 0.74 0.64 20.76 23.22 65.63 82.09 25.74 28.83 9.45 8.00 86.67 115.00 15.00 42.67 38.60 9.77 14.16 7.13 54.77 2.03 34.09 83.30
L9 × T3 59.21 0.75 0.68 20.67 22.52 65.03 92.80 28.45 32.71 11.45 10.33 81.33 107.67 21.00 49.67 43.60 11.83 14.26 7.23 52.58 1.95 31.42 78.52
L9 × T4 51.76 0.80 0.70 23.39 26.93 61.49 105.70 28.75 34.44 13.07 8.00 91.33 102.67 15.00 47.00 46.60 7.83 11.16 7.22 52.77 1.87 30.42 81.92
L9 × T5 54.39 0.78 0.68 21.46 25.53 57.81 101.06 31.69 32.37 9.75 12.67 89.67 112.67 23.00 48.67 37.60 12.83 11.66 7.31 53.37 1.68 36.09 81.80
L10 × TI 50.37 0.85 0.70 19.76 22.50 65.83 98.68 27.18 27.51 13.35 11.33 90.67 114.67 14.33 53.67 48.60 9.83 11.66 7.35 54.07 1.87 37.94 78.43
L10 × T2 52.09 0.75 0.63 23.43 25.41 59.06 103.60 29.47 33.14 14.45 9.00 90.00 108.67 19.00 49.00 43.60 7.83 13.16 7.38 53.30 1.87 34.09 81.45
L10 × T3 56.34 0.78 0.69 22.36 25.00 62.74 89.53 30.28 28.55 10.45 8.00 91.67 109.67 17.67 51.00 46.60 12.83 12.66 8.03 53.07 1.78 32.09 82.92
L10 × T4 59.13 0.71 0.62 20.36 23.90 61.55 104.27 29.28 28.38 12.38 10.00 89.67 117.33 20.33 50.67 44.60 11.83 13.06 7.47 54.07 1.68 34.09 84.83
L10 × T5 51.69 0.83 0.68 22.76 23.39 63.12 109.70 30.36 29.14 9.83 12.00 84.67 111.00 21.00 51.67 52.60 12.27 13.66 8.01 53.67 1.94 39.57 82.27