Embed Size (px)
Citation preview

S-‐1
Supporting Information
Genetically expanded cell free protein
synthesis using endogenous pyrrolysyl
orthogonal translation system.
Yonatan Chemla1, Eden Ozer1, Orr Schlesinger1, Vincent Noireaux2, Lital
Alfonta1*
1Department of Life Sciences and Ilse Katz Institute for Nanoscale Science and
Technology, Ben-Gurion University of the Negev, P.O. Box 653, Beer-Sheva,
8410500,Israel.
2School of Physics and Astronomy, University of Minnesota, Minneapolis, Minnesota
55401, USA
*Corresponding Author: Lital Alfonta: [email protected]; Table of Contents:
Cover page…………………………………………………………………..............S-1
Table S1 Transformation and strain matrix................................................................S-2
Table S2 Strains and plasmids used in this research.......................................…S-3-S-4
Table S3 A comparison between genetic code system/methodologies...............S-5-S-6
Figure S1 Growth curves of the C321.ΔprfA strains................................................S-7
Figure S2 Nε-Boc-L-lysine Incorporation into deGFP (Various concentrations)......S-8
Figure S3 Nε-Propargyl-L-lysine incorporation into deGFP (Various sites).............S-9
Figure S4 Nε-Propargyl-L-lysine multiple site incorporation kinetics (deGFP)......S-10
Figure S5 Detailed LC-MS results..................................................................S-11-S-12
Figure S6 EGFP Calibration curves.........................................................................S-13
Figure S7 Bradford calibration curve.......................................................................S-14
Gene sequences.........................................................................................................S-15
References.................................................................................................................S-16

S-‐2
a Pyl-OTS: Mm-pyrrolysil synthetase/Mm-tRNACUA
Pyl (Blight et al., 2004; Srinivasan
et al., 2002) b PylAF-OTS: Mm-pyrrolysil synthetase/Mm-tRNACUAPyl (Herner et al.,
2013). c pAcF-OTS: Mj-para-aceto-phenylalanyl synthetase/Mj-tRNACUAOpt (Wang et
al., 2003). dSep-OTS: Mm-phospho-seryl synthetase/Mm-tRNACUASep and Ef-sep (an
orthogonal elongation factor) (Park et al., 2011).
Table S1. Different transformations performed in each experiment conducted in this study
No OTS
pKD SepRS (Sep-OTS)d
pSUP pACF (pAcF-OTS)c
pEVOL PylRS-AF (PylAF-OTS)b
pEVOL PylRS (Pyl-OTS)a
Plasmid / Strain
+ + + + + C321.ΔprfA + C321.ΔprfA
EXP + C321 (i.e.
prfA+)
+ BL21(DE3) + DH5α
S-‐3
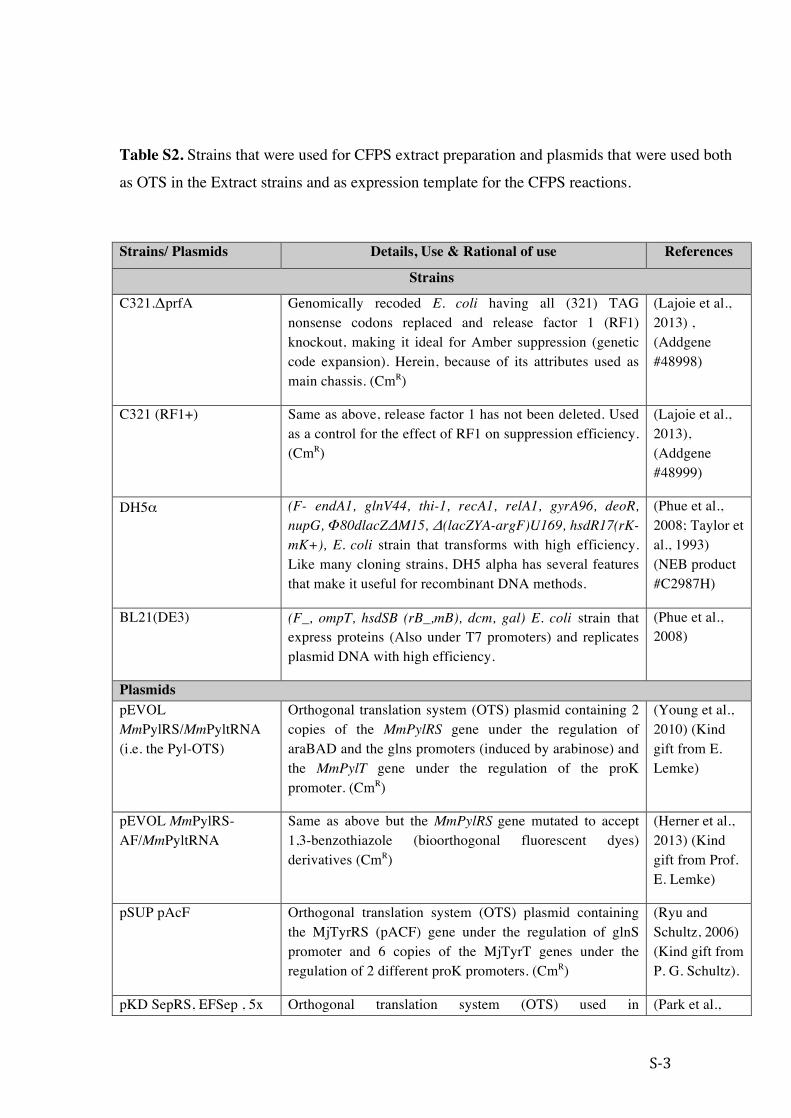
Table S2. Strains that were used for CFPS extract preparation and plasmids that were used both
as OTS in the Extract strains and as expression template for the CFPS reactions.
Strains/ Plasmids Details, Use & Rational of use References
Strains
C321.ΔprfA Genomically recoded E. coli having all (321) TAG nonsense codons replaced and release factor 1 (RF1) knockout, making it ideal for Amber suppression (genetic code expansion). Herein, because of its attributes used as main chassis. (CmR)
(Lajoie et al., 2013) , (Addgene #48998)
C321 (RF1+) Same as above, release factor 1 has not been deleted. Used as a control for the effect of RF1 on suppression efficiency. (CmR)
(Lajoie et al., 2013), (Addgene #48999)
DH5α (F- endA1, glnV44, thi-1, recA1, relA1, gyrA96, deoR, nupG, Φ80dlacZΔM15, Δ(lacZYA-argF)U169, hsdR17(rK- mK+), E. coli strain that transforms with high efficiency. Like many cloning strains, DH5 alpha has several features that make it useful for recombinant DNA methods.
(Phue et al., 2008; Taylor et al., 1993) (NEB product #C2987H)
BL21(DE3) (F_, ompT, hsdSB (rB_,mB ), dcm, gal) E. coli strain that express proteins (Also under T7 promoters) and replicates plasmid DNA with high efficiency.
(Phue et al., 2008)
Plasmids pEVOL MmPylRS/MmPyltRNA (i.e. the Pyl-OTS)
Orthogonal translation system (OTS) plasmid containing 2 copies of the MmPylRS gene under the regulation of araBAD and the glns promoters (induced by arabinose) and the MmPylT gene under the regulation of the proK promoter. (CmR)
(Young et al., 2010) (Kind gift from E. Lemke)
pEVOL MmPylRS-AF/MmPyltRNA
Same as above but the MmPylRS gene mutated to accept 1,3-benzothiazole (bioorthogonal fluorescent dyes) derivatives (CmR)
(Herner et al., 2013) (Kind gift from Prof. E. Lemke)
pSUP pAcF Orthogonal translation system (OTS) plasmid containing the MjTyrRS (pACF) gene under the regulation of glnS promoter and 6 copies of the MjTyrT genes under the regulation of 2 different proK promoters. (CmR)
(Ryu and Schultz, 2006) (Kind gift from P. G. Schultz).
pKD SepRS, EFSep , 5x Orthogonal translation system (OTS) used in (Park et al.,

S-‐4
tRNASep (B40 OTS) phosphoprotein synthesis. Expresses the MjSep-accepting tRNA (tRNASep), the M. Maripaludis Sep-tRNA synthetase (SepRS) and an engineered EF-Tu (EFSep) (KanR)
2011) (Addgene #52054)
pBEST-OR2-OR1-Pr-UTR1-deGFP-T500
Expression plasmid, deGFP expression is regulated by the OR2-OR1 promoter (bacteriophage Lambda promoter with one mutation). The deGFP gene was mutated to create the following variants: Y35X (i.e. Y35TAG mutation) (AmpR)
(Sun et al., 2013) (Addgene #40019)
S-‐5
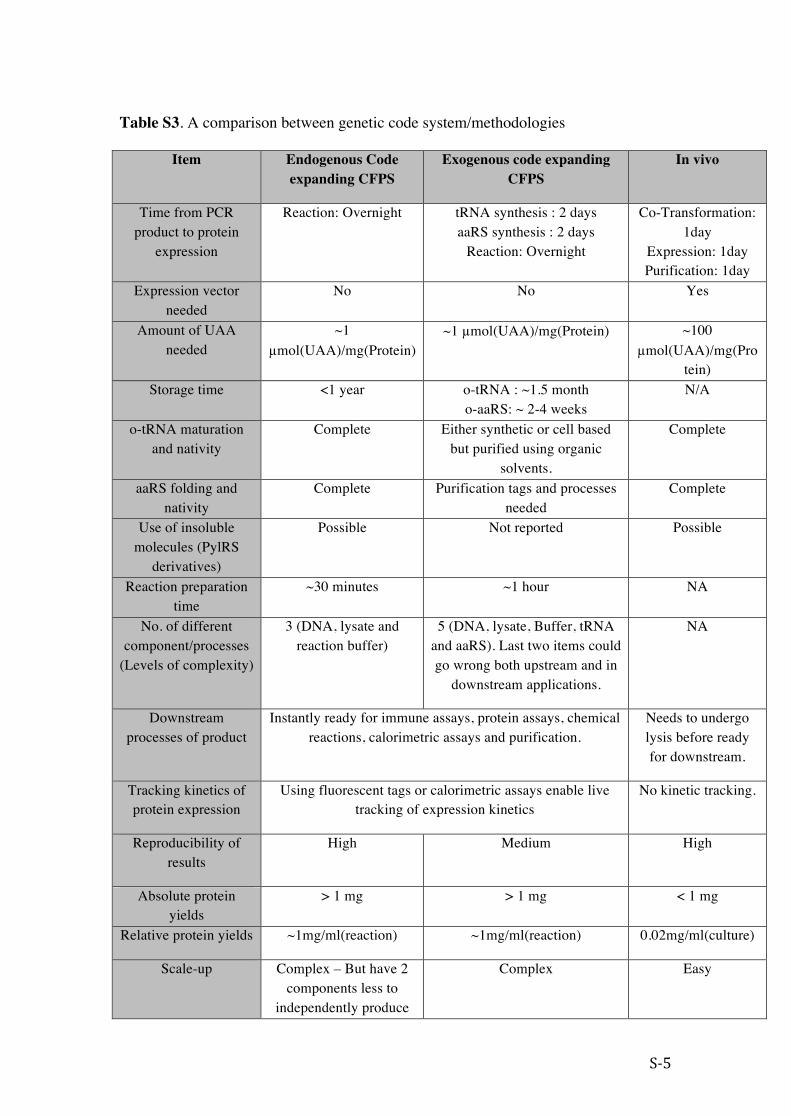
Table S3. A comparison between genetic code system/methodologies
Item Endogenous Code expanding CFPS
Exogenous code expanding CFPS
In vivo
Time from PCR product to protein
expression
Reaction: Overnight tRNA synthesis : 2 days aaRS synthesis : 2 days
Reaction: Overnight
Co-Transformation: 1day
Expression: 1day Purification: 1day
Expression vector needed
No No Yes
Amount of UAA needed
~1 µmol(UAA)/mg(Protein)
~1 µmol(UAA)/mg(Protein) ~100 µmol(UAA)/mg(Pro
tein) Storage time <1 year o-tRNA : ~1.5 month
o-aaRS: ~ 2-4 weeks N/A
o-tRNA maturation and nativity
Complete Either synthetic or cell based but purified using organic
solvents.
Complete
aaRS folding and nativity
Complete Purification tags and processes needed
Complete
Use of insoluble molecules (PylRS
derivatives)
Possible Not reported Possible
Reaction preparation time
~30 minutes ~1 hour NA
No. of different component/processes
(Levels of complexity)
3 (DNA, lysate and reaction buffer)
5 (DNA, lysate, Buffer, tRNA and aaRS). Last two items could go wrong both upstream and in
downstream applications.
NA
Downstream processes of product
Instantly ready for immune assays, protein assays, chemical reactions, calorimetric assays and purification.
Needs to undergo lysis before ready for downstream.
Tracking kinetics of protein expression
Using fluorescent tags or calorimetric assays enable live tracking of expression kinetics
No kinetic tracking.
Reproducibility of results
High Medium High
Absolute protein yields
> 1 mg > 1 mg < 1 mg
Relative protein yields ~1mg/ml(reaction) ~1mg/ml(reaction) 0.02mg/ml(culture)
Scale-up Complex – But have 2 components less to
independently produce
Complex Easy
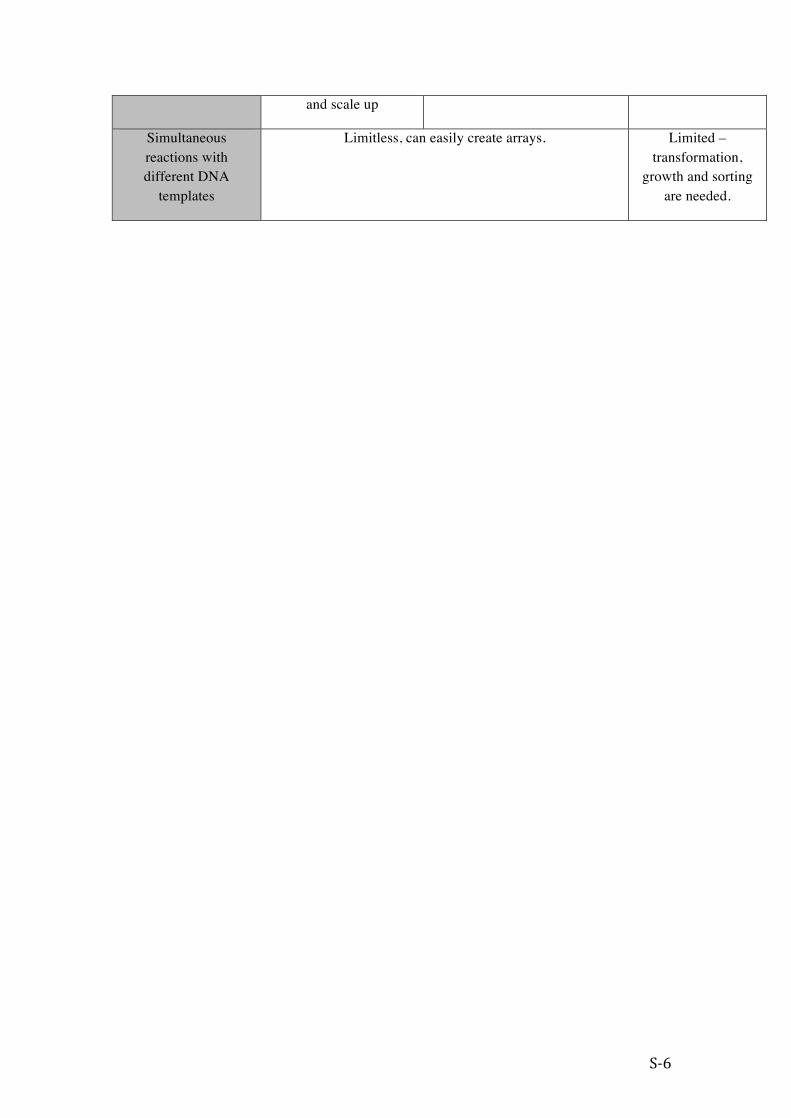
S-‐6
and scale up
Simultaneous reactions with different DNA
templates
Limitless, can easily create arrays. Limited – transformation,
growth and sorting are needed.
S-‐7
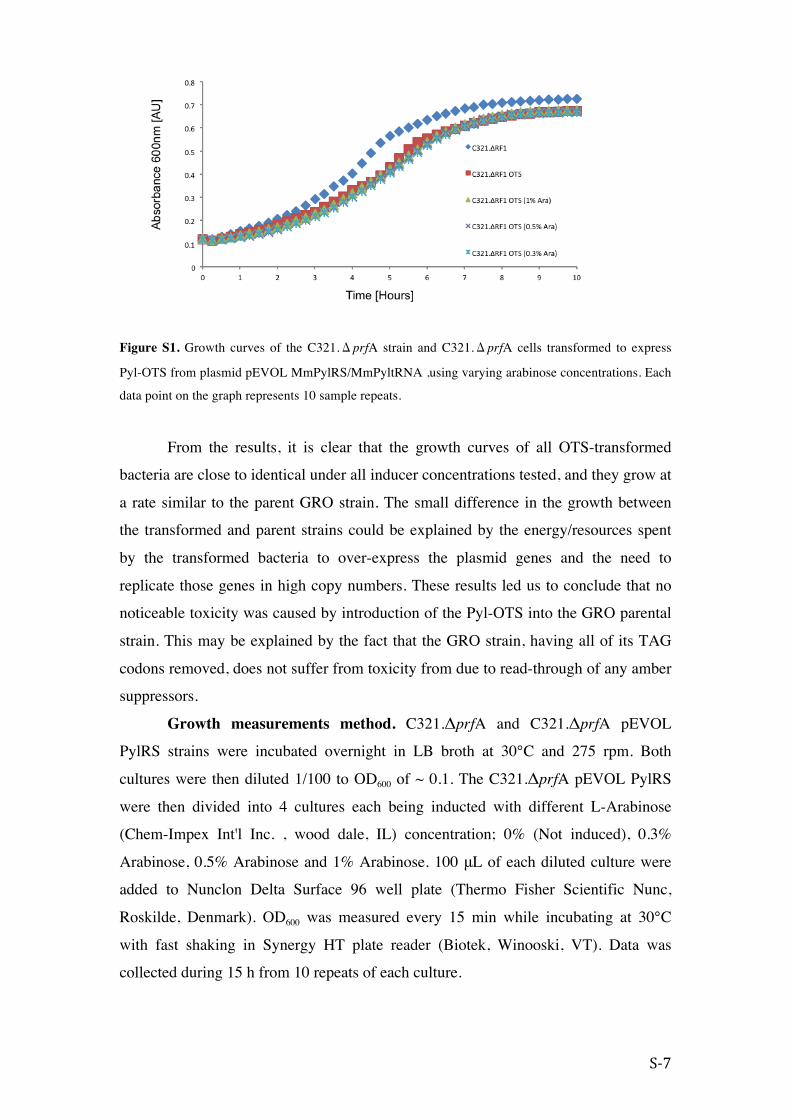
Figure S1. Growth curves of the C321.ΔprfA strain and C321.ΔprfA cells transformed to express
Pyl-OTS from plasmid pEVOL MmPylRS/MmPyltRNA ,using varying arabinose concentrations. Each
data point on the graph represents 10 sample repeats.
From the results, it is clear that the growth curves of all OTS-transformed
bacteria are close to identical under all inducer concentrations tested, and they grow at
a rate similar to the parent GRO strain. The small difference in the growth between
the transformed and parent strains could be explained by the energy/resources spent
by the transformed bacteria to over-express the plasmid genes and the need to
replicate those genes in high copy numbers. These results led us to conclude that no
noticeable toxicity was caused by introduction of the Pyl-OTS into the GRO parental
strain. This may be explained by the fact that the GRO strain, having all of its TAG
codons removed, does not suffer from toxicity from due to read-through of any amber
suppressors.
Growth measurements method. C321.ΔprfA and C321.ΔprfA pEVOL
PylRS strains were incubated overnight in LB broth at 30°C and 275 rpm. Both
cultures were then diluted 1/100 to OD600 of ~ 0.1. The C321.ΔprfA pEVOL PylRS
were then divided into 4 cultures each being inducted with different L-Arabinose
(Chem-Impex Int'l Inc. , wood dale, IL) concentration; 0% (Not induced), 0.3%
Arabinose, 0.5% Arabinose and 1% Arabinose. 100 μL of each diluted culture were
added to Nunclon Delta Surface 96 well plate (Thermo Fisher Scientific Nunc,
Roskilde, Denmark). OD600 was measured every 15 min while incubating at 30°C
with fast shaking in Synergy HT plate reader (Biotek, Winooski, VT). Data was
collected during 15 h from 10 repeats of each culture.
S-‐8
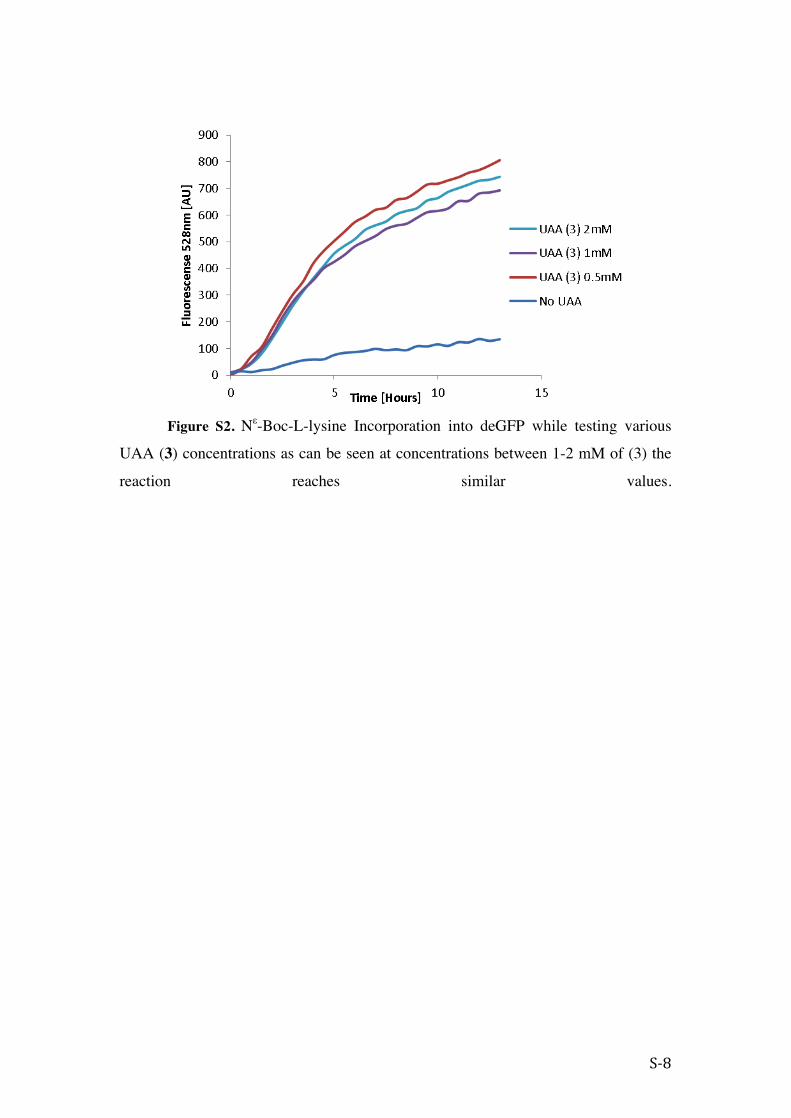
Figure S2. Nε-Boc-L-lysine Incorporation into deGFP while testing various
UAA (3) concentrations as can be seen at concentrations between 1-2 mM of (3) the
reaction reaches similar values.

S-‐9
A) B)
Figure S3. Successful incorporation Nε-Propargyl-L-lysine in K136X (Panel A) and D193X (Panel B)
using the endogenous and genetically expanded CFPS system, with the Pyl-OTS.
S-‐10
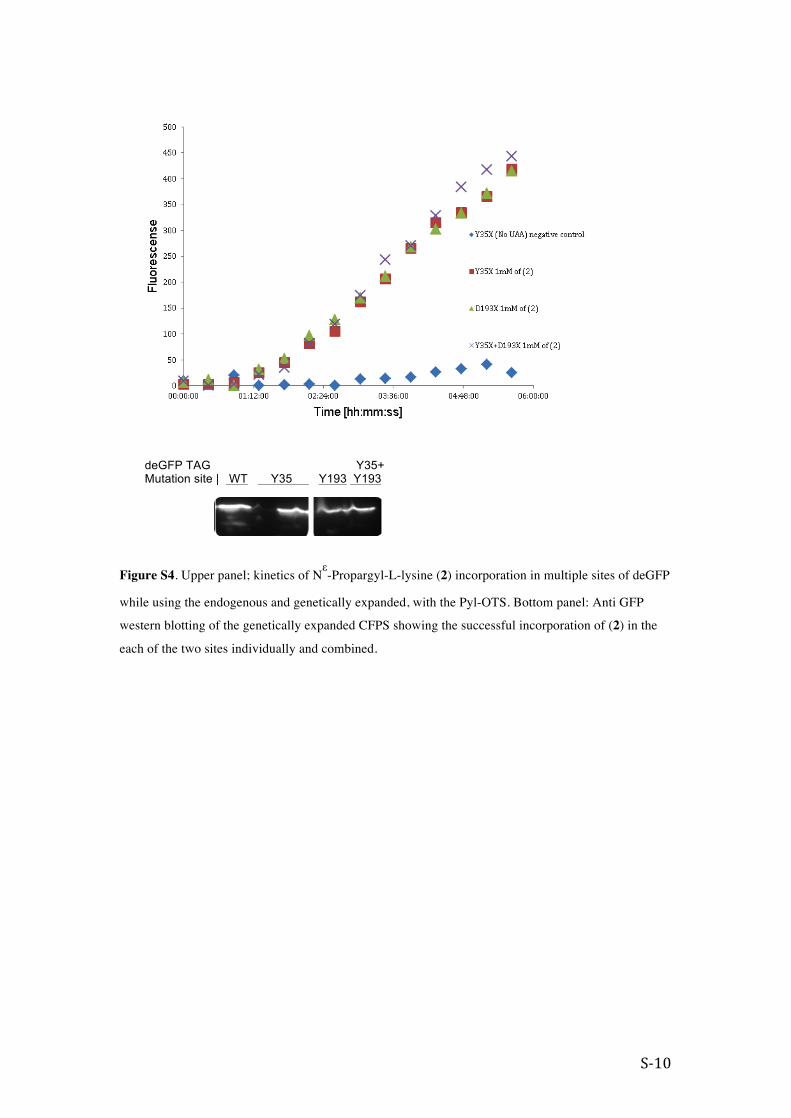
Figure S4. Upper panel; kinetics of Nε-Propargyl-L-lysine (2) incorporation in multiple sites of deGFP
while using the endogenous and genetically expanded, with the Pyl-OTS. Bottom panel: Anti GFP
western blotting of the genetically expanded CFPS showing the successful incorporation of (2) in the
each of the two sites individually and combined.
deGFP TAG Y35+ Mutation site | WT Y35 Y193 Y193
S-‐11
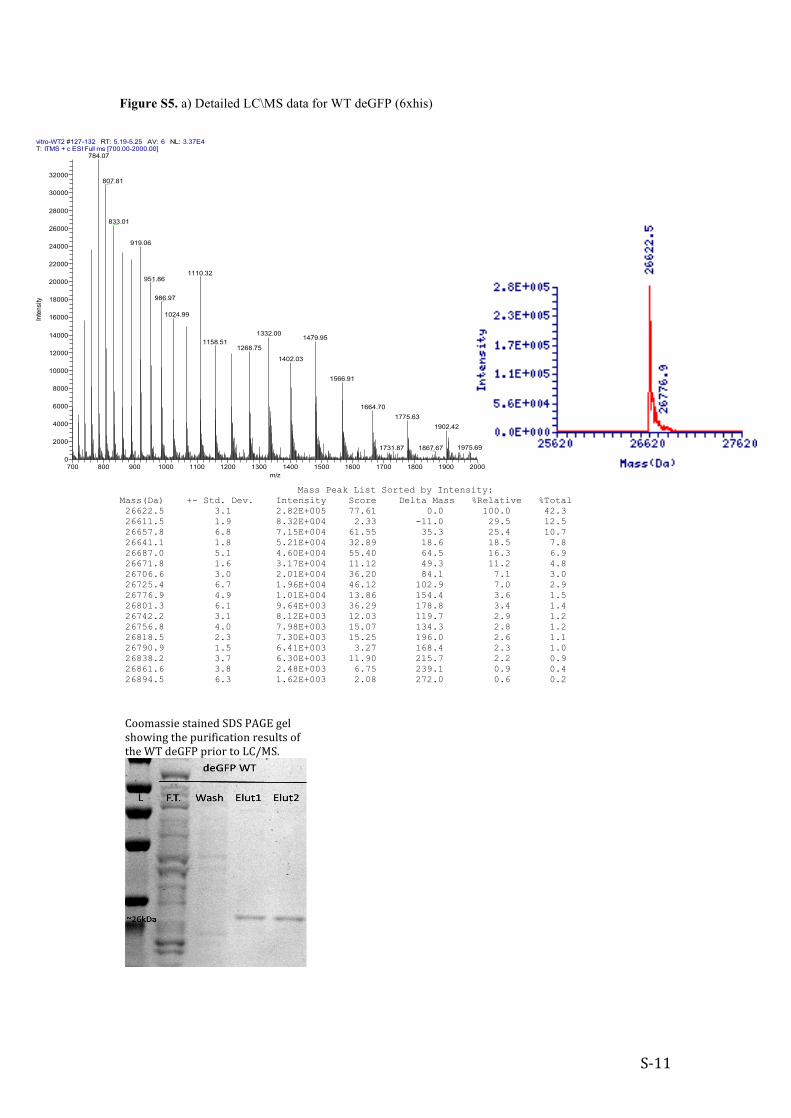
Figure S5. a) Detailed LC\MS data for WT deGFP (6xhis)
Mass Peak List Sorted by Intensity:
Mass(Da) +- Std. Dev. Intensity Score Delta Mass %Relative %Total 26622.5 3.1 2.82E+005 77.61 0.0 100.0 42.3 26611.5 1.9 8.32E+004 2.33 -11.0 29.5 12.5 26657.8 6.8 7.15E+004 61.55 35.3 25.4 10.7 26641.1 1.8 5.21E+004 32.89 18.6 18.5 7.8 26687.0 5.1 4.60E+004 55.40 64.5 16.3 6.9 26671.8 1.6 3.17E+004 11.12 49.3 11.2 4.8 26706.6 3.0 2.01E+004 36.20 84.1 7.1 3.0 26725.4 6.7 1.96E+004 46.12 102.9 7.0 2.9 26776.9 4.9 1.01E+004 13.86 154.4 3.6 1.5 26801.3 6.1 9.64E+003 36.29 178.8 3.4 1.4 26742.2 3.1 8.12E+003 12.03 119.7 2.9 1.2 26756.8 4.0 7.98E+003 15.07 134.3 2.8 1.2 26818.5 2.3 7.30E+003 15.25 196.0 2.6 1.1 26790.9 1.5 6.41E+003 3.27 168.4 2.3 1.0 26838.2 3.7 6.30E+003 11.90 215.7 2.2 0.9 26861.6 3.8 2.48E+003 6.75 239.1 0.9 0.4 26894.5 6.3 1.62E+003 2.08 272.0 0.6 0.2
vitro-WT2 #127-132 RT: 5.19-5.25 AV: 6 NL: 3.37E4T: ITMS + c ESI Full ms [700.00-2000.00]
700 800 900 1000 1100 1200 1300 1400 1500 1600 1700 1800 1900 2000m/z
0
2000
4000
6000
8000
10000
12000
14000
16000
18000
20000
22000
24000
26000
28000
30000
32000
Inte
nsity
784.07
807.81
833.01
919.06
1110.32951.86
986.97
1024.99
1332.001479.95
1158.511268.75
1402.03
1566.91
1664.701775.63
1902.42
1975.691867.671731.87
Coomassie stained SDS PAGE gel showing the purification results of the WT deGFP prior to LC/MS.
S-‐12
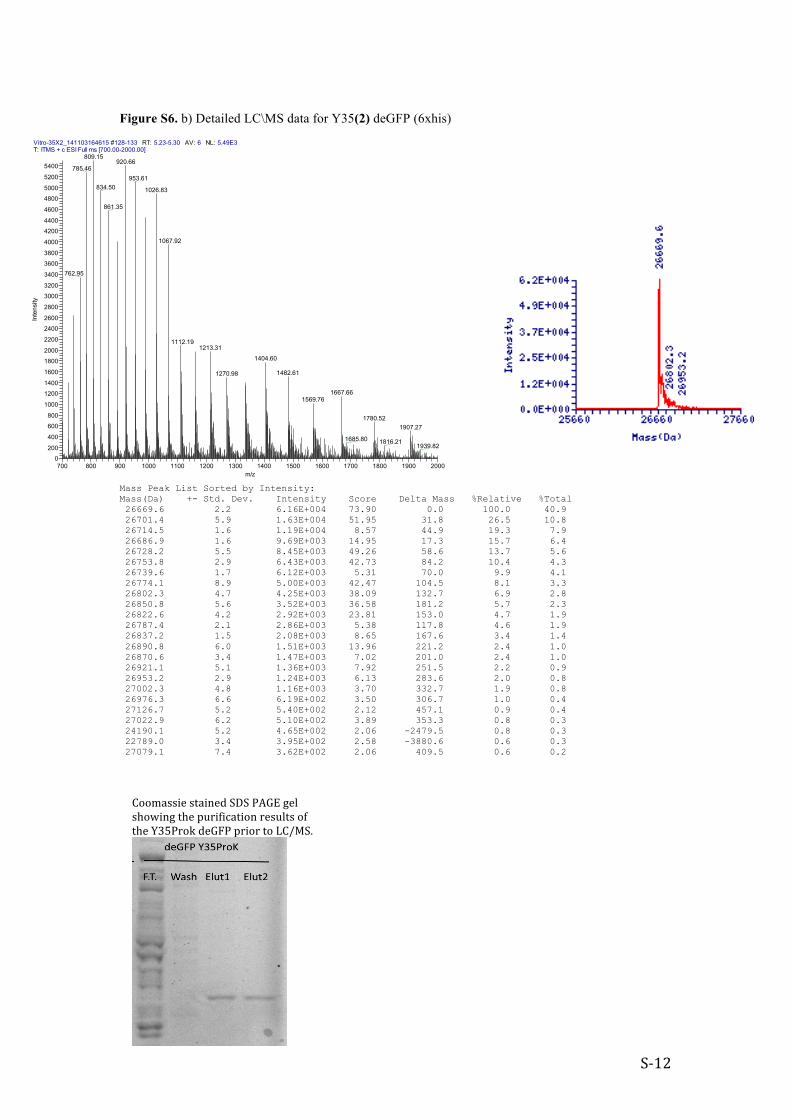
Figure S6. b) Detailed LC\MS data for Y35(2) deGFP (6xhis)
Mass Peak List Sorted by Intensity: Mass(Da) +- Std. Dev. Intensity Score Delta Mass %Relative %Total 26669.6 2.2 6.16E+004 73.90 0.0 100.0 40.9 26701.4 5.9 1.63E+004 51.95 31.8 26.5 10.8 26714.5 1.6 1.19E+004 8.57 44.9 19.3 7.9 26686.9 1.6 9.69E+003 14.95 17.3 15.7 6.4 26728.2 5.5 8.45E+003 49.26 58.6 13.7 5.6 26753.8 2.9 6.43E+003 42.73 84.2 10.4 4.3 26739.6 1.7 6.12E+003 5.31 70.0 9.9 4.1 26774.1 8.9 5.00E+003 42.47 104.5 8.1 3.3 26802.3 4.7 4.25E+003 38.09 132.7 6.9 2.8 26850.8 5.6 3.52E+003 36.58 181.2 5.7 2.3 26822.6 4.2 2.92E+003 23.81 153.0 4.7 1.9 26787.4 2.1 2.86E+003 5.38 117.8 4.6 1.9 26837.2 1.5 2.08E+003 8.65 167.6 3.4 1.4 26890.8 6.0 1.51E+003 13.96 221.2 2.4 1.0 26870.6 3.4 1.47E+003 7.02 201.0 2.4 1.0 26921.1 5.1 1.36E+003 7.92 251.5 2.2 0.9 26953.2 2.9 1.24E+003 6.13 283.6 2.0 0.8 27002.3 4.8 1.16E+003 3.70 332.7 1.9 0.8 26976.3 6.6 6.19E+002 3.50 306.7 1.0 0.4 27126.7 5.2 5.40E+002 2.12 457.1 0.9 0.4 27022.9 6.2 5.10E+002 3.89 353.3 0.8 0.3 24190.1 5.2 4.65E+002 2.06 -2479.5 0.8 0.3 22789.0 3.4 3.95E+002 2.58 -3880.6 0.6 0.3 27079.1 7.4 3.62E+002 2.06 409.5 0.6 0.2
Vitro-35X2_141103164615 #128-133 RT: 5.23-5.30 AV: 6 NL: 5.49E3T: ITMS + c ESI Full ms [700.00-2000.00]
700 800 900 1000 1100 1200 1300 1400 1500 1600 1700 1800 1900 2000m/z
0
200
400
600
800
1000
1200
1400
1600
1800
2000
2200
2400
2600
2800
3000
3200
3400
3600
3800
4000
4200
4400
4600
4800
5000
5200
5400
Inte
nsity
809.15920.66
785.46953.61
834.50 1026.83
861.35
1067.92
762.95
1112.191213.31
1404.60
1482.611270.98
1667.661569.76
1780.521907.27
1685.80 1816.211939.82
Coomassie stained SDS PAGE gel showing the purification results of the Y35Prok deGFP prior to LC/MS.

S-‐13
Figure S7. Calibration curve for correlating between EGFP florescence and protein concentration.

S-‐14
Figure S8 - Bradford Calibration Curve. The Bradford assay results:
Bradford Assay Data WT deGFP 1 WT deGFP 2 Y35(2) deGFP 1 Y35(2) deGFP 2 590nm/450nm 0.89 0.88 0.99 1.01 Protein concentration [ug/ml] 152.12 145.75 204.88 215.08 Averaged Concentration [ug/ml] 148.93 209.98 Total protein in concentrated fraction 77.45 121.79 total volume of CFPS reaction [uL] 456.00 456.00 Original concentration [ug/uL] 0.17 0.27
Averaged concentration [mg/mL]
0.22

S-‐15
Genes and plasmid sequences used in this study: deGFP: ATGGAGCTTTTCACTGGCGTTGTTCCCATCCTGGTCGAGCTGGACGGCGACGTAAACGGCCACAAGTTCAGCGTGTCCGGCGAGGGCGAGGGCGATGCCACCTACGGCAAGCTGACCCTGAAGTTCATCTGCACCACCGGCAAGCTGCCCGTGCCCTGGCCCACCCTCGTGACCACCCTGACCTACGGCGTGCAGTGCTTCAGCCGCTACCCCGACCACATGAAGCAGCACGACTTCTTCAAGTCCGCCATGCCCGAAGGCTACGTCCAGGAGCGCACCATCTTCTTCAAGGACGACGGCAACTACAAGACCCGCGCCGAGGTGAAGTTCGAGGGCGACACCCTGGTGAACCGCATCGAGCTGAAGGGCATCGACTTCAAGGAGGACGGCAACATCCTGGGGCACAAGCTGGAGTACAACTACAACAGCCACAACGTCTATATCATGGCCGACAAGCAGAAGAACGGCATCAAGGTGAACTTCAAGATCCGCCACAACATCGAGGACGGCAGCGTGCAGCTCGCCGACCACTACCAGCAGAACACCCCCATCGGCGACGGCCCCGTGCTGCTGCCCGACAACCACTACCTGAGCACCCAGTCCGCCCTGAGCAAAGACCCCAACGAGAAGCGCGATCACATGGTCCTGCTGGAGTTCGTGACCGCCGCCGGGATCTAA deGFP (N terminus 6xhis) ATGGGCAGCAGCCATCATCATCATCATCACAGCTCTAGAGAGCTTTTCACTGGCGTTGTTCCCATCCTGGTCGAGCTGGACGGCGACGTAAACGGCCACAAGTTCAGCGTGTCCGGCGAGGGCGAGGGCGATGCCACCTACGGCAAGCTGACCCTGAAGTTCATCTGCACCACCGGCAAGCTGCCCGTGCCCTGGCCCACCCTCGTGACCACCCTGACCTACGGCGTGCAGTGCTTCAGCCGCTACCCCGACCACATGAAGCAGCACGACTTCTTCAAGTCCGCCATGCCCGAAGGCTACGTCCAGGAGCGCACCATCTTCTTCAAGGACGACGGCAACTACAAGACCCGCGCCGAGGTGAAGTTCGAGGGCGACACCCTGGTGAACCGCATCGAGCTGAAGGGCATCGACTTCAAGGAGGACGGCAACATCCTGGGGCACAAGCTGGAGTACAACTACAACAGCCACAACGTCTATATCATGGCCGACAAGCAGAAGAACGGCATCAAGGTGAACTTCAAGATCCGCCACAACATCGAGGACGGCAGCGTGCAGCTCGCCGACCACTACCAGCAGAACACCCCCATCGGCGACGGCCCCGTGCTGCTGCCCGACAACCACTACCTGAGCACCCAGTCCGCCCTGAGCAAAGACCCCAACGAGAAGCGCGATCACATGGTCCTGCTGGAGTTCGTGACCGCCGCCGGGATCTAA Methanosarcina mazei PylRS: ATGGATAAAAAACCACTAAACACTCTGATCTCTGCTACTGGTCTGTGGATGAGTCGTACCGGAACCATTCATAAAATCAAACACCACGAGGTTAGCCGTTCGAAAATCTATATTGAGATGGCGTGTGGCGATCATCTGGTTGTGAACAATAGCCGCTCTTCTCGTACAGCACGTGCACTGCGTCACCACAAATATCGTAAAACCTGTAAACGTTGCCGTGTGTCCGATGAGGATCTGAACAAATTCCTGACAAAAGCCAATGAGGACCAAACAAGCGTGAAAGTGAAAGTCGTTAGCGCTCCTACCCGTACTAAAAAAGCAATGCCGAAATCCGTTGCTCGTGCCCCTAAACCACTGGAAAACACTGAAGCAGCACAGGCACAGCCGTCTGGAAGCAAATTCTCTCCGGCCATTCCTGTTTCTACCCAGGAGTCCGTTTCTGTTCCAGCAAGTGTGAGCACCAGCATTAGCAGTATTAGCACCGGTGCCACCGCTAGCGCCCTGGTTAAAGGCAATACCAATCCGATTACAAGCATGTCTGCCCCGGTTCAAGCATCAGCTCCAGCACTGACAAAATCCCAAACCGATCGTCTGGAGGTTCTGCTGAATCCGAAAGACGAAATCAGCCTGAATTCCGGCAAACCGTTTCGTGAACTGGAGAGCGAACTGCTGTCACGTCGTAAAAAAGACCTGCAACAAATCTATGCCGAAGAACGTGAGAACTATCTGGGGAAACTGGAACGTGAAATCACCCGCTTTTTCGTGGATCGTGGCTTTCTGGAGATCAAATCCCCGATTCTGATTCCTCTGGAGTATATCGAGCGTATGGGCATCGACAATGATACCGAACTGAGCAAACAAATTTTCCGTGTGGATAAAAACTTCTGTCTGCGCCCTATGCTGGCACCAAATCTGTATAACTATCTGCGCAAACTGGACCGTGCCCTGCCTGATCCTATCAAAATCTTCGAGATCGGCCCGTGTTATCGTAAAGAGTCCGACGGTAAAGAACATCTGGAGGAGTTTACCATGCTGAACTTTTGCCAAATGGGTTCAGGTTGTACTCGTGAGAACCTGGAAAGCATCATCACCGATTTTCTGAACCACCTGGGCATTGACTTCAAAATTGTGGGCGACAGCTGTATGGTGTATGGCGACACCCTGGATGTCATGCACGGCGACCTGGAACTGTCTAGTGCCGTTGTTGGACCAATTCCGCTGGACCGTGAGTGGGGTATCGACAAACCGTGGATCGGAGCAGGATTCGGTCTGGAACGCCTGCTGAAAGTGAAACACGACTTCAAAAACATCAAACGTGCCGCCCGTTCTGAATCGTATTATAACGGGATTTCTACCAACCTGTAA Methanosarcina mazei Pyl-tRNAcua
pyl: TATGCATGGCGATATCTAATACGACTCACTATAGGAAACCTGATCATGTAGATCGAATGGACTCTAAATCCGTTCAGCCGGGTTAGATTCCCGGGGTTTCCGCCA

S-‐16
REFRENCES:
Blight SK, Larue RC, Mahapatra A, Longstaff DG, Chang E, Zhao G, Kang PT, Green-Church KB, Chan MK, Krzycki J a. 2004. Direct charging of tRNA(CUA) with pyrrolysine in vitro and in vivo. Nature 431:333–335.
Herner A, Nikić I, Kállay M, Lemke E a, Kele P. 2013. A new family of bioorthogonally applicable fluorogenic labels. Org. Biomol. Chem. 11:3297–3306.
Lajoie M, Rovner A, Goodman D, Aerni H., Haimovich AD, Kuznetsov G, Mercer JA, Wang HH, Carr PA, Mosberg JA, Rohland N, Schultz PG, Jacobson JM, Rinehart J, Church GM, Isaacs FJ. 2013. Genomically recoded organisms expand biological functions. Science 342:357–360.
Park H-S, Hohn MJ, Umehara T, Guo L-T, Osborne EM, Benner J, Noren CJ, Rinehart J, Söll D. 2011. Expanding the genetic code of Escherichia coli with phosphoserine. Science 333:1151–1154.
Phue J-N, Lee SJ, Trinh L, Shiloach J. 2008. Modified Escherichia coli B (BL21), a superior producer of plasmid DNA compared with Escherichia coli K (DH5alpha). Biotechnol. Bioeng. 101:831–836.
Ryu Y, Schultz PG. 2006. Efficient incorporation of unnatural amino acids into proteins in Escherichia coli. Nat. Methods 3:263–266.
Srinivasan G, James CM, Krzycki J a. 2002. Pyrrolysine encoded by UAG in Archaea: charging of a UAG-decoding specialized tRNA. Science 296:1459–1462.
Sun ZZ, Hayes C a, Shin J, Caschera F, Murray RM, Noireaux V. 2013. Protocols for implementing an escherichia coli based TX-TL cell-free expression system for synthetic biology. J. Vis. Exp. 79:1–15.
Taylor RG, Walker DC, Mclnnes RR. 1993. E.coli host strains significantly affect the quality of small scale plasmid DNA preparations used for sequencing. Nucleic Acids Res. 21:1677–1678.
Wang L, Zhang Z, Brock A, Schultz PG. 2003. Addition of the keto functional group to the genetic code of Escherichia coli. Proc. Natl. Acad. Sci. U. S. A. 100:56–61.
Young TS, Ahmad I, Yin JA, Schultz PG. 2010. An enhanced system for unnatural amino acid mutagenesis in E. coli. J. Mol. Biol. 395:361–374.