Embed Size (px)
Citation preview
GeneticEpidemiologyRESEARCH ARTICLE
EINVis: A Visualization Tool for Analyzing andExploring Genetic Interactions in Large-ScaleAssociation Studies
Yubao Wu,1 Xiaofeng Zhu,2 Jian Chen,3 and Xiang Zhang1∗
1Department of Electrical Engineering and Computer Science, Case Western Reserve University, Cleveland, Ohio; 2Department of Epidemiologyand Biostatistics, Case Western Reserve University, Cleveland, Ohio; 3Department of Computer Science and Electrical Engineering, University ofMaryland, Baltimore County, Baltimore, Maryland
Received 28 March 2013; Revised 24 June 2013; accepted revised manuscript 11 July 2013.Published online 11 August 2013 in Wiley Online Library (wileyonlinelibrary.com). DOI 10.1002/gepi.21754
ABSTRACT: Epistasis (gene-gene interaction) detection in large-scale genetic association studies has recently drawn extensiveresearch interests as many complex traits are likely caused by the joint effect of multiple genetic factors. The large numberof possible interactions poses both statistical and computational challenges. A variety of approaches have been developedto address the analytical challenges in epistatic interaction detection. These methods usually output the identified geneticinteractions and store them in flat file formats. It is highly desirable to develop an effective visualization tool to furtherinvestigate the detected interactions and unravel hidden interaction patterns. We have developed EINVis, a novel visualizationtool that is specifically designed to analyze and explore genetic interactions. EINVis displays interactions among geneticmarkers as a network. It utilizes a circular layout (specially, a tree ring view) to simultaneously visualize the hierarchicalinteractions between single nucleotide polymorphisms (SNPs), genes, and chromosomes, and the network structure formedby these interactions. Using EINVis, the user can distinguish marginal effects from interactions, track interactions involvingmore than two markers, visualize interactions at different levels, and detect proxy SNPs based on linkage disequilibrium.EINVis is an effective and user-friendly free visualization tool for analyzing and exploring genetic interactions. It is publiclyavailable with detailed documentation and online tutorial on the web at http://filer.case.edu/yxw407/einvis/.Genet Epidemiol 37:675–685, 2013. C© 2013 Wiley Periodicals, Inc.
KEY WORDS: epistasis; networks; visualization; gene-gene interaction; software
Introduction
Epistasis (gene-gene interaction) detection is receiving anincreasing amount of research attention in large-scale ge-netic association studies [Cordell, 2009]. Interactions be-tween genes are fundamentally important to understand thestructure and function of genetic pathways of complex ge-netic systems [Moore and Williams, 2009; Phillips, 2008]and have been suggested potentially to uncover the “missingheritability” in genetic association studies [Manolio et al.,2009]. Detecting epistatic interactions in the genome-widescale is both statistically and computationally challenging.The large number of possible interactions between single nu-cleotide polymorphisms (SNPs) poses a serious multiple test-ing problem and demands intensive computational resources[Steen, 2012]. A variety of methods have been developed forepistasis detection. Please refer to Shang et al. [2011], Wanget al. [2011] for excellent review and performance study ofthe existing methods.
The outputs of an epistasis detection method usually in-clude a list of SNP pairs and their test statistics or significance
∗Correspondence to: Xiang Zhang, Department of Electrical Engineering and Com-
puter Science, Case Western Reserve University, 10900 Euclid Avenue, 321 Glennan
Building, Cleveland, OH 44106. E-mail: [email protected]
levels. There is a lack of effective visualization tool to furtheranalyze and explore the discovered interactions. Moreover,most of the current study designs for searching epistatic inter-actions at the genome-wide level have low power because ofthe large number of tests. Therefore, it is interesting to system-ically examine many interactions with relatively weak statisti-cal evidence. An intuitive approach to explore the discoveredgenetic interactions is to use network built by linking SNPswhose pairwise interactions are stronger than a threshold [Huet al., 2011; McKinney et al., 2009]. Representing epistatic in-teractions visually by networks is an effective way to demon-strate the interplay between different SNPs and genes.
Visualization tools, such as Cytoscape [Shannon et al.,2003] and VisANT 3.5 [Hu et al., 2009], are mainly designedfor biomolecular network visualization. MizBee [Meyer et al.,2009] exerts a separate circular layout and other linked viewsto visualize syntenic data. Circos [Krzywinski et al., 2009]focuses on circular layouts and is created for comparativegenomics. D3 [Bostock et al., 2011] is a general purposevisualization toolkit. Despite the success of these excellentvisualization tools, none of them can be directly used for ex-ploring the epistatic interaction network (EIN) [Donchevaet al., 2012; Pavlopoulos et al., 2008; Suderman and Hallett,2007].
C© 2013 WILEY PERIODICALS, INC.
Visualizing genetic interaction network has its unique re-quirements and properties that can be used to enhance thevisualization effectiveness. In a genetic interaction network,the relationship between SNPs, genes, and chromosomes canbe represented using a hierarchical tree structure. This hier-archical structure can be utilized to enhance the effective-ness of network visualization. Circular layout is a naturalchoice to visualize the hierarchical structure and networkstructure simultaneously [Holten, 2006]. Moreover, whenstudying gene-gene interactions, it is important to distin-guish marginal effects from interactions. For example, it isinteresting to identify SNPs that have weak marginal effectsbut interact with many other SNPs. Tracking interacting SNPsand visualizing interactions at different levels, e.g., SNP-SNP,SNP-gene, and gene-gene interactions, are also importantfunctions that can enhance the effectiveness of the visualiza-tion tools.
We have developed a visualization tool EINVis (EpistaticInteraction Network Visualization) for the exploration andanalysis of genetic interactions. Utilizing EINVis, the user candirectly see the connection pattern among SNPs, genes, andchromosomes. The interaction strength between two nodesis encoded by the edge color. The user can also provide single-locus test statistics (encoded by the node color), which helpto reveal the relationship between marginal and interactingeffects. EINVis allows users to observe how a set of selectednodes interact with other nodes by highlighting the con-nected nodes and induced edges. The user can also expandor collapse nodes, which not only help to focus on the set ofnodes of interest, but also enable to observe interactions atdifferent levels. EINVis also provides summary statistics ofthe visualized interaction network.
Material and Methods
EINVis Software
EINVis is created for visualization of small or moderate ge-netic interaction network with hundreds of edges or nodes.EINVis is open source and implemented in JavaScript lan-guage. Canvas 2D and control elements in HTML5 (the fifthrevision of the HTML standard) are exerted to draw graph-ics and provide user-friendly interfaces. EINVis runs on allmajor browsers as long as they provide support for HTML5.
EINVis provides three different views: an EIN tree ringview, an EIN matrix view, and a linkage disequilibrium (LD)tree ring view. The EIN tree ring view is the main view inEINVis. It adopts the circular layout and looks like a treering. A wide range of controls and mouse interactions areincluded to let user interact with the visualization results.The EIN matrix view is an auxiliary view. It can help the userobserve the adjacency matrix of the interaction network. TheLD tree ring view is another auxiliary view. It can help theuser observe the LD information among SNPs.
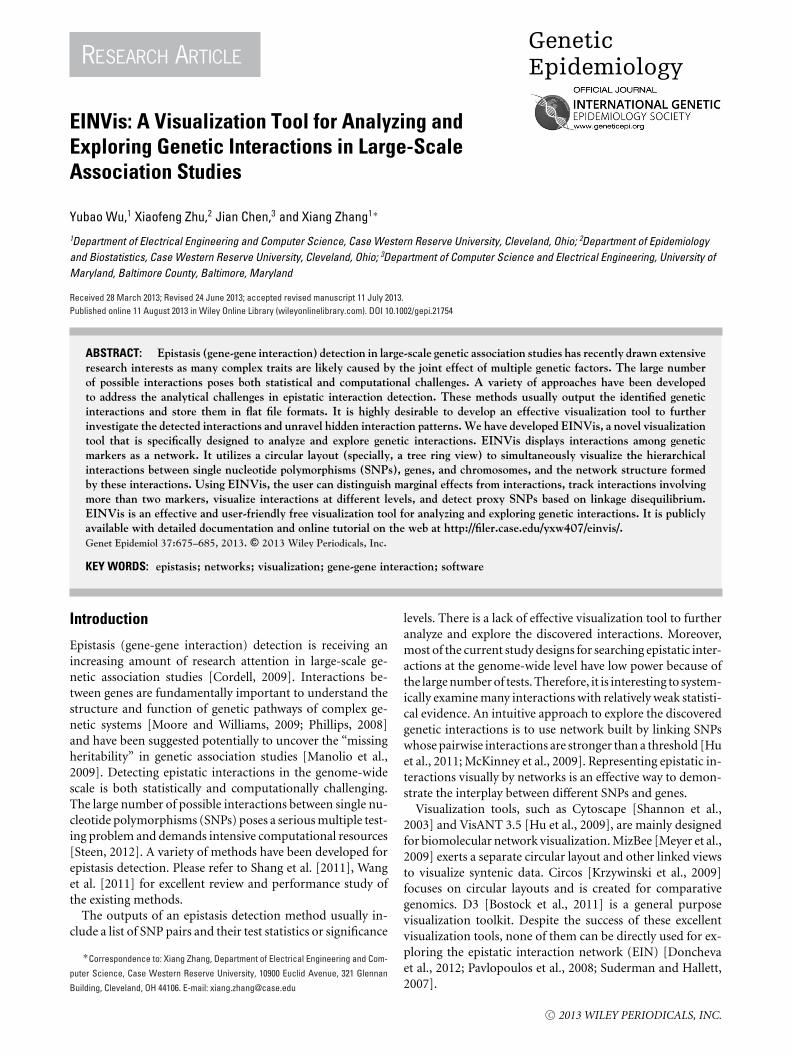
The underlying implementation architecture of EINVis isshown in Figure 1. It includes three main modules: layoutgeneration, rendering, and user interaction modules.
After the user inputs the node and edge files, EINVis willgenerate the layout and other rendering parameters. Then,EINVis will begin to render the tree ring views and matrixview. EINVis provides a wide range of user interactions,which can help the user to explore the visualized results.EINVis also provide SNPs rank summary information. Usercan link from EINVis to NCBI website and look up theinterested SNPs or genes.
Layout Generation Module
The layout generation module generates the graph layoutaccording to the user input files. All rendering parametersfor the tree ring views and matrix view are generated by thismodule. The input files include the EIN node file (SNPs),EIN edge file (interactions between SNPs), and LD edge file(LD information between SNPs). In the EIN tree ring view,each node is rendered as a ring sector, which includes fourparameters: inner radius, outer radius, begin angle, and endangle degree. The node color is mapped from the single-locus test statistic. The edge layout is generated by B-splineinterpolation. There is a virtual hierarchical grid [Holten,2006] built in the inner circle region of tree ring view. Wefind the shortest path between two nodes, which have anedge linking them through this virtual grid. The points on thispath will be used to calculate the edge curve. The edge coloris mapped from two-locus test statistic. When there is userinteraction, this module will update the layouts and renderingparameters, such as node color and bubble positions. Afterupdating, it will call the rendering module to update thevisualization results.
Rendering Module
The rendering module renders graphics on the canvas el-ements (please refer to the official W3C specification aboutCanvas element). The canvas element provides scripts with aresolution-dependent bitmap canvas, which can be used forrendering graphics and other visual images on the fly. Therendering module reads the parameters generated by the lay-out generation module and calls the figure drawing functionto render the figure on the canvas. When the user interactswith EINVis, the rendering module can also update the vi-sualization results. For example, when the user changes theedge color, this module will update the edge color (instead ofbeginning rendering from scratch). The tree ring views andmatrix view are rendered as bubbles [Bragdon et al., 2010;Li et al., 2011]. The extension of static multiple views to ametaphorical interface of bubbles enables a flexible layout tosupport analysis. The user can move the bubbles or changetheir layers. After this module renders the graphics, the usercan observe and interact with the visualization results.
User Interaction Module
This module enables various user interactions. There aretwo types of interactions provided by EINVis: the mouse and
676 Genetic Epidemiology, Vol. 37, No. 7, 675–685, 2013
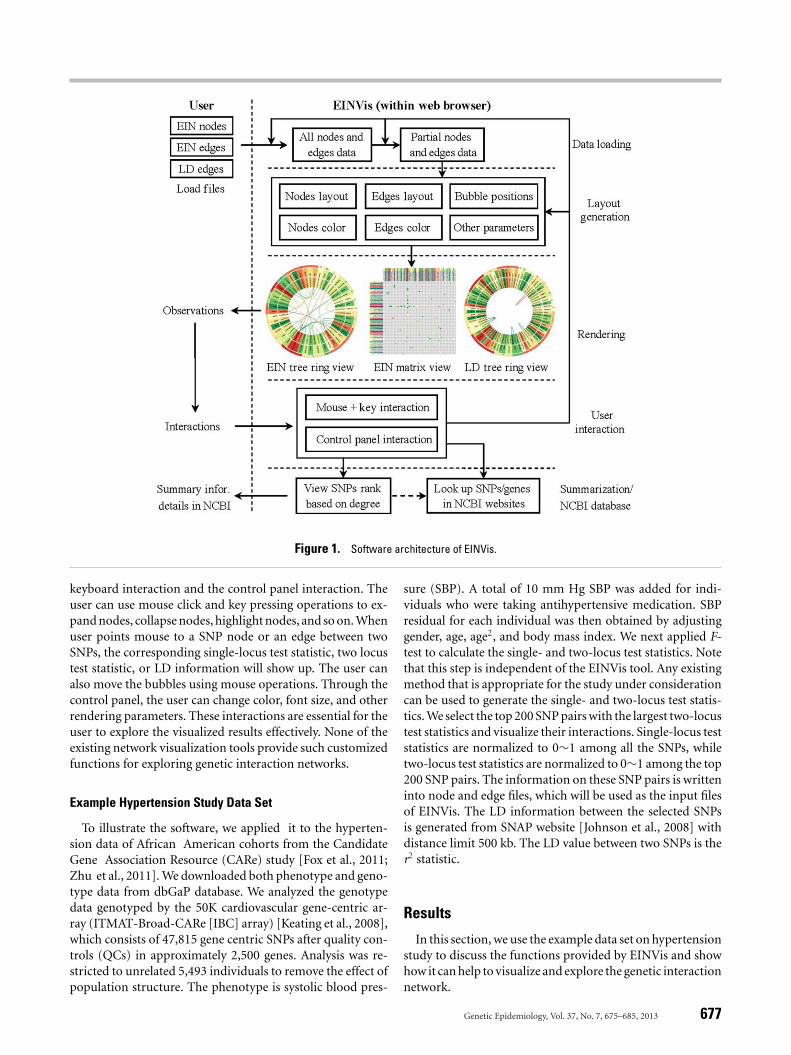
Figure 1. Software architecture of EINVis.
keyboard interaction and the control panel interaction. Theuser can use mouse click and key pressing operations to ex-pand nodes, collapse nodes, highlight nodes, and so on. Whenuser points mouse to a SNP node or an edge between twoSNPs, the corresponding single-locus test statistic, two locustest statistic, or LD information will show up. The user canalso move the bubbles using mouse operations. Through thecontrol panel, the user can change color, font size, and otherrendering parameters. These interactions are essential for theuser to explore the visualized results effectively. None of theexisting network visualization tools provide such customizedfunctions for exploring genetic interaction networks.
Example Hypertension Study Data Set
To illustrate the software, we applied it to the hyperten-sion data of African American cohorts from the CandidateGene Association Resource (CARe) study [Fox et al., 2011;Zhu et al., 2011]. We downloaded both phenotype and geno-type data from dbGaP database. We analyzed the genotypedata genotyped by the 50K cardiovascular gene-centric ar-ray (ITMAT-Broad-CARe [IBC] array) [Keating et al., 2008],which consists of 47,815 gene centric SNPs after quality con-trols (QCs) in approximately 2,500 genes. Analysis was re-stricted to unrelated 5,493 individuals to remove the effect ofpopulation structure. The phenotype is systolic blood pres-
sure (SBP). A total of 10 mm Hg SBP was added for indi-viduals who were taking antihypertensive medication. SBPresidual for each individual was then obtained by adjustinggender, age, age2, and body mass index. We next applied F-test to calculate the single- and two-locus test statistics. Notethat this step is independent of the EINVis tool. Any existingmethod that is appropriate for the study under considerationcan be used to generate the single- and two-locus test statis-tics. We select the top 200 SNP pairs with the largest two-locustest statistics and visualize their interactions. Single-locus teststatistics are normalized to 0∼1 among all the SNPs, whiletwo-locus test statistics are normalized to 0∼1 among the top200 SNP pairs. The information on these SNP pairs is writteninto node and edge files, which will be used as the input filesof EINVis. The LD information between the selected SNPsis generated from SNAP website [Johnson et al., 2008] withdistance limit 500 kb. The LD value between two SNPs is ther2 statistic.
Results
In this section, we use the example data set on hypertensionstudy to discuss the functions provided by EINVis and showhow it can help to visualize and explore the genetic interactionnetwork.
Genetic Epidemiology, Vol. 37, No. 7, 675–685, 2013 677
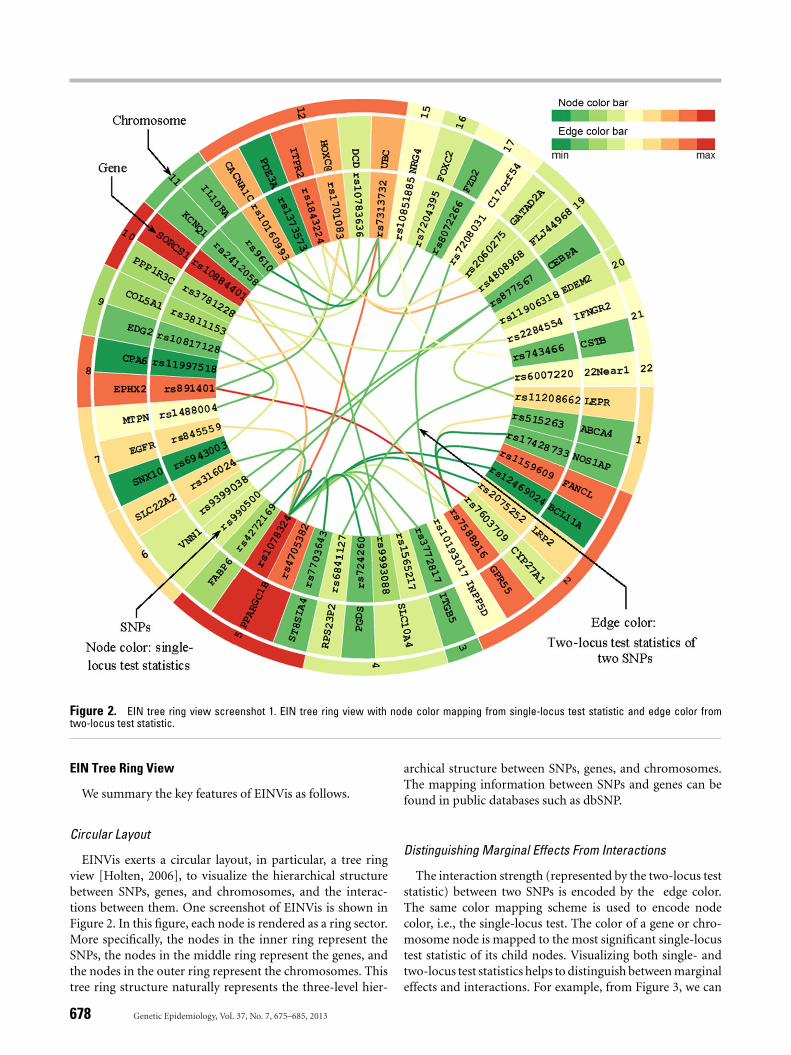
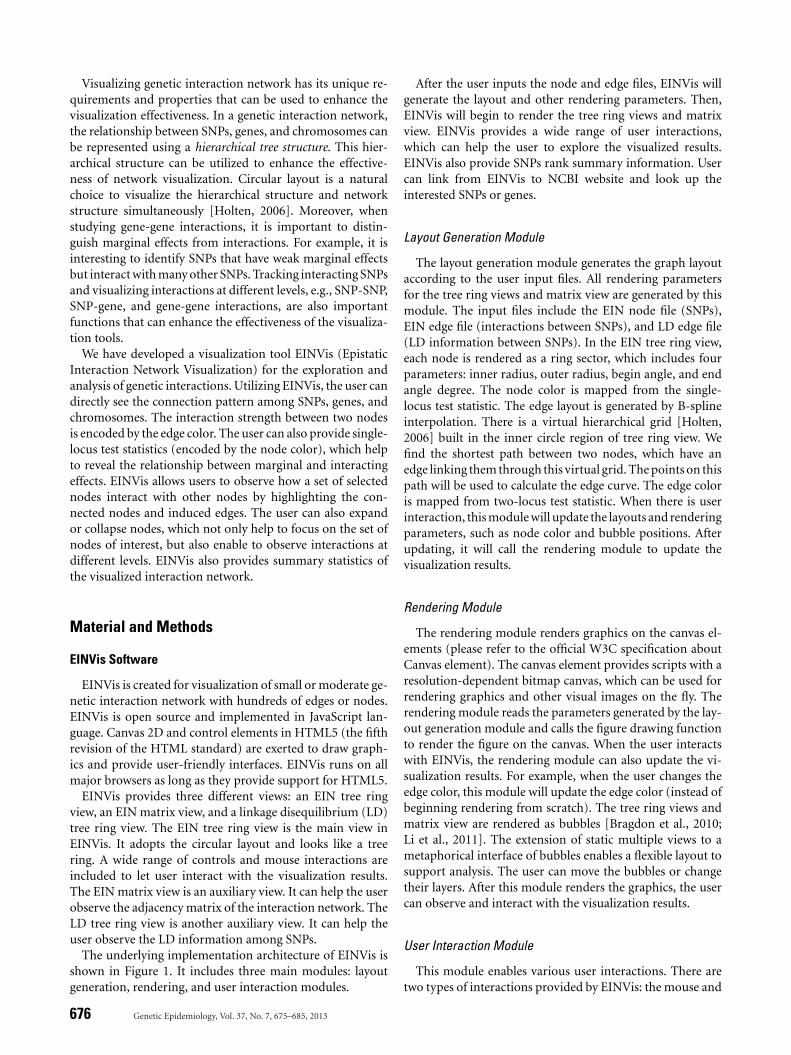
Figure 2. EIN tree ring view screenshot 1. EIN tree ring view with node color mapping from single-locus test statistic and edge color fromtwo-locus test statistic.
EIN Tree Ring View
We summary the key features of EINVis as follows.
Circular Layout
EINVis exerts a circular layout, in particular, a tree ringview [Holten, 2006], to visualize the hierarchical structurebetween SNPs, genes, and chromosomes, and the interac-tions between them. One screenshot of EINVis is shown inFigure 2. In this figure, each node is rendered as a ring sector.More specifically, the nodes in the inner ring represent theSNPs, the nodes in the middle ring represent the genes, andthe nodes in the outer ring represent the chromosomes. Thistree ring structure naturally represents the three-level hier-
archical structure between SNPs, genes, and chromosomes.The mapping information between SNPs and genes can befound in public databases such as dbSNP.
Distinguishing Marginal Effects From Interactions
The interaction strength (represented by the two-locus teststatistic) between two SNPs is encoded by the edge color.The same color mapping scheme is used to encode nodecolor, i.e., the single-locus test. The color of a gene or chro-mosome node is mapped to the most significant single-locustest statistic of its child nodes. Visualizing both single- andtwo-locus test statistics helps to distinguish between marginaleffects and interactions. For example, from Figure 3, we can
678 Genetic Epidemiology, Vol. 37, No. 7, 675–685, 2013

Figure 3. EIN tree ring view screenshot 2. SNP “rs10160993” on gene “CACNA1C” is selected. SNP “rs10160993” on gene “CACNA1C” and SNP“rs4746172” on gene “VCL” have strong interaction and low marginal effects.
see that SNP “rs10160993” on gene “CACNA1C” and SNP“rs4746172” on gene “VCL” both have weak single-locus as-sociations, but their two-locus association is very strong. Thisindicates strong interaction effects. In Figure 4, we can ob-serve that a hub SNP “rs1078324” on gene “PPARGC1B,”which interacts with many other SNPs, has strong marginaleffect. Clearly, it is the marginal effect that makes this SNPa hub. EINVis allows distinguishing marginal effects frominteractions. From the NCBI Genetic Association Database,we find that “CACNA1C” has been reported to have strongassociation with hypertension [Bremer et al., 2006; Kamideet al., 2009]. The literature shows that “CACNA1C” polymor-phisms are associated with the efficacy of calcium channelblockers in the treatment of hypertension.
Edge Bundling and Interaction Tracking
EINVis incorporates edge bundling technique [Holten,2006] to reduce visual clutter when there are a large numberof edges. This technique models each edge as a B-spline curveand bundle adjacent edges together to form a path from onenode to another. It also helps to visualize implicit connectionsbetween parent nodes resulting from the explicit connectionsbetween their child nodes. EINVis also allows the user to trackthe interacting nodes. When one node is selected, all its inter-acting nodes and corresponding edges can be highlighted. Forexample, Figure 4 shows that one SNP “rs1078324” on gene“PPARGC1B” is selected, and all its interacting nodes andcorresponding edges are highlighted, while unrelated nodesand edges become gray.
Genetic Epidemiology, Vol. 37, No. 7, 675–685, 2013 679
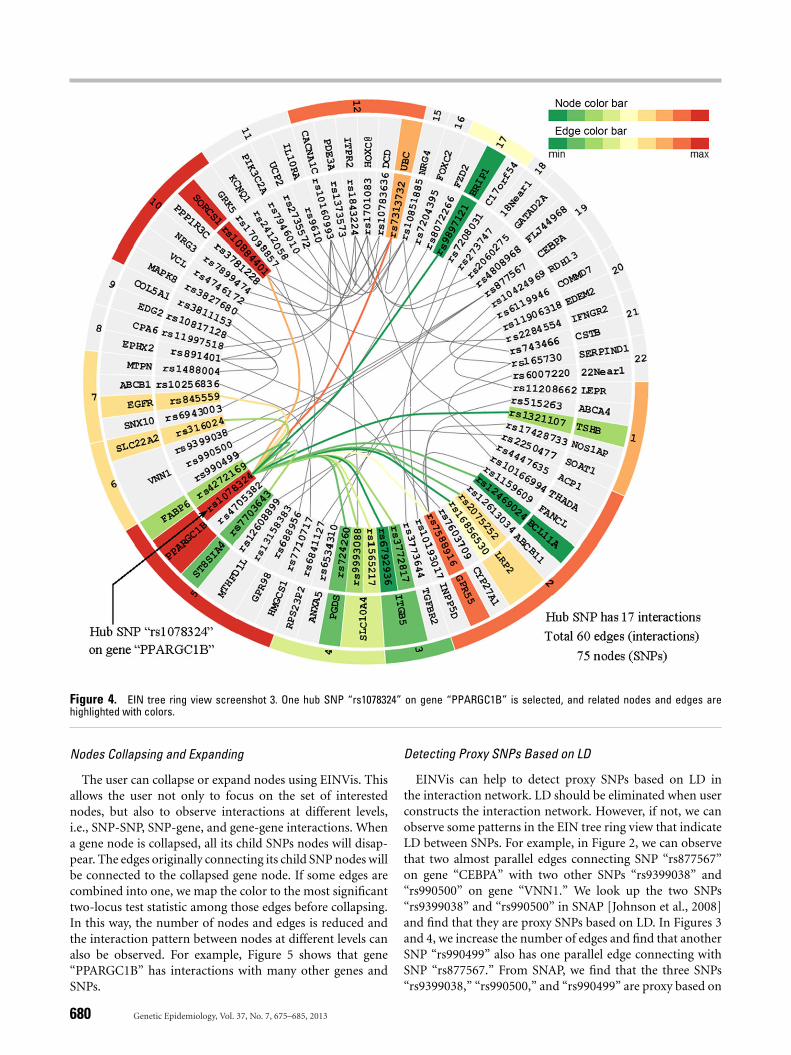
Figure 4. EIN tree ring view screenshot 3. One hub SNP “rs1078324” on gene “PPARGC1B” is selected, and related nodes and edges arehighlighted with colors.
Nodes Collapsing and Expanding
The user can collapse or expand nodes using EINVis. Thisallows the user not only to focus on the set of interestednodes, but also to observe interactions at different levels,i.e., SNP-SNP, SNP-gene, and gene-gene interactions. Whena gene node is collapsed, all its child SNPs nodes will disap-pear. The edges originally connecting its child SNP nodes willbe connected to the collapsed gene node. If some edges arecombined into one, we map the color to the most significanttwo-locus test statistic among those edges before collapsing.In this way, the number of nodes and edges is reduced andthe interaction pattern between nodes at different levels canalso be observed. For example, Figure 5 shows that gene“PPARGC1B” has interactions with many other genes andSNPs.
Detecting Proxy SNPs Based on LD
EINVis can help to detect proxy SNPs based on LD inthe interaction network. LD should be eliminated when userconstructs the interaction network. However, if not, we canobserve some patterns in the EIN tree ring view that indicateLD between SNPs. For example, in Figure 2, we can observethat two almost parallel edges connecting SNP “rs877567”on gene “CEBPA” with two other SNPs “rs9399038” and“rs990500” on gene “VNN1.” We look up the two SNPs“rs9399038” and “rs990500” in SNAP [Johnson et al., 2008]and find that they are proxy SNPs based on LD. In Figures 3and 4, we increase the number of edges and find that anotherSNP “rs990499” also has one parallel edge connecting withSNP “rs877567.” From SNAP, we find that the three SNPs“rs9399038,” “rs990500,” and “rs990499” are proxy based on
680 Genetic Epidemiology, Vol. 37, No. 7, 675–685, 2013
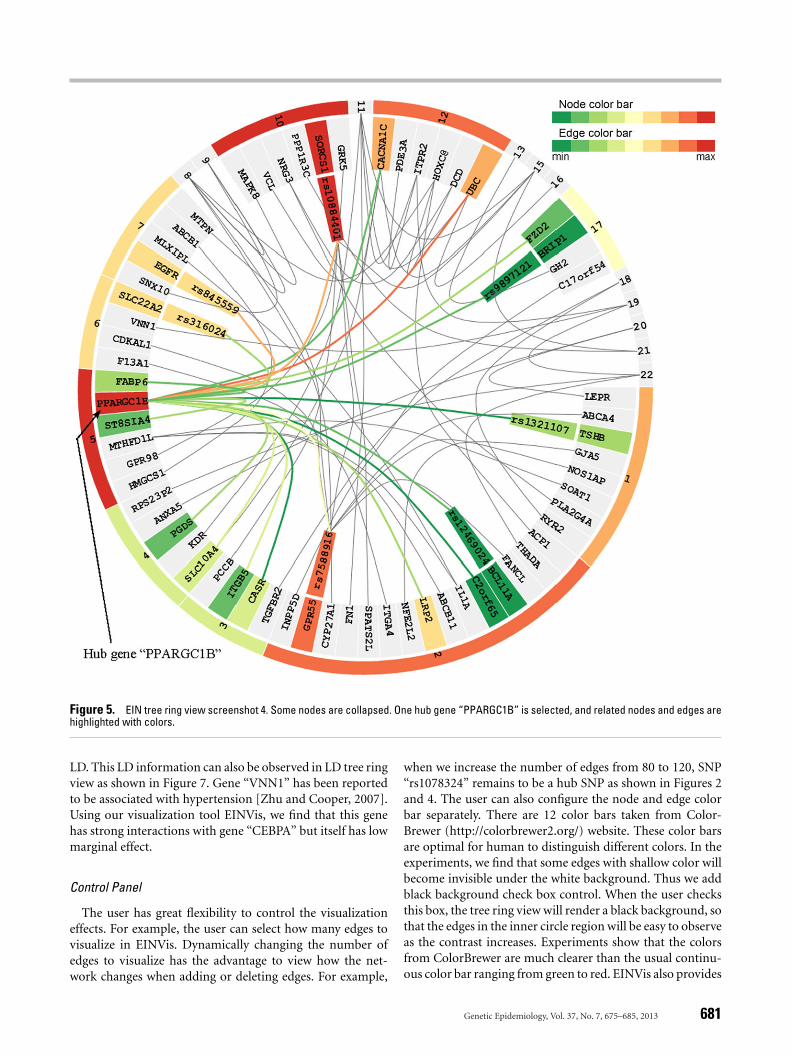
Figure 5. EIN tree ring view screenshot 4. Some nodes are collapsed. One hub gene “PPARGC1B” is selected, and related nodes and edges arehighlighted with colors.
LD. This LD information can also be observed in LD tree ringview as shown in Figure 7. Gene “VNN1” has been reportedto be associated with hypertension [Zhu and Cooper, 2007].Using our visualization tool EINVis, we find that this genehas strong interactions with gene “CEBPA” but itself has lowmarginal effect.
Control Panel
The user has great flexibility to control the visualizationeffects. For example, the user can select how many edges tovisualize in EINVis. Dynamically changing the number ofedges to visualize has the advantage to view how the net-work changes when adding or deleting edges. For example,
when we increase the number of edges from 80 to 120, SNP“rs1078324” remains to be a hub SNP as shown in Figures 2and 4. The user can also configure the node and edge colorbar separately. There are 12 color bars taken from Color-Brewer (http://colorbrewer2.org/) website. These color barsare optimal for human to distinguish different colors. In theexperiments, we find that some edges with shallow color willbecome invisible under the white background. Thus we addblack background check box control. When the user checksthis box, the tree ring view will render a black background, sothat the edges in the inner circle region will be easy to observeas the contrast increases. Experiments show that the colorsfrom ColorBrewer are much clearer than the usual continu-ous color bar ranging from green to red. EINVis also provides
Genetic Epidemiology, Vol. 37, No. 7, 675–685, 2013 681

Table 1. Partial table of SNPs rank
Epistasis interaction network (EIN) has
� Number of nodes (SNPs): 218� Number of edges (SNP-SNP interactions): 200
The parameters for binomial distribution are
� Number of independent experiments: 200 (number of edges in EIN)� Probability to yield success: 0.0092 (2/number of nodes in EIN)
Chrome Single-locus Number of Binomial dist.Index ID Gene name SNP ID test statistics related edges P-value
1 5 PPARGC1B rs1078324 0.947 51 0.00002 15 NRG4 rs10851885 0.552 13 7.4 × 10⁻⁹
3 2 GPR55 rs7588916 0.859 12 6.0 × 10⁻⁸
4 10 SORCS1 rs10884401 1.000 10 3.2 × 10⁻⁶
5 12 UBC rs7313732 0.725 9 2.0 × 10⁻⁵
6 12 ITPR2 rs1843224 0.852 9 2.0 × 10⁻⁵
7 12 HOXC@ rs1701083 0.772 9 2.0 × 10⁻⁵
8 19 MTHFD1L rs12608899 0.835 7 0.00069 5 PPARGC1B rs4705382 0.809 7 0.000610 8 EPHX2 rs891401 0.819 6 0.002711 2 FANCL rs1159609 0.820 5 0.010912 12 CACNA1C rs10160993 0.669 5 0.010913 8 ADRA1A rs498194 0.572 4 0.038214 9 VLDLR rs2242104 0.769 4 0.038215 12 DCD rs10783636 0.398 4 0.038216 21 IFNGR2 rs2284554 0.488 4 0.038217 12 HOXC@ rs12309639 0.684 3 0.1135
this traditional color bar for comparison purpose. The usercan also control the font size of the node label text. Whenthere are too many SNPs, user can decrease the font size tosave space to show more SNPs. The user can also choose tohide the node name and focus on the node and edge colorpatterns. When the user finds an interesting gene or SNP, hecan choose to show the node name again.
Mouse-Over Function
In the EIN tree ring view, when the user points mouse to aSNP node, the corresponding marginal statistic will be shownat the upright corner of the ring circle. When the user pointsmouse to an edge connecting two SNPs, the correspondingtwo-locus test statistic will be shown at the same place. Sim-ilarly, in the LD tree ring view, when the mouse is pointed toan edge, the corresponding LD information will be shown.This allows the user to see the exact test value in addition tothe mapped color on the node and edge.
Link to NCBI Website
EINVis also allows the user to directly connect to the NCBIwebsite, so he can get more detailed information of selectedSNPs or genes. In the EIN tree ring view, the user can clickon one node while pressing “L” key to link to NCBI website.In the summary statistics webpage, each SNP and gene namehas a hyperlink to NCBI.
Summary Statistics
Through the “View Rank” button in the control panel onthe EIN tree ring view bubble, the user can link to a newpage, which shows the rank of SNPs by their degree in theinteraction network. The significance of a node with certain
degree is accessed as follows. Suppose that there are nv nodesand ne edges in the network. Assuming each node has thesame probability to connect to an edge, the probability thata node is connected to an edge is Pe = 2
nv.
The number of edges connected to a node follows a bino-mial distribution binom(ne, Pe). If one node has a degree ofd, we can test if this node has excessive number of connectededges by calculating the P-value as: P = p binom(ne, d, Pe),where “p binom” is the function to calculate the P-value usingbinomial distribution.
Table 1 shows the results by using the hypertension dataset. From the table, we can see that SNP “rs1078324” on gene“PPARGC1B” has the largest degree of 51 with highly sig-nificant test P-value. However, its single-locus test value isrelatively large. It is likely that the marginal effect makes thisSNP a hub. The second SNP “rs10851885” on gene “NRG4”has a degree of 13, which is also highly significant. We noticethat this SNP has a relatively low single-locus test statistic. Af-ter further examination, we found that two additional genes,“NRG1” and “NRG3,” belong to the same gene family thatalso appears in the top 200 SNP pairs. This suggests “NRG”gene family warrants further investigation. We did not find“NRG” gene family reported to have association with hyper-tension. In Table 1, we notice that gene “ADRA1A” has beenreported many times to be associated with hypertension [Kit-sios and Zintzaras, 2010; Zhang et al., 2009]. We notice thatgene “ADRA1A” only has a 0.572 single-locus test statistic. Itis possible that the genetic interactions have made this genevisible.
EIN Matrix View
The EIN matrix view visualizes the adjacency matrix ofthe genetic interaction network. One screenshot is shown in
682 Genetic Epidemiology, Vol. 37, No. 7, 675–685, 2013

Figure 6. EIN matrix view. EIN matrix view with SNP name (in left or top margin) background color mapping to single-locus test statistic, andsquares (in the matrix region) color mapping to two-locus test statistic.
Figure 6. Note that the adjacency matrix is symmetric. Inthe left margin, we list all the SNP names in the format of“GeneName.SNPName.” The background color of an SNPname is mapped to its single-locus test statistic. The SNPname background color bar is the same as the nodes colorbar in EIN tree ring view. In the top margin, the SNPs namesare shown with the same order as that in the left margin. Inthe matrix, the color of each entry represents the interactionstrength between two SNPs on the corresponding row andcolumn. The gray color means that there is no interaction.
When the number of SNPs is too large to fit into the screen,the matrix view will visualize part of the matrix and providea panning function to allow the user to move the window andvisualize other parts of the adjacency matrix.
LD Tree Ring View
The LD tree ring view enables the visualization of the LDinformation between SNPs. An example is shown in Figure 7.The LD tree ring view has exactly the same layout as the EIN
Genetic Epidemiology, Vol. 37, No. 7, 675–685, 2013 683
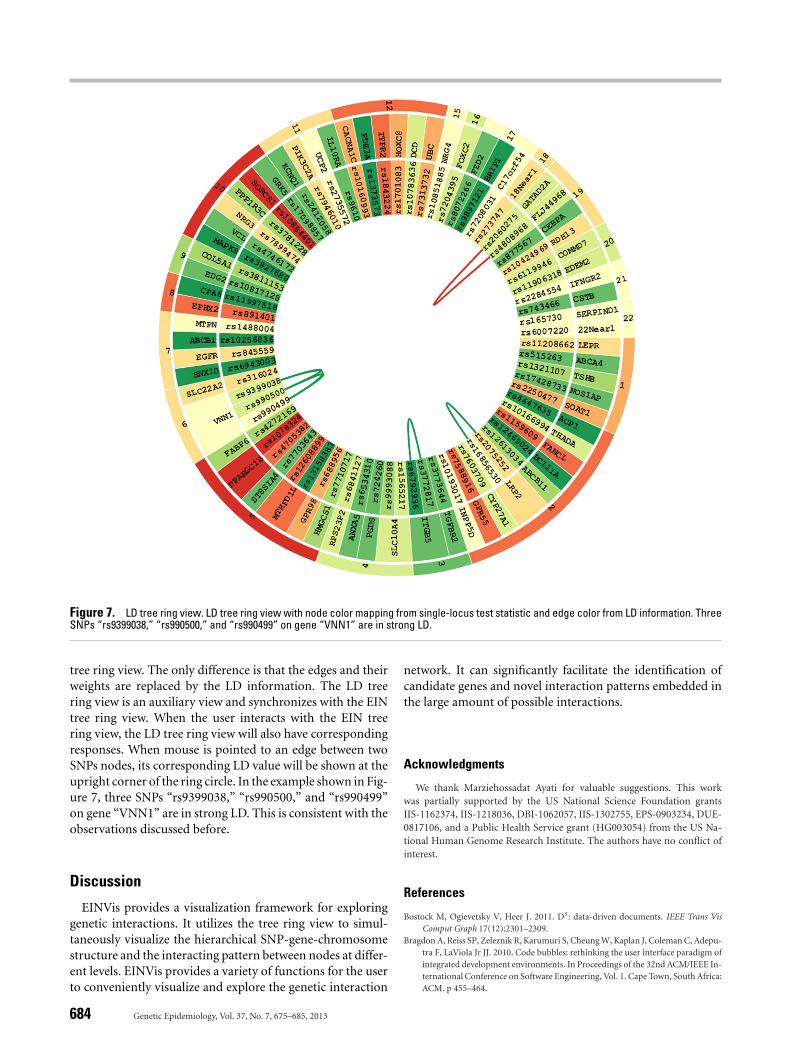
Figure 7. LD tree ring view. LD tree ring view with node color mapping from single-locus test statistic and edge color from LD information. ThreeSNPs “rs9399038,” “rs990500,” and “rs990499” on gene “VNN1” are in strong LD.
tree ring view. The only difference is that the edges and theirweights are replaced by the LD information. The LD treering view is an auxiliary view and synchronizes with the EINtree ring view. When the user interacts with the EIN treering view, the LD tree ring view will also have correspondingresponses. When mouse is pointed to an edge between twoSNPs nodes, its corresponding LD value will be shown at theupright corner of the ring circle. In the example shown in Fig-ure 7, three SNPs “rs9399038,” “rs990500,” and “rs990499”on gene “VNN1” are in strong LD. This is consistent with theobservations discussed before.
Discussion
EINVis provides a visualization framework for exploringgenetic interactions. It utilizes the tree ring view to simul-taneously visualize the hierarchical SNP-gene-chromosomestructure and the interacting pattern between nodes at differ-ent levels. EINVis provides a variety of functions for the userto conveniently visualize and explore the genetic interaction
network. It can significantly facilitate the identification ofcandidate genes and novel interaction patterns embedded inthe large amount of possible interactions.
Acknowledgments
We thank Marziehossadat Ayati for valuable suggestions. This workwas partially supported by the US National Science Foundation grantsIIS-1162374, IIS-1218036, DBI-1062057, IIS-1302755, EPS-0903234, DUE-0817106, and a Public Health Service grant (HG003054) from the US Na-tional Human Genome Research Institute. The authors have no conflict ofinterest.
References
Bostock M, Ogievetsky V, Heer J. 2011. D3: data-driven documents. IEEE Trans VisComput Graph 17(12):2301–2309.
Bragdon A, Reiss SP, Zeleznik R, Karumuri S, Cheung W, Kaplan J, Coleman C, Adepu-tra F, LaViola Jr JJ. 2010. Code bubbles: rethinking the user interface paradigm ofintegrated development environments. In Proceedings of the 32nd ACM/IEEE In-ternational Conference on Software Engineering, Vol. 1. Cape Town, South Africa:ACM. p 455–464.
684 Genetic Epidemiology, Vol. 37, No. 7, 675–685, 2013
Bremer T, Man A, Kask K, Diamond C. 2006. CACNA1C polymorphisms are associatedwith the efficacy of calcium channel blockers in the treatment of hypertension.Pharmacogenomics 7(3):271–279.
Cordell HJ. 2009. Detecting gene–gene interactions that underlie human diseases. NatRev Genet 10(6):392–404.
Doncheva NT, Assenov Y, Domingues FS, Albrecht M. 2012. Topological analysis andinteractive visualization of biological networks and protein structures. Nat Protoc7(4):670–685.
Fox ER, Young, JH, Li Y, Dreisbach AW, Keating BJ, Musani SK, Pihur V. 2011. As-sociation of genetic variation with systolic and diastolic blood pressure amongAfrican Americans: the Candidate Gene Association Resource study. Hum MolGenet 20(11):2273–2284.
Holten D. 2006. Hierarchical edge bundles: visualization of adjacency relations inhierarchical data. IEEE Trans Vis Comput Graph 12(5):741–748.
Hu Z, Hung JH, Wang Y, Chang YC, Huang CL, Huyck M, DeLisi C. 2009. VisANT3.5: multi-scale network visualization, analysis and inference based on the geneontology. Nucleic Acids Res 37(Suppl 2):W115–W121.
Hu T, Sinnott-Armstrong NA, Kiralis JW, Andrew AS, Karagas MR, Moore JH. 2011.Characterizing genetic interactions in human disease association studies usingstatistical epistasis networks. BMC Bioinformatics 12(1):364.
Johnson AD, Handsaker RE, Pulit SL, Nizzari MM, O’Donnell CJ, de Bakker PI. 2008.SNAP: a web-based tool for identification and annotation of proxy SNPs usingHapMap. Bioinformatics 24(24):2938–2939.
Kamide K, Yang J, Matayoshi T, Takiuchi S, Horio T, Yoshii M, Kawano Y. 2009. Geneticpolymorphisms of L-type calcium channel alpha1C and alpha1D subunit genes areassociated with sensitivity to the antihypertensive effects of L-type dihydropyridinecalcium-channel blockers. Circ J 73(4):732.
Keating BJ, Tischfield S, Murray SS, Bhangale T, Price TS, Glessner JT, McCarthy MI.2008. Concept, design and implementation of a cardiovascular gene-centric 50 kSNP array for large-scale genomic association studies. PLoS One 3(10): e3583.
Kitsios GD, Zintzaras E. 2010. Synopsis and data synthesis of genetic association studiesin hypertension for the adrenergic receptor family genes: the CUMAGAS-HYPERTdatabase. Am J Hypertens 23(3):305–313.
Krzywinski M, Schein J, Birol I, Connors J, Gascoyne R, Horsman D, Marra MA.2009. Circos: an information aesthetic for comparative genomics. Genome Res19(9):1639–1645.
Li G, Bragdon AC, Pan Z, Zhang M, Swartz SM, Laidlaw DH, Zhang C, Liu H,
Chen J. 2011. VisBubbles: a workflow-driven framework for scientific data analysisof time-varying biological datasets (SAP-0281). In SIGGRAPH Asia Posters. HongKong, China: ACM.
Manolio TA, Collins FS, Cox NJ, Goldstein DB, Hindorff LA, Hunter DJ, Visscher PM.2009. Finding the missing heritability of complex diseases. Nature 461(7265):747–753.
McKinney BA, Crowe JE, Guo J, Tian D. 2009. Capturing the spectrum of interactioneffects in genetic association studies by simulated evaporative cooling networkanalysis. PLoS Genet 5(3):e1000432.
Meyer M, Munzner T, Pfister H. 2009. MizBee: a multiscale synteny browser. IEEETrans Vis Comput Graph 15(6):897–904.
Moore JH, Williams SM. 2009. Epistasis and its implications for personal genetics. AmJ Hum Genet 85(3):309.
Pavlopoulos GA, Wegener AL, Schneider R. 2008. A survey of visualization tools forbiological network analysis. Biodata Min 1(1):12.
Phillips PC. 2008. Epistasis—the essential role of gene interactions in the structure andevolution of genetic systems. Nat Rev Genet 9(11):855–867.
Shang J, Zhang J, Sun Y, Liu D, Ye D, Yin Y. 2011. Performance analysis of novelmethods for detecting epistasis. BMC Bioinformatics 12(1):475.
Shannon P, Markiel A, Ozier O, Baliga NS, Wang JT, Ramage D, Ideker T. 2003. Cy-toscape: a software environment for integrated models of biomolecular interactionnetworks. Genome Res 13(11):2498–2504.
Suderman M, Hallett M. 2007. Tools for visually exploring biological networks. Bioin-formatics 23(20):2651–2659.
Steen VK. 2012. Travelling the world of gene–gene interactions. Briefings Bioinform13(1):1–19.
Wang Y, Liu G, Feng M, Wong L. 2011. An empirical comparison of several recentepistatic interaction detection methods. Bioinformatics 27(21):2936–2943.
Zhang Y, Hong X, Liu H, Huo Y, Xu X. 2009. Arg347Cys polymorphism of α1A-adrenoceptor gene is associated with blood pressure response to nifedipine GITSin Chinese hypertensive patients. J Hum Genet 54(6):360–364.
Zhu X, Cooper RS. 2007. Admixture mapping provides evidence of association of theVNN1 gene with hypertension. PLoS One 2(11):e1244.
Zhu X, Young JH, Fox E, Keating BJ, Franceschini N, Kang S, Levy D. 2011. Combinedadmixture mapping and association analysis identifies a novel blood pressuregenetic locus on 5p13: contributions from the CARe consortium. Hum Mol Genet20(11):2285–2295.
Genetic Epidemiology, Vol. 37, No. 7, 675–685, 2013 685