Embed Size (px)
Citation preview
Genetic Programming + Unfolding Embryology
in Automated Layout Planning
Adam Doulgerakis
September 2007
This dissertation is submitted in partial fulfilment of
the requirements for the degree of Master of
Science in Adaptive Architecture & Computation
from the University Of London
Bartlett School of Graduate Studies
University College London
ABSTRACT
ABSTRACT
Automated layout planning aims to the implementation of computational
methods for the generation and the optimization of floor plans, considering the
spatial configuration and the assignment of activities. Sophisticated strategies
such as Genetic Algorithms have been implemented as heuristics of good
solutions. However, the generative forces that derive from the social structures
have been often neglected. This research aims to illustrate that the data that
encode the layout’s social and cultural generative forces, can be
implemented within an evolutionary system for the design of residential layouts.
For that purpose a co-operative system was created, which is composed of a
Genetic Programming algorithm and an agent-based unfolding embryology
procedure that assigns activities to the spaces generated by the GP algorithm.
The assignment of activities is a recursive process which follows instructions
encoded as permeability graphs. Furthermore, the Ranking Sum Fitness
evaluation method is proposed and applied for the achievement of multi-
objective optimization. Its efficiency is tested against the Weighted-Sum Fitness
function. The system’s results, both numerical and spatial, are compared to the
results of a conventional evolutionary approach. This comparison showed that,
in general, the proposed system can yield better solutions.
Keywords
Genetic Programming, Automated Layout Planning, Permeability Graphs,
Space as Program, Recursive Genotype Structures, Multi-objective Optimization
word count : 10,363
ADAM DOULGERAKIS MSc AAC 2
TABLE OF CONTENTS
TABLE OF CONTENTS
ABSTRACT............................................................................................................ 2 TABLE OF CONTENTS........................................................................................... 3 LIST OF FIGURES.................................................................................................. 5 AKNOWLEDGEMENTS .......................................................................................... 7
INTRODUCTION ............................................................................................ 8 1. LITERATURE REVIEW.............................................................................. 10
1.1 HOUSES’ UNDERLYING GENERATIVE RULES............................................... 11 1.2 SPACE LAYOUT PLANNING........................................................................... 14 1.3 REPRESENTATIONS OF SPACE .................................................................... 15
1.3.1 EQUAL AREAS [One–to–One Assignment] .........................................................15 1.3.2 UNEQUAL AREAS [Block Plan] ..............................................................................15
1.4 GENERATING SOLUTIONS ............................................................................ 17 1.4.1 CONSTRUCTIVE PROCEDURES..............................................................................17 1.4.2 ITERATIVE IMPROVEMENT STRATEGIES .................................................................17 1.4.3 SOPHISTICATED STRATEGIES ..................................................................................17
1.5 RELATED WORK FOR THE SPACE LAYOUT PLANNING................................. 24 1.5.1 CONSTRUCTIVE APPROACH.................................................................................24 1.5.2 EVOLUTIONARY APPROACH.................................................................................27
2. AIMS AND OBJECTIVES .......................................................................... 31 3. METHODOLOGY ...................................................................................... 34
3.1 SPACE AS PROGRAM.................................................................................... 35 3.2 STRUCTURE OF THE GENOTYPE .................................................................. 37
3.2.1 AGGREGATING SPACES........................................................................................37 3.2.2 SUBDIVIDING SPACE ..............................................................................................39
3.3 MANIPULATION OF GEOMETRY .................................................................... 40 3.3.1 RECTANGULAR SPACES.........................................................................................40 3.3.2 POLYGONAL SPACES ............................................................................................40
3.4 EMBRYOLOGY-THE ASSIGNMENT OF ACTIVITIES ........................................ 42 3.4.1 ENCODING OF GENERAL PREFERENCES.............................................................42 3.4.2 ENCODING OF GAMMA MAPS............................................................................44 3.4.3 ITERATION OF SPACES AND ASSIGNMENT OF ACTIVITIES .................................45 3.4.4 INITIALIZATION OF THE EVALUATION FUNCTION.................................................46
3.5 THE EVOLUTION OF CONFIGURATIONS ....................................................... 47 3.5.1 POPULATION OF INDIVIDUALS..............................................................................47 3.5.2 MULTI-OBJECTIVE EVALUATION AND SELECTION...............................................47 3.5.3 GENETIC OPERATIONS...........................................................................................50
3.6 THE CONTEXT OF THE APPLICATION ........................................................... 52 3.6.1 MULTISTOREY RESIDENTIAL BUILDING IN ATHENS................................................52
ADAM DOULGERAKIS MSc AAC 3
TABLE OF CONTENTS
3.6.2 APPLICATION OF THE MODEL TO THE CONTEXT.................................................53 4. FINDINGS ................................................................................................ 54
4.1 VERSIONS OF THE APPLICATION ................................................................. 55 4.2 PREASSIGNED ACTIVITIES vs. UNFOLDING ASSIGNMENT........................... 56 4.3 WEIGHTED SUM FITNESS vs. RANKING SUM FITNESS ................................. 59
5. DISCUSSION ........................................................................................... 63 5.1 GENERAL ...................................................................................................... 64 5.2 COMPARING TO OTHER APPROACHES ........................................................ 65 5.3 LIMITATIONS AND FURTHER DEVELOPMENT ............................................... 67
CONCLUSIONS ........................................................................................... 69 LIST OF REFERENCES ........................................................................................ 71 APPENDIX I: SCRIPTING METHODS .................................................................... 74
GENOTYPE ........................................................................................................................74 RECTANGULAR SPACES..................................................................................................74 POLYGONAL SPACES......................................................................................................75 CROSSOVER.....................................................................................................................77 MUTATION.........................................................................................................................78 ADF [Automatically Defined Functions] ......................................................................79
APPENDIX II: USER TYPES .................................................................................. 80 CD-ROM .............................................................................................................. 84
ADAM DOULGERAKIS MSc AAC 4
LIST OF FIGURES
LIST OF FIGURES
Figure 1 Decoding configurations. [Hillier and Hanson,1984] ...............................................11 Figure 2 Similar plans generate different patterns of use [Hillier and Hanson,1984]..........12 Figure 3 Random aggregation of cells with one face free [Hillier and Hanson,1984] ......13 Figure4 Villager application [Doulgerakis unpublished] ........................................................13 Figure5 One-to-one assignment [Ligget,2000] ........................................................................15 Figure6 Modularisation on a block plan [Liggett,2000]..........................................................15 Figure7 Facilities Layout Problem’s approaches.....................................................................16 Figure8 Evolutionary computation [Bentley,1999] ..................................................................18 Figure9 Search space and solution space [Bentley,1999] ....................................................19 Figure10 Genetic algorithms [Kalay,2004]................................................................................19 Figure11 Genetic operations in solution space [Gero,1998].................................................20 Figure12 Genetic operations [Flake,1998]................................................................................21 Figure13 Programs in tree-forms [Sean Hanna unpublished] ................................................21 Figure14 Crossover and mutation in GP [Sean Hanna unpublished] ..................................22 Figure15 CRAFT [//me.utexas.edu/~jensen/ORMM/omie/design/layout/craft.htm] .......24 Figure16 Dimensionless dissections of rectangles [Mitchell et al.,1976] ..............................25 Figure17 Transformations of dimensionless representations [Mitchell et al.,1976] .............25 Figure18 Sitewalker [Doulgerakis unpublished] .......................................................................26 Figure19 Allocated departments within the outline [Jo and Gero,1998]............................27 Figure20 Generation of a ‘trimino’ [Rosenman,1996] ............................................................28 Figure21 Possible arrangements of two rooms [Rosenman,1996] ........................................29 Figure22 Ant’s pheromone trail [Finucane et al.,2006] ..........................................................29 Figure23 Generated urban structure [Finucane et al.,2006].................................................30 Figure24 Numerical representation and manipulation of space.........................................35 Figure25 Aggregated spheres within an isospatial grid [Coates,1999] ...............................36 Figure26 GP Population of 3D object’s combinations [Coates and Hazarika,1999].........36 Figure27 GP genotype’s structure [Sean Hanna unpublished] ............................................37 Figure28 Aggregation of spaces genotype-phenotype .......................................................38 Figure29 GP population [aggregation of spaces]..................................................................38 Figure30 Subdivision of space genotype-phenotype............................................................39 Figure31 Rectilinear subdivision..................................................................................................40 Figure32 Polygonal subdivision...................................................................................................40 Figure33 intertwined GP and embryology algorithms............................................................42 Figure34 Encoding of general preferences .............................................................................43 Figure35 Encoding of gamma-maps ........................................................................................44 Figure36 Activities assignment algorithm .................................................................................45 Figure37 Searching for starting spaces. ....................................................................................46
ADAM DOULGERAKIS MSc AAC 5
LIST OF FIGURES
Figure38 Reproduction of the population................................................................................46 Figure39 One GP algorithm is executed for each floor .........................................................47 Figure40 Weighted Sum Fitness function ..................................................................................48 Figure41 Ranking Sum Fitness function .....................................................................................49 Figure42 Crossover genetic operation .....................................................................................50 Figure43 Mutation genetic operation.......................................................................................51 Figure44 Fragmentation of property in Patisia-Athens [Grigoratos and Sfiriou,2006]........52 Figure45 Typical multi-storey residential buildings [Grigoratos and Sfiriou,2006]................53 Figure46 Site and environment imported by .dxf file..............................................................53 Figure47 Generate building constrained by site and heights...............................................53 Figure48 Versions of the application.........................................................................................55 Figure49 Fitness of fittest and average fitness graphs ............................................................56 Figure50 Evolution of each objective in the two methods....................................................57 Figure51 Typical layouts [Activities Assignment Embryology] ...............................................58 Figure52 Typical layout [Randomly Assigned Activities] ........................................................58 Figure53 Evolution of solutions....................................................................................................59 Figure54 Objectives’ graph ........................................................................................................60 Figure55 Typical layout [Activities Assignment Embryology and Ranking Fitness].............60 Figure56 Typical layout [Activities Assignment Embryology and Weighted Sum] .............60 Figure57 Evolution of each objective in the two methods....................................................61 Figure58 Perspective views of solutions ....................................................................................62 Figure59 Backyard at Montessori school, Delft [Hertzberger,1991]......................................70
ADAM DOULGERAKIS MSc AAC 6
AKNOWLEDGEMENTS
AKNOWLEDGEMENTS
I would like to thank my supervisors:
Christian Derix, for his valuable advice and inspirational discussions
Chiron Mottram for his guidance and encouragement.
I am grateful to:
Julienne Hanson and Paul Coates, for their helpful recommendations
I would also like to thank:
Maria, Olga, Kostas and Christos for their friendship, help and support.
ADAM DOULGERAKIS MSc AAC 7
INTRODUCTION
INTRODUCTION
“The synthesis of design solutions is characterized by uncertainty,
unpredictability, the joy of discovery and the frustration of fruitless explorations”
[Kalay,2004,p.199]
Nowadays, architecture has become a field of multidisciplinary influence.
Particularly, the encapsulation of computational methods within the design
process, has reformulated the traditional approaches to the design problems.
Since the early years of the computational era, designers pioneered the
implementation of computation in the field of layout planning problem. The
layout planning problem is one of great complexity for it seeks to satisfy a set of
often conflicting criteria. Additionally, the configurations that result from the
combination of even a small amount of spaces constitute a vast search space
that makes impossible the enumeration of all the possible solutions and the
selection of the best among them. Hence, traditional methods to solve this kind
of problems are based on the designer’s intuition and creativity.
However, the development of sophisticated computational algorithms
proposed efficient heuristics for solutions that perform well under the imposed
set of constraints. Genetic Algorithms [GAs] in particular, were influenced by
the way that natural evolution occurs on populations of individuals, namely
through selection and reproduction of the fittest. The implementation of GAs
within the field of automated layout planning yielded efficient solutions.
Nevertheless, in most cases of automated layout planning, the researchers
seem to neglect the impact that the social and cultural background have over
the formation of the layout configuration. This research questions the possibility
to guide the evolution of layouts by considering these underlying generative
forces.
In order to answer this question, a multi-objective Genetic Programming
algorithm is applied over a population of individuals to induct their adaptation
to a set of criteria. Genetic Programming [GP], developed by Koza [Koza,1992],
is the subset of GAs which is involved with the program induction problem.
Hence, the articulation of residential layouts as programs, with values and
ADAM DOULGERAKIS MSc AAC 8
INTRODUCTION
functions, was necessary for the cooperation with the GP algorithm. Thereupon,
the allocation of activities [embryology] to a set of spaces occurs as an
independent unfolding procedure that is based on permeability graphs, e.g.
Gamma Graphs [Hanson,1998 and Hillier and Hanson,1984].
This report will start with an introduction to the social meaning and the
underlying social/cultural rules which generate the houses’ layouts. An overview
follows along with a classification of the different approaches developed over
time for the automated layout planning. A selection of distinctive works which
illustrate the different approaches will be presented. Thereupon, the
methodology developed for this research will be thoroughly explained, along
with its variations and early attempts. Furthermore, the findings of the research
will be presented whose meaning and importance will be discussed in respect
with the related work and the aims set.
ADAM DOULGERAKIS MSc AAC 9
LITERATURE REVIEW
1. LITERATURE REVIEW
ADAM DOULGERAKIS MSc AAC 10
LITERATURE REVIEW
1.1 HOUSES’ UNDERLYING GENERATIVE RULES
“Buildings are not just objects but transformation of space through objects.”
[Hillier and Hanson,1984,p.1]
People transform the space of their environment in order to host their activities
and their needs. This transformation is not a random aggregation of closed
spaces, it rather responds to certain generative rules that vary among the
different societies and cultures.
“Buildings, indeed, the entire built environment, are essentially social and
cultural products. […] Their size, appearance, location and form are governed
not simply by physical factors but by a society's ideas, its forms of economic
and social organization, its distribution of resources and authority, its activities
and the beliefs and values which prevail at any one period of time.” [King,1980,
p.1]
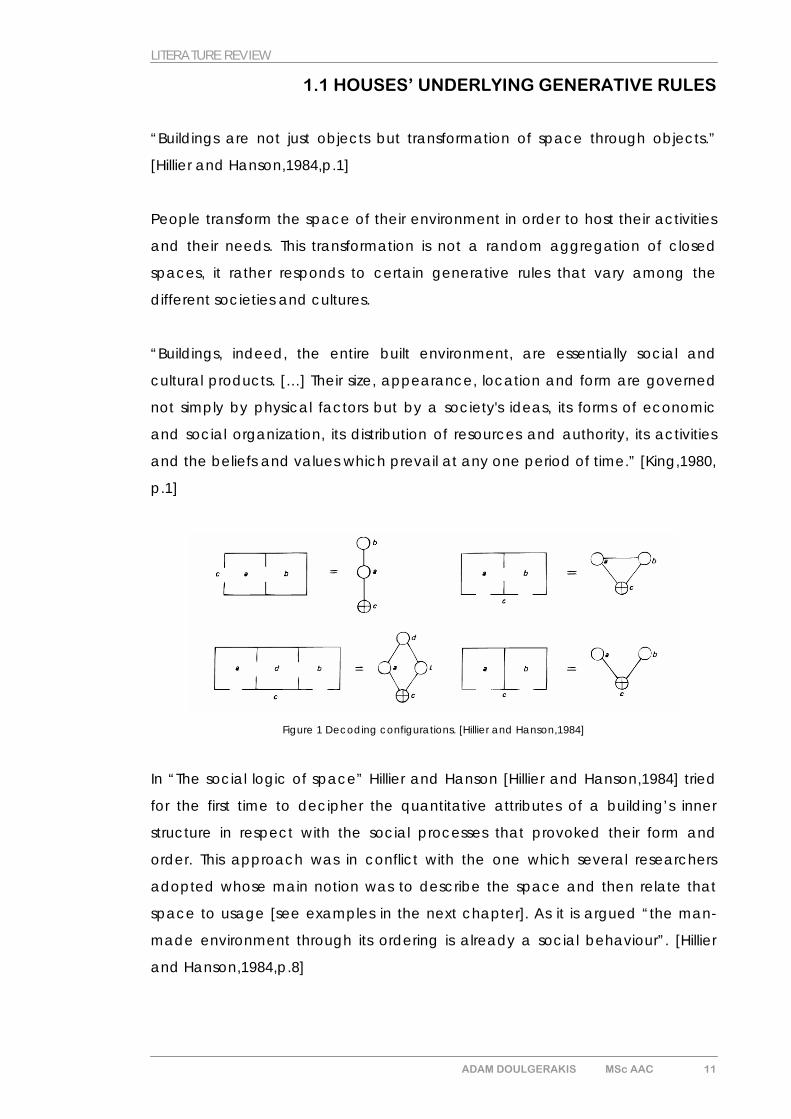
Figure 1 Decoding configurations. [Hillier and Hanson,1984]
In “The social logic of space” Hillier and Hanson [Hillier and Hanson,1984] tried
for the first time to decipher the quantitative attributes of a building’s inner
structure in respect with the social processes that provoked their form and
order. This approach was in conflict with the one which several researchers
adopted whose main notion was to describe the space and then relate that
space to usage [see examples in the next chapter]. As it is argued “the man-
made environment through its ordering is already a social behaviour”. [Hillier
and Hanson,1984,p.8]
ADAM DOULGERAKIS MSc AAC 11
LITERATURE REVIEW
Furthermore, according to the authors, the relations in the physical
configuration of spaces could describe the social meaning of space. One of
the objectives was to find the building rules that produce the resulting spatial
configuration. These rules concern the combination of elementary generators in
a set of more general rules that constitute the building’s genotype. And it is this
genotype that makes different instances of buildings to be categorised under
the same label. Their similarity or diversity is not based on their geometric
attributes, but instead on their underlying generative rules.
“What is realised in every interior is already a certain mode of organising
experience, and a certain way of representing in space the idiosyncrasies of
cultural identity.” [Hillier and Hanson,1984,p.145]
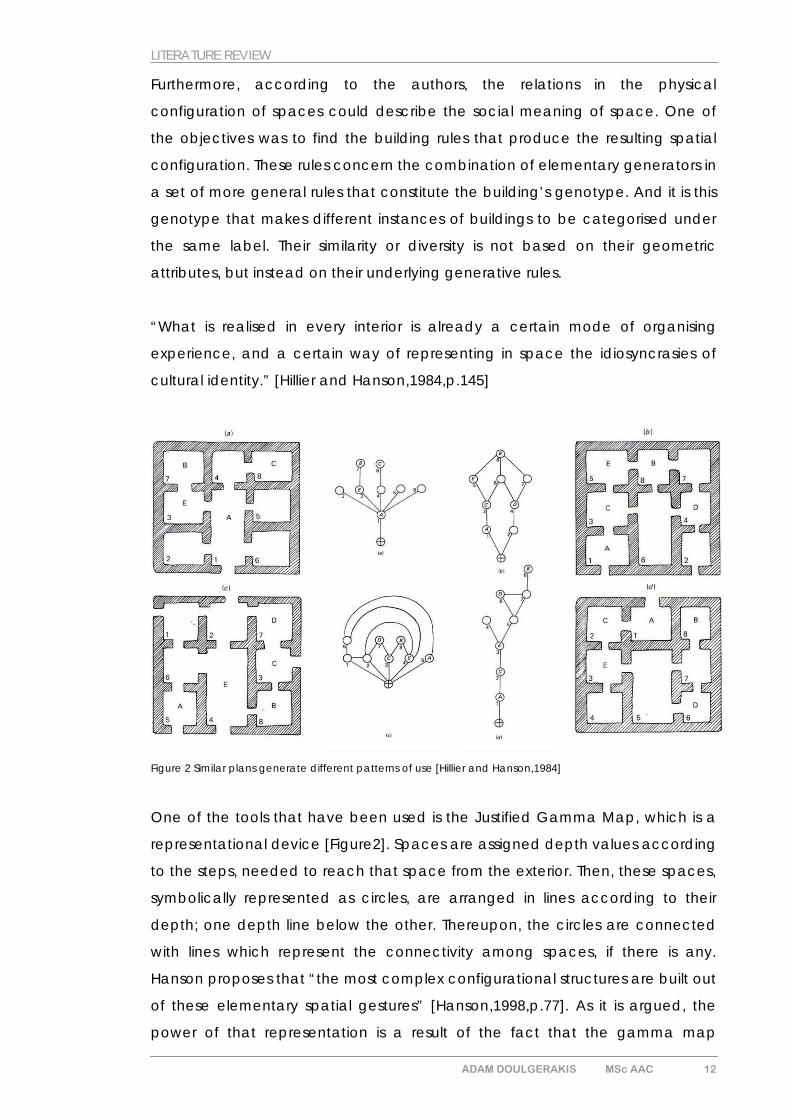
Figure 2 Similar plans generate different patterns of use [Hillier and Hanson,1984]
One of the tools that have been used is the Justified Gamma Map, which is a
representational device [Figure2]. Spaces are assigned depth values according
to the steps, needed to reach that space from the exterior. Then, these spaces,
symbolically represented as circles, are arranged in lines according to their
depth; one depth line below the other. Thereupon, the circles are connected
with lines which represent the connectivity among spaces, if there is any.
Hanson proposes that “the most complex configurational structures are built out
of these elementary spatial gestures” [Hanson,1998,p.77]. As it is argued, the
power of that representation is a result of the fact that the gamma map
ADAM DOULGERAKIS MSc AAC 12
LITERATURE REVIEW
deciphers the different underlying syntactic genotypes of buildings [Figure2]
whose geometry and adjacency Maps are identical [Hillier and Hanson,1984,
p.150].
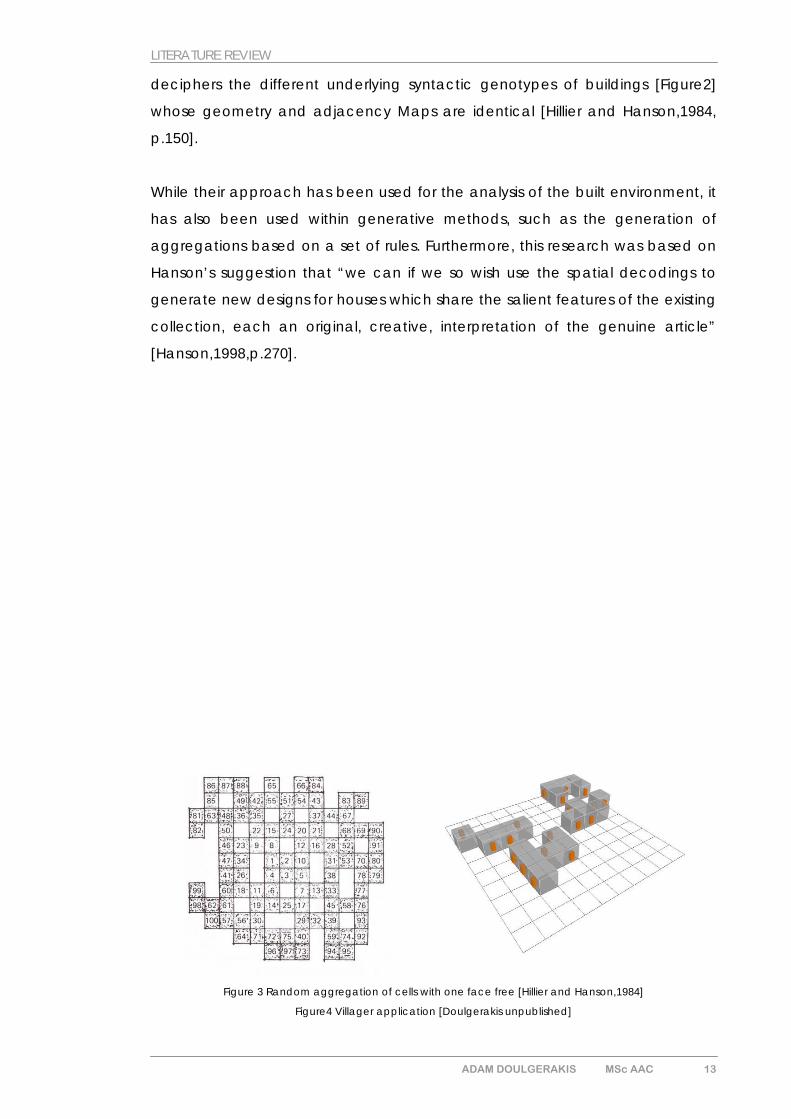
While their approach has been used for the analysis of the built environment, it
has also been used within generative methods, such as the generation of
aggregations based on a set of rules. Furthermore, this research was based on
Hanson’s suggestion that “we can if we so wish use the spatial decodings to
generate new designs for houses which share the salient features of the existing
collection, each an original, creative, interpretation of the genuine article”
[Hanson,1998,p.270].
Figure 3 Random aggregation of cells with one face free [Hillier and Hanson,1984]
Figure4 Villager application [Doulgerakis unpublished]
ADAM DOULGERAKIS MSc AAC 13
LITERATURE REVIEW
1.2 SPACE LAYOUT PLANNING
In “Decoding homes and houses”, Julienne Hanson mentions that “the same
brief for a house may generate solutions of breathtaking sophistication and
mind-numbing banality” [Hanson,1998,p.2]. In general, the space layout
problem is one of great complexity. Even a small number of spaces give rise to
a vast search space as the population of possible solutions augments
exponentially.
Since computation made possible the development of search algorithms and
optimization strategies, researchers tried to use these new means as an effort to
solve that kind of problems [e.g. the Facilities Layout Problem–FLP]. Liggett, in
her paper “Automated Facilities Layout: past, present and future” reviews
several approaches that aimed to address a demanding design problem.
“Facility layout is concerned with the allocation of activities to space such that
a set of criteria are met/or some objective minimized” [Liggett,2000,p.197].
Attempts to build automated solutions for spatial layout problems have their
origin in the 1960s. These attempts set different goals and follow various
strategies in order to come up with a solution. As the spatial layout planning
becomes an optimization problem, the number and the nature of the
parameters which have to be optimized, define the complexity of each
strategy’s goal. These objectives vary from the optimization of a single criterion
function [such as the cost minimization associated with flow of materials
between activities], to the finding of an arrangement that satisfies a diverse set
of constrains [e.g. position, orientation, adjacency, path, view or distance] [see
SEED and LOOS/ABLOOS in Kalay,2004].
ADAM DOULGERAKIS MSc AAC 14
LITERATURE REVIEW
1.3 REPRESENTATIONS OF SPACE
Facilities Layout Problems [FLP] can be divided in the following general
categories according to the way that the structure of space is considered: the
equal-area facility layout problems and the unequal-area facility layout
problems.
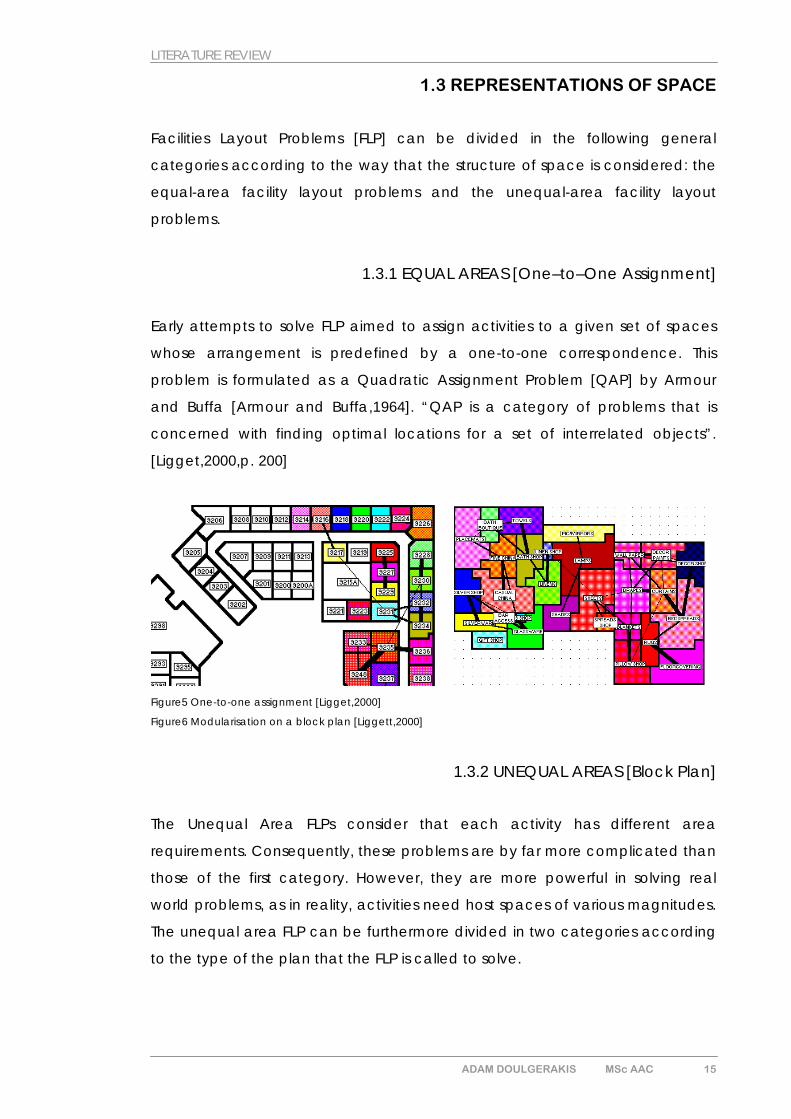
1.3.1 EQUAL AREAS [One–to–One Assignment]
Early attempts to solve FLP aimed to assign activities to a given set of spaces
whose arrangement is predefined by a one-to-one correspondence. This
problem is formulated as a Quadratic Assignment Problem [QAP] by Armour
and Buffa [Armour and Buffa,1964]. “QAP is a category of problems that is
concerned with finding optimal locations for a set of interrelated objects”.
[Ligget,2000,p. 200]
Figure5 One-to-one assignment [Ligget,2000]
Figure6 Modularisation on a block plan [Liggett,2000]
1.3.2 UNEQUAL AREAS [Block Plan]
The Unequal Area FLPs consider that each activity has different area
requirements. Consequently, these problems are by far more complicated than
those of the first category. However, they are more powerful in solving real
world problems, as in reality, activities need host spaces of various magnitudes.
The unequal area FLP can be furthermore divided in two categories according
to the type of the plan that the FLP is called to solve.
ADAM DOULGERAKIS MSc AAC 15
LITERATURE REVIEW
THE GRID-BASED APPROACH
“In the grid-based block plan layout problem the facility layout is constructed
on the grid plan, called the grid-based block plan and divided into squares or
rectangles having a unit area” [Lee et al.,2005,p.880]. Then, the activities are
partitioned into cells of the same unit-area according to their area
requirements [Figure6]. Thereupon, as Liggett [Liggett,2000,p.205] stresses, the
problem is translated to a one-to-one assignment problem. In this case, the
module’s attributes influence the results of the automated algorithm. The grid
can only approximately create plans whose elements are not rectilinear; the
approximation limit is defined by the grid’s unit area. Nevertheless, there are
examples which show that this method can be efficient in FLP solving [see Jo
and Gero,1998 and Rosenman,1996].
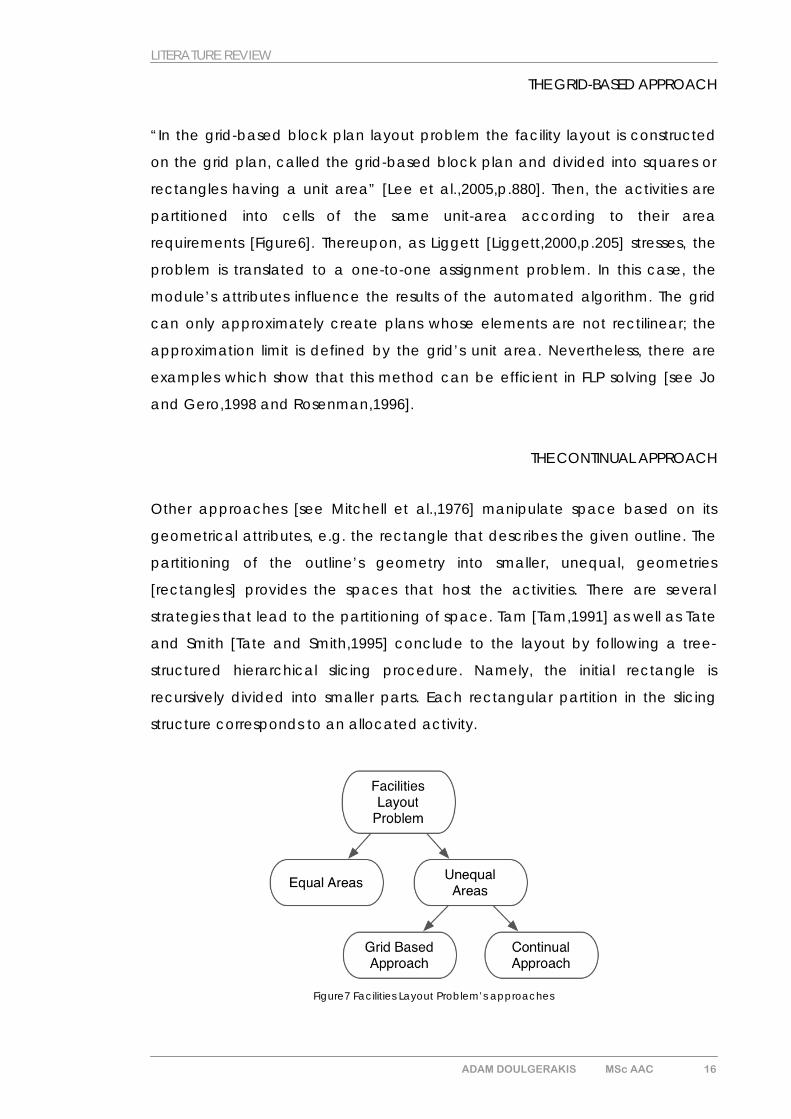
THE CONTINUAL APPROACH
Other approaches [see Mitchell et al.,1976] manipulate space based on its
geometrical attributes, e.g. the rectangle that describes the given outline. The
partitioning of the outline’s geometry into smaller, unequal, geometries
[rectangles] provides the spaces that host the activities. There are several
strategies that lead to the partitioning of space. Tam [Tam,1991] as well as Tate
and Smith [Tate and Smith,1995] conclude to the layout by following a tree-
structured hierarchical slicing procedure. Namely, the initial rectangle is
recursively divided into smaller parts. Each rectangular partition in the slicing
structure corresponds to an allocated activity.
Figure7 Facilities Layout Problem’s approaches
ADAM DOULGERAKIS MSc AAC 16
LITERATURE REVIEW
1.4 GENERATING SOLUTIONS
Liggett [Liggett,2000,p.202] classifies the existing generative methods in two
categories. On the one hand, there are the constructive initial-placement
strategies, whereas on the other, there are the iterative improvement strategies.
1.4.1 CONSTRUCTIVE PROCEDURES
According to Jo and Gero [Jo and Gero,1998], a constructive procedure is an
n-stage decision process that starts with a set of spaces and a set of activities
which are assigned to the spaces one at a time. These activities are allocated
the one next to the other according to the predefined design requirements. For
each placement, a ‘tree-search’ is executed and the selection of an activity-
location assignment is made. The criteria for the selection of the next element
to be assigned can be either local or global. Tree search can either be
influenced by the spaces that have already been assigned [local criteria], or
by the future search steps as well [global criteria]; thereupon, the assignment
that guarantees the most promising evolution is selected.
1.4.2 ITERATIVE IMPROVEMENT STRATEGIES
In order to optimize the outcome of a constructive strategy, improvement
procedures are applied at a later stage, i.e. after the completion of the first
assignment. The simplest one is the ‘pair wise’ exchange which is based on the
random selection of a pair of assigned spaces and the exchange of their
activities. The result is evaluated according to the requirements and if the
exchange improves the solution’s efficiency, it is accepted as the new solution
and so on.
1.4.3 SOPHISTICATED STRATEGIES
There is another category of strategies which are used in order to build more
efficient automated solutions for spatial layout problems. This category is
characterized by the use of sophisticated algorithms that provide a massively
parallel exploration of the solution space. Evolutionary Algorithms attempt to
ADAM DOULGERAKIS MSc AAC 17
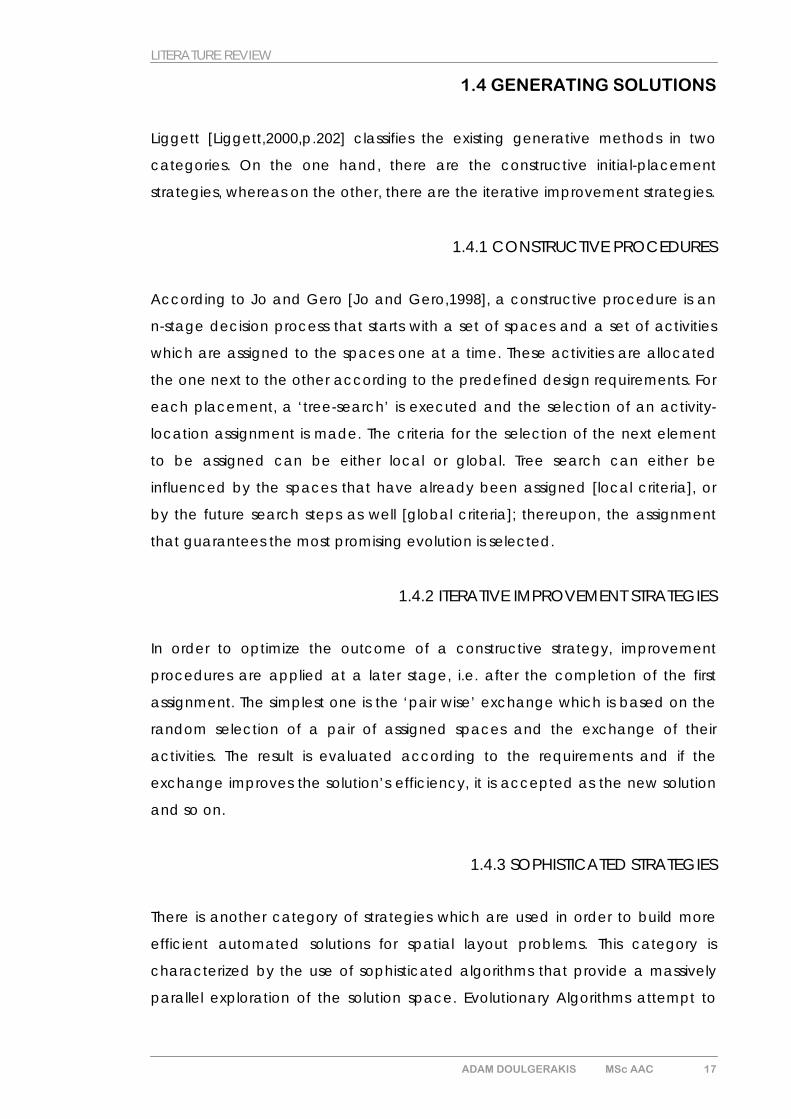
LITERATURE REVIEW
imitate the way that natural evolution generates evolved organisms as offspring
of less-evolved ancestors.
Figure8 Evolutionary computation [Bentley,1999]
As Peter Bentley explains, “evolutionary design has its roots in computer
science, design, and evolutionary biology. It is a branch of evolutionary
computation, it extends and combines CAD and analysis software, and it
borrows ideas from natural evolution” [Bentley,1999,p.35]. Evolutionary design
uses as a tool, evolutionary algorithms in order to explore the design solution
space, either for the generation of innovative designs or for the optimization of
the design’s efficiency according to predefined criteria. It follows the
explanation of the evolutionary algorithms that can be used in spatial layout
planning and in the next section, paradigms will be described.
GENETIC ALGORITHMS
“Genetic Algorithms [GAs] model natural selection and the evolution process.
Conceptually, genetic algorithms use the mechanisms of inheritance, genetic
crossover and natural selection in evolving individuals which, over time, adapt
to their environment.” [Gero,1996,p.16]
Bentley [Bentley,1999,p.8] mentions that GAs use two kind of abstract spaces.
The first space is the solution space, which comprises all the possible solutions of
a given problem. As it is impossible for a GA to manipulate the solution space,
given that it is merely a computational algorithm, the second space contains a
coded version [Genotypes] of all the possible solutions. This space is called the
search space of the GA.
ADAM DOULGERAKIS MSc AAC 18
LITERATURE REVIEW
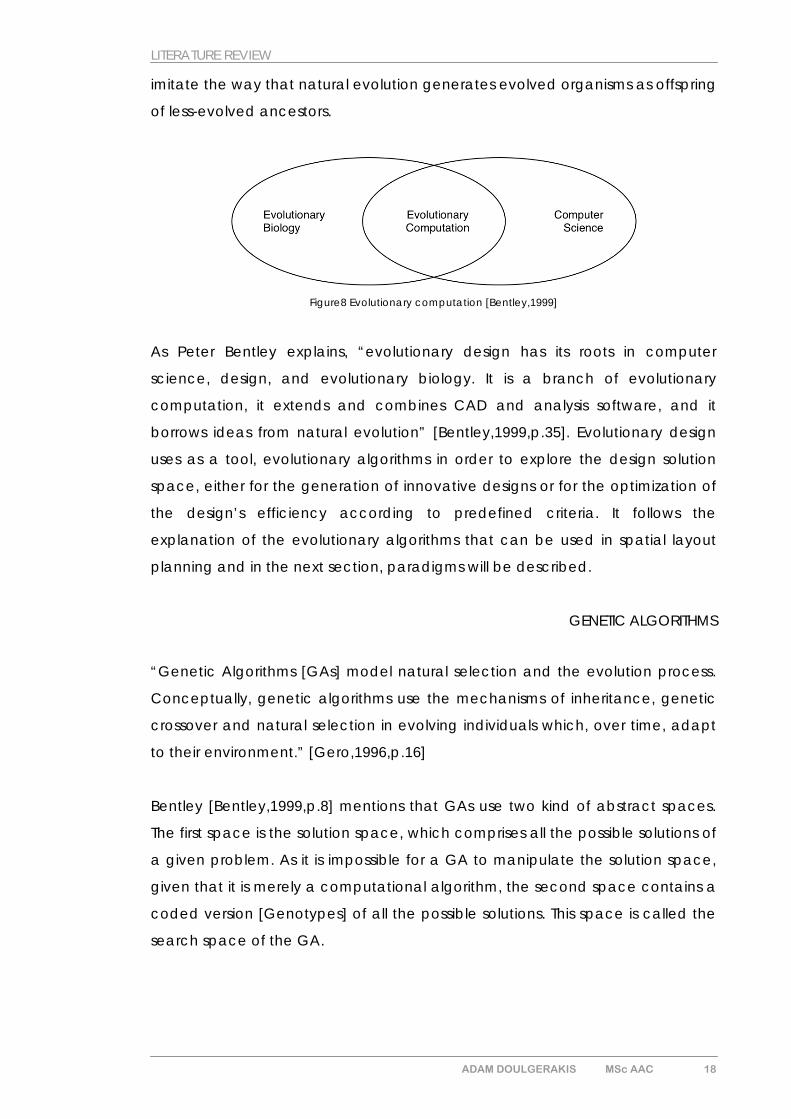
Figure9 Search space and solution space [Bentley,1999]
The genotype is a set of coded parameters that describe the phenotype. These
parameters are called the genes, while the values that the genes can take are
called alleles. The genotype is often represented as a string of values and each
string position corresponds to a single gene.
The efficiency of the algorithm is based on the fact that it is applied to a
population of solutions. The search within the solution space is highly parallel as
each individual explores a different area of that space. “Evolution operates on
no single individual but on entire species.” [Flake,1998, p.340]
The genotypes are then translated to their corresponding phenotypes which
are then evaluated according to the predefined criteria. As Jo and Gero [Jo
and Gero,1998,p.152] comment, the phenotypes [e.g. the organisms per se]
live in the world. Hence, their good or their bad performance depends
exclusively on their physical attributes and not on their chromosomes.
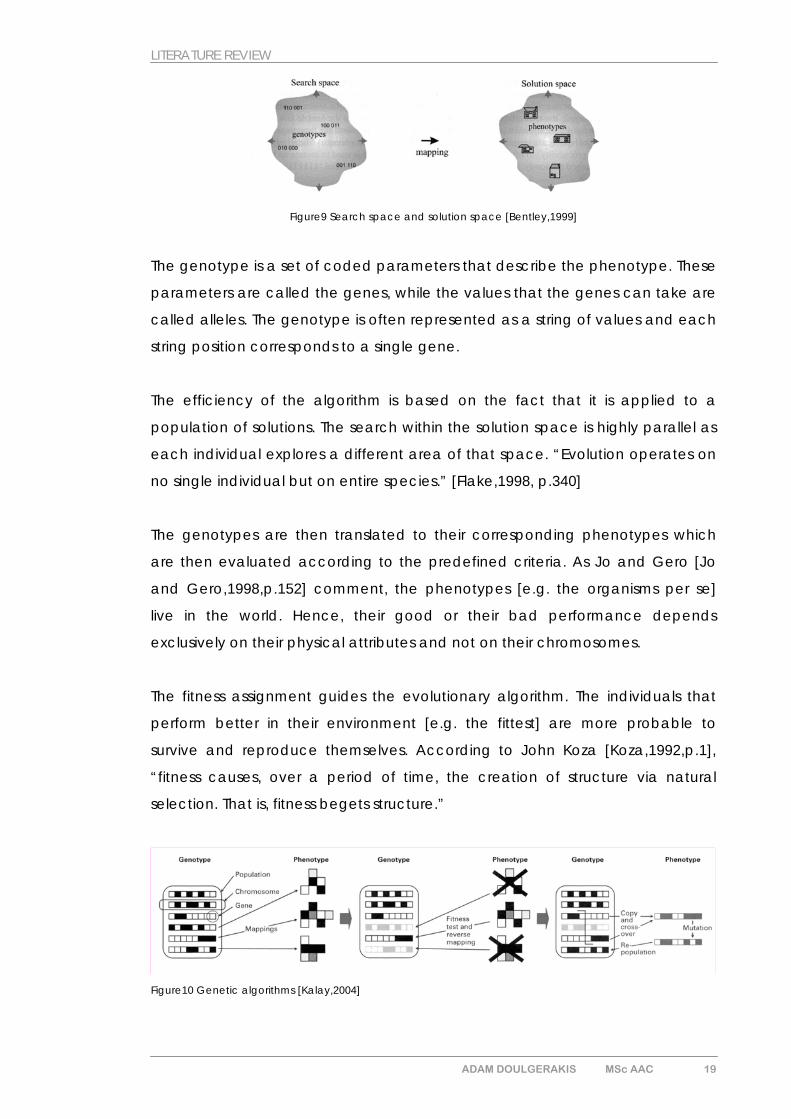
The fitness assignment guides the evolutionary algorithm. The individuals that
perform better in their environment [e.g. the fittest] are more probable to
survive and reproduce themselves. According to John Koza [Koza,1992,p.1],
“fitness causes, over a period of time, the creation of structure via natural
selection. That is, fitness begets structure.”
Figure10 Genetic algorithms [Kalay,2004]
ADAM DOULGERAKIS MSc AAC 19
LITERATURE REVIEW
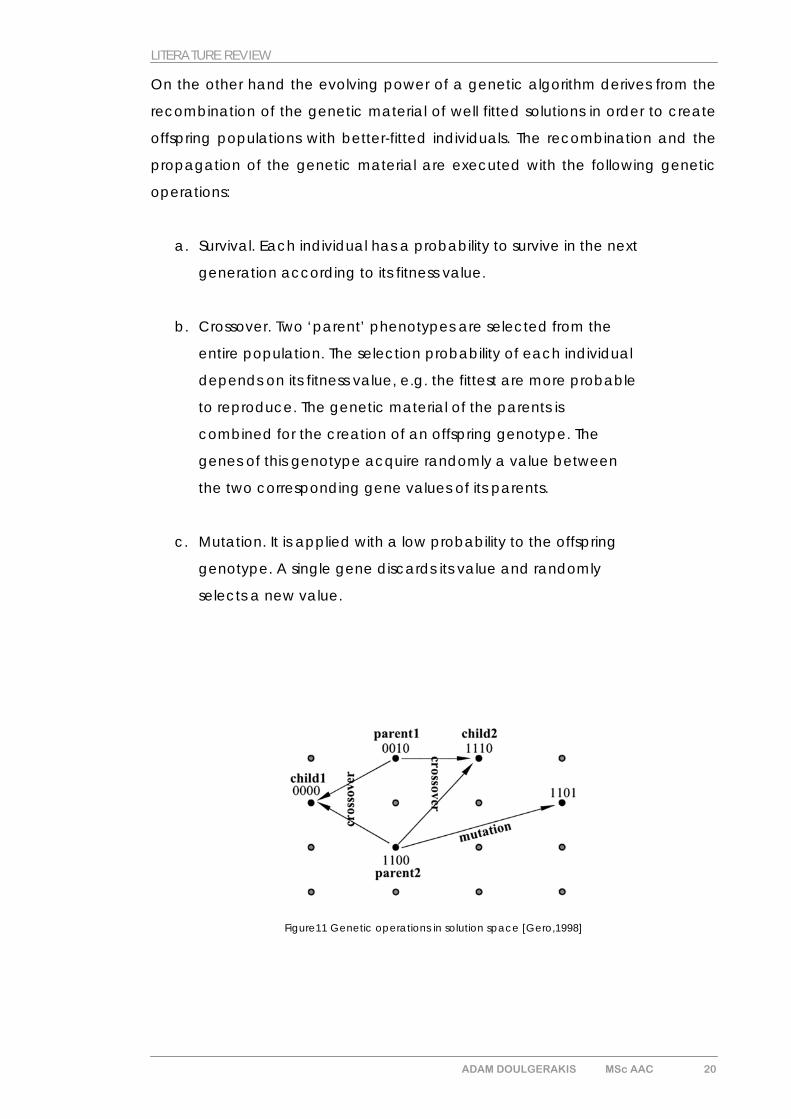
On the other hand the evolving power of a genetic algorithm derives from the
recombination of the genetic material of well fitted solutions in order to create
offspring populations with better-fitted individuals. The recombination and the
propagation of the genetic material are executed with the following genetic
operations:
a. Survival. Each individual has a probability to survive in the next
generation according to its fitness value.
b. Crossover. Two ‘parent’ phenotypes are selected from the
entire population. The selection probability of each individual
depends on its fitness value, e.g. the fittest are more probable
to reproduce. The genetic material of the parents is
combined for the creation of an offspring genotype. The
genes of this genotype acquire randomly a value between
the two corresponding gene values of its parents.
c. Mutation. It is applied with a low probability to the offspring
genotype. A single gene discards its value and randomly
selects a new value.
Figure11 Genetic operations in solution space [Gero,1998]
ADAM DOULGERAKIS MSc AAC 20
LITERATURE REVIEW
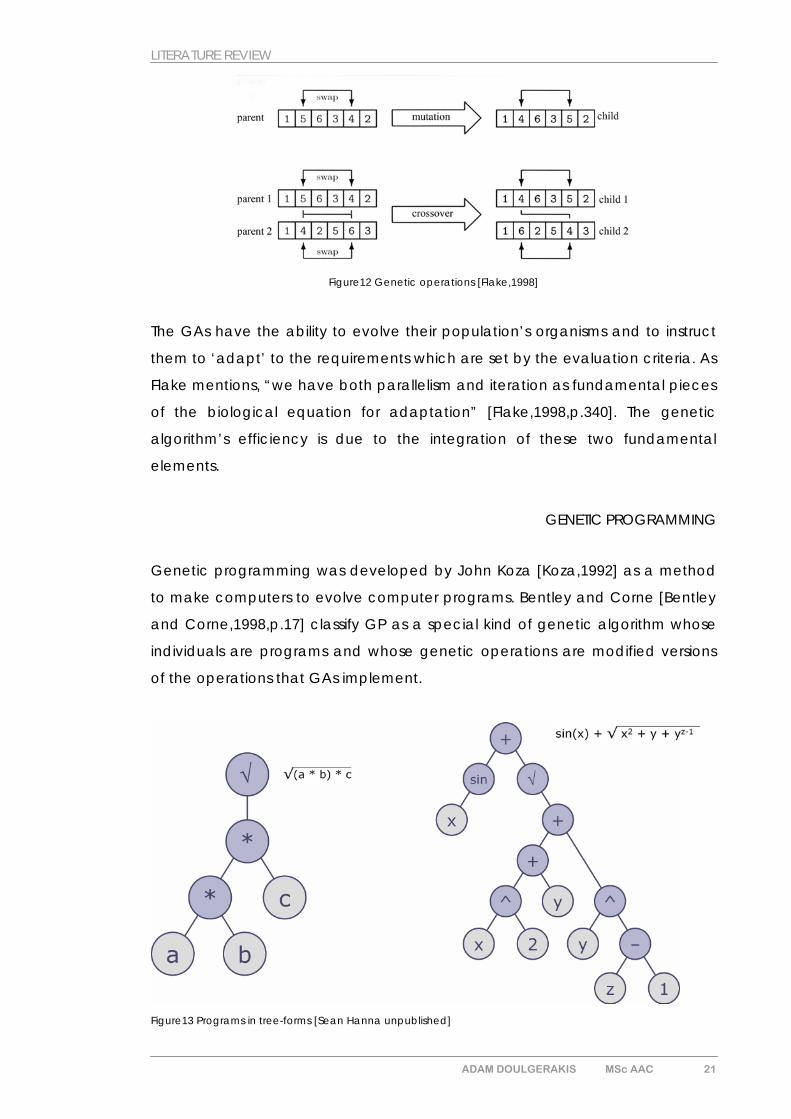
Figure12 Genetic operations [Flake,1998]
The GAs have the ability to evolve their population’s organisms and to instruct
them to ‘adapt’ to the requirements which are set by the evaluation criteria. As
Flake mentions, “we have both parallelism and iteration as fundamental pieces
of the biological equation for adaptation” [Flake,1998,p.340]. The genetic
algorithm’s efficiency is due to the integration of these two fundamental
elements.
GENETIC PROGRAMMING
Genetic programming was developed by John Koza [Koza,1992] as a method
to make computers to evolve computer programs. Bentley and Corne [Bentley
and Corne,1998,p.17] classify GP as a special kind of genetic algorithm whose
individuals are programs and whose genetic operations are modified versions
of the operations that GAs implement.
Figure13 Programs in tree-forms [Sean Hanna unpublished]
ADAM DOULGERAKIS MSc AAC 21
LITERATURE REVIEW
Koza [Koza,1992,p.2] stresses out that in order to get computers to solve specific
problems, the structure of a computer program is required.
Such a structure can:
a. perform operations in a hierarchical way,
b. perform alternative computations depending on the
outcome of intermediate calculations,
c. perform iterations and recursions,
d. perform computations on variables of many different types,
and
e. define intermediate values and subprograms which can be
subsequently reused.
The major difference between GAs and GP is that in the second case the
solution to the problem does not have a predefined length and structure. In
GAs the genotype of an individual constitutes a fixed length string of genes that
include all the necessary information in order to describe each solution. “The
initial selection of string length limits in advance the number of internal states of
the system and limits what the system can learn” [Koza,1992,p.66]. Within the
context of genetic programming “the size, the shape and the structural
complexity of the solution should emerge during the problem-solving process as
a result of the demands of the problem. The size, shape, and structural
complexity should be part of the answer produced by a problem solving
technique- not part of the question” [Koza,1992,p.2].
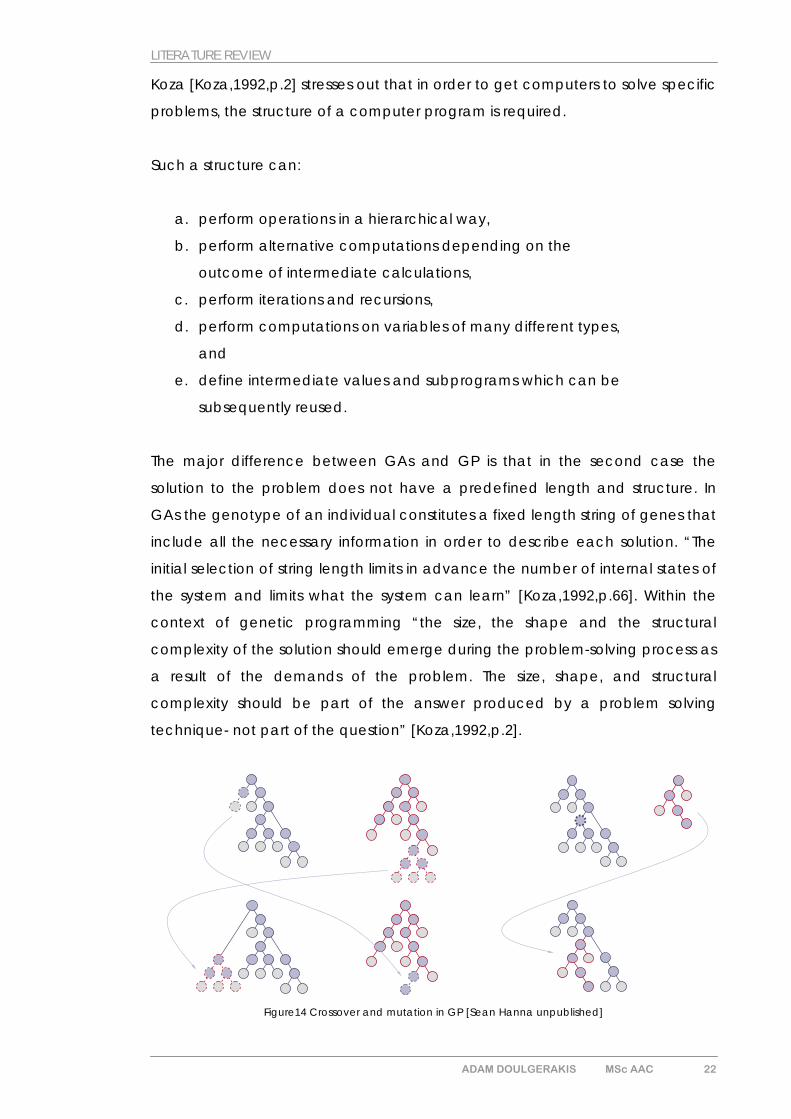
Figure14 Crossover and mutation in GP [Sean Hanna unpublished]
ADAM DOULGERAKIS MSc AAC 22
LITERATURE REVIEW
Since a chromosome of a computer program can be of variable length and
complexity, a specific solution representation is needed in order to be able to
accept the genetic operations, crossover and mutation. Koza [Koza,1992]
proposed the arrangement of the solutions in hierarchical tree-structures with
intermediate and terminal nodes. The crossover operation selects randomly a
node in each parent genotype and swaps their branches. As for mutation, GP
selects randomly a node in a tree-structure, and replaces the sub-tree whose
root is that node with a new randomly generated sub-tree.
GENETIC ALGORITHMS vs. GENETIC PROGRAMMING
In summary, GP and GAs are both divisions of the evolutionary algorithms and
they execute similar heuristics in the solution’s induction process. However, their
major difference is the kind of solutions that they are involved with. GAs
articulate the problem in terms of values required, whereas GP focus on rules
describing a method to solve the problem. GAs explore the search space
defined by a specific problem in search of a specific optimal solution [data].
On the other hand, GP explores the search space defined by a general set of
problems in search of a general solution [algorithm] that responds to the
requirement set by such problems.
Hence, the selection for the implementation of the appropriate algorithm,
either GAs or GP, depends on the objectives of the research. When a problem
is explicitly defined as a single case problem and the desired result is the final
values of the variables, the GAs should be implemented. Whereas, when the
input that defines a specific problem [e.g. environment values and objectives]
is unknown, GP can provide a general set of instructions [algorithm] that solve
adequately such problems.
ADAM DOULGERAKIS MSc AAC 23
LITERATURE REVIEW
1.5 RELATED WORK FOR THE SPACE LAYOUT PLANNING
1.5.1 CONSTRUCTIVE APPROACH
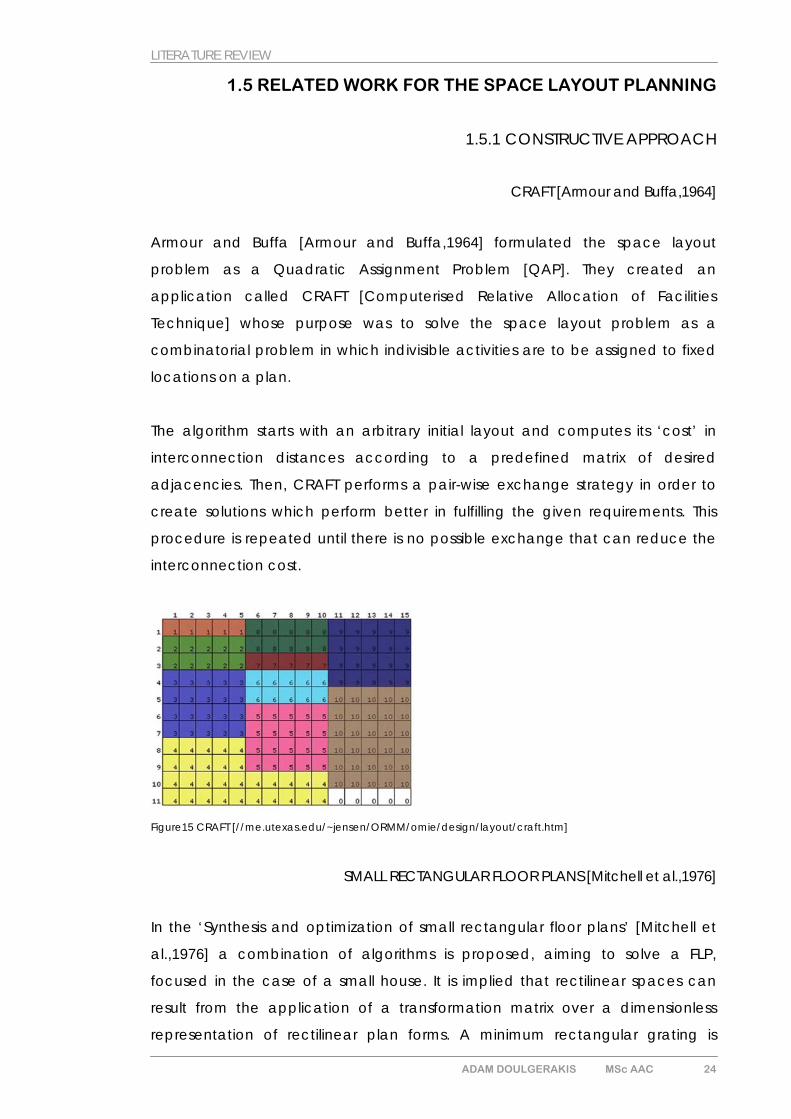
CRAFT [Armour and Buffa,1964]
Armour and Buffa [Armour and Buffa,1964] formulated the space layout
problem as a Quadratic Assignment Problem [QAP]. They created an
application called CRAFT [Computerised Relative Allocation of Facilities
Technique] whose purpose was to solve the space layout problem as a
combinatorial problem in which indivisible activities are to be assigned to fixed
locations on a plan.
The algorithm starts with an arbitrary initial layout and computes its ‘cost’ in
interconnection distances according to a predefined matrix of desired
adjacencies. Then, CRAFT performs a pair-wise exchange strategy in order to
create solutions which perform better in fulfilling the given requirements. This
procedure is repeated until there is no possible exchange that can reduce the
interconnection cost.
Figure15 CRAFT [//me.utexas.edu/~jensen/ORMM/omie/design/layout/craft.htm]
SMALL RECTANGULAR FLOOR PLANS [Mitchell et al.,1976]
In the ‘Synthesis and optimization of small rectangular floor plans’ [Mitchell et
al.,1976] a combination of algorithms is proposed, aiming to solve a FLP,
focused in the case of a small house. It is implied that rectilinear spaces can
result from the application of a transformation matrix over a dimensionless
representation of rectilinear plan forms. A minimum rectangular grating is
ADAM DOULGERAKIS MSc AAC 24
LITERATURE REVIEW
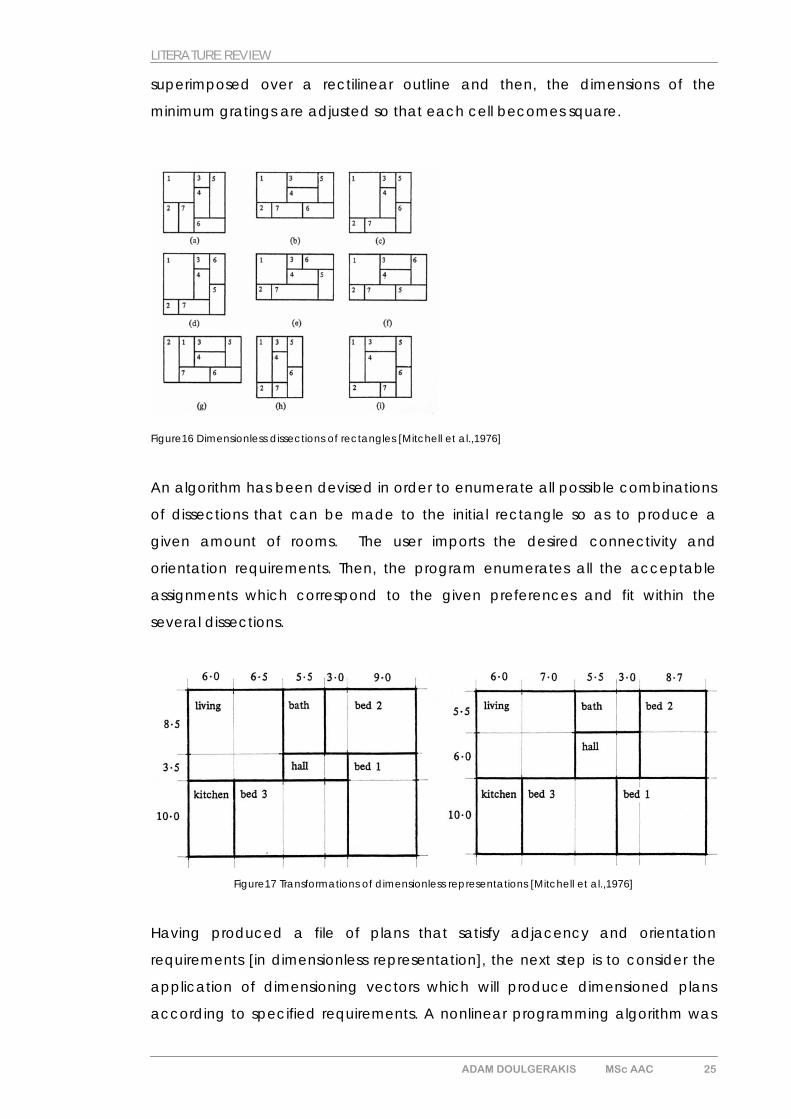
superimposed over a rectilinear outline and then, the dimensions of the
minimum gratings are adjusted so that each cell becomes square.
Figure16 Dimensionless dissections of rectangles [Mitchell et al.,1976]
An algorithm has been devised in order to enumerate all possible combinations
of dissections that can be made to the initial rectangle so as to produce a
given amount of rooms. The user imports the desired connectivity and
orientation requirements. Then, the program enumerates all the acceptable
assignments which correspond to the given preferences and fit within the
several dissections.
Figure17 Transformations of dimensionless representations [Mitchell et al.,1976]
Having produced a file of plans that satisfy adjacency and orientation
requirements [in dimensionless representation], the next step is to consider the
application of dimensioning vectors which will produce dimensioned plans
according to specified requirements. A nonlinear programming algorithm was
ADAM DOULGERAKIS MSc AAC 25
LITERATURE REVIEW
applied to each of the plan arrangements generated at the previous step in
order to discover the dimensioning vectors which optimise the objective subject
to the defined constraints. Only a small amount of arrangements can yield
feasible solutions which constitute the final outcome of the method.
SITEWALKER [Doulgerakis,2007]
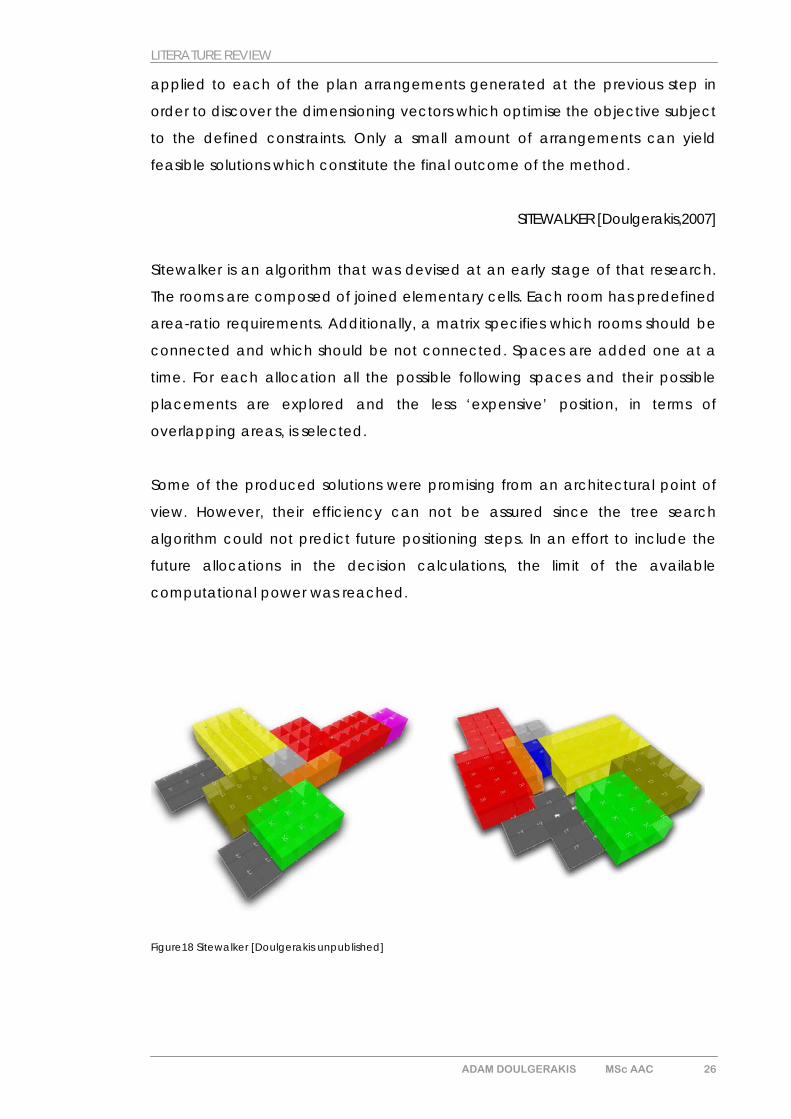
Sitewalker is an algorithm that was devised at an early stage of that research.
The rooms are composed of joined elementary cells. Each room has predefined
area-ratio requirements. Additionally, a matrix specifies which rooms should be
connected and which should be not connected. Spaces are added one at a
time. For each allocation all the possible following spaces and their possible
placements are explored and the less ‘expensive’ position, in terms of
overlapping areas, is selected.
Some of the produced solutions were promising from an architectural point of
view. However, their efficiency can not be assured since the tree search
algorithm could not predict future positioning steps. In an effort to include the
future allocations in the decision calculations, the limit of the available
computational power was reached.
Figure18 Sitewalker [Doulgerakis unpublished]
ADAM DOULGERAKIS MSc AAC 26
LITERATURE REVIEW
1.5.2 EVOLUTIONARY APPROACH
EDGE [Jo and Gero,1998]
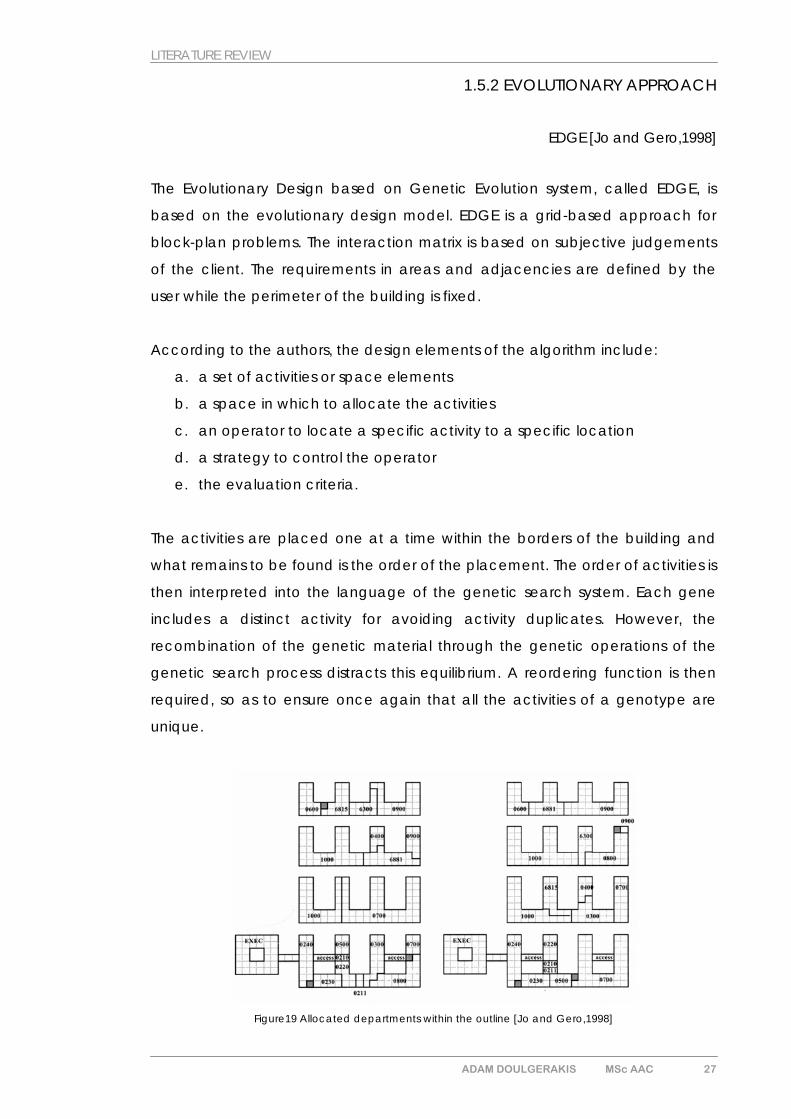
The Evolutionary Design based on Genetic Evolution system, called EDGE, is
based on the evolutionary design model. EDGE is a grid-based approach for
block-plan problems. The interaction matrix is based on subjective judgements
of the client. The requirements in areas and adjacencies are defined by the
user while the perimeter of the building is fixed.
According to the authors, the design elements of the algorithm include:
a. a set of activities or space elements
b. a space in which to allocate the activities
c. an operator to locate a specific activity to a specific location
d. a strategy to control the operator
e. the evaluation criteria.
The activities are placed one at a time within the borders of the building and
what remains to be found is the order of the placement. The order of activities is
then interpreted into the language of the genetic search system. Each gene
includes a distinct activity for avoiding activity duplicates. However, the
recombination of the genetic material through the genetic operations of the
genetic search process distracts this equilibrium. A reordering function is then
required, so as to ensure once again that all the activities of a genotype are
unique.
Figure19 Allocated departments within the outline [Jo and Gero,1998]
ADAM DOULGERAKIS MSc AAC 27
LITERATURE REVIEW
The system does not converge to a single solution as it is usually the case in
evolutionary design; alternatively it provides a series of promising solutions. Then,
the user chooses a solution among them.
THE GENERATION OF FORM [Rosenman,1996]
The structure of the designing elements in Rosenman’s model is hierarchical. A
house is considered to be composed out of zones. Zones are considered to be
composed out of rooms which are considered to be composed out of space
units. Rosenman’s work is a grid-based approach for block-plan problems. Each
room is composed of a number of space units. At the room level, the
component unit is a fundamental unit of space. At the zone level, the
component unit is a room and at the house level the component unit is the
zone.
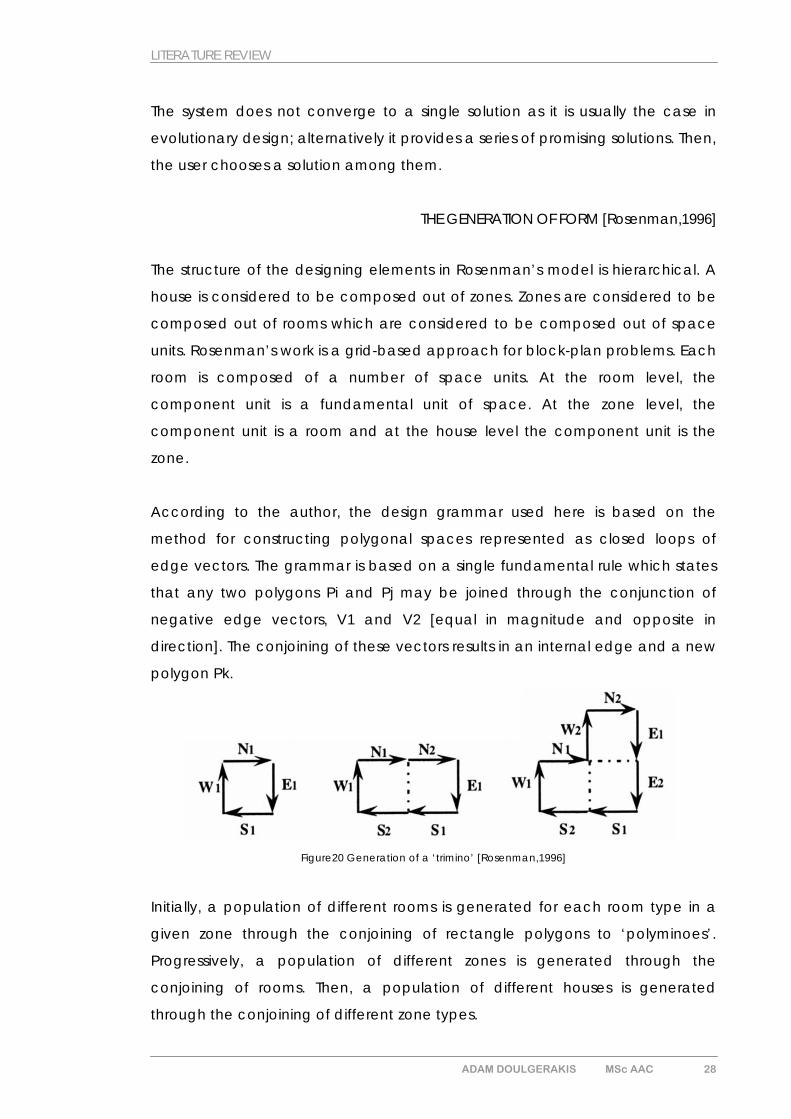
According to the author, the design grammar used here is based on the
method for constructing polygonal spaces represented as closed loops of
edge vectors. The grammar is based on a single fundamental rule which states
that any two polygons Pi and Pj may be joined through the conjunction of
negative edge vectors, V1 and V2 [equal in magnitude and opposite in
direction]. The conjoining of these vectors results in an internal edge and a new
polygon Pk.
Figure20 Generation of a ‘trimino’ [Rosenman,1996]
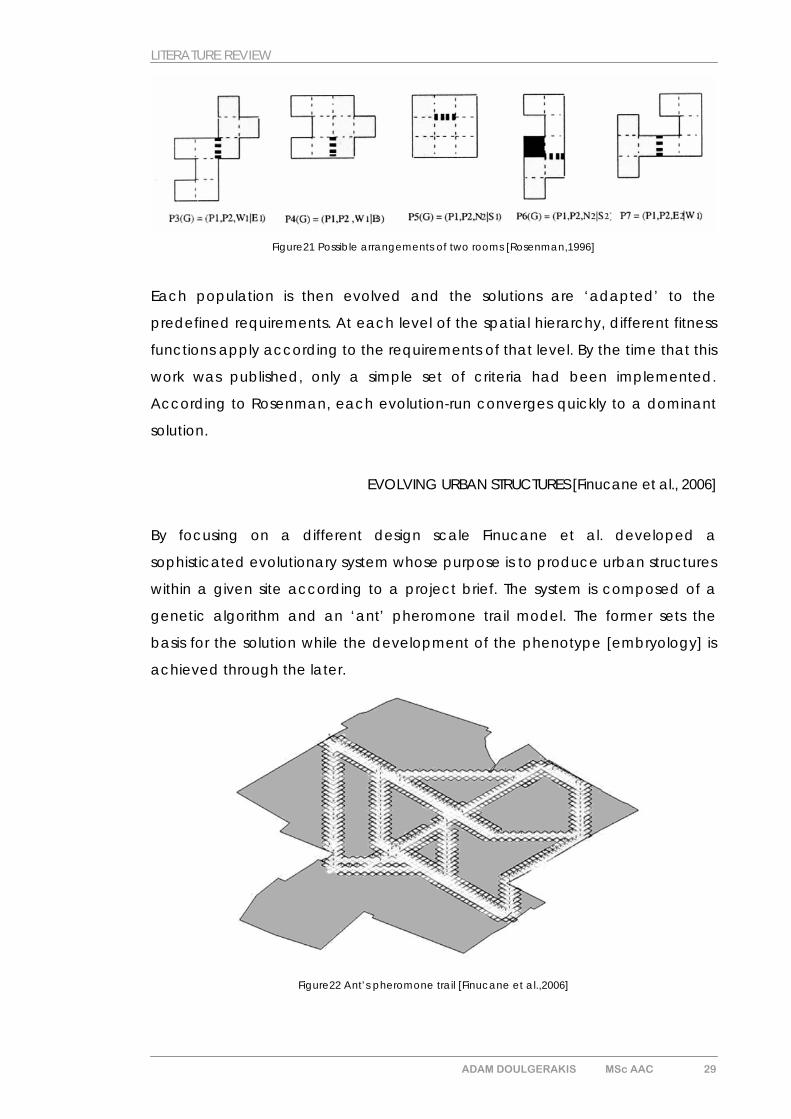
Initially, a population of different rooms is generated for each room type in a
given zone through the conjoining of rectangle polygons to ‘polyminoes’.
Progressively, a population of different zones is generated through the
conjoining of rooms. Then, a population of different houses is generated
through the conjoining of different zone types.
ADAM DOULGERAKIS MSc AAC 28
LITERATURE REVIEW
Figure21 Possible arrangements of two rooms [Rosenman,1996]
Each population is then evolved and the solutions are ‘adapted’ to the
predefined requirements. At each level of the spatial hierarchy, different fitness
functions apply according to the requirements of that level. By the time that this
work was published, only a simple set of criteria had been implemented.
According to Rosenman, each evolution-run converges quickly to a dominant
solution.
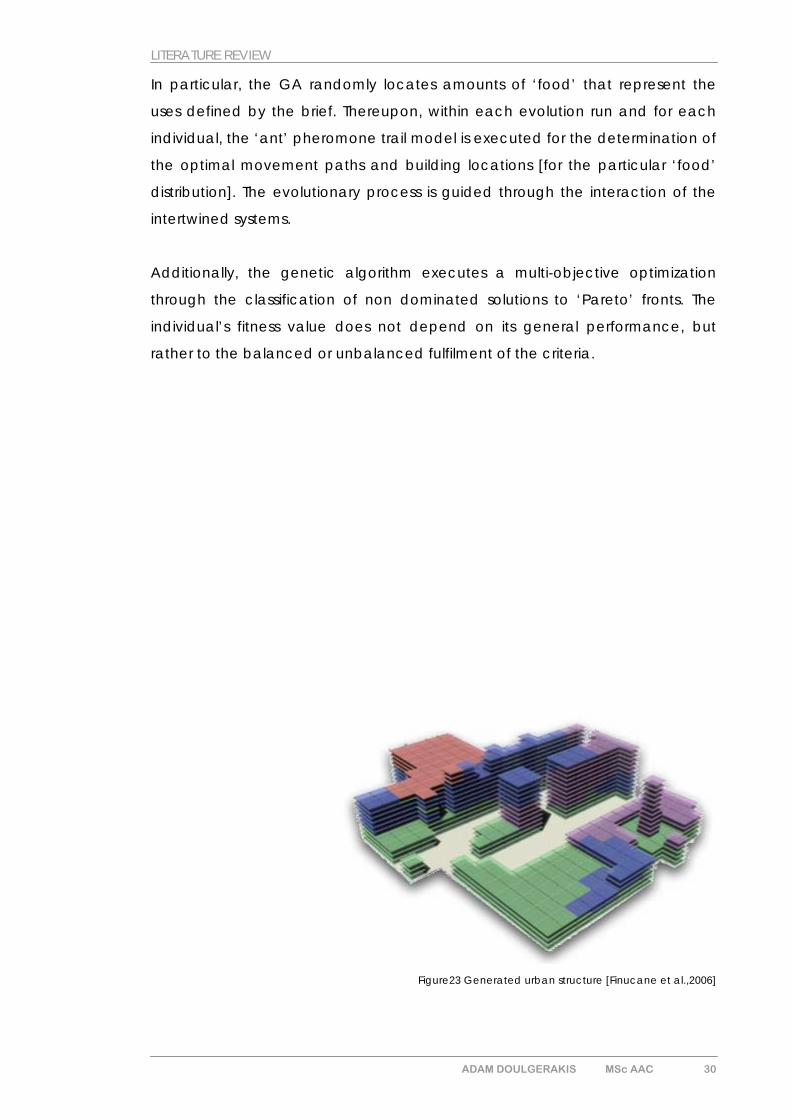
EVOLVING URBAN STRUCTURES [Finucane et al., 2006]
By focusing on a different design scale Finucane et al. developed a
sophisticated evolutionary system whose purpose is to produce urban structures
within a given site according to a project brief. The system is composed of a
genetic algorithm and an ‘ant’ pheromone trail model. The former sets the
basis for the solution while the development of the phenotype [embryology] is
achieved through the later.
Figure22 Ant’s pheromone trail [Finucane et al.,2006]
ADAM DOULGERAKIS MSc AAC 29
LITERATURE REVIEW
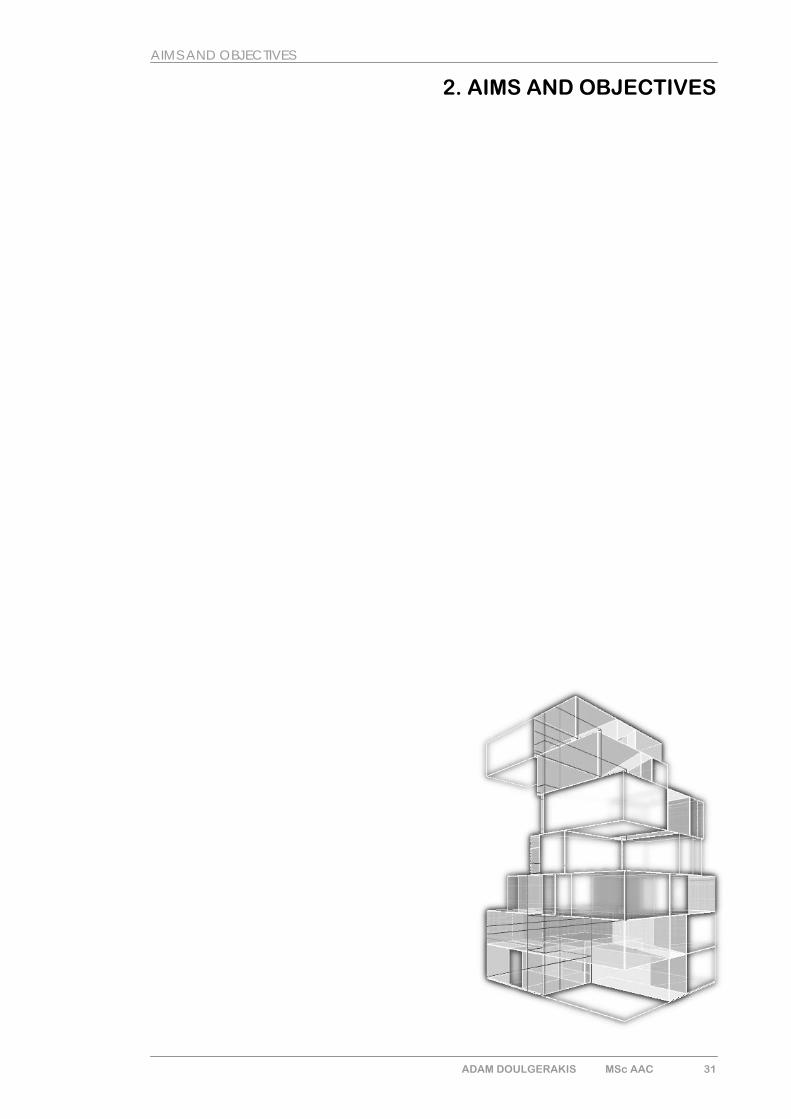
In particular, the GA randomly locates amounts of ‘food’ that represent the
uses defined by the brief. Thereupon, within each evolution run and for each
individual, the ‘ant’ pheromone trail model is executed for the determination of
the optimal movement paths and building locations [for the particular ‘food’
distribution]. The evolutionary process is guided through the interaction of the
intertwined systems.
Additionally, the genetic algorithm executes a multi-objective optimization
through the classification of non dominated solutions to ‘Pareto’ fronts. The
individual’s fitness value does not depend on its general performance, but
rather to the balanced or unbalanced fulfilment of the criteria.
Figure23 Generated urban structure [Finucane et al.,2006]
ADAM DOULGERAKIS MSc AAC 30
AIMS AND OBJECTIVES
2. AIMS AND OBJECTIVES
ADAM DOULGERAKIS MSc AAC 31
AIMS AND OBJECTIVES
Based on the framework that was described in the literature review, an
evolutionary system was created in order to show that a different approach to
the automated layout planning is possible.
This thesis attempts to demonstrate that an efficient evolutionary system, whose
purpose is to generate floor plans, can be driven by a computationally
independent process [embryology] that assigns activities to existing spaces
according to a set of rules [preferences]. These rules can be encoded in terms
of required dimensional attributes as well as permeability graphs. The evolution
of spaces and the assignment process are intertwined in the same system. The
space configuration restrains the movement and the decisions of the ‘assigner’.
Simultaneously, the ‘assigner’ evaluates the resulted allocation of activities and
inducts the evolution of configurations towards the one or the other direction.
Most of the cases presented earlier [see related work section], implement
advanced methods in order to find optimal solutions in the problem of assigning
a set of activities within a plan. However, they don’t consider the generative
power that the cultural and social structures have over the formation of the
built environment.
As it is previously mentioned, Hillier and Hanson [Hanson,1998 and Hillier and
Hanson,1984] stress out that there is an underlying social structure that has the
role of a ‘genotype’ in the generation of buildings. Different buildings have
different layouts because either they host different sets of activities, or the
allocation of their activities is inducted by different cultural backgrounds. In
both cases, the needs in the implementation of control and power over the
given set of activities form a genotypical set of instructions.
In this thesis it is argued that this very set of instructions can be used as the
driving force within an evolutionary process in order to direct the evolution
towards solutions [e.g. spatial configurations] that can host a set of activities in
the same general way that a particular type of buildings already does. It is an
effort to create a generative system whose generative power is based on the
way that societies have inducted the evolution of their environments.
ADAM DOULGERAKIS MSc AAC 32
AIMS AND OBJECTIVES
For the creation of the aforementioned system, the PROCESSING programming
language was used. The system was implemented within the context of a real
example, namely the typical multi-storey residential building in the centre of
Athens. The system’s efficiency will be tested against a conventional Genetic
Programming algorithm whose activities are randomly assigned during the
generation of the individuals.
ADAM DOULGERAKIS MSc AAC 33
METHODOLOGY METHODOLOGY
ADAM DOULGERAKIS MSc AAC 34
3. METHODOLOGY
ADAM DOULGERAKIS MSc AAC 34
METHODOLOGY
3.1 SPACE AS PROGRAM
Architectural design nowadays strives to adopt the methodologies and the
tools of computer science. Some of the uses of computation in architecture
include analysis, reproduction, generation and optimization of design artefacts.
Regardless of the reason for which one implements computation in the general
field of architecture, there is a common basis that is required. Since
computation processes information in mathematical terms, there is a need to
describe space and spatial attributes in terms of numerical values.
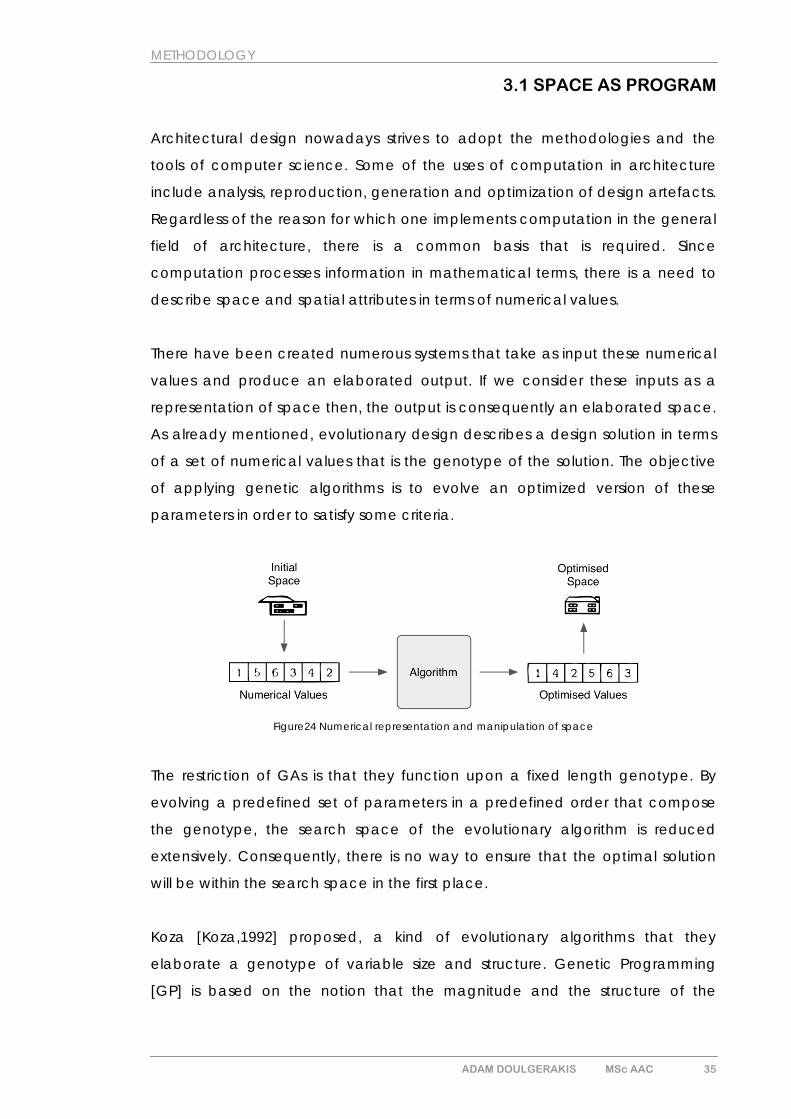
There have been created numerous systems that take as input these numerical
values and produce an elaborated output. If we consider these inputs as a
representation of space then, the output is consequently an elaborated space.
As already mentioned, evolutionary design describes a design solution in terms
of a set of numerical values that is the genotype of the solution. The objective
of applying genetic algorithms is to evolve an optimized version of these
parameters in order to satisfy some criteria.
Figure24 Numerical representation and manipulation of space
The restriction of GAs is that they function upon a fixed length genotype. By
evolving a predefined set of parameters in a predefined order that compose
the genotype, the search space of the evolutionary algorithm is reduced
extensively. Consequently, there is no way to ensure that the optimal solution
will be within the search space in the first place.
Koza [Koza,1992] proposed, a kind of evolutionary algorithms that they
elaborate a genotype of variable size and structure. Genetic Programming
[GP] is based on the notion that the magnitude and the structure of the
ADAM DOULGERAKIS MSc AAC 35
METHODOLOGY
attributes in the optimal solution is part of the answer and not part of the
question [Koza,1992, p.2].
A very interesting point that Koza [Koza,1992,p.3] stresses out regarding genetic
programming is that a wide variety of seemingly different problems from
different fields can be recast as requiring the discovery of a computer program
that produces some desired output when there is an appropriate evaluation
method. Hence, several different problems can be translated into problems of
“program induction”.
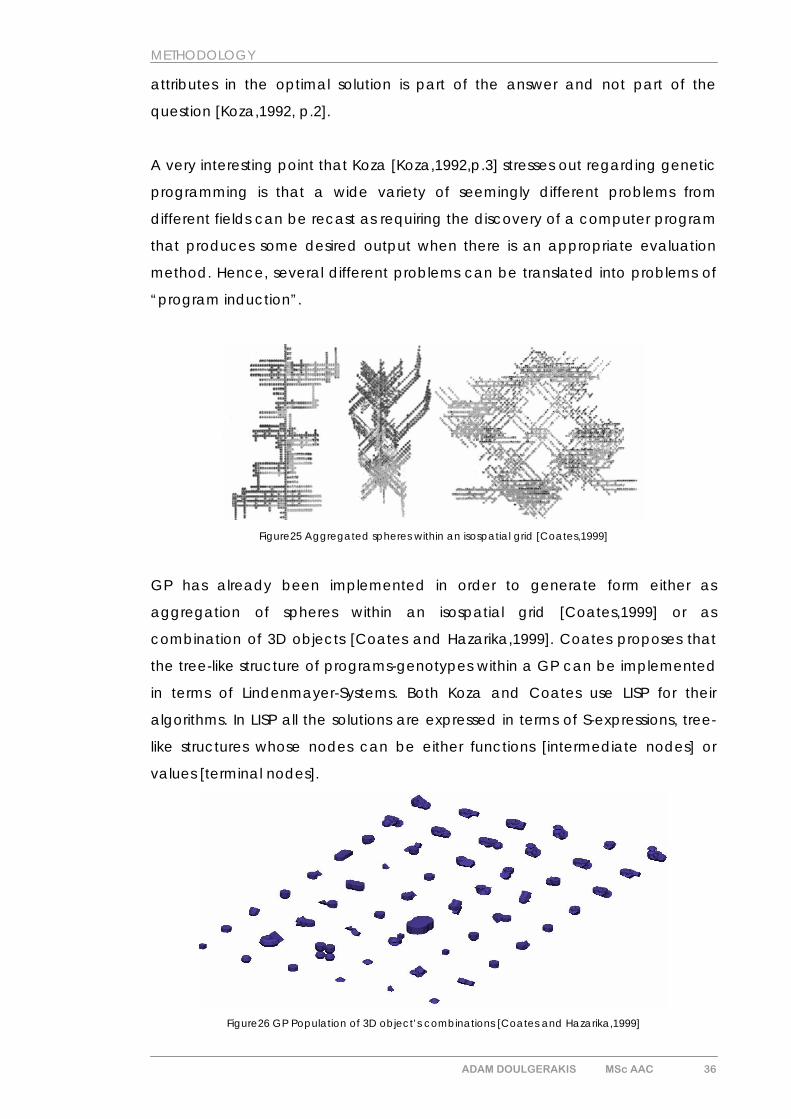
Figure25 Aggregated spheres within an isospatial grid [Coates,1999]
GP has already been implemented in order to generate form either as
aggregation of spheres within an isospatial grid [Coates,1999] or as
combination of 3D objects [Coates and Hazarika,1999]. Coates proposes that
the tree-like structure of programs-genotypes within a GP can be implemented
in terms of Lindenmayer-Systems. Both Koza and Coates use LISP for their
algorithms. In LISP all the solutions are expressed in terms of S-expressions, tree-
like structures whose nodes can be either functions [intermediate nodes] or
values [terminal nodes].
Figure26 GP Population of 3D object’s combinations [Coates and Hazarika,1999]
ADAM DOULGERAKIS MSc AAC 36
METHODOLOGY
3.2 STRUCTURE OF THE GENOTYPE
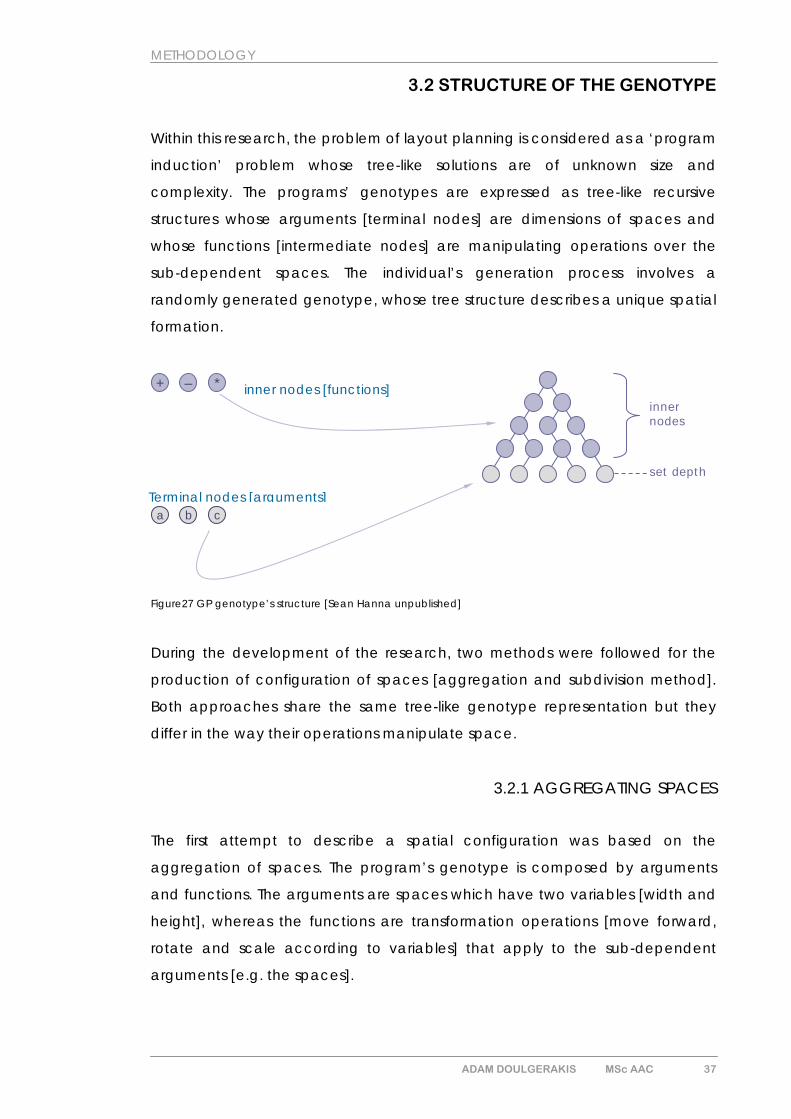
Within this research, the problem of layout planning is considered as a ‘program
induction’ problem whose tree-like solutions are of unknown size and
complexity. The programs’ genotypes are expressed as tree-like recursive
structures whose arguments [terminal nodes] are dimensions of spaces and
whose functions [intermediate nodes] are manipulating operations over the
sub-dependent spaces. The individual’s generation process involves a
randomly generated genotype, whose tree structure describes a unique spatial
formation.
a cb
+ *–innernodes
set depth
inner nodes [functions]
Terminal nodes [arguments]
Figure27 GP genotype’s structure [Sean Hanna unpublished]
During the development of the research, two methods were followed for the
production of configuration of spaces [aggregation and subdivision method].
Both approaches share the same tree-like genotype representation but they
differ in the way their operations manipulate space.
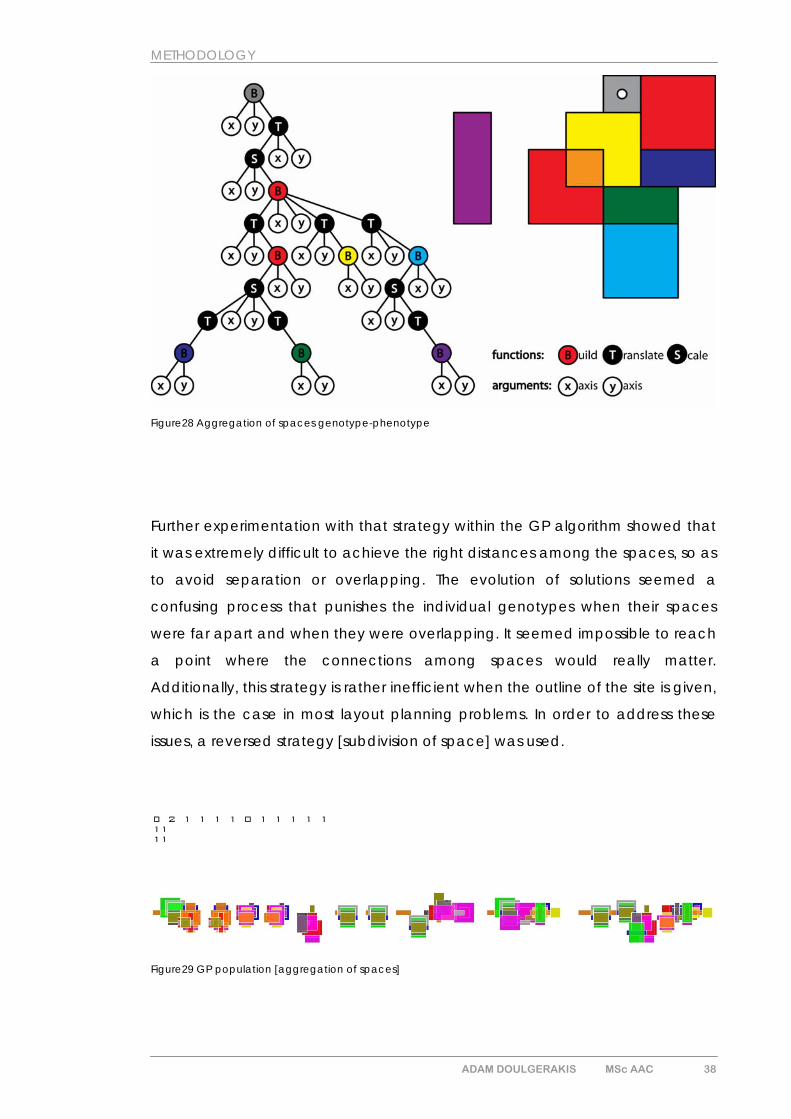
3.2.1 AGGREGATING SPACES
The first attempt to describe a spatial configuration was based on the
aggregation of spaces. The program’s genotype is composed by arguments
and functions. The arguments are spaces which have two variables [width and
height], whereas the functions are transformation operations [move forward,
rotate and scale according to variables] that apply to the sub-dependent
arguments [e.g. the spaces].
ADAM DOULGERAKIS MSc AAC 37
METHODOLOGY
Figure28 Aggregation of spaces genotype-phenotype
Further experimentation with that strategy within the GP algorithm showed that
it was extremely difficult to achieve the right distances among the spaces, so as
to avoid separation or overlapping. The evolution of solutions seemed a
confusing process that punishes the individual genotypes when their spaces
were far apart and when they were overlapping. It seemed impossible to reach
a point where the connections among spaces would really matter.
Additionally, this strategy is rather inefficient when the outline of the site is given,
which is the case in most layout planning problems. In order to address these
issues, a reversed strategy [subdivision of space] was used.
Figure29 GP population [aggregation of spaces]
ADAM DOULGERAKIS MSc AAC 38
METHODOLOGY
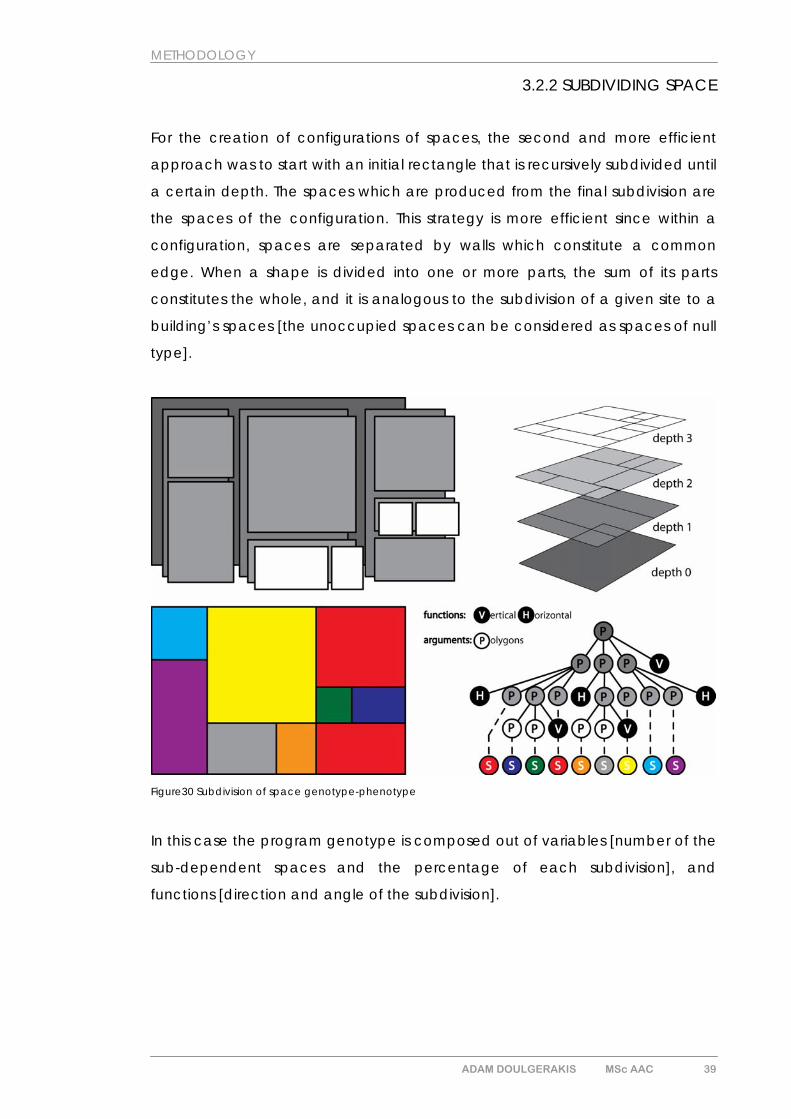
3.2.2 SUBDIVIDING SPACE
For the creation of configurations of spaces, the second and more efficient
approach was to start with an initial rectangle that is recursively subdivided until
a certain depth. The spaces which are produced from the final subdivision are
the spaces of the configuration. This strategy is more efficient since within a
configuration, spaces are separated by walls which constitute a common
edge. When a shape is divided into one or more parts, the sum of its parts
constitutes the whole, and it is analogous to the subdivision of a given site to a
building’s spaces [the unoccupied spaces can be considered as spaces of null
type].
Figure30 Subdivision of space genotype-phenotype
In this case the program genotype is composed out of variables [number of the
sub-dependent spaces and the percentage of each subdivision], and
functions [direction and angle of the subdivision].
ADAM DOULGERAKIS MSc AAC 39
METHODOLOGY
3.3 MANIPULATION OF GEOMETRY
Since the aforementioned tree-like genotype structure can produce the
required variations in shape and size of solutions, the next step was to find the
way that the tree-structured genotype would describe a configuration of
spaces.
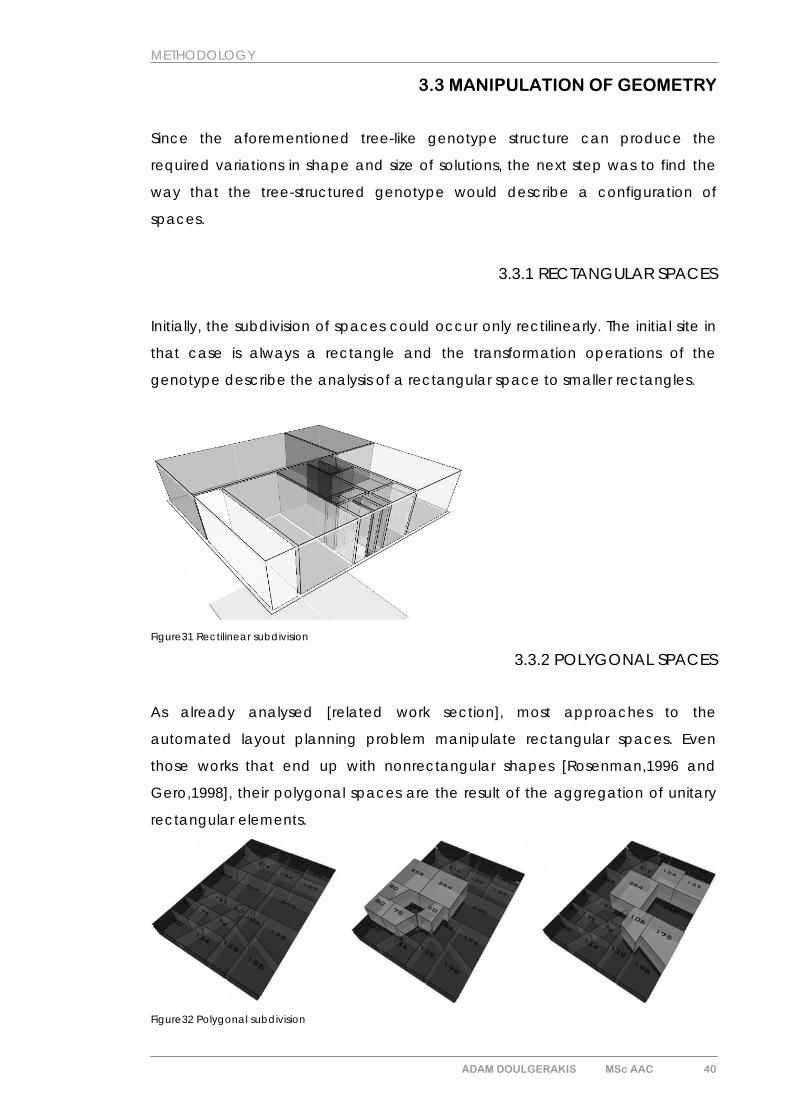
3.3.1 RECTANGULAR SPACES
Initially, the subdivision of spaces could occur only rectilinearly. The initial site in
that case is always a rectangle and the transformation operations of the
genotype describe the analysis of a rectangular space to smaller rectangles.
Figure31 Rectilinear subdivision
3.3.2 POLYGONAL SPACES
As already analysed [related work section], most approaches to the
automated layout planning problem manipulate rectangular spaces. Even
those works that end up with nonrectangular shapes [Rosenman,1996 and
Gero,1998], their polygonal spaces are the result of the aggregation of unitary
rectangular elements.
Figure32 Polygonal subdivision
ADAM DOULGERAKIS MSc AAC 40
METHODOLOGY
Whereas a rectangular space could efficiently be subdivided to rectangular
spaces there was a need for a more flexible strategy that could consider space
as a polygon and not as a rectangle. It is worth mentioning that in this case,
one could easily remain within the borders of rectangular spaces since a
rectangle is a polygon. Nonetheless, by considering space as polygon allows
non-rectangular shapes to be included in the generation of solutions and
widens the search space towards more realistic configurations.
ADAM DOULGERAKIS MSc AAC 41
METHODOLOGY
3.4 EMBRYOLOGY-THE ASSIGNMENT OF ACTIVITIES
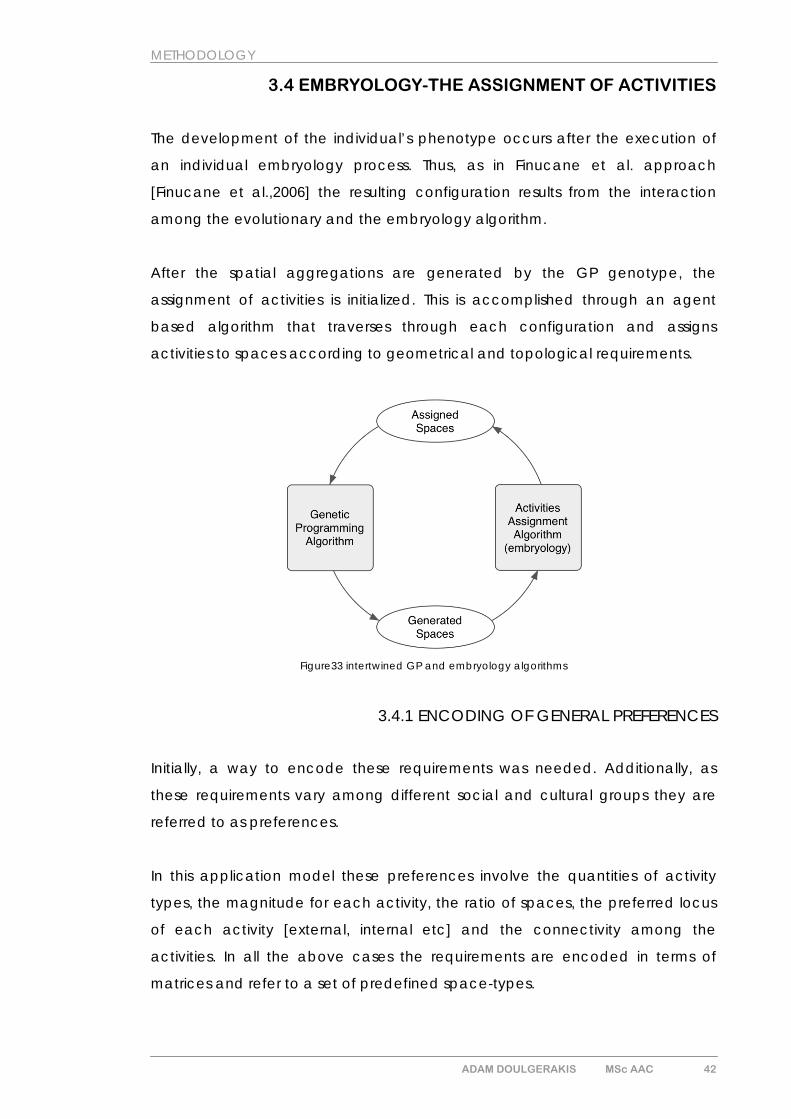
The development of the individual’s phenotype occurs after the execution of
an individual embryology process. Thus, as in Finucane et al. approach
[Finucane et al.,2006] the resulting configuration results from the interaction
among the evolutionary and the embryology algorithm.
After the spatial aggregations are generated by the GP genotype, the
assignment of activities is initialized. This is accomplished through an agent
based algorithm that traverses through each configuration and assigns
activities to spaces according to geometrical and topological requirements.
Figure33 intertwined GP and embryology algorithms
3.4.1 ENCODING OF GENERAL PREFERENCES
Initially, a way to encode these requirements was needed. Additionally, as
these requirements vary among different social and cultural groups they are
referred to as preferences.
In this application model these preferences involve the quantities of activity
types, the magnitude for each activity, the ratio of spaces, the preferred locus
of each activity [external, internal etc] and the connectivity among the
activities. In all the above cases the requirements are encoded in terms of
matrices and refer to a set of predefined space-types.
ADAM DOULGERAKIS MSc AAC 42
METHODOLOGY
These space types are:
a. vertical communication
b. entrance
c. living room
d. corridor
e. wc
f. kitchen
g. bathroom
h. study-room/workshop
i. diner
j. room
k. terrace
l. storage
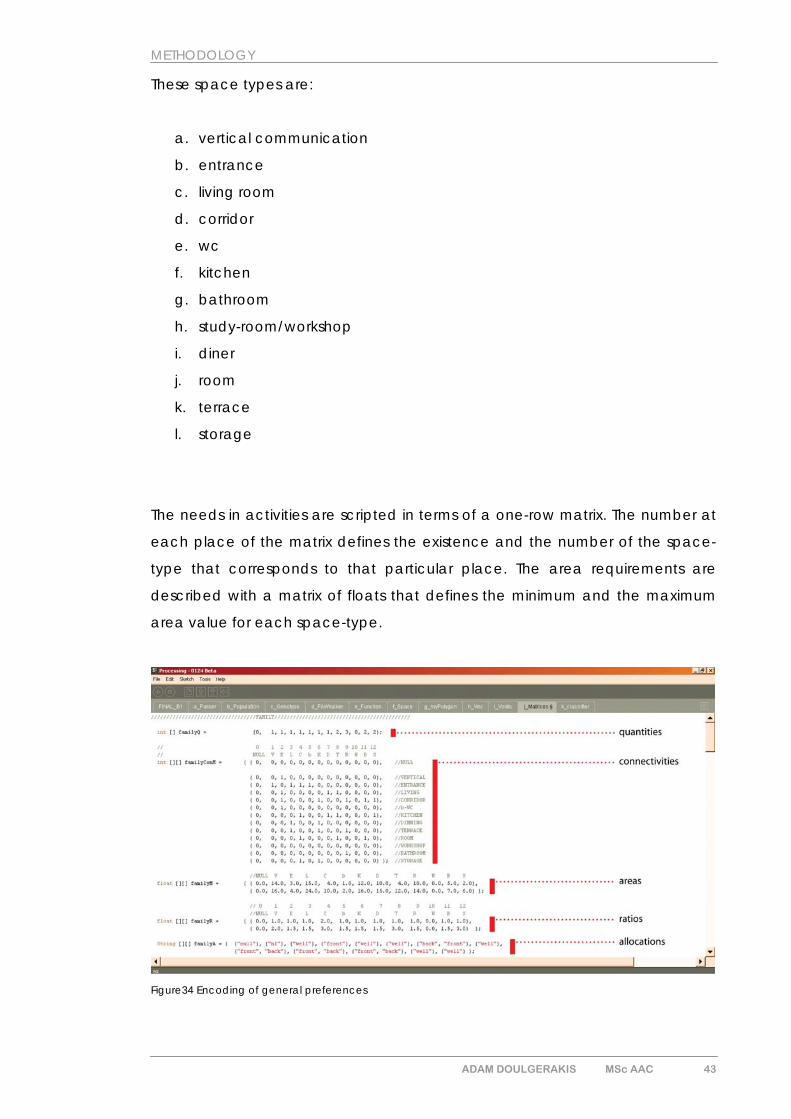
The needs in activities are scripted in terms of a one-row matrix. The number at
each place of the matrix defines the existence and the number of the space-
type that corresponds to that particular place. The area requirements are
described with a matrix of floats that defines the minimum and the maximum
area value for each space-type.
Figure34 Encoding of general preferences
ADAM DOULGERAKIS MSc AAC 43
METHODOLOGY
That is also the case for the ratio requirements. As for the connectivity
requirements, the correspondent matrix is a square matrix that each space-
type corresponds to a row and a column. When an element of the Matrix is 1,
the space-types that correspond to the row and the column should be
connected, whereas if it is 0, a connection is not required. The locus
requirements are described in terms of a matrix that instead of numerical values
contains strings. For each position, these strings inscribe the accepted positions
of the correspondent space-type [for instance front, back, middle].
3.4.2 ENCODING OF GAMMA MAPS
As it is argued in this research, even though the aforementioned requirements
are necessary in order to describe a residential layout, they are not enough.
The social and the cultural forces that generate the particular kind of layouts
can be scripted through the use of justified gamma maps.
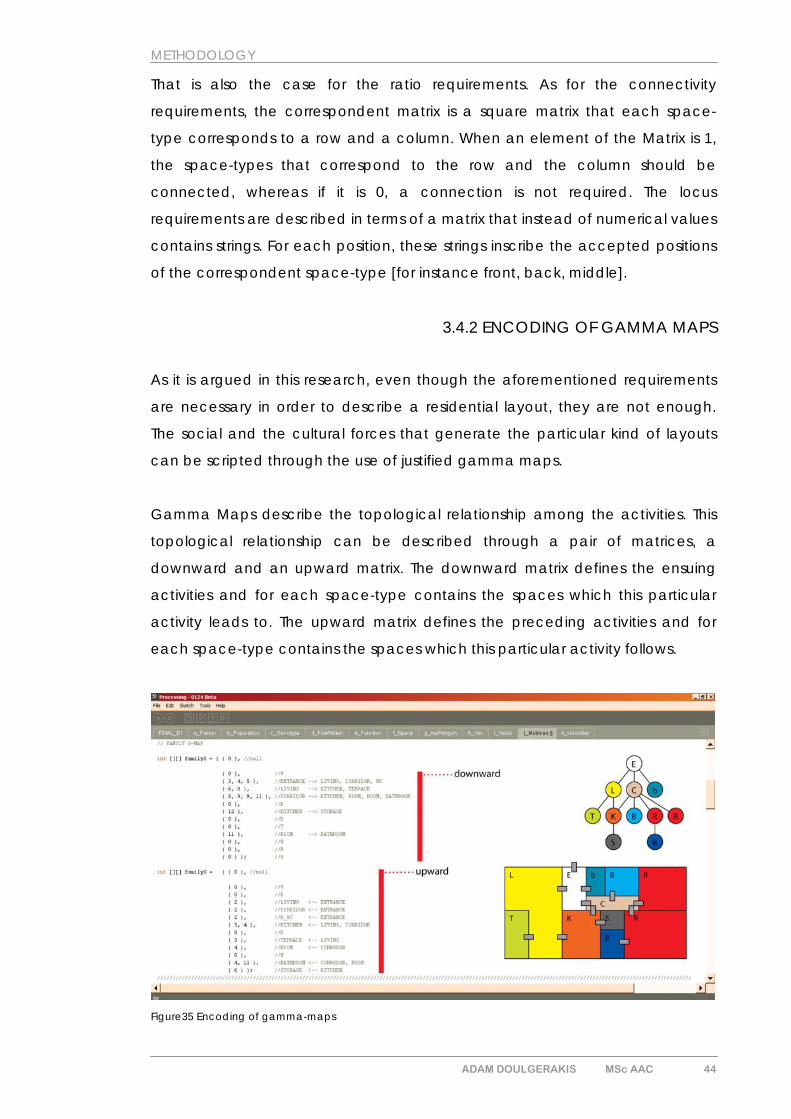
Gamma Maps describe the topological relationship among the activities. This
topological relationship can be described through a pair of matrices, a
downward and an upward matrix. The downward matrix defines the ensuing
activities and for each space-type contains the spaces which this particular
activity leads to. The upward matrix defines the preceding activities and for
each space-type contains the spaces which this particular activity follows.
Figure35 Encoding of gamma-maps
ADAM DOULGERAKIS MSc AAC 44
METHODOLOGY
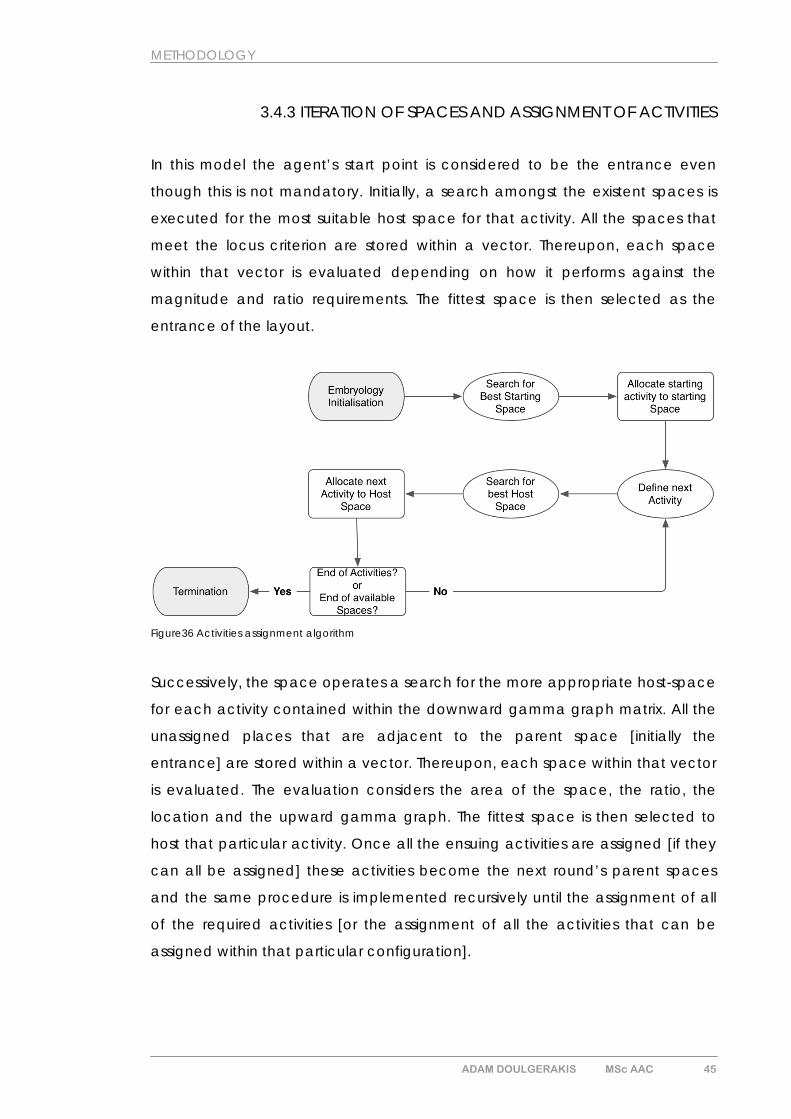
3.4.3 ITERATION OF SPACES AND ASSIGNMENT OF ACTIVITIES
In this model the agent’s start point is considered to be the entrance even
though this is not mandatory. Initially, a search amongst the existent spaces is
executed for the most suitable host space for that activity. All the spaces that
meet the locus criterion are stored within a vector. Thereupon, each space
within that vector is evaluated depending on how it performs against the
magnitude and ratio requirements. The fittest space is then selected as the
entrance of the layout.
Figure36 Activities assignment algorithm
Successively, the space operates a search for the more appropriate host-space
for each activity contained within the downward gamma graph matrix. All the
unassigned places that are adjacent to the parent space [initially the
entrance] are stored within a vector. Thereupon, each space within that vector
is evaluated. The evaluation considers the area of the space, the ratio, the
location and the upward gamma graph. The fittest space is then selected to
host that particular activity. Once all the ensuing activities are assigned [if they
can all be assigned] these activities become the next round’s parent spaces
and the same procedure is implemented recursively until the assignment of all
of the required activities [or the assignment of all the activities that can be
assigned within that particular configuration].
ADAM DOULGERAKIS MSc AAC 45
METHODOLOGY
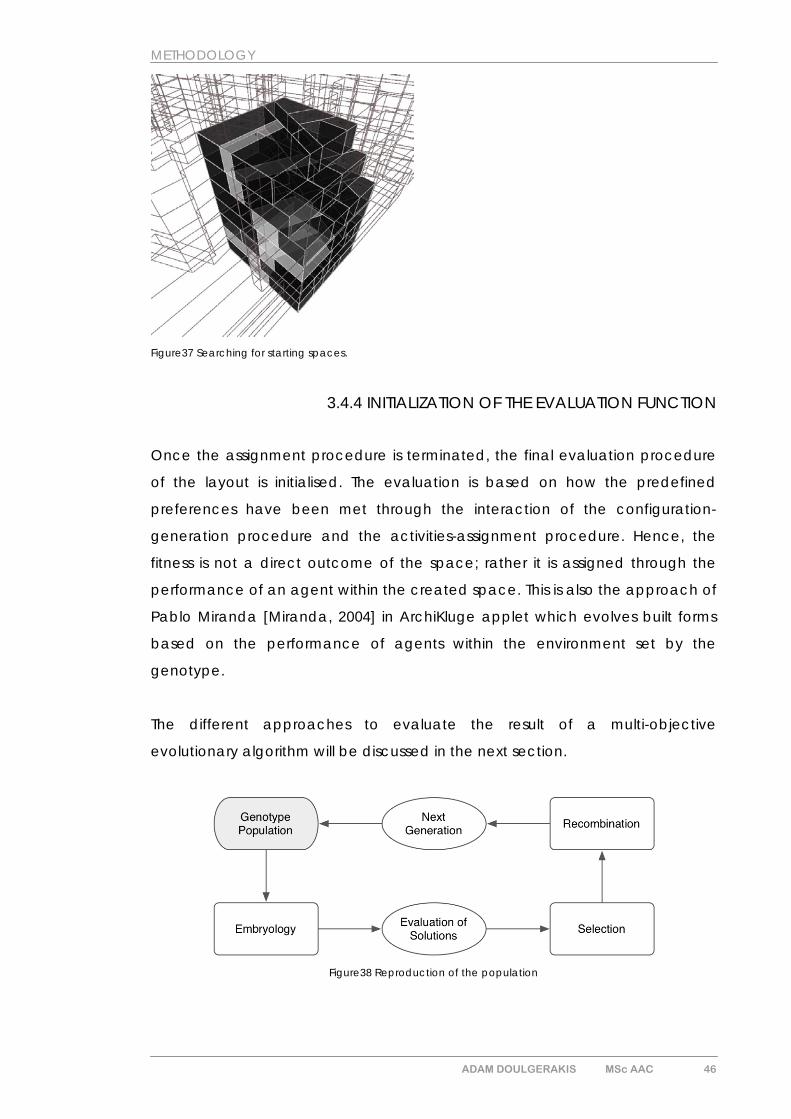
Figure37 Searching for starting spaces.
3.4.4 INITIALIZATION OF THE EVALUATION FUNCTION
Once the assignment procedure is terminated, the final evaluation procedure
of the layout is initialised. The evaluation is based on how the predefined
preferences have been met through the interaction of the configuration-
generation procedure and the activities-assignment procedure. Hence, the
fitness is not a direct outcome of the space; rather it is assigned through the
performance of an agent within the created space. This is also the approach of
Pablo Miranda [Miranda, 2004] in ArchiKluge applet which evolves built forms
based on the performance of agents within the environment set by the
genotype.
The different approaches to evaluate the result of a multi-objective
evolutionary algorithm will be discussed in the next section.
Figure38 Reproduction of the population
ADAM DOULGERAKIS MSc AAC 46
METHODOLOGY
3.5 THE EVOLUTION OF CONFIGURATIONS
It is worth mentioning, that within the context of GP there is a problem to
produce solutions which are ‘valid’ and don’t cause a system crash when they
are executed. The tree-structured genotype can handle the required variations
in shape/size of the solutions and its creation method assures the generation of
valid solutions, yet most of them are not good solutions. In order to proceed
from merely valid solutions to good solutions, an evolutionary algorithm is
implemented.
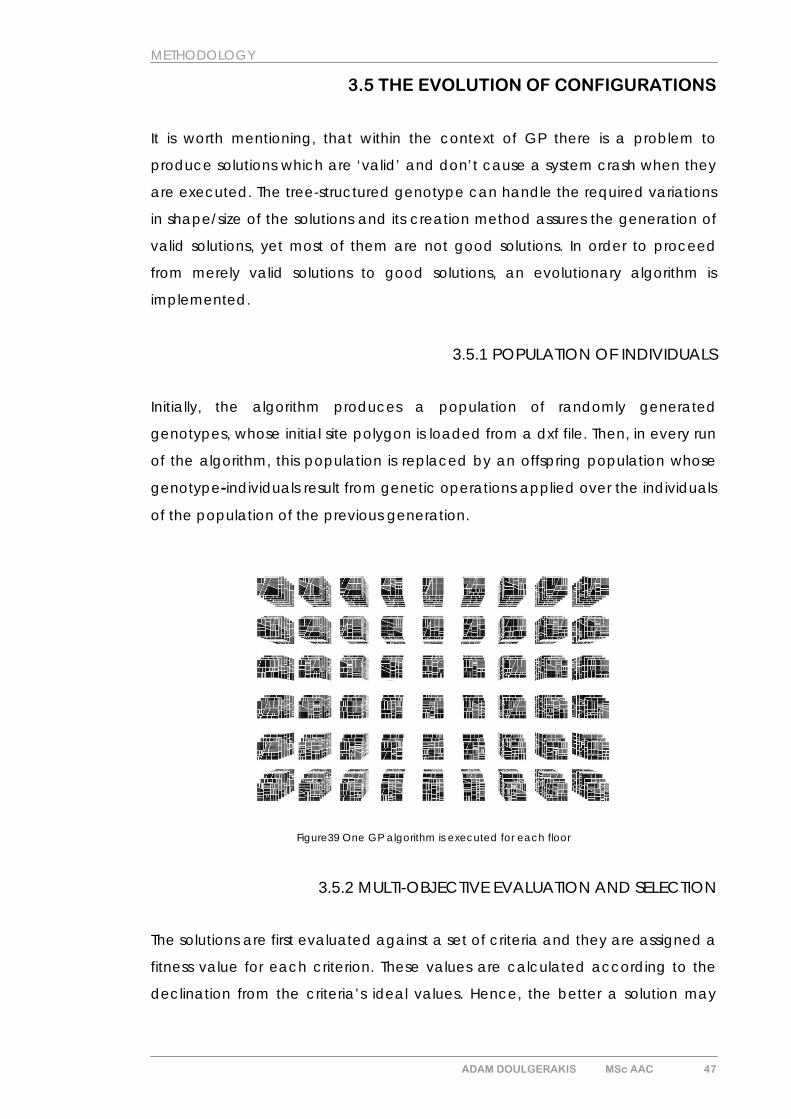
3.5.1 POPULATION OF INDIVIDUALS
Initially, the algorithm produces a population of randomly generated
genotypes, whose initial site polygon is loaded from a dxf file. Then, in every run
of the algorithm, this population is replaced by an offspring population whose
genotype-individuals result from genetic operations applied over the individuals
of the population of the previous generation.
Figure39 One GP algorithm is executed for each floor
3.5.2 MULTI-OBJECTIVE EVALUATION AND SELECTION
The solutions are first evaluated against a set of criteria and they are assigned a
fitness value for each criterion. These values are calculated according to the
declination from the criteria’s ideal values. Hence, the better a solution may
ADAM DOULGERAKIS MSc AAC 47
METHODOLOGY
perform in respect to a particular objective, the lower this objective’s fitness
value will be.
There are several methods that calculate the solutions’ total fitness value.
Particularly, the Weighted Sum, the ‘Pareto’ Optimisation and the Ranking Sum
methods will be discussed in the following paragraphs.
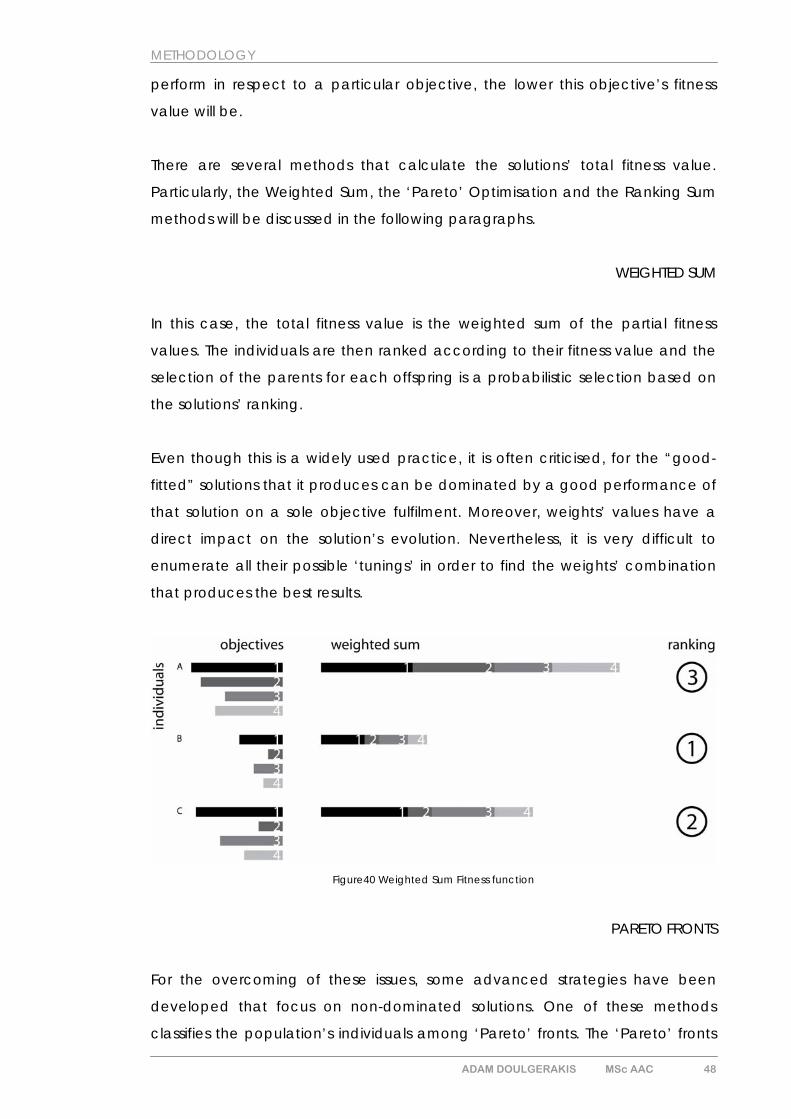
WEIGHTED SUM
In this case, the total fitness value is the weighted sum of the partial fitness
values. The individuals are then ranked according to their fitness value and the
selection of the parents for each offspring is a probabilistic selection based on
the solutions’ ranking.
Even though this is a widely used practice, it is often criticised, for the “good-
fitted” solutions that it produces can be dominated by a good performance of
that solution on a sole objective fulfilment. Moreover, weights’ values have a
direct impact on the solution’s evolution. Nevertheless, it is very difficult to
enumerate all their possible ‘tunings’ in order to find the weights’ combination
that produces the best results.
Figure40 Weighted Sum Fitness function
PARETO FRONTS
For the overcoming of these issues, some advanced strategies have been
developed that focus on non-dominated solutions. One of these methods
classifies the population’s individuals among ‘Pareto’ fronts. The ‘Pareto’ fronts
ADAM DOULGERAKIS MSc AAC 48
METHODOLOGY
are groups of solutions with a particular grade of non-dominance. As Cvetkovic
and Parmee argue while the application ‘Pareto’ fronts present very good
results, it is extremely computationally expensive to implement [Cvetkovic and
Parmee,1998].
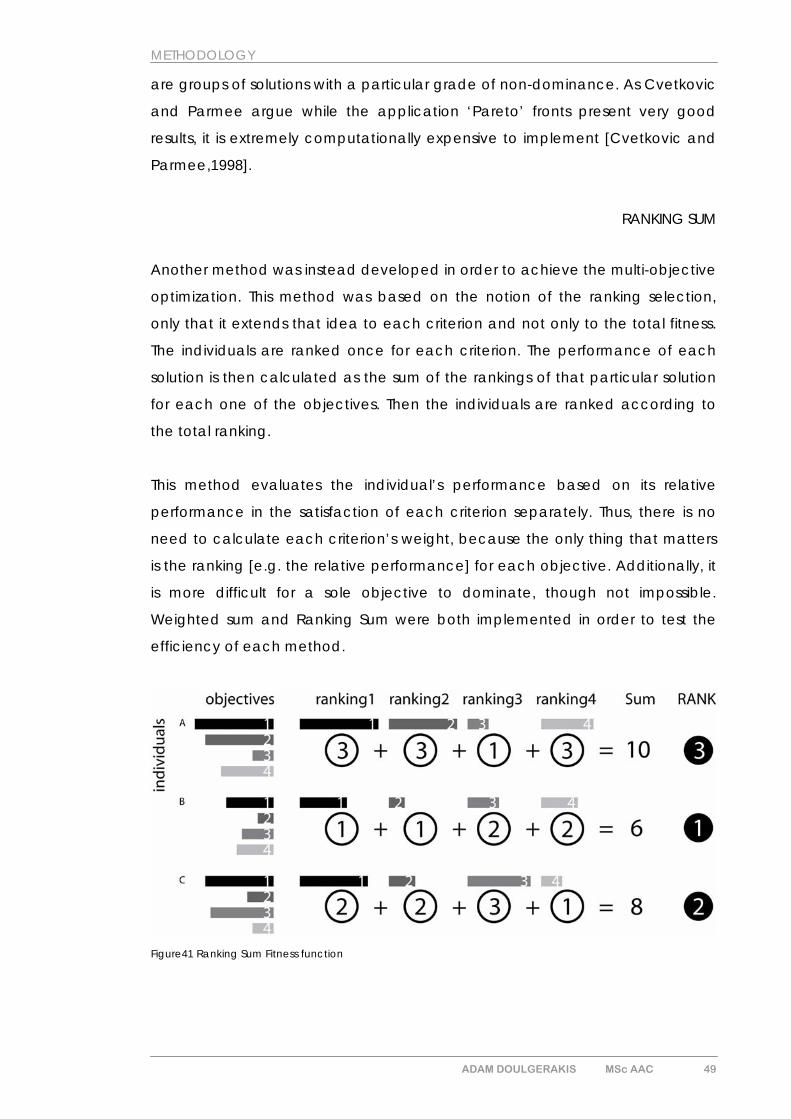
RANKING SUM
Another method was instead developed in order to achieve the multi-objective
optimization. This method was based on the notion of the ranking selection,
only that it extends that idea to each criterion and not only to the total fitness.
The individuals are ranked once for each criterion. The performance of each
solution is then calculated as the sum of the rankings of that particular solution
for each one of the objectives. Then the individuals are ranked according to
the total ranking.
This method evaluates the individual’s performance based on its relative
performance in the satisfaction of each criterion separately. Thus, there is no
need to calculate each criterion’s weight, because the only thing that matters
is the ranking [e.g. the relative performance] for each objective. Additionally, it
is more difficult for a sole objective to dominate, though not impossible.
Weighted sum and Ranking Sum were both implemented in order to test the
efficiency of each method.
Figure41 Ranking Sum Fitness function
ADAM DOULGERAKIS MSc AAC 49
METHODOLOGY
SELECTION
There are several methods to select the parents of the next generation’s
individuals; for example the probabilistic selection according to their fitness
value or the eyeball test where the user selects manually the parents.
In our research the Ranking Selection Method is adopted. Once the evaluation
of the individuals is executed, either with the Weighted Sum or the Ranking Sum,
the individuals are sorted form the best fit to the worst fit. Thereupon, a
probability selection according to the ranking of the solutions defines the
parents of the next generation’s individuals.
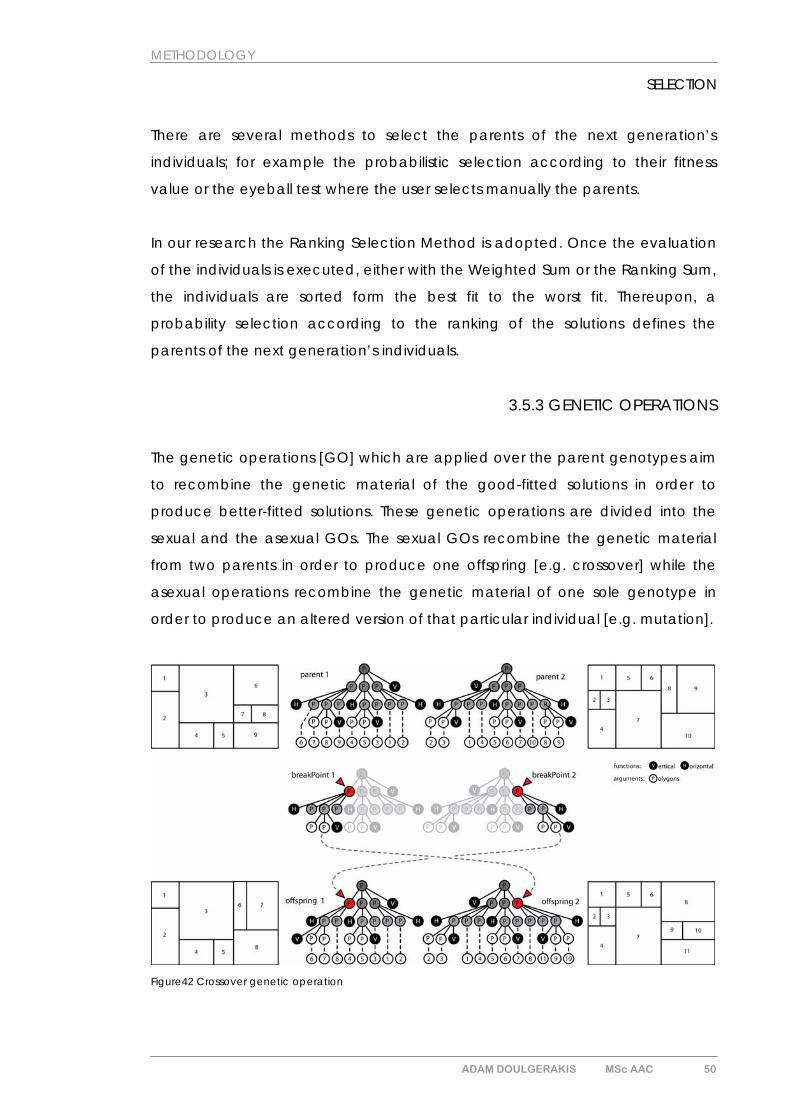
3.5.3 GENETIC OPERATIONS
The genetic operations [GO] which are applied over the parent genotypes aim
to recombine the genetic material of the good-fitted solutions in order to
produce better-fitted solutions. These genetic operations are divided into the
sexual and the asexual GOs. The sexual GOs recombine the genetic material
from two parents in order to produce one offspring [e.g. crossover] while the
asexual operations recombine the genetic material of one sole genotype in
order to produce an altered version of that particular individual [e.g. mutation].
Figure42 Crossover genetic operation
ADAM DOULGERAKIS MSc AAC 50
METHODOLOGY
CROSSOVER
The crossover GO is implemented over two parent-genotypes selected as
described above [Figure42]. The crossover selects randomly a break-point in
each tree-structured parent-genotype and exchanges the sub-trees that
depend on these break-points. Hence, the offspring genotypes combine a part
from both parents’ subdivision instructions.
`
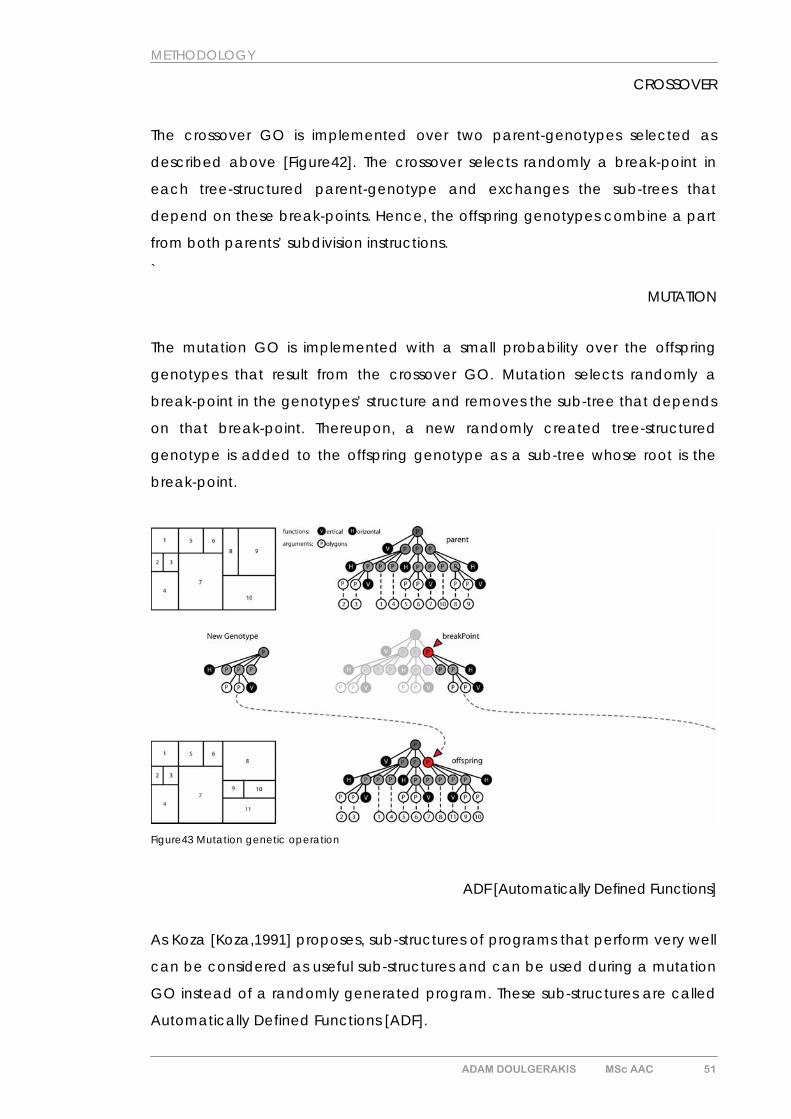
MUTATION
The mutation GO is implemented with a small probability over the offspring
genotypes that result from the crossover GO. Mutation selects randomly a
break-point in the genotypes’ structure and removes the sub-tree that depends
on that break-point. Thereupon, a new randomly created tree-structured
genotype is added to the offspring genotype as a sub-tree whose root is the
break-point.
Figure43 Mutation genetic operation
ADF [Automatically Defined Functions]
As Koza [Koza,1991] proposes, sub-structures of programs that perform very well
can be considered as useful sub-structures and can be used during a mutation
GO instead of a randomly generated program. These sub-structures are called
Automatically Defined Functions [ADF].
ADAM DOULGERAKIS MSc AAC 51
METHODOLOGY
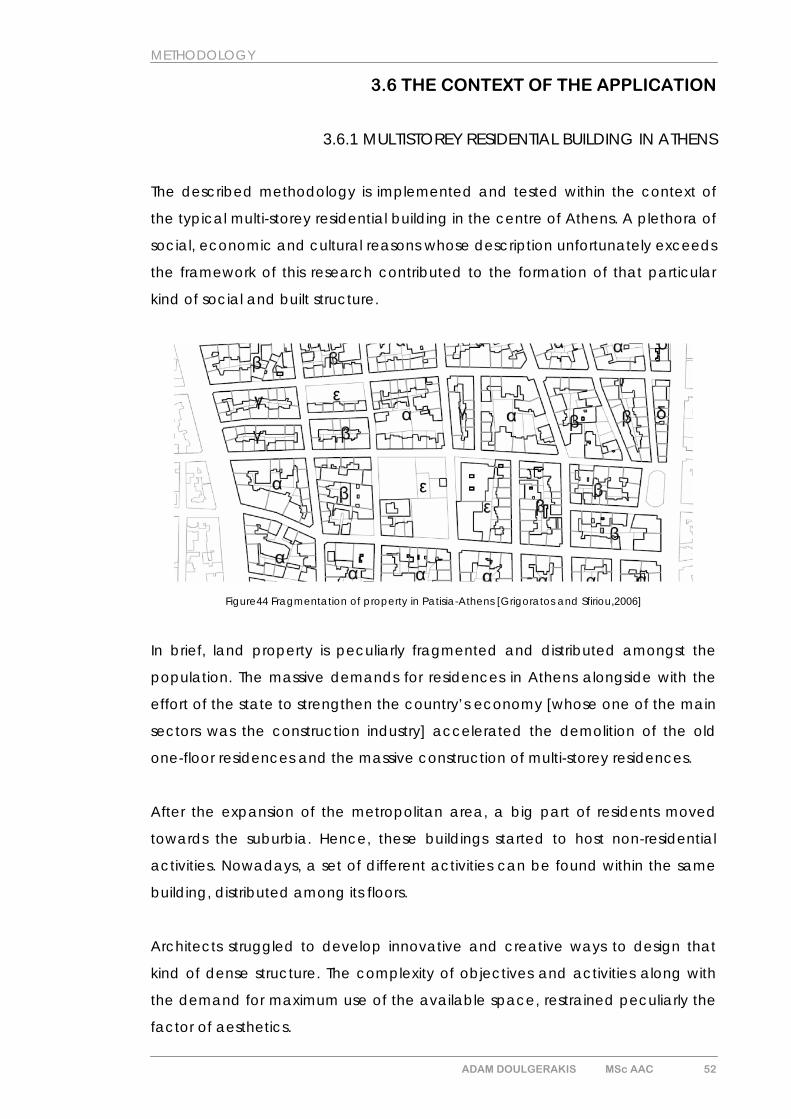
3.6 THE CONTEXT OF THE APPLICATION
3.6.1 MULTISTOREY RESIDENTIAL BUILDING IN ATHENS
The described methodology is implemented and tested within the context of
the typical multi-storey residential building in the centre of Athens. A plethora of
social, economic and cultural reasons whose description unfortunately exceeds
the framework of this research contributed to the formation of that particular
kind of social and built structure.
Figure44 Fragmentation of property in Patisia-Athens [Grigoratos and Sfiriou,2006]
In brief, land property is peculiarly fragmented and distributed amongst the
population. The massive demands for residences in Athens alongside with the
effort of the state to strengthen the country’s economy [whose one of the main
sectors was the construction industry] accelerated the demolition of the old
one-floor residences and the massive construction of multi-storey residences.
After the expansion of the metropolitan area, a big part of residents moved
towards the suburbia. Hence, these buildings started to host non-residential
activities. Nowadays, a set of different activities can be found within the same
building, distributed among its floors.
Architects struggled to develop innovative and creative ways to design that
kind of dense structure. The complexity of objectives and activities along with
the demand for maximum use of the available space, restrained peculiarly the
factor of aesthetics.
ADAM DOULGERAKIS MSc AAC 52
METHODOLOGY
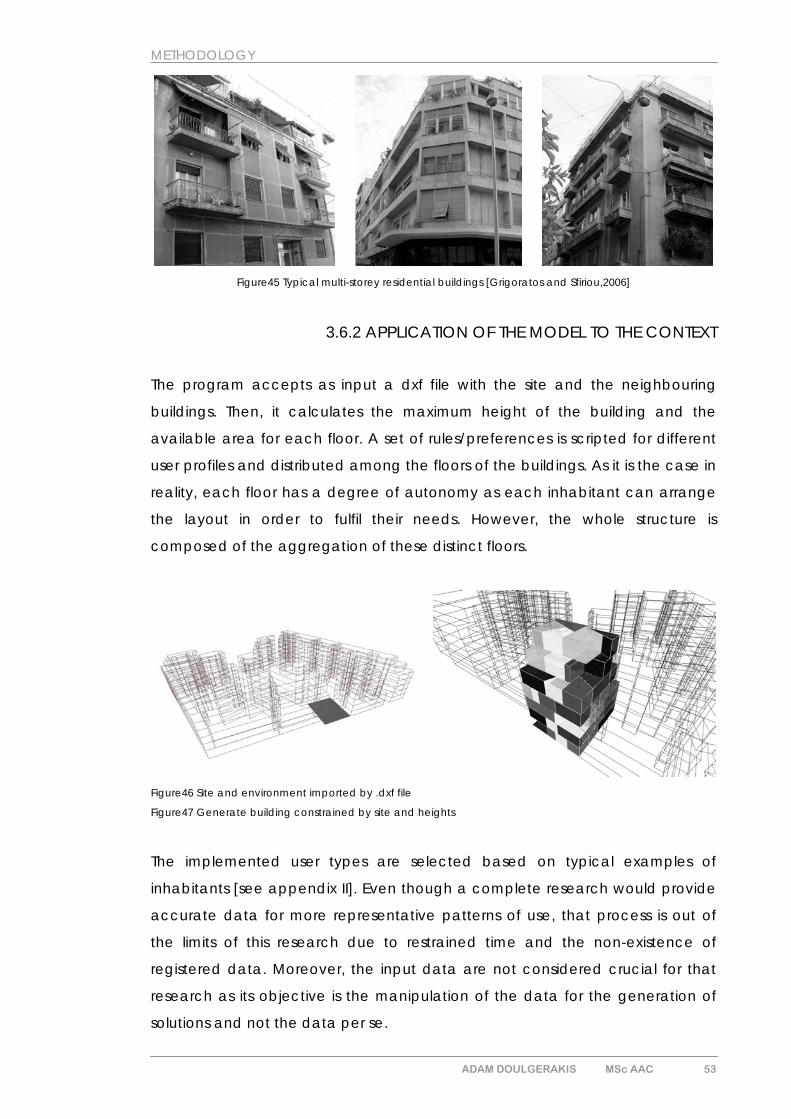
Figure45 Typical multi-storey residential buildings [Grigoratos and Sfiriou,2006]
3.6.2 APPLICATION OF THE MODEL TO THE CONTEXT
The program accepts as input a dxf file with the site and the neighbouring
buildings. Then, it calculates the maximum height of the building and the
available area for each floor. A set of rules/preferences is scripted for different
user profiles and distributed among the floors of the buildings. As it is the case in
reality, each floor has a degree of autonomy as each inhabitant can arrange
the layout in order to fulfil their needs. However, the whole structure is
composed of the aggregation of these distinct floors.
Figure46 Site and environment imported by .dxf file
Figure47 Generate building constrained by site and heights
The implemented user types are selected based on typical examples of
inhabitants [see appendix II]. Even though a complete research would provide
accurate data for more representative patterns of use, that process is out of
the limits of this research due to restrained time and the non-existence of
registered data. Moreover, the input data are not considered crucial for that
research as its objective is the manipulation of the data for the generation of
solutions and not the data per se.
ADAM DOULGERAKIS MSc AAC 53

FINDINGS
4. FINDINGS
ADAM DOULGERAKIS MSc AAC 54
FINDINGS
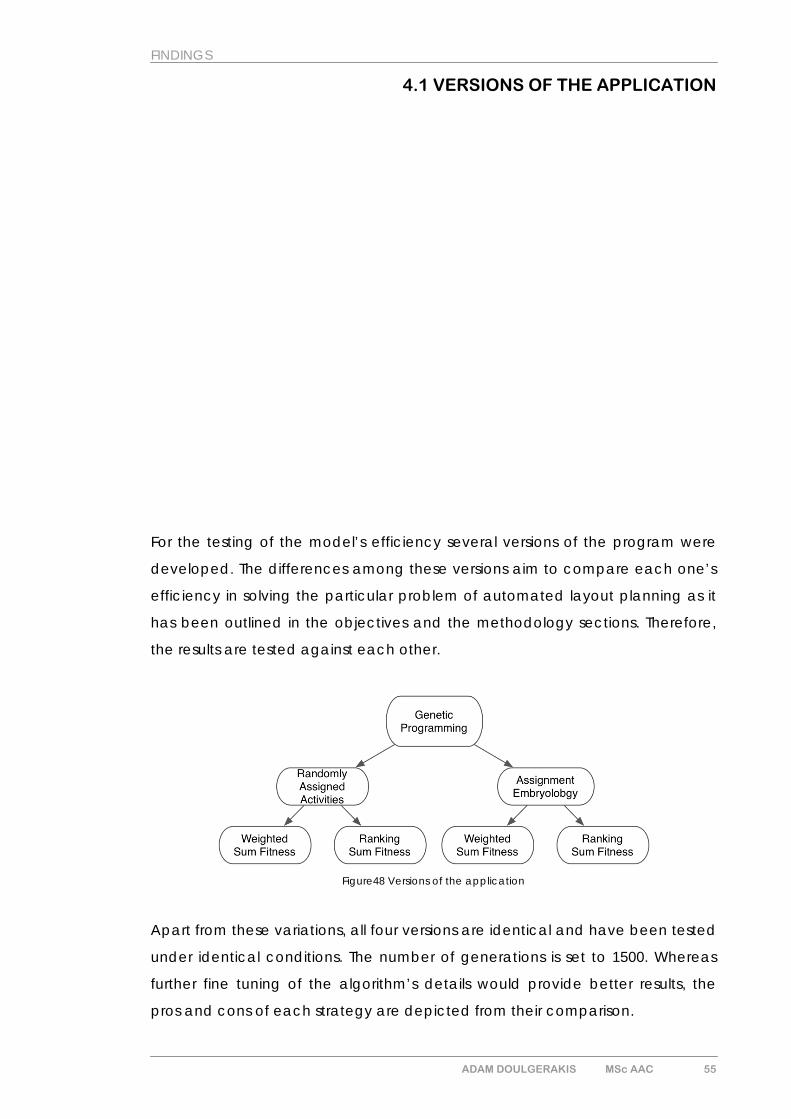
4.1 VERSIONS OF THE APPLICATION
For the testing of the model’s efficiency several versions of the program were
developed. The differences among these versions aim to compare each one’s
efficiency in solving the particular problem of automated layout planning as it
has been outlined in the objectives and the methodology sections. Therefore,
the results are tested against each other.
Figure48 Versions of the application
Apart from these variations, all four versions are identical and have been tested
under identical conditions. The number of generations is set to 1500. Whereas
further fine tuning of the algorithm’s details would provide better results, the
pros and cons of each strategy are depicted from their comparison.
ADAM DOULGERAKIS MSc AAC 55
FINDINGS
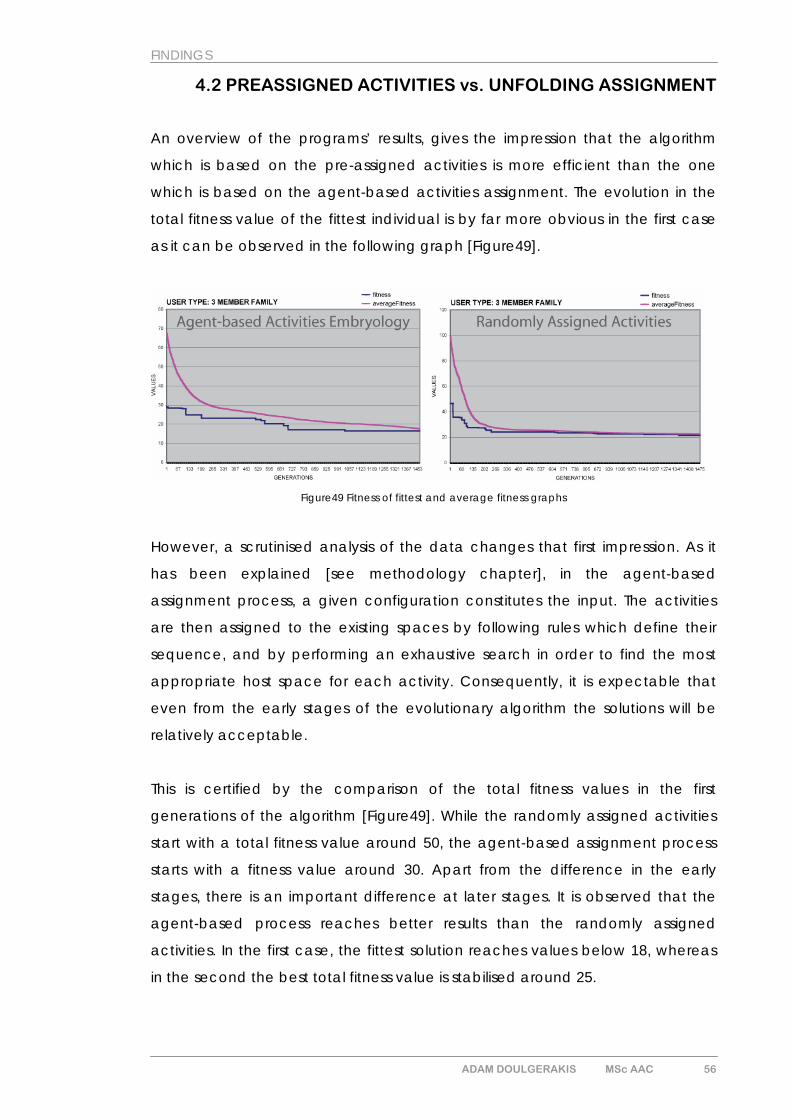
4.2 PREASSIGNED ACTIVITIES vs. UNFOLDING ASSIGNMENT
An overview of the programs’ results, gives the impression that the algorithm
which is based on the pre-assigned activities is more efficient than the one
which is based on the agent-based activities assignment. The evolution in the
total fitness value of the fittest individual is by far more obvious in the first case
as it can be observed in the following graph [Figure49].
Figure49 Fitness of fittest and average fitness graphs
However, a scrutinised analysis of the data changes that first impression. As it
has been explained [see methodology chapter], in the agent-based
assignment process, a given configuration constitutes the input. The activities
are then assigned to the existing spaces by following rules which define their
sequence, and by performing an exhaustive search in order to find the most
appropriate host space for each activity. Consequently, it is expectable that
even from the early stages of the evolutionary algorithm the solutions will be
relatively acceptable.
This is certified by the comparison of the total fitness values in the first
generations of the algorithm [Figure49]. While the randomly assigned activities
start with a total fitness value around 50, the agent-based assignment process
starts with a fitness value around 30. Apart from the difference in the early
stages, there is an important difference at later stages. It is observed that the
agent-based process reaches better results than the randomly assigned
activities. In the first case, the fittest solution reaches values below 18, whereas
in the second the best total fitness value is stabilised around 25.
ADAM DOULGERAKIS MSc AAC 56
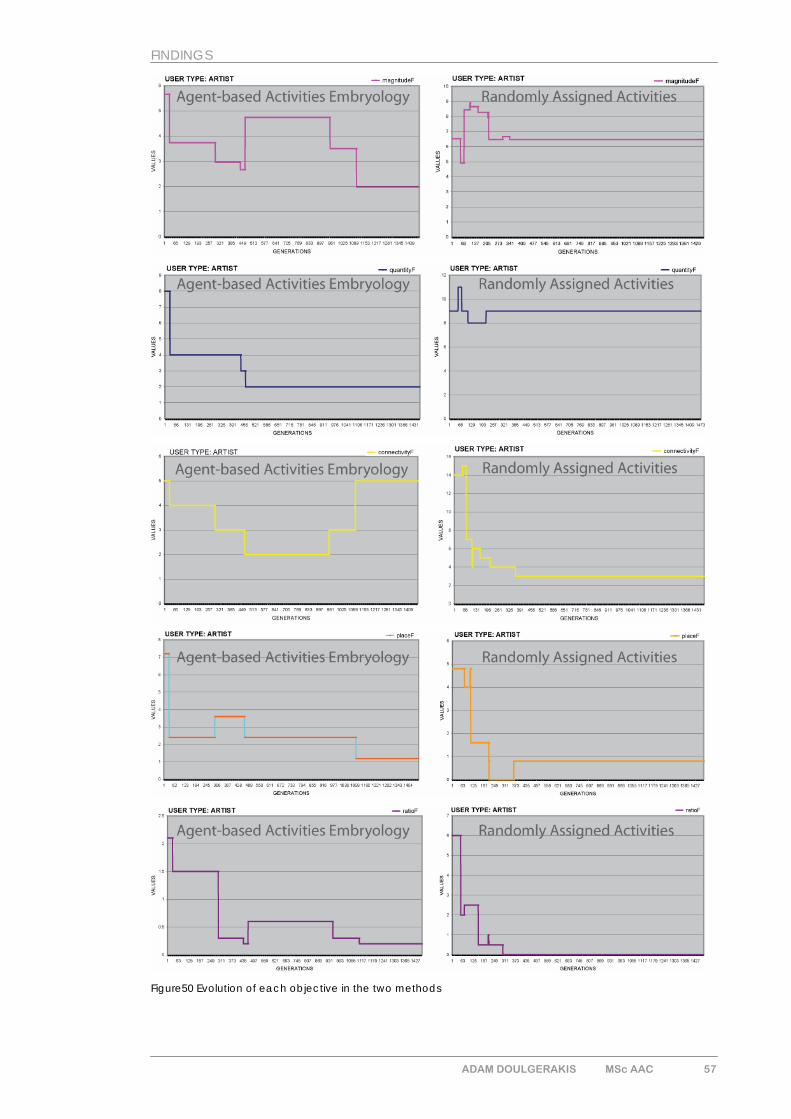
FINDINGS
Figure50 Evolution of each objective in the two methods
ADAM DOULGERAKIS MSc AAC 57
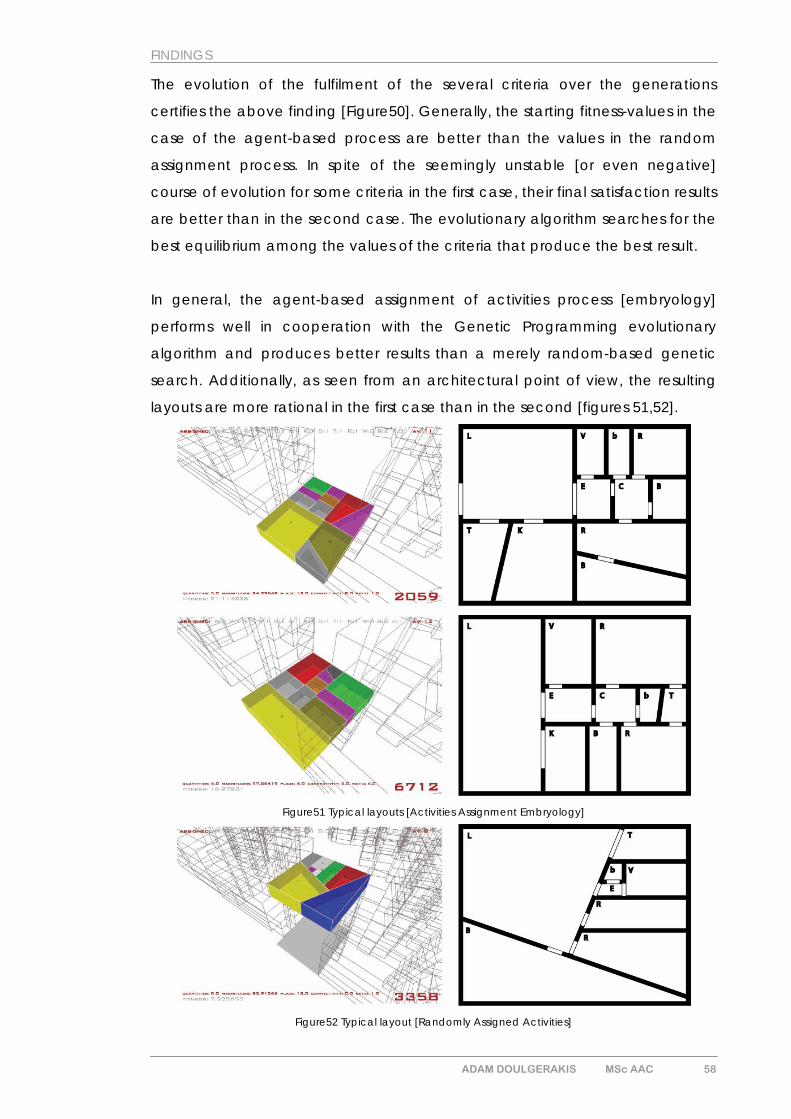
FINDINGS
The evolution of the fulfilment of the several criteria over the generations
certifies the above finding [Figure50]. Generally, the starting fitness-values in the
case of the agent-based process are better than the values in the random
assignment process. In spite of the seemingly unstable [or even negative]
course of evolution for some criteria in the first case, their final satisfaction results
are better than in the second case. The evolutionary algorithm searches for the
best equilibrium among the values of the criteria that produce the best result.
In general, the agent-based assignment of activities process [embryology]
performs well in cooperation with the Genetic Programming evolutionary
algorithm and produces better results than a merely random-based genetic
search. Additionally, as seen from an architectural point of view, the resulting
layouts are more rational in the first case than in the second [figures 51,52].
Figure51 Typical layouts [Activities Assignment Embryology]
Figure52 Typical layout [Randomly Assigned Activities]
ADAM DOULGERAKIS MSc AAC 58
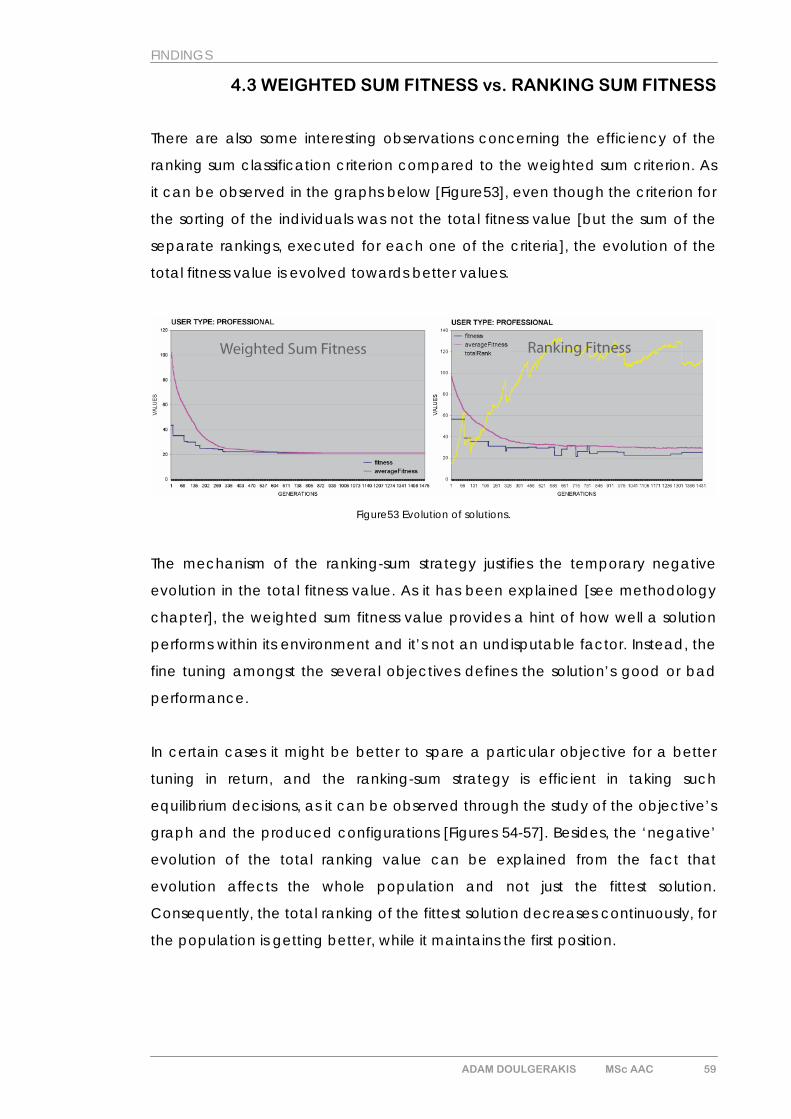
FINDINGS
4.3 WEIGHTED SUM FITNESS vs. RANKING SUM FITNESS
There are also some interesting observations concerning the efficiency of the
ranking sum classification criterion compared to the weighted sum criterion. As
it can be observed in the graphs below [Figure53], even though the criterion for
the sorting of the individuals was not the total fitness value [but the sum of the
separate rankings, executed for each one of the criteria], the evolution of the
total fitness value is evolved towards better values.
Figure53 Evolution of solutions.
The mechanism of the ranking-sum strategy justifies the temporary negative
evolution in the total fitness value. As it has been explained [see methodology
chapter], the weighted sum fitness value provides a hint of how well a solution
performs within its environment and it’s not an undisputable factor. Instead, the
fine tuning amongst the several objectives defines the solution’s good or bad
performance.
In certain cases it might be better to spare a particular objective for a better
tuning in return, and the ranking-sum strategy is efficient in taking such
equilibrium decisions, as it can be observed through the study of the objective’s
graph and the produced configurations [Figures 54-57]. Besides, the ‘negative’
evolution of the total ranking value can be explained from the fact that
evolution affects the whole population and not just the fittest solution.
Consequently, the total ranking of the fittest solution decreases continuously, for
the population is getting better, while it maintains the first position.
ADAM DOULGERAKIS MSc AAC 59
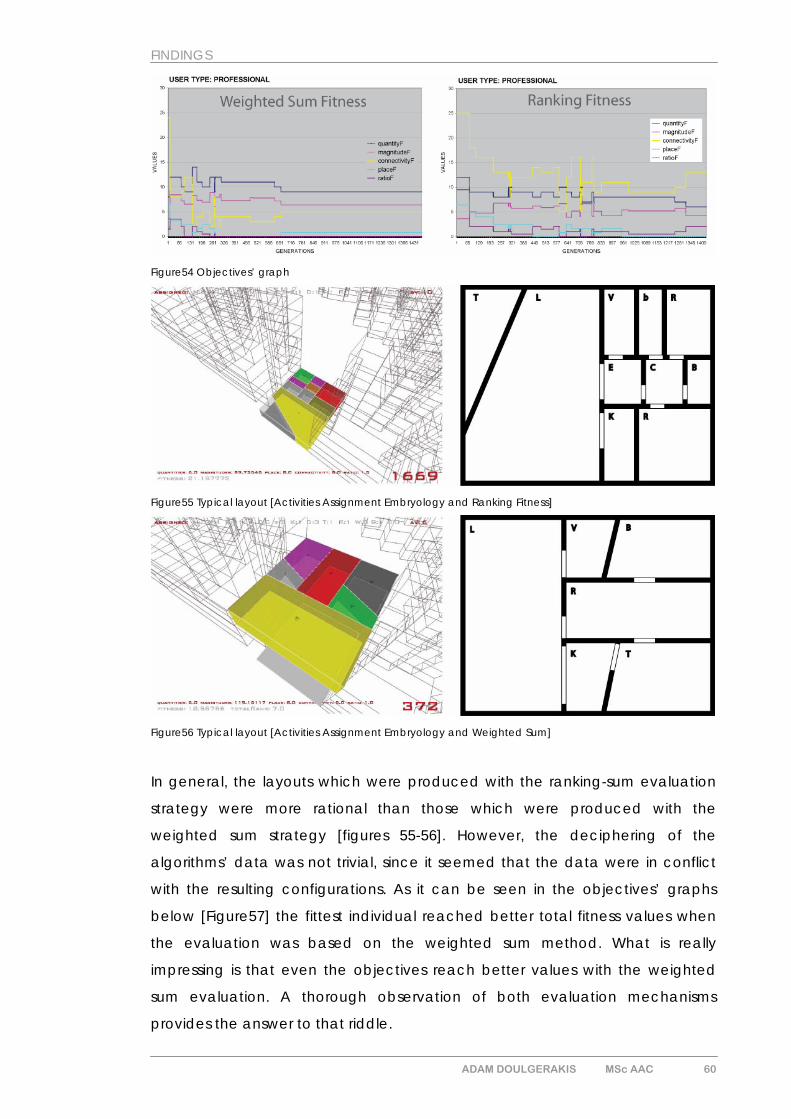
FINDINGS
Figure54 Objectives’ graph
Figure55 Typical layout [Activities Assignment Embryology and Ranking Fitness]
Figure56 Typical layout [Activities Assignment Embryology and Weighted Sum]
In general, the layouts which were produced with the ranking-sum evaluation
strategy were more rational than those which were produced with the
weighted sum strategy [figures 55-56]. However, the deciphering of the
algorithms’ data was not trivial, since it seemed that the data were in conflict
with the resulting configurations. As it can be seen in the objectives’ graphs
below [Figure57] the fittest individual reached better total fitness values when
the evaluation was based on the weighted sum method. What is really
impressing is that even the objectives reach better values with the weighted
sum evaluation. A thorough observation of both evaluation mechanisms
provides the answer to that riddle.
ADAM DOULGERAKIS MSc AAC 60
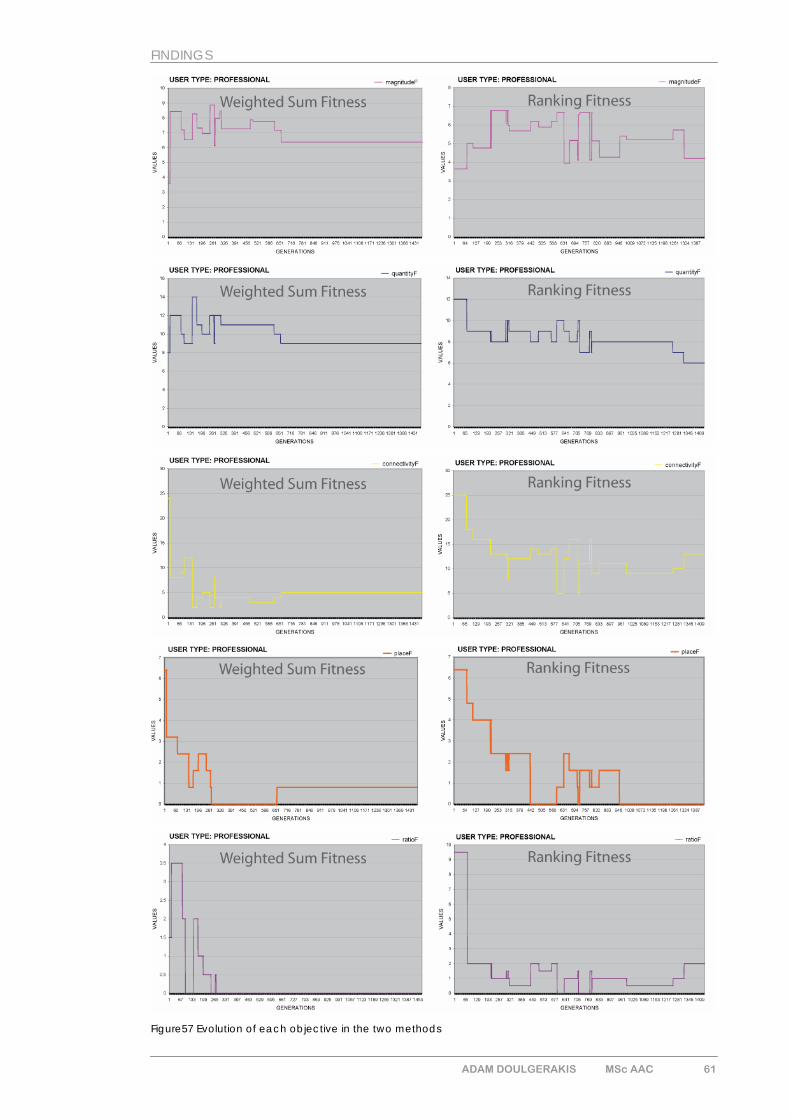
FINDINGS
Figure57 Evolution of each objective in the two methods
ADAM DOULGERAKIS MSc AAC 61
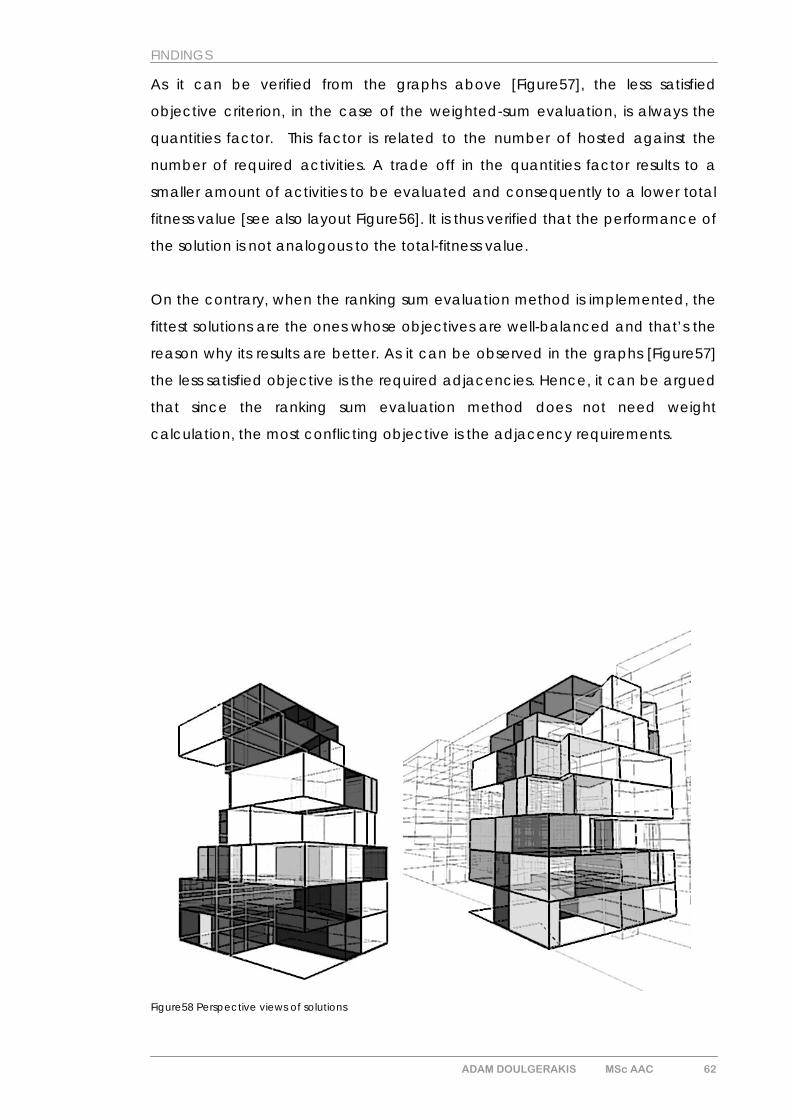
FINDINGS
As it can be verified from the graphs above [Figure57], the less satisfied
objective criterion, in the case of the weighted-sum evaluation, is always the
quantities factor. This factor is related to the number of hosted against the
number of required activities. A trade off in the quantities factor results to a
smaller amount of activities to be evaluated and consequently to a lower total
fitness value [see also layout Figure56]. It is thus verified that the performance of
the solution is not analogous to the total-fitness value.
On the contrary, when the ranking sum evaluation method is implemented, the
fittest solutions are the ones whose objectives are well-balanced and that’s the
reason why its results are better. As it can be observed in the graphs [Figure57]
the less satisfied objective is the required adjacencies. Hence, it can be argued
that since the ranking sum evaluation method does not need weight
calculation, the most conflicting objective is the adjacency requirements.
Figure58 Perspective views of solutions
ADAM DOULGERAKIS MSc AAC 62
DISCUSSION
5. DISCUSSION
ADAM DOULGERAKIS MSc AAC 63
DISCUSSION
5.1 GENERAL
As previously discussed [see results chapter], the model used within this research
can be considered as successful since relatively good results have been
produced regarding both numerical data and spatial configurations. The
research’s hypothesis that an efficient evolutionary system aiming to generate
floor plans can be driven by a computationally independent embryology
process is thus verified. This process assigns activities to existing spaces
according to a set of rules [preferences] which are encoded in terms of
required dimensional attributes as well as permeability graphs. Additionally, it
has been shown [see results chapter], that an evaluation method which
classifies individuals according to the sum of their rankings [for each objective
separately] produces more balanced results than the weighted sum evaluation
method.
ADAM DOULGERAKIS MSc AAC 64
DISCUSSION
5.2 COMPARING TO OTHER APPROACHES
The other approaches for the automated layout planning problem that have
been studied during the research provided valuable material and helped in the
development of the methodology. Particularly, this method is based on the
notion that an evolutionary approach is more efficient in the exploration of the
search space since the number of possible solutions is extremely high for an
exhaustive search for the best solution. Thus, it can be classified within the
evolutionary approaches to the automated layout planning problem.
In the case of Sitewalker [Doulgerakis 2007] some of the results produced with
exhaustive search in steps were particularly satisfactory. However, when the
consideration of future search steps was attempted, the limit of the available
computational power was reached. As Jo and Gero [Jo and Gero,1998] argue,
in constructive approaches [such as CRAFT [Armour and Buffa,1964] and
Sitewalker [Doulgerakis,2007]] there is always the risk that the algorithm will
never find its way out of a local optimum and thus, a method such as an
evolutionary algorithm which performs a parallel search, is more efficient.
Nevertheless, Mitchell et al. [Mitchell et al.,1976] produce a set of well-fitted
solutions with an exhaustive search among all the possible solutions. However,
the drawback of that method is its massive computational cost. Hence, as the
title of the work proposes, it is efficient only when applied to small rectangular
floor plans with a small number of rooms.
However, the way that Mitchell et al. system manipulated space influenced this
research. The subdivision of a given rectangle to smaller rectangles constitutes
a very capable means of producing spatial configurations. Moreover, these
spaces are not the result of aggregated unitary cells; instead they constitute
independent geometric elements. Thus, the results are not restrained by the
granularity of an underlying grid as it is the case in Rosenman’s approach
[Rosenman, 1996]. The method which was developed within this research
adopts this perspective for the manipulation of unequal-area spaces. Thus, it is
classified within the unequal area approach [Block Plan] to the automated
layout planning problem and particularly within the continual space block plan
approach. However, that research is not narrowed down to rectangular
ADAM DOULGERAKIS MSc AAC 65
DISCUSSION
shapes. The subdivision can occur diagonally and the consideration of
geometry as polygons allows the manipulation of almost all the possible site
outlines and favours the production of even more realistic solutions.
The developed methodology has a similar approach with the Finucane et al.
[Finucane et al.,2006] system. Particularly, the development of the phenotype is
in both cases an independent embryology process that optimizes the
translation of the genotype to the actual configuration. Moreover, both
approaches attempt a multi-objective optimization. Finucane et al. yield
efficient solutions by classifying the individuals in ‘Pareto’ fronts. This research’s
approach to the multi-objective optimization [e.g. the Ranking Sum Fitness]
produces efficient results as well.
An element which is neglected in the related approaches is the social and the
cultural background, whose forces have an important role in the formation of
the buildings’ layout. This research aims to prove that it is possible to encode
these forces [in this case by means of the gamma-map] and to implement
them within a generative system whose purpose is to create floor-layout
solutions.
ADAM DOULGERAKIS MSc AAC 66
DISCUSSION
5.3 LIMITATIONS AND FURTHER DEVELOPMENT
Further development of the system was restrained due to time constrains.
Additionally, the data which have been used as required attributes for the
configurations are not based on statistics. Instead, the preferences of the
different user-types have been encoded intuitively. Nevertheless, the objective
of this research was to confirm that such an approach can be efficient and
thus, these data are not of crucial importance in that branch of the research.
A research could be held concerning the typology and the statistics of this type
of buildings. Furthermore, the system’s efficiency could be tested against real
data by comparing existing typologies and configurations resulting from the
implementation of the methodology described.
Moreover, there are several methods to decode the social and the cultural
underlying forces that drive the formation of buildings layouts; permeability
map being one of them amongst others. Within the context of this research,
only the permeability graph [gamma map] has been implemented. A number
of other data such as visibility and privacy can also have large impact over the
layout’s formation forces.
A further development of that research should attempt to implement these
data as generative criteria for the assignment of activities, as well as evaluation
criteria for the classification of the results.
Furthermore, it must be mentioned that in order to produce more efficient and
realistic results, the activities-assignment process should have the ability to join
two [or even more] spaces or to further subdivide them if this could make the
solution’s performance better. This change could be then translated as
additional information integrated in the solution’s genotype by following the
Lamarkistic model of evolution.
While this approach was attempted and managed to produce results within
sole individuals, its implementation to the Genetic Programming algorithm was
restrained due to the lack of sufficient computational power. Namely, the
calculation of the possible additions and subdivisions for every individual and
ADAM DOULGERAKIS MSc AAC 67
DISCUSSION
the selection of the best action among the numerous options are excessively
demanding in computational power as it approaches exhaustive search
algorithms.
Ultimately, it would be very interesting to expand this system as a co-
evolutionary system focusing on the interaction of the building’s floors. That
evolutionary algorithm would generate each floor’s configurations
independently, but the result would be evaluated according to the feasibility of
the solutions as a to-be-built project. For instance the placement of terraces,
vertical communications, and wet spaces [bathroom, kitchen], are decisions
that should be taken in regards to the whole building in order to achieve
functional solutions.
ADAM DOULGERAKIS MSc AAC 68
CONCLUSIONS
CONCLUSIONS
The development of the application system was based on the ongoing
research aiming to address the automated layout planning problem with the
use of sophisticated heuristics, such as Genetic Algorithms. However, in most of
these cases, the impact of the generative forces that derive from the social
and the cultural environment has been neglected. The objective of that
research was to illustrate that the encoding of these forces in terms of
permeability graphs, can be implemented within an evolutionary process in
order to yield meaningful and efficient results.
In order to examine this approach’s potentials, two similar multi-objective GP
systems have been elaborated. The first one represents the traditional
evolutionary approach whose individuals acquire random values during the
generation of the initial population. Whereas, the second is a Genetic
Programming algorithm implemented for the evolution of residential layouts
driven by an independent agent-based unfolding embryology process, which
assigns activities to the spaces, generated by the GP, according to a set of
spatial and permeability requirements. In the latter, the GP and the assignment
process compose a single evolutionary system, as GP generates spaces and
the assignment allocates the activities and evaluates the result.
Both systems have been executed within the same context, with the same
requirements and for the same time. The context of the experiment was a
typical multi-storey residential building in the centre of Athens. As it was justified
by the comparison of the results, the co-operational GA-assignment system
yielded better results than the conventional GA system. Thus, the hypothesis of
the research was verified and the proposed approach can be considered as
successful.
Hence, the contribution of this research to the evolution of automated layout
planning is that it showed that elements which encode the social meaning of
buildings can be used within a generative system and particularly in
cooperation with an evolutionary system. Nevertheless, according to Hillier and
Hanson [Hillier and Hanson,1984] there is a plethora of such encodings [e.g.
visibility and privacy graphs] whose purpose is to decode the social forces that
ADAM DOULGERAKIS MSc AAC 69
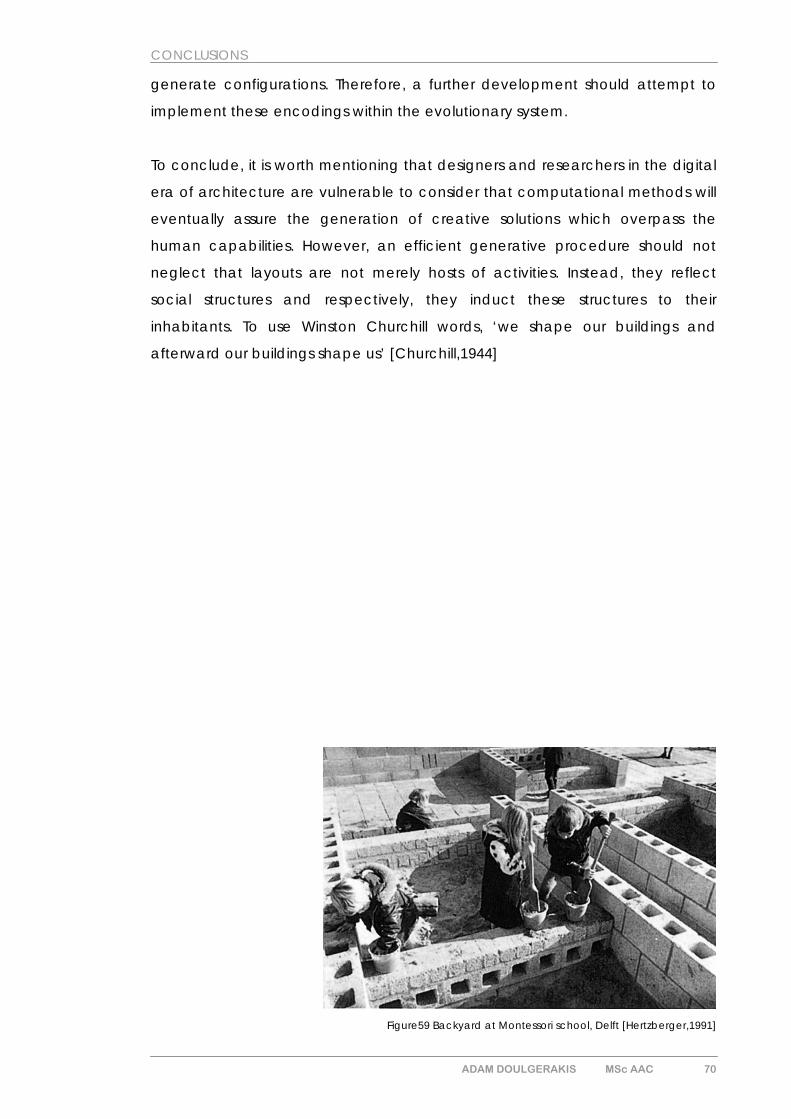
CONCLUSIONS
generate configurations. Therefore, a further development should attempt to
implement these encodings within the evolutionary system.
To conclude, it is worth mentioning that designers and researchers in the digital
era of architecture are vulnerable to consider that computational methods will
eventually assure the generation of creative solutions which overpass the
human capabilities. However, an efficient generative procedure should not
neglect that layouts are not merely hosts of activities. Instead, they reflect
social structures and respectively, they induct these structures to their
inhabitants. To use Winston Churchill words, ‘we shape our buildings and
afterward our buildings shape us’ [Churchill,1944]
Figure59 Backyard at Montessori school, Delft [Hertzberger,1991]
ADAM DOULGERAKIS MSc AAC 70
LIST OF REFERENCES
LIST OF REFERENCES
Armour, B. & Buffa, E. [1964]. “Allocating Facilities with CRAFT, in Harvard
Business Review”, 42 [2], pp. 136-159.
Bentley, P.J. & Corne, D.W., eds. [1998]. “Creative Evolutionary Systems”,
San Francisco: Morgan Kaufmann Publishers.
Bentley, P.J., ed. [1999]. “Evolutionary Design by Computers”, San
Francisco: Morgan Kaufmann Publishers.
Churchill, W., [1944]. “Rebuilding the House of Commons”, in Eades, C.,
ed., “Onward to Victory”. Boston, MA: Little, Brown and Company.
Coates, P.S., & Hazarika L., [1999]. “The use of Genetic Programming for
applications in the field of spatial composition”, Proceedings of the 2nd
Generative Art Conference GA1999,
http://uelceca.net/research/Generative%20Art/milan99.pdf [accessed
11/2007]
Coates, P.S., et al. [1999]. “Exploring Three Dimensional Design Worlds using
Lindemayer Systems and Genetic Programming”, in Bentley, P.J., ed.,
“Evolutionary Design by Computers”, San Francisco: Morgan Kaufmann
Publishers.
ADAM DOULGERAKIS MSc AAC 71
LIST OF REFERENCES
Cvetkovic, D. & Parmee, I. [1998]. “Evolutionary design and multi
objective optimisation”, in EUFIT ’98, Aachen Germany, pp. 397-401.
Grigoratos, K. & Sfiriou, P. [2006]. “ Investigation of possibilities of
intervention in high-density central districts. Redefinition of residential
buildings and overdraft spaces in city blocks.” Diploma Thesis, School of
Architecture, National Technical University of Athens. [in greek]
Finucane et al. [2006]. “Evolving Urban Structures using Computer
Optimisation Techniques”, Proceedings of the 9th Generative Art
Conference GA2006, pp.186-214.
Flake, G.W. [1998]. “The Computational Beauty of Nature: computer
explorations of Fractals, chaos, complex systems, and adaptation”,
Cambridge MA: MIT press.
Gero, J.S. [1996]. “Computers and creative design”, in Tan, M. & Teh, R.,
eds., “The Global Design Studio”, National University of Singapore, p.11-19.
Hanson, J. [1998]. “Decoding Homes and Houses”, Cambridge:
Cambridge University Press.
Hertzberger, H. [1991]. “Lessons for Students in Architecture” , Rotterdam:
010 Publishers.
Hillier, B. & Hanson, J. [1984]. “The Social Logic of Space”, Cambridge:
Cambridge University Press.
Jo, J. & Gero, J.S. [1998]. “Space layout planning using an evolutionary
approach”, in Artificial Intelligence in Engineering, 12 [3], pp. 149-162.
Kalay, Y.E. [2004]. “Architecture’s New Media: Principles, Theories, and
Methods of Computer Aided Design”. Cambridge MA: MIT Press.
King, A.D., ed. [1980]. “Introduction, in Buildings and Society: Essays on the
Social Development of the Built Environment”, London: Routledge.
ADAM DOULGERAKIS MSc AAC 72
LIST OF REFERENCES
Koza, J.R. [1992]. “Genetic Programming: On the programming of
computers by natural selection”. Cambridge MA: MIT Press.
Lee et al., [2005]. “An improved genetic algorithm for multi-floor facility
layout problems having inner structure walls and passages”, in Computers &
Operations Research 32 [2005], pp. 879-899.
Ligget, R.S. [2000]. “Automated Facilities Layout: past, present and future”,
in Automation in Construction, 9 [2], pp. 197-215.
Miranda, P. [2004], on-line Java Application:
http://www.armyofclerks.net/ArchiKluge/index.htm [accessed 11/2007]
Mitchell, W.J. et al. [1976]. “Synthesis and optimization of small rectangular
floor plans”, Environment and Planning B 3, pp. 37-70.
Rosenman, M.A. [1996]. “The generation of form using an evolutionary
approach”, in Gero, J.S. & Sudweeks, F., eds., “Artificial Intelligence in
Design '96”, Dordrecht: Kluwer Academic, pp. 643-662.
Tam, K. [1991]. “Simulated annealing algorithm for allocating space to
manufacturing cells”, in International Journal of Production Research, 30,
pp. 63-87.
Tate, D. & Smith, A. [1995]. “Unequal-area facility layout by genetic
search”, IEE Trans. 27 [4], pp. 465-473.
ADAM DOULGERAKIS MSc AAC 73
APPENDIX I: SCRIPTING METHODS
APPENDIX I: SCRIPTING METHODS
In this appendix some elements of the program will be thoroughly described.
The full source code for all the applications developed within this research can
be found in the included CD-ROM.
The application is scripted in Processing programming language. However,
several elements of the program required methods and classes that overpass
processing potentials. In these cases, Java classes have been called within the
processing environment. As the classes are named after the object they
represent [e.g. the polygon class represents polygons], different lettering have
used to differentiate the references. Hence, words in bold refer to classes.
GENOTYPE
A node class was created that could represent both values and functions.
When the generation of a random genotype is initialised, an instance of the
node class is called that is the root node whose depth value is 0. Then, the root
node instantiates a random number of children nodes whose depth value is 1.
This procedure is repeated recursively until a certain depth value is reached.
The node class takes as input the parent node [in the case of the root node the
parent node is null] and stores in a Java vector the children nodes. In addition,
every node stores in Java vectors all its ancestors and all its descendants. This is
achieved when the instantiation of every node takes place. Thus, every
instance obtains ‘knowledge’ of its position within the genotype tree by
reference to its immediate parent node as well as to its ancestors. Furthermore,
in every moment each node is conscious of its sub-dependent tree and nodes.
RECTANGULAR SPACES
When a genotype instance is called, it takes as input value the initial space,
namely the outline of the building. That space can be either the available part
of the construction site, or the site itself. Since this input constitutes a geometry,
an appropriate class is needed that can create and manipulate geometry.
Initially, the site was strictly rectangular, and the shapes were boxes. A space
class was then created that used as input the initial point, the width and the
ADAM DOULGERAKIS MSc AAC 74
APPENDIX I: SCRIPTING METHODS
length of the rectangular space and produced as output a box whose area
was defined by the given width and length values and whose height was
predefined.
The initial space, which is the input of the genotype, is transmitted to the root-
node. The root-node successively decides randomly the number of the children
nodes and the orientation of the subdivision [vertically or horizontally].
According to each case the root divides the width [horizontal division] or the
height [vertical division] while keeping the other value intact. The divisor is the
number of the children nodes. Then the root-node instantiates a number of
nodes that is equal to its number of children value. The children nodes are
called one at a time and they are given as inputs their own space, which is
composed of the intact value [for instance the width], a part of the other value
[for instance the height], and a starting point calculated by the starting point of
the parent node translated to the sum of the portions of the previous children-
nodes [if any]. The last child’s space is the remaining part of the initial space.
That procedure is repeated recursively until the maximum depth is reached. All
the nodes without children-nodes are considered as terminal [e.g. the nodes
of maximum depth and the nodes that while their depth value is less than the
maximum value, their number of children value was randomly set to 0]. All the
terminal nodes store a duplicate of the node’s space within a vector in the
genotype. This duplicate represents a constructed space.
While all the nodes have each one their space, these spaces are merely an
abstract instance as they do not represent an actual, constructed space, but
the given space that they dispose in order to distribute it among their children.
Only the terminal nodes’ spaces are materialized as actual space. Thus, by
the end of that procedure in lieu of the initial geometry there is a set of
rectangles whose areas compose the initial rectangle.
POLYGONAL SPACES
A polygon class was created that used as input two arrays of coordinates, the
xPoints [] array for the x-coordinates and the yPoints [] for the y-coordinates.
ADAM DOULGERAKIS MSc AAC 75
APPENDIX I: SCRIPTING METHODS
Each space object has a reference to its corresponding polygon. However,
while these parameters are sufficient in order to draw the polygon or to
calculate its centroid, the need for further manipulation [e.g. Boolean
operations] led towards the implementation of Java classes.
The notion was that a polygonal space could be subdivided to polygonal
spaces with the use of Boolean operations [join, subtract, intersect]. Java’s
area class can perform these operations. In order to render a polygon to an
area, the Java general path class was used. Since general path implements
the java shape interface it can provide the area of a given polygon [polygon-
>general path->area]. It is worth mentioning that java has its own polygon class
that implements the java shape interface, so it would be easier to get its area
[polygon->area]. Nevertheless, java polygon accepts arrays of integers as
coordinates, and for the purpose of subdividing polygons, float coordinates
were necessary. In brief, in order to perform a Boolean operation over two
given polygons, the following sequence is used: for both polygons, create a
general path from the polygons’ points that describe its outline [general path
gp1, general path gp2] -> get the areas that correspond to the general
paths [new area a1 = area[gp1], new area a2 = area[gp2]] -> perform the
Boolean operation with the areas [ new area rest = a1.subtract[a2]].
Another important method that java area class provides is the transform
method. By this method one can manipulate the given area [translate, rotate,
scale] by use of the AffineTransform class that is merely a transformation
matrix. The AffineTransform matrix can be set by applying its “translate”,
“rotate” and “scale” methods. In brief, in order to perform a transformation
over a given area object the following procedure is followed: create an
identity AffineTransform matrix [new affine transform m] -> apply a
transformation method over this matrix [m.translate[x, y]] -> apply this
transformation to the initial area a [a.transform[m]].
Up to that point, it is achieved to apply transformations as well as Boolean
operations to given polygons. However, the result of the aforementioned
procedures is in terms of an area and not of a polygon. Consequently, in order
to complete the procedure, a final step was necessary: to render the resulted
ADAM DOULGERAKIS MSc AAC 76
APPENDIX I: SCRIPTING METHODS
area to its corresponding polygon. That step was achieved by use of the
PathIterator interface. The PathIterator interface provides the mechanism for
objects that implement the Shape interface [such as area objects] to return
the geometry of their boundary by allowing a caller to retrieve the path of that
boundary a segment at a time [Java reference]. Hence, the new transformed
polygon is created by retrieving the transformed area’s PathIterator. In brief
the procedure is the following: polygons-> areas of polygons -> manipulate
the areas -> get resulted areas -> get new polygons from resulted areas.
Thereupon, in order to create a configuration the followed procedure is similar
with the one that was applied for the creation of configurations of rectangular
spaces. The initial polygon that is the input of the genotype is transmitted to
the root-node. The root-node successively decides randomly the number of the
children nodes, the orientation [vertically or horizontally], and the angle of the
subdivision. The root creates a filter rectangle that is the bounding rectangle of
its polygon. According to each case the root scales, rotates and translates the
filter in order to produce the children node’s bounds. Each child node’s space
is the intersection of the initial polygon with the filter rectangle. Then the root-
node instantiates a number of nodes that is equal to its number of children
value. The children nodes are called one at a time and they are given as input
their own polygon. The last child’s polygon is the remaining of the initial’s
polygon.
CROSSOVER
In order to perform the crossover GO, first a genotype copy function is needed.
That function’s role is to generate an identical duplicate of a genotype so as
when the crossover occurs to the copies of the genotypes, the original
genotypes remain intact. The copying is achieved by recursively ‘reading’ the
original genotype’s nodes and creating in the same time identical duplicates
of these nodes to the duplicate genotype.
Successively, the crossover function selects randomly a breaking point node for
each genotype. Every genotype stores within a vector every node that is
created from its root-node. Thus, the selection of breaking points occurs by
ADAM DOULGERAKIS MSc AAC 77
APPENDIX I: SCRIPTING METHODS
randomly selecting a node among the nodes that are stored within the nodes-
vector of each genotype. Once the selection of break-points is made, the
genotypes exchange the sub-trees that have as roots the breakpoints nodes.
A re-creation function is then applied to the genotypes in order to update the
changes that have occurred. Particularly this re-creation function removes the
nodes from its initial genotype’s and adds them to its current genotype’s
node-vector, updates the depth value of each node, updates the genealogy
relations that are inscribed within each node’s allAncestors and allDescendants
vectors, and updates the polygons of each node. Each node object has
memory of the way that its parent filter-polygon was manipulated [translated,
scaled and rotated] for the production of that exact node. Consequently, the
same transformations are applied but in different filter-polygons this time
resulting to different polygons.
Eventually, the two offspring genotypes are evaluated and the fittest is
selected as the offspring, whereas the other one is rejected.
MUTATION
The mutation GO is occasionally applied, with a small probability factor, over
the offspring genotype of the crossover operation. The mutation GO selects
randomly one break point [as in the crossover] and removes the sub-tree that
has as a root the break point node. Then, a new random genotype is
generated that is added to the first genotype by replacing the break point
node with the new genotype’s root-node.
In order to produce solutions that are considered within the acceptable
boundaries, the new genotypes maximum depth allowance is equal to the
general maximum depth allowance minus the break point’s depth value.
Successively, the recreation function is applied again in order to update the
final genotype.
ADAM DOULGERAKIS MSc AAC 78
APPENDIX I: SCRIPTING METHODS
ADF [Automatically Defined Functions]
In our model, the genotypes that have a very good performance, store to a
vector a new genotype that is a duplicate genotype of a sub-tree.
Thereupon, when the mutation GO is applied, instead of generating a new
random genotype, the mutation has a chance to occur by adopting randomly
one of the ADF genotype.
ADAM DOULGERAKIS MSc AAC 79
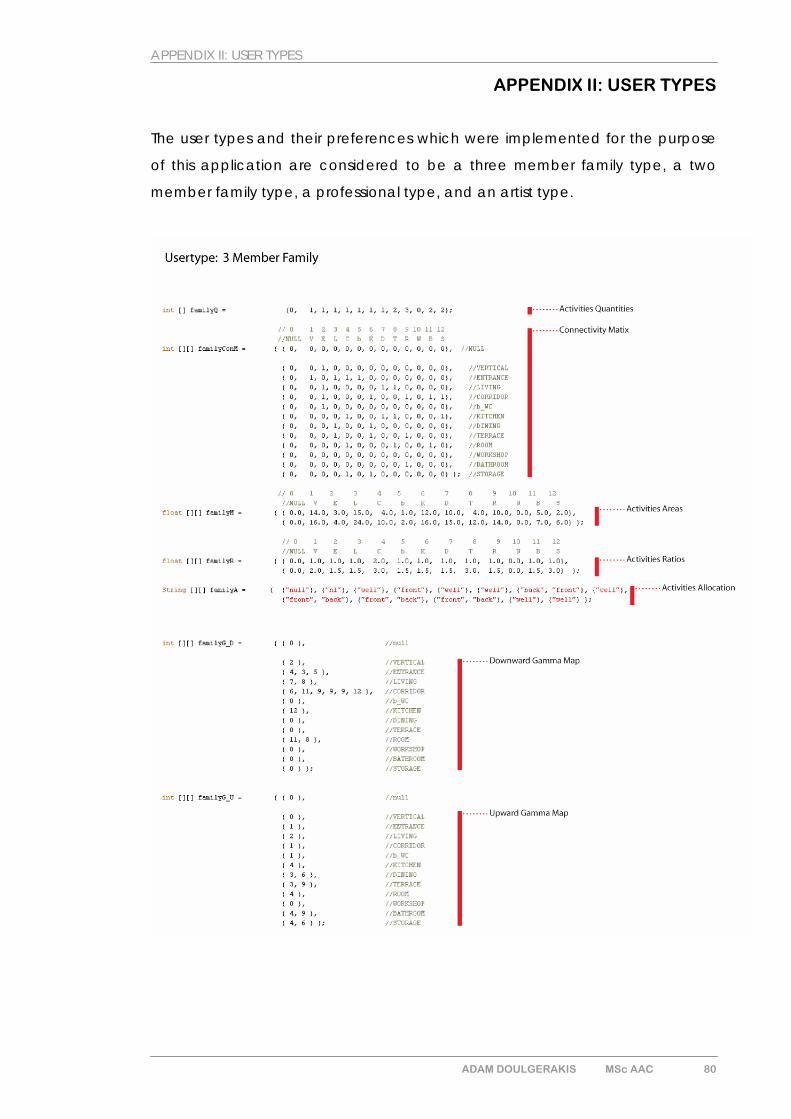
APPENDIX II: USER TYPES
APPENDIX II: USER TYPES
The user types and their preferences which were implemented for the purpose
of this application are considered to be a three member family type, a two
member family type, a professional type, and an artist type.
ADAM DOULGERAKIS MSc AAC 80
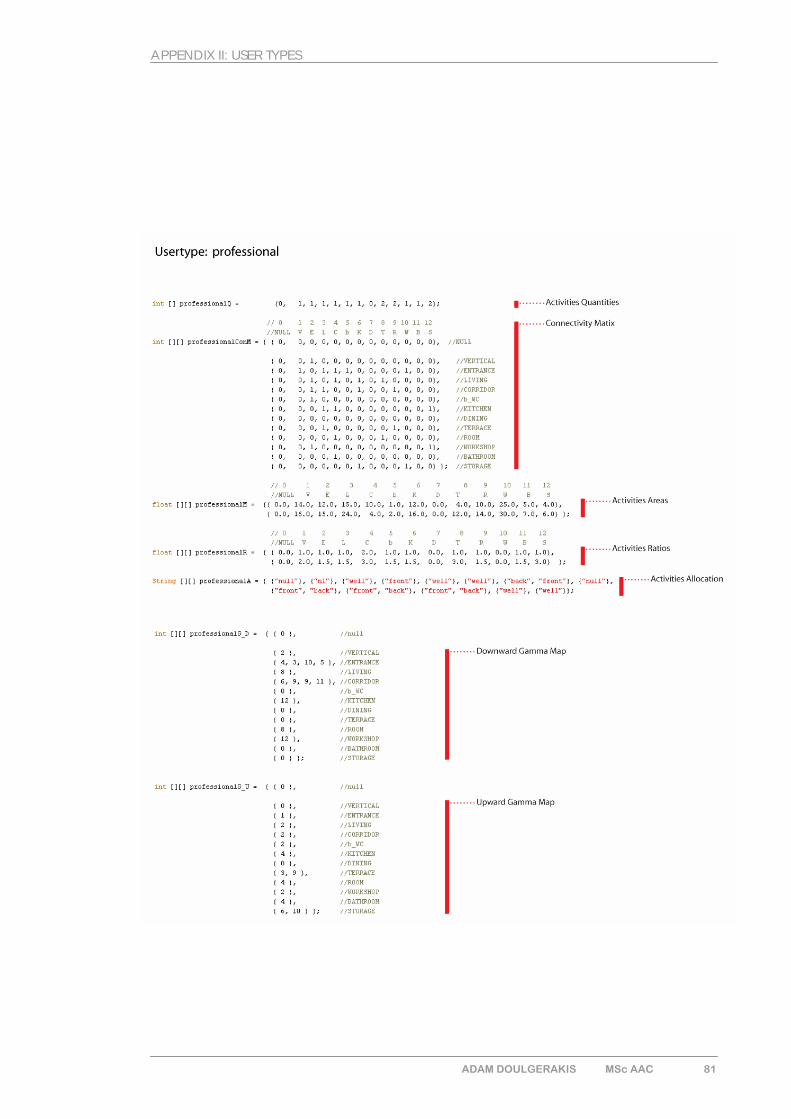
APPENDIX II: USER TYPES
ADAM DOULGERAKIS MSc AAC 81
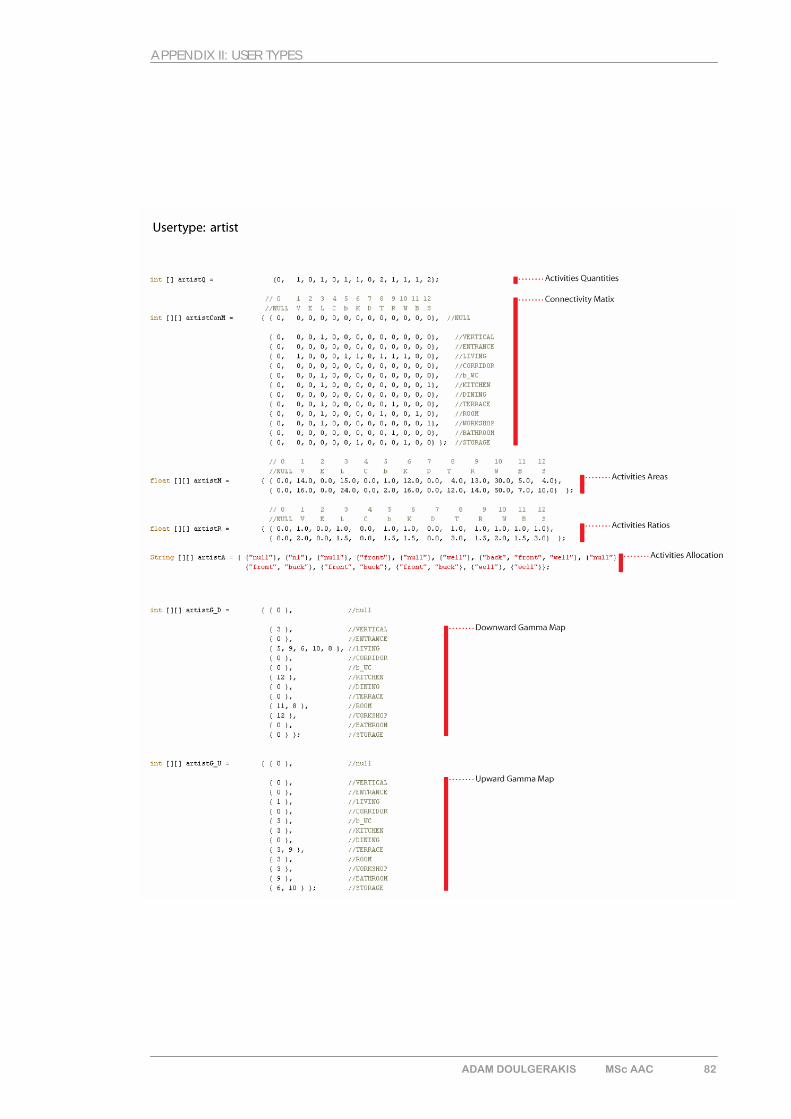
APPENDIX II: USER TYPES
ADAM DOULGERAKIS MSc AAC 82
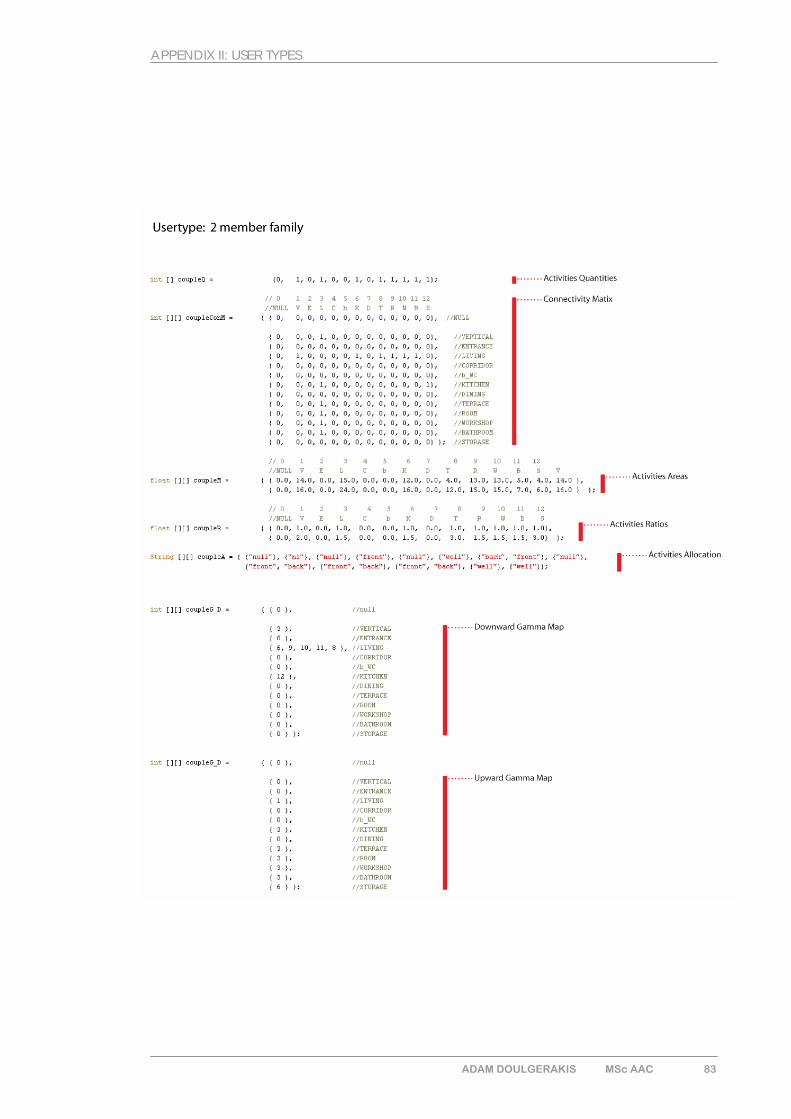
APPENDIX II: USER TYPES
ADAM DOULGERAKIS MSc AAC 83

CD-ROM