Embed Size (px)
Citation preview
International Journal of
Molecular Sciences
Article
Genetic Diversity and Population Structure ofBroomcorn Millet (Panicum miliaceum L.) Cultivarsand Landraces in China Based onMicrosatellite MarkersMinxuan Liu 1, Yue Xu 2, Jihong He 3, Shuang Zhang 1, Yinyue Wang 1,4 and Ping Lu 1,*
1 Institute of Crop Science, Chinese Academy of Agricultural Sciences, Beijing 100081, China;[email protected] (M.L.); [email protected] (S.Z.); [email protected] (Y.W.)
2 School of Life Science, Jilin University, Changchun 130012, China; [email protected] Institute of Crop Science, Gansu Academy of Agricultural Sciences, Lanzhou 030000, China;
[email protected] Faculty of Life Science, Jilin Agricultural University, Changchun 130118, China* Correspondence: [email protected]; Tel. & Fax: +86-010-6215-9962
Academic Editor: Jianhua ZhuReceived: 30 December 2015; Accepted: 8 March 2016; Published: 14 March 2016
Abstract: Broomcorn millet (Panicum miliaceum L.), one of the first domesticated crops, hasbeen grown in Northern China for at least 10,000 years. The species is presently a minor crop,and evaluation of its genetic diversity has been very limited. In this study, we analyzed thegenetic diversity of 88 accessions of broomcorn millet collected from various provinces of China.Amplification with 67 simple sequence repeat (SSR) primers revealed moderate levels of diversityin the investigated accessions. A total of 179 alleles were detected, with an average of 2.7 allelesper locus. Polymorphism information content and expected heterozygosity ranged from 0.043to 0.729 (mean = 0.376) and 0.045 to 0.771 (mean = 0.445), respectively. Cluster analysis based onthe unweighted pair group method of mathematical averages separated the 88 accessions into fourgroups at a genetic similarity level of 0.633. A genetic structure assay indicated a close correlationbetween geographical regions and genetic diversity. The uncovered information will be valuablefor defining gene pools and developing breeding programs for broomcorn millet. Furthermore, themillet-specific SSR markers developed in this study should serve as useful tools for assessment ofgenetic diversity and elucidation of population structure in broomcorn millet.
Keywords: genetic diversity; population structure; SSR markers; Panicum miliaceum L. varieties
1. Introduction
Broomcorn millet (Panicum miliaceum L. (Poaceae); 2n = 4x = 36) is an annual warm season cropalso known as proso, hog, white, yellow, or common millet [1]. One of the most ancient grain crops, itsagricultural use in North China pushed back to the Pleistocene–Holocene boundary [2]. Broomcornmillet is cultivated widely across China; the main production area is along the Great Wall, where itserves as an important staple food [3]. The species is also planted for human and avian consumption incentral Europe, Russia, India, Pakistan, Korea, Japan, and other parts of Eurasia [4], and has emergedas one of the most aggressive grass weeds in North America and Canada [5]. Broomcorn millet has theshortest growing cycle of any cereal, reaching maturity 60–90 days after sowing. The crop also haslow water and nutrient requirements, allowing it to be cultivated at a wide range of altitudes, even onmarginal agricultural land where other cereals do not succeed [6]. Broomcorn millet is also a healthfood because of its unique nutritional benefits: it features protein contents, especially those of alkaline
Int. J. Mol. Sci. 2016, 17, 370; doi:10.3390/ijms17030370 www.mdpi.com/journal/ijms
Int. J. Mol. Sci. 2016, 17, 370 2 of 18
ones, which are higher than levels in crops such as wheat, rice, and oats, an abundance of easilyabsorbed amino acids, and a relatively balanced array of trace elements and vitamin precursors [7].For these reasons, broomcorn millet continues to be an important component of the Chinese diet.
The collection, evaluation, conservation, and utilization of crop germplasm have become one ofthe top agricultural research priorities in China [8]. Interest in the genetic diversity and structure ofnatural populations has increased because of the need to broaden knowledge of genetic variation incultivated species [9]. A detailed understanding of genetic relationships among germplasm resourcesis vital for future breeding process like yield, quality, and resistance (including pest and disease) [10].In addition, a thorough dig and research of germplasm conserved in gene bank can facilitate theintrogression of useful gene into the existing commercial crop genetic base [11]. According to thedifferences in morphological traits, isozymes, DNA markers, as well as pedigree information andgeographic origins, crop genetic diversity and relationship can be evaluated. Compared with restrictionfragment length polymorphism (RFLP), amplified fragment length polymorphism (AFLP), and randomamplification of polymorphic DNA (RAPD) markers, simple sequence repeats (SSRs) have been shownto produce higher levels of polymorphisms and to have much greater ability to identify unique allelesin crop germplasm [12]. SSRs constitute a superior molecular marker system, offering the advantagesof being codominant, abundant, highly reproducible, highly polymorphic, and easy to assay. SSRshave been used to study genetic diversity in various crop species, including maize [13], soybean [14],sorghum [15], cowpea [16], and foxtail millet [17]. SSRs have also been used to construct linkagemaps, assess phylogenetic and population genetic relationships, and identify molecular markers formarker-assisted selection [18].
More than 8700 accessions (landraces and varieties) of P. miliaceum (Panicum miliaceum) areconserved in the National Gene Bank of the Institute of Crop Science, Chinese Academy of AgriculturalSciences (Beijing, China). Although abundant morphological variation exists within the broomcornmillet accessions, assessment of their genetic diversity using DNA markers has been inadequate.Previous analyses of genetic variation in P. miliaceum have employed isozymes [19], RAPDs [20],AFLPs [21], and SSRs transferred from other cereal species [22], as well as markers developed inbroomcorn millet by de novo methods [23]. The resulting data are limited, however, and cannot fullyreveal genetic relationships among accessions. Furthermore, no research has been performed on thegenetic diversity and inter-relationships of cultivated varieties of broomcorn millet in China.
In this study, millet-specific SSR primers developed in our laboratory by high-throughputsequencing were used to identify polymorphisms and to analyze the genetic diversity and structure of88 accessions comprising 56 main varieties cultivated in China and 32 parental lines.
2. Results
2.1. SSR Polymorphic Variation
Using the 67 SSR primer pairs that produced clear polymorphic fragments among eightrepresentatives during preliminary screening, we detected 179 alleles and 349 genotypes inthe 88 studied accessions. Details of uncovered polymorphism levels and other parameters are given inTable 1. Observed number of alleles (Na), is one of the most important indexes of genetic differentiationassociated with populations, types, and geographical sites [17]. Among the 88 accessions, Na per locusvaried from 2 to 5, with a mean value of 2.7, and the number of amplified genotypes varied from 3 to 15,with an average of 5.2. The effective number of alleles (Ne) for each locus varied between 1.05 and 4.29,with an average of 1.995 per locus. Of 179 alleles, 10 (5.59%) were rare, with a frequency less than 0.05in the entire set of samples. Approximately 50% and 32% of polymorphic SSR loci were associated withtwo and three alleles, respectively (Table 2). Values of Shannon's information index (I) varied from0.1085 to 1.5194 per locus, with an average of 0.7254, while expected heterozygosity (He) and observedheterozygosity (Ho) ranged from 0.0447 to 0.7713 (mean = 0.4447) and 0 to 0.9545 (mean = 0.2348),respectively. Some loci, such as F786, F1036, F1067, F1071, F2185, BM306, and BM344, had a Ho
Int. J. Mol. Sci. 2016, 17, 370 3 of 18
of 0, suggesting universal outcrossing between individuals or perhaps between wild populations andnearby cultivated broomcorn millet. The value of genetic diversity which calculated according toNei’s 1973 (H) ranged from 0.0444 (for F1036) to 0.7669 (for F1380), with an average of 0.4419. Withrespect to FST, an index of genetic differentiation or the genetic distance between wild and cultivatedaccessions, values of the 67 applied markers ranged widely: from 0.0434 (BM114) to 0.8342 (F1071),with a mean of 0.2988. Polymorphism information content (PIC) values for each SSR ranged from0.0434 (F1036) to 0.7288 (F1380), with an average of 0.376, indicating a moderate level of geneticdiversity in Chinese broomcorn millet. In the analyzed samples, values of Na and Ne per locus weremost strongly correlated with PIC (r = 0.966–0.993, p < 0.05), followed by I, He, and H.
Table 1. Genetic parameters of the 67 polymorphic simple sequence repeat markers used in this study.
Locus Name Ng a Na b Ne c I d Ho e He f H g FSTh PIC i
F265 10 4 3.215 1.225 0.830 0.693 0.689 0.121 0.626F258 6 3 2.997 1.098 0.435 0.670 0.666 0.150 0.592F334 3 2 1.984 0.689 0.136 0.499 0.496 0.449 0.373F503 10 4 3.350 1.289 0.288 0.706 0.702 0.209 0.649F510 3 2 2.000 0.693 0.026 0.503 0.500 0.505 0.375F515 6 3 1.440 0.585 0.034 0.307 0.305 0.408 0.284F619 3 2 1.585 0.556 0.102 0.371 0.369 0.207 0.301F621 3 2 1.512 0.522 0.091 0.341 0.339 0.248 0.281F630 3 2 1.527 0.529 0.080 0.347 0.345 0.252 0.285F632 6 3 2.281 0.952 0.552 0.565 0.562 0.175 0.500F691 3 2 1.996 0.692 0.091 0.502 0.499 0.352 0.374F1080 6 3 1.586 0.682 0.023 0.372 0.370 0.206 0.339F653 10 4 2.400 1.005 1.000 0.589 0.583 0.051 0.498F1761 3 2 1.994 0.692 0.057 0.501 0.498 0.296 0.374F1036 3 2 1.047 0.109 0.000 0.045 0.044 0.123 0.043F1065 10 4 2.692 1.180 0.322 0.632 0.629 0.200 0.585F1429 10 4 3.665 1.340 0.955 0.731 0.727 0.079 0.677F1400 6 3 1.990 0.830 0.205 0.500 0.498 0.423 0.427F1387 10 4 3.712 1.346 0.886 0.735 0.731 0.139 0.681F1380 15 5 4.290 1.519 1.000 0.771 0.767 0.155 0.729F635 6 3 1.444 0.574 0.109 0.310 0.307 0.726 0.281F746 6 3 1.456 0.594 0.114 0.315 0.313 0.449 0.289F780 3 2 1.831 0.646 0.125 0.458 0.454 0.404 0.351F836 10 4 1.413 0.627 0.094 0.295 0.292 0.803 0.280F845 6 3 1.630 0.692 0.046 0.389 0.387 0.274 0.347F850 6 3 1.399 0.539 0.034 0.287 0.285 0.226 0.261F1067 6 3 1.147 0.280 0.000 0.129 0.128 0.273 0.123F1071 6 3 1.135 0.269 0.000 0.120 0.119 0.834 0.114F1553 3 2 1.585 0.556 0.057 0.371 0.369 0.291 0.301F1610 3 2 2.000 0.693 0.058 0.503 0.500 0.332 0.375F1625 3 2 1.964 0.684 0.068 0.494 0.491 0.448 0.370F1672 6 3 2.045 0.880 0.330 0.514 0.511 0.309 0.456F1703 3 2 1.938 0.677 0.071 0.488 0.484 0.757 0.367F1760 10 4 2.367 1.019 0.215 0.581 0.578 0.352 0.504F1908 6 3 2.993 1.097 0.852 0.670 0.666 0.074 0.592F1940 3 2 1.337 0.419 0.023 0.253 0.252 0.313 0.220F2068 3 2 1.266 0.366 0.080 0.211 0.210 0.556 0.188F2074 3 2 1.872 0.659 0.080 0.469 0.466 0.379 0.357F2185 3 2 1.225 0.330 0.000 0.185 0.184 0.227 0.167F2202 3 2 1.933 0.676 0.023 0.486 0.483 0.375 0.366F2281 3 2 1.458 0.494 0.016 0.317 0.314 0.786 0.265F2288 3 2 1.996 0.692 0.114 0.502 0.499 0.273 0.374
Int. J. Mol. Sci. 2016, 17, 370 4 of 18
Table 1. Cont.
Locus Name Ng a Na b Ne c I d Ho e He f H g FSTh PIC i
F2290 3 2 2.000 0.693 0.138 0.503 0.500 0.240 0.375F2305 6 3 2.896 1.081 0.193 0.659 0.655 0.203 0.581F2370 6 3 1.815 0.683 0.636 0.452 0.449 0.179 0.358F2382 3 2 2.000 0.693 0.011 0.503 0.500 0.425 0.375F2540 6 3 1.293 0.463 0.091 0.228 0.227 0.187 0.214F2551 6 3 1.372 0.532 0.136 0.273 0.271 0.145 0.254F2734 3 2 1.839 0.649 0.159 0.459 0.456 0.328 0.352F2782 3 2 1.294 0.388 0.057 0.229 0.227 0.335 0.201F2901 3 2 1.600 0.562 0.023 0.377 0.375 0.218 0.305F2979 3 2 1.146 0.249 0.023 0.128 0.127 0.262 0.119F2019 6 3 1.406 0.561 0.034 0.290 0.289 0.198 0.269
BM114 6 3 2.377 0.936 0.897 0.583 0.579 0.043 0.487BM136 3 2 1.133 0.234 0.011 0.118 0.117 0.345 0.110BM212 6 3 2.848 1.071 0.818 0.653 0.649 0.150 0.574BM289 3 2 1.727 0.612 0.102 0.423 0.421 0.346 0.332BM295 6 3 2.630 1.028 0.609 0.623 0.620 0.189 0.546BM306 3 2 1.576 0.552 0.000 0.369 0.366 0.745 0.299BM341 3 2 1.789 0.633 0.094 0.448 0.441 0.810 0.344BM344 3 2 1.839 0.649 0.000 0.459 0.456 0.203 0.352BM374 6 3 1.630 0.707 0.188 0.389 0.386 0.675 0.354BM378 3 2 1.969 0.685 0.511 0.495 0.492 0.140 0.371BM396 10 4 3.636 1.331 0.796 0.729 0.725 0.173 0.673BM411 3 2 1.999 0.693 0.277 0.503 0.500 0.313 0.375BM483 10 4 3.258 1.248 0.309 0.699 0.693 0.315 0.633
F786 3 2 1.920 0.672 0.000 0.482 0.479 0.390 0.364Mean 5.209 2.672 1.995 0.725 0.235 0.445 0.442 0.299 0.376
SD 2.766 0.786 0.722 0.302 0.300 0.173 0.172a Number of genotypes where each locus amplified alleles; b observed number of alleles; c effective numberof alleles; d Shannon's information index; e observed heterozygosity; f expected heterozygosity; g Nei’s(1973) gene diversity; h F-statistic value for evaluation of geographical differentiation; and I polymorphisminformation content.
Table 2. Distribution of allelic variation in 67 polymorphic simple sequence repeat (SSR) loci.
Number of Alleles Number of SSR Loci Polymorphic Loci (%)
2 34 50.753 22 32.844 10 14.925 1 1.49
2.2. Comparative Genetic Diversity of Broomcorn Millet Varieties from Different Populations
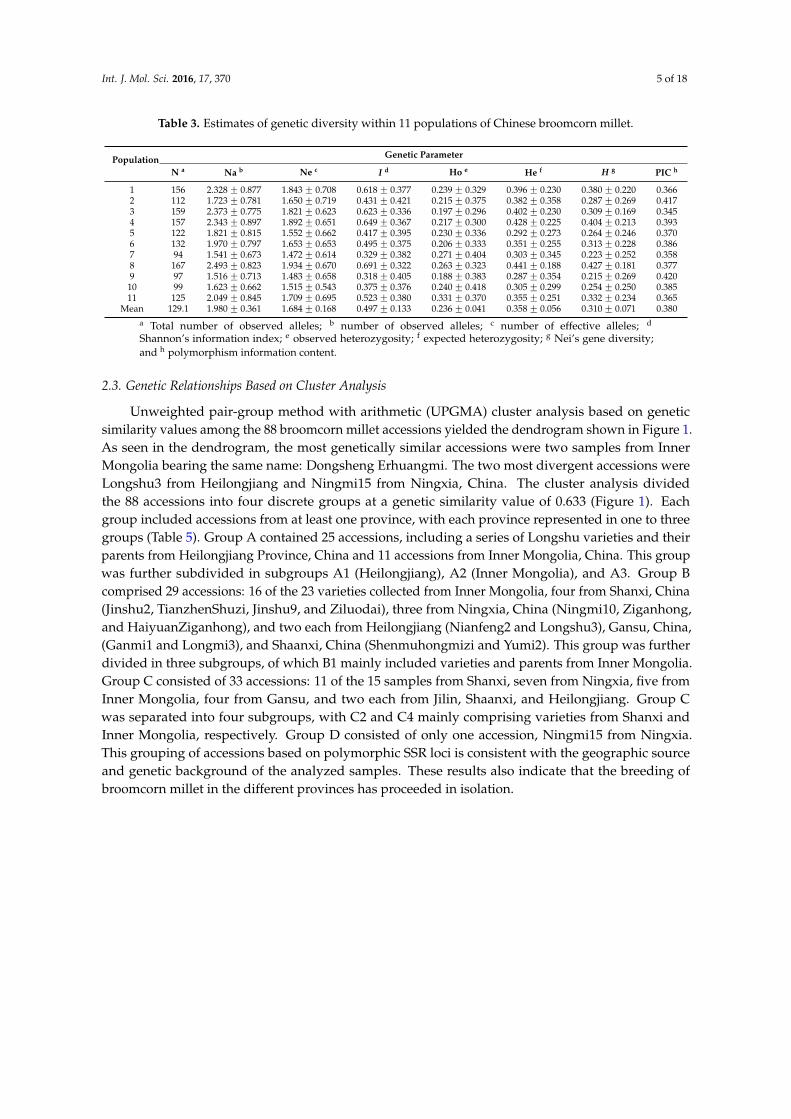
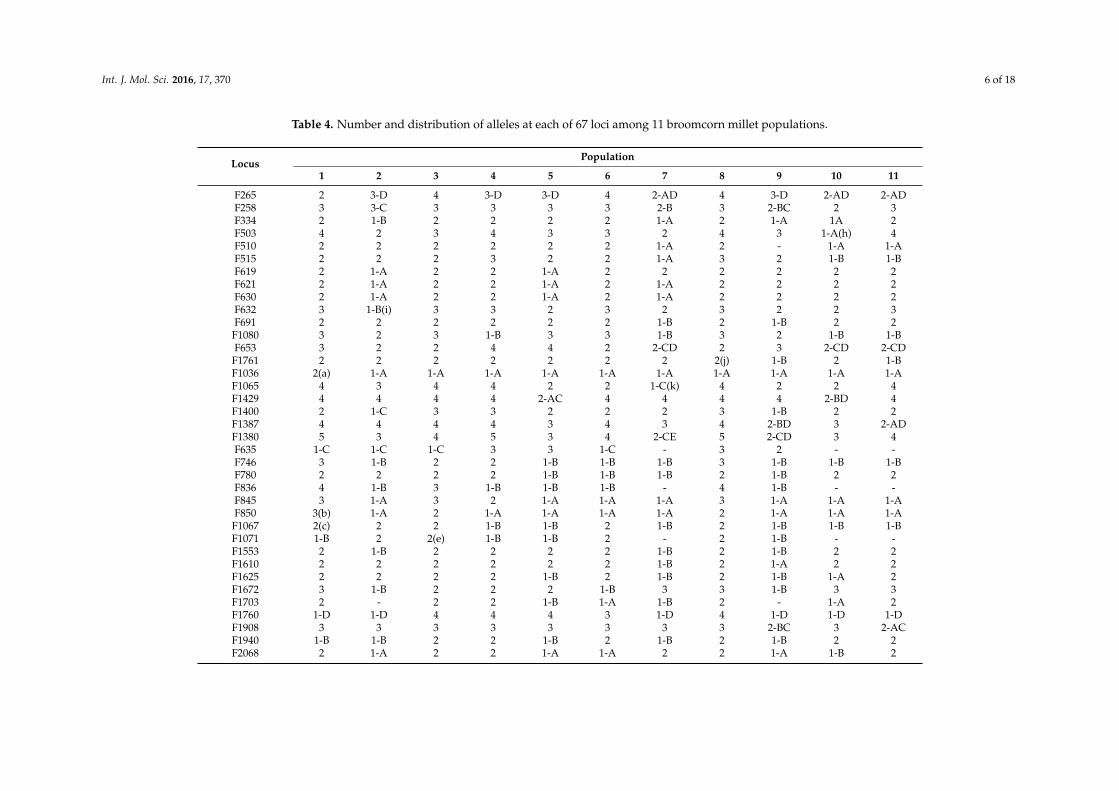
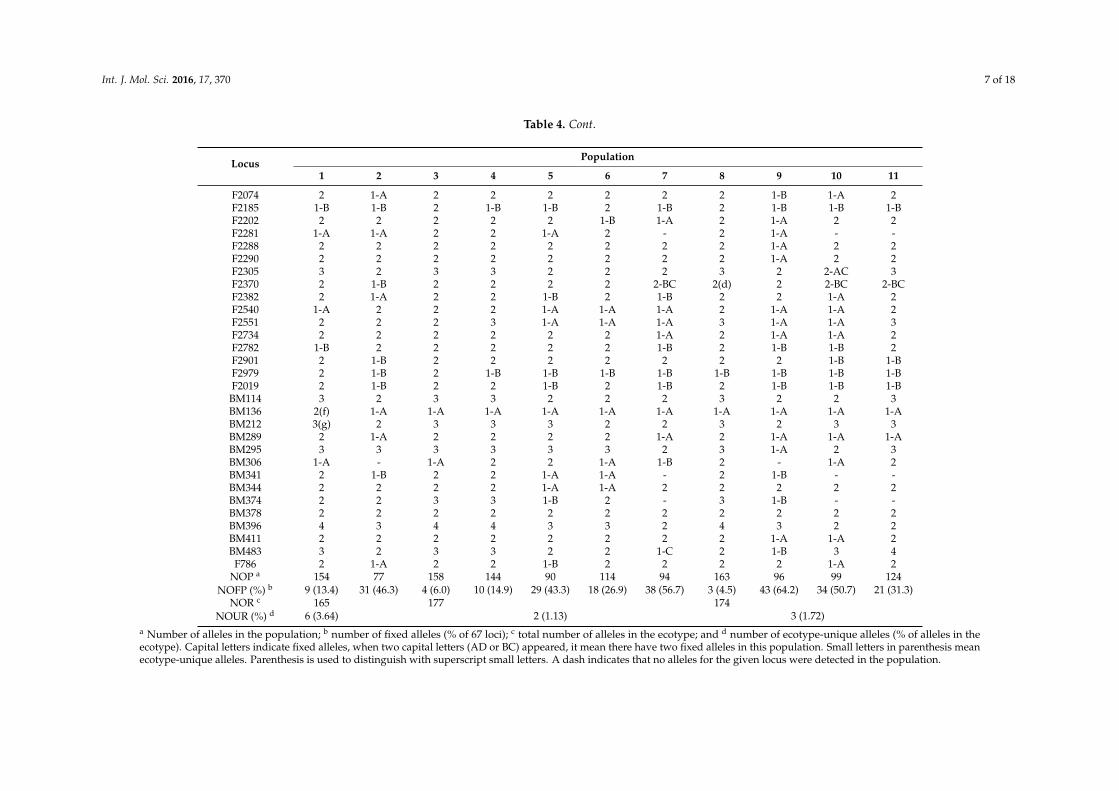
As evidenced by the estimates of population genetic diversity listed in Table 3, genetic differencesexisted among the 88 accessions derived from the 11 populations of five ecotypes. We detected 1420alleles at 67 SSR loci in the 88 accessions, with the total number of alleles in each population rangingfrom 94 to 167 (Table 4). A total of 240 alleles were fixed among the 11 populations (Table 4), withthe highest percentages of fixed alleles 64.2%, 56.7%, and 46.3% appearing in population 9, 7, and 2,respectively. Ap ranged from 38.84% to 95.52%, with a mean of 67.98% between populations, while Naper population ranged from 1.516 to 2.493 and averaged 1.980 (Table 3). Ho in each population variedfrom 0.197 to 0.33, with an average of 0.236. Average I, H, and PIC per locus varied among populationsfrom 0.318 to 0.619 (average = 0.497), 0.215–0.427 (average = 0.310), and 0.345–0.420 (average = 0.380),respectively. The lowest genetic parameter values were found in accessions constituting population 9;this finding implies that the accessions from population 9 were very closely related, with a majority ofloci (64.2%) observed to be fixed (Table 4). Accessions of population 8 which, from Inner Mongolia,China, exhibited the highest genetic diversity, displaying the highest values of all genetic parametersexcept for PIC.
Int. J. Mol. Sci. 2016, 17, 370 5 of 18
Table 3. Estimates of genetic diversity within 11 populations of Chinese broomcorn millet.
Population Genetic Parameter
N a Na b Ne c I d Ho e He f H g PIC h
1 156 2.328 ˘ 0.877 1.843 ˘ 0.708 0.618 ˘ 0.377 0.239 ˘ 0.329 0.396 ˘ 0.230 0.380 ˘ 0.220 0.3662 112 1.723 ˘ 0.781 1.650 ˘ 0.719 0.431 ˘ 0.421 0.215 ˘ 0.375 0.382 ˘ 0.358 0.287 ˘ 0.269 0.4173 159 2.373 ˘ 0.775 1.821 ˘ 0.623 0.623 ˘ 0.336 0.197 ˘ 0.296 0.402 ˘ 0.230 0.309 ˘ 0.169 0.3454 157 2.343 ˘ 0.897 1.892 ˘ 0.651 0.649 ˘ 0.367 0.217 ˘ 0.300 0.428 ˘ 0.225 0.404 ˘ 0.213 0.3935 122 1.821 ˘ 0.815 1.552 ˘ 0.662 0.417 ˘ 0.395 0.230 ˘ 0.336 0.292 ˘ 0.273 0.264 ˘ 0.246 0.3706 132 1.970 ˘ 0.797 1.653 ˘ 0.653 0.495 ˘ 0.375 0.206 ˘ 0.333 0.351 ˘ 0.255 0.313 ˘ 0.228 0.3867 94 1.541 ˘ 0.673 1.472 ˘ 0.614 0.329 ˘ 0.382 0.271 ˘ 0.404 0.303 ˘ 0.345 0.223 ˘ 0.252 0.3588 167 2.493 ˘ 0.823 1.934 ˘ 0.670 0.691 ˘ 0.322 0.263 ˘ 0.323 0.441 ˘ 0.188 0.427 ˘ 0.181 0.3779 97 1.516 ˘ 0.713 1.483 ˘ 0.658 0.318 ˘ 0.405 0.188 ˘ 0.383 0.287 ˘ 0.354 0.215 ˘ 0.269 0.420
10 99 1.623 ˘ 0.662 1.515 ˘ 0.543 0.375 ˘ 0.376 0.240 ˘ 0.418 0.305 ˘ 0.299 0.254 ˘ 0.250 0.38511 125 2.049 ˘ 0.845 1.709 ˘ 0.695 0.523 ˘ 0.380 0.331 ˘ 0.370 0.355 ˘ 0.251 0.332 ˘ 0.234 0.365
Mean 129.1 1.980 ˘ 0.361 1.684 ˘ 0.168 0.497 ˘ 0.133 0.236 ˘ 0.041 0.358 ˘ 0.056 0.310 ˘ 0.071 0.380a Total number of observed alleles; b number of observed alleles; c number of effective alleles; d
Shannon’s information index; e observed heterozygosity; f expected heterozygosity; g Nei’s gene diversity;and h polymorphism information content.
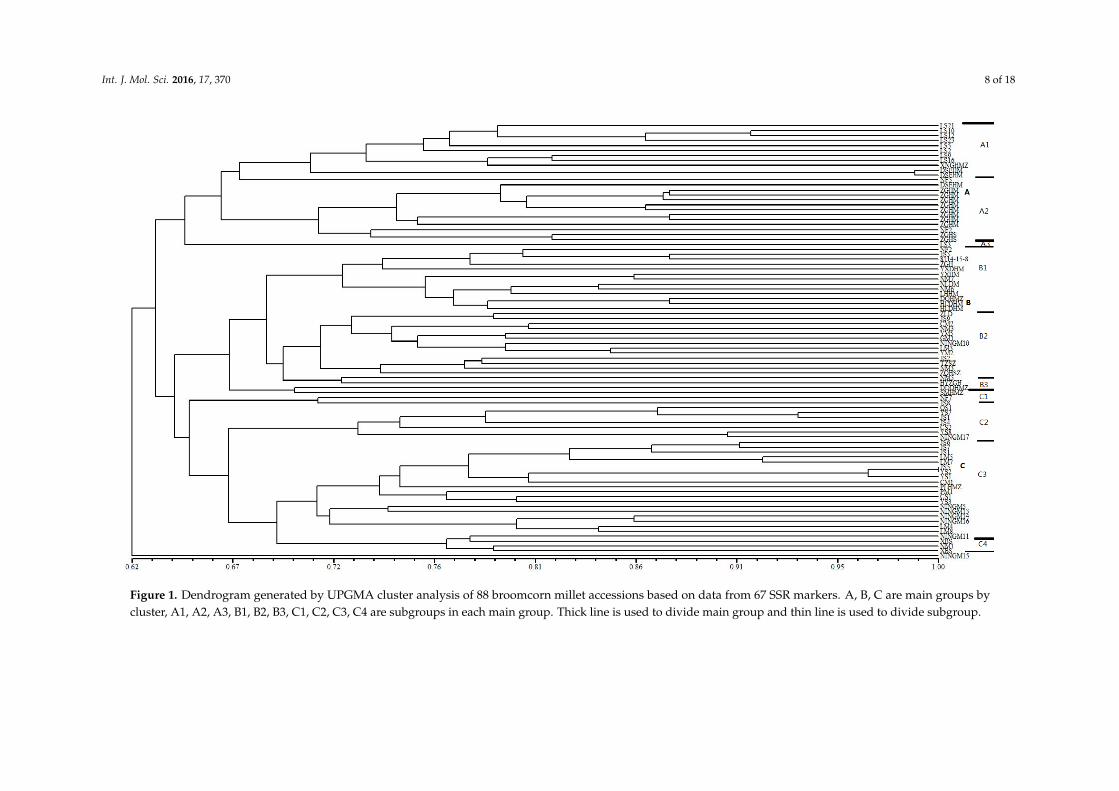
2.3. Genetic Relationships Based on Cluster Analysis
Unweighted pair-group method with arithmetic (UPGMA) cluster analysis based on geneticsimilarity values among the 88 broomcorn millet accessions yielded the dendrogram shown in Figure 1.As seen in the dendrogram, the most genetically similar accessions were two samples from InnerMongolia bearing the same name: Dongsheng Erhuangmi. The two most divergent accessions wereLongshu3 from Heilongjiang and Ningmi15 from Ningxia, China. The cluster analysis dividedthe 88 accessions into four discrete groups at a genetic similarity value of 0.633 (Figure 1). Eachgroup included accessions from at least one province, with each province represented in one to threegroups (Table 5). Group A contained 25 accessions, including a series of Longshu varieties and theirparents from Heilongjiang Province, China and 11 accessions from Inner Mongolia, China. This groupwas further subdivided in subgroups A1 (Heilongjiang), A2 (Inner Mongolia), and A3. Group Bcomprised 29 accessions: 16 of the 23 varieties collected from Inner Mongolia, four from Shanxi, China(Jinshu2, TianzhenShuzi, Jinshu9, and Ziluodai), three from Ningxia, China (Ningmi10, Ziganhong,and HaiyuanZiganhong), and two each from Heilongjiang (Nianfeng2 and Longshu3), Gansu, China,(Ganmi1 and Longmi3), and Shaanxi, China (Shenmuhongmizi and Yumi2). This group was furtherdivided in three subgroups, of which B1 mainly included varieties and parents from Inner Mongolia.Group C consisted of 33 accessions: 11 of the 15 samples from Shanxi, seven from Ningxia, five fromInner Mongolia, four from Gansu, and two each from Jilin, Shaanxi, and Heilongjiang. Group Cwas separated into four subgroups, with C2 and C4 mainly comprising varieties from Shanxi andInner Mongolia, respectively. Group D consisted of only one accession, Ningmi15 from Ningxia.This grouping of accessions based on polymorphic SSR loci is consistent with the geographic sourceand genetic background of the analyzed samples. These results also indicate that the breeding ofbroomcorn millet in the different provinces has proceeded in isolation.
Int. J. Mol. Sci. 2016, 17, 370 6 of 18
Table 4. Number and distribution of alleles at each of 67 loci among 11 broomcorn millet populations.
LocusPopulation
1 2 3 4 5 6 7 8 9 10 11
F265 2 3-D 4 3-D 3-D 4 2-AD 4 3-D 2-AD 2-ADF258 3 3-C 3 3 3 3 2-B 3 2-BC 2 3F334 2 1-B 2 2 2 2 1-A 2 1-A 1A 2F503 4 2 3 4 3 3 2 4 3 1-A(h) 4F510 2 2 2 2 2 2 1-A 2 - 1-A 1-AF515 2 2 2 3 2 2 1-A 3 2 1-B 1-BF619 2 1-A 2 2 1-A 2 2 2 2 2 2F621 2 1-A 2 2 1-A 2 1-A 2 2 2 2F630 2 1-A 2 2 1-A 2 1-A 2 2 2 2F632 3 1-B(i) 3 3 2 3 2 3 2 2 3F691 2 2 2 2 2 2 1-B 2 1-B 2 2
F1080 3 2 3 1-B 3 3 1-B 3 2 1-B 1-BF653 3 2 2 4 4 2 2-CD 2 3 2-CD 2-CD
F1761 2 2 2 2 2 2 2 2(j) 1-B 2 1-BF1036 2(a) 1-A 1-A 1-A 1-A 1-A 1-A 1-A 1-A 1-A 1-AF1065 4 3 4 4 2 2 1-C(k) 4 2 2 4F1429 4 4 4 4 2-AC 4 4 4 4 2-BD 4F1400 2 1-C 3 3 2 2 2 3 1-B 2 2F1387 4 4 4 4 3 4 3 4 2-BD 3 2-ADF1380 5 3 4 5 3 4 2-CE 5 2-CD 3 4F635 1-C 1-C 1-C 3 3 1-C - 3 2 - -F746 3 1-B 2 2 1-B 1-B 1-B 3 1-B 1-B 1-BF780 2 2 2 2 1-B 1-B 1-B 2 1-B 2 2F836 4 1-B 3 1-B 1-B 1-B - 4 1-B - -F845 3 1-A 3 2 1-A 1-A 1-A 3 1-A 1-A 1-AF850 3(b) 1-A 2 1-A 1-A 1-A 1-A 2 1-A 1-A 1-A
F1067 2(c) 2 2 1-B 1-B 2 1-B 2 1-B 1-B 1-BF1071 1-B 2 2(e) 1-B 1-B 2 - 2 1-B - -F1553 2 1-B 2 2 2 2 1-B 2 1-B 2 2F1610 2 2 2 2 2 2 1-B 2 1-A 2 2F1625 2 2 2 2 1-B 2 1-B 2 1-B 1-A 2F1672 3 1-B 2 2 2 1-B 3 3 1-B 3 3F1703 2 - 2 2 1-B 1-A 1-B 2 - 1-A 2F1760 1-D 1-D 4 4 4 3 1-D 4 1-D 1-D 1-DF1908 3 3 3 3 3 3 3 3 2-BC 3 2-ACF1940 1-B 1-B 2 2 1-B 2 1-B 2 1-B 2 2F2068 2 1-A 2 2 1-A 1-A 2 2 1-A 1-B 2
Int. J. Mol. Sci. 2016, 17, 370 7 of 18
Table 4. Cont.
LocusPopulation
1 2 3 4 5 6 7 8 9 10 11
F2074 2 1-A 2 2 2 2 2 2 1-B 1-A 2F2185 1-B 1-B 2 1-B 1-B 2 1-B 2 1-B 1-B 1-BF2202 2 2 2 2 2 1-B 1-A 2 1-A 2 2F2281 1-A 1-A 2 2 1-A 2 - 2 1-A - -F2288 2 2 2 2 2 2 2 2 1-A 2 2F2290 2 2 2 2 2 2 2 2 1-A 2 2F2305 3 2 3 3 2 2 2 3 2 2-AC 3F2370 2 1-B 2 2 2 2 2-BC 2(d) 2 2-BC 2-BCF2382 2 1-A 2 2 1-B 2 1-B 2 2 1-A 2F2540 1-A 2 2 2 1-A 1-A 1-A 2 1-A 1-A 2F2551 2 2 2 3 1-A 1-A 1-A 3 1-A 1-A 3F2734 2 2 2 2 2 2 1-A 2 1-A 1-A 2F2782 1-B 2 2 2 2 2 1-B 2 1-B 1-B 2F2901 2 1-B 2 2 2 2 2 2 2 1-B 1-BF2979 2 1-B 2 1-B 1-B 1-B 1-B 1-B 1-B 1-B 1-BF2019 2 1-B 2 2 1-B 2 1-B 2 1-B 1-B 1-B
BM114 3 2 3 3 2 2 2 3 2 2 3BM136 2(f) 1-A 1-A 1-A 1-A 1-A 1-A 1-A 1-A 1-A 1-ABM212 3(g) 2 3 3 3 2 2 3 2 3 3BM289 2 1-A 2 2 2 2 1-A 2 1-A 1-A 1-ABM295 3 3 3 3 3 3 2 3 1-A 2 3BM306 1-A - 1-A 2 2 1-A 1-B 2 - 1-A 2BM341 2 1-B 2 2 1-A 1-A - 2 1-B - -BM344 2 2 2 2 1-A 1-A 2 2 2 2 2BM374 2 2 3 3 1-B 2 - 3 1-B - -BM378 2 2 2 2 2 2 2 2 2 2 2BM396 4 3 4 4 3 3 2 4 3 2 2BM411 2 2 2 2 2 2 2 2 1-A 1-A 2BM483 3 2 3 3 2 2 1-C 2 1-B 3 4
F786 2 1-A 2 2 1-B 2 2 2 2 1-A 2NOP a 154 77 158 144 90 114 94 163 96 99 124
NOFP (%) b 9 (13.4) 31 (46.3) 4 (6.0) 10 (14.9) 29 (43.3) 18 (26.9) 38 (56.7) 3 (4.5) 43 (64.2) 34 (50.7) 21 (31.3)NOR c 165 177 174
NOUR (%) d 6 (3.64) 2 (1.13) 3 (1.72)a Number of alleles in the population; b number of fixed alleles (% of 67 loci); c total number of alleles in the ecotype; and d number of ecotype-unique alleles (% of alleles in theecotype). Capital letters indicate fixed alleles, when two capital letters (AD or BC) appeared, it mean there have two fixed alleles in this population. Small letters in parenthesis meanecotype-unique alleles. Parenthesis is used to distinguish with superscript small letters. A dash indicates that no alleles for the given locus were detected in the population.
Int. J. Mol. Sci. 2016, 17, 370 8 of 18
Int. J. Mol. Sci. 2016, 17, 370 8 of 16
Figure 1. Dendrogram generated by UPGMA cluster analysis of 88 broomcorn millet accessions based on data from 67 SSR markers. A, B, C are main groups by cluster, A1, A2, A3, B1, B2, B3, C1, C2, C3, C4 are subgroups in each main group. Thick line is used to divide main group and thin line is used to divide subgroup.
Figure 1. Dendrogram generated by UPGMA cluster analysis of 88 broomcorn millet accessions based on data from 67 SSR markers. A, B, C are main groups bycluster, A1, A2, A3, B1, B2, B3, C1, C2, C3, C4 are subgroups in each main group. Thick line is used to divide main group and thin line is used to divide subgroup.
Int. J. Mol. Sci. 2016, 17, 370 9 of 18
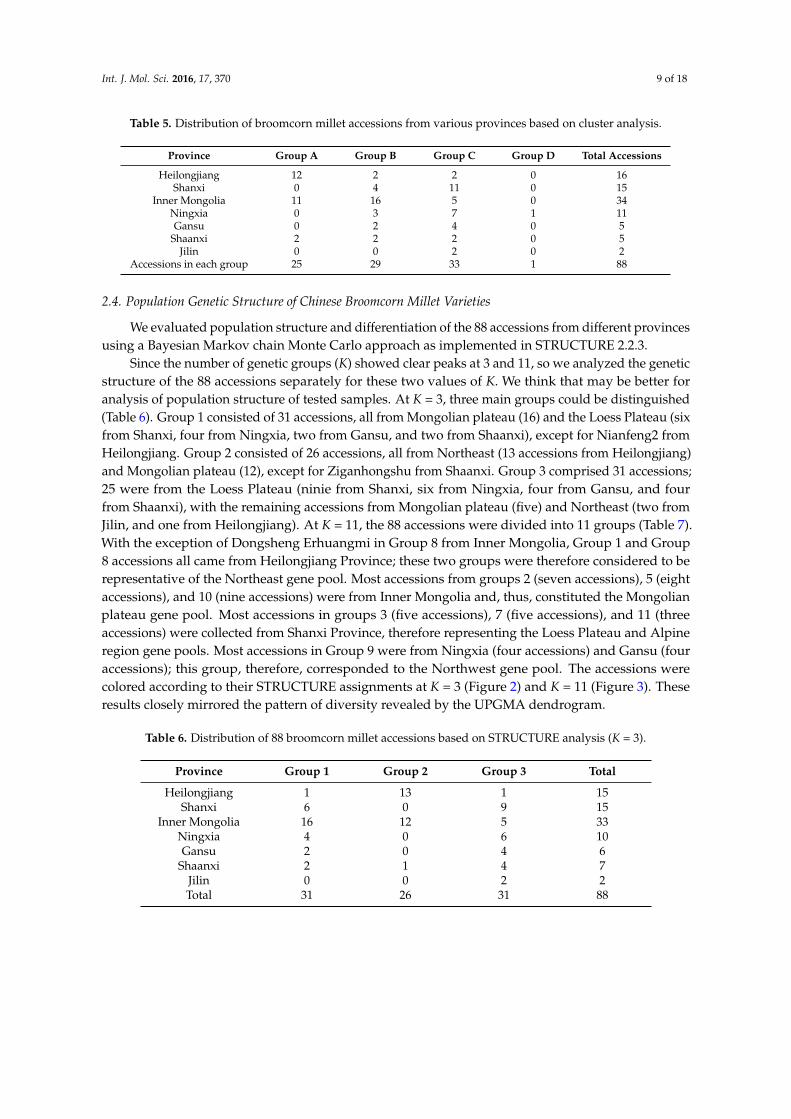
Table 5. Distribution of broomcorn millet accessions from various provinces based on cluster analysis.
Province Group A Group B Group C Group D Total Accessions
Heilongjiang 12 2 2 0 16Shanxi 0 4 11 0 15
Inner Mongolia 11 16 5 0 34Ningxia 0 3 7 1 11Gansu 0 2 4 0 5
Shaanxi 2 2 2 0 5Jilin 0 0 2 0 2
Accessions in each group 25 29 33 1 88
2.4. Population Genetic Structure of Chinese Broomcorn Millet Varieties
We evaluated population structure and differentiation of the 88 accessions from different provincesusing a Bayesian Markov chain Monte Carlo approach as implemented in STRUCTURE 2.2.3.
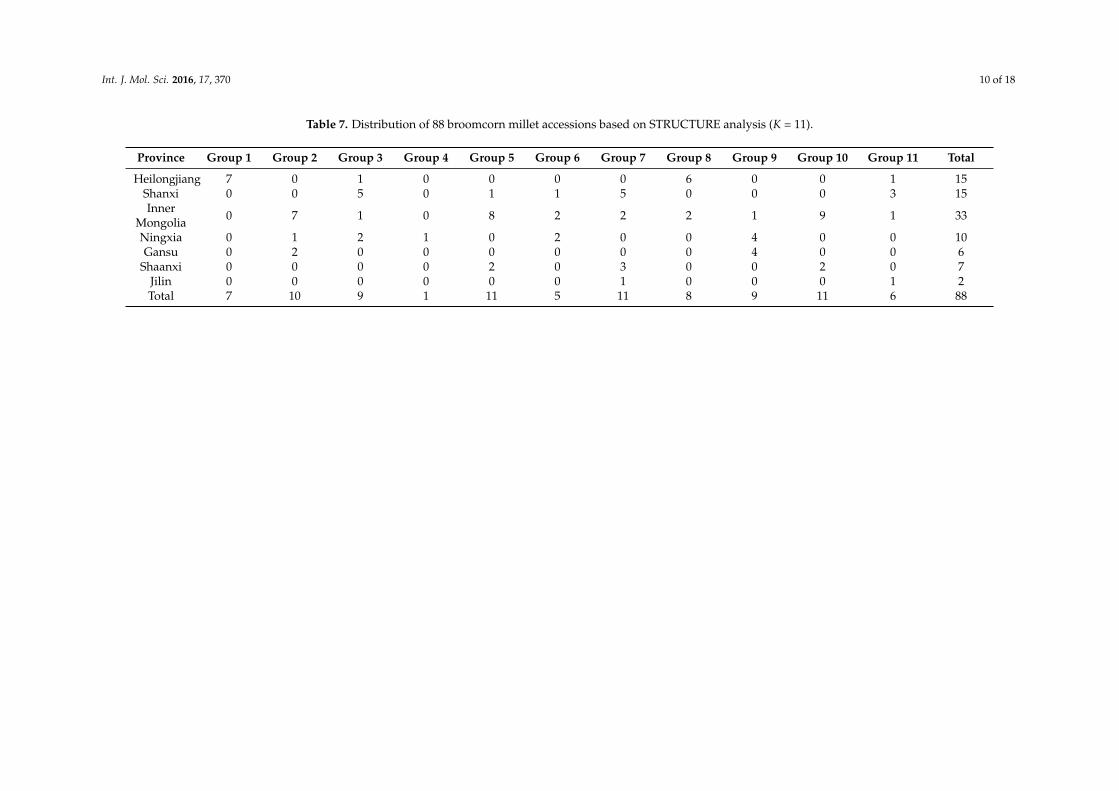
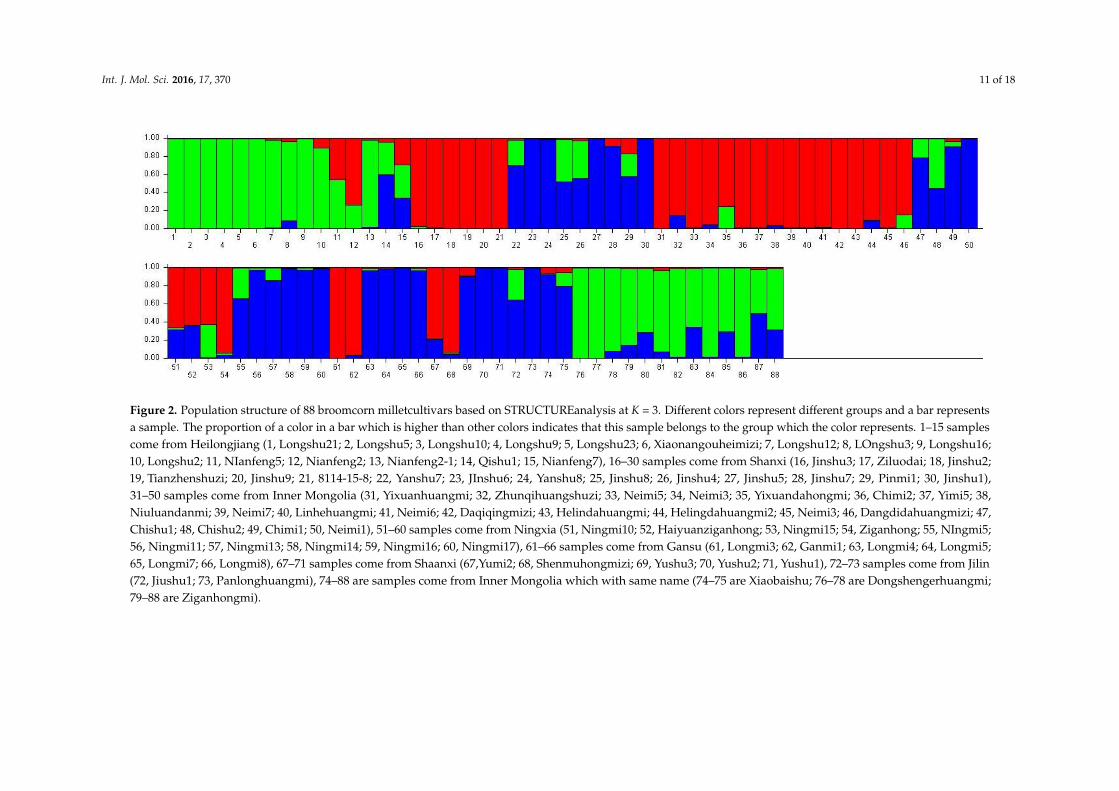
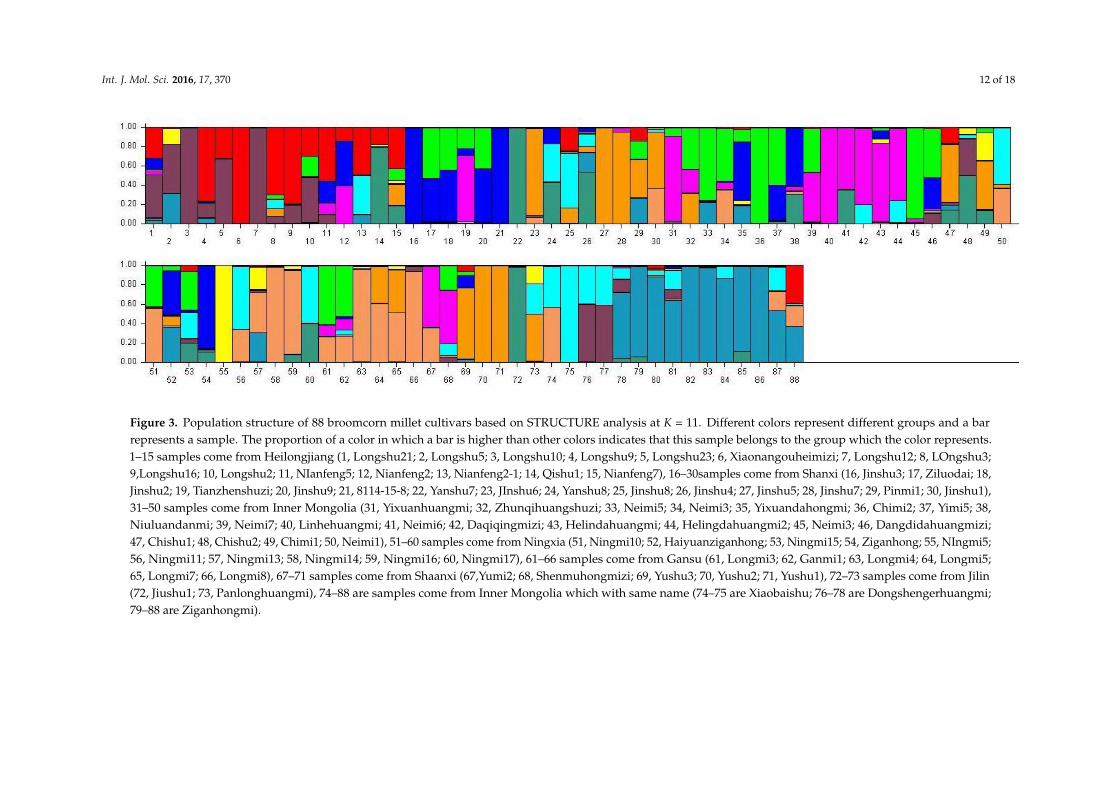
Since the number of genetic groups (K) showed clear peaks at 3 and 11, so we analyzed the geneticstructure of the 88 accessions separately for these two values of K. We think that may be better foranalysis of population structure of tested samples. At K = 3, three main groups could be distinguished(Table 6). Group 1 consisted of 31 accessions, all from Mongolian plateau (16) and the Loess Plateau (sixfrom Shanxi, four from Ningxia, two from Gansu, and two from Shaanxi), except for Nianfeng2 fromHeilongjiang. Group 2 consisted of 26 accessions, all from Northeast (13 accessions from Heilongjiang)and Mongolian plateau (12), except for Ziganhongshu from Shaanxi. Group 3 comprised 31 accessions;25 were from the Loess Plateau (ninie from Shanxi, six from Ningxia, four from Gansu, and fourfrom Shaanxi), with the remaining accessions from Mongolian plateau (five) and Northeast (two fromJilin, and one from Heilongjiang). At K = 11, the 88 accessions were divided into 11 groups (Table 7).With the exception of Dongsheng Erhuangmi in Group 8 from Inner Mongolia, Group 1 and Group8 accessions all came from Heilongjiang Province; these two groups were therefore considered to berepresentative of the Northeast gene pool. Most accessions from groups 2 (seven accessions), 5 (eightaccessions), and 10 (nine accessions) were from Inner Mongolia and, thus, constituted the Mongolianplateau gene pool. Most accessions in groups 3 (five accessions), 7 (five accessions), and 11 (threeaccessions) were collected from Shanxi Province, therefore representing the Loess Plateau and Alpineregion gene pools. Most accessions in Group 9 were from Ningxia (four accessions) and Gansu (fouraccessions); this group, therefore, corresponded to the Northwest gene pool. The accessions werecolored according to their STRUCTURE assignments at K = 3 (Figure 2) and K = 11 (Figure 3). Theseresults closely mirrored the pattern of diversity revealed by the UPGMA dendrogram.
Table 6. Distribution of 88 broomcorn millet accessions based on STRUCTURE analysis (K = 3).
Province Group 1 Group 2 Group 3 Total
Heilongjiang 1 13 1 15Shanxi 6 0 9 15
Inner Mongolia 16 12 5 33Ningxia 4 0 6 10Gansu 2 0 4 6
Shaanxi 2 1 4 7Jilin 0 0 2 2Total 31 26 31 88
Int. J. Mol. Sci. 2016, 17, 370 10 of 18
Table 7. Distribution of 88 broomcorn millet accessions based on STRUCTURE analysis (K = 11).
Province Group 1 Group 2 Group 3 Group 4 Group 5 Group 6 Group 7 Group 8 Group 9 Group 10 Group 11 Total
Heilongjiang 7 0 1 0 0 0 0 6 0 0 1 15Shanxi 0 0 5 0 1 1 5 0 0 0 3 15Inner
Mongolia 0 7 1 0 8 2 2 2 1 9 1 33
Ningxia 0 1 2 1 0 2 0 0 4 0 0 10Gansu 0 2 0 0 0 0 0 0 4 0 0 6
Shaanxi 0 0 0 0 2 0 3 0 0 2 0 7Jilin 0 0 0 0 0 0 1 0 0 0 1 2Total 7 10 9 1 11 5 11 8 9 11 6 88
Int. J. Mol. Sci. 2016, 17, 370 11 of 18
Figure 2. Population structure of 88 broomcorn milletcultivars based on STRUCTUREanalysis at K = 3. Different colors represent different groups and a bar representsa sample. The proportion of a color in a bar which is higher than other colors indicates that this sample belongs to the group which the color represents. 1–15 samplescome from Heilongjiang (1, Longshu21; 2, Longshu5; 3, Longshu10; 4, Longshu9; 5, Longshu23; 6, Xiaonangouheimizi; 7, Longshu12; 8, LOngshu3; 9, Longshu16;10, Longshu2; 11, NIanfeng5; 12, Nianfeng2; 13, Nianfeng2-1; 14, Qishu1; 15, Nianfeng7), 16–30 samples come from Shanxi (16, Jinshu3; 17, Ziluodai; 18, Jinshu2;19, Tianzhenshuzi; 20, Jinshu9; 21, 8114-15-8; 22, Yanshu7; 23, JInshu6; 24, Yanshu8; 25, Jinshu8; 26, Jinshu4; 27, Jinshu5; 28, Jinshu7; 29, Pinmi1; 30, Jinshu1),31–50 samples come from Inner Mongolia (31, Yixuanhuangmi; 32, Zhunqihuangshuzi; 33, Neimi5; 34, Neimi3; 35, Yixuandahongmi; 36, Chimi2; 37, Yimi5; 38,Niuluandanmi; 39, Neimi7; 40, Linhehuangmi; 41, Neimi6; 42, Daqiqingmizi; 43, Helindahuangmi; 44, Helingdahuangmi2; 45, Neimi3; 46, Dangdidahuangmizi; 47,Chishu1; 48, Chishu2; 49, Chimi1; 50, Neimi1), 51–60 samples come from Ningxia (51, Ningmi10; 52, Haiyuanziganhong; 53, Ningmi15; 54, Ziganhong; 55, NIngmi5;56, Ningmi11; 57, Ningmi13; 58, Ningmi14; 59, Ningmi16; 60, Ningmi17), 61–66 samples come from Gansu (61, Longmi3; 62, Ganmi1; 63, Longmi4; 64, Longmi5;65, Longmi7; 66, Longmi8), 67–71 samples come from Shaanxi (67,Yumi2; 68, Shenmuhongmizi; 69, Yushu3; 70, Yushu2; 71, Yushu1), 72–73 samples come from Jilin(72, Jiushu1; 73, Panlonghuangmi), 74–88 are samples come from Inner Mongolia which with same name (74–75 are Xiaobaishu; 76–78 are Dongshengerhuangmi;79–88 are Ziganhongmi).
Int. J. Mol. Sci. 2016, 17, 370 12 of 18
Figure 3. Population structure of 88 broomcorn millet cultivars based on STRUCTURE analysis at K = 11. Different colors represent different groups and a barrepresents a sample. The proportion of a color in which a bar is higher than other colors indicates that this sample belongs to the group which the color represents.1–15 samples come from Heilongjiang (1, Longshu21; 2, Longshu5; 3, Longshu10; 4, Longshu9; 5, Longshu23; 6, Xiaonangouheimizi; 7, Longshu12; 8, LOngshu3;9,Longshu16; 10, Longshu2; 11, NIanfeng5; 12, Nianfeng2; 13, Nianfeng2-1; 14, Qishu1; 15, Nianfeng7), 16–30samples come from Shanxi (16, Jinshu3; 17, Ziluodai; 18,Jinshu2; 19, Tianzhenshuzi; 20, Jinshu9; 21, 8114-15-8; 22, Yanshu7; 23, JInshu6; 24, Yanshu8; 25, Jinshu8; 26, Jinshu4; 27, Jinshu5; 28, Jinshu7; 29, Pinmi1; 30, Jinshu1),31–50 samples come from Inner Mongolia (31, Yixuanhuangmi; 32, Zhunqihuangshuzi; 33, Neimi5; 34, Neimi3; 35, Yixuandahongmi; 36, Chimi2; 37, Yimi5; 38,Niuluandanmi; 39, Neimi7; 40, Linhehuangmi; 41, Neimi6; 42, Daqiqingmizi; 43, Helindahuangmi; 44, Helingdahuangmi2; 45, Neimi3; 46, Dangdidahuangmizi;47, Chishu1; 48, Chishu2; 49, Chimi1; 50, Neimi1), 51–60 samples come from Ningxia (51, Ningmi10; 52, Haiyuanziganhong; 53, Ningmi15; 54, Ziganhong; 55, NIngmi5;56, Ningmi11; 57, Ningmi13; 58, Ningmi14; 59, Ningmi16; 60, Ningmi17), 61–66 samples come from Gansu (61, Longmi3; 62, Ganmi1; 63, Longmi4; 64, Longmi5;65, Longmi7; 66, Longmi8), 67–71 samples come from Shaanxi (67,Yumi2; 68, Shenmuhongmizi; 69, Yushu3; 70, Yushu2; 71, Yushu1), 72–73 samples come from Jilin(72, Jiushu1; 73, Panlonghuangmi), 74–88 are samples come from Inner Mongolia which with same name (74–75 are Xiaobaishu; 76–78 are Dongshengerhuangmi;79–88 are Ziganhongmi).
Int. J. Mol. Sci. 2016, 17, 370 13 of 18
3. Discussion
3.1. Genetic Diversity and Population Structure of Broomcorn Millet in China
Broomcorn millet, one of the most ancient drought- and salt-resistant cereal crops [24–26] with anextremely short ripening time, is extensively cultivated for food and fodder in China, India, Russia,Central Europe, the Middle East, and North America [4]. As recorded in descriptions and datastandards for broomcorn millet [27], the crop shows a high degree of variation in morphologicalfeatures such as seed color (white, gray, yellow, red, brown, black, or compound), panicle type(lateral-or dense-panicled), inflorescence color (green or purple), and grain number per spikelet (oneto three) across its distributional range. Although subspecies, races, and biotypes of broomcorn millethave been proposed [28], the races may not have eco-geographic unity, and weedy and wild types areoften indistinguishable from cultivated varieties. Attempts to use isozymes and protein markers todistinguish the interspecies have not been successful [19,20]. Although molecular markers, such asRAPDs [20], AFLPs [21], inter-simple sequence repeats [6], single nucleotide polymorphisms [6], andSSRs [4,22,23] have been used to study broomcorn millet and its relatives, different conclusions havebeen obtained regarding its genetic diversity. M’Ribu and Hilu [20] used RAPDs to assess variation infour Panicum species and broomcorn millet; they found that broomcorn millet accessions exhibitedhigh polymorphism levels and grouped together according to their geographical regions of origin.Conversely, Karam [21] compared the genetic diversity of three domestic and nine wild broomcornmillet biotypes from the United State and Canada; in that study, estimated genetic distances amongbiotypes ranged from 0.02 to 0.04, and a UPGMA cluster analysis revealed two distinct groups withno geographic association. These conflicting results may be due to the use of samples of differentorigins or unsuitable molecular markers. In our study, we analyzed 88 broomcorn millet accessions,including 56 cultivated varieties and 32 landraces, with several of the latter being parents of somevarieties. The 67 SSR primers in our study possessed an average of 2.71 alleles per locus, and the valueof PIC and He was 0.376 and 0.445, respectively. These important genetic parameters are higher thanthose reported for broomcorn millet from other countries based on SSR [23] or RAPD [20] markers,but lower than those uncovered in Chinese landraces [22]. The genetic diversity of China broomcornmillet thus appears to be much richer than that of other countries. In the UPGMA analysis in ourstudy, cultivated varieties were grouped according to the geographical regions in which they wereregistered, with specific varieties and their parents often placed in the same group. This result is inaccordance with that of most previous research [20,22,23], and indicates the existence of extensivegenetic variation within different ecological growth areas and complex genetic relationships betweenvarious populations of broomcorn millet. The isolated position of Ningmi15 (from Ningxia Province)in the dendrogram is probably due to a high number of missing data points.
The observed association of varieties from contiguous regions such as Gansu and Ningxia hasseveral possible explanations, such as similar natural conditions, artificial selection within the tworegions, or seed movement and gene flow [20]. On the basis of their mixed genetic structures, mostof the varieties tested in this study seem to be derived from hybridization events. For example,evidence of hybridization can be discerned for Longshu23 (accession 5 in Figure 3, with maleparent XiaonangouHeimizi and female parent Longshu12), Jinshu9 (accession 20, with 8114-15-8as one parent), Neimi5 (accession 33), and Neimi7 (accession 39, with parents LinheHuangmi andZhunqiHuangshuzi).The results of cluster and genetic structure analysis revealed by our study will bevaluable for defining gene pools and developing breeding programs for broomcorn millet. Breederscan select suitable accessions in their own ecotype to cross according to the dendrogram result.
3.2. SSRs as Effective Molecular Markers for Genetic Diversity Assessment of Broomcorn Millet
Compared with many other molecular markers, SSRs have several advantages: they are abundantand highly polymorphic, codominantly inherited, analytically simple, and readily transferable [29].SSRs have been widely used to analyze the genetic diversity of various crop species. The first
Int. J. Mol. Sci. 2016, 17, 370 14 of 18
application of SSRs to broomcorn millet was by Hu et al. [22], who selected 983 SSR primers, including450 from rice, 380 from wheat, 115 from oat, and 38 from barley to evaluate the genetic diversityof 118 broomcorn millet accessions. Although their study revealed a high level of genetic diversity,applicability of the SSR markers transferred from other crops was low: only 46 (4.6%) of the 983 primersgenerated clear and reproducible polymorphic fragments. To effectively evaluate the genetic diversityof broomcorn millet, additional millet-specific markers are therefore needed. Recent advances in libraryenrichment techniques and automated sequencing have simplified and accelerated the developmentof SSR markers in a cost-effective way [23]. As a result, species-specific SSR markers for variouscrops, such as foxtail millet [30], oats [31], faba bean [32], and grasspea [33], have been developedand characterized for future studies. Cho et al. [23] developed and characterized 25 polymorphic SSRmarkers for broomcorn millet through construction of an SSR-enriched library obtained from genomicDNA. Nevertheless, the number of polymorphic SSRs developed in that study was insufficient forthe evaluation of the more than 8800 accessions of broomcorn millet conserved in the National Centerfor Crop Germplasm Conservation of China. We, therefore, used high-throughput sequencing todevelop 500 SSR primer pairs in our laboratory and screened them for polymorphisms using eightrepresentatives randomly selected from 88 accessions. Of the 500 pairs, 162 (32.4%) produced clear,reproducible, polymorphic fragments; 67 (13.4%) were additionally found to be polymorphic in morethan 80% of accessions. After comparing our results with previous research [22], we conclude thatthe millet-specific SSR markers developed in this study have higher efficiency than SSRs transferredfrom other crops; they should serve as useful tools for the assessment of genetic diversity and theelucidation of population structure in broomcorn millet.
3.3. Origin and Evolution of Broomcorn Millet
Although Central Asia, China, and Central Europe have all been proposed as the specific area ofdomestication of broomcorn millet and its wild ancestors, the original location has not been definitivelydetermined [34]. In addition, in situ hybridization has suggested that witch grass (P. capillare L.), aweedy, diploid (2n = 18) New World species, may be an ancestor of broomcorn millet [34]. Analysis ofgenetic diversity can provide insights into the origin and evolution of broomcorn millet. Our studyrevealed that Chinese accessions are typically more genetically diverse than those of other countries, aresult consistent with the findings of Hu et al. [22]. Those authors also observed that genetic similaritycoefficients of Loess Plateau ecotype accessions were significantly lower than those of other ecotypes,suggesting that the Loess Plateau is the original site of P. miliaceum. In our study, the genetic diversityof accessions from the Mongolian Plateau was slightly higher than that of other ecotypes, perhapsbecause of the effects of breeding programs or other reasons requiring further investigation.
4. Materials and Methods
4.1. Plant Materials
A total of 88 broomcorn millet accessions (56 varieties and 32 parents) collected from sevenmain millet-producing Chinese provinces were provided by the institutions listed in Table S1.Theseaccessions were divided into 11 populations according to sources. Populations 8–11 are four landracepopulations, with all accessions from a given population having the same name. As indicated inTable S1, the 88 accessions belonged to five different ecotypes: Northeast (20 accessions), LoessPlateau (17), Mongolian Plateau (29), Northwest (16), and Alpine Region (6). Prior to experimentaluse, all plant materials were reproduced for three generations through strict self-crossing.
4.2. DNA Isolation
Seeds of each accession were sown in plastic pots (10 cm diameter) and grown under greenhouseconditions. Total genomic DNA was extracted from young leaves of 15–20-day old seedlings based onthe modified cetyltrimethylammonium bromide method described by Edward et al. [35]. The relative
Int. J. Mol. Sci. 2016, 17, 370 15 of 18
purity and concentration of extracted DNA was evaluated on a Nano Drop ND-1000 instrument(NanoDrop, Wilmington, DE, USA). The final concentration of each DNA sample was adjustedto 30 ng¨µL´1.
4.3. Primer Screening and Microsatellite Amplification
We used 500 pairs of SSR primers (Table S2.) developed in our laboratory by high-throughputsequencing to identify polymorphisms in eight representatives randomly selected from the 73non-repeated accessions. All primers were synthesized by Dingguo Gene Co. (Beijing, China). Atotal of 162 primer pairs producing clear and reproducible polymorphic fragments among the eightaccessions were used in further tests to assess the genetic diversity of all 88 accessions.
Polymerase chain reaction (PCR) amplifications were performed in 10 µL volumes containing1.6 µL of 10ˆ PCR buffer (containing 20 mM¨ Mg2+), 0.2 µL of each 10 mM dNTP, 0.1 µL of 5 U¨µL´1
Taq DNA polymerase, 0.5 µL of a 5 µM solution of each primer, 1 µL of 30 ng¨µL´1 genomic DNA,and 6.1 µL of ddH2O. Reactions were carried out in a PTC-100 Thermo-Cycler (ALT INC., East Lyme,CT, USA) using the program as follows: (1) initial denaturation at 94 ˝C for 5 min; (2) 39 cycles ofdenaturation at 94 ˝C for 45 s; (3) annealing at 55 ˝C for 50 s; (4) extension at 72 ˝C for 1 min; (5) a finalextension at 72 ˝C for 10 min. The PCR-amplified products were resolved by 8% polyacrylamide gelelectrophoresis, with DNA bands visualized by silver nitrate staining. Allele sizes were determinedusing a 50-bp DNA ladder (Tiangen, Beijing, China).
4.4. Data Analysis
Allele presence and absence was scored for each SSR marker as 1 and 0, respectively. These scoreswere stored in an Excel file as a binary matrix and served as the basis of the genetic diversity analysis.
POPGENE 1.31 [36] was used to calculate the following measures of genetic diversity: observednumber of alleles (Na), effective number of alleles (Ne), observed heterozygosity (Ho), expectedheterozygosity (He), Nei’s gene diversity (H) [37], and the Shannon–Weaver index (I). Geographicaldifferentiation was evaluated by estimating F-statistic (FST) values among geographical regions usingPOPGENE. The Simpson diversity index for each SSR, also known as the polymorphism informationcontent (PIC), was calculated using the program PIC-CALC 0.6. Using a similarity matrix generatedfrom the proportion of shared fragments [38], genetic relationships among genotypes were determinedby cluster analysis based on the unweighted pair group method of mathematical averages (UPGMA) asimplemented in NTSYS2.1. We used STRUCTURE version 2.3.4 to identify genetic groups within the 88broomcorn millet varieties and their parents. STRUCTURE analysis is a Bayesian approach that uses noa priori classification and divides samples into K populations according to the allele frequencies at eachlocus. The most likely number of genetic groups (K = 1 to 10) was estimated following the procedure ofEvanno et al. [39], who proposed the ad hoc statistic ∆K. Program settings included admixture ancestryand correlated marker frequency models, with α inferred from the data and lambda set to 1 [39].Twenty independent Markov chain Monte Carlo runs, each consisting of 1,000,000 iterations with aburn-in of 500,000 iterations, were carried out for each K.
5. Conclusions
In conclusion, our data indicates there have abundant genetic variation within different ecologicalgrowth areas and complex genetic relationships between various populations of broomcorn millet.On the other hand, the millet-specific SSR markers developed in this study can be served as effectivemolecular tools for the assessment of genetic diversity and the elucidation of population structure inbroomcorn millet.
Supplementary Materials: The supplementary materials are available online at www.mdpi.com/1422-0067/17/3/370/s1.
Int. J. Mol. Sci. 2016, 17, 370 16 of 18
Acknowledgments: This research was supported by the Agricultural Science and Technology Innovation Program,the National Science Foundation for Young Scientists of China (Grant No. 31301386) and the China AgricultureResearch System (CARS-07-12[1].5-A1). We thank Tianyu Yang of the Institute of Crop Breeding, Gansu Academyof Agricultural Sciences, for kindly providing seed material.
Author Contributions: Minxuan Liu performed designed experiment, statistical analysis, and drafted themanuscript. Yue Xu assisted in designing SSR primer and preparing the manuscript. Jihong He worked for thevalidation identification of SSR markers. Yinyue Wang worked on PCR experiment. Shuang Zhang prepared allthe seeds of broomcorn millet and DNA isolation. Ping Lu designed and coordinated the study. All authors readand approved the final manuscript.
Conflicts of Interest: The authors declare no conflict of interest.
References
1. Jana, K.; Jan, M. Content and quality of protein in proso millet (Panicum miliaceum L.) varieties. Plant FoodsHum. Nutr. 2006, 61, 45–49.
2. Crawford, G.W. Agricultural origins in North China pushed back to the Pleistocene–Holocene boundary.Proc. Natl. Acad. Sci. USA 2009, 106, 7271–7272. [CrossRef] [PubMed]
3. Wang, L.; Wang, X.Y.; Wen, Q.F. Research and utilization of proso millet germplasm resource in China.J. Plant Genet. Res. 2005, 6, 471–474.
4. Hunt, H.V.; Campana, M.G.; Lawes, M.C.; Park, Y.J.; Bower, M.A.; Howe, C.J.; Jones, M.K. Genetic diversityand phylogeography of broomcorn millet (Panicum miliaceum L.) across Eurasia. Mol. Ecol. 2011, 20,4756–4771. [CrossRef] [PubMed]
5. Bridges, D.C. Crop losses due to weeds in the United States; Weed Science Society of America: Champaign, IL,USA, 1992; pp. 75–147.
6. Lágler, R.; Gyulai, G.; Humphreys, M.; Szabó, Z.; Horváth, L.; Bittsánszky, A.; Kiss, J.; Holly, L.; Heszky, L.Morphological and molecular analysis of common millet (P. miliaceum) cultivars compared to a DNA samplefrom the 15th century (Hungary). Euphytica 2005, 146, 77–85. [CrossRef]
7. Dong, Y.C.; Zheng, D.S. Crops and Their Wild Relatives in China; China Agriculture Press: Beijing, China, 2006;pp. 331–359.
8. Li, Y.; Guan, R.; Liu, Z.; Ma, Y.; Wang, L.; Li, L.; Lin, F.; Luan, W.; Chen, P.; Yan, Z. Genetic structure anddiversity of cultivated soybean (Glycine max (L.) Merr.) landraces in China. Theor. Appl. Genet. 2008, 117,857–871. [CrossRef] [PubMed]
9. Che, Y.H.; Li, H.J.; Yang, Y.P.; Yang, X.M.; Li, X.Q.; Li, L.H. On the use of SSR markers for the geneticcharacterization of the Agropyron cristatum (L.) Gaertn. in Northern China. Genet. Resour. Crop Evol. 2008, 55,389–396. [CrossRef]
10. Wang, L.; Guan, R.; Zhang, X.L.; Chang, R.; Qiu, L. Genetic diversity of Chinese cultivated soybean revealedby SSR markers. Crop Sci. 2006, 46, 1032–1038. [CrossRef]
11. Tara Satyavathi, C.; Bhat, K.V.; Bharadwaj, C.; Tiwari, S.P.; Chaudhury, V.K. AFLP analysis of genetic diversityin Indian soybean [Glycine max (L.) Merr.] varieties. Genet. Resour. Crop Evol. 2006, 53, 1069–1079. [CrossRef]
12. Barkley, N.A.; Dean, R.E.; Pittman, R.N.; Wang, M.L.; Holbrook, C.C.; Pederson, G.A. Genetic diversity ofcultivated and wild-type peanuts evaluated with M13-tailed SSR markers and sequencing. Genet. Res. 2007,89, 93–106. [CrossRef] [PubMed]
13. Eleuch, L.; Jilal, A.; Grando, S.; Ceccarelli, S.; Schmising, M.V.K.; Tsujimoto, H.; Hajer, A.; Daaloul, A.;Baum, M. Genetic diversity and association analysis for salinity tolerance, heading date and plant height ofbarley germplasm using simple sequence repeat markers. J. Integr. Plant Biol. 2008, 50, 1004–1014. [CrossRef][PubMed]
14. Wen, Z.X.; Ding, Y.L.; Zhao, T.N.; Gai, J.Y. Genetic diversity and peculiarity of annual wild soybean(G. soja Sieb. et Zucc.) from various eco-regions in China. Theor. Appl. Genet. 2009, 119, 371–381. [CrossRef][PubMed]
15. Li, R.Y.; Zhang, H.; Zhou, X.C.; Guan, Y.A.; Yao, F.X.; Song, G.A.; Wang, J.C.; Zhang, C.Q. Genetic diversityin Chinese sorghum landraces revealed by chloroplast simple sequence repeats. Genet. Resour. Crop Evol.2010, 57, 1–15. [CrossRef]
Int. J. Mol. Sci. 2016, 17, 370 17 of 18
16. Badiane, F.A.; Gowda, B.S.; Cissé, N.; Diouf, D.; Sadio, O.; Timko, M.P. Genetic relationship of cowpea(Vigna unguiculata) varieties from Senegal based on SSR markers. Genet. Mol. Res. 2012, 11, 292–304.[CrossRef] [PubMed]
17. Wang, C.F.; Jia, G.Q.; Zhi, H.; Niu, Z.G.; Chai, Y.; Li, W.; Wang, Y.F.; Li, H.Q.; Lu, P.; Zhao, B.H.; et al. Geneticdiversity and population structure of Chinese foxtail millet [Setaria italica (L.) Beauv.] landraces. G3 2012, 2,769–777. [CrossRef] [PubMed]
18. Guo, X.M.; Gao, A.N.; Liu, W.H.; Yang, X.M.; Li, X.Q.; Li, L.H. Evaluation of genetic diversity, populationstructure, and linkage disequilibrium among elite Chinese wheat (Triticumaestivum L.) cultivars. Aust. J.Crop Sci. 2011, 5, 1167–1172.
19. Warwick, S.I. Isozyme variation in proso millet. J. Hered. 1987, 78, 210–212.20. M'Ribu, H.K.; Hilu, K.W. Detection of interspecific and intraspecific variation in Panicum millets through
random amplified polymorphic DNA. Theor. Appl. Genet. 1994, 88, 412–416. [CrossRef] [PubMed]21. Karam, D.; Westra, P.; Nissen, S.J.; Ward, S.M.; Figueiredo, J.E.F. Genetic diversity among proso millet
(Panicum miliaceum) biotypes assessed by AFLP techniques. PlantaDaninha 2004, 22, 167–174. [CrossRef]22. Hu, X.Y.; Wang, J.F.; Lu, P.; Zhang, H.S. Assessment of genetic diversity in broomcorn millet
(Panicum miliaceum L.) using SSR markers. J. Genet. Genom. 2009, 36, 491–500. [CrossRef]23. Cho, Y.; Chung, J.W.; Lee, G.A.; Ma, K.H.; Dixit, A.; Gwag, J.G.; Park, Y.J. Development and characterization
of twenty-five new polymorphic microsatellite markers in proso millet (Panicum miliaceum L.). Genes Genom.2010, 32, 267–273. [CrossRef]
24. Graybosch, R.A.; Baltensperger, D.D. Evaluation of the waxy endosperm trait in proso millet(Panicum miliaceum). Plant Breed. 2009, 128, 70–73. [CrossRef]
25. Liu, M.X.; Qiao, Z.J.; Zhang, S.; Wang, Y.Y.; Lu, P. Response of broomcorn millet (Panicum miliaceum L.)genotypes from semiarid regions of China to salt stress. Crop J. 2015, 3, 57–66. [CrossRef]
26. Liu, M.X.; Zhang, Z.W.; Wu, B.; Lu, P. Evaluation of mixed salt-tolerance at germination stage and seedlingstage and the related physiological characteristics of Panicum miliaceum L. Sci. Agric. Sin. 2012, 18, 3733–3743.
27. Wang, X.Y.; Wang, L. Descriptors and Data Standard for Broomcorn Millet (Panicum miliaceum L.); ChinaAgriculture Press: Beijing, China, 2006; pp. 25–37.
28. Harlan, J.R. Crops and Man, 2nd ed.; American Society of Agronomy-Crop Science Society: Madison, WC,USA, 1992.
29. Weber, J.L. Informativeness of human (dC-dA)n¨ (dG-dT)n polymorphism. Genomics 1990, 7, 524–530.[CrossRef]
30. Jia, X.P.; Zhang, Z.B.; Liu, Y.H.; Zhang, C.W.; Shi, Y.S.; Song, Y.C.; Wang, T.Y.; Li, Y. Development and geneticmapping of SSR markers in foxtail millet [Setaria italica (L.) P. Beauv.]. Theor. Appl. Genet. 2009, 118, 821–829.[CrossRef] [PubMed]
31. Wu, B.; Lu, P.; Zhang, Z.W. Recombinant microsatellite amplification: A rapid method for developing simplesequence repeat markers. Mol. Breed. 2012, 29, 53–59. [CrossRef]
32. Yang, T.; Bao, S.Y.; Ford, R.; Jia, T.J.; Guan, J.P.; He, Y.H.; Sun, X.L.; Jiang, J.Y.; Hao, J.J.; Zhang, X.Y.; et al.High-throughput novel microsatellite marker of faba bean via next generation sequencing. BMC Genom.2012, 13, 602. [CrossRef] [PubMed]
33. Yang, T.; Jiang, J.Y.; Burlyaeva, M.; Hu, J.G.; Coyne, C.J.; Kumar, S.; Redden, R.; Sun, X.L.; Wang, F.;Chang, J.W.; et al. Large-scale microsatellite development in grasspea (Lathyrus sativus L.), an orphan legumeof the arid areas. BMC Plant Biol. 2014, 14, 65. [CrossRef] [PubMed]
34. Hunt, H.V.; Badakshi, F.; Romanova, O.; Howe, C.J.; Jones, M.K.; Heslop-Harrison, J.S.P. Reticulate evolutionin Panicum (Poaceae): The origin of tetraploid broomcorn millet, P. miliaceum. J. Exp. Bot. 2014. [CrossRef][PubMed]
35. Edwards, K.; Johnstone, C.; Thompson, C. A simple andrapid method for the preparation of plant genomicDNA for PCR analysis. Nucleic Acids. Res. 1991, 19, 1349. [CrossRef] [PubMed]
36. Yeh, F.C.; Yang, R.C.; Boyle, T. POPGENE Software Package Version 1.31 for Population Genetic Analysis;University of Alberta: Edmonton, AB, Canada, 1999.
37. Nei, M. Analysis of gene diversity in subdivided populations. Proc. Natl. Acad. Sci. USA 1973, 70, 3321–3323.[CrossRef] [PubMed]

Int. J. Mol. Sci. 2016, 17, 370 18 of 18
38. Nei, M.; Li, W.H. Mathematical model for studying genetic variation in terms of restriction endonucleases.Proc. Natl. Acad. Sci. USA 1979, 76, 5269–5273. [CrossRef] [PubMed]
39. Evanno, G.; Regnaut, S.; Goudet, J. Detecting the number of clusters of individuals using the softwareSTRUCTURE: A simulation study. Mol. Ecol. 2005, 14, 2611–2620. [CrossRef] [PubMed]
© 2016 by the authors; licensee MDPI, Basel, Switzerland. This article is an open accessarticle distributed under the terms and conditions of the Creative Commons by Attribution(CC-BY) license (http://creativecommons.org/licenses/by/4.0/).