Embed Size (px)
Citation preview

1 June 16, 2014
Genetic diversity analysis of Eligmocarpus cynometroides, an endangered
priority species for conservation in the littoral forests of Madagascar
Final Report
Dr. Sarada Krishnan
1. Background & Introduction
The littoral forest of Madagascar is a distinctive type of humid evergreen forest restricted to
unconsolidated sand located within a few kilometers from the Indian Ocean (Lowry et al.
2008). The littoral forests, which once occupied much of the coastal fringe of eastern
Madagascar and were contiguous with the dense humid lowland evergreen forests, now,
persist only in small fragments (de Gouvenain and Silander 2003). The original size of this
habitat was less than 1% of Madagascar’s total surface area, and today exists in only about
10% of its original range (Moat and Smith 2007) with only about 1.5% of the remaining
fragments included within the existing protected areas network (Consiglio et al. 2005). Even
though the habitat range is very small, the littoral forests harbor about 13% of Madagascar‟s
total native flora, of which 25% are endemic to this habitat (Moat and Smith 2007). The
littoral region of southeastern Madagascar in Tolagnaro (Fort Dauphin) is dominated by the
Vohimena Mountains and a rolling coastal plain extending several kilometers to the Indian
Ocean (Vincelette et al. 2007a).
One of the most threatened ecosystems in Madagascar with less than 2,835 ha remaining, the
littoral forests of the Tolagnaro region are expected to lose numerous plant and animal
species in the near future as a result of deforestation and consequent habitat changes (Bollen
and Donati 2006). The remaining littoral forests of southeastern Madagascar are under severe
pressure from various threats from the local human population such as tavy (shifting slash
and burn agriculture), bushfires as a result of the practice of tavy, and harvest of timber and
non-timber forest products (e.g. charcoal for cooking, wood for construction) for both
subsistence and commercial activities (Bollen and Donati 2006). The three main remaining
groups of littoral forest fragments are located in Mandena, Petriky, and Sainte Luce with
fragment sizes ranging from 1 to 377 ha (Bollen and Donati 2006). The most imminent threat
to these forests is the plan to extract ilmenite by QIT Madagascar Minerals (QMM) (Bollen
and Donati 2006).
QIT Madagascar Minerals (QMM), a company jointly owned by Rio Tinto, UK, and the
Malagasy State represented by the Office des Mines Nationales et des Industries Strategiques
de Madagascar (OMNIS) started an extensive exploration program in 1986 for heavy mineral
sands containing titanium dioxide in the form of ilmenite and rutile along the eastern coast of
Madagascar (Vincelette et al. 2007b). Major sediments were located underneath the littoral
forests in Mandena, Sainte Luce, and Petriky (Lowry et al. 2008). Over the following 20
years, before the start of mining activities in 2009, QMM launched an extensive biodiversity
assessment project addressing the potential impact of mining on economic, technical, and

2 June 16, 2014
cultural issues with ramifications for environmental conservation (Vincelette et al. 2007b).
Mining activities started in Mandena in 2009 and is scheduled to start in Petriky and Sainte
Luce 20-45 years later, lasting up to 60 years (Bollen and Donati 2006). The impact of these
activities would result in the loss of littoral forests in Mandena, Sainte Luce, and Petriky at
62.8 ha, 661.8 ha, and 705.8 ha, respectively (Bollen and Donati 2006). To mitigate this loss,
the environmental impact assessment conducted by QMM has led to the establishment of tree
nurseries and plantations, seed banks, and extensive research into reforestation (Bollen and
Donati 2006).
Eligmocarpus cynometroides Capuron is a tree species endemic to the littoral forests of
southeastern Madagascar, where it grows in the narrow, transitional area between the humid
and sub-arid bioclimatic zones. It is classified as critically endangered (CR) due to habitat
loss, selective harvesting, and mining activities. It is documented as occuring within an area
of only 77 km2 in only two subpopulations, neither of which are within protected areas
(Randriatafika et al. 2007). Randriatafika et al. (2007) documented 27 known individual
plants in the littoral forests of Petriky with a concern that they may become extinct if rescue
strategies are not developed soon. Since documenting these 27 trees, they report that four
trees were felled in 2003 for timber, leaving only 23 trees. These 23 trees occupy an area of
only 0.01 km2. Randriatafika et al. (2007) mention distribution of this species in a second
subpopulation at Parcel 3 of the Parc National d’Andohahela, though Lowry et al. (2008)
report this population as extinct. This species is a QMM priority species for conservation.
The purpose of this project is to develop conservation strategies for long term conservation of
this species by ensuring that the entire genetic diversity of the existing populations is
preserved.
The specific research objectives of this project were to:
1. Understand the genetic diversity of the existing in situ and ex situ populations of
Eligmocarpus cynometroides.
2. Develop propagation protocols to enhance nursery production.
3. Develop reintroduction strategies.
2. Materials and Methods
Plant material
Travel to Madagascar to collect leaf samples for genetics work was done Feb. 27 – March 9,
2013. Collecting permits from Malagasy Forestry department were acquired with assistance
from Missouri Botanical Garden, Madagascar. In addition to collection of leaf and herbarium
samples, permission to collect seeds was also provided from the Directorate General of
Forest Malagasy (Permit Number: 048/13/MEF/SG/DGF/DCB.SAP/SCB). Collecting in the
littoral forests of Petriky and Mandena in South Eastern Madagascar was performed in
collaboration with Qit Madagascar Minerals (QMM). Figure 1 shows the littoral forest
habitat in Petriky.
3 June 16, 2014
Figure 1: Littoral forest habitat in Petriky
Appendix 1 gives the list of collections made. Table 1 lists a summary of populations
sampled for genetic diversity analysis. Location coordinates were recorded using WGS 84
map datum using a Magellan Meridian Color Handheld GPS. Several leaves of each
individual plant were collected and placed in a plastic bag with silica gel. Leaf samples were
collected from seedlings growing in the QMM nursery in Mandena (Figure 2). Leaves from
forest trees were collected in Manambaro village in Pertriky. Forest trees were divided into
two populations, those east of the village and west of the village respectively. Voucher
specimens of selected samples were collected in replicates of three, one each for Denver
Botanic Gardens (KHD), Parc Botanique et Zoologique de Tsimbazaza (TAN), and Missouri
Botanical Garden (MO). Select trees had fallen fruit pods at the base of the trees (Figures 3
and 4). Pods were shaken at random to confirm the presence of seeds in the pods. A majority
of the fallen pods did not make the sound of seeds within the pod when shaken and were
discarded. Only those that made sound were collected. Additionally, seeds from the QMM
seed bank were also brought back for germination testing (Figure 5).

4 June 16, 2014
Table 1: Summary of Eligmocarpus cynometroides populations sampled
Population Name
Collection Numbers*
# Samples
Pop 1 - QMM seedlings
SK 723 – SK 729 7
Pop 2 – Trees east of village
SK 730; SK 732 – SK 739 9
Pop 3 – Trees west of village
SK 740 – SK 741 2
*Detailed collections list with location coordinates and herbarium and seed sample information
is provided in Appendix 1.
Figure 2: Sampling of seedlings grown at QMM nursery in Mandena

5 June 16, 2014
Figure 3: Mature Eligmocarpus cynometroides tree with fruit pods in the littoral forest in
Petriky
Figure 4: Fallen fruit pods at the base of an Eligmocarpus cynometroides tree

6 June 16, 2014
Figure 5: Fruit pods at the QMM Seed Bank collection, seeds of which were used in
germination testing
Exportation permits to bring the samples from Madagascar was acquired through Missouri
Botanical Garden (permit numbers: 088N-EV04/MG13 and 144N-EV07/MG13). USDA
APHIS requires separate permits to import seeds and leaf/herbarium samples. The seed
importation permit was not issued until late April, 2013. Since leaves/herbarium and seeds
cannot be shipped together, the leaves/herbarium were shipped and received at Denver in
May, 2013. The seeds were shipped and received in August, 2013.
DNA extraction and ISSR amplification
Genomic DNA was extracted using GenCatch™ Plant Genomic DNA purification kit (Epoch
Biolabs) in the Conservation Genetics lab at Denver Botanic Gardens. Slight modifications
were made to the extraction protocols.
Initially, 30 ISSR primers were selected based on general success we have had in our lab.
After testing for amplifications, 20 were discarded. The remaining 10 primers with their
optimal PCR reaction conditions are listed in Table 2.
PCR reactions were carried out in a total volume of 17 μl containing 1 μl of genomic DNA,
1.7 μl of 10x PCR reaction buffer, 1.36 μl of 10mM dNTPs, and MgCl2, primer, BSA, and
Taq DNA Polymerase concentrations as listed in Table 2. Amplification was performed in an
Eppendorf Mastercycler proS (Hamberg, Germany) under the following conditions: initial
denaturation at 94°C for 5 min followed by 35 cycles of denaturation at 94°C for 30 s; primer
annealing for 90 s at varying annealing temperatures (48.1ºC – 58ºC) for each primer as

7 June 16, 2014
noted in Table 2; extension at 72°C for 90 s; and final extension at 72°C for 8 min. PCR
products were analyzed by electrophoresis on 1.5% agarose gel for 100 minutes at 70mA
containing 4 μl of EZ-Vision dye in 1X TAE buffer. The PCR products were visualized using
the UV transilluminator (Syngene InGenius Bioimager) and documented using the GeneSnap
software program. Figure 6 shows an example of a gel image.
Table 2: Primers used in ISSR analysis with their sequence information, annealing
temperatures, MgCl2 concentrations and reagent combinations.
Primer Primer Sequence
(5’ – 3’)
Annealing
Temp.
(ºC)
MgCl2
Conc.
(µl)
Reagent
Combo*
UBC807 (AG)8T 58.0 2.0 Combo 1
UBC810 (GA)8T 52.0 1.5 Combo 1
UBC811 (GA)8C 54.7 1.5 Combo 3
UBC812 (GA)8A 55.7 1.5 Combo 4
UBC817 (CA)8A 56.0 2.0 Combo 1
UBC819 (GT)8A 53.0 1.0 Combo 1
UBC823 (TC)8C 50.0 2.0 Combo 1
UBC830 (TG)8G 51.0 2.0 Combo 1
UBC840 (GA)8YT 48.1 2.0 Combo 4
UBC841 (GA)8YC 50.1 2.0 Combo 2
*Reagent Combinations:
Combo 1
(µl)
Combo 2
(µl)
Combo 3
(µl)
Combo 4
(µl)
Primer 0.7 0.8 0.9 1
BSA 0.8 0.7 0.6 0.5
Taq 0.135 0.14 0.145 0.17

8 June 16, 2014
Figure 6: A gel representing optimization experiments of two primers (UBC830 and
UBC840) to identify the best combination of annealing temperature and reagent mix
combinations.

9 June 16, 2014
Data analysis
The ISSR products were scored for the presence (1) and absence (0) of homologous DNA
bands using GelCompar II (Applied Maths). Gene diversity (H) and Shannon’s information
index (I) (Shannon and Weaver 1949) were computed using the software POPGENE 1.32
(Yeh et al. 1997). The Nei’s estimate of gene diversity and Shannon’s information index
were computed assuming Hardy-Weinberg disequilibrium with fixation indices of 0.95.
Hierarchical genetic structure was examined through an analysis of molecurlar variance
(AMOVA) (Excoffier et al. 1992) with 999 permutations using GenAlEx V.6.501 (Peakall
and Smouse 2006). AMOVA was applied to estimate the components of variance among and
within populations based on PhiPT (which is analogous to FST) for each population. GenAlEx
was also used to calculate Nei’s genetic distance (Nei 1978) between the three populations to
estimate genetic distance among them. Structure ver. 2.2 (Pritchard et al. 2000), a
probabilistic based-clustering method for multi-locus genotype data, was used to investigate
population structure. Parameters included admixture model with allele frequencies correlated
among populations and each run with 50,000 MCMC repetitions after 50,000 burn-in. The
determination of the best K value was considered as the modal value of ΔK, an ad hoc
quantity as proposed by Evanno et al. (2005). Structure Harvester was used to determine
K=2.
Seed germination testing
Three different treatments were performed to see which one gives best germination:
Control - Scarification pretreatment done by soaking the seeds for 4 hours in water
Treatment 1 – Scarification pretreatment done by nicking the seeds with clippers
Treatment 2 - Scarification pretreatment done by nicking the seeds with clippers and
soaking for 4 hours in water
There were a total of 18 seeds, with 6 seeds per treatment. The seeds were sown in a
germination tray containing a germination mix. The germination mix consisted on one part
peat + vermiculite + perlite and one part sand. Seeds were sown on November 10, 2013 and
the tray was placed on bottom heat mats at a soil temperature of 74°F (23.33°C).
3. Results and Discussion
Of the 18 total samples, one of the samples (SK 739) gave poor amplification across all
primers and so this sample was dropped from the study. The 10 primers produced a total of
194 loci, of which, loci with less than four occurrences across all samples were dropped,
leaving 128 scorable bands. Of these, 119 bands (92.97%) were polymorphic across the 17
samples from three populations (Table 3). The total number of bands ranged from five for
UBC819 to 17 for UBC807 and UBC810. The polymorphism index ranged from 53.85% for
UBC811 to 100% for UBC807, UBC812, UBC823, UBC830, UBC840 and UBC841 (Table
3).

10 June 16, 2014
Table 3: ISSR polymorphism exhibited for Eligmocarpus cynometroides.
Primer
No. of bands
No. of
polymorphic
bands
Polymorphism
index (%)
UBC807
17 17 100.00
UBC810 17 16 94.12
UBC811 13 7 53.85
UBC812 14 14 100.00
UBC817 13 12 92.31
UBC819 5 4 80.00
UBC823 9 9 100.00
UBC830 14 14 100.00
UBC840 16 16 100.00
UBC841 10 10 100.00
Total
128 119 92.97
Table 4 gives a summary of the measures of genetic diversity for each population as
measured by the percentage of polymorphic loci, Shannon’s information index (I) and Nei’s
gene diversity (H).
Table 4: Measures of genetic diversity in each population of Eligmocarpus cynometroides.
Population
No. of
individuals
%
polymorphic
loci
Shannon’s
Index (I)
Nei’s Gene
Diversity (H)
Seedlings
7 79.69 0.48 0.33
East
8 82.03 0.45 0.31
West 2 43.75 0.27 0.18
Mean 17 68.49 0.40 0.27
11 June 16, 2014
The genetic diversity of the QMM seedlings was higher than both the in-situ trees growing
East and West of the village with a higher Shannon’s information index of 0.48 and Nei’s
gene diversity of 0.33. The East population had higher genetic diversity compared to the
West population with Shannon’s Index of 0.45 and Nei’s Gene Diversity of 0.31. These same
indices were 0.27 and 0.18 respectively for the West population. This lower genetic diversity
of the West population could be due to the small sample size of only two individuals in this
population. Overall the extant populations of Eligmocarpus cynometroides exhibit high
genetic diversity with a mean Shannon’s Index of 0.40 and Nei’s gene diversity of 0.27.
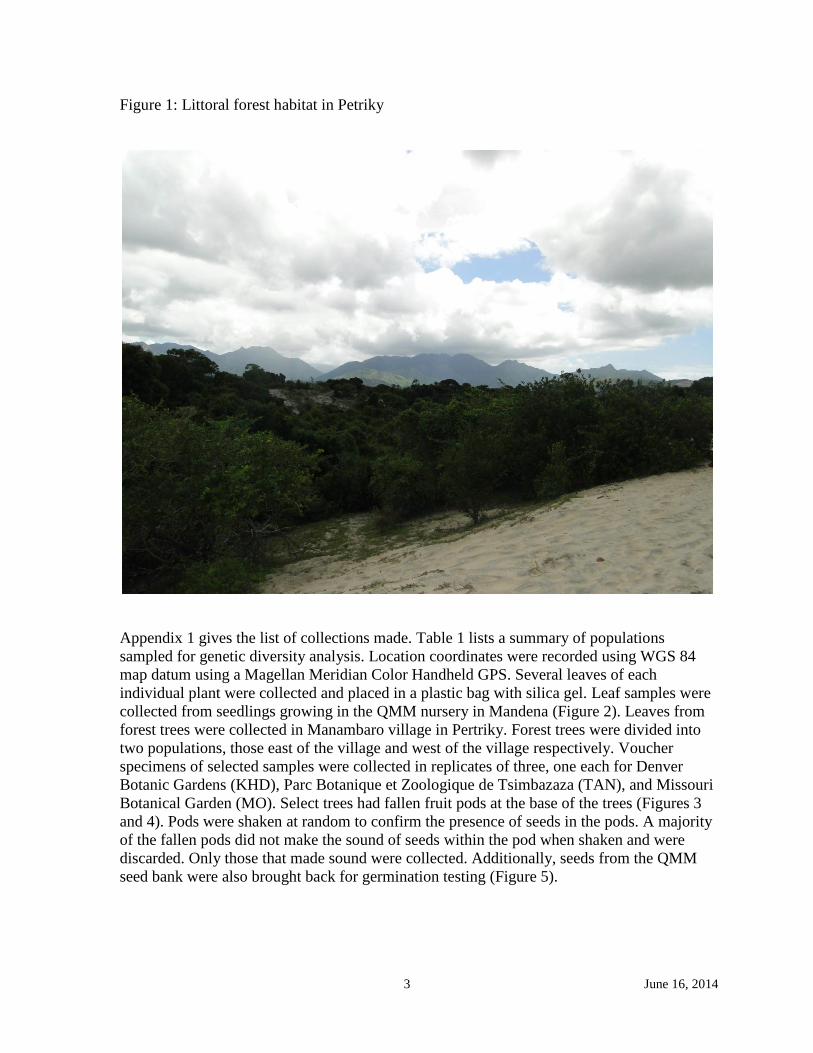
To understand the genetic partitioning among the three populations, Analysis of Molecular
Variation (AMOVA) was performed, which is presented in Table 5. Ninety one percent of
the variation was within population and 9% among populations. AMOVA was performed
again to compare the genetic differentiation between the ex situ seedling population and the
in situ forest population, which is presented in Table 6. The among-population variation was
higher at 11% between the ex situ and in situ populations. The variation within population
was 89%.
Table 5: Summary of partitioning of genetic variation among three populations of
Eligmocarpus cynometroides using AMOVA
Source of variation df Sum of squares Est. Variance Percentage of
variation
Among populations 2 68.56 2.18 9
Within populations 14 325.32 23.38 91
Total 16 393.882 25.42 100
Among Pops 9%
Within Pops 91%
Percentages of Molecular Variance

12 June 16, 2014
Table 6: Summary of partitioning of genetic variation among the ex situ and in situ
populations of Eligmocarpus cynometroides using AMOVA
Source of variation df Sum of squares Est. Variance Percentage of
variation
Among populations 1 46.11 2.78 11
Within populations 15 347.77 23.19 89
Total 16 393.88 25.97 100
Table 7 gives the Nei’s Genetic Distance, showing the pairwise matrix of genetic distance
between the three populations. The seedling population (Pop 1) was more distant from the
West population (Pop 3) with a Nei’s genetic distance of 0.26 compared to 0.12 between the
seedling and East populations (Pop 2). The Nei’s genetic distance between the East and West
populations was 0.17 suggesting some differentiation among these two in situ populations.
Table 7: Pairwise population matrix of Nei’s Genetic Distance among populations
Pop 1 Pop 2 Pop 3
Pop 1 0.0000
Pop 2 0.1207 0.0000
Pop 3 0.2627 0.1739 0.0000
Pop 1 – Seedlings
Pop 2 – East of village
Pop 3 – West of village
Figure 7 gives an analysis of the genotypes of the three populations using Structure. Bar plots
representing the genotypes are given on the X-axis, distributed in predefined populations and
colored according to their membership of the K-dependent clustering. For each set analyzed,
the probability membership for each genotype in each K-cluster is given on the Y-axis.
Among Pops 11%
Within Pops 89%
Percentages of Molecular Variance

13 June 16, 2014
Individuals with multiple colors have admixed genotypes. The mean likelihood for ancestral
inference for these populations was ΔK = 46.01. The seedlings are genotypically different
from both the East and West populations corresponding with the results indicated by the
Nei’s genetic distance testing and AMOVA.
Figure 7: Analysis of Eligmocarpus cynometroides genotypes using Structure.
Seed germination testing resulted in one seedling (5.56%). The results of the germination test
are listed in Table 8. Germination of this one seedling was recorded during the week of
February 17, 2014 (14 weeks after sowing) and the seedling was transplanted to a larger pot
the week of March 3, 2014 (Figure 8). Treatment 2 whereby the seeds are scarified by
nicking the seeds with clippers, followed by soaking in water for four hours prior to sowing
seems to provide the best germination results. Seeds that remain firm and viable (38.89%)
will continue to be retained in the greenhouses and monitored frequently for germination.
Table 8: Germination test results.
Treatment # Seeds Germinated # Seeds Firm &
Viable # Seeds Rotted
Control 0 3 3
Treatment 1 0 0 6
Treatment 2 1 4 1
Seedlings East of Village West of Village

14 June 16, 2014
Figure 8: The germinated seedling that was treated to Treatment 2 (Scarification pretreatment
done by nicking the seeds with clippers and soaking for 4 hours in water)
4. Conservation Implications
Based on the results, the following conclusions can be reached:
i. The remaining extant populations and seedlings of Eligmocarpus cynometroides
retain high genetic diversity as indicated through 10 ISSR markers.
ii. The seedlings being grown at the QMM nursery exhibit higher genetic diversity
compared to the East and West forest populations using the genetic diversity
parameters of Shannon’s Index and Nei’s Gene Diversity.
iii. The East population has higher genetic diversity compared to the West population as
indicated by the genetic diversity parameters of Shannon’s Index and Nei’s Gene
Diversity. This could possibly be due to small sample size of the West population.
iv. Partitioning of genetic variation was 91% within populations and 9% among
populations when all three populations were compared.
v. When the ex situ seedling population was compared with the in situ forest populations
(East and West combined), the partitioning of genetic variation was higher among
population at 11% and within population variation of 89%.

15 June 16, 2014
vi. The Nei’s Genetic Distance was greater between the seedling population and the East
population.
vii. There was a moderate amount of genetic differentiation between the East and West
populations as indicated by a Nei’s Genetic Distance of 0.17.
viii. Structure analysis shows the genotypic difference of the seedling population from the
East and West populations.
ix. Seed germination was poor (5.6%). The only successful germination was achieved by
scarifying the seeds by nicking them with clippers, followed by soaking in water for
four hours prior to sowing.
Based on these results, it may be concluded that the current seedlings grown at the QMM
nursery probably came from seeds from trees that are currently extinct in the wild or not
sampled during this study. Every effort should be made to conserve these seedlings and use
them in restoration and future propagation programs. The East and West in situ populations
were well differentiated and so every effort should be made to conserve the existing extant
trees in the East and West locations and developing propagation programs to increase the
production of saplings for restoration programs. A genetic distance of 0.17 between the East
and West populations indicate a need to conserve these two populations as separate entities.
Studies on propagation by cuttings and micropropagation should be undertaken.
The 2007 survey of Eligmocarpus cynometroides (Randriatafika et al. 2007) documented 23
extant trees in the littoral forests of Petriky. During field work in 2013, we documented and
collected from 11 trees in Petriky. One additional outlier tree was reported to be located
southwest of our collection site, where we were unable to collect. Additionally a restoration
site where saplings grown at the QMM nursery had been transplanted to was also not
sampled. Analyzing the genetic diversity of these individuals will be important in
documenting any additional genetic variation present within these individuals that is not
present in those sampled.
Another subpopulation was reported in Parcel 3 of the Parc National d’Andohahela
(Randriatafika et al. 2007), though specific population information is not available. Lowry
et al. (2008) report this population as extinct. Attempts should be made to scout for presence
of trees or seedlings at Parcel 3 of the Parc National d’Andohahela.
5. References:
Bollen, A. and G. Donati. 2006. Conservation status of the littoral forest of south-eastern
Madagascar: a review. Oryx. 40(1):57-66.
Consiglio, T., G. E. Schatz, G. McPherson, P. P. Lowry II, J. Rabenantoandro, Z. S. Rogers,
R. Rabevohitra, and D. Rabehevitra. 2005. Deforestation and plant diversity of
Madagascar’s littoral forests. Conservation Biology. 20(6):1799-1803.
de Gouvenain, R. C. and J. A. Silander Jr. 2003. Littoral Forest. In: Goodman SM, Benstead
JP (eds) The Natural History of Madagascar. The University of Chicago Press,
Chicago. pp 103-111.
16 June 16, 2014
Evanno, G., S. Regnaut, and J. Goudet. 2005. Detecting the number of clusters of individuals
using the software STRUCTURE: a simulation study. Molecular Ecology. 14:2611-
2620.
Excoffier, L., P. E. Smouse, and J. M. Quattro. 1992. Analysis of molecular variance inferred
from metric distances among DNA haplotypes: application to human mitochondrial
DNA restriction data. Genetics. 131:479-491.
Lowry II, P. P., F. Randriatafika, and J. Rabenantoandro. 2008. Conservation status of
vascular plant species from the QMM/Rio Tinto mining area at Mandena, Tolagnaro
(Fort Dauphin) region, southeast Madagascar. Madagascar Conservation and
Development. 3(1):55-63.
Moat, J. and P. Smith. 2007. Atlas of the Vegetation of Madagascar. Kew Publishing, Royal
Botanic Gardens, Kew.
Nei, M. 1978. Estimation of average heterozygosity and genetic distance from a small
number of individuals. Genetics. 89:583-590.
Peakall, R, and P. E. Smouse. 2006. GENALEX 6: genetic analysis in Excel. Population
genetic software for teaching and research. Molecular Ecology Notes. 6:288-295.
Pritchard, J. K., M. Stephens, and P. Donnelly. 2000. Inference of population structure using
multilocus genotype data. Genetics. 155:945-959.
Randriatafika, F., J. Rabenantoandro, C. Birkinshaw and M. Vincelette. 2007. Biology,
ecology, risk of extinction, and conservation strategy for Eligmocarpus
cynometroides (Fabaceae): a priority species at Petriky. In: Ganzhorn, J. U., S. M.
Goodman and M. Vincelette (eds). Biodiversity, Ecology and Conservation of
Littoral Ecosystems in Southeastern Madagascar, Tolagnoro (Fort Dauphin). Series
editor Alfonso Alonso. SI/MAB Series #11. Smithsonian Institution, Washington DC,
USA. pp 369-377.
Shannon C. E. and W. Weaver. 1949. The mathematical theory of communication. Univ. of
Illinois Press, Urbana.
Vincelette, M., L. Dean and J. U. Ganzhorn. 2007a. The QMM/Rio Tinto project history in
Tolagnaro and its social and environmental concepts. In: Ganzhorn, J. U., S. M.
Goodman and M. Vincelette (eds). Biodiversity, Ecology and Conservation of
Littoral Ecosystems in Southeastern Madagascar, Tolagnoro (Fort Dauphin). Series
editor Alfonso Alonso. SI/MAB Series #11. Smithsonian Institution, Washington DC,
USA. pp 1-8.
Vincelette, M., J. Dumouchel, J. Giroux and R. Heriarive. 2007b. The Tolagnaro (Fort
Dauphin) region: a brief overview of the geology, hydrology, and climatology. In:
Ganzhorn, J. U., S. M. Goodman and M. Vincelette (eds). Biodiversity, Ecology and

17 June 16, 2014
Conservation of Littoral Ecosystems in Southeastern Madagascar, Tolagnoro (Fort
Dauphin). Series editor Alfonso Alonso. SI/MAB Series #11. Smithsonian Institution,
Washington DC, USA. pp 9-17.
Yeh, F.C., R.-C. Yang, T. Boyle, Z.-H. Ye and J.X. Mao. 1997. POPGENE: the user-friendly
shareware for population genetic analysis. Molecular Biology and Biotechnology
Centre, University of Alberta, Canada. [Available at http://www.ualberta.ca/~fyeh/]
Acknowledgements:
Thanks to Association of Zoological Horticulture for support of this project through their
conservation grant. At QMM, key people that were instrumental in making this project happen
were Johny Rabenantoandro, Faly Randriatafika, David Rabehevitra and Roger Ramison.
Assistance of staff at Missouri Botanical Garden (MBG), Madagascar, was critical in acquiring
the required permits. Thanks to Faranirina Lantoarisoa and Christian Camara of MBG. Thanks to
Vololotahina Razafindrahaja for field work assistance. Finally thanks to Denver Botanic
Gardens’ Conservation Genetics team of Dr. Jenny Neale and Anna Schwabe for lab assistance
and data review and to Michael Bone for greenhouse germination assistance.

18 June 16, 2014
Appendix 1: Eligmocarpus cynometroides Collections List
Collectors: Sarada Krishnan (DBG) GPS Datum: WGS 84 State: Toliara
David Rabehevitra (QMM) District: Tolagnaro
Roger Ramison (QMM) Area: Petriky Mandena
Vololotahina Razafindrahaja (PBZT) Locality: Manambaro QMM Nursery
DNA
Sample
SK 723Eligmocarpus
cynometroides
QMM
seedlingMarch 4, 2013
24°57'09S
47°00'11E0.15 x
Seeds collected in Pertiky on Feb 1, 2011;
planted on April 1, 2011. 16-20 leaves.
SK 724Eligmocarpus
cynometroides
QMM
seedlingMarch 4, 2013
24°57'09S
47°00'11E0.75 x
Seeds collected in Pertiky on Feb 1, 2011;
planted on April 1, 2011. Largest seedling;
numerous leaves; healthy.
SK 725Eligmocarpus
cynometroides
QMM
seedlingMarch 4, 2013
24°57'09S
47°00'11E0.30 x
Seeds collected in Pertiky on Feb 1, 2011;
planted on April 1, 2011. Numerous leaves
SK 726Eligmocarpus
cynometroides
QMM
seedlingMarch 4, 2013
24°57'09S
47°00'11E0.30 x
Seeds collected in Pertiky on Feb 1, 2011;
planted on April 1, 2011. Numerous leaves
SK 727Eligmocarpus
cynometroides
QMM
seedlingMarch 4, 2013
24°57'09S
47°00'11E0.15 x
Seeds collected in Pertiky on Feb 1, 2011;
planted on April 1, 2011. Fewer leaves
SK 728Eligmocarpus
cynometroides
QMM
seedlingMarch 4, 2013
24°57'09S
47°00'11E0.15 x
Seeds collected in Pertiky on Feb 1, 2011;
planted on April 1, 2011. Smallest seedling
with very few leaves - only 7.
SK 729Eligmocarpus
cynometroides
QMM
seedlingMarch 4, 2013
24°57'09S
47°00'11E0.30 x
Seeds collected in Pertiky on Feb 1, 2011;
planted on April 1, 2011. 12-15 leaves
SK 730Eligmocarpus
cynometroides
Pop 1 - E of
villageMarch 5, 2013
24°03'10S
46°53'48E19.0 x 3 Huge tree; next to path
SK 731 Erythroxylum nitidulum March 5, 201324°03'10S
46°53'48E1.80 x 3
Associated species; next to path; white
flowers present; fruits present
SK 732Eligmocarpus
cynometroides
Pop 1 - E of
villageMarch 5, 2013
24°03'13S
46°53'47E3.00 x 3
Well branched. Healthy; next to Coffea
commersoniana
SK 733Eligmocarpus
cynometroides
Pop 1 - E of
villageMarch 5, 2013
24°03'13S
46°53'47E4.00 x 3 3
A few feet from SK 732. Fruits present at the
base of the tree; few fruits on tree. Collected
only fruits that were rattling.
SK 734Eligmocarpus
cynometroides
Pop 1 - E of
villageMarch 5, 2013
24°03'11S
46°53'50E7.00 x
Well branched; fruits on tree and on the
ground, though did not find any with seeds
(rattling).
SK 735Eligmocarpus
cynometroides
Pop 1 - E of
villageMarch 5, 2013
24°03'10S
46°53'44E3.00 x
Next to the path and close to SK 730. Young
leaves tinged red. Shooting from a cut tree; no
fruits.
SK 736Eligmocarpus
cynometroides
Pop 1 - E of
villageMarch 5, 2013
24°03'09S
46°53'44E15.00 x
100 meters from the previous trees with
fragmented forest in between.
SK 737Eligmocarpus
cynometroides
Pop 1 - E of
villageMarch 5, 2013
24°03'14S
46°53'41E2.50 x Young tree
SK 738Eligmocarpus
cynometroides
Pop 1 - E of
villageMarch 5, 2013
24°03'15S
46°53'42E17.00 x
Huge tree; leaves present way up - collected
with a long stick.
SK 739Eligmocarpus
cynometroides
Pop 1 - E of
villageMarch 5, 2013
24°03'14S
46°53'41E3.00 x Sparsely leaved
SK 740Eligmocarpus
cynometroides
Pop 2 - W of
villageMarch 5, 2013
25°03'25S
46°53'27E8.00 x 1
Highly degraded habitat. Fruits at base of tree
and on tree.
SK 741Eligmocarpus
cynometroides
Pop 2 - W of
villageMarch 5, 2013
24°03'36S
46°53'19E6.00 x 3 2
Highly degraded habitat. Fruits at base of tree
and on tree.
QMM 1646Eligmocarpus
cynometroides
QMM seed
collectionSept 19, 2011 17
Fruits from QMM's seed collection. Collected
from Petriky from various trees (mixed).
Littoral Forest. Sandy soil. Assosicated vegetation: Rhopalocarpus coriaceus (Sphaerosepalaceae), Croton sp. (Euphorbiaceae), Strychnos sp. (Loganiaceae), Tricalysia
cryptocalyx (Rubiaceae), Dracaena sp. (Asparagaceae), Garcinia sp. (Clusiaceae), Coffea commersoniana (Rubiaceae), Erythroxylum sp. (Erythroxylaceae)
Notes
Habitat Description:
Eligmocarpus cynometroides2013 Collections List
Coll. # Plant IDPopulation
ID
Date of
Collection# Herb. # FruitsLat / Long
Ht:
(M)