Embed Size (px)
Citation preview
RESEARCH ARTICLE Open Access
RNA-seq analysis reveals considerablegenetic diversity and provides geneticmarkers saturating all chromosomes in thediploid wild wheat relative AegilopsumbellulataMoeko Okada1, Kentaro Yoshida1* , Ryo Nishijima1, Asami Michikawa1, Yuka Motoi2, Kazuhiro Sato2
and Shigeo Takumi1
Abstract
Background: Aegilops umbellulata Zhuk. (2n = 14), a wild diploid wheat relative, has been the source of traitimprovement in wheat breeding. Intraspecific genetic variation of Ae. umbellulata, however, has not been wellstudied and the genomic information in this species is limited.
Results: To develop novel genetic markers distributed over all chromosomes of Ae. umbellulata and toevaluate its genetic diversity, we performed RNA sequencing of 12 representative accessions andreconstructed transcripts by de novo assembly of reads for each accession. A large number of singlenucleotide polymorphisms (SNPs) and insertions/deletions (indels) were obtained and anchored to thepseudomolecules of Ae. tauschii and barley (Hordeum vulgare L.), which were regarded as virtualchromosomes of Ae. umbellulata. Interestingly, genetic diversity in Ae. umbellulata was higher than in Ae.tauschii, despite the narrow habitat of Ae. umbellulata. Comparative analyses of nucleotide polymorphismsbetween Ae. umbellulata and Ae. tauschii revealed no clear lineage differentiation and existence of alleles withrarer frequencies predominantly in Ae. umbellulata, with patterns clearly distinct from those in Ae. tauschii.
Conclusions: The anchored SNPs, covering all chromosomes, provide sufficient genetic markers betweenAe. umbellulata accessions. The alleles with rarer frequencies might be the main source of the high geneticdiversity in Ae. umbellulata.
Keywords: Aegilops umbellulata, Aegilops tauschii, Barley, DNA markers, RNA sequencing, Synteny
BackgroundAegilops umbellulata Zhuk. (2n = 14), a wild diploidwheat relative, is distributed in West Asia and is knownas the U-genome donor of Ae. columnaris and Ae. triar-istata [1, 2]. Ae. umbellulata (UU genome) has cross-ability with tetraploid wheat (T. turgidum L.; AABBgenome), which allows generation of synthetic hexa-ploids (AABBUU genome) through ABU triploids. Some
combinations of interspecific crosses between Ae. umbel-lulata accessions and tetraploid wheat result in hybridincompatibility, such as severe growth abortion andgrass-clump dwarfness [3]. This observation suggests theexistence of unrevealed genetic polymorphisms in Ae.umbellulata that potentially vary phenotypic traits.Ae. umbellulata have been used for breeding of bread
wheat and is a considerable resource of disease resist-ance genes [4–10]. Leaf rust and stripe rust resistancegenes [6, 8, 11] and high-molecular weight glutenin sub-units [5, 12] have been introduced into bread wheat cul-tivars. Chhuneja et al. (2008) [6] and Bansal et al. (2017)
* Correspondence: [email protected] School of Agricultural Science, Kobe University, Rokkodai 1-1,Nada-ku, Kobe 657-8501, JapanFull list of author information is available at the end of the article
© The Author(s). 2018 Open Access This article is distributed under the terms of the Creative Commons Attribution 4.0International License (http://creativecommons.org/licenses/by/4.0/), which permits unrestricted use, distribution, andreproduction in any medium, provided you give appropriate credit to the original author(s) and the source, provide a link tothe Creative Commons license, and indicate if changes were made. The Creative Commons Public Domain Dedication waiver(http://creativecommons.org/publicdomain/zero/1.0/) applies to the data made available in this article, unless otherwise stated.
Okada et al. BMC Plant Biology (2018) 18:271 https://doi.org/10.1186/s12870-018-1498-8
[8] established introgression lines of leaf and stripe rustresistance genes derived from synthetic hexaploids(AABBUU). The cross of the synthetic hexaploids (AAB-BUU) with T. aestivum cv. Chinese Spring PhI, whichcarries an epistatic inhibitor of Ph1 gene, induced hom-ologous pairing and resulted in transfer of the leaf andstripe rust resistance genes of Ae. umbellulata into thebread wheat T. aestivum. Although Ae. umbellulataprovides valuable genetic resources for breeding of breadwheat, it has not been well studied and information onits genome is limited. Evaluation of intraspecific geneticdiversity based on genome-wide polymorphisms in Ae.umbellulata would impart practical information fordesigning genetic markers, facilitating the efficient use ofAe. umbellulata for breeding.Since the tribe Triticeae has a large genome, most
of which is occupied by repetitive sequences, develop-ment of high-quality physical maps and whole gen-ome sequencing are challenging. RNA sequencing(RNA-seq) is one of the solutions for detection ofsingle nucleotide polymorphisms (SNPs) and evalu-ation of genetic diversity by avoiding these genomecomplexities of the Triticeae. RNA-seq approaches foridentifying novel genetic markers have been appliedto several Triticeae species such as T. monococcum[13] and Ae. tauschii [14–16]. RNA-seq has the ad-vantage of direct detection of SNPs linked to causalgenes for targeted phenotypes. RNA-seq-based bulkedsegregant analysis narrowed down the genome loca-tion of a wheat yellow rust resistance gene, Yr15, anda wheat spot blotch resistance gene, Sb3, within0.77 cM and 0.15 cM intervals, respectively [17, 18].Recently, the highest-quality genome sequences have
been developed in the diploid Triticeae species barley(Hordeum vulgare L.) [19, 20] and Ae. tauschii [21, 22].By utilizing highly conserved chromosomal syntenyacross Triticeae species [23, 24], the pseudomolecules ofbarley and Ae. tauschii can be regarded as virtual chro-mosomes of other Triticeae species. By combiningRNA-seq with positional information from this synteny,a large number of SNPs and indels can be anchored tothe chromosomes, facilitating design of genome-widegenetic markers [16]. The RNA-seq-based approach formarker development is considered applicable to otherwild wheat species when enough genomic information islacking.Here, to evaluate genetic polymorphisms and capture
genetic markers in Ae. umbellulata, transcripts of 12representative accessions of Ae. umbellulata were firstreconstructed by de novo assembly of reads fromRNA-seq on the Illumina MiSeq platform. Using thededuced transcript sequences, a large number of SNPsand indels between the Ae. umbellulata accessions weredetected and anchored to the barley and Ae. tauschii
pseudomolecules. Comparative analysis of DNA polymor-phisms between Ae. umbellulata and Ae. tauschii revealedrelatively high genetic diversity in Ae. umbellulata.
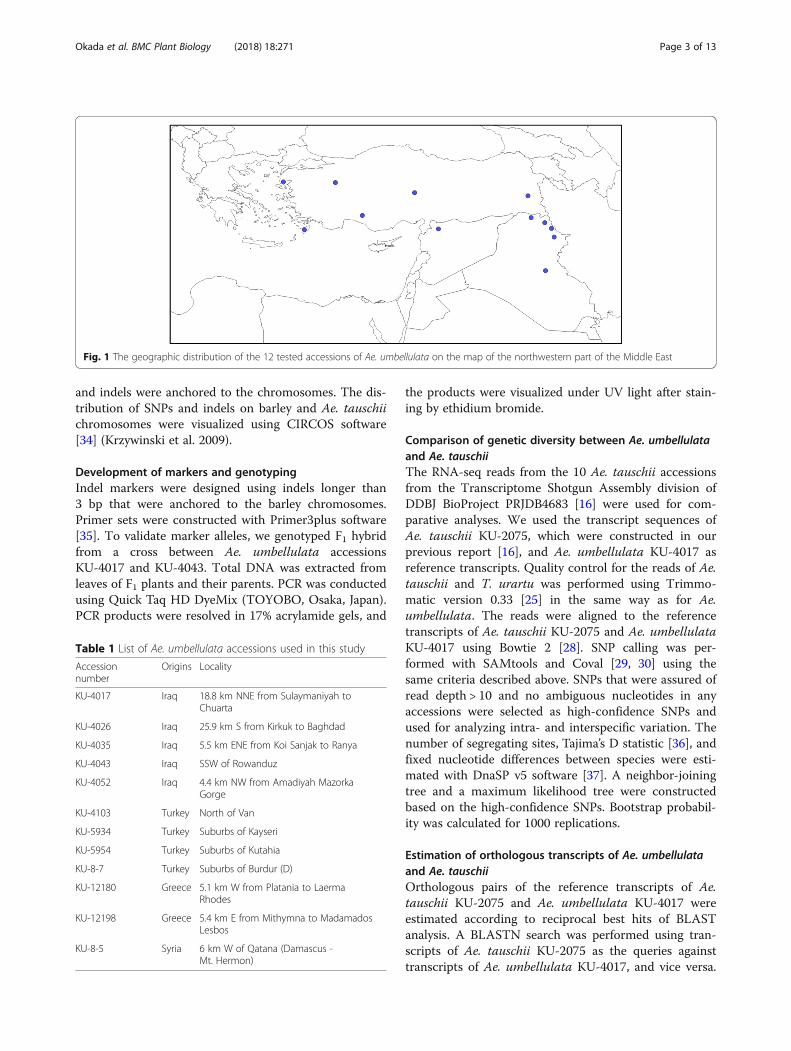
MethodsPlant materials, library construction and RNA sequencingTwelve accessions of Ae. umbellulata were chosen fromthe wheat genetic resources database of the NationalBioResource Project-Wheat (Japan, https://shigen.nig.ac.jp/wheat/komugi/top/top.jsp) to represent the diver-sity of this species (Fig. 1; Table 1). T. urartu KU-199-5was used as the outgroup species for the comparativeanalysis between Ae. umbellulata and Ae. tauschii. TotalRNA was extracted from leaves of Ae. umbellulata andT. urartu at the seedling stage using a Sepasol-RNA ISuper G solution (Nacalai Tesque, Kyoto, Japan). Thetotal RNA was treated with DNase I at 37 °C for 20 minto remove contaminating DNA. A total of 6 to 10 μg ofRNA was used for constructing paired-end libraries. Thelibraries were constructed with TruSeq RNA LibraryPreparation Kit v2 (Illumina, San Diego, CA, USA)according to the manufacturer’s instructions, and weresequenced with 300-bp paired-end reads on an IlluminaMiSeq sequencer.
De novo assembly of reads from RNA-seqLow-quality bases (average quality score per 4 bp < 30),adapter sequences, and reads < 100 bp were removedusing the Trimmomatic version 0.33 tool [25]. Thepaired-end reads were assembled with Trinity version2.0.6 software to reconstruct transcripts for each acces-sion [26, 27]. If a gene had multiple isoforms, the firsttranscript sequence designated by Trinity was chosen asa unigene. A set of unigenes was made for each acces-sion according to our previous report [16], and was usedas a reference transcript dataset. Paired-end reads fromeach accession were aligned to the reference transcriptsusing the Bowtie 2 [28]. SAMtools and Coval softwarewere used for SNP and indel calling [29, 30]. SNPs andindels were called when over 95% of the aligned se-quences were different from those of the reference tran-scripts at positions with read depth > 10. Sequence datahave been deposited to DDBJ Sequence Read ArchiveDRA006404.
Mapping the assembled transcripts, SNPs and indels tobarley and Ae. tauschii genome sequencesThe transcripts were mapped to the barley (Hordeumvulgare L.) reference genome “ASM32608v1 masked”[19] from the Ensembl Plants database [31] and to theAe. tauschii genome “PRJNA341983” from the NCBIdatabase [21] using Gmap software version 2014-12-31[32] and bedtools [33]. Based on the transcripts mappingto the pseudomolecules of Ae. tauschii and barley, SNPs
Okada et al. BMC Plant Biology (2018) 18:271 Page 2 of 13
and indels were anchored to the chromosomes. The dis-tribution of SNPs and indels on barley and Ae. tauschiichromosomes were visualized using CIRCOS software[34] (Krzywinski et al. 2009).
Development of markers and genotypingIndel markers were designed using indels longer than3 bp that were anchored to the barley chromosomes.Primer sets were constructed with Primer3plus software[35]. To validate marker alleles, we genotyped F1 hybridfrom a cross between Ae. umbellulata accessionsKU-4017 and KU-4043. Total DNA was extracted fromleaves of F1 plants and their parents. PCR was conductedusing Quick Taq HD DyeMix (TOYOBO, Osaka, Japan).PCR products were resolved in 17% acrylamide gels, and
the products were visualized under UV light after stain-ing by ethidium bromide.
Comparison of genetic diversity between Ae. umbellulataand Ae. tauschiiThe RNA-seq reads from the 10 Ae. tauschii accessionsfrom the Transcriptome Shotgun Assembly division ofDDBJ BioProject PRJDB4683 [16] were used for com-parative analyses. We used the transcript sequences ofAe. tauschii KU-2075, which were constructed in ourprevious report [16], and Ae. umbellulata KU-4017 asreference transcripts. Quality control for the reads of Ae.tauschii and T. urartu was performed using Trimmo-matic version 0.33 [25] in the same way as for Ae.umbellulata. The reads were aligned to the referencetranscripts of Ae. tauschii KU-2075 and Ae. umbellulataKU-4017 using Bowtie 2 [28]. SNP calling was per-formed with SAMtools and Coval [29, 30] using thesame criteria described above. SNPs that were assured ofread depth > 10 and no ambiguous nucleotides in anyaccessions were selected as high-confidence SNPs andused for analyzing intra- and interspecific variation. Thenumber of segregating sites, Tajima’s D statistic [36], andfixed nucleotide differences between species were esti-mated with DnaSP v5 software [37]. A neighbor-joiningtree and a maximum likelihood tree were constructedbased on the high-confidence SNPs. Bootstrap probabil-ity was calculated for 1000 replications.
Estimation of orthologous transcripts of Ae. umbellulataand Ae. tauschiiOrthologous pairs of the reference transcripts of Ae.tauschii KU-2075 and Ae. umbellulata KU-4017 wereestimated according to reciprocal best hits of BLASTanalysis. A BLASTN search was performed using tran-scripts of Ae. tauschii KU-2075 as the queries againsttranscripts of Ae. umbellulata KU-4017, and vice versa.
Fig. 1 The geographic distribution of the 12 tested accessions of Ae. umbellulata on the map of the northwestern part of the Middle East
Table 1 List of Ae. umbellulata accessions used in this study
Accessionnumber
Origins Locality
KU-4017 Iraq 18.8 km NNE from Sulaymaniyah toChuarta
KU-4026 Iraq 25.9 km S from Kirkuk to Baghdad
KU-4035 Iraq 5.5 km ENE from Koi Sanjak to Ranya
KU-4043 Iraq SSW of Rowanduz
KU-4052 Iraq 4.4 km NW from Amadiyah MazorkaGorge
KU-4103 Turkey North of Van
KU-5934 Turkey Suburbs of Kayseri
KU-5954 Turkey Suburbs of Kutahia
KU-8-7 Turkey Suburbs of Burdur (D)
KU-12180 Greece 5.1 km W from Platania to LaermaRhodes
KU-12198 Greece 5.4 km E from Mithymna to MadamadosLesbos
KU-8-5 Syria 6 km W of Qatana (Damascus -Mt. Hermon)
Okada et al. BMC Plant Biology (2018) 18:271 Page 3 of 13
When the same best hit was detected and query cover-age was over 80% in both BLAST analyses, the tran-scripts from Ae. umbellulata KU-4017 and Ae. tauschiiKU-2075 were judged an orthologous pair.
Gene expression analysisThe mapped reads that were concordantly aligned to thereference transcripts were chosen from the alignmentfile with SAMtools [29]. Fragments per kilobase permillion mapped reads (FPKM) values were calculatedbased on the concordantly mapped reads [38].
ResultsRNA sequencing of 12 Ae. umbellulata accessionsTo evaluate genetic diversity based on a large number ofDNA polymorphisms in the U-genome species Ae.umbellulata, RNA-seq was performed on the 12representative accessions, generating 3.5–6.1 millionpaired-end reads per one accession (Table 2). Thesereads were analyzed according to the workflow shown inAdditional file 1: Figure S1. After filtering out reads withlow quality, 2.2–3.9 million paired-end reads (56.2–74.1%) were obtained. Due to the absence of a referencegenome for Ae. umbellulata, transcript sequences foreach of the 12 accessions were constructed by de novo
assembly of the filtered reads. For each accession, 20,996to 59,253 transcripts with N50 values of 899 to 1365 bpwere deduced. One isoform was chosen as a unigene if atranscript had multiple isoforms. Finally, 12 sets ofunigenes composed of 20,675 to 55,831 representativeisoforms were obtained (Table 2) and used as referencetranscript datasets for pairwise alignments between theaccessions.
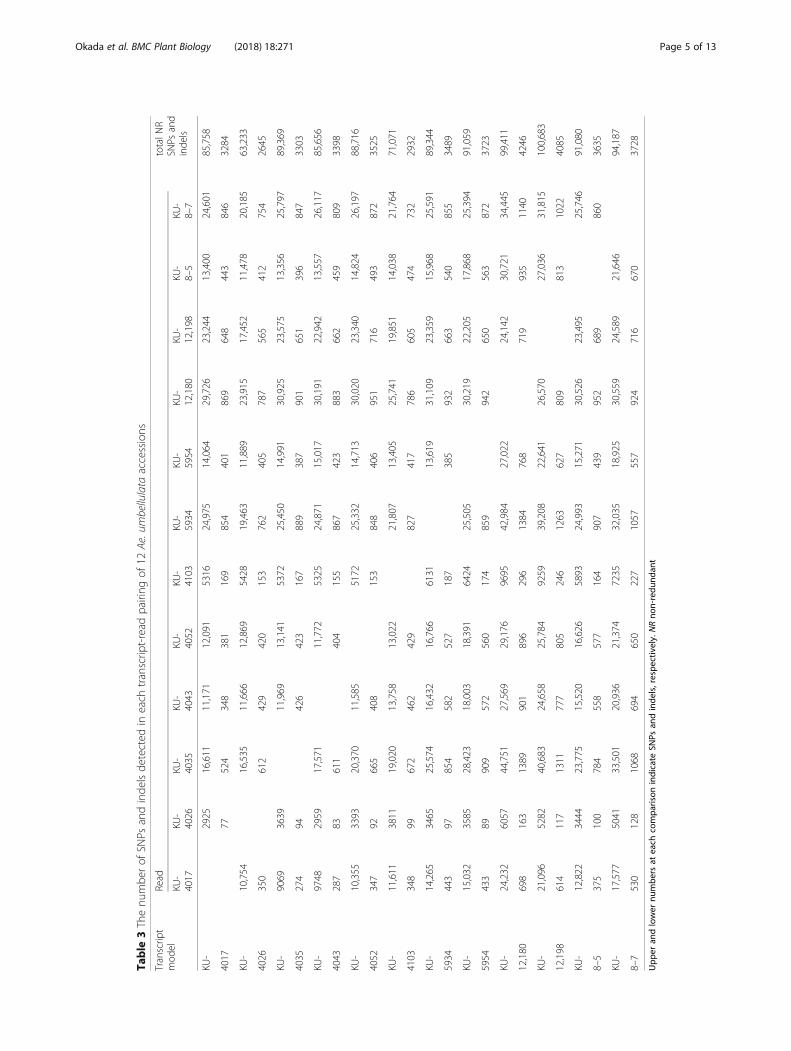
Genome-wide identification of SNPs and indels in Ae.umbellulataTo detect SNPs and indels among the accessions, thefiltered reads of each accession were aligned to the refer-ence transcripts of all other accessions, and SNPs andindels were called according to the thresholds with readdepth > 10. SNPs and indels identified from comparisonsof the same accessions were regarded as artifacts. Afterfiltering to remove these putative artifacts, 2925–44,751SNPs and 77–1389 indels were obtained among theaccessions (Table 3). The maximum numbers of SNPsand indels were obtained between KU-4035 andKU-12180 (44,751 SNPs and 1389 indels), with theminimum between KU-4017 and KU-4026 (2925 SNPsand 77 indels).
Table 2 Summary of RNA sequencing for 12 accessions of Ae. umbellulata
Accession Readpairs
Filteredread pairs (%a)
(unigenes) N50(bp)
Median contiglength(bp)
Total assembledbases(Mbp)
KU-4017 3,738,403 2,515,683 (67.29%) 39,359(37640)
1238 658 36
KU-4026 4,935,634 3,429,252 (69.48%) 20,996(20675)
900 578.5 15.6
KU-4035 6,077,268 3,890,911 (64.02%) 57,029(52216)
1350 654 52.9
KU-4043 4,090,151 2,392,708 (58.50%) 50,985(48590)
1095 518 38.9
KU-4052 3,829,992 2,152,503 (56.20%) 47,320(44869)
1179 577 39.4
KU-4103 3,875,477 2,506,545 (64.68%) 31,418(30873)
899 507 22.1
KU-5934 5,114,283 3,507,234 (68.58%) 57,466(52751)
1332 630 52.7
KU-5954 3,686,807 2,694,916 (73.10%) 45,164(41780)
1365 699 44.1
KU-12180 3,455,952 2,560,779 (74.10%) 46,323(44000)
1229 631 41.2
KU-12198 3,623,492 2,666,981 (73.60%) 50,069(46178)
1359 655 47,7
KU-8-5 3,669,766 2,699,452 (73.56%) 52,648(48981)
1259 654 48.2
KU-8-7 3,798,153 2,524,378 (66.46%) 59,253(55831)
1160 524 46.9
aPercentage of the number of filtered read pairs per the number of read pairs
Okada et al. BMC Plant Biology (2018) 18:271 Page 4 of 13
Table
3Thenu
mbe
rof
SNPs
andinde
lsde
tected
ineach
transcrip
t-read
pairing
of12
Ae.umbellulata
accessions
Transcrip
tmod
elRead
totalN
RSN
Psand
inde
lsKU
-4017
KU-
4026
KU-
4035
KU-
4043
KU-
4052
KU-
4103
KU-
5934
KU-
5954
KU-
12,180
KU-
12,198
KU-
8–5
KU-
8–7
KU-
2925
16,611
11,171
12,091
5316
24,975
14,064
29,726
23,244
13,400
24,601
85,758
4017
77524
348
381
169
854
401
869
648
443
846
3284
KU-
10,754
16,535
11,666
12,869
5428
19,463
11,889
23,915
17,452
11,478
20,185
63,233
4026
350
612
429
420
153
762
405
787
565
412
754
2645
KU-
9069
3639
11,969
13,141
5372
25,450
14,991
30,925
23,575
13,356
25,797
89,369
4035
274
94426
423
167
889
387
901
651
396
847
3303
KU-
9748
2959
17,571
11,772
5325
24,871
15,017
30,191
22,942
13,557
26,117
85,656
4043
287
83611
404
155
867
423
883
662
459
809
3398
KU-
10,355
3393
20,370
11,585
5172
25,332
14,713
30,020
23,340
14,824
26,197
88,716
4052
347
92665
408
153
848
406
951
716
493
872
3525
KU-
11,611
3811
19,020
13,758
13,022
21,807
13,405
25,741
19,851
14,038
21,764
71,071
4103
348
99672
462
429
827
417
786
605
474
732
2932
KU-
14,265
3465
25,574
16,432
16,766
6131
13,619
31,109
23,359
15,968
25,591
89,344
5934
443
97854
582
527
187
385
932
663
540
855
3489
KU-
15,032
3585
28,423
18,003
18,391
6424
25,505
30,219
22,205
17,868
25,394
91,059
5954
433
89909
572
560
174
859
942
650
563
872
3723
KU-
24,232
6057
44,751
27,569
29,176
9695
42,984
27,022
24,142
30,721
34,445
99,411
12,180
698
163
1389
901
896
296
1384
768
719
935
1140
4246
KU-
21,096
5282
40,683
24,658
25,784
9259
39,208
22,641
26,570
27,036
31,815
100,683
12,198
614
117
1311
777
805
246
1263
627
809
813
1022
4085
KU-
12,822
3444
23,775
15,520
16,626
5893
24,993
15,271
30,526
23,495
25,746
91,080
8–5
375
100
784
558
577
164
907
439
952
689
860
3635
KU-
17,577
5041
33,501
20,936
21,374
7235
32,035
18,925
30,559
24,589
21,646
94,187
8–7
530
128
1068
694
650
227
1057
557
924
716
670
3728
Upp
eran
dlower
numbe
rsat
each
compa
rison
indicate
SNPs
andinde
ls,respe
ctively.NRno
n-redu
ndan
t
Okada et al. BMC Plant Biology (2018) 18:271 Page 5 of 13
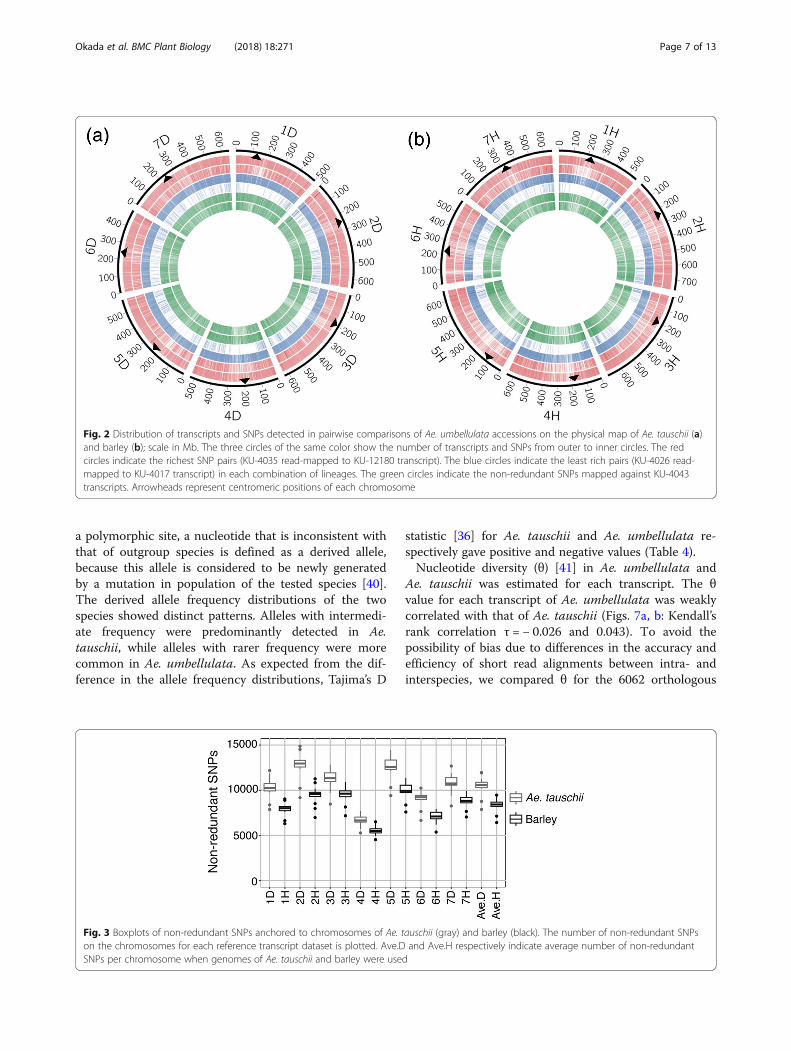
For efficient use of the identified SNPs and indels asgenetic markers, their chromosomal locations must beknown. Here, we used the Ae. tauschii and barley pseu-domolecules as virtual chromosomes of Ae. umbellulata,and mapped the unigene sequences of the Ae. umbellu-lata reference transcript datasets to the Ae. tauschii andbarley chromosomes. In the reference transcripts,75.87–85.35% of the unigenes were mapped to Ae.tauschii and 52.08–67.69% to barley chromosomes(Additional file 1: Table S1). Based on the positional in-formation of the mapped unigenes, SNPs and indelswere anchored to the chromosomes of both species. Inany pairwise comparison between Ae. umbellulataaccessions, 81.83–89.50% of SNPs and 75.28–89.26% ofindels were anchored to Ae. tauschii chromosomes,while 63.17–75.16% of SNPs and 59.04–77.78% of indelswere anchored to barley chromosomes (Additional file 1:Tables S2, S3). The distribution of SNPs over eachchromosome of Ae. tauschii and barley was visualizedwith CIRCOS [34] for the Ae. umbellulata accessionpairs with the maximum or minimum number of SNPs.The SNPs covered all chromosomes (Fig. 2).Non-redundant SNPs and indels were estimated for
each of the 12 sets of reference transcripts. A total of63,233–100,683 non-redundant SNPs and 2645–4246non-redundant indels were detected in the tested Ae.umbellulata accessions (Table 3). On average, 73,075non-redundant SNPs (85.07%) were anchored to Ae.tauschii chromosomes, and 58,247 (70.40%) non-redun-dant SNPs to barley chromosomes (Additional file 1:Tables S4, S5). The smallest number of anchorednon-redundant SNPs was observed on chromosomes 4Din Ae. tauschii and 4H in barley (Fig. 3). Each chromo-some of Ae. tauschii and barley had an average of 10,439and 8321 non-redundant SNPs, respectively. The an-chored non-redundant SNPs were distributed over allseven chromosomes of Ae. tauschii and barley (Fig. 2).We estimated the percentages of non-redundant SNPs
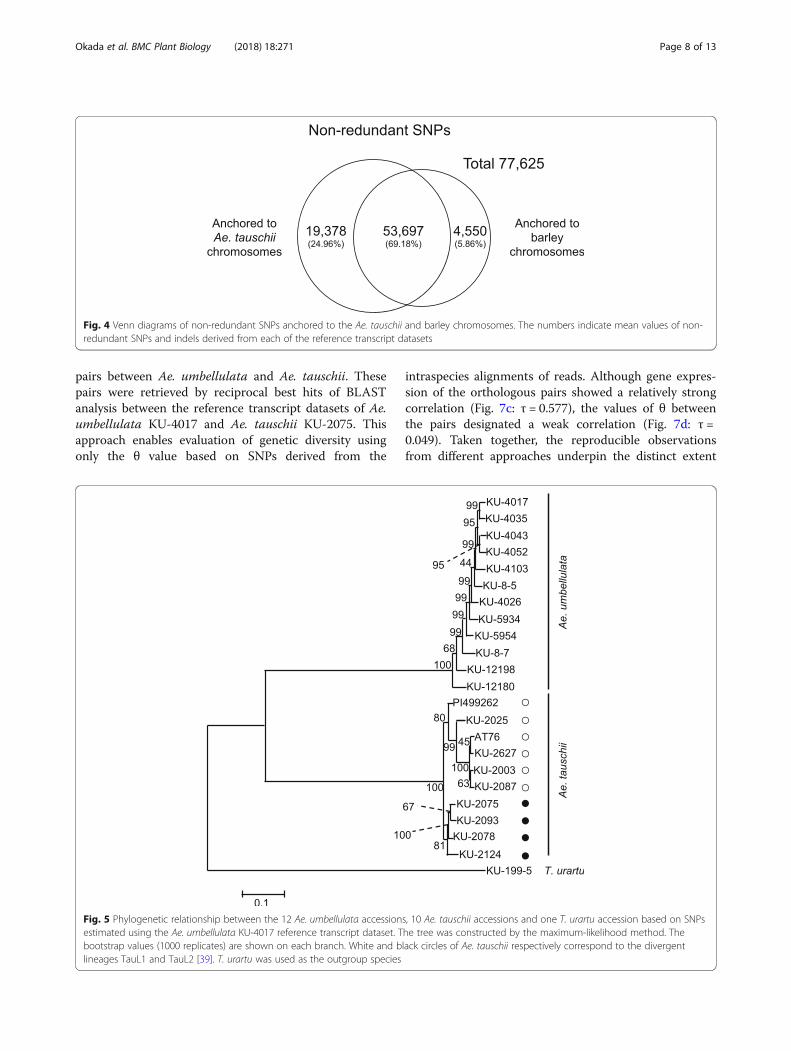
anchored to the Ae. tauschii chromosomes overlappedthose on barley chromosomes (Fig. 4). Venn diagramsshowed that 69.18% of non-redundant SNPs were an-chored to both Ae. tauschii and barley chromosomes.The percentage of non-redundant SNPs uniquely an-choring to Ae. tauschii chromosomes was 24.96%. Only5.86% of non-redundant SNPs were uniquely anchoredto barley chromosomes. After integration of these an-chored non-redundant SNPs, 77,625 non-redundantSNPs were placed on the chromosomes.
Application of indel markers to confirmation of F1formationTo confirm usefulness of the identified polymorphismsas genetic markers, primer sets for 27 indels were de-signed. The indel markers were applied to genotype F1
hybrid from a cross between two Ae. umbellulata acces-sions, KU-4017 and KU-4043; nine markers enabled de-tection of the genetic differences between the accessionsand confirmed their F1 formation (Additional file 1:Figure S2). The difference in amplicon size between theparents was observed in the five markers. Presence/ab-sence of amplicons between the parents was detected inthe two markers. In the other two markers, the parentswere distinguished by an extra band.
Comparison of genetic diversity in Ae. umbellulata andAe. tauschiiAe. tauschii is widely distributed over central Eurasiaand has three divergent lineages, TauL1, TauL2 and TauL3[39]. On the other hand, the habitat of Ae. umbellulata islimited to West Asia. To examine how differences in geo-graphic distribution and evolutionary history of these speciesaffected the extent of DNA polymorphisms and the distribu-tion of allele frequency, genetic diversity in Ae. umbellulataand Ae. tauschii was evaluated with SNPs deduced using thesame RNA-seq platform. To compare intraspecific diversityof the two Aegilops species, reads from RNA-seq of the 12Ae. umbellulata accessions, the 10 Ae. tauschii accessions[16] and T. urartu KU-199-5 were aligned to the referencetranscripts of Ae. umbellulata KU-4017. T. urartu KU-199-5was used as an outgroup species. To elucidate the phylogen-etic relationship of Ae. umbellulata and Ae. tauschii acces-sions, maximum likelihood and neighbor-joining trees wereconstructed based on the high-confidence SNPs (Fig. 5;Additional file 1: Figure S3a). The three species were clearlyseparated, with the Aegilops species more closely re-lated than T. urartu, with fixed nucleotide differencesbetween Ae. umbellulata and Ae. tauschii smaller thanthose between Ae. tauschii and T. urartu or between Ae.umbellulata and T. urartu (Additional file 1: Table S6).The external branches of Ae. umbellulata were longerthan those of Ae. tauschii. Ae. umbellulata KU-12180 wasisolated from the other accessions, supporting observa-tions from the phylogenetic trees constructed based onnucleotide polymorphisms in a small number of genes [3].However, the clear divergent lineages observed in Ae.tauschii were not found in the Ae. umbellulata accessions(Fig. 5). When the reference transcripts of Ae. tauschiiKU-2075 was used for the alignments and SNP calling,similar results were obtained (Additional file 1: Table S6,Figures S3b, S4).The number of segregating sites in Ae. umbellulata
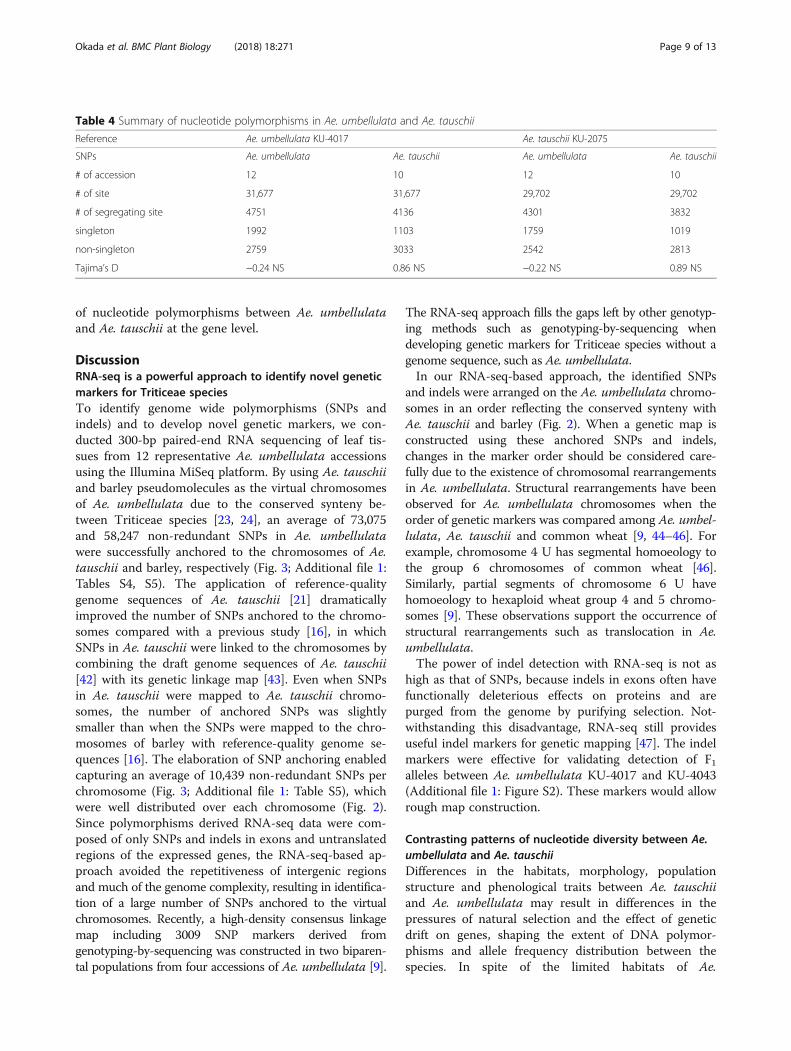
was larger than in Ae. tauschii (Table 4), indicating thatAe. umbellulata has relatively high genetic diversity. Totest how differences in habitat and evolutionary historybetween Ae. umbellulata and Ae. tauschii affected allelefrequency distribution in these two species, the derivedallele frequency distribution for each species was esti-mated using T. urartu as an outgroup species (Fig. 6). At
Okada et al. BMC Plant Biology (2018) 18:271 Page 6 of 13
a polymorphic site, a nucleotide that is inconsistent withthat of outgroup species is defined as a derived allele,because this allele is considered to be newly generatedby a mutation in population of the tested species [40].The derived allele frequency distributions of the twospecies showed distinct patterns. Alleles with intermedi-ate frequency were predominantly detected in Ae.tauschii, while alleles with rarer frequency were morecommon in Ae. umbellulata. As expected from the dif-ference in the allele frequency distributions, Tajima’s D
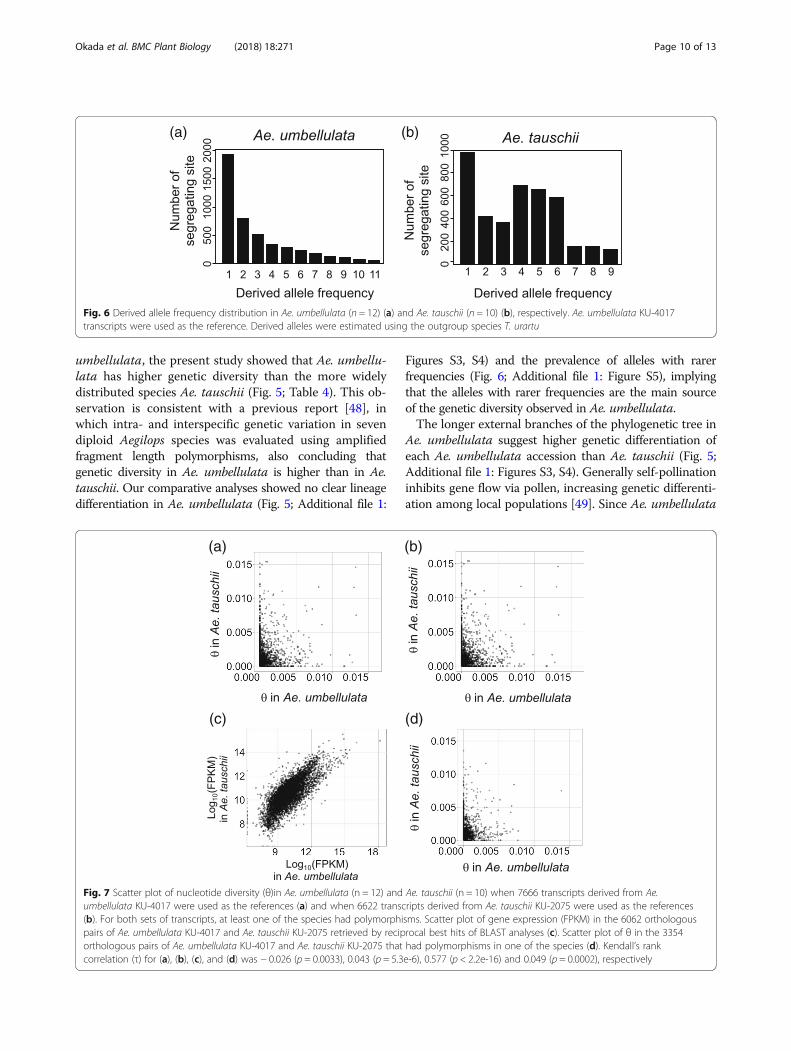
statistic [36] for Ae. tauschii and Ae. umbellulata re-spectively gave positive and negative values (Table 4).Nucleotide diversity (θ) [41] in Ae. umbellulata and
Ae. tauschii was estimated for each transcript. The θvalue for each transcript of Ae. umbellulata was weaklycorrelated with that of Ae. tauschii (Figs. 7a, b: Kendall’srank correlation τ = − 0.026 and 0.043). To avoid thepossibility of bias due to differences in the accuracy andefficiency of short read alignments between intra- andinterspecies, we compared θ for the 6062 orthologous
Fig. 3 Boxplots of non-redundant SNPs anchored to chromosomes of Ae. tauschii (gray) and barley (black). The number of non-redundant SNPson the chromosomes for each reference transcript dataset is plotted. Ave.D and Ave.H respectively indicate average number of non-redundantSNPs per chromosome when genomes of Ae. tauschii and barley were used
Fig. 2 Distribution of transcripts and SNPs detected in pairwise comparisons of Ae. umbellulata accessions on the physical map of Ae. tauschii (a)and barley (b); scale in Mb. The three circles of the same color show the number of transcripts and SNPs from outer to inner circles. The redcircles indicate the richest SNP pairs (KU-4035 read-mapped to KU-12180 transcript). The blue circles indicate the least rich pairs (KU-4026 read-mapped to KU-4017 transcript) in each combination of lineages. The green circles indicate the non-redundant SNPs mapped against KU-4043transcripts. Arrowheads represent centromeric positions of each chromosome
Okada et al. BMC Plant Biology (2018) 18:271 Page 7 of 13
pairs between Ae. umbellulata and Ae. tauschii. Thesepairs were retrieved by reciprocal best hits of BLASTanalysis between the reference transcript datasets of Ae.umbellulata KU-4017 and Ae. tauschii KU-2075. Thisapproach enables evaluation of genetic diversity usingonly the θ value based on SNPs derived from the
intraspecies alignments of reads. Although gene expres-sion of the orthologous pairs showed a relatively strongcorrelation (Fig. 7c: τ = 0.577), the values of θ betweenthe pairs designated a weak correlation (Fig. 7d: τ =0.049). Taken together, the reproducible observationsfrom different approaches underpin the distinct extent
Fig. 5 Phylogenetic relationship between the 12 Ae. umbellulata accessions, 10 Ae. tauschii accessions and one T. urartu accession based on SNPsestimated using the Ae. umbellulata KU-4017 reference transcript dataset. The tree was constructed by the maximum-likelihood method. Thebootstrap values (1000 replicates) are shown on each branch. White and black circles of Ae. tauschii respectively correspond to the divergentlineages TauL1 and TauL2 [39]. T. urartu was used as the outgroup species
Fig. 4 Venn diagrams of non-redundant SNPs anchored to the Ae. tauschii and barley chromosomes. The numbers indicate mean values of non-redundant SNPs and indels derived from each of the reference transcript datasets
Okada et al. BMC Plant Biology (2018) 18:271 Page 8 of 13
of nucleotide polymorphisms between Ae. umbellulataand Ae. tauschii at the gene level.
DiscussionRNA-seq is a powerful approach to identify novel geneticmarkers for Triticeae speciesTo identify genome wide polymorphisms (SNPs andindels) and to develop novel genetic markers, we con-ducted 300-bp paired-end RNA sequencing of leaf tis-sues from 12 representative Ae. umbellulata accessionsusing the Illumina MiSeq platform. By using Ae. tauschiiand barley pseudomolecules as the virtual chromosomesof Ae. umbellulata due to the conserved synteny be-tween Triticeae species [23, 24], an average of 73,075and 58,247 non-redundant SNPs in Ae. umbellulatawere successfully anchored to the chromosomes of Ae.tauschii and barley, respectively (Fig. 3; Additional file 1:Tables S4, S5). The application of reference-qualitygenome sequences of Ae. tauschii [21] dramaticallyimproved the number of SNPs anchored to the chromo-somes compared with a previous study [16], in whichSNPs in Ae. tauschii were linked to the chromosomes bycombining the draft genome sequences of Ae. tauschii[42] with its genetic linkage map [43]. Even when SNPsin Ae. tauschii were mapped to Ae. tauschii chromo-somes, the number of anchored SNPs was slightlysmaller than when the SNPs were mapped to the chro-mosomes of barley with reference-quality genome se-quences [16]. The elaboration of SNP anchoring enabledcapturing an average of 10,439 non-redundant SNPs perchromosome (Fig. 3; Additional file 1: Table S5), whichwere well distributed over each chromosome (Fig. 2).Since polymorphisms derived RNA-seq data were com-posed of only SNPs and indels in exons and untranslatedregions of the expressed genes, the RNA-seq-based ap-proach avoided the repetitiveness of intergenic regionsand much of the genome complexity, resulting in identifica-tion of a large number of SNPs anchored to the virtualchromosomes. Recently, a high-density consensus linkagemap including 3009 SNP markers derived fromgenotyping-by-sequencing was constructed in two biparen-tal populations from four accessions of Ae. umbellulata [9].
The RNA-seq approach fills the gaps left by other genotyp-ing methods such as genotyping-by-sequencing whendeveloping genetic markers for Triticeae species without agenome sequence, such as Ae. umbellulata.In our RNA-seq-based approach, the identified SNPs
and indels were arranged on the Ae. umbellulata chromo-somes in an order reflecting the conserved synteny withAe. tauschii and barley (Fig. 2). When a genetic map isconstructed using these anchored SNPs and indels,changes in the marker order should be considered care-fully due to the existence of chromosomal rearrangementsin Ae. umbellulata. Structural rearrangements have beenobserved for Ae. umbellulata chromosomes when theorder of genetic markers was compared among Ae. umbel-lulata, Ae. tauschii and common wheat [9, 44–46]. Forexample, chromosome 4 U has segmental homoeology tothe group 6 chromosomes of common wheat [46].Similarly, partial segments of chromosome 6 U havehomoeology to hexaploid wheat group 4 and 5 chromo-somes [9]. These observations support the occurrence ofstructural rearrangements such as translocation in Ae.umbellulata.The power of indel detection with RNA-seq is not as
high as that of SNPs, because indels in exons often havefunctionally deleterious effects on proteins and arepurged from the genome by purifying selection. Not-withstanding this disadvantage, RNA-seq still providesuseful indel markers for genetic mapping [47]. The indelmarkers were effective for validating detection of F1alleles between Ae. umbellulata KU-4017 and KU-4043(Additional file 1: Figure S2). These markers would allowrough map construction.
Contrasting patterns of nucleotide diversity between Ae.umbellulata and Ae. tauschiiDifferences in the habitats, morphology, populationstructure and phenological traits between Ae. tauschiiand Ae. umbellulata may result in differences in thepressures of natural selection and the effect of geneticdrift on genes, shaping the extent of DNA polymor-phisms and allele frequency distribution between thespecies. In spite of the limited habitats of Ae.
Table 4 Summary of nucleotide polymorphisms in Ae. umbellulata and Ae. tauschii
Reference Ae. umbellulata KU-4017 Ae. tauschii KU-2075
SNPs Ae. umbellulata Ae. tauschii Ae. umbellulata Ae. tauschii
# of accession 12 10 12 10
# of site 31,677 31,677 29,702 29,702
# of segregating site 4751 4136 4301 3832
singleton 1992 1103 1759 1019
non-singleton 2759 3033 2542 2813
Tajima’s D −0.24 NS 0.86 NS −0.22 NS 0.89 NS
Okada et al. BMC Plant Biology (2018) 18:271 Page 9 of 13
umbellulata, the present study showed that Ae. umbellu-lata has higher genetic diversity than the more widelydistributed species Ae. tauschii (Fig. 5; Table 4). This ob-servation is consistent with a previous report [48], inwhich intra- and interspecific genetic variation in sevendiploid Aegilops species was evaluated using amplifiedfragment length polymorphisms, also concluding thatgenetic diversity in Ae. umbellulata is higher than in Ae.tauschii. Our comparative analyses showed no clear lineagedifferentiation in Ae. umbellulata (Fig. 5; Additional file 1:
Figures S3, S4) and the prevalence of alleles with rarerfrequencies (Fig. 6; Additional file 1: Figure S5), implyingthat the alleles with rarer frequencies are the main sourceof the genetic diversity observed in Ae. umbellulata.The longer external branches of the phylogenetic tree in
Ae. umbellulata suggest higher genetic differentiation ofeach Ae. umbellulata accession than Ae. tauschii (Fig. 5;Additional file 1: Figures S3, S4). Generally self-pollinationinhibits gene flow via pollen, increasing genetic differenti-ation among local populations [49]. Since Ae. umbellulata
(a) (b)
(c) (d)
Fig. 7 Scatter plot of nucleotide diversity (θ)in Ae. umbellulata (n = 12) and Ae. tauschii (n = 10) when 7666 transcripts derived from Ae.umbellulata KU-4017 were used as the references (a) and when 6622 transcripts derived from Ae. tauschii KU-2075 were used as the references(b). For both sets of transcripts, at least one of the species had polymorphisms. Scatter plot of gene expression (FPKM) in the 6062 orthologouspairs of Ae. umbellulata KU-4017 and Ae. tauschii KU-2075 retrieved by reciprocal best hits of BLAST analyses (c). Scatter plot of θ in the 3354orthologous pairs of Ae. umbellulata KU-4017 and Ae. tauschii KU-2075 that had polymorphisms in one of the species (d). Kendall’s rankcorrelation (τ) for (a), (b), (c), and (d) was − 0.026 (p = 0.0033), 0.043 (p = 5.3e-6), 0.577 (p < 2.2e-16) and 0.049 (p = 0.0002), respectively
(a) (b)
Fig. 6 Derived allele frequency distribution in Ae. umbellulata (n = 12) (a) and Ae. tauschii (n = 10) (b), respectively. Ae. umbellulata KU-4017transcripts were used as the reference. Derived alleles were estimated using the outgroup species T. urartu
Okada et al. BMC Plant Biology (2018) 18:271 Page 10 of 13
is a self-fertilizing plant, this general view could be applic-able to the observed genetic differentiation between theaccessions of Ae. umbellulata. Considering Ae. tauschii isalso a self-fertilizing species, another factor may contrib-ute to shaping the distinct patterns of nucleotide poly-morphism in these two species. If the time of expansionand colonization into the modern habitats differed be-tween species, neutral mutations are expected to haveaccumulated more within a local population of the specieswith the earlier expansion and colonization, generatinggenetic differentiation between local populations underthe limited gene flow. If this hypothesis is accepted, thetime of expansion and colonization into the modern habi-tat of Ae. umbellulata is presumed to be older than thatof Ae. tauschii. These different evolutionary scenarios andhabitats of Ae. tauschii and Ae. umbellulata are likely tohave shaped distinct genetic diversity for each gene fromtheir common ancestor. The scatter plots of nucleotidediversity in the transcripts of Ae. umbellulata and Ae.tauschii show weaker correlations between the ortholo-gous pairs (Fig. 7), suggesting that genes of Ae. umbellu-lata were subjected to natural selection pressure andeffects of genetic drift that were distinct from those of Ae.tauschii. Future larger-scale population genomic analysesin both species will disclose population dynamics withhigher resolution and more powerfully detect footprints ofnatural selection in each gene.
ConclusionThe RNA-seq-based approach is efficient for develop-ment of a large number of molecular markers and forconducting population genetic analyses for a largenumber of genes in wheat wild relatives such as Ae.umbellulata lacking genomic information. In addition,Ae. umbellulata, harboring relatively high genetic diver-sity, has considerable potential as a genetic resource forbreeding of common wheat.
Additional file
Additional file 1 : Table S1. Summary of the number of unigenesanchored to barley and Ae. tauschii genome. Table S2. The number ofSNPs and indels anchored to the chromosomes of Ae. tauschii out of theSNPs and indels detected in each transcript-read pairing of 12 Ae. umbel-lulata accessions. Table S3. The number of SNPs and indels anchored tothe barley chromosomes out of the SNPs and indels detected in eachtranscript-read pairing of 12 Ae. umbellulata accessions. Table S4.The number of non-redundant SNPs anchored to each Ae. tauschiichromosome. Table S5. The number of non-redundant SNPsanchored to each barley chromosome. Table S6. Summary ofnucleotide polymorphism and divergence in Ae. umbellulata, Ae.tauschii and T. urartu. Figure S1. The workflow of RNA-seq analysis.Figure S2. Images of polyacrylamide gel electrophoresis for indelmarkers. Figure S3. Phylogenetic relationship between 12 Ae. umbel-lulata accessions, 10 Ae. tauschii accessions and one T. urartu acces-sion based on SNPs that was estimated by using the Ae. umbellulataKU-4017 reference transcript dataset (a) and the Ae. tauschii KU-2075
reference transcript dataset (b). These trees were constructed byNeighbor-Joining method. Figure S4. Phylogenetic relationship betweenthe 12 Ae. umbellulata accessions, 10 Ae. tauschii accessions and one T.urartu accession based on SNPs estimated using the Ae. tauschii KU-2075reference transcript dataset. The tree was constructed by themaximum-likelihood method. Figure S5. Derived allele frequencydistribution in Ae. umbellulata (n = 12) (a) and Ae. tauschii (n = 10) (b),respectively. Ae. tauschii KU-2075 transcripts were used as thereference. Derived alleles were estimated using the outgroup speciesT. urartu. (PDF 824 kb)
AbbreviationsFPKM: Fragments per kilobase per million mapped reads; indels: Insertionsand deletions; RNA-seq: RNA-sequencing; SNPs: Single nucleotidepolymorphisms
AcknowledgmentsThe Ae. umbellulata seeds used in this study were supplied by the NationalBioResource Project-Wheat, Japan (www.nbrp.jp). Computations for RNAsequence assembly and alignments of reads were performed on the NIGsupercomputer at the ROIS National Institute of Genetics, Japan.
FundingThis work was supported by Grant-in-Aid for Scientific Research on Innova-tive Areas No. 17H05842, by Grant-in-Aid for Scientific Research (B) No.16H04862 to ST from the Ministry of Education, Culture, Sports, Science andTechnology (MEXT) of Japan, and by MEXT as part of a Joint Research Pro-gram implemented at the Institute of Plant Science and Resources, OkayamaUniversity, Japan. KY was supported by JST, PRESTO (No. JPMJPR15QB).
Availability of data and materialsThe datasets generated during and/or analyzed during the current study areavailable from the corresponding author on reasonable request.
Authors' contributionsKY, KS and ST designed the whole project. MO, KY, KS and ST wrote themanuscript. MO, AM, and YM performed experiments. MO, RN, and KYconducted RNA-sequencing analyses. All authors read and approved the finalmanuscript.
Ethics approval and consent to participateNot applicable
Consent for publicationNot applicable
Competing interestsThe authors declare that they have no conflicts of interest.
Publisher’s NoteSpringer Nature remains neutral with regard to jurisdictional claims inpublished maps and institutional affiliations.
Author details1Graduate School of Agricultural Science, Kobe University, Rokkodai 1-1,Nada-ku, Kobe 657-8501, Japan. 2Institute of Plant Science and Resources,Okayama University, Kurashiki, Japan.
Received: 29 January 2018 Accepted: 25 October 2018
References1. Lilienfeld FA. H. Kihara: genome-analysis in Triticum and Aegilops. X.
Concluding review. Cytologia. 1951;16:101–23.2. Wang GZ, Miyashita NT, Tsunewaki K. Plasmon analyses of Triticum (wheat)
and Aegilops: PCR-single strand conformational polymorphism (PCR-SSCP)analyses of organellar DNAs. Proc Natl Acad Sci U S A. 1997;94:14570–7.
3. Okada M, Yoshida K, Takumi S. Hybrid incompatibilities in interspecificcrosses between tetraploid wheat and its wild diploid relative Aegilopsumbellulata. Plant Mol Biol. 2017;95:625–45.
Okada et al. BMC Plant Biology (2018) 18:271 Page 11 of 13
4. Kimber G. The addition of the chromosomes of Aegilops umbellulata toTriticum aestivum (var. Chinese spring). Genet Res. 1967;9:111–4.
5. Law CN, Payne PI. Genetical aspects of breeding for improved grain proteincontent and type in wheat. J Cereal Sci. 1983;1:79–93.
6. Chhuneja P, Kaur S, Goel RK, Aghaee-Sarbaezeh M, Parashar M, Dhaliwal HS.Transfer of leaf rust and stripe rust resistance from Aegilops umbellulataZhuk. To bread wheat (Triticum aestivum L.). Genet Resour Crop Evol. 2008;55:849–59.
7. Edae EA, Olivera PD, Jin Y, Poland JA, Rouse MN. Genotype-by-sequencingfacilitates genetic mapping of a stem rust resistance locus in Aegilopsumbellulata, a wild relative of cultivated wheat. BMC Genomics. 2016;17:1039.
8. Bansal M, Kaur S, Dhaliwal HS, Bains NS, Bariana HS, Chhuneja P, Bansal UK.Mapping of Aegilops umbellulata-derived leaf rust and stripe rust resistanceloci in wheat. Plant Pathol. 2017;66:38–44.
9. Edae EA, Olivera PD, Jin Y, Rouse MN. Genotyping-by-sequencing facilitatesa high-density consensus linkage map for Aegilops umbellulata, a wildrelative of cultivated wheat. G3. 2017;7:1551–61.
10. Wang J, Wang C, Zhen S, Li X, Yan Y. Low-molecular-weight gluteninsubunits from the 1U genome of Aegilops umbellulata confer superiordough rheological properties and improve bread making quality of breadwheat. J Sci Food Agric. 2017. https://doi.org/10.1002/jsfa.8700.
11. Schachermayr G, Siedler H, Gale MD, Winzeler H, Winzeler M, Keller B.Identification and localization of molecular markers linked to the Lr9 leafrust resistance gene of wheat. Theor Appl Genet. 1994;88:110–5.
12. Brown JWS, Kemble RJ, Law CN, Flavell RB. Control of endosperm proteinsin Triticum aestivum (ver. Chinise spring) and Aegilops umbellulata byhomeologous group 1 chromosomse. Genetics. 1979;93:189–200.
13. Fox SE, Geniza M, Hanumappa M, Naithani S, Sullivan C, Preece J, Tiwari VK,Elser J, Leonard JM, Sage A, Gresham C, Kerhornou A, Bolser D, McCarthy F,Kersey P, Lazo GR, Jaiswal P. De novo transcriptome assembly and analysesof gene expression during photomorphogenesis in diploid wheat Triticummonococcum. PLoS One. 2014;9:e96855.
14. Iehisa JCM, Shimizu A, Sato K, Nasuda S, Takumi S. Discovery of high-confidence single nucleotide polymorphisms from large-scale de novoanalysis of leaf transcripts of Aegilops tauschii, a wild wheat progenitor.DNA Res. 2012;19:487–97.
15. Iehisa JCM, Shimizu A, Sato K, Nishijima R, Sakaguchi K, Matsuda R,Nasuda S, Takumi S. Genome-wide marker development for the wheatD genome based on single nucleotide polymorphisms identified fromtranscripts in the wild wheat progenitor Aegilops tauschii. Theor ApplGenet. 2014;127:261–71.
16. Nishijima R, Yoshida K, Motoi Y, Sato K, Takumi S. Genome-wideidentification of novel genetic markers from RNA sequencing assembly ofdiverse Aegilops tauschii accessions. Mol Gen Genomics. 2016;291:1681–94.
17. Ramirez-Gonzalez RH, Segovia V, Bird N, Fenwick P, Holdgate S, Berry S, Jack P,Caccamo M, Uauy C. RNA-seq bulked segregant analysis enables theidentification of high-resolution genetic markers for breeding in hexaploidwheat. Plant Biotechnol J. 2015;13:613–24.
18. Lu P, Liang Y, Li D, Wang Z, Li W, Wang G, Wang Y, Zhou Q, Xie J, Zhang D,Chen Y, Li M, Zhang Y, Sun Q, Han C, Liu Z. Fine genetic mapping of spotblotch resistance gene Sb3 in wheat (Triticum aestivum). Theor Appl Genet.2016;129:577–89.
19. International Barley Genome Sequencing Consortium. A physical,genetic and functional sequence assembly of the barley genome.Nature. 2012;491:711–6.
20. Mascher M, Gundlach H, Himmelbach A, Beier S, Twardziok SO, Wicker T,Radchuk V, Dockter C, Hedley PE, Russell J, Bayer M, Ramsay L, Liu H,Haberer G, Zhang X-Q, Zhang Q, Barrero RA, Li L, Taudien S, Groth M, FelderM, Hastie A, Simkova H, Stankova H, Vrana J, Chan S, Munoz-Amatriain M,Ounit R, Wanamaker S, Bolser D, Colmsee C, Schmutzer T, Aliyeva-Schnorr L,Grasso S, Tanskanen J, Chailyan A, Sampath D, Heavens D, Clissold L, Cao S,Chapman B, Dai F, Han Y, Li H, Li X, Lin C, McCoole JK, Tan C, Wang P,Wang S, Yin S, Zhou G, Poland JA, Bellgard MI, Borisjuk L, Houben A, DolezelJ, Ayling S, Lonardi S, Kersey P, Langridge P, Muehlbauer GJ, Clark MD,Caccamo M, Schulman AH, Mayer KFX, Platzer M, Close TJ, Scholz U,Hansson M, Zhang G, Braumann I, Spannagl M, Li C, Waugh R, Stein N. Achromosome conformation capture ordered sequence of the barleygenome. Nature. 2017;544:427–33.
21. Luo MC, Gu YQ, Puiu D, Wang H, Twardziok SO, Deal KR, Huo N, Zhu T,Wang L, Wang Y, MaGuire PE, Liu S, Long H, Ramasamy RK, Rodriquez JC,
Van SL, Yuan L, Wang Z, Xia Z, Xiao L, Anderson OD, Ouyang S, Liang Y,Zimin AV, Pertea G, Qi P, Bennetzen JL, Dai X, Dawson MW, Müller H-G,Kugler K, Rovarola-Duarte L, Spannagl M, Mayer KFX, Lu F-H, Bevan MW,Leroy P, Li P, You FM, Sun Q, Liu Z, Lyons E, Wicker T, Salzberg SL, DevosKM, Dvorák J. Genome sequence of the progenitor of the wheat D genomeAegilops tauschii. Nature. 2017;551:498–502.
22. Zhao G, Zou C, Li K, Wang K, Li T, Gao L, Zhang X, Wang H, Yang Z, Liu X,Jiang W, Mao L, Kong X, Jiao Y, Jia J. The Aegilops tauschii genome revealsmultiple impacts of transposons. Nat Plants. 2017;3:946–55.
23. Mayer KFX, Martis M, Hedley PE, Šimkov H, Liu H, Morris JA, Steuernagel B,Taudien S, Roessner S, Gundlach H, Kubal Kov M, Suchánková P, Murat F,Felder M, Nussbaumer T, Graner A, Salse J, Endo T, Sakai H, Tanaka T, Itoh T,Sato K, Platzer M, Matsumoto T, Scholz U, Doležel J, Waugh R, Stein N.Unlocking the barley genome by chromosomal and comparative genomics.Plant Cell. 2011;23:1249–63.
24. Wicker T, Mayer KFX, Gundlach H, Martis M, Steuernagel B, Scholz U, ŠimkovH, Kubal Kov M, Choulet F, Taudien S, Platzer M, Feuillet C, Fahima T, BudakH, Dolezel J, Keller B, Stein N. Frequent gene movement and pseudogeneevolution is common to the large and complex genomes of wheat, barley,and their relatives. Plant Cell. 2011;23:1706–18.
25. Bolger AM, Lohse M, Usadel B. Trimmomatic: a flexible trimmer for Illuminasequence data. Bioinformatics. 2014;30:2114–20.
26. Grabherr MG, Haas BJ, Yassour M, Levin JZ, Thompson DA, Amit I, AdiconisX, Fan L, Raychowdhury R, Zeng Q, Chen Z, Mauceli E, Hacohen N, Gnirke A,Rhind N, di Palma F, Birren BW, Nusbaum C, Lindblad-Toh K, Friedman N,Regev A. Full length transcriptome assembly from RNA-seq data without areference genome. Nat Biotechnol. 2011;29:644–52.
27. Haas BJ, Papanicolaou A, Yassour M, Grabherr M, Blood PD, Bowden J,Couger MB, Eccles D, Li B, Lieber M, Macmanes MD, Ott M, Orvis J, PochetN, Strozzi F, Weeks N, Westerman R, William T, Dewey CN, Henschel R,Leduc RD, Friedman N, Regev A. De novo transcript sequencereconstruction from RNA-seq using the trinity platform for referencegeneration and analysis. Nat Protoc. 2013;8:1494–512.
28. Langmead B, Salzberg SL. Fast gapped-read alignment with bowtie 2. NatMethods. 2012;9:357–9.
29. Li H, Handsaker B, Wysoker A, Fennell T, Ruan J, Homer N, Marth G, AbecasisG, Durbin R. Subgroup 1000 genome project data processing. The sequencealignment/map format and SAMtools. Bioinformatics. 2009;25:2078–9.
30. Kosugi S, Natsume S, Yoshida K, MacLean D, Cano L, Kamoun S, Terauchi R.Coval: improving alignment quality and variant calling accuracy for next-generation sequencing data. PLoS One. 2013;8:e75402.
31. Kersey PJ, Allen JE, Armean I, Boddu S, Bolt BJ, Carvalho-Silva D,Christensen M, Davis P, Falin LJ, Grabmueller C, Humphrey J, KerhornouA, Khobova J, Aranganathan NK, Langridge N, Lowy E, McDowall MD,Maheswari U, Nuhn M, Ong CK, Overduin B, Paulini M, Pedro H, PerryE, Spudich G, Tapanari E, Walts B, Williams G, Tello-Ruiz M, Stein J, WeiS, Ware D, Bolser DM, Howe KL, Kulesha E, Lawson D, Maslen G, StainesDM. Ensembl genomes 2016: more genomes, more complexity. NucleicAcids Res. 2015;44:574–80.
32. Wu TD, Watanabe CK. GMAP: a genomic mapping and alignment programfor mRNA and EST sequences. Bioinformatics. 2005;21:1859–75.
33. Quinlan AR, Hall IM. BEDTools: a flexible suite of utilities for comparinggenomic features. Bioinformatics. 2010;26:841–2.
34. Krzywinski M, Schein J, Birol I, Connors J, Gascoyne R, Horsman D, Jones SJ,Marra MA. Circos: an information aesthetic for comparative genetics.Genome Res. 2009;19:1639–45.
35. Untergasser A, Nijveen H, Rao X, Bisseling T, Geurts R, Leunissen JA.Primer3Plus, an enhanced web interface to Primer3. Nucleic Acid Res. 2007;35:W71–4.
36. Tajima F. Statistical method for testing the neutral mutation hypothesis byDNA polymorphism. Genetics. 1989;123:585–95.
37. Librado P, Rozas J. DnaSP v5: a software for comprehensive analysis of DNApolymorphism data. Bioinformatics. 2009;25:1451–2.
38. Trapnell C, Williams BA, Pertea G, Mortazavi A, Kwan G, van Baren MJ,Salzberg SL, Wold BJ, Pachter L. Transcript assembly and quantification byRNA-seq reveals unannotated transcripts and isoform switching during celldifferentiation. Nat Biotechnol. 2010;28:511–5.
39. Matsuoka Y, Takumi S, Kawahara T. Intraspecific lineage divergence and itsassociation with reproductive trait change during species range expansionin central Eurasian wild wheat Aegilops tauschii Coss. (Poaceae). BMC EvolBiol. 2015;15:213.
Okada et al. BMC Plant Biology (2018) 18:271 Page 12 of 13
40. Fay JC, Wu CI. Hitchhiking under positive Darwinian selection. Genetics.2000;155:1405–13.
41. Watterson GA. On the number of segregating sites in genetical modelswithout recombination. Theor Popul Biol. 1975;7:256–76.
42. Jia J, Zhao S, Kong X, Li Y, Zhao G, He W, Appels R, Pfeifer M, Tao Y, ZhangX, Jing R, Zhang C, Ma Y, Gao L, Gao C, Spannagl M, KFX M, Li D, Pan S,Zheng F, Hu Q, Xia X, Li J, Liang Q, Chen J, Wicker T, Gou C, Kuang H, He G,Luo Y, Keller B, Xia Q, Lu P, Wang J, Zou H, Zhang R, Xu J, Gao J, MiddletonC, Quan Z, Liu G, Wang J, International wheat genome sequencingconsortium, Yang H, Liu X, He Z, Mao L, Wang J. Aegilops tauschii draftgenome sequence reveals a gene repertoire for wheat adaptation. Nature.2013;496:91–5.
43. Luo M-C, Gu YQ, You FM, Deal KR, Ma Y, Hu Y, Huo N, Wang Y, Wang J,Chen S, Jorgensen CM, Zhang Y, McGuire PE, Pasternak S, Stein JC, Ware D,Kramer M, McCombie WR, Kianian SF, Martis MM, Mayer KFX, Sehgal SK, LiW, Gill BS, Bevan MW, Šimková H, Doležel J, Weining S, Lazo GR, AndersonOD, Dvorak J. A 4-gigabase physical map unlocks the structure andevolution of the complex genome of Aegilops tauschii, the wheat D-genome progenitor. Proc Natl Acad Sci U S A. 2013;110:7940–5.
44. Zhang H, Jia J, Gale MD, Devos KM. Relationships between thechromosomes of Aegilops umbellulata and wheat. Theor Appl Genet. 1998;96:69–75.
45. Devos KM, Gale MD. Genome relationships: the grass model in currentresearch. Plant Cell. 2000;12:637–46.
46. Molnár I, Vrána J, Burešová V, Cápal P, Farkas A, Darkó É, Cseh A, KubalákováM, Molnár-Láng M, Doležel J. Dissecting the U, M, S and C genome of wildrelatives of bread wheat (Aegilops spp.) into chromosomes and exploringtheir synteny with wheat. Plant J. 2016;88:452–67.
47. Nishijima R, Okamoto Y, Hatano H, Takumi S. Quantitative trait locus analysisfor spikelet shape-related traits in wild wheat progenitor Aegilops tauschii:implications for intraspecific diversification and subspecies differentiation.PLoS One. 2017;12:e0173210.
48. Sasanuma T, Chabane K, Endo TR, Valkoun J. Characterization of geneticvariation in and phylogenetic relationships among diploid Aegilops speciesby AFLP: incongruity of chloroplast and nuclear data. Theor Appl Genet.2004;108:612–8.
49. Wright SI, Kalisz S, Slotte T. Evolutionary consequences of self-fertilization inplants. Proc R Soc B. 2013;280:20130133.
Okada et al. BMC Plant Biology (2018) 18:271 Page 13 of 13