Embed Size (px)
Citation preview

Genetic dissection and prognostic modeling of overtstroke in sickle cell anemiaPaola Sebastiani1,6, Marco F Ramoni2,6, Vikki Nolan3, Clinton T Baldwin4 & Martin H Steinberg5
Sickle cell anemia (SCA) is a paradigmatic single genedisorder caused by homozygosity with respect to a uniquemutation at the b-globin locus. SCA is phenotypically complex,with different clinical courses ranging from early childhoodmortality to a virtually unrecognized condition. Overt stroke isa severe complication affecting 6–8% of individuals with SCA.Modifier genes might interact to determine the susceptibilityto stroke, but such genes have not yet been identified. UsingBayesian networks, we analyzed 108 SNPs in 39 candidategenes in 1,398 individuals with SCA. We found that 31 SNPs in12 genes interact with fetal hemoglobin to modulate the risk ofstroke. This network of interactions includes three genes in theTGF-b pathway and SELP, which is associated with stroke inthe general population. We validated this model in a differentpopulation by predicting the occurrence of stroke in 114individuals with 98.2% accuracy.
Stroke is a severe vascular complication of SCA, more frequent inaffected individuals under the age of 20. Although recovery may becomplete, stroke can cause permanent brain damage and even death.Trans-cranial Doppler flow studies can predict the likelihood of strokein children with SCA, but only 10% of individuals with abnormaltrans-cranial Doppler values will have stroke in the year after the
study, and stroke will occur in B19% individuals with normal trans-cranial Doppler values1. More accurate prognostic methods wouldtherefore help to target prophylactic treatments, such as transfusion2
or hydroxyurea, to individuals at highest risk3,4.In individuals with SCA, the products of modifier genes may
interact to determine the likelihood of stroke and other complications.SNPs in VCAM1 (ref. 5), IL4R and ADRB2 (ref. 6) are significantlyassociated with stroke in SCA subjects. Furthermore, the risk of strokeis reduced in individuals with a-thalassemia7, and increased fetalhemoglobin (HbF) levels are associated with reduced risks for othercomplications8. To identify the genetic basis of stroke in individualswith SCA, we selected 80 candidate genes involved in vasoregulation,inflammation, cell adhesion, coagulation, hemostasis, cell prolifera-tion, oxidative biology and other functions. We analyzed 108 SNPs inthese genes in 1,398 African Americans with SCA, 92 subjects withreported overt stroke and 1,306 subjects without, enrolled in theCooperative Study of Sickle Cell Disease (CSSCD)9. Extensive clinicalinformation was available for each of these individuals (Supplemen-tary Table 1 online).
Genetic dissection of a complex trait requires disentangling the webof interactions among genes, environment and phenotype10–12. Tomodel these relationships, we carried out a multivariate analysis usingBayesian networks, multivariate dependency models that account for
Figure 1 Examples of Bayesian network
structures. (a) A simple Bayesian network
with two nodes representing a SNP (G) and
a phenotype (P). The probability distribution
of G represents the genotype distribution in the
population, and the conditional probability
distribution of P describes the distribution
of the phenotype given each genotype.
(b) The association between G and P can be
reversed using Bayes theorem. (c) A Bayesian
network linking four SNPs (G1–G4) to a phenotype P. The phenotype is independent of the other SNPs, once we know the SNPs G3 and G4. The joint
probability distribution of the network is fully specified by the five distributions representing the distribution of G1 (two parameters), of G2 given G1(six parameters), of G3 given G2 (six parameters), of G4 given G2 (six parameters) and of P given G3 and G4 (nine parameters). The full probability
distribution requires 81 � 2 � 1 ¼ 161 parameters; this network requires only 29.
G G
GP
P
PP
G AA Aa aa0.6 0.3 0.1
AAAaaa
Present0.70.50.1
Absent0.30.50.9
G AA Aa aaPresentAbsent
0.4040.187
0.0190.188
0.5770.625
PPresent Absent
0.52 0.48 P
G4G3
G2
G1a b c
Published online 20 March 2005; doi:10.1038/ng1533
1Department of Biostatistics, Boston University School of Public Health, Boston, Massachusetts 02118, USA. 2Children’s Hospital Informatics Program and HarvardPartners Center for Genetics and Genomics, Harvard Medical School, Boston, Massachusetts 02115, USA. 3Department of Epidemiology, Boston University Schoolof Public Health, Boston, Massachusetts 02118, USA. 4Center for Human Genetics and Department of Pediatrics, Boston University School of Medicine, Boston,Massachusetts 02118, USA. 5Department of Medicine, Boston University School of Medicine, Boston, Massachusetts 02118, USA. 6These authors contributedequally to this work. Correspondence should be addressed to M.F.R. ([email protected]).
NATURE GENETICS VOLUME 37 [ NUMBER 4 [ APRIL 2005 43 5
L E T T E R S©
2005
Nat
ure
Pub
lishi
ng G
roup
ht
tp://
ww
w.n
atur
e.co
m/n
atur
egen
etic
s

simultaneous associations and interactions among multiple genes andtheir interplay with clinical and physiological factors. Bayesian net-works have been already applied to the analysis of several types ofgenomic data (gene expression13, protein-protein interactions14 andpedigree analysis15), and their modular nature makes them ideal foranalyzing large association studies. Furthermore, Bayesian networkscan be used for prognosis: a network capturing the relationshipbetween genotypes and phenotype can be used to compute theprobability that a new individual with particular genotype will havethe phenotype of interest15,16.
A Bayesian network is a directed acyclic graph in which nodesrepresent random variables and arcs define directed stochastic depen-dencies quantified by probability distributions. Figure 1 depicts threeBayesian networks, starting with a simple network describing thedependency of a phenotypic character P on a single SNP G (Fig. 1a).The graph decomposes the joint probability distribution of the twovariables into the product of the marginal distribution of G (theparent node) and the conditional distribution of P (the child node)given G. The marginal and conditional probability distributions aresufficient to define the association between P and G because theirproduct determines the joint probability distribution. This propertypersists when we invert the direction of the arc in the graph (Fig. 1b)and when we expand the graphical structure to include severalvariables (Fig. 1c): the overall association is measured by the joint
probability distribution that is still defined by the product of eachchild-parent conditional distribution. This modular nature of aBayesian network is due to the conditional independences amongthe variables encoded by the directed acyclic graph16: the graphspecifies the set of parents of each node as those having an arcpointing directly to it, and each node becomes independent ofits predecessors given the parent nodes. This modular represen-tation captures complex dependency models (able to integrateassociations between SNPs and phenotype; associations betweenSNPs due to linkage disequilibrium or evolutionary patterns17;and interaction processes linking SNPs, phenotype and modulatingfactors18) with a small number of parameters. Reducing the numberof parameters allows us to ‘learn’ large dependency networksfrom comparatively small data sets, and well-established techni-ques exist to develop Bayesian networks from data in an almostautomated manner16.
We focused on those networks that describe the dependencies ofgenotypes on phenotype, because analysis conditional on phenotypereduces the complexity of the search18 and can identify larger sets ofassociations between SNPs and phenotype. This modeling strategydescribing the diagnostic rather than prognostic associations iscommonly used in data mining to build predictive models in largedata sets19. Figure 2 shows the overall dependency network that weidentified, linking 69 SNPs in 20 genes, HbF levels, total hemoglobin
EDN1.9
EDN1.7
EDN1.3 BMP6.2 BMP6.3
ANXA2.7
ANXA2.5
ANXA2.11
ANXA2.12
ANXA2.13
ANXA2.8
ANXA2.4
ANXA2.3
ERG.5 RS276789 TGFBR3.4
TGFBR2.6 TGFBR2.0
TIE
CAT
MET.9
MET.6NRCAM
SELP.15
ERG.3
ECE1.12
BMP6
BMP6.10 ADCY9.8ECE1.13 SELP.17 ERG.4
SELP.2
EDN1.10 EDN1.6
BMP6.13BMP6.9 SELP.22
ERG.2
SELP.12
SELP.11
SELP.13
SELPSELPLG
TEK
SELP.14
CIQB
MET.5
KL.2
TGFBR3.10
TGFBR3.7
TGFBR2TGFBR3
KL.3CSF2.3
TGFBR3.9
TGFBR3.2
TGFBR3.8
CSF2.4
ANXA2.6
CCL2
BMP6.11
BMP6.14 BMP6.12
TGFBR3.6
ADCY9.5
ADCY9.11
ADCY9
ADCY9.9
Thalassemia HbF.G
HbG
HbF.P
Stroke
Figure 2 The Bayesian network describing the joint association of 69 SNPs with stroke. Nodes represent SNPs or clinical factors; the numbers after each
gene distinguish different SNPs on the same gene. SNP are shown as blue nodes; their rs numbers are given in Supplementary Table 4 online. Clinical
variables (HbF.G, fetal hemoglobin (g dL�1); HbF.P, fetal hemoglobin (%); HbG, total hemoglobin concentration; Thalassemia, heterozygosity or homozygosity
with respect to a 3.7-kb a-thalassemia deletion) are shown as pink nodes. Twenty-five SNPs in ADCY9, ANXA2, BMP6, CCL2, CSF2, ECE1, ERG, MET,
SELP, TEK and TGFBR3 are directly associated with the phenotype and have the largest independent effect on the risk of stroke. Note the association
of stroke with several SNPs in ADCY9, BMP6, MET, SELP and TGFBR3, which usually reduces the possibility of false positives18.
4 36 VOLUME 37 [ NUMBER 4 [ APRIL 2005 NATURE GENETICS
L E T T E R S©
2005
Nat
ure
Pub
lishi
ng G
roup
ht
tp://
ww
w.n
atur
e.co
m/n
atur
egen
etic
s

concentration and coincidence of a-thalassemia to stroke. Thirty oneSNPs in 12 genes interact with HbF to modulate the risk of stroke. Ofthese, 25 SNPs in 11 genes are directly associated with the phenotype,meaning that they have the largest independent effect on the predic-tion of risk of stroke. The strength of the dependency of each of thesenodes is summarized by the odds of the model with the dependencyversus the model without the dependency (Table 1). The conditionalprobability tables quantifying the network are estimated from the data(Supplementary Table 2 online).
The network dissects the genetic basis of stroke into 11 genes whosevariants have a direct effect on the disease that is modulated by HbFlevels and 9 genes whose variants are indirectly associated with stroke.An example is the cluster of five SNPs in EDN1 that is associated withSNPs in ANXA2 and BMP6. Both EDN1 and BMP6 are on chromo-some 6 (at 6p24.1 and 6p24.3, respectively), and their associationsuggests that this chromosomal region may be associated with anincreased risk of stroke. ANXA2 has a regulatory role in cell surfaceplasmin generation20; EDN1 might be a potent vasoconstrictor andmitogen secreted in response to hypoxia21, supporting the hypothesisthat EDN1 antagonists may be useful in the prevention and treatmentof sickle vaso-occlusive crises. Our model suggests that variants inBMP6 are the strongest risk factors, whereas variants in EDN1 areassociated with stroke through BMP6 and ANXA2 but are not asrelevant for risk prediction. Stroke is also directly associatedwith variants in TGFBR3 and indirectly associated with variantsin TGFBR2, which have essential, nonredundant roles in TGF-b
signaling22. BMP6 is part of the TGF-b superfamily, and the simulta-neous association of three genes with functional roles in TGF-bsignaling suggests that this pathway might be involved with increasedrisk of stroke. This conjecture is further supported by the associationof stroke with CSF2, a protein necessary for the survival, proliferationand differentiation of leukocyte progenitors. Variants in SELP areassociated with stroke in the general population23; our analysisconfirms its important, though insufficient, prognostic role.
By decomposing the overall distribution into interrelated modules,the network summarizes all relevant dependencies without losing themultigenic nature of stroke. Using the network in Figure 2, we cancompute the probability distribution of the phenotype (stroke) giventhe genotype of any SNP and, conversely, compute the conditionaldistribution of any genotype given values of other variables in thenetwork. In this way, the model is able to describe the determinanteffects of genetic variants on stroke, to predict the odds for stroke ofnew individuals given their genotypes and to find the most probablecombination of genetic variants leading to stroke.
Table 2 reports the risk of stroke predicted by the network inFigure 2 for some genotypes and shows the impossibility of predictingthis risk using individual SNPs. For example, homozygosity (TT) withrespect to BMP6.10 is, by itself, associated with both negligible andvery large risk, and only the simultaneous consideration of other SNPscan determine the actual risk of stroke. This situation is confirmed bythe analysis of single-gene accuracy and contribution (Table 1),highlighting the small effect of individual genes. On the other hand,
Table 1 Summary information for the genes and the clinical variable HbF directly associated with stroke
Single geneb
Gene Position SNP Bayes factora Accuracy (%) Contribution (%)
ADCY9 16p13.3 rs437115 3 71.93 2
rs2238432 98
rs2238426 3,381
rs2072338 638
rs2283497 10
ANXA2 15q22.2 hCV26910500 1.68 � 108 43.86 2
BMP6 6p24.3 rs267196 2.31 � 1016 83.33 5
rs267201 1.92 � 10103
rs408505 4.06 � 10101
rs449853 2.20 � 1057
CCL2 17q11.2 rs4586 844 55.14 1
CSF2 5q23.3 rs25882 1.19 � 10198 50.88 1
ECE1 1p36.12 rs212528 1.55 � 104 13.15 0.20
rs212531 2.34 � 1080
ERG 21q22.2 rs989554 62 42.98 1
MET 7q31.2 rs38850 68 23.68 1
rs38859 1.58 � 1039
SELP 1q24.2 rs2420378 1.90 � 1010 80.70 7
rs3917733 2.84 � 1034
rs3753306 2.32 � 1065
TEK 9p21.2 rs489347 2 8 1
TGFBR3 1p22.1 rs284875 443,992 50.88 2
rs2148322 68,988
rs2765888 41,968
rs2007686 1,739
HbF (%) 482 72.81 1
aBayes factor of the model associating the SNP to stroke versus the model of independence. bThe accuracy of a single gene is the proportion of individuals whose phenotype is correctly predictedusing only the SNPs in this gene. Single gene contribution is the loss of predictive accuracy when all SNPs of this gene are removed. Both single gene accuracy and contribution were measured onthe independent test set of 114 individuals.
NATURE GENETICS VOLUME 37 [ NUMBER 4 [ APRIL 2005 43 7
L E T T E R S©
2005
Nat
ure
Pub
lishi
ng G
roup
ht
tp://
ww
w.n
atur
e.co
m/n
atur
egen
etic
s
the 98.5% predictive accuracy reached by the model in fivefold cross-validation shows the determinant role of the simultaneous presence ofall SNPs and their interplay with clinical variables for the correctprediction of stroke susceptibility.
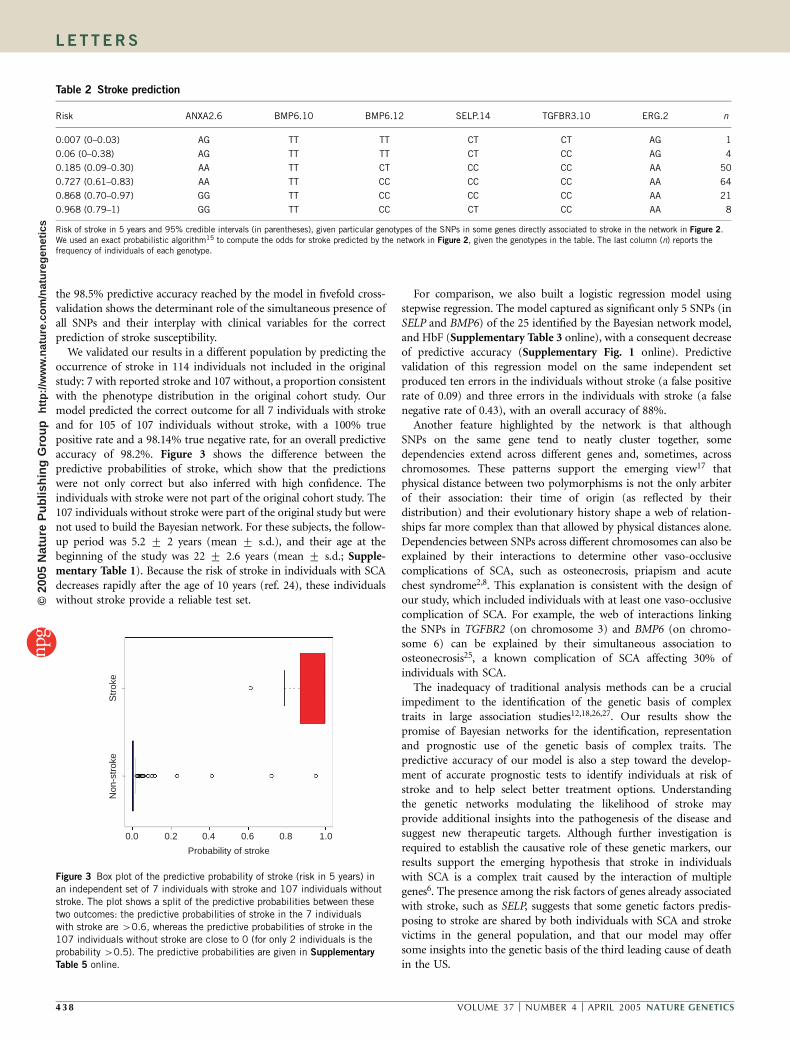
We validated our results in a different population by predicting theoccurrence of stroke in 114 individuals not included in the originalstudy: 7 with reported stroke and 107 without, a proportion consistentwith the phenotype distribution in the original cohort study. Ourmodel predicted the correct outcome for all 7 individuals with strokeand for 105 of 107 individuals without stroke, with a 100% truepositive rate and a 98.14% true negative rate, for an overall predictiveaccuracy of 98.2%. Figure 3 shows the difference between thepredictive probabilities of stroke, which show that the predictionswere not only correct but also inferred with high confidence. Theindividuals with stroke were not part of the original cohort study. The107 individuals without stroke were part of the original study but werenot used to build the Bayesian network. For these subjects, the follow-up period was 5.2 7 2 years (mean 7 s.d.), and their age at thebeginning of the study was 22 7 2.6 years (mean 7 s.d.; Supple-mentary Table 1). Because the risk of stroke in individuals with SCAdecreases rapidly after the age of 10 years (ref. 24), these individualswithout stroke provide a reliable test set.
For comparison, we also built a logistic regression model usingstepwise regression. The model captured as significant only 5 SNPs (inSELP and BMP6) of the 25 identified by the Bayesian network model,and HbF (Supplementary Table 3 online), with a consequent decreaseof predictive accuracy (Supplementary Fig. 1 online). Predictivevalidation of this regression model on the same independent setproduced ten errors in the individuals without stroke (a false positiverate of 0.09) and three errors in the individuals with stroke (a falsenegative rate of 0.43), with an overall accuracy of 88%.
Another feature highlighted by the network is that althoughSNPs on the same gene tend to neatly cluster together, somedependencies extend across different genes and, sometimes, acrosschromosomes. These patterns support the emerging view17 thatphysical distance between two polymorphisms is not the only arbiterof their association: their time of origin (as reflected by theirdistribution) and their evolutionary history shape a web of relation-ships far more complex than that allowed by physical distances alone.Dependencies between SNPs across different chromosomes can also beexplained by their interactions to determine other vaso-occlusivecomplications of SCA, such as osteonecrosis, priapism and acutechest syndrome2,8. This explanation is consistent with the design ofour study, which included individuals with at least one vaso-occlusivecomplication of SCA. For example, the web of interactions linkingthe SNPs in TGFBR2 (on chromosome 3) and BMP6 (on chromo-some 6) can be explained by their simultaneous association toosteonecrosis25, a known complication of SCA affecting 30% ofindividuals with SCA.
The inadequacy of traditional analysis methods can be a crucialimpediment to the identification of the genetic basis of complextraits in large association studies12,18,26,27. Our results show thepromise of Bayesian networks for the identification, representationand prognostic use of the genetic basis of complex traits. Thepredictive accuracy of our model is also a step toward the develop-ment of accurate prognostic tests to identify individuals at risk ofstroke and to help select better treatment options. Understandingthe genetic networks modulating the likelihood of stroke mayprovide additional insights into the pathogenesis of the disease andsuggest new therapeutic targets. Although further investigation isrequired to establish the causative role of these genetic markers, ourresults support the emerging hypothesis that stroke in individualswith SCA is a complex trait caused by the interaction of multiplegenes6. The presence among the risk factors of genes already associatedwith stroke, such as SELP, suggests that some genetic factors predis-posing to stroke are shared by both individuals with SCA and strokevictims in the general population, and that our model may offersome insights into the genetic basis of the third leading cause of deathin the US.
1.00.80.60.40.20.0
Probability of stroke
Non
-str
oke
Str
oke
Figure 3 Box plot of the predictive probability of stroke (risk in 5 years) in
an independent set of 7 individuals with stroke and 107 individuals without
stroke. The plot shows a split of the predictive probabilities between these
two outcomes: the predictive probabilities of stroke in the 7 individuals
with stroke are 40.6, whereas the predictive probabilities of stroke in the
107 individuals without stroke are close to 0 (for only 2 individuals is the
probability 40.5). The predictive probabilities are given in Supplementary
Table 5 online.
Table 2 Stroke prediction
Risk ANXA2.6 BMP6.10 BMP6.12 SELP.14 TGFBR3.10 ERG.2 n
0.007 (0–0.03) AG TT TT CT CT AG 1
0.06 (0–0.38) AG TT TT CT CC AG 4
0.185 (0.09–0.30) AA TT CT CC CC AA 50
0.727 (0.61–0.83) AA TT CC CC CC AA 64
0.868 (0.70–0.97) GG TT CC CC CC AA 21
0.968 (0.79–1) GG TT CC CT CC AA 8
Risk of stroke in 5 years and 95% credible intervals (in parentheses), given particular genotypes of the SNPs in some genes directly associated to stroke in the network in Figure 2.We used an exact probabilistic algorithm15 to compute the odds for stroke predicted by the network in Figure 2, given the genotypes in the table. The last column (n) reports thefrequency of individuals of each genotype.
4 38 VOLUME 37 [ NUMBER 4 [ APRIL 2005 NATURE GENETICS
L E T T E R S©
2005
Nat
ure
Pub
lishi
ng G
roup
ht
tp://
ww
w.n
atur
e.co
m/n
atur
egen
etic
s
METHODSData collection. Between October 1978 and September 1988, the first phase of
the CSSCD enrolled 4,082 African Americans from 23 clinical centers across the
US9. Newborns and any individual who had visited a participating clinic for
any medical reason between 1975 and 1978 were eligible for participation.
Except for newborns, who were enrolled throughout the study period, enroll-
ment was closed in May 1981. Subjects were observed for 5.2 7 2 years (mean
7 s.d.). Five years after the start of the CSSCD, blood samples were obtained
for the determination of a-thalassemia and the b-globin gene cluster haplotype.
DNA from this sample was also deposited in a repository controlled by the US
National Institutes of Health; this DNA was used for SNP genotyping. We
limited our genotyping to samples from individuals with SCA (homozygous
with respect to the hemoglobin S gene) with or without coincident
a-thalassemia, who presented at least one vaso-occlusive complication of SCA.
The CSSCD database provided the clinical information about the subpheno-
types of SCA, including overt stroke, osteonecrosis, acute chest syndrome,
painful episodes, leg ulceration, renal failure, priapism and proliferative
retinopathy. Information about other clinical features, including HbF levels,
systolic and diastolic blood pressure, and gender, was also collected. The DNA
samples were used to genotype 235 SNPs in 80 candidate genes.
Strokes were classified by the investigator at each center on the basis of the
available clinical and imaging studies. For our analysis, we considered only
those individuals with a confirmed history of or incident complete nonhemor-
rhagic stroke, documented by imaging studies. Ninety-five percent of the indi-
viduals classified as having infarctive stroke underwent computed tomography
scan, brain scan or magnetic resonance imaging at the time of the event. Mag-
netic resonance imaging information was not collected before December 1986.
A detailed description of stroke in individuals who participated in the CSSCD
was reported previously28. This study was reviewed and approved by the
Institutional Review Board of Boston University School of Medicine. Samples
from individuals with stroke of the independent validation set were obtained
from the Medical College of Georgia and the University of Mississippi Medical
Center, with the approval of their respective Institutional Review Boards.
Genotyping. DNA samples were used for SNP genotyping by high-throughput
mass spectrometry. We selected SNPs with population frequency information
and heterozygosity values 40.2 in the candidate genes from dbSNP and the
Celera database. We compared the amplification primers used in all reactions
with the SNP database to ensure that there were no hidden SNPs in the
amplification priming site that would result in inaccurate genotyping. We used
the Sequenom Mass Spectrometry HME assay for genotyping29. We amplified
the region containing the SNP by PCR, treated it with shrimp alkaline
phosphatase, hybridized it to with a primer upstream of the polymorphism
and extended the primer with a combination of a normal and a di-deoxy dNTP
that corresponds to the SNP. We then removed salt from the sample and
analyzed the primer extension products on a Bruker Biflex II Mass Spectro-
meter. For assay design, we tagged the amplification primers. The melt
temperature of the unique portion of the amplification primers was 56–58 1C
and the product size was 80–150 bp. The mass of the detecting primer
was 4,000–8,000 Da. We assembled multiplex groups of five to eight SNPs,
with similar sequence context, into single reactions for analysis. We
assembled information about phenotypes, clinical features and genotypes
into a large database and assigned a unique identifier to each sample to
anonymize the data.
Statistical analysis. Of the 235 SNPs genotyped in CSSCD subjects, 116 were
not included in the statistical analysis either because they were monomorphic
or because the primers failed. Of the remaining 118 SNPs, we included in the
analysis those with o30% missing genotypes satisfying Hardy Weinberg
equilibrium in the individuals with stroke, for a total of 108 SNPs in 39
candidate genes. Continuous variables were discretized into four bins with
equal frequencies.
To build the Bayesian network, we used a popular Bayesian approach30
implemented in the program Bayesware Discoverer. The program searches for
the most probable network of dependency given the data. To find such a
network, the Discoverer explores a space of different network models, scores
each model by its posterior probability conditional on the available data and
returns the model with maximum posterior probability. This probability is
computed by Bayes theorem as pðMjDÞ / pðDjMÞpðMÞ, where p(D|M) is the
probability that the observed data are generated from the network model M
and p(M) is the prior probability encoding knowledge about the model M
before seeing any data. We assumed that all models were equally likely a priori,
and so p(M) is uniform and p(M|D) becomes proportional to p(D|M), a
quantity known as marginal likelihood. The marginal likelihood averages the
likelihood functions for different parameters values and is calculated as
pðDjMÞ ¼R
pðDjyÞpðyÞdy, where p(D|y) is the traditional likelihood function
and p(y) is the parameter prior density. For categorical data in which p(y)
follows a Dirichlet distribution, the integral pðDjMÞ ¼R
pðDjyÞpðyÞdyhas a closed-form solution16 that is computed in product form as
pðDjMÞ ¼Q
i pðDijMiÞ, where Mi is the model describing the dependency of
the ith variable on its parent nodes and Di are the observed data of the ith
variable16. The factorization of the marginal likelihood implies that a model can
be learned locally, by selecting the most probable set of parents for each variable
and then joining these local structures into a complete network, in a procedure
that closely resembles standard path analysis. This modularity property allows
us to assess, locally, the strength of local associations represented by rival
models. This comparison is based on the Bayes factor that measures the odds of
a model Mi versus a model ~Mi by the ratio of their posterior probabilities
pðMijDiÞ=pð ~MijDiÞ or, equivalently, by the ratio of their marginal likelihoods
r ¼ pðDijMiÞ=pðDij ~MiÞ. Given a fixed structure for all the other associations,
the posterior probability p(Di|Mi) equals r/(1 + r) and a large Bayes factor rimplies that the probability p(Di|Mi) is close to one, meaning that there is very
strong evidence for the associations described by the model Mi versus the
alternative model ~Mi. When we explore different dependency models for the ith
variable, the posterior probability of each model depends on the same data Di.
To reduce the search space, we used a bottom-up search strategy known as
the K2 algorithm30. We specified the space of candidate models to be explored
by imposing a search order on the database variables in which older SNPs
(more uniformly distributed in the population) were tested as children of more
recent SNPs (asymmetrically distributed SNPs). Results of simulations that we
have carried out suggest that this heuristic leads to better networks with largest
marginal likelihood. We focused on models in which the phenotype is the root
node of the network and the genotypes can be either conditionally dependent
or marginally independent of it. As in traditional regression models, in which
the phenotype is dependent on the genotypes, this inverted dependency
structure can represent the association of independent as well as interacting
SNPs with the phenotype16. But this structure is also able to capture more
complex models of dependency19, because the marginal likelihood measuring
the association of each SNP with the phenotype is functionally independent of
the association of other SNPs with the phenotype. In contrast, in regression
structures, the presence of an association between a SNP and the phenotype
affects the marginal likelihood measuring the association between the pheno-
type and other SNPs, reducing the set of SNPs that can be detected as
associated with the phenotype. In our Bayesian network, the nodes associated
with the phenotype are the children nodes of stroke (26 nodes that are directly
associated with stroke) and the parents of the children nodes (6 nodes that are
associated to stroke, given the common children nodes).
The Bayesian network induced by this search procedure was quantified by
the conditional probability distribution of each node given the parents nodes.
The conditional probabilities were estimated as
pðxikjpijÞ ¼aijk + nijk
aij + nij;
where xik represents the state of the child node, pij represents a combination of
states of the parent nodes, nijk is the sample frequency of (xik,pij) and nij is the
sample frequency of pij. The parameters aijk and aij ¼P
k aijk encode the prior
distribution with the constraintP
j aij ¼ a for all j, as suggested16. We chose
a ¼ 8 by sensitivity analysis16.
Predictive validation. To assess the robustness of the network to sampling
variability, we first used fivefold cross-validation in which we partitioned the
original data set into five nonoverlapping subsets that we used for learning the
network dependency. We then used each network to predict the phenotypes of
the individuals not included in the learning process and measured the accuracy
NATURE GENETICS VOLUME 37 [ NUMBER 4 [ APRIL 2005 43 9
L E T T E R S©
2005
Nat
ure
Pub
lishi
ng G
roup
ht
tp://
ww
w.n
atur
e.co
m/n
atur
egen
etic
s

by the frequency of individuals for whom the correct phenotypes were
predicted with probability 40.5. We calculated the predictive probability of
stroke, given evidence in the network, using the clique algorithm16 implemen-
ted in Discoverer. We determined the predictive accuracy of the models using
an independent set of 114 individuals with SCA, including 7 individuals with
stroke who were not part of the multicenter study and 107 individuals
randomly selected from the original database for whom we had a complete
medical history and who were not used to build the Bayesian network model.
We used the model to predict the phenotypes of these individuals and to assess
the predictive accuracy by the frequency of individuals for whom the correct
phenotypes were predicted with probability 40.5.
Logistic regression. We built a logistic regression model to identify the SNPs
associated with the phenotype using the stepwise procedure implemented in
the R program, which uses the Akaike information criterion in the forward
step. We then selected the significant regressors (P o 0.05).
URLs. The network and a tutorial introduction to the use of Bayesian networks
in genomics are available from our website (http://genomethods.org/sca/).
dbSNP is available at http://www.ncbi.nlm.nih.gov/SNP/. The program Bayes-
ware Discoverer is available at http://www.bayesware.com/.
Note: Supplementary information is available on the Nature Genetics website.
ACKNOWLEDGMENTSWe thank R. Adams, A. Anderson and R. Iyer for providing the blood samples ofthe individuals with stroke in the independent validation set. This work wassupported by National Science Foundation and the National Heart, Lung andBlood Institute of the National Institutes of Health.
COMPETING INTERESTS STATEMENTThe authors declare competing financial interests (see the Nature Genetics websitefor details).
Received 15 July 2004; accepted 8 February 2005
Published online at http://www.nature.com/naturegenetics/
1. Adams, R.J. et al. Stroke and conversion to high risk in children screened withtranscranial Doppler ultrasound during the STOP study. Blood 103, 3689–3694(2004).
2. Steinberg, M.H., Forget, B.G., Higgs, D.R. & Nagel, R.L. Disorders of Hemoglobin:Genetics, Pathophysiology, and Clinical Management (Cambridge University Press,Cambridge, 2001).
3. Ware, R.E., Zimmerman, S.A. & Schultz, W.H. Hydroxyurea as an alternative to bloodtransfusions for the prevention of recurrent stroke in children with sickle cell disease.Blood 94, 3022–3026 (1999).
4. Adams, R.J. et al. Prevention of a first stroke by transfusions in children with sickle cellanemia and abnormal results on transcranial Doppler ultrasonography. N. Engl. J. Med.339, 5–11 (1998).
5. Taylor, J.G.t. et al. Variants in the VCAM1 gene and risk for symptomatic stroke in sicklecell disease. Blood 100, 4303–4309 (2002).
6. Hoppe, C. et al. Gene interactions and stroke risk in children with sickle cell anemia.Blood 103, 2391–2396 (2004).
7. Adams, R.J. et al. Alpha thalassemia and stroke risk in sickle cell anemia. Am. J.Hematol. 45, 279–282 (1994).
8. Platt, O.S. et al. Mortality in sickle cell disease. Life expectancy and risk factors forearly death. N. Engl. J. Med. 330, 1639–1644 (1994).
9. Gaston, M. et al. Recruitment in the Cooperative Study of Sickle Cell Disease (CSSCD).Control Clin. Trials 8, 131S–140S (1987).
10. Gabriel, S.B. et al. Segregation at three loci explains familial and population risk inHirschsprung disease. Nat. Genet. 31, 89–93 (2002).
11. Collins, F.S., Green, E.D., Guttmacher, A.E. & Guyer, M.S. A vision for the future ofgenomics research. Nature 422, 835–847 (2003).
12. Carlson, C.S., Eberle, M.A., Kruglyak, L. & Nickerson, D.A. Mapping complex diseaseloci in whole-genome association studies. Nature 429, 446–452 (2004).
13. Friedman, N. Inferring cellular networks using probabilistic graphical models. Science303, 799–805 (2004).
14. Jansen, R. et al. A Bayesian networks approach for predicting protein-protein inter-actions from genomic data. Science 302, 449–453 (2003).
15. Lauritzen, S.L. & Sheehan, N.A. Graphical models for genetic analysis. Statist. Sci.18, 489–514 (2004).
16. Cowell, R.G., Dawid, A.P., Lauritzen, S.L. & Spiegelhalter, D.J. Probabilistic Networksand Expert Systems (Springer, New York, 1999).
17. Chakravarti, A. Population genetics–making sense out of sequence. Nat. Genet. 21,56–60 (1999).
18. Hoh, J. & Ott, J. Mathematical multi-locus approaches to localizing complex humantrait genes. Nat. Rev. Genet. 4, 701–709 (2003).
19. Hand, D.J., Mannila, H. & Smyth, P. Principles of Data Mining (MIT Press, Cambridge,Massachusetts, 2001).
20. Ling, Q. et al. Annexin II regulates fibrin homeostasis and neoangiogenesis in vivo.J. Clin. Invest. 113, 38–48 (2004).
21. Angerio, A.D. & Lee, N.D. Sickle cell crisis and endothelin antagonists. Crit. Care Nurs.Q. 26, 225–229 (2003).
22. Brown, C.B., Boyer, A.S., Runyan, R.B. & Barnett, J.V. Requirement of type IIITGF-beta receptor for endocardial cell transformation in the heart. Science 283,2080–2082 (1999).
23. Zee, R.Y. et al. Polymorphism in the P-selectin and interleukin-4 genes as determi-nants of stroke: a population-based, prospective genetic analysis. Hum. Mol. Genet.13, 389–396 (2004).
24. Alexander, N., Higgs, D., Dover, G. & Serjeant, G.R. Are there clinical phenotypes ofhomozygous sickle cell disease? Br. J. Haematol. 126, 606–611 (2004).
25. Steinberg, M.H. et al. Association of polymorphisms in genes of the transforminggrowth factor-beta pathway with sickle cell osteonecrosis. Blood 102, 262A–263A(2003).
26. Botstein, D. & Risch, N. Discovering genotypes underlying human phenotypes: pastsuccesses for mendelian disease, future approaches for complex disease. Nat. Genet.33 Suppl: 228–237 (2003).
27. Beaumont, M.A. & Rannala, B. The Bayesian revolution in genetics. Nat. Rev. Genet.5, 251–261 (2004).
28. Ohene-Frempong, K. et al. Cerebrovascular accidents in sickle cell disease: rates andrisk factors. Blood 91, 288–294 (1998).
29. Chiu, N.H. et al. Mass spectrometry of single-stranded restriction fragments capturedby an undigested complementary sequence. Nucleic Acids Res. 28, E31 (2000).
30. Cooper, G.F. & Herskovitz, G.F. A Bayesian method for the induction of probabilisticnetworks from data. Mach. Learn. 9, 309–347 (1992).
4 40 VOLUME 37 [ NUMBER 4 [ APRIL 2005 NATURE GENETICS
L E T T E R S©
2005
Nat
ure
Pub
lishi
ng G
roup
ht
tp://
ww
w.n
atur
e.co
m/n
atur
egen
etic
s