Embed Size (px)
Citation preview
GENETIC ASPECTS OF MARBLING IN BEEF CARCASSES
Andy D. Herring
Department of Animal Science
Texas A&M University
INTRODUCTION: The goal of this paper is to review the genetic aspects of marbling in beef
carcasses and to serve as a reference source. It is not meant to be an exhaustive review of the
literature in regard to all relationships involving marbling with other production and carcass
traits. However, it is meant to review several of the major studies around the world that could
have direct genetic implications on production of beef carcasses in the United States.
Historically, fat thickness of fed cattle has been used to estimate carcass quality grade. As a
result, this paper focuses on the relationship between subcutaneous fat thickness and marbling.
Following an Executive Summary of points, the paper is organized into sections of (1) breed
comparison studies, (2) estimates of genetic variation, heritability and correlations of marbling
and other carcass traits, (3) evaluation at different carcass end-points, (5) single gene and genetic
marker considerations, (6) impacts of selection on marbling, (7) National Beef Quality Audit
aspects, and finally (8) cowherd considerations.
EXECUTIVE SUMMARY
There are substantial differences in marbling ability across breeds of cattle, and within
breeds of cattle. Heritability estimates of marbling ability have ranged from .13 to .88 in
particular groups, with a mean value of approximately .45. As a result, marbling will
respond to selection in all breeds, but the amount of genetic variation is not constant
within all breeds, and the relationship of marbling with other traits is probably not
constant across all breeds.
Selection can be utilized to increase marbling ability without increasing external fat, and
increased marbling can also be accomplished without causing detrimental effects on other
production traits in feedlot animals or in cowherds.
Where it has been evaluated within proper research trials, effect of carcass end-point-
constant basis (age, weight, fat) has a relatively minor impact on heritability estimate for
marbling or ranking of individuals for marbling EPD.
Genetically, the use of external fat thickness alone explains very little in regard to
marbling score, and therefore should not be used alone as a predictor of marbling ability
because the phenotypic correlation between these two traits will be close to zero in most
groups of cattle. The genetic correlation between external fat and marbling is higher, but
still not large.
Expected progeny differences (EPDs) based on carcass data and live animal ultrasound
data are important and useful tools for improvement of marbling ability, as are emerging
genetic tests. EPDs estimate the genetic potential of an animal as a parent across all gene
loci involved, whereas genetic tests are specific to a small number of genes or genetic
markers involved in the trait.
2
Ultrasound evaluation of body composition provides important information to predict
marbling of carcasses from feeder calves and feedlot cattle, as well as to identify genetic
potential for marbling among breeding animals.
More genetic DNA markers and commercial genetic tests will become available in the
near future, and will continue to decrease in cost per test. It has been shown that desirable
forms of genes will be found in populations of animals not considered to be desirable for
the trait; tests are likely to identify animals that are desirable for EPD but do not have
favorable genotypes for specific genetic tests, and the reverse is also possible. A high-
accuracy (ACC) EPD is more informative than any single genetic test, but genetic test
results are available immediately.
Most breeding and genetics research projects have utilized age-constant basis, and most
nutrition research projects have utilized fat-constant basis when evaluating beef
carcasses. There need to be more research trials where both are evaluated in the same
trial, especially as age-verification programs become more popular.
There is a need to better evaluate and incorporate calf/herd background information when
evaluating marbling ability as well as all carcass traits. Several reports in the literature
document the influence of animal age at harvest, age of dam, effects of creep feeding,
individual year effects, etc., that may be viewed as “nuisance” variables, and are
generally not known on most feedlot cattle. These should receive more attention as
source- and age-verified programs become more important, and variation in these types
of effects could mask genetic differences if not documented.
Genetic strategies and considerations related to marbling ability
A large inefficiency in the beef industry comes from managing cattle of different genetic
potentials in the same manner because their ultimate potential is not known, or
ineffectively projected based on appearances or stereotypes. Therefore, premiums and
discounts that are reliably related to end-product differences are needed earlier in the U.S.
beef production system. Simply relying on external fat thickness to predict marbling
ability is ineffective and inefficient.
Production supply chains and/or verification programs that have access to individual
animal identification, animal age, cowherd management and pedigree information will
have distinct advantages over similar programs that do not have these types of
information.
Multiple sources of information should be jointly utilized to genetically change marbling.
Crews et al. (2004) found that combination use of live animal ultrasound and carcass data
gave a larger range and more accurate EPD estimation than either source did individually.
There needs to be more focus on evaluation of beef females in regard to improving all
carcass traits, although many seedstock producers have been more concerned with
obtaining ultrasound information on yearling bulls than heifers. Reverter et al. (2000)
found higher genetic correlations between yearling heifer ultrasound IMF and carcass
IMF in Australian Angus and Hereford cattle, as compared to yearling bull ultrasound
IMF. Crews and Kemp (2001) found much higher genetic correlations between
ultrasound fat thickness in yearling heifers and carcass fat in steers than between yearling
bulls and steers.

3
Relationships between important cowherd traits and end product traits need to be
considered in beef production systems. In the attempt to increase genetic ability of
marbling, producers need to be careful not to ignore, and thus possibly sacrifice desirable
cow functionality and reproduction traits.
Breed comparison studies
Many breed comparison studies have been accomplished through production of crossbred
progeny, specifically F1 calves in many cases where the different breeds evaluated have been
different sire breeds bred to the same cows. This procedure yields one-half of the additive
genetic breed difference to be expressed in calves sired by different breeds. All F1 calves
produced will have 100% heterosis between the pair of breeds involved; however, some pairs of
breeds will show much more heterosis in the F1 generation than others, most notably Bos
indicus-Bos taurus combinations may have two to three times as much heterosis as compared to
Bos taurus-Bos taurus combinations.
One of the most widely known cattle breeding research projects is the USDA-ARS Germplasm
Evaluation Program (GPE) conducted at the U.S. Meat Animal Research Center at Clay Center,
Neb. This project has been organized into specific cycles where each cycle involved particular
sire breeds and particular year. In early cycles (I through IV), Angus and Hereford cows were
bred to different sire breeds; however, in more recent cycles (Cycle V and later) Angus, Hereford
and MARC III (¼ Angus, ¼ Hereford, ¼ Pinzgauer, ¼ Red Poll) cows have been used to
evaluate sire breeds. In each cycle, steers have been serially harvested after three different times
on feed so that different carcass end-point adjustments (age, carcass weight, fat thickness,
marbling) and comparisons could be made through regression analyses.
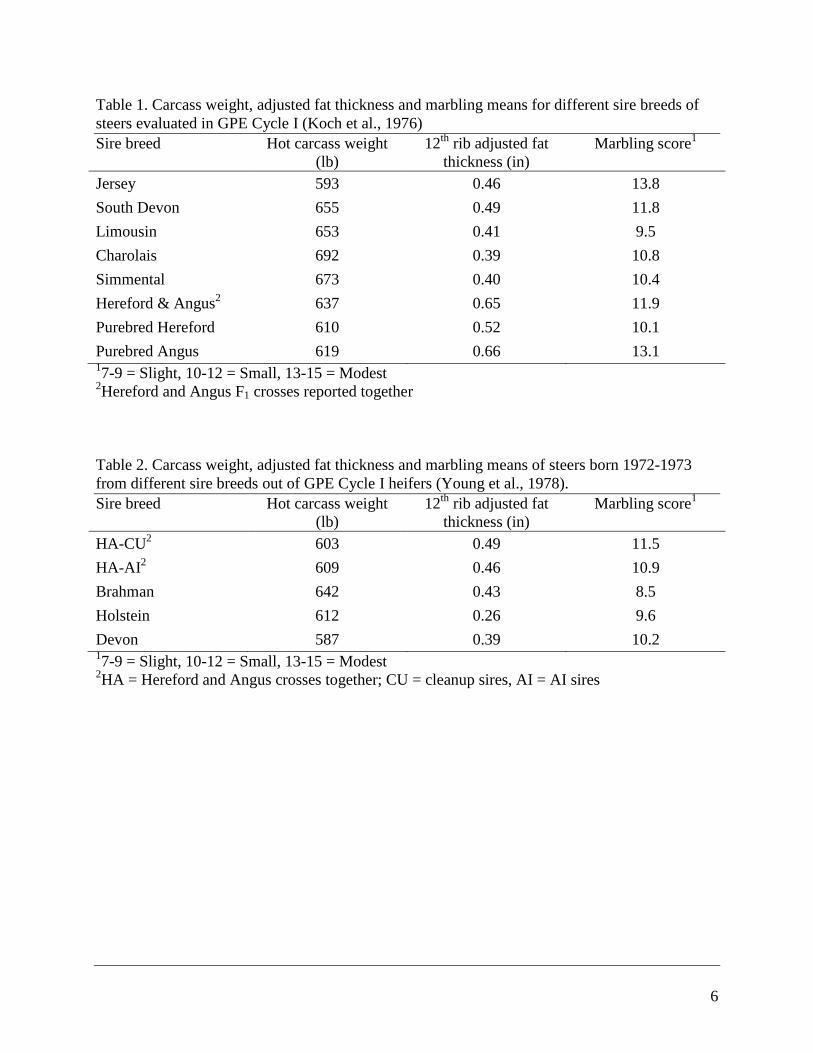
Koch et al. (1976) reported the results of sire breed comparisons for carcass traits in steers
produced in Cycle I (calves produced 1970-1972). Purebred Hereford and Angus cattle were also
produced in addition to the various F1 crosses. Calves were weaned at seven months of age and
fed as calves. These cattle were fed to age constant average basis of 457 d, and the means for
carcass weight, fat thickness and marbling score are presented in Table 1. Marbling was
significantly higher for purebred Angus than purebred Hereford steers, and the Angus steers
were also fatter. Among crossbred steers, Jersey-sired calves had the most marbling and
Limousin-sired steers had the least. Both the Jersey crosses and the purebred Angus steers were
average Modest for marbling score, but the purebred Angus steer had .66 in of fat whereas the
Jersey crosses had .46 in of fat. The Hereford-Angus (HA) crosses had the same fat thickness as
the Angus steers, and marbling that was a third of a score lower that purebred Angus. The Jersey,
HA, and South Devon had significantly higher quality grades than Limousin, Charolais and
Simmental crosses, but they also had more fat cover. There were no fat-constant end-point
comparisons made among sire breeds in this report.
Young et al. (1978) reported carcass traits of steers that were produced by Cycle I first-calf
heifers by Angus, Hereford, Brahman, Holstein and Devon sires. These calves were born in 1972
and 1973. The means for carcass weight fat thickness and marbling score on age-constant basis
of 452 d are presented in Table 2. Steers by Hereford and Angus sires had the most fat cover and
most marbling. Steers by Brahman sires had heaviest carcasses and least marbling at similar fat

4
thickness to those sired by Angus and Hereford. Holstein-sired carcasses had the least amount of
fat, but intermediate marbling score.
Koch et al. (1979) reported the carcass results from GPE Cycle II, which included sire breeds of
Angus, Hereford, Red Poll, Brown Swiss, Gelbvieh, Maine Anjou and Chianina. Contemporary
purebred Angus and Hereford calves were produced along with F1 crosses for this cycle in 1973
and 1974. These steers were weaned at six months of age, and fed as calves. An interesting result
reported was that there was a significant sire-breed by dam-breed interaction for fat thickness,
but not marbling. The means for the carcass traits for the sire breeds from Angus vs. Hereford
dams was not reported though. The means for carcass weight, fat thickness and marbling scores
relative to age- and fat-constant end-points are given in Table 3. Purebred Angus steers had the
highest average marbling score of all steers at all end-points. These authors stated that adjusted
means of these breed types suggested small differences in rate of intramuscular fat deposition
relative to total carcass fat. Straightbred Angus, Hereford and HA crosses had the highest degree
of fat thickness at the age-constant end-point. Straightbred Angus steers were average Choice
with .57 in of fat, straightbred Hereford were high Select (Good) at .56 in fat, and HA crosses
were low Choice with .63 in of fat.
Koch et al. (1982) reported results of carcass evaluations from GPE Cycle III. These calves were
born in 1975 and 1976. This cycle included sire breeds of Hereford, Angus, Tarentaise,
Pinzgauer, Brahman and Sahiwal (Bos indicus breed from Pakistan). Calves were weaned at
average age of seven months and were fed as calves. The means for carcass weights and
marbling scores at age- and fat-constant end-points are presented in Table 4. The HA crosses had
the highest marbling scores at age- and weight-constant end-points, but the Pinzgauer crosses
had the highest marbling score at a fat-constant end-point. At the age-constant end-point, the Bos
indicus crosses had intermediate fat thickness, but the lowest marbling scores; HA crosses were
the fattest at the average age of 445 d. Based on these data, Tarentaise and Pinzgauer crosses
would have been expected to have higher marbling scores than HA crosses at .5 in of fat. Both
Tarentaise and Pinzgauer are breeds with fairly high milk production potential.
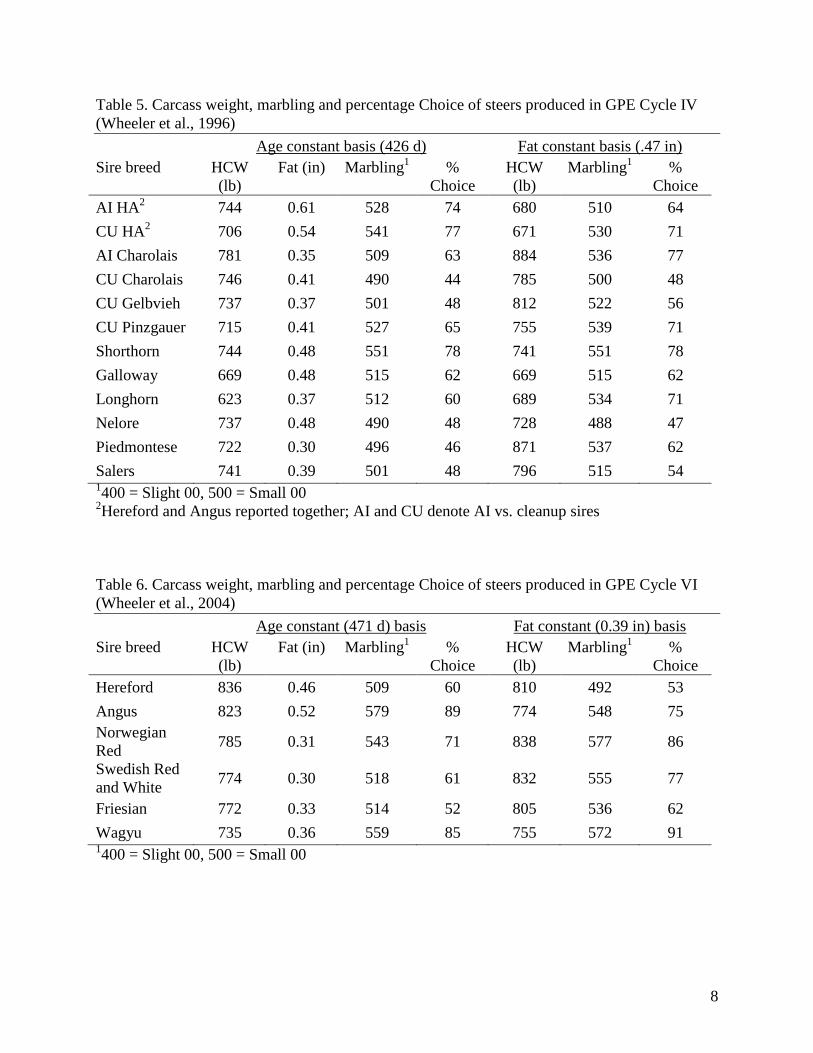
Wheeler et al. (1996) reported carcass results from GPE Cycle IV. Sire breeds included
Hereford, Angus, Charolais, Gelbvieh, Pinzgauer, Shorthorn, Galloway, Longhorn, Nelore,
Piedmontese, and Salers. All sire breeds were bred to Angus and Hereford cows. Calves were
born 1986-1990 and were weaned at an average of five months of age. Steers were fed as calves.
Means for carcass weights, fat, marbling, and percent Choice relative to age and fat end-points
are presented in Table 5. At constant age of 426 d, average marbling was higher in Shorthorn,
HA, and Pinzgauer crosses than others, and was lowest in Nelore (Bos indicus breed originally
from India), Charolais and Piedmontese (double muscled from Italy) crosses.
Wheeler et al. (2004) reported results from GPE Cycle VI. These calves were born 1997-1998,
and sire breeds included Hereford, Angus, Norwegian Red, Swedish Red and White, Beef
Friesian (all three of which are dual purpose Bos taurus breeds) and Wagyu (Bos taurus breed
from Japan). Calves were weaned at an average age of seven months, and all steers were fed as
calves. A sire-breed by dam-breed interaction was reported for marbling, but was not discussed
in any detail, and means for sire-breed by dam-breed combinations were not given. Table 6
contains means for carcass weight, fat, marbling and percent Choice relative to age- and fat-
constant end-points. On an age-constant basis, Angus-sired carcasses had the most fat, most

5
marbling, and highest percent Choice. However, at a fat end-point of .39 in, Wagyu and
Norwegian Red and White crosses had the highest marbling.
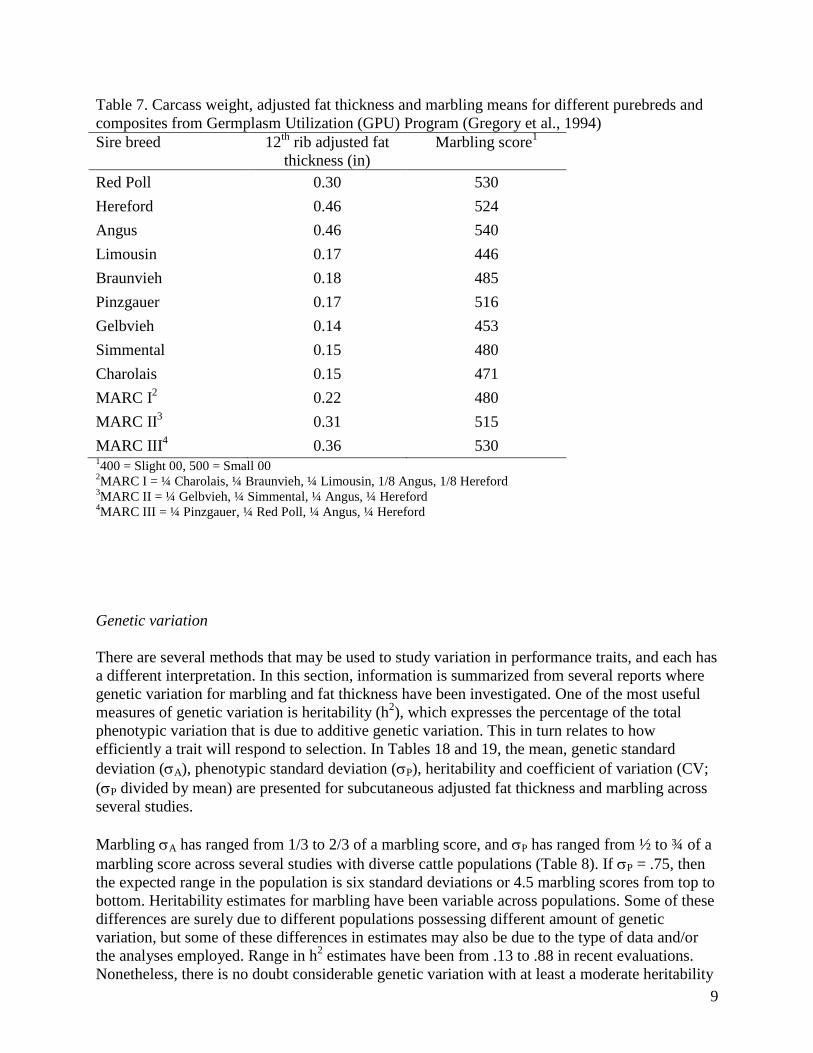
Gregory et al. (1994) reported fat thickness and marbling scores for steers produced in the
Germplasm utilization (GPU) Program at Clay Center, Neb.. This project was designed to study
heterosis retention in three composite populations. These steers were born in 1988 to 1991. In
three years, calves were weaned at five months of age, and in one year calves were weaned at
four months of age. Animals were started on feed immediately after weaning. Mean slaughter
age was 438 d. Means for fat thickness and marbling score are presented in Table 7. All of these
cattle breed types had means that were quite small for fat thickness, with surprisingly high
marbling scores relative to fat thickness in several instances. Perhaps the early weaning and
feeding initiation contributed to this.
Chambaz et al. (2003) conducted a study in Switzerland where purebred Angus, Simmental,
Charolais and Limousin steers were fed to equal marbling content as estimated by ultrasound
evaluation. Steers were harvested when % IMF was estimated to be 3-4%. To reach this target
IMF, Angus steers were fed 141 d and produced carcasses that weighed 605 lb; Simmental steers
were fed 267 d and had 746 lb carcasses; Charolais steers were fed 281 d and had 869 lb
carcasses; Limousin steers were fed 346 d and had 891 lb carcasses.
Adams et al. (1982) compared purebred Longhorn, Hereford, Angus, Brahman, and Holstein
steers that were fed to Choice finish, or 186 d. Carcass weight, fat thickness and marbling scores,
respectively, were 554 lb, .16 in, Small- for Longhorn, 622 lb, .66 in, Small
- for Hereford, 594
lb, .70 in, Modest- for Angus, 492 lb, .31 in, Practically Devoid
- for Brahman, and 635 lb, .17 in,
Slighto for Holstein. These steers were chosen as representative of their breeds (11 each) and fed
together, but they were not reared in the same environment.
6
Table 1. Carcass weight, adjusted fat thickness and marbling means for different sire breeds of
steers evaluated in GPE Cycle I (Koch et al., 1976)
Sire breed Hot carcass weight
(lb)
12th
rib adjusted fat
thickness (in)
Marbling score1
Jersey 593 0.46 13.8
South Devon 655 0.49 11.8
Limousin 653 0.41 9.5
Charolais 692 0.39 10.8
Simmental 673 0.40 10.4
Hereford & Angus2 637 0.65 11.9
Purebred Hereford 610 0.52 10.1
Purebred Angus 619 0.66 13.1 17-9 = Slight, 10-12 = Small, 13-15 = Modest
2Hereford and Angus F1 crosses reported together
Table 2. Carcass weight, adjusted fat thickness and marbling means of steers born 1972-1973
from different sire breeds out of GPE Cycle I heifers (Young et al., 1978).
Sire breed Hot carcass weight
(lb)
12th
rib adjusted fat
thickness (in)
Marbling score1
HA-CU2 603 0.49 11.5
HA-AI2 609 0.46 10.9
Brahman 642 0.43 8.5
Holstein 612 0.26 9.6
Devon 587 0.39 10.2 17-9 = Slight, 10-12 = Small, 13-15 = Modest
2HA = Hereford and Angus crosses together; CU = cleanup sires, AI = AI sires

7
Table 3. Carcass weight, fat thickness and marbling means at age-constant (473 d) and fat-
constant (0.49 in) end-points of steers in GPE Cycle II (Koch et al., 1979)
Age constant basis Fat constant basis
Sire breed HCW (lb) Fat (in) Marbling1 HCW (lb) Marbling
1
Hereford & Angus2 616 0.63 10.8 552 9.6
Red Poll 598 0.48 10.7 603 10.8
Brown Swiss 658 0.39 9.9 739 11.3
Gelbvieh 667 0.37 9.2 774 10.8
Maine Anjou 684 0.36 9.6 799 11.4
Chianina 669 0.31 8.0 845 10.3
Purebred Hereford 599 0.56 9.1 566 8.5
Purebred Angus 609 0.57 13.3 569 12.3 17-9 = Slight, 10-12 = Small, 13-15 = Modest
2Hereford and Angus reported together
Table 4. Carcass weight, fat thickness and marbling means at age-constant (445 d) and fat
constant (0.49 in) end-points of steers in GPE Cycle III (Koch et al., 1982)
Age constant basis Fat constant basis
Sire breed HCW (lb) Fat (in) Marbling1 HCW (lb) Marbling
1
Hereford & Angus2 651 0.63 11.4 581 9.8
Tarentaise 653 0.43 10.2 697 11.1
Pinzgauer 645 0.45 10.9 671 11.5
Brahman 678 0.55 9.4 645 8.8
Sahiwal 627 0.53 9.8 603 9.3 17-9 = Slight, 10-12 = Small, 13-15 = Modest
2Hereford and Angus reported together
8
Table 5. Carcass weight, marbling and percentage Choice of steers produced in GPE Cycle IV
(Wheeler et al., 1996)
Age constant basis (426 d) Fat constant basis (.47 in)
Sire breed HCW
(lb)
Fat (in) Marbling1 %
Choice
HCW
(lb)
Marbling1 %
Choice
AI HA2 744 0.61 528 74 680 510 64
CU HA2 706 0.54 541 77 671 530 71
AI Charolais 781 0.35 509 63 884 536 77
CU Charolais 746 0.41 490 44 785 500 48
CU Gelbvieh 737 0.37 501 48 812 522 56
CU Pinzgauer 715 0.41 527 65 755 539 71
Shorthorn 744 0.48 551 78 741 551 78
Galloway 669 0.48 515 62 669 515 62
Longhorn 623 0.37 512 60 689 534 71
Nelore 737 0.48 490 48 728 488 47
Piedmontese 722 0.30 496 46 871 537 62
Salers 741 0.39 501 48 796 515 54 1400 = Slight 00, 500 = Small 00
2Hereford and Angus reported together; AI and CU denote AI vs. cleanup sires
Table 6. Carcass weight, marbling and percentage Choice of steers produced in GPE Cycle VI
(Wheeler et al., 2004)
Age constant (471 d) basis Fat constant (0.39 in) basis
Sire breed HCW
(lb)
Fat (in) Marbling1 %
Choice
HCW
(lb)
Marbling1 %
Choice
Hereford 836 0.46 509 60 810 492 53
Angus 823 0.52 579 89 774 548 75
Norwegian
Red 785 0.31 543 71 838 577 86
Swedish Red
and White 774 0.30 518 61 832 555 77
Friesian 772 0.33 514 52 805 536 62
Wagyu 735 0.36 559 85 755 572 91 1400 = Slight 00, 500 = Small 00
9
Table 7. Carcass weight, adjusted fat thickness and marbling means for different purebreds and
composites from Germplasm Utilization (GPU) Program (Gregory et al., 1994)
Sire breed 12th
rib adjusted fat
thickness (in)
Marbling score1
Red Poll 0.30 530
Hereford 0.46 524
Angus 0.46 540
Limousin 0.17 446
Braunvieh 0.18 485
Pinzgauer 0.17 516
Gelbvieh 0.14 453
Simmental 0.15 480
Charolais 0.15 471
MARC I2 0.22 480
MARC II3 0.31 515
MARC III4 0.36 530
1400 = Slight 00, 500 = Small 00
2MARC I = ¼ Charolais, ¼ Braunvieh, ¼ Limousin, 1/8 Angus, 1/8 Hereford
3MARC II = ¼ Gelbvieh, ¼ Simmental, ¼ Angus, ¼ Hereford
4MARC III = ¼ Pinzgauer, ¼ Red Poll, ¼ Angus, ¼ Hereford
Genetic variation
There are several methods that may be used to study variation in performance traits, and each has
a different interpretation. In this section, information is summarized from several reports where
genetic variation for marbling and fat thickness have been investigated. One of the most useful
measures of genetic variation is heritability (h2), which expresses the percentage of the total
phenotypic variation that is due to additive genetic variation. This in turn relates to how
efficiently a trait will respond to selection. In Tables 18 and 19, the mean, genetic standard
deviation (A), phenotypic standard deviation (P), heritability and coefficient of variation (CV;
(P divided by mean) are presented for subcutaneous adjusted fat thickness and marbling across
several studies.
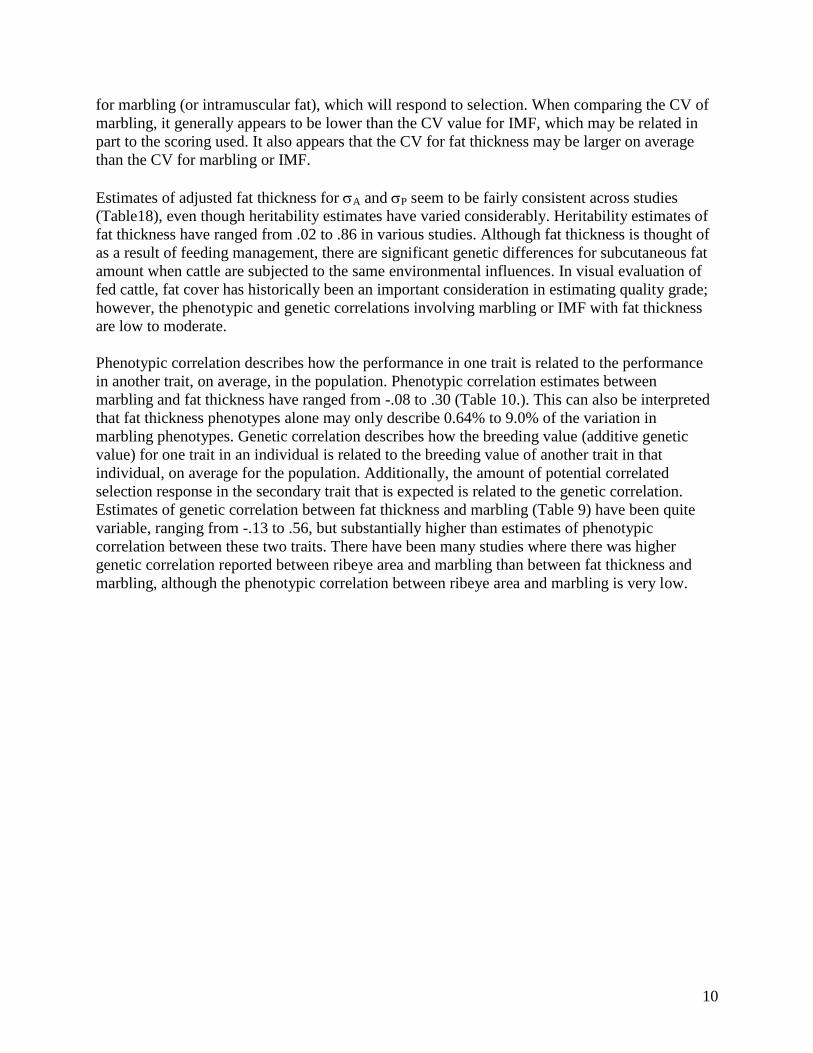
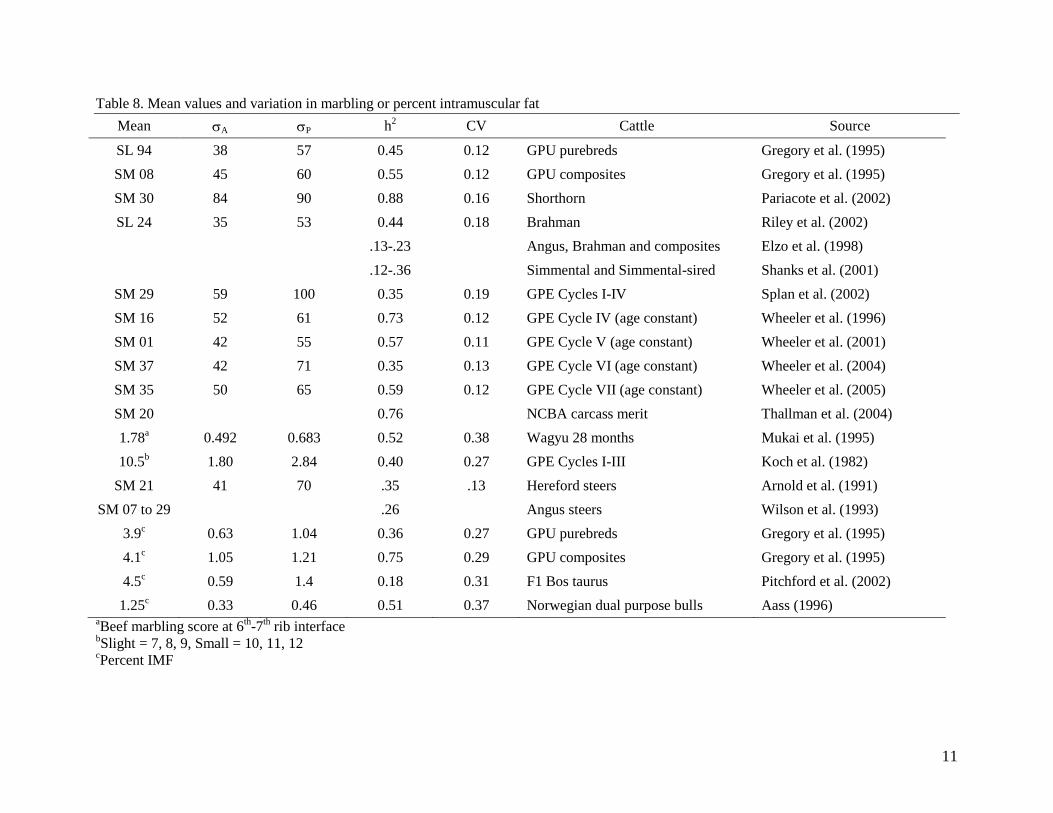
Marbling A has ranged from 1/3 to 2/3 of a marbling score, and P has ranged from ½ to ¾ of a
marbling score across several studies with diverse cattle populations (Table 8). If P = .75, then
the expected range in the population is six standard deviations or 4.5 marbling scores from top to
bottom. Heritability estimates for marbling have been variable across populations. Some of these
differences are surely due to different populations possessing different amount of genetic
variation, but some of these differences in estimates may also be due to the type of data and/or
the analyses employed. Range in h2 estimates have been from .13 to .88 in recent evaluations.
Nonetheless, there is no doubt considerable genetic variation with at least a moderate heritability
10
for marbling (or intramuscular fat), which will respond to selection. When comparing the CV of
marbling, it generally appears to be lower than the CV value for IMF, which may be related in
part to the scoring used. It also appears that the CV for fat thickness may be larger on average
than the CV for marbling or IMF.
Estimates of adjusted fat thickness for A and P seem to be fairly consistent across studies
(Table18), even though heritability estimates have varied considerably. Heritability estimates of
fat thickness have ranged from .02 to .86 in various studies. Although fat thickness is thought of
as a result of feeding management, there are significant genetic differences for subcutaneous fat
amount when cattle are subjected to the same environmental influences. In visual evaluation of
fed cattle, fat cover has historically been an important consideration in estimating quality grade;
however, the phenotypic and genetic correlations involving marbling or IMF with fat thickness
are low to moderate.
Phenotypic correlation describes how the performance in one trait is related to the performance
in another trait, on average, in the population. Phenotypic correlation estimates between
marbling and fat thickness have ranged from -.08 to .30 (Table 10.). This can also be interpreted
that fat thickness phenotypes alone may only describe 0.64% to 9.0% of the variation in
marbling phenotypes. Genetic correlation describes how the breeding value (additive genetic
value) for one trait in an individual is related to the breeding value of another trait in that
individual, on average for the population. Additionally, the amount of potential correlated
selection response in the secondary trait that is expected is related to the genetic correlation.
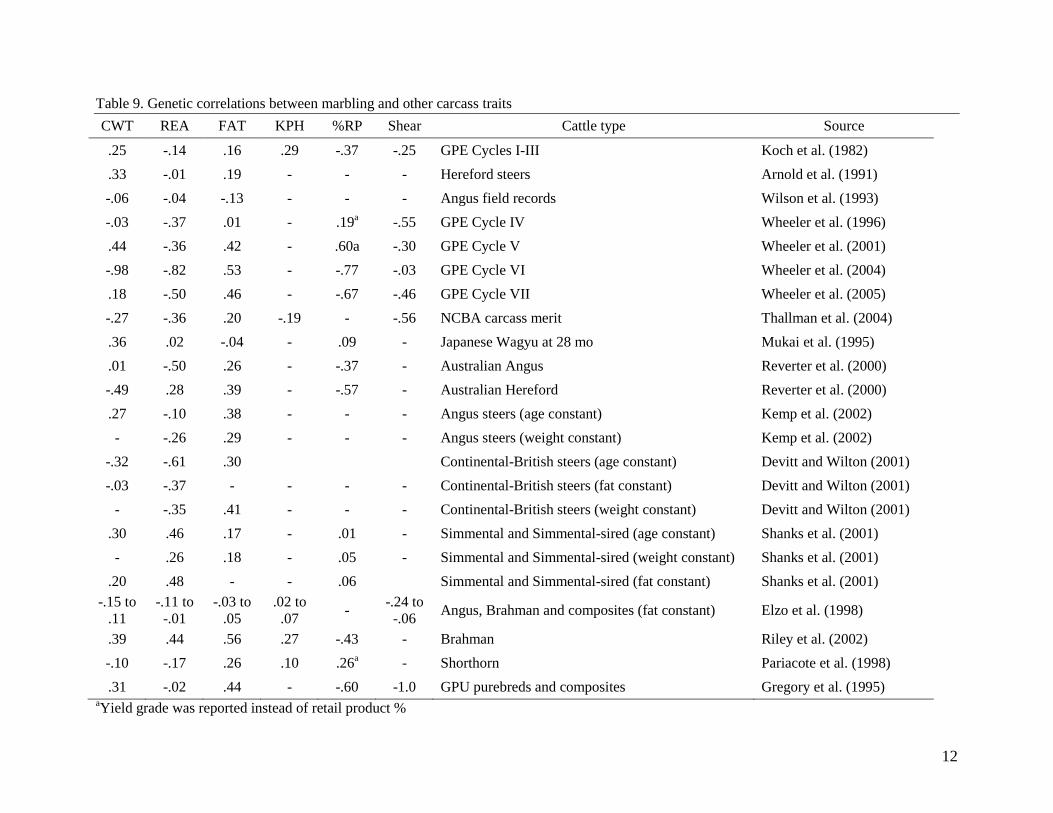
Estimates of genetic correlation between fat thickness and marbling (Table 9) have been quite
variable, ranging from -.13 to .56, but substantially higher than estimates of phenotypic
correlation between these two traits. There have been many studies where there was higher
genetic correlation reported between ribeye area and marbling than between fat thickness and
marbling, although the phenotypic correlation between ribeye area and marbling is very low.
11
Table 8. Mean values and variation in marbling or percent intramuscular fat
Mean A P h2 CV Cattle Source
SL 94 38 57 0.45 0.12 GPU purebreds Gregory et al. (1995)
SM 08 45 60 0.55 0.12 GPU composites Gregory et al. (1995)
SM 30 84 90 0.88 0.16 Shorthorn Pariacote et al. (2002)
SL 24 35 53 0.44 0.18 Brahman Riley et al. (2002)
.13-.23 Angus, Brahman and composites Elzo et al. (1998)
.12-.36 Simmental and Simmental-sired Shanks et al. (2001)
SM 29 59 100 0.35 0.19 GPE Cycles I-IV Splan et al. (2002)
SM 16 52 61 0.73 0.12 GPE Cycle IV (age constant) Wheeler et al. (1996)
SM 01 42 55 0.57 0.11 GPE Cycle V (age constant) Wheeler et al. (2001)
SM 37 42 71 0.35 0.13 GPE Cycle VI (age constant) Wheeler et al. (2004)
SM 35 50 65 0.59 0.12 GPE Cycle VII (age constant) Wheeler et al. (2005)
SM 20 0.76 NCBA carcass merit Thallman et al. (2004)
1.78a 0.492 0.683 0.52 0.38 Wagyu 28 months Mukai et al. (1995)
10.5b 1.80 2.84 0.40 0.27 GPE Cycles I-III Koch et al. (1982)
SM 21 41 70 .35 .13 Hereford steers Arnold et al. (1991)
SM 07 to 29 .26 Angus steers Wilson et al. (1993)
3.9c 0.63 1.04 0.36 0.27 GPU purebreds Gregory et al. (1995)
4.1c 1.05 1.21 0.75 0.29 GPU composites Gregory et al. (1995)
4.5c 0.59 1.4 0.18 0.31 F1 Bos taurus Pitchford et al. (2002)
1.25c 0.33 0.46 0.51 0.37 Norwegian dual purpose bulls Aass (1996)
aBeef marbling score at 6
th-7
th rib interface
bSlight = 7, 8, 9, Small = 10, 11, 12
cPercent IMF
12
Table 9. Genetic correlations between marbling and other carcass traits
CWT REA FAT KPH %RP Shear Cattle type Source
.25 -.14 .16 .29 -.37 -.25 GPE Cycles I-III Koch et al. (1982)
.33 -.01 .19 - - - Hereford steers Arnold et al. (1991)
-.06 -.04 -.13 - - - Angus field records Wilson et al. (1993)
-.03 -.37 .01 - .19a -.55 GPE Cycle IV Wheeler et al. (1996)
.44 -.36 .42 - .60a -.30 GPE Cycle V Wheeler et al. (2001)
-.98 -.82 .53 - -.77 -.03 GPE Cycle VI Wheeler et al. (2004)
.18 -.50 .46 - -.67 -.46 GPE Cycle VII Wheeler et al. (2005)
-.27 -.36 .20 -.19 - -.56 NCBA carcass merit Thallman et al. (2004)
.36 .02 -.04 - .09 - Japanese Wagyu at 28 mo Mukai et al. (1995)
.01 -.50 .26 - -.37 - Australian Angus Reverter et al. (2000)
-.49 .28 .39 - -.57 - Australian Hereford Reverter et al. (2000)
.27 -.10 .38 - - - Angus steers (age constant) Kemp et al. (2002)
- -.26 .29 - - - Angus steers (weight constant) Kemp et al. (2002)
-.32 -.61 .30 Continental-British steers (age constant) Devitt and Wilton (2001)
-.03 -.37 - - - - Continental-British steers (fat constant) Devitt and Wilton (2001)
- -.35 .41 - - - Continental-British steers (weight constant) Devitt and Wilton (2001)
.30 .46 .17 - .01 - Simmental and Simmental-sired (age constant) Shanks et al. (2001)
- .26 .18 - .05 - Simmental and Simmental-sired (weight constant) Shanks et al. (2001)
.20 .48 - - .06 Simmental and Simmental-sired (fat constant) Shanks et al. (2001)
-.15 to
.11
-.11 to
-.01
-.03 to
.05
.02 to
.07 -
-.24 to
-.06 Angus, Brahman and composites (fat constant) Elzo et al. (1998)
.39 .44 .56 .27 -.43 - Brahman Riley et al. (2002)
-.10 -.17 .26 .10 .26a - Shorthorn Pariacote et al. (1998)
.31 -.02 .44 - -.60 -1.0 GPU purebreds and composites Gregory et al. (1995) aYield grade was reported instead of retail product %

13
Table 10. Phenotypic correlations between marbling and other carcass traits
CWT REA FAT KPH %RP Shear Cattle type Source
.13 .03 .24 .18 -.37 -.12 GPE Cycles I-III Koch et al. (1982)
.08 -.01 .12 - - - Angus field records Wilson et al. (1993)
.09 -.06 .14 - .18a -.11 GPE Cycle IV Wheeler et al. (1996)
.20 -.10 .29 - .34a -.15 GPE Cycle V Wheeler et al. (2001)
.05 -.09 .28 - -.49 -.15 GPE Cycle VI Wheeler et al. (2004)
.14 -.10 .17 - -.41 -.28 GPE Cycle VII Wheeler et al. (2005)
.10 -.04 .22 .03 - -.23 NCBA carcass merit Thallman et al. (2004)
-.14 .34 -.08 - .36 - Japanese Wagyu at 28 mo Mukai et al. (1995)
- - Australian Angus Reverter et al. (2000)
- - Australian Hereford Reverter et al. (2000)
- - - Angus steers (age constant) Kemp et al. (2002)
- - - - Angus steers (weight constant) Kemp et al. (2002)
.04 -.05 .19 - - - Continental-British steers (age constant) Devitt and Wilton (2001)
.15 .04 - - - - Continental-British steers (fat constant) Devitt and Wilton (2001)
- -.09 .19 - - - Continental-British steers (weight constant) Devitt and Wilton (2001)
.09 .02 .11 - -.16 - Simmental and Simmental-sired (age constant) Shanks et al. (2001)
- -.03 .11 - -.09 - Simmental and Simmental-sired (weight constant) Shanks et al. (2001)
.05 .02 - - -.07 - Simmental and Simmental-sired (fat constant) Shanks et al. (2001)
.10 to
.40
-.26 to
.22
.25 to
.28
-.22 to
.03 -
-.01 to
.16 Angus, Brahman and composites (fat constant) Elzo et al. (1998)
.17 .12 .30 .18 -.19 - Brahman Riley et al. (2002)
.09 .20 -.08 .10 .22a - Shorthorn Pariacote et al. (1998)
.13 -.05 .25 - -.43 -.24 GPU purebreds and composites Gregory et al. (1995)

14
Evaluation at different carcass end-points
There being a large range in heritability estimates in marbling ability as well as all other carcass
traits across studies, it is tempting to compare these estimates across studies where cattle have
been fed to different end-point outcomes (age-constant, weight-constant, fat-constant). This
should be done carefully, however, because in many cases not only are the end-point bases
different, but also breed, feeding regime, geographic region, etc., also differ. To fairly compare
the end-points bases, studies that evaluate different bases in the same cattle should receive the
most attention. But, there have not been a lot of these types of projects conducted. In studies that
have evaluated various end-points comparisons, the relationships involving marbling with
carcass weight and ribeye area appear much more variable across end-points as does the
relationship of marbling and fat. Shanks et al. (2001) reported rg between marbling and fat of .17
at age-constant and .18 at weight-constant bases, whereas rg between marbling and ribeye area
was .46, .26, and .48 at age-, weight-, and fat-constant bases, respectively, in Simmental and
Simmental-sired cattle. Shanks et al. (2001) also stated that the number of records (and therefore
ACC on genetic predictions) was more important for determining rankings of animals than was
the end-point of evaluation. Devitt and Wilson (2001) reported rg between marbling and fat of
.30 at age-constant and .41 at weight-constant bases, whereas rg between marbling and ribeye
area was -.61, -.35, and -.37 at age-, weight-, and fat-constant bases, respectively, in Continental-
British cross steers. Kemp et al. (2002) reported rg between marbling and fat to be .38 and .29 at
age- and weight-constant end-points, respectively, and found rg between marbling and ribeye
area to be -.10 and -.26 at the same two respective end-points.
Additionally, the heritability estimates of carcass weight seem to vary more that heritability
estimates of marbling across end-points. Rios-Utrera et al. (2005) reported heritability of
marbling to be .40, .41, and .35 at age-, weight-, and fat-constant end-points, respectively.
Heritability of adjusted fat thickness was .20 and .21 at age- and weight-constant end-points,
respectively. Carcass weight heritability was .27 at age-constant basis, but .41 at fat-constant
basis. Rios-Utera et al. (2006) stated that carcass traits adjusted to different biological end-points
should be viewed as different but related traits. Most breeding and genetics research projects
have utilized age-constant basis, and most nutrition research projects have utilized fat-constant
basis. There needs to be more research trials where both are evaluated, especially as age-
verification programs become more popular.
Single gene and genetic marker considerations
Casas et al. (2001) reported results from a study that evaluated the inactive myostatin gene
(double muscling) in two populations of cattle. One was produced from an F1 Belgian Blue-
MARC III sire and the other was from an F1 Piedmontese-Angus sire; both were bred to MARC
III females to produce progeny for the analyses. There were three QTL for marbling found on
chromosomes (BTA) 3, 8 and 10 in calves from the Belgian Blue sire. The effect of the Belgian
Blue allele increased marbling by .29 and .30 scores at the QTL on BTA 3 and 8, respectively,
but decreased marbling by .32 score at the QTL on BTA 10 as compared to the allele from
MARC III origin. The QTL for fat on BTA 8 was in close proximity to the QTL for marbling,
but not the same, and the allele of Belgian Blue origin resulted in slightly increased fat thickness
(.06 in) as compared to MARC III-origin allele. No marbling QTL were identified in the
15
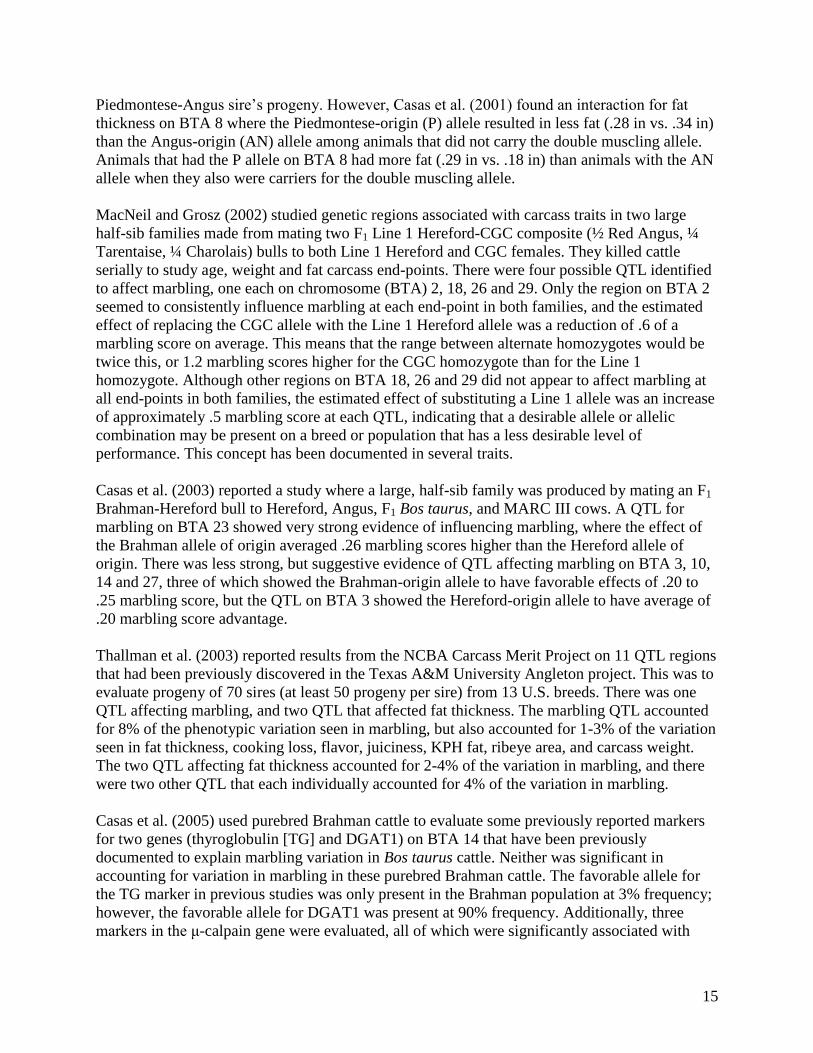
Piedmontese-Angus sire’s progeny. However, Casas et al. (2001) found an interaction for fat
thickness on BTA 8 where the Piedmontese-origin (P) allele resulted in less fat (.28 in vs. .34 in)
than the Angus-origin (AN) allele among animals that did not carry the double muscling allele.
Animals that had the P allele on BTA 8 had more fat (.29 in vs. .18 in) than animals with the AN
allele when they also were carriers for the double muscling allele.
MacNeil and Grosz (2002) studied genetic regions associated with carcass traits in two large
half-sib families made from mating two F1 Line 1 Hereford-CGC composite (½ Red Angus, ¼
Tarentaise, ¼ Charolais) bulls to both Line 1 Hereford and CGC females. They killed cattle
serially to study age, weight and fat carcass end-points. There were four possible QTL identified
to affect marbling, one each on chromosome (BTA) 2, 18, 26 and 29. Only the region on BTA 2
seemed to consistently influence marbling at each end-point in both families, and the estimated
effect of replacing the CGC allele with the Line 1 Hereford allele was a reduction of .6 of a
marbling score on average. This means that the range between alternate homozygotes would be
twice this, or 1.2 marbling scores higher for the CGC homozygote than for the Line 1
homozygote. Although other regions on BTA 18, 26 and 29 did not appear to affect marbling at
all end-points in both families, the estimated effect of substituting a Line 1 allele was an increase
of approximately .5 marbling score at each QTL, indicating that a desirable allele or allelic
combination may be present on a breed or population that has a less desirable level of
performance. This concept has been documented in several traits.
Casas et al. (2003) reported a study where a large, half-sib family was produced by mating an F1
Brahman-Hereford bull to Hereford, Angus, F1 Bos taurus, and MARC III cows. A QTL for
marbling on BTA 23 showed very strong evidence of influencing marbling, where the effect of
the Brahman allele of origin averaged .26 marbling scores higher than the Hereford allele of
origin. There was less strong, but suggestive evidence of QTL affecting marbling on BTA 3, 10,
14 and 27, three of which showed the Brahman-origin allele to have favorable effects of .20 to
.25 marbling score, but the QTL on BTA 3 showed the Hereford-origin allele to have average of
.20 marbling score advantage.
Thallman et al. (2003) reported results from the NCBA Carcass Merit Project on 11 QTL regions
that had been previously discovered in the Texas A&M University Angleton project. This was to
evaluate progeny of 70 sires (at least 50 progeny per sire) from 13 U.S. breeds. There was one
QTL affecting marbling, and two QTL that affected fat thickness. The marbling QTL accounted
for 8% of the phenotypic variation seen in marbling, but also accounted for 1-3% of the variation
seen in fat thickness, cooking loss, flavor, juiciness, KPH fat, ribeye area, and carcass weight.
The two QTL affecting fat thickness accounted for 2-4% of the variation in marbling, and there
were two other QTL that each individually accounted for 4% of the variation in marbling.
Casas et al. (2005) used purebred Brahman cattle to evaluate some previously reported markers
for two genes (thyroglobulin [TG] and DGAT1) on BTA 14 that have been previously
documented to explain marbling variation in Bos taurus cattle. Neither was significant in
accounting for variation in marbling in these purebred Brahman cattle. The favorable allele for
the TG marker in previous studies was only present in the Brahman population at 3% frequency;
however, the favorable allele for DGAT1 was present at 90% frequency. Additionally, three
markers in the μ-calpain gene were evaluated, all of which were significantly associated with
16
carcass hump height, but only one was associated with sensory panel tenderness. This illustrates
the need to investigate the usefulness of genetic markers in a variety of breeds in addition to the
population in which they were discovered to prove that they are not simply detecting breed
differences at other loci.
Mizoshita et al. (2004) documented potential QTL on BTA 4, 5, 13,and 14 for beef marbling
score in Japanese Wagyu steers. They also mapped a QTL for fat thickness on BTA 14 in similar
region to that reported in several U.S. studies. The QTL for marbling and fat thickness were in
the same region that has been reported to contain thyroglobulin and DGAT1. The QTL for
marbling on BTA 4 accounted for 8% of the phenotypic variation in marbling.
Nkrumah et al. (2005) reported on the effects of an SNP in the leptin gene on several traits in Bos
taurus hybrid cattle in Canada. The additive effect of the gene was calculated to be .68% for
ultrasound IMF. Additionally, both feed intake and IMF had a substantial dominance (non-
additive) aspect.
Impacts of selection
The reasons behind estimating heritability and genetic correlations are to predict the change in a
trait due to selection for that trait and to predict associated changes in other traits, respectively.
There is considerable direct and indirect evidence that selection for marbling in cattle is
effective.
Vieselmeyer et al. (1996) evaluated high and low marbling EPD Angus bulls from the 1989
American Angus Association Sire Summary. The average marbling EPD for high bulls was +.59,
whereas the average marling EPD for low bulls was -.23. These bulls were bred to MARC II
cows (1/4 each Angus, Hereford, Gelbvieh, Simmental), and calves were born in 1990 and 1991.
In the 1995 sire summary, the high bulls average marbling EPD was +.33 and the low bulls
averaged -.35. These sires were very similar for fat thickness EPD. Both steers and heifers were
fed, and animals were killed in two groups each year, about 60 days apart. For group 1, progeny
of high sires averaged 52% Choice, .33 in fat thickness, 601 lb carcass weight, and 2.4 yield
grade. These same traits in progeny of low sires in group 1 were 17%, .35 in, 616 lb and 2.4,
respectively. For group 2, these same traits in progeny of high sires were 96%, .52 in, 735 lb, 3.0,
respectively, and for progeny of low sires were 78%, .52 in, 750 lb, and 2.9, respectively. For
these same cattle, Gwartney et al. (1996) suggested that progeny from high marbling EPD may
have faster rate of marbling deposition. No differences were detected for taste panel
characteristics in steers from high vs. low sire; however, heifers from high sires had both
increased juiciness and tenderness than heifers from low sires.
Sapp et al. (2002) reported a study where Angus bulls were selected on yearling ultrasound IMF
(UIMF) and identified as high or low UIMF. The high UIMF bulls averaged 3.75% themselves
and 0.18 for UIMF EPD, while the low UIMF bulls averaged 1.70% for UIMF and -0.22 for
UIMF EPD. Sires were bred o commercial Angus females and entered the feedlot at 12 to 15 mo
of age. Steers from high UIMF sires had more marbling (Small 52) that those from low UIMF
sires (Small 08), but did not differ for fat thickness, carcass weight, or yield grade. Sapp et al.

17
(2002) also predicted that for each 1% difference in sire IMF EPD should result in a difference
of .9 marbling score between progeny groups.
May et al. (1995) studied F1 calves produced from Angus bulls from the 1960s (18 sires) vs. the
1980s (12 sires). These sires were used to produce calves in 1989 and 1990 and were reared as
contemporaries and fed as calves. Calves from 1960s sires had carcass traits of 592 lb, .49 in,
12.2 sq in, Small 10, and 2.6 for carcass weight, fat thickness, ribeye area, marbling score, and
yield grade, respectively, whereas calves from 1980s sires had average values of 692 lb, .52 in,
12.6 sq in, Slight 86 and 3.0, respectively. The 1980s-sired calves were 10 lb heavier for birth
weight (81 lb vs. 71 lb) and 50 lb heavier for weaning weight (488 lb vs. 438 lb). A subset of
steers from each type of sire were used to study adipocyte traits, and the calves from 1980s sires
had smaller subcutaneous and intramuscular fat cells (more cells per gram of tissue), but no
differences in fatness as measured by fat thickness or marbling.
Newman et al. (2002) studied genetic correlations between purebred and crossbred performance
for several growth and carcass traits in Australian cattle. Angus, Hereford, Shorthorn, Belmont
Red and Santa Gertrudis sires were used to produce purebred calves, and F1 calves from
Brahman cows. The genetic correlation between purebred and crossbred traits was .48, .83, .95,
1.0, and .78 for carcass weight, retail beef yield, IMF (measured by automated camera), rump fat,
and ultrasound ribeye area, respectively. The heritability of IMF was .41 in purebreds and .33 in
crossbreds.
Crews et al. (2004) evaluated Simmental carcass EPD based on live animal ultrasound data only,
carcass data only, and the combination of live and carcass data where the live animal and the
carcass data were treated as separate, genetically correlated traits. They found that carcass EPD
based on the combined data had a larger range and more accurate values for a larger sample of
animals as compared to the analyses that had only ultrasound or only carcass data. Furthermore,
sire EPD based solely on ultrasound data differed substantially from EPD based solely on carcass
data.
Burrow and Prayaga (2004) stated that selection for reduced rectal temperature in a composite of
¼ each Africander, Brahman, Hereford, and Shorthorn resulted in increased marbling without
any change in external fat thickness in high heat stress environment (central Queensland). They
also stated that selection such as this might lead to changes in body fat deposition patterns;
however, not many details were given about the collection of carcass data.
Aass and Vangen (1997) reported that carcasses from progeny of high milk yield sires tended to
have lower IMF (-0.32%) than progeny from low milk yield sires in Norwegian Dual Purpose
cattle. These authors also stated that selection for high growth rate in these cattle may lead to
changes in muscle structure with negative eating quality, but this seemed very speculative.
National Beef Quality Audits
It would be a fair assumption that cattle should have a combination of some minimal fat
thickness as well as time on feed to express their genetic potential for marbling; however, exactly
what these levels are remain unknown. Cattle that have the potential to grade Choice and Yield

18
Grade (YG) 2 should be managed and marketed differently from those that will grade Standard
and/or YG 4 given the same circumstances. The problem is that if the genetic and management
background and/or genetic potential are not known, it is safest to feed and market the cattle for
average values. The main point about cattle that grade Prime is that they have the genetic ability
to marble, and it is not because they are fat. In the three NBQA, there are at least twice as many
cattle with YG 1-3 that grade Prime as those with YG 4-5. This concept is further illustrated
below in Figure 1. Although Prime carcasses are rare, the percentage of carcasses grading Prime
varies little across fat thickness levels. Of fat thickness levels over .50 inches, the percentages of
Standard and Prime carcasses seem about the same. According to the 2005 NBQA (Smith et al.,
2006), carcass weight continues to increase, but the need to increase quality grade and reduce
external fat remain priorities. As carcass weight increases, the total amount of excess fat also
increases.
Distribution of QG within Fat Thickness
0
10
20
30
40
50
60
<.2 .2-.29 .3 -.39 .4-.49 .5-.59 .6-.69 .7-.79 .8-.89 .9-.99 >1.0
Fat
Per
cen
tag
e
Prime Premium ChoiceLow Choice SelectStandard
Figure 1. Distribution of quality grade percentages within each level of fat thickness from 2000
NBQA (Summarized by Dan Hale, Texas Cooperative Extension).
Cowherd considerations
There is a shortage of research that relates carcass traits with mature cow traits in contemporary
females. Nephawe et al. (2004) evaluated these relationships in cattle produced in the first four
cycles of GPE. Mature cow weight and height were very lowly, negatively genetically correlated
with marbling score in steer mates (-.15 and -.17, respectively), and cow body condition score
was not correlated at all (-.03). Cow body condition score was moderately genetically correlated
with adjusted fat thickness of steers however (.30). Mature weights of cows were very highly
genetically correlated to carcass weights whether or not they were adjusted for body condition
score (.81 and .82). Cow body condition score only had .23 genetic correlation with carcass
weight. In these analyses, carcass data were on an age-constant basis. The continual increase in
carcass weight is not independent of cow size. Figure 2 shows weights at five years of age of
cows produced in 1970s vs. late 1990s in the GPE program at MARC.

19
Figure 2. Average cow weights at five years of age from breeds evaluated in Germplasm
Evaluation (GPE) Program at Clay Center, Neb..
Literature Cited
Aass, L. 1996. Variation in carcass and meat quality traits and their relations to growth in dual purpose cattle. Livestock
Prod. Sci. 46:1-12.
Aass, L., and Odd Vangen. 1997. Effects of selection for high milk yield and growth on carcass and meat quality traits in
dual purpose cattle. Livest. Prod. Sci. 52:75-86.
Adams, N. J., G. C. Smith and Z. L. Carpenter. 1982. Performance, carcass and palatability characteristics of longhorn
and other type of cattle. Meat Sci. 7:67-79.
Arnold, J. W., J. K. Bertrand, L. L. Benyshek, and C. Ludwig. 1991. Estimates of genetic parameters for live animal
ultrasound, actual carcass data, and growth traits in beef cattle. J. Anim. Sci. 69:985-992.
Baker, J. F., C. R. Long and T. C. Cartwright. 1984. Characterization of cattle of a five breed diallel: V. Breed and
heterosis effects on carcass merit. J. Anim. Sci. 59:922-933.
Block, H. C., J. J. McKinnon, A. F. Mustafa, and D. A. Christensen. 2001. Manipulation of cattle growth to target carcass
quality. J. Anim. Sci. 79:133-140.
Boleman, S. L., S. J. Boleman, W. W. Morgan, D. S. Hale, D. B. Griffin, J. W. Savell, R. P. Ames, M. T. Smith, J. D.
Tatum, T. G. Field, G. C. Smith, B. A Gardner, J. B. Morgan, S. L. Northcutt, H. G. Dolezal, D. R. Gill, and F. K. Ray.
1998. National beef quality audit-1995: Survey of producer-related defects and carcass quality and quantity attributes. J.
Anim. Sci. 76:96-103.
Burrow, H. M., and K. C. Prayaga. 2004. Correlated responses in productive and adaptive traits and temperament
following selection for growth and heat resistance in tropical beef cattle. Livest. Prod. Sci. 86:143-161.
Casas, E., S. D. Shackelford, J. W. Keele, M. Koohmaraie, T. P. L. Smith, and R. T. Stone. 2003. Detection of
quantitative trait loci for growth and carcass composition in cattle. J. Anim. Sci. 81:2976-2983.
1054
1489
1049
1481
1121
1476
1155
1395
1114
1463
1191
1467
1000
1100
1200
1300
1400
1500
1600
Co
w w
eig
ht
Hereford Angus Simmental Gelbvieh Limousin Charolais
1970s 1990s

20
Casas, E., R. T. Stone, J. W. Keele, S. D. Shackelford, S. M. Kappes, and M. Koohmaraie. 2001. A comprehensive
search for quantitative trait loci affecting growth and carcass composition of cattle segregating alternate forms of the
myostatin gene. J. Anim. Sci. 79:854-860.
Casas, E., S. N. White, D. G. Riley, T. P. L. Smith, R. A. Brenneman, T. A. Olson, D. D. Johnson, S. W. Coleman, G. L.
Bennett, and C. C. Chase, Jr. 2005. Assessment of single nucleotide polymorphisms in genes residing on chromosomes
14 and 29 for association with carcass composition traits in Bos indicus cattle. J. Anim. Sci. 83:13-19.
Chambaz, A., M. R. L. Scheeder, M. Kreuzer, P. A. Dufey. 2003. Meat quality of Angus, Simmental, Charolais and
Limousin steers compared at the same intramuscular fat content. Meat Sci. 63:491-500.
Crews, Jr., D. H. and R. A. Kemp. 2001. Genetic parameters for ultrasound and carcass measures of yield and quality
among replacement and slaughter beef cattle. J. Anim. Sci. 79:3008-3020.
Crews, Jr., D. H., E. J. Pollack, and R. L. Quaas. 2004. Evaluation of Simmental carcass EPD estimated using live and
carcass data. J. Anim. Sci. 82:661-667.
Cundiff, L. V., K. E. Gregory, R. M. Koch, and G. E. Dickerson. 1971. Genetic relationships among growth and carcass
traits of beef cattle. J. Anim. Sci. 33:550-555.
Devitt, C. J. B., and J. W. Wilton. 2001. Genetic correlation estimates between ultrasound measurements on yearling bulls
and carcass measurements on finished steers. J. Anim. Sci. 79:2790-2797.
Elzo, M. A., R. L. West, D. D. Johnson, and D. L. Wakeman. 1998. Genetic variation and prediction of additive and
nonadditive genetic effects for six carcass traits in an Angus-Brahman multibreed herd. J. Anim. Sci. 76:1810-1823.
Geary, T. W., E. L. McFadin, M. D. MacNeil, E. E. Grings, R. E. Short, R. N. Funston, and D. H. Keisler. 2003. Leptin
as a predictor of carcass composition in beef cattle. J. Anim. Sci. 81:1-8.
Gregory, K. E., L. V. Cundiff, and R. M. Koch. 1995. Genetic and phenotypic (co)variances for growth and carcass traits
of purebred and composite populations of beef cattle. J. Anim. Sci. 73:1920-1926.
Gwartney, B. L., C. R. Calkins, R. J. Rasby, R. A. Stock, B. A. Vieselmeyer, and J. A. Gosey. 1996. Use of expected
progeny differences for marbling in beef: II. Carcass and palatability traits. J. Anim. Sci. 74:1014-1022.
Hassen, A., D. E. Wilson, and G. H. Rouse. 1998. Evaluation of carcass, live, and real-time ultrasound measures in
feedlot cattle: I. Assessment of sex and breed effects. J. Anim. Sci. 76:273-282.
Kemp, D. J., W. O. Herring, and C. J. Kaiser. 2002. Genetic and environmental parameters for steer ultrasound and
carcass traits. J. Anim. Sci. 80:1489-1496.
Koch, R. M., M. E. Dikeman, D. M. Allen, M. May, J. D. Crouse and D. R. Campion. 1976. Characterization of
biological types of cattle: III. Carcass composition, quality and palatability. J. Anim. Sci. 43:48-62.
Koch, R. M., M. E. Dikeman, R. J. Lipsey, D. M. Allen and J. D. Crouse. 1979. Characterization of biological types of
cattle-Cycle II: III. Carcass composition, quality and palatability. J. Anim. Sci. 49:448-460.
Koch, R. M., M. E. Dikeman and J. D. Crouse. 1982. Characterization of biological types of cattle (Cycle III): III.
Carcass composition, quality and palatability. J. Anim. Sci. 54: 35-45.
Lee, J. W., S. B. Choi, J. S. Kim, J. F. Keown, and L. D. Van Vleck. 2000. Parameter estimates for genetic effects on
carcass traits of Korean native cattle. J. Anim. Sci. 78:1181-1190.
Lorenzen, C. L., D. S. Hale, D. B. Griffin, J. W. Savell, K. E. Belk, T. L. Frederick, M. F. Miller, T. H. Montgomery, and
G. C. Smith. 1993. National beef quality audit: Survey of producer-related defects and carcass quality and quantity
attributes. J. Anim. Sci. 71:1495-1502.

21
MacNeil, M. D., and M. D. Grosz. 2002. Genome-wide scans for QTL affecting carcass traits in Hereford x composite
double backcross populations. J. Anim. Sci. 80:2316-2324.
Marshall, D. M. 1994. Breed differences and genetic parameters for body composition traits in beef cattle. J. Anim. Sci.
72:2745-2755.
May, S. G., N. S. Burney, J. J. Wilson, J. W. Savell, A. D. Herring, D. K. Lunt, J. F. Baker, J. O. Sanders, and S. B. Smith.
1995. Lipogenic activity of intramuscular and subcutaneous adipose tissues from steers produced by different generations
of Angus sires. J. Anim. Sci. 73:1310-1317.
McKenna, D. R., D. L. Roeber, P. K. Bates, T. B. Schmidt, D. S. Hale, D. B. Griffin, J. W. Savell, J. C. Brooks, J. B.
Morgan, T. H. Montgomery, K. E. Belk, and G. C. Smith. 2002. National beef quality audit-2000: Survey of targeted
cattle and carcass characteristics related to quality, quantity, and value of fed steers and heifers. J. Anim. Sci. 80:1212-
1222.
Mizoshita, K., T. Watanabe, H. Hayashi, C. Kubota, H. Yamakuchi, J. Todoroki, and Y. Sugimoto. 2004. Quantitative
trait loci analysis for growth and carcass traits in a half-sib family of purebred Japanese Black (Wagyu) cattle. J. Anim.
Sci. 82:3415-3420.
Moore, K. K., P. A. Ekeren, D. K. Lunt, and S. B. Smith. 1991. Relationship between fatty acid-binding protein activity
and marbling score in bovine longissimus muscle. J. Anim. Sci. 69:1515-1521.
Mukai, F., K. Oyama, and S. Kohno. 1995. Genetic relationships between performance test traits and field carcass traits
in Japanese Black cattle. Livestock Prod. Sci. 44:199-205.
Newman, S., A Reverter, and D. J. Johnson. 2002. Purebred-crossbred performance and genetic evaluation of
postweaning growth and carcass traits in Bos indicus x Bos taurus crosses in Australia. J. Anim. Sci. 80:1801-1808.
Nephawe, K. A., L. V. Cundiff, M. E. Dikeman, J. D. Crouse, and L. D. Van Vleck. 2004. Genetic relationships between
sex-specific traits in beef cattle: Mature weight, weight adjusted for body condition score, height and body condition score
of cows and carcass traits of their steer relatives. J. Anim. Sci. 82:647-653.
Nkrumah, J. D., C. Li, J. Yu, C. Hansen, D. H. Keisler, and S. S. Moore. 2005. Polymorphisms in the bovine leptin
promoter associated with serum leptin concentration, growth, feed intake, feeding behavior, and measures of carcass merit.
J. Anim. Sci. 83:20-28.
Ozawa, S., T. Mitsuhashi, M. Mitsumoto, S. Matsumoto, N. Itoh, K. Itagaki, Y. Kohno, and T. Dohgo. 2000. The
characteristics of muscle fiber types of longissimus thoracis muscle and their influences on the quantity and quality of
meat from Japanese Black steers. Meat Sci. 54:65-70.
Pariacote, F., L. D. Van Vleck, and R. E. Hunsley. 1998. Genetic and phenotypic parameters for carcass traits of
American Shorthorn beef cattle. J. Anim. Sci. 76:2584-2588.
Pitchford, W.S., M. P. B. Deland, B. D. Siebert, A. E. O. Malau-Aduli and C. D. K. Bottems. 2002. Genetic variation in
fatness and fatty acid composition of crossbred cattle. J. Anim. Sci. 80:2825-2832.
Reverter, A., D. J. Johnson, H. U. Graser, M. L. Wolcott, and W. H. Upton. 2000. Genetic analyses of live-animal
ultrasound and abattoir carcass traits in Australian Angus and Hereford cattle. J. Anim. Sci. 78:1786-1795.
Riley, D. G., C. C. Chase, Jr., A. C. Hammond, R. L. West, D. D. Johnson, T. A. Olson, and S. W. Coleman. 2002.
Estimated genetic parameters for carcass traits of Brahman cattle. J. Anim. Sci. 80:955-962.
Rios-Utrera, A. 2004. Genetic evaluation of carcass traits: Looking at the effects of slaughter end-points. Pages 79-103 in
Proc. Beef Improv. Fed. 36th Annu. Res. Symp. And Annu. Mtg., Sioux Falls, SD. Iowa State Univ., Ames.
Ríos-Utrera, A., L. V. Cundiff, K. E. Gregory, R. M. Koch, M. E. Dikeman, M. Koohmaraie, and L. D. Van Vleck. 2005.
Genetic analysis of carcass traits of steers adjusted to age, weight, or fat thickness slaughter end-points. 83:764-776.

22
Ríos-Utrera, A., L. V. Cundiff, K. E. Gregory, R. M. Koch, M. E. Dikeman, M. Koohmaraie, and L. D. Van Vleck. 2006.
Effects of age, weight, and fat slaughter end-points on estimates of breed and retained heterosis effects for carcass traits. J.
Anim. Sci. 84:63-87.
Sapp, R. L., J. K. Bertrand, T. D. Pringle, and D. E. Wilson. 2002. Effects of selection for ultrasound intramuscular fat
percentage in Angus bulls on carcass traits of progeny. J. Anim. Sci. 80:2017-2022.
Shackelford, S. D., M. Koomaraie, L. V. Cundiff, K. E. Gregory, G. A. Rohrer, and J. W. Savell. 1994. Heritabilities and
phenotypic and genetic correlations for bovine postrigor calpastatin activity and intramuscular fat content, Warner-Bratzler
shear force, retail product yield, and growth rate. J. Anim. Sci. 72:857-863.
Shanks, B. C., M. W. Tess, D. D. Kress, and B. E. Cunningham. 2001. Genetic evaluation of carcass traits in Simmental-
sired cattle at different slaughter end-points. J. Anim. Sci. 79:595-604.
Sherbeck, J. A., J. D. Tatum, T. G. Field, J. B. Morgan, and G. C. Smith. 1996. Effect of phenotypic expression of
Brahman breeding on marbling and tenderness traits. J. Anim. Sci. 74:304-309.
Smith, G. C., J.W. Savell, J.B. Morgan and T.E. Lawrence. 2006. Final report of the National Beef Quality Audit - 2005:
A new benchmark for the U.S. beef industry. Conducted for National Cattleman’s Beef Association.
Splan, R. K., L. V. Cundiff, M. E. Dikeman, and L. D. Van Vleck. 2002. Estimates of parameters between direct and
maternal genetic effects for weaning weight and direct genetic effects for carcass traits in crossbred cattle. J. Anim. Sci.
80:3107-3111.
Stelzleni, A. M., T. L. Perkins, A. H. Brown, Jr., F. W. Pohlman, Z. B. Johnson, and B. A. Sandelin. 2002. Genetic
parameter estimates of yearling live animal ultrasonic measurements in Brangus cattle. J. Anim. Sci. 80:3150-3153.
Thallman, R. M., D. W. Moser, E. W. Dressler, L. Radu Totir, R. L. Fernando, S. D. Kachman, J. M. Rumph, M. E.
Dikeman, and E. J. Pollack. 2003. Carcass Merit Project: DNA marker validation. Proc. Available at
Uytterhaegen, L., E. Claeys, D. Demeyer, M. Lippens, L. O. Fiems, C. Y. Boucque, G. Van de Voorde, and A. Bastiaens.
1994. Effects of double-muscling on carcass quality, beef tenderness and myofibrillar protein degredation in Belgian Blue
White bulls. Meat Sci. 38:255-267.
Vieselmeyer, B. A., R. J. Rasby, B. L. Gwartney, C. R. Calkins, R. A. Stock, and J. A. Gosey. 1996. Use of expected
progeny differences for marbling in beef: I. production traits. J. Anim. Sci. 74:1009-1013.
Wheeler, T. L., L. V. Cundiff, R. M. Koch, and J. D. Crouse. 1996. Characterization of biological types of cattle (Cycle
IV): Carcass traits and logissimus palatability. J. Anim. Sci. 74:1023-1035.
Wheeler, T. L., L. V. Cundiff, S. D. Shackelford and M. Koohmaraie. 2001. Characterization of biological types of cattle
(Cycle V): Carcass traits and logissimus palatability. J. Anim. Sci. 79:1209-1222.
Wheeler, T. L., L. V. Cundiff, S. D. Shackelford and M. Koohmaraie. 2004. Characterization of biological types of cattle
(Cycle VI): Carcass, yield, and longissimus palatability traits. J. Anim. Sci. 82:1177-1189.
Wheeler, T. L. L. V. Cundiff, S. D. Shackelford and M. Koohmaraie. 2005. Characterization of biological types of cattle
(Cycle VII): Carcass, yield, and longissimus palatability traits. J. Anim. Sci. 83:196-207.
Wilson, D. E., R. L. Wilham, S. L. Northcutt, and G. H. Rouse. 1993. Genetic parameters for carcass traits estimated
from Angus field records. J. Anim. Sci. 71:2365-2370.
Young, L. D., L. V. Cundiff, J. D. Crouse, G. M. Smith and K. E. Gregory. 1978. Characterization of biological types of
cattle. VIII. Postweaning growth and carcass traits of three-way cross steers. J. Anim. Sci. 46:1178-1191.