Embed Size (px)
Citation preview
This file is part of the following reference:
Case, George N.D. (2016) Genesis of the E1 group of iron
oxide-copper-gold deposits, Cloncurry district, North West
Queensland. PhD thesis, James Cook University.
Access to this file is available from:
http://researchonline.jcu.edu.au/49998/
The author has certified to JCU that they have made a reasonable effort to gain
permission and acknowledge the owner of any third party copyright material
included in this document. If you believe that this is not the case, please contact
[email protected] and quote
http://researchonline.jcu.edu.au/49998/
ResearchOnline@JCU
Genesis of the E1 Group of Iron oxide-Copper-
Gold Deposits, Cloncurry District, North West
Queensland
Submitted by George N.D. Case (BSci.) in July 2016
for the degree of Doctor of Philosophy from the College of Science and Engineering, James Cook University

i
Acknowledgements The author thanks his advisory panel: Dr. Zhaoshan Chang, Dr. Tom Blenkinsop, Dr.
Jan Marten Huizenga, and Dr. Richard Lilly, for their abundant help, insight, editing
and mentoring throughout the project. Dr. Chang, in particular, provided thorough
feedback that greatly improved the author’s writing. The author also appreciated the
insight provided from Dr. Nick Oliver, Dr. Pat Williams, Dr. Kevin Blake, Dr. Carl
Spandler, Dr. Christa Placzek, and Dr. Mike Rubenach. Special thanks are given to Dr.
Richard Lilly, who provided much mentorship and advice on getting through a PhD.
The employees at Ernest Henry Mining and Mount Isa Mines are thanked for their
generous support in field work logistics: Trevor Shaw, Steve Harper, Janelle Taplin,
Terry Bromell, Chris Hy, and Drew Luck. The thesis examiners, Dr. J. Walshe and Dr.
R. Duncan, provided helpful feedback that greatly improved the overall thesis.
The author received most of the financial support for his PhD through Xstrata
Copper/Glencore and a James Cook University International Postgraduate Research
Scholarship. The Society of Economic Geologists (SEG) Foundation generously
awarded the student a Graduate Fellowship, Research Grant, and SEG conference
attendance funding. James Cook University also provided several Postgraduate
Research grants for analytical expenses. The Economic Geology Research Centre
(EGRU) and Geological Society of Australia also provided funding to attend
conferences.
Finally, the author wishes to thank his family for their support throughout his time in
Australia. He wishes to thank his wife, Marissa, in particular, who sacrificed so much,
so that he could pursue the opportunity of studying abroad. Her love, support and
encouragement are forever appreciated.
ii
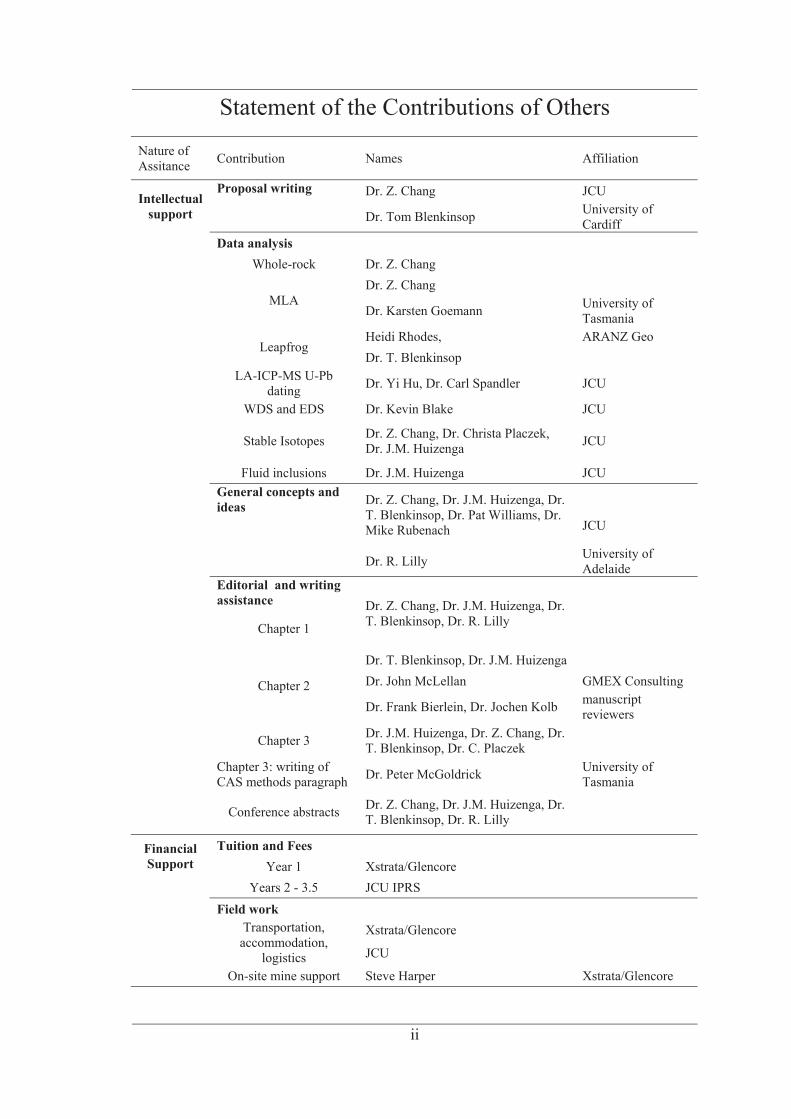
Statement of the Contributions of Others Nature of Assitance Contribution Names Affiliation
Intellectual support
Proposal writing Dr. Z. Chang JCU
Dr. Tom Blenkinsop University of Cardiff
Data analysis Whole-rock Dr. Z. Chang
MLA Dr. Z. Chang
Dr. Karsten Goemann University of Tasmania
Leapfrog
Heidi Rhodes, ARANZ Geo Dr. T. Blenkinsop
LA-ICP-MS U-Pb dating Dr. Yi Hu, Dr. Carl Spandler JCU
WDS and EDS Dr. Kevin Blake JCU
Stable Isotopes Dr. Z. Chang, Dr. Christa Placzek, Dr. J.M. Huizenga JCU
Fluid inclusions Dr. J.M. Huizenga JCU General concepts and
ideas Dr. Z. Chang, Dr. J.M. Huizenga, Dr. T. Blenkinsop, Dr. Pat Williams, Dr. Mike Rubenach
JCU
Dr. R. Lilly University of Adelaide
Editorial and writing assistance Dr. Z. Chang, Dr. J.M. Huizenga, Dr.
T. Blenkinsop, Dr. R. Lilly
Chapter 1
Chapter 2
Dr. T. Blenkinsop, Dr. J.M. Huizenga Dr. John McLellan GMEX Consulting
Dr. Frank Bierlein, Dr. Jochen Kolb manuscript reviewers
Chapter 3 Dr. J.M. Huizenga, Dr. Z. Chang, Dr. T. Blenkinsop, Dr. C. Placzek
Chapter 3: writing of CAS methods paragraph Dr. Peter McGoldrick University of
Tasmania
Conference abstracts Dr. Z. Chang, Dr. J.M. Huizenga, Dr. T. Blenkinsop, Dr. R. Lilly
Financial Support
Tuition and Fees Year 1 Xstrata/Glencore
Years 2 - 3.5 JCU IPRS Field work Transportation,
accommodation, logistics
Xstrata/Glencore
JCU
On-site mine support Steve Harper Xstrata/Glencore

iii
Nature of Assitance Contribution Names Affiliation
Financial Support
Stipend Year 1 Xstrata/Glencore
Years 2 - 3.5 JCU IPRS Fellowship Society of Economic Geologsits
Conference attendance
SEG 2014, 2015 Society of Economic Geologists SEG 2015 Geological Society of Australia SEG 2014, 2015 EGRU
Analytical costs
Years 1 - 3.5 Xstrata/Glencore
Research Grants Society of Economic Geologsits
JCU: SEES, GRS, CSTE
Data collection
Whole-rock ACME Labs
LA-ICP-MS U-Pb dating Dr. Yi Hu
WDS and EDS Dr. Kevin Blake, Dr. Shane Askew JCU
SHRIMP - Stable isotopes Dr. Richard Armstrong Australian National
University
Fluid inclusions Dr. J.M. Huizenga
Sample collection
Dr. R. Lilly
Lisa Craddock University of Leicester
Robbie Coleman JCU IRMS - Stable isotopes
Sulfur
Dr. Kim Baublys University of Queensland
Dr. P. McGoldrick
Oxygen Dr. Craig Johnson US Geological Survey
Signed:
Date: July 3rd, 2016

iv
Statement of the Contributions of Coauthors
Chapter Paper Authorship Roles
2 To be submitted
Case, G., Chang, Z., Blenkinsop, T., Lilly, R., and Goemann, K.
Major research concepts were co-developed by the authors. Case collected the samples and analysed the data. Goemann carried out the MLA analysis, and Case analysed the results thereof. Case wrote the first draft and made the figures and tables. Chang, Blenkinsop and Lilly provided extensive editorial feedback
3
Delineating the structural controls on iron oxide-Cu-Au deposit genesis through implicit modeling: A case study from the E1 Group, Cloncurry District, Australia; submitted to the Geological Society of London
Case, G., Blenkinsop, T., Chang, Z., Huizenga, J.M., Lilly, R., and McLellan, J..
Major research concepts were co-developed by the authors. Case conducted the modeling and analysis, wrote the first draft, and developed the figures. Blenkinsop and Huizenga provided substanital editorial review. Regional geophysical structural interpretations used in two figures were provided by McLellan.
4 To be submitted
Case, G., Chang, Z., Huizenga, J. M., Lilly, R., Armstrong, R., McGoldrick, P.
Major research questions were co-developed by the authors. Case collected the samples and assisted in some of the isotope analysis. Richard Armstrong conducted the SHRIMP isotope analysis, and processed the data. McGoldrick conducted the CAS analysis. Case conducted the fluid inclusion analysis, with which Huizenga assisted. Case analysed the data and wrote the first draft. Huizenga and Chang provided editorial review.
Signed:
Date: July 3rd, 2016

v
Abstract The E1 Group of iron oxide-copper-gold (IOCG) deposits is located in the metal-rich
Cloncurry District of northwest Queensland. The E1 Group contains a total resource of
47 Mt averaging 0.72% Cu and 0.21 g/t Au, and has not been previously investigated in
detail. This study aims to understand the genesis of the E1 Group by characterising its
geology, alteration paragenesis, ore chemistry, structural controls, and mineralising
fluid properties. These features are investigated using drill core logging, petrography,
whole-rock geochemistry, microprobe analysis, LA-ICP-MS U-Pb dating, 3-D implicit
geological modeling, fluid inclusion studies, and SHRIMP and IRMS oxygen and sulfur
stable isotope analyses.
The E1 Group comprises three distinct orebodies: E1 North, E1 East and E1 South. The
orebodies are hosted mainly in marble and carbonaceous metasiltstone of the Corella
Formation (1750–1720 Ma). The metasedimentary rocks are intercalated with
mineralised clastic metavolcanic rocks and barren meta-andesite of the Mount Fort
Constantine Volcanics (~1750 Ma). These rocks were intruded by Ernest Henry Diorite,
cut across by a discordant, polymictic, breccia, and then intruded by dolerite.
Drill core logging, petrography and Mineral Liberation Analysis were used to study the
E1 Group alteration textures and styles. They show that E1 Group mineralisation is
typified mainly by fine- to medium-grained (<500 μm) stratabound and shear zone-
hosted replacement bodies. The ores are typically layer-controlled; some ores are also in
veins. The discordant breccia is barren, and pre-dates mineralisation.
The alteration paragenesis was constrained with drill core logging, petrography, and
Energy-Dispersive and Wavelength-Dispersive analyses. The E1 Group paragenetic
sequence is characterised by three major stages. Stage 1 is dominated by albite (-
hematite), with lesser quartz, actinolite, scapolite, and titanite. The second stage is
broken into three sub-stages. Stage 2a is dominated by magnetite, fluorophlogopite and
fluorannite, fluorapatite, K (-Ba)-feldspar and lesser quartz and pyrite. Stage 2b is a
minor phase of albite (-hematite)-rutile-ilmenite alteration. Stage 2c is composed of
ankeritic carbonate, magnetite, pyrite, and minor chalcopyrite. Stage 3 is the main
mineralising event, and is dominated by carbonate (-Fe-Mn), chalcopyrite, barite,
fluorite, pyrite, chlorite, sericite; trace amounts of monazite, bastnäsite, uraninite and
coffinite are also present.
vi
Whole-rock geochemical analysis indicates that the ores are highly enriched in Fe, Ba,
F, P, and locally Mn, and are less enriched in U, LREE, Co, Mo, As, Sn, Ag while
depleted in Si, Na and K. Delineation of the deposit zonation patterns shows a transition
from the E1 North orebody into a barren magnetite-apatite ± pyrite zone to the
southwest. Barium and fluorine are elevated over 200 m from mineralisation.
The relatively new technique of three-dimensional implicit geological and geochemical
modeling was used to study the structural history and controls of the E1 Group. The
deposit is hosted within a series of northwest-plunging folds that formed during regional
D2 deformation event and peak metamorphism. The E1 North and E1 South orebodies
are hosted in the hinges of the E1 North Antiform and E1 South Synform, respectively,
while E1 East occurs in the limb of the E1 East Antiform. The E1 North Antiform is cut
by the northeast-southwest-trending brittle-ductile E1 North Shear Zone that dips ~70°
northwest. The shear zone is an R-shear of a dextral Riedel structure caused by
transpressional movement on the regional Mount Margaret Fault during local D3 /
regional D4. Implicit geochemical modeling suggests that the spatial distributions of Cu,
Au, Fe, U, Co, Mo, and La are controlled by the fold hinges and E1 North Shear Zone,
and the highest-grade orebody occurs at their intersection. Drill core and petrographic
observations indicate that ore formation took place around local D3 / regional D4. A
later local D4 / regional D5 event caused brittle reactivation of the E1 North Shear Zone
and formed northeast-southwest-trending reverse-oblique faults at E1 South that offset
mineralisation.
Fluid inclusion analyses were conducted on Stage 2a quartz and Stage 3 barite to
determine the composition of the mineralising fluids. Stage 2a quartz hosts a primary
fluid inclusion assemblage, 1A, that is characterised by halite-rich, aqueous liquid-solid-
vapour fluid inclusions with >50 wt% NaCleq; the assemblage was heterogeneously
trapped. Stage 3 barite hosts two major fluid inclusion assemblages (2A and 2B).
Assemblage 2A comprises primary, moderate to low salinity (<15 wt% NaCleq) aqueous
liquid-vapour, inclusions that homogenise between 160° and 190°C. Assemblage 2B is
composed of secondary, moderately saline (<9 wt% NaCl; <18 wt% CaCl2), liquid-
vapour inclusions.
In order to constrain fluid and metal sources and precipitation mechanisms, the 18OVMSOW values of Stage 2a quartz- 34SCDT values of

vii
and Stage 3 barite-chalcopyrite pairs, were studied; Stage 2 pyrite was also measured.
For fine-grained ores, the in-situ Sensitive High Resolution Ion Microprobe method was
used, while conventional ex-situ Isotope Ratio Mass Spectrometry was used for vein 18O values at E1 North have a narrow range of +12.7 to
18O values are characterised by a wider range from 0 to
+8‰. Calculated isotopic equilibrium temperatures from quartz and magnetite range
from 350° to 540°C 18O range of the fluid at these temperatures is
+8.4 to +10.9‰.
Stage 3 chalcopyrite 34S values are distinct between E1 North (–5.8 to +2.7‰), E1 34S values
vary from +6.7 to +21.2‰ in E1 North, +19.1 to +29.5‰ in E1 South, and +5.6‰ to
+26.5‰ in E1 East. Vein-hosted 34S values are 5 to 10‰ lower than those in
fine-grained samples. Stage 2 pyrite is typically 1 to 2‰ higher than Stage 3
chalcopyrite. Calculated equilibrium temperatures for Stage 3 barite and chalcopyrite in
fine-grained samples range from 230° to 340°C; vein-hosted samples did not reach
equilibrium. Estimated trapping pressures of barite 2A fluid inclusions, based on these
temperatures, range from 2.2 to 3.3 (±0.5) kbar. This corresponds to a depth range of 8–
12 km. The estimated values of 34 S range from +4.9 ± 5.3‰ at E1 North, to +15.9 ±
3.6‰ at E1 South.
18Ofluid and 34 S values at E1 North, coupled with the high salinity of 1A fluid
inclusions, are consistent with those from a magmatic-hydrothermal fluid. The F-U-
REE enrichment of the paragenesis suggests that the magma was an evolved, alkaline,
granite. It is speculated that this granite was related to the (1550–1490 Ma) Williams-
Naraku Batholith; it may have supplied some of the Cu and Au. The shifts in the values 34Smineral and 34 S at E1 South can be explained by mixing of the magmatic fluid
with a shallower fluid that had equilibrated with the Corella Formation host rocks. 34S of barite and chalcopyrite between E1 North and South suggests
that both fluids supplied 2-4SO . Ore precipitation was likely caused by salinity decrease
as a result of fluid-fluid mixing. Dilation in the E1 North Shear Zone and fold hinges
during local D3 / regional D4 provided the main conduits for mixing of the mineralising
fluids.
viii
Table of Contents Acknowledgements i
Statement of the Contributions of Others ii
Abstract v
Table of Contents viii
List of Figures xi
List of Tables xiii
Chapter 1: Introduction 1
Thesis Rationale 2
References 7
Chapter 2: Geology and alteration paragenesis of the E1 Group of epigenetic iron oxide-Cu-Au deposits, Cloncurry District, Australia 9
Abstract 10
Introduction 11
Regional Setting: Geological History and IOCG mineralisation of the Cloncurry District 15
Sampling and Analytical Methods 22
E1 Group Deposit Geology 24
Alteration, Mineralisation and Ore Textures 37
Paragenetic Sequence 48
Geochronology 61
Ore Chemistry 64
Zonation Patterns 73
Discussion 80
Implications for IOCG Genesis and Exploration 88
Conclusions 89
References 91
ix
Chapter 3: Delineating the structural controls on iron oxide-Cu-Au deposit genesis through implicit modeling: A case study from the E1 Group, Cloncurry District, Australia 101
Abstract 102
Introduction 102
Regional Geology 104
Host Rocks and Paragenetic Sequence of the E1 Group 110
3-D Geological Modeling 112
E1 Structural Geology 115
Deformation Sequence 125
3-D Concentration Distribution Modeling 129
Discussion 137
Conclusions 149
References 151
Chapter 4: The evolution and sources of mineralising fluids at the E1 Group IOCG deposits, Cloncurry District, Queensland, Australia 161
Abstract 162
Introduction 163
Cloncurry District Geology and Fluid Characteristics 166
E1 Group Geology, Structures and Paragenesis 173
Fluid Inclusion and Stable Istope Systematics 178
Sampling 181
Analytical Methods 188
Results 191
Physiochemical Characteristics 204
Discussion 213
Implications 224
Conclusions 230
References 231
Chapter 5: Conclusions 245
A Genetic Model of the E1 Group 246
Implications for IOCG Genesis and Exploration 250

x
Appendices 252 Appendix A: Drill Core Sample Locations and Descriptions 252
Appendix B: Whole-Rock Geochemical Data 274
Appendix C: Microprobe and Mineral Liberation Analysis Data 302
Appendix D: Monazite U-Pb LA-ICP-MS Data 314
Appendix E: Leapfrog Modeling Database 323
Appendix F: Fluid Inclusion Raw Data 372
Appendix G: Stable Isotope Raw Data 378
Appendix H: Copyright Statements 383
xi
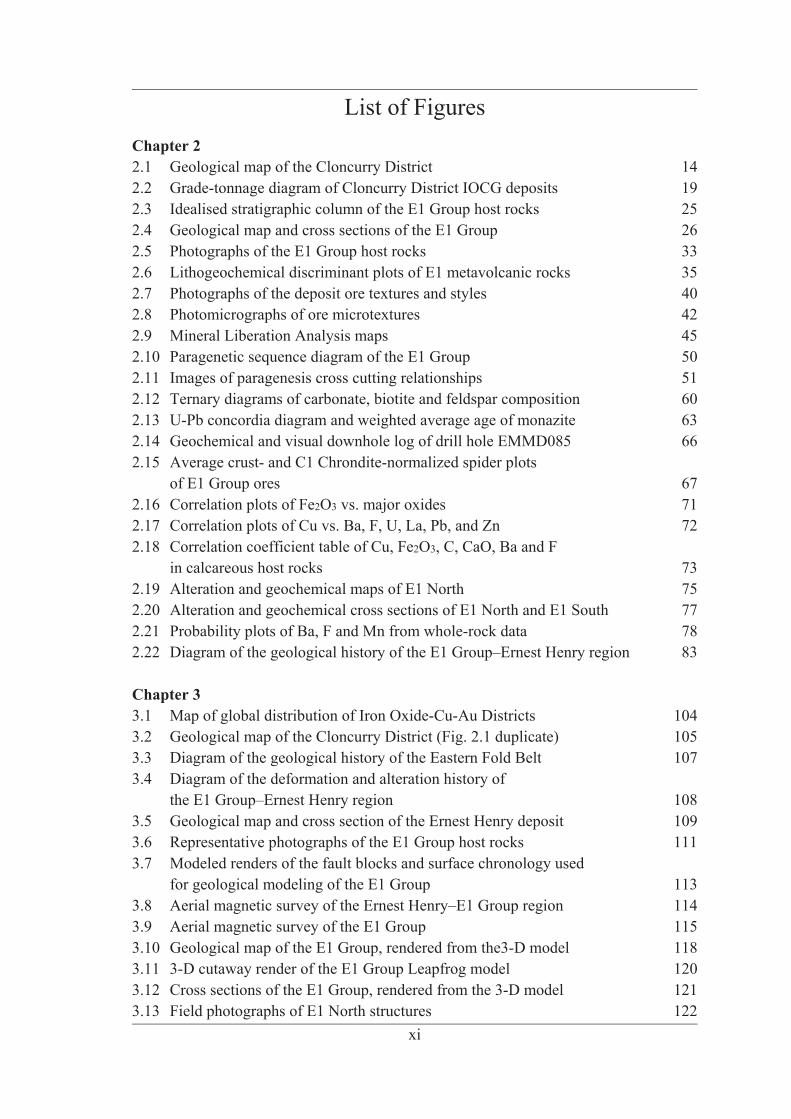
List of Figures Chapter 2 2.1 Geological map of the Cloncurry District 14 2.2 Grade-tonnage diagram of Cloncurry District IOCG deposits 19 2.3 Idealised stratigraphic column of the E1 Group host rocks 25 2.4 Geological map and cross sections of the E1 Group 26 2.5 Photographs of the E1 Group host rocks 33 2.6 Lithogeochemical discriminant plots of E1 metavolcanic rocks 35 2.7 Photographs of the deposit ore textures and styles 40 2.8 Photomicrographs of ore microtextures 42 2.9 Mineral Liberation Analysis maps 45 2.10 Paragenetic sequence diagram of the E1 Group 50 2.11 Images of paragenesis cross cutting relationships 51 2.12 Ternary diagrams of carbonate, biotite and feldspar composition 60 2.13 U-Pb concordia diagram and weighted average age of monazite 63 2.14 Geochemical and visual downhole log of drill hole EMMD085 66 2.15 Average crust- and C1 Chrondite-normalized spider plots
of E1 Group ores 67 2.16 Correlation plots of Fe2O3 vs. major oxides 71 2.17 Correlation plots of Cu vs. Ba, F, U, La, Pb, and Zn 72 2.18 Correlation coefficient table of Cu, Fe2O3, C, CaO, Ba and F
in calcareous host rocks 73 2.19 Alteration and geochemical maps of E1 North 75 2.20 Alteration and geochemical cross sections of E1 North and E1 South 77 2.21 Probability plots of Ba, F and Mn from whole-rock data 78 2.22 Diagram of the geological history of the E1 Group–Ernest Henry region 83
Chapter 3 3.1 Map of global distribution of Iron Oxide-Cu-Au Districts 104 3.2 Geological map of the Cloncurry District (Fig. 2.1 duplicate) 105 3.3 Diagram of the geological history of the Eastern Fold Belt 107 3.4 Diagram of the deformation and alteration history of
the E1 Group–Ernest Henry region 108 3.5 Geological map and cross section of the Ernest Henry deposit 109 3.6 Representative photographs of the E1 Group host rocks 111 3.7 Modeled renders of the fault blocks and surface chronology used
for geological modeling of the E1 Group 113 3.8 Aerial magnetic survey of the Ernest Henry–E1 Group region 114 3.9 Aerial magnetic survey of the E1 Group 115 3.10 Geological map of the E1 Group, rendered from the3-D model 118 3.11 3-D cutaway render of the E1 Group Leapfrog model 120 3.12 Cross sections of the E1 Group, rendered from the 3-D model 121 3.13 Field photographs of E1 North structures 122
xii
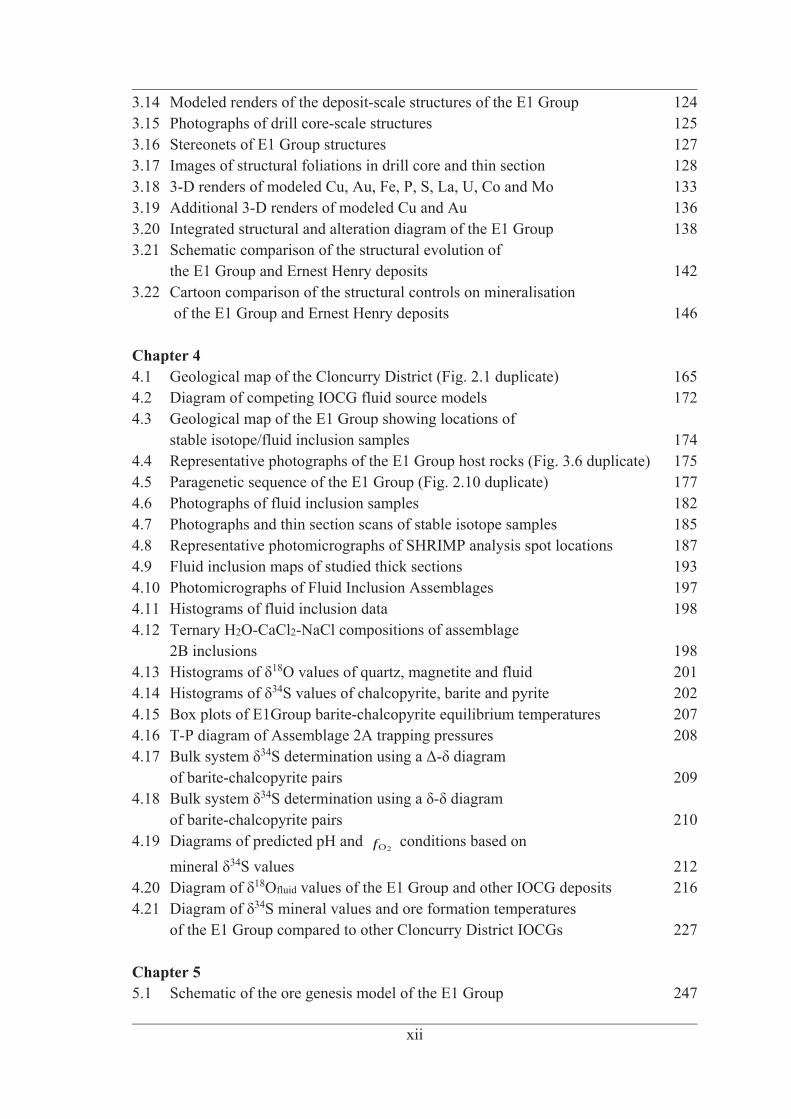
3.14 Modeled renders of the deposit-scale structures of the E1 Group 124 3.15 Photographs of drill core-scale structures 125 3.16 Stereonets of E1 Group structures 127 3.17 Images of structural foliations in drill core and thin section 128 3.18 3-D renders of modeled Cu, Au, Fe, P, S, La, U, Co and Mo 133 3.19 Additional 3-D renders of modeled Cu and Au 136 3.20 Integrated structural and alteration diagram of the E1 Group 138 3.21 Schematic comparison of the structural evolution of
the E1 Group and Ernest Henry deposits 142 3.22 Cartoon comparison of the structural controls on mineralisation
of the E1 Group and Ernest Henry deposits 146
Chapter 4 4.1 Geological map of the Cloncurry District (Fig. 2.1 duplicate) 165 4.2 Diagram of competing IOCG fluid source models 172 4.3 Geological map of the E1 Group showing locations of
stable isotope/fluid inclusion samples 174 4.4 Representative photographs of the E1 Group host rocks (Fig. 3.6 duplicate) 175 4.5 Paragenetic sequence of the E1 Group (Fig. 2.10 duplicate) 177 4.6 Photographs of fluid inclusion samples 182 4.7 Photographs and thin section scans of stable isotope samples 185 4.8 Representative photomicrographs of SHRIMP analysis spot locations 187 4.9 Fluid inclusion maps of studied thick sections 193 4.10 Photomicrographs of Fluid Inclusion Assemblages 197 4.11 Histograms of fluid inclusion data 198 4.12 Ternary H2O-CaCl2-NaCl compositions of assemblage
2B inclusions 198 4.13 Histograms of 18O values of quartz, magnetite and fluid 201 4.14 34S values of chalcopyrite, barite and pyrite 202 4.15 Box plots of E1Group barite-chalcopyrite equilibrium temperatures 207 4.16 T-P diagram of Assemblage 2A trapping pressures 208 4.17 34 -
of barite-chalcopyrite pairs 209 4.18 34 -
of barite-chalcopyrite pairs 210 4.19 Diagrams of predicted pH and
2Of conditions based on 34S values 212
4.20 18Ofluid values of the E1 Group and other IOCG deposits 216 4.21 34S mineral values and ore formation temperatures
of the E1 Group compared to other Cloncurry District IOCGs 227
Chapter 5 5.1 Schematic of the ore genesis model of the E1 Group 247
xiii
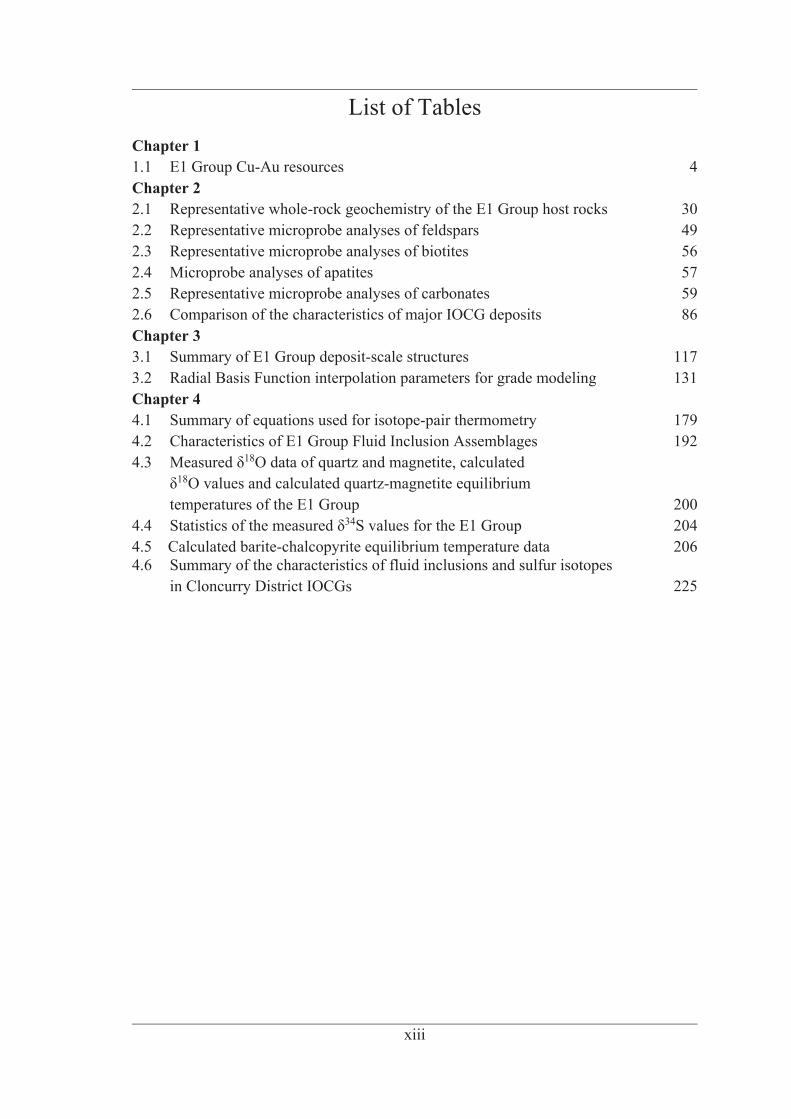
List of Tables Chapter 1 1.1 E1 Group Cu-Au resources 4 Chapter 2 2.1 Representative whole-rock geochemistry of the E1 Group host rocks 30 2.2 Representative microprobe analyses of feldspars 49 2.3 Representative microprobe analyses of biotites 56 2.4 Microprobe analyses of apatites 57 2.5 Representative microprobe analyses of carbonates 59 2.6 Comparison of the characteristics of major IOCG deposits 86 Chapter 3 3.1 Summary of E1 Group deposit-scale structures 117 3.2 Radial Basis Function interpolation parameters for grade modeling 131 Chapter 4 4.1 Summary of equations used for isotope-pair thermometry 179 4.2 Characteristics of E1 Group Fluid Inclusion Assemblages 192 4.3 18O data of quartz and magnetite, calculated
18O values and calculated quartz-magnetite equilibrium temperatures of the E1 Group 200
4.4 34S values for the E1 Group 204 4.5 Calculated barite-chalcopyrite equilibrium temperature data 206 4.6 Summary of the characteristics of fluid inclusions and sulfur isotopes
in Cloncurry District IOCGs 225

1
Chapter 1 Introduction
Chapter 1: Introduction
2
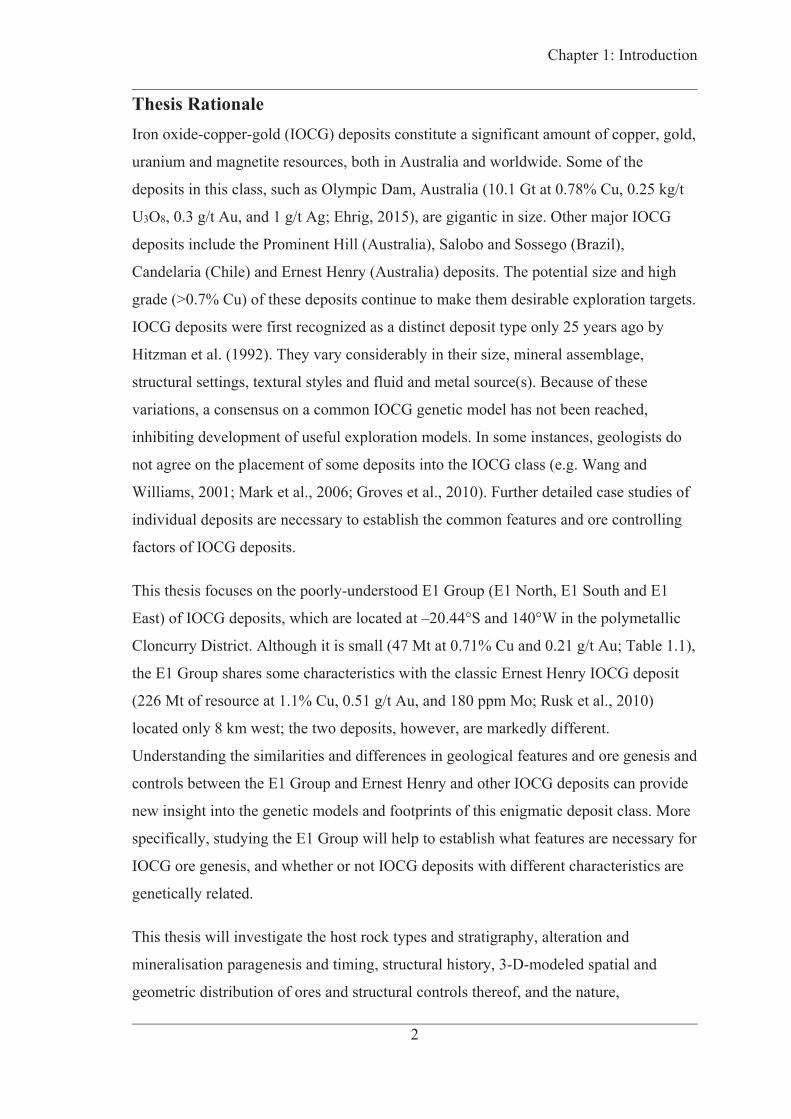
Thesis Rationale Iron oxide-copper-gold (IOCG) deposits constitute a significant amount of copper, gold,
uranium and magnetite resources, both in Australia and worldwide. Some of the
deposits in this class, such as Olympic Dam, Australia (10.1 Gt at 0.78% Cu, 0.25 kg/t
U3O8, 0.3 g/t Au, and 1 g/t Ag; Ehrig, 2015), are gigantic in size. Other major IOCG
deposits include the Prominent Hill (Australia), Salobo and Sossego (Brazil),
Candelaria (Chile) and Ernest Henry (Australia) deposits. The potential size and high
grade (>0.7% Cu) of these deposits continue to make them desirable exploration targets.
IOCG deposits were first recognized as a distinct deposit type only 25 years ago by
Hitzman et al. (1992). They vary considerably in their size, mineral assemblage,
structural settings, textural styles and fluid and metal source(s). Because of these
variations, a consensus on a common IOCG genetic model has not been reached,
inhibiting development of useful exploration models. In some instances, geologists do
not agree on the placement of some deposits into the IOCG class (e.g. Wang and
Williams, 2001; Mark et al., 2006; Groves et al., 2010). Further detailed case studies of
individual deposits are necessary to establish the common features and ore controlling
factors of IOCG deposits.
This thesis focuses on the poorly-understood E1 Group (E1 North, E1 South and E1
East) of IOCG deposits, which are located at –20.44°S and 140°W in the polymetallic
Cloncurry District. Although it is small (47 Mt at 0.71% Cu and 0.21 g/t Au; Table 1.1),
the E1 Group shares some characteristics with the classic Ernest Henry IOCG deposit
(226 Mt of resource at 1.1% Cu, 0.51 g/t Au, and 180 ppm Mo; Rusk et al., 2010)
located only 8 km west; the two deposits, however, are markedly different.
Understanding the similarities and differences in geological features and ore genesis and
controls between the E1 Group and Ernest Henry and other IOCG deposits can provide
new insight into the genetic models and footprints of this enigmatic deposit class. More
specifically, studying the E1 Group will help to establish what features are necessary for
IOCG ore genesis, and whether or not IOCG deposits with different characteristics are
genetically related.
This thesis will investigate the host rock types and stratigraphy, alteration and
mineralisation paragenesis and timing, structural history, 3-D-modeled spatial and
geometric distribution of ores and structural controls thereof, and the nature,
Chapter 1: Introduction
3
composition and conditions of the ore-forming fluid(s). The factors controlling ore
formation will be presented, and a genetic model will be proposed.
Early Characterisation of the E1 Group The E1 Group was discovered by Western Mining Company in 1995, but was not
drilled out extensively until the early 2000s by EXCO Resources. Like Ernest Henry,
the E1 Group does not crop out; consequently, little geological work was done in the
area, aside from geophysical surveys, before drilling. Other targets around E1 were also
drilled by EXCO; the closest is the E8 target, 2 km south of E1 South. The E1 Group
was sold to Xstrata Copper in 2012. Open pit mining of the E1 North ore zone
commenced in August 2012 and finished in March 2014. Pre-stripping of the E1 East
and E1 South pits began in August 2012, but was later suspended before reaching the
Proterozoic rocks.
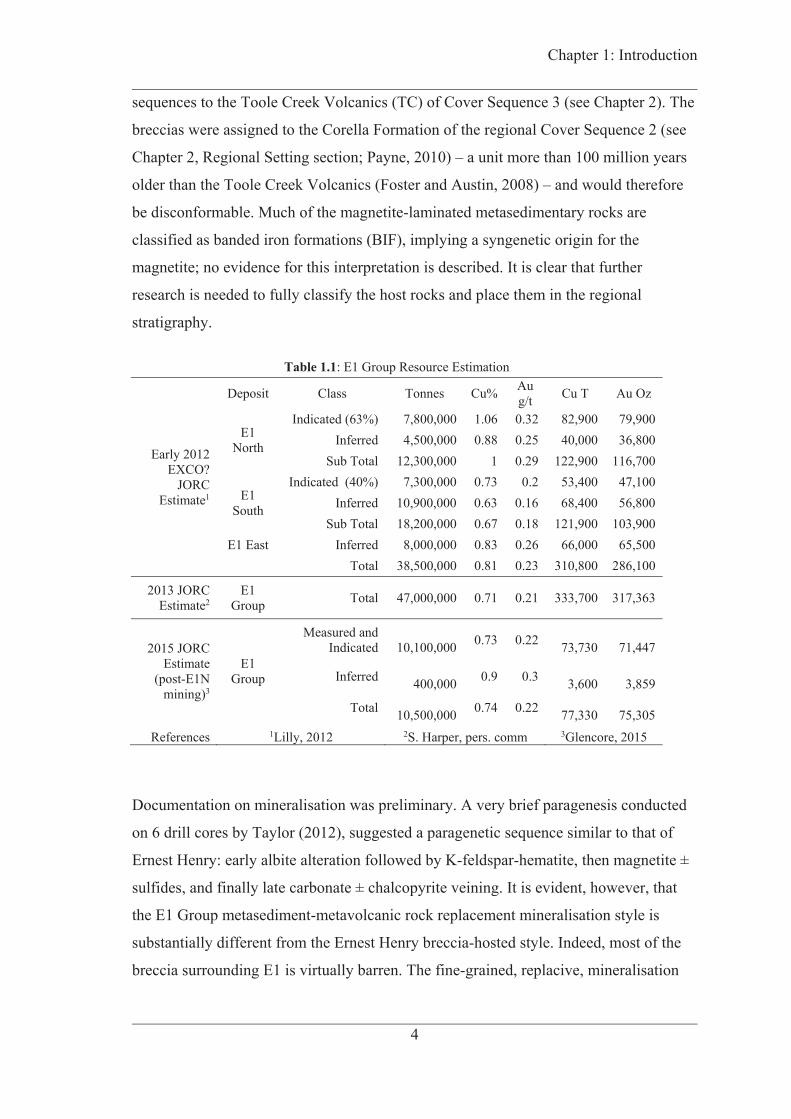
The most recent individual resource estimates available for each orebody in the E1
Group are shown in Table 1.1. It is important to note that these estimates, which total
just 38.5 Mt (Lilly, 2012), were made prior to the 47 Mt estimate stated above; no later
individual estimates are available. Regardless, it is obvious that E1 North is
characterised by a significantly higher Cu-Au grade, and contains more Cu and Au
overall. The most recent 2015 estimate, after mining of the E1 North orebody, is much
smaller at 10.5 Mt at 0.74% Cu and 0.22 g/t Au (Table 1.1).
Little work was done in the E1 Group area, except for geophysical surveys, prior to
drilling. Drilling company and consultant reports are based on drill core logging and
minor petrographic studies, and the work focuses on resource estimates, host rock
characterisation and general alteration paragenesis interpretations (e.g. Laing, 2003;
Jami, 2008; Taylor, 2012). There are no publications on the E1 Group of deposits.
The reports describe the host rocks as steeply-dipping psammites, metasiltstones, and
mafic to intermediate metavolcaniclastic rocks. Breccias, characterised by strong red
alteration (albite, hematite, K-feldspar?), are also described, and are interpreted as being
stratigraphically conformable to the metasedimentary and metavolcanic rocks (Payne,
2010). Some exploration reports (e.g. Jami, 2008) separated the coherent metavolcanic
rocks into a distinct metabasalt unit that underlies the main mineralised metatuff-
volcanic breccia lens and a trachyte unit that overlies the lens, and assigned both
Chapter 1: Introduction
4
sequences to the Toole Creek Volcanics (TC) of Cover Sequence 3 (see Chapter 2). The
breccias were assigned to the Corella Formation of the regional Cover Sequence 2 (see
Chapter 2, Regional Setting section; Payne, 2010) – a unit more than 100 million years
older than the Toole Creek Volcanics (Foster and Austin, 2008) – and would therefore
be disconformable. Much of the magnetite-laminated metasedimentary rocks are
classified as banded iron formations (BIF), implying a syngenetic origin for the
magnetite; no evidence for this interpretation is described. It is clear that further
research is needed to fully classify the host rocks and place them in the regional
stratigraphy.
Table 1.1: E1 Group Resource Estimation
Early 2012 EXCO?
JORC Estimate1
Deposit Class Tonnes Cu% Au g/t Cu T Au Oz
E1 North
Indicated (63%) 7,800,000 1.06 0.32 82,900 79,900 Inferred 4,500,000 0.88 0.25 40,000 36,800
Sub Total 12,300,000 1 0.29 122,900 116,700
E1 South
Indicated (40%) 7,300,000 0.73 0.2 53,400 47,100 Inferred 10,900,000 0.63 0.16 68,400 56,800
Sub Total 18,200,000 0.67 0.18 121,900 103,900 E1 East Inferred 8,000,000 0.83 0.26 66,000 65,500
Total 38,500,000 0.81 0.23 310,800 286,100
2013 JORC Estimate2
E1 Group Total 47,000,000 0.71 0.21 333,700 317,363
2015 JORC Estimate
(post-E1N mining)3
E1 Group
Measured and Indicated
10,100,000 0.73 0.22
73,730
71,447
Inferred 400,000 0.9 0.3
3,600
3,859
Total 10,500,000 0.74 0.22
77,330
75,305 References 1Lilly, 2012 2S. Harper, pers. comm 3Glencore, 2015
Documentation on mineralisation was preliminary. A very brief paragenesis conducted
on 6 drill cores by Taylor (2012), suggested a paragenetic sequence similar to that of
Ernest Henry: early albite alteration followed by K-feldspar-hematite, then magnetite ±
sulfides, and finally late carbonate ± chalcopyrite veining. It is evident, however, that
the E1 Group metasediment-metavolcanic rock replacement mineralisation style is
substantially different from the Ernest Henry breccia-hosted style. Indeed, most of the
breccia surrounding E1 is virtually barren. The fine-grained, replacive, mineralisation
Chapter 1: Introduction
5
texture and style of the E1 Group instead resemble the metasedimentary rock-hosted
Osborne and Starra IOCGs.
The limited body of existing work leaves open many problems concerning the nature
and genesis of the E1 Group:
1. The hypothesized host rocks, the Toole Creek Volcanics and Corella Formation,
are interpreted as conformable yet are over 100 million years different in age,
and are part of two distinct sedimentary-volcanic packages (Cover Sequence 2
and 3; see Chapter 2).
2. The alteration paragenesis has not been analysed through extensive petrography
or microprobe analysis, and the spatial distribution of alterations are not known.
3. The relative and absolute timing of mineralisation and alteration – especially
magnetite (epigenetic or syngenetic) – are not constrained.
4. The structures and deformation history of the deposit are not documented in
detail.
5. The origin and source(s) of the mineralising fluids and metals are not
constrained.
These problems will be resolved through the aims and objectives described below.
Aims and Objectives The aim of this PhD project is to understand the geology and genesis of the E1 Group of
IOCG deposits in order to improve existing IOCG genetic and exploration models. To
achieve such understanding, the major objectives are as follows: 1) characterise the host
rock stratigraphy, geological framework and alteration paragenesis of the deposit, 2)
constrain the timing of alteration and mineralisation, especially for magnetite and
chalcopyrite, 3) delineate the structural history of the deposit and the structural controls
on mineralisation, 4) characterise the evolution of the mineralising fluids in the deposit,
and 5) combine the geology, paragenesis, structures and fluids into a composite genetic
model. These objectives are reached through a combination of geological core logging,
3-D geological and structural modeling, U-Pb geochronology, and whole-rock, mineral,
stable isotope, and fluid inclusion geochemistry.

Chapter 1: Introduction
6
The thesis is structured such that each chapter focuses on one of the previously
mentioned objectives. Chapter 1 describes the rationale and aims of the thesis. In
Chapter 2, the results of characterisation of the geology and alteration paragenesis of the
E1 Group (Objective 1) are presented, and the relative and absolute timings of alteration
and mineralisation are discussed (Objective 2); the deposit is then placed into the
context of other IOCG deposits. Chapter 3 draws upon these data and presents 3-D
geological and geochemical models of the deposit; the structural history and controls on
mineralisation are then discussed (Objective 3). Chapter 4 focuses on the fluid evolution
of the E1 Group (Objective 4) delineated through fluid inclusion and stable istope
analyses. The possible fluid and metals sources and fluid evolution are discussed.
Finally, in the Conclusion chapter (Chapter 5), the results of Chapters 2–4 are
synthesised to establish a comprehensive ore genesis model of the E1 Group (Objective
5).
Chapter 2 describes the framework geology of the E1 Group deposit – the host rocks
and alteration paragenesis – based on the results of core logging, petrography, whole-
rock geochemical analysis, microprobe EDS (Energy-Dispersive Spectroscopy) and
WDS (Wavelength-Dispersive Spectroscopy) mineral analyses, and U-Pb monazite
geochronology. Drill core and thin section petrographic observations of the lithology
and mineralogy of the host rocks, combined with whole-rock major, minor, and trace
element geochemical analyses, are presented. The detailed alteration paragenetic
sequence, derived from drill core logging and petrography, is described. The data from
EDS and WDS microprobe analyses of alteration minerals are presented. The results of
U-Pb dating attempts on monazite, paragenetically related to mineralisation, are also
shown. The implications of these results in the genesis and classification of the E1
Group are discussed. The data form the geological groundwork and context for the
remaining chapters.
Chapter 3 presents the outcome of 3-D geological modeling of the E1 Group host rocks
and structures, based on drill core logging and geophysical datasets, and discusses the
structural history and structural controls on mineralisation. Three-dimensional
geochemical grade models of Cu, Au, Fe, P, S, U, Co, and Mo assay data are presented.
The results are compared with existing work on the nearby Ernest Henry deposit, and
implications for structural controls on IOCG genesis in Cloncurry and other districts are
discussed.
Chapter 1: Introduction
7
In Chapter 4, fluid inclusion and oxygen and sulfur data from pre-ore quartz-magnetite
and syn-ore barite chalcopyrite are presented. Fluid inclusion assemblages (FIA) in
quartz, barite, and calcite are mapped and described. Melting temperatures and resultant
salinity estimates from barite fluid inclusions are shown, along with barite
homogenisation temperatures. Oxygen isotopic measurements of quartz and magnetite
are shown, and are used to constrain the isotopic composition and equilibrium formation
temperature of these pre-ore minerals. Sulfur isotope data from barite, chalcopyrite, and
pyrite are described. Equilibrium temperature estimates of barite-chalcopyrite formation
are presented, and used to place constraints on pH, 2Of during mineralisation, as well as
on the possible sources of sulfur and cations. The sulfur isotope temperature constraints
are combined with barite fluid inclusion homogenisation temperatures to estimate true
trapping pressures during ore formation. The data are combined to discuss models of
fluid sources and ore precipitation mechanisms of the E1 Group. The implications of
these factors in IOCG genesis in the Cloncurry District are also discussed.
The Conclusion chapter uses the results of Chapters 2–4 to establish a complete ore
genesis model of the E1 Group that includes geological, structural, and fluid aspects. It
is followed by a section which summarises the exploration implications of the model.
References
Ehrig, K., (2015). Olympic Dam - Future Directions: BHP - Billiton Presentation, 11 Dec 2015, 28p. Retrieved 4 May 2016 from http://www.saexplorers.com.au/presentations/2015/1600ehrig.pdf.
Foster, D., and Austin, J., (2008). The 1800-1610Ma stratigraphic and magmatic history of the Eastern Succession, Mount Isa Inlier, and correlations with adjacent Paleoproterozoic terranes: Precambrian Research, 163(1–2), p.7–30.
Glencore, (2015). Glencore Resources and Reserves as of 31 December 2015: Glencore Plc, 63p. Retrieved 1 Nov 2016 from http://www.glencore.com/assets/investors/doc/reports_and_results/2015/GLEN-2015-Resources-Reserves-Report.pdf.
Groves, D. I., Bierlein, F. P., Meinert, L. D., and Hitzman, M. W., (2010). Iron oxide copper-gold (IOCG) deposits through Earth history: Implications for origin, lithospheric setting, and distinction from other epigenetic iron oxide deposits: Economic Geology, 105, p.641–654.
Chapter 1: Introduction
8
Hitzman, M. W., Oreskes, N., and Einaudi, M. T., (1992). Geological characteristics and tectonic setting of Proterozoic iron oxide (Cu-U-Au-REE) deposits: Precambrian Research, 58(1–4), p.241–287.
Jami, M., (2008). Mount Margaret Deposit: EXCO Resources internal report, Cloncurry, QLD, Australia, 19p.
Laing, W.P., (2003). Report on E1 North Prospect Drillcore: Evaluation of Photography by Joe Potter and Others, EXCO Resources internal report, Cloncurry, QLD, Australia, 9p.
Lilly, R., (2012). E1 and Monakoff deposits: alteration paragenesis and ore deposit model. Xstrata Copper Exploration internal presentation: August 2012, Mount Isa, QLD, Australia, 55p.
Mark, G., Oliver, N. H. S., and Carew, M. J., (2006). Insights into the genesis and diversity of epigenetic Cu - Au mineralisation in the Cloncurry district, Mt Isa Inlier, northwest Queensland. Australian Journal of Earth Sciences, 53(1), p.109–124.
Payne, P., (2010). Mineral resource estimate, E1 copper-gold deposits, Cloncurry District, Australia: Runge Ltd, Perth, Western Australia, Australia, May 2010. EXCO Resources internal report, Cloncurry, QLD, Australia, 88p.
Rusk, B.G., Oliver, N.H.S., Cleverley, J.S., Blenkinsop, T.G., Zhang, D., Williams, P.J. and Habermann, P., (2010). Physical and Chemical Characteristics of the Ernest Henry Iron Oxide Copper Gold Deposit, Australia; Implications for IOCG Genesis: in Porter, T.M., (ed.), Hydrothermal Iron Oxide Copper-Gold and Related Deposits: A Global Perspective: PGC Publishing, 3, Adelaide, SA, Australia p.201–218.
Taylor, R. G., (2012). Observations concerning paragenesis and structural controls at the E1 and Monokoff prospects, Cloncurry, Queensland, Australia: Xstrata Copper Exploration internal report, Cloncurry, QLD, 33p.
Wang, S., and Williams, P. J., (2001). Geochemistry and origin of Proterozoic skarns at the Mount Elliott Cu-Au(-Co-Ni) deposit, Cloncurry district, NW Queensland, Australia. Mineralium Deposita, 36(2), p.109–124.
9
Chapter 2 Geology and alteration paragenesis of the E1 Group of
epigenetic iron oxide-Cu-Au deposits, Cloncurry District, Australia
George Case1, Zhaoshan Chang1, Thomas Blenkinsop1, 2, Richard Lilly3, 4, and Karsten
Goemann5
1EGRU (Economic Geology Research Centre), College of Science and Engineering,
James Cook University, Townsville, Queensland 4811, Australia
2School of Earth and Ocean Sciences, Cardiff University, Cardiff, Wales CF10 3XQ,
United Kingdom
3Department of Earth Sciences, University of Adelaide, Adelaide, South Australia 5005,
Australia
4Mount Isa Mines, Mount Isa, Queensland 4825, Australia
5Central Science Laboratory, University of Tasmania, Hobart, Tasmania 7005, Australia
Chapter 2: Geology and Alteration
10
Abstract The E1 Group, located 8 km from the world-class Ernest Henry iron oxide-copper-gold
(IOCG) deposit in the Cloncurry District, is hosted in a package of metamorphosed
clastic and coherent intermediate volcanics and calcareous and siliciclastic sedimentary
rocks of the ~1750 Myr old Mount Fort Constantine Volcanics and Corella Formation.
The rocks were intruded by Ernest Henry Diorite (~1650 Ma), cut across by discordant
breccia, and then intruded by (meta)-dolerite. E1 Group ores are mostly laminated,
stratabound and shear-hosted, and the geometry of the orebodies follows a series of
north-northwest-plunging folds. The folds are cut across by northeast-southwest and
northwest-southeast-trending faults and shears. The ores are restricted mainly to clastic
metavolcanic and metasedimentary rocks. Mineral Liberation Analysis indicates that the
magnetite-barite-fluorite-calcite-chalcopyrite ores are dominantly characterised by fine-
grained (<100 μm) layer- and groundmass-controlled replacement textures.
The E1 Group formed in three major phases. Stage 1 is characterised by early albite and
lesser amphibole and titanite alteration. Stage 2 is subdivided into three sub-stages that
probably formed close together in time: Stage 2a magnetite-biotite-apatite-K(-Ba)-
feldspar alteration, Stage 2b intermediate albite alteration, and Stage 2c early
carbonate-quartz-magnetite-chalcopyrite mineralisation. Stage 3 chalcopyrite-pyrite-
barite-fluorite-carbonate alteration is the main mineralising event. Stage 3 also contains
minor monazite, bastnäsite, coffinite, and uraninite U-REE phases. A U-Pb (LA-ICP-
MS) age of 1456 ± 44 Ma of Stage 3 monazite overlaps in error with the youngest
magmatic and mineralisation phases at ~1500 Ma, but may also be mixed with younger
ages related to a resetting event of uncertain cause.
Geochemical data indicate that, in addition to economic Cu, Au, and magnetite, E1
Group ores are highly enriched in Ba, F (up to 22 wt% and 15 wt%, respectively).
Phosphorus (up to 7500 ppm P2O5), LREE (1500 ppm), U (450 ppm), Co (500 ppm),
Mo (400 ppm), Sn (150 ppm), and Ag (6 ppm) are also enriched relative to less altered
rocks in the area. Lead concentrations of 49 ppm in ores are anomalous, but zinc
abundances are not elevated. Geochemical anomaly thresholds for Ba, F, and Mn,
determined from the value of the median + 2 median absolute deviation, are much
higher than average crustal concentrations; this may be the result of an alteration halo
Chapter 2: Geology and Alteration
11
extending beyond existing drill holes. Such extent suggests fluorine and barium can act
as potential vectors for E1 Group-style mineralisation.
The E1 Group is consistent with some of the defining features of Ernest Henry and
Olympic Dam-style IOCGs: Cu-Au-Fe-oxide-U-REE-Ag-Ba-F-P-Co-Mo-Sn
geochemistry, strong structural controls, and spatial association with Na-(-Ca)
alteration. However, E1 is characterised by higher concentrations of Ba and F. Drill core
observations and geochemical data indicate a metasomatic origin of the magnetite-
layered host rocks.The replacive nature of E1 ores indicates that factors such as host
rock composition, and the presence of shearing, are important controls for smaller
deposits that are more abundant in the Cloncurry District. The transition from Ba-
bearing K-feldspar to barite alteration between stages 2a and 3, and the transition from
Stage 2a fluorapatite to Stage 3 fluorite, suggest that Ba and F were present throughout
much of the paragenetic sequence. It is speculated that the elevated concentrations of Ba
and F in the E1 Group are a result of protracted in-situ enrichment of wall rocks and
earlier alteration; such enrichment was limited at Ernest Henry because of volume
increase caused by brecciation. The similar parageneses of E1 to the nearby Ernest
Henry and Monakoff deposits suggests that these systems probably formed from a
similar type of ore fluid under similar conditions.
Introduction The E1 Group of Cu-Au deposits – E1 North, East, and South – is located in the
northeast Cloncurry District of the Eastern Fold Belt (Fig. 2.1). E1 East lies 700 m
northeast of E1 North, and E1 South is 1 km southeast. The closest other target is E8, 2
km south of E1 South. Like Ernest Henry, the E1 group of deposits are hosted in
Proterozoic basement rocks overlain by 20–50 m of Mesozoic sedimentary rocks that
form a flat, featureless plain. The Proterozoic/Mesozoic unconformity culminates in a
palaeotopographic high over the E1 North orebody. The nearest basement outcrops to
the E1 Group are Mount Margaret, 2 km southeast (Fig. 2.1), and Mount Fort
Constantine, 18 km west-southwest.
The E1 Group has not been previously studied in detail, and there exists little
understanding of the host rock stratigraphic framework, alteration and litho- and ore
geochemistry of the deposit. This chapter aims to describe these characteristics, which
will also provide the geological context for the structural, fluid inclusion and stable
Chapter 2: Geology and Alteration
12
isotope studies presented in subsequent chapters. In this chapter, the E1 Group deposit
host rocks and stratigraphic position, alteration and mineralisation, paragenetic
sequence, ore geochronology, ore chemistry and zonation patterns are presented. These
data are based on a combination of drill core logging, optical petrography, microprobe
and Mineral Liberation Analysis (MLA), and whole-rock geochemistry of fresh and
altered wall rocks and ores. In particular, this study also uses MLA, which was
necessary for characterising the very fine-grained (<20–200 μm) ores of the E1 Group.
Based on these data, the E1 Group is placed into the regional geologic framework of
IOCG mineralisation, and the classification of the E1 Group as a true IOCG deposit is
discussed.
Geological characteristics and classification of IOCG deposits The iron oxide-Cu-Au class of ore deposits was recognized by Hitzman et al. (1992)
after the discovery of the super-giant Olympic Dam Cu-Au-U-Ag deposit (10.1 Gt at
0.78 % Cu, 0.25 kg/t U3O8, 0.3g/t Au, and 1g/t Ag; Ehrig, 2015) in South Australia in
1975 by Western Mining Company (Roberts and Hudson, 1983). IOCGs are
distinguished from other deposit types mainly through empirical geological
characteristics, which have been discussed extensively in Hitzman et al. (1992),
Hitzman (2000), Williams et al. (2005) and Groves et al. (2010). Although the
classification is controversial, those workers generally agree that true IOCGs are
characterised by the following: 1) economic grades of Cu-Au ± U ± Ag, accompanied
by enrichment of REE, P, CO32-, F, Ba, Co and Mo; 2) strongly structurally-focused
hydrothermal mineralisation in breccias, veins, or replacement bodies; 3) spatial
association with regional-scale (> 100 km2) sodic (albite ± Na-scapolite) and/or sodic-
calcic (albite-scapolite-Ca-amphibole) alteration; 4) abundant , low-Ti Fe-oxides in
magnetite and/or hematite; and 5) temporal association with regional A- or I-type
magmatism (Groves et al., 2010). The paragenetic sequences of most IOCGs are
typified by early sodic ± calcic alteration, followed by abundant Fe-oxides ± apatite ±
biotite ± K-feldspar alteration, and then by the ore assemblage of Cu-Au ± Fe-oxides ±
barite ± fluorite ± uraninite ± monazite ± bastnasite; some or all of these stages may be
cyclic (e.g. Hitzman et al., 1992; Hitzman, 2000; Requia and Fontboté, 2000; Mark et
al., 2006b). These alterations are typically also zoned in space, with sodic ± calcic
alteration at depth, magnetite ± apatite ± biotite ± K-feldspar at intermediate levels, and
hematite-sericite at shallower levels (Hitzman, 2000). The particular minerals expressed
Chapter 2: Geology and Alteration
13
in these alterations are strongly controlled by host rock composition (Hitzman, 2000).
Additionally, at greater depths, IOCG mineralisation may transition to magnetite-
apatite-dominated and Cu-Au-poor, Kiruna-style, iron oxide-apatite (IOA),
mineralisation (Knipping et al., 2015).
True IOCG deposits are found across the globe and throughout geological time, from
the Archean to the Cenozoic. They occur in a variety of tectonic settings, ranging from
intracontinental orogenic collapse, to intracontinental anorogenic magmatism, and to
proximal or distal collision-related extensional backarc basins (Hitzman, 2000; Groves
et al., 2010; Hayward and Skirrow, 2010). Notable IOCG and IOA districts include the
Gawler Craton, South Australia, Australia, which hosts the type-deposit and largest
IOCG orebody, Olympic Dam; the Andean Coastal Cordillera in Chile and Peru; the
Carajás District, Brazil; and the host district of the E1 Group – the Cloncurry District of
the Mount Isa Inlier, Queensland, Australia. The E1 Group will be compared and
contrasted with deposits in these major districts.
Chapter 2: Geology and Alteration
14
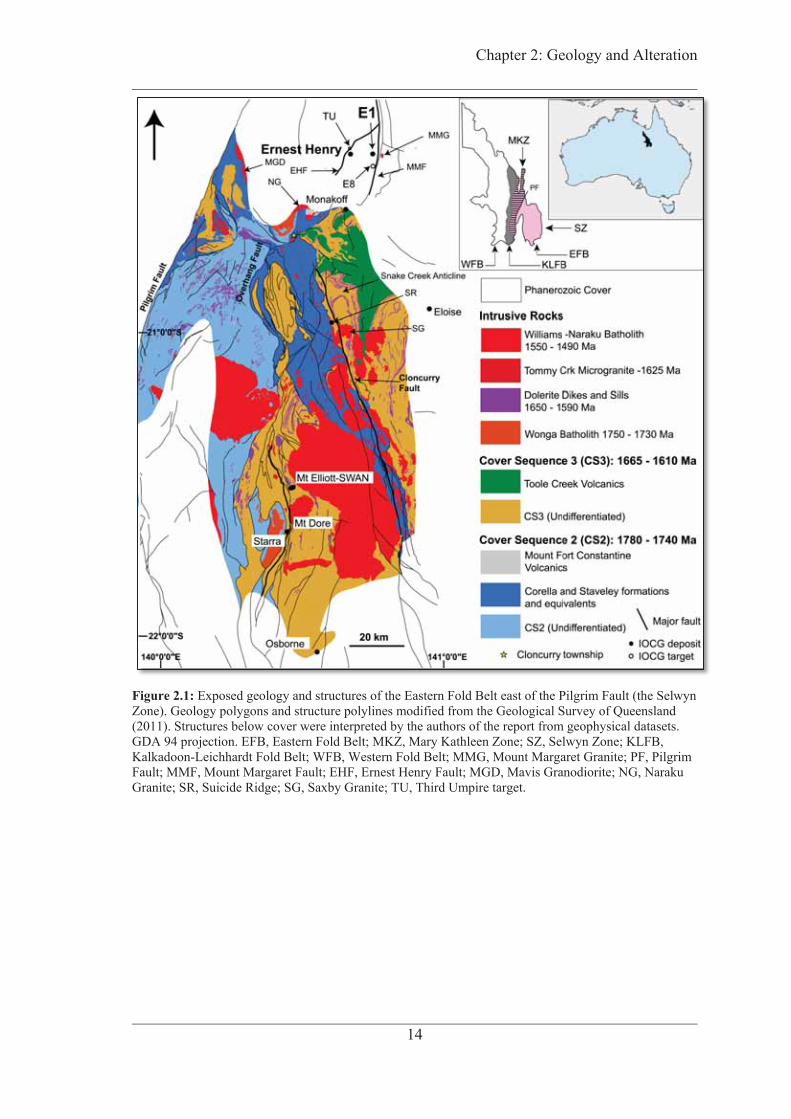
Figure 2.1: Exposed geology and structures of the Eastern Fold Belt east of the Pilgrim Fault (the Selwyn Zone). Geology polygons and structure polylines modified from the Geological Survey of Queensland (2011). Structures below cover were interpreted by the authors of the report from geophysical datasets. GDA 94 projection. EFB, Eastern Fold Belt; MKZ, Mary Kathleen Zone; SZ, Selwyn Zone; KLFB, Kalkadoon-Leichhardt Fold Belt; WFB, Western Fold Belt; MMG, Mount Margaret Granite; PF, Pilgrim Fault; MMF, Mount Margaret Fault; EHF, Ernest Henry Fault; MGD, Mavis Granodiorite; NG, Naraku Granite; SR, Suicide Ridge; SG, Saxby Granite; TU, Third Umpire target.

Chapter 2: Geology and Alteration
15
Regional Setting: Geological History and IOCG mineralisation of the Cloncurry District The E1 Group of IOCG deposits is located 41 km northeast of Cloncurry in the Selwyn
Zone of the Eastern Fold Belt of the Proterozoic Mount Isa Inlier of northwest
Queensland (Fig. 2.1). The Mount Isa Inlier is conventionally subdivided into the
Western Fold Belt, Kalkadoon-Leichhardt Belt, and Eastern Fold Belt tectonic domains
(Blake, 1987). The Pilgrim Fault subdivides the Eastern Fold Belt into the Mary
Kathleen Zone to the west, and Selwyn Zone to the east (Fig. 2.1). The Inlier is
metalliferous, but deposit styles vary substantially between belts. The Western Fold Belt
is dominated by Mount Isa-style Cu and Pb-Zn deposits, while the Eastern Fold Belt
and Kalkadoon-Leichhardt Belt host varying styles of Cu-Au and BHT and SEDEX Pb-
Zn ± Ag mineralisation, of which many of the Cu-Au deposits are grouped into the
IOCG classification (Williams et al., 2005; Groves et al., 2010).
Cover sequence deposition and early intrusions The sedimentary and volcanic country rocks of the Eastern Fold Belt were deposited
between 1875 and 1610 Ma in an intracratonic rift setting (Blake, 1987 and references
therein; O’dea et al., 1997). They overlie the ~1900 Ma basement rocks of the
Barramundi Orogeny and are divided into three major unconformable cover sequences
(Blake and Stewart, 1992). The rocks that comprise these cover sequences are
summarised below. It should be noted that the rock type terms used to describe these
rocks based on their interpreted protoliths, rather than on their metamorphosed forms.
Cover Sequence 1 includes the 1870–1840 Ma Leichhardt (felsic)Volcanics, as well as
their source magmas, the Kalkadoon and Ewen granites, which were intruded between
1870 and 1840 Ma (Wyborn and Page, 1983). Following a significant hiatus, the
Argylla Formation, Marraba (mafic) Volcanics, Mitakoodi Quartzite, Overhang
Jaspilite, and Corella/Doherty Formation of Cover Sequence 2 were deposited between
1780 and 1740 Ma. The Argylla Formation is made up of rhyolite, dacite, andesite and
lesser quartz arenite, feldspathic sandstone and shale (Passchier, 1992). The Marraba
Volcanics comprise mainly basalt, sandstone and siltstone (Blake and Stewart, 1992).
The Mitakoodi Quartzite contains quartz arenite, siltstone, basalt, shale and lesser
limestone. The Corella Formation, Doherty Formation and Overhang Jaspilite are
Chapter 2: Geology and Alteration
16
considered to be temporally equivalent across the Eastern Fold Belt (Foster and Austin,
2008). These units are dominated by limestone and calcareous siltstone, but also contain
quartz arenite, basalt and shale (Blake and Stewart, 1992). The Overhang Jaspilite also
contains jaspilite beds. The presence of metamorphic scapolite and gypsum
pseudomorphs in many outcrops has led to the conclusion that evaporite rocks
originally formed part of these three formations (e.g. Reinhardt, 1991; Hammerli et al.,
2014). The Corella Formation was deposited between 1750–1740 Ma (Foster and
Austin, 2008). The maximum age (~1780 Ma) of Cover Sequence 2 rocks is based the
depositional age of Argylla Formation (Foster and Austin, 2008). Northeast of
Cloncurry, the Mount Fort Constantine Volcanics formed between 1750 and 1740 Ma
(Page and Sun 1998, Foster and Austin, 2008). This volcanic/hypabyssal sequence is
dominantly intermediate to felsic in composition, but includes minor mafic-intermediate
flows (Blake et al., 1997); these volcanic rocks are not recognized south of Cloncurry.
Whole-rock geochemical analysis of the Mount Fort Constantine Volcanics indicates
that this suite is characterised by a mix of within-plate and syn-collisional-volcanic arc
granitic Nb/Y signatures (Blake et al., 1997). Some debate still remains concerning the
Staveley Formation, which has been placed into Cover Sequence 3 (see below) by some
authors (Foster and Austin, 2008), but has some temporal overlap with the Corella and
Doherty formations; it may be as old as ~1740–1720 Ma (Betts et al., 2011; Carson et
al., 2011). It is also lithologically similar and contains calcareous to siliceous arenite,
siltstone, calcareous sandtone, and minor marble and iron-rich beds. It is shown later in
this study that the Corella Formation and Mount Fort Constantine Volcanics are the host
rocks of the E1 Group.
After deposition of Cover Sequence 2, renewed extension took place and granites of the
1750–1740 Ma Wonga Batholith were intruded mostly in the western portion of the
Eastern Fold Belt, west of the Pilgrim Fault (Wyborn et al., 1988). Following the
Wonga event, the Cover Sequence 3 rocks were formed. They include the Llewellyn
Creek Formation, Mount Norna Quartzite, Toole Creek (mafic) Volcanics,which were
deposited between 1690 and 1650 Ma (Foster and Austin, 2008; Rubenach et al., 2008).
The Llewellyn Creek Formation is composed mainly of shale and sandstone turbidite
sequences. The Mount Norna Quartzite, despite its name, is made up mostly of pelite,
feldspathic sandstone and basalt, with a basal quartz arenite bed. The Toole Creek
Volcanics are dominated by basalt and black shale, and lesser chert, limestone and iron-

Chapter 2: Geology and Alteration
17
rich beds. The 1650 Ma minimum age is based on the age of the Toole Creek Volcanics
(1658 ± 8 Ma; Page and Sun, 1998), while the maximum age of ~ 1690 Ma for Cover
Sequence 3 rocks is based on the age of dolerite dykes intruding them (Rubenach et al.,
2008). Around the cessation of deposition of Cover Sequence 3, the Ernest Henry
Diorite suite crystallized at ~1650 Ma (Page and Sun, 1998); it is limited in extent to the
region around the E1 Group and Ernest Henry.
Scott et al. (1998), Jackson et al. (2000), Betts and Giles (2006) and Neumann et al.
(2009) present an alternative stratigraphic framework for the entire Mount Isa Inlier,
and Betts and Giles (2006) consider the Western and Eastern fold belts to be broadly
stratigraphically correlated in the form of superbasins. Their framework groups the
formations of Cover Sequence 2 into the Leichhardt Superbasin, while those of Cover
Sequence 3 are divided into the Calvert Superbasin (Llewellyn Creek Formation –
Mount Norna Quartzite) and Isa Superbasin (Toole Creek Volcanics and Staveley
Formation). Similar correlations have also been proposed by Foster and Austin (2008).
Isan Orogeny: deformation and metamorphism Deformations in post-Barramundian rocks in the Mount Isa Inlier are dominated by the
1650–1500 Ma Isan Orogeny (Blake et al., 1990; Rubenach et al., 2008), which was
probably driven early on by collision of Laurentia with the North Australian Craton
(Betts and Giles, 2006), and later ( after ~1550 Ma) by orogenic collapse (Duncan et al.,
2014). The deformation and metamorphic history of this orogeny is complex, but most
workers (e.g. Adshead-Bell, 1998; Rubenach and Lewthwaite, 2002; Giles et al., 2006;
O’dea et al., 2006; Rubenach et al., 2008; Abu Sharib and Bell, 2011) agree that at least
four major contractional events occurred. The D1 event (1630–1600 Ma) formed poorly-
preserved east-west trending, steep, folds (Rubenach et al., 2008). The dominant north-
south-trending, steep, folds and fabric ubiquitous in the Eastern Fold Belt formed in D2
(1600–1580) at amphibolite facies peak metamorphic conditions (Page and Sun, 1998;
Giles and Nutman, 2002; Rubenach et al., 2008). This was followed by the D3 event
(~1550 Ma; Page and Sun, 1998; Rubenach et al., 2008; Duncan et al., 2011), which
generated steep north-northwest-trending folds and crenulation of S2 (Rubenach et al.,
2008). Steep, northeast-trending folds associated with additional crenulation of S2 fabric
are a late D4 event that lasted from around 1530 to 1500 Ma (Davis et al., 2001;
Rubenach et al., 2008).

Chapter 2: Geology and Alteration
18
Late intrusions and sodic-calcic metasomatism Following peak metamorphism in the Isan Orogeny, voluminous A-type granitoids of
the Williams-Naraku Batholith (Williams-Naraku Batholith; 1550–1490 Ma) were
intruded throughout the Eastern Fold Belt (Page and Sun, 1998). The Mount Margaret
Granite, 2 km east of the E1 Group, is the nearest Williams-Naraku Batholith outcrop to
the deposit and is dated at 1530 Ma (Page and Sun, 1998). No other outcrops of
Williams-Naraku Batholith granites occur near Ernest Henry or E1; the next nearest
other granite pluton, the ~1505 Ma Malakoff Granite (Page and Sun, 1998); crops out
20 km southwest.
During the 1600–1500 Ma time period, numerous episodes of regional sodic (albite ±
scapolite) and sodic-calcic (albite ± actinolite ± scapolite ± diopside ± titanite) alteration
also took place across the Eastern Fold Belt (Rubenach, 2013 and references therein).
Sodic ± calcic alteration textures typically vary from fine-grained, pervasive alteration,
to coarse-grained veining and brecciation. The breccias that are hosted mostly within
the Corella Formation are referred to as Corella Breccias (Marshall, 2003), while others
contain clasts of both the Corella Formation and much younger Cover Sequence 3 rocks
and are named differently (e.g. Suicide Ridge Breccia; Gilded Rose Breccia) at
individual localities (Oliver et al., 2004; Bertelli and Baker, 2010). Notable examples of
extensive Na-Ca alteration include the Knobby Quarry albitite and breccia and the
Suicide Ridge breccia. Some regional Na-Ca alteration zones overlap with some Fe-
oxide-Cu-Au orebodies including Starra (Rotheram, 1997), Osborne (Fisher and
Kendrick, 2008) Ernest Henry (Mark et al. 2006b), and the E1 Group (this study), but
others are generally barren. The origins of these breccias are discussed in detail in
Marshall (2003), Oliver et al. (2006), Bertelli and Baker (2010) and Marshall and Oliver
(2008).
IOCG mineralisation The Cloncurry District hosts abundant IOCG and Fe-oxide-rich Cu-Au ores; the largest
of these is the world-class Ernest Henry IOCG deposit. Other significant deposits and
prospects include Osborne, Starra, Eloise, Mount Elliott-SWAN, Monakoff and the E1
Group (Figs. 2.1–2.2). Total resources in the district may exceed 20 Mt Cu and 9.5 Moz
Au (Duncan et al., 2011; Williams, 1998).
Chapter 2: Geology and Alteration
19
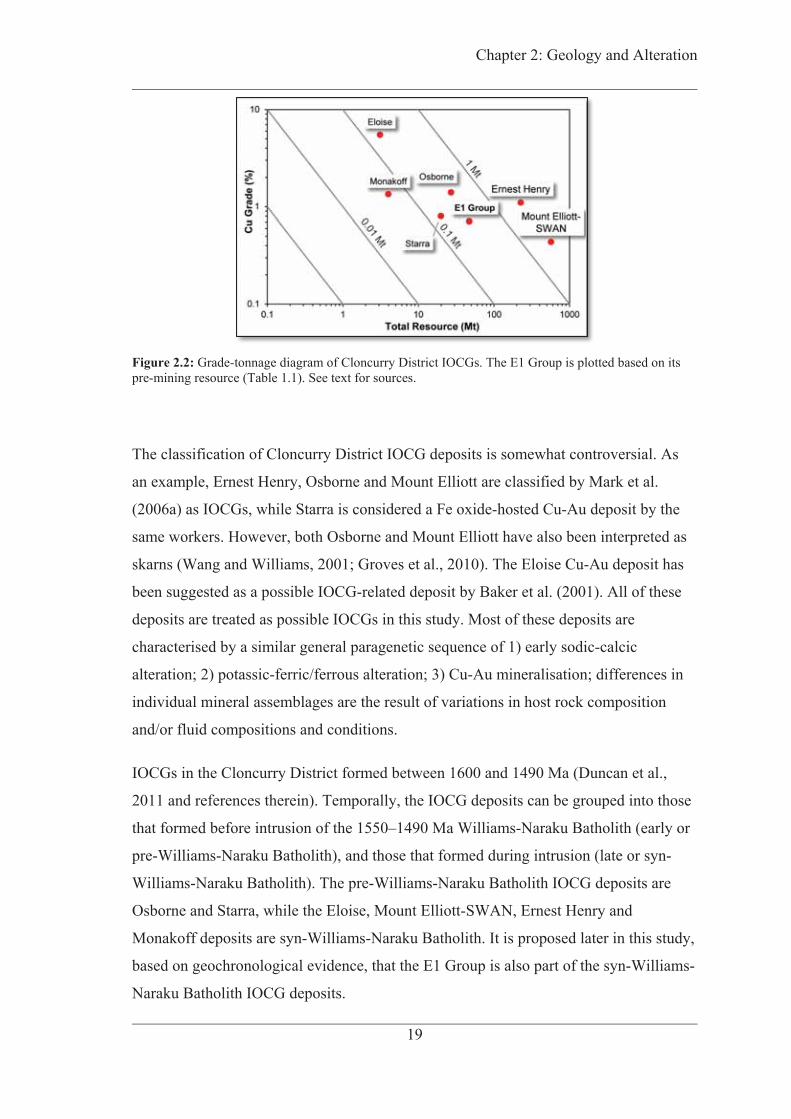
Figure 2.2: Grade-tonnage diagram of Cloncurry District IOCGs. The E1 Group is plotted based on its pre-mining resource (Table 1.1). See text for sources.
The classification of Cloncurry District IOCG deposits is somewhat controversial. As
an example, Ernest Henry, Osborne and Mount Elliott are classified by Mark et al.
(2006a) as IOCGs, while Starra is considered a Fe oxide-hosted Cu-Au deposit by the
same workers. However, both Osborne and Mount Elliott have also been interpreted as
skarns (Wang and Williams, 2001; Groves et al., 2010). The Eloise Cu-Au deposit has
been suggested as a possible IOCG-related deposit by Baker et al. (2001). All of these
deposits are treated as possible IOCGs in this study. Most of these deposits are
characterised by a similar general paragenetic sequence of 1) early sodic-calcic
alteration; 2) potassic-ferric/ferrous alteration; 3) Cu-Au mineralisation; differences in
individual mineral assemblages are the result of variations in host rock composition
and/or fluid compositions and conditions.
IOCGs in the Cloncurry District formed between 1600 and 1490 Ma (Duncan et al.,
2011 and references therein). Temporally, the IOCG deposits can be grouped into those
that formed before intrusion of the 1550–1490 Ma Williams-Naraku Batholith (early or
pre-Williams-Naraku Batholith), and those that formed during intrusion (late or syn-
Williams-Naraku Batholith). The pre-Williams-Naraku Batholith IOCG deposits are
Osborne and Starra, while the Eloise, Mount Elliott-SWAN, Ernest Henry and
Monakoff deposits are syn-Williams-Naraku Batholith. It is proposed later in this study,
based on geochronological evidence, that the E1 Group is also part of the syn-Williams-
Naraku Batholith IOCG deposits.

Chapter 2: Geology and Alteration
20
Pre-Williams-Naraku Batholith deposits The Osborne (1595 ± 5 Ma, Re-Os; Gauthier et al., 2001) and Starra (1568 ± 7 Ma, Re-
Os; Duncan et al., 2011) deposits are the oldest known IOCGs in the Cloncurry District,
and are not temporally associated with any known magmatic events, with the exception
of some peak-metamorphic anatectic pegmatites at Osborne (Fisher and Kendrick,
2008). The Osborne deposit is hosted in metasedimentary rocks of the Mount Norna
Quartzite (and psammite) of Cover Sequence 3, and the Corella Formation (Cover
Sequence 2) may be at depth (Fisher and Kendrick, 2008). The ore body is composed of
banded magnetite, quartz and apatite ironstone, with minor pelitic layers. The ironstone
is interpreted to be pre-metamorphic (Fisher and Kendrick, 2008; Oliver et al., 2008),
and some of the ironstone domains are not mineralised (Fisher and Kendrick, 2008).
The Starra deposit is interpreted to be hosted in the Staveley Formation (Duncan et al.,
2011). The ores are typified by magnetite and hematite-rich breccias and replacement
ironstones (Duncan et al., 2014).
Syn- Williams-Naraku Batholith deposits The Eloise (1530 ± 3 Ma, Ar-Ar; Baker et al., 2001), Mount Elliott-SWAN (~1515 Ma,
Re-Os; Duncan et al., 2011), Ernest Henry (~1525 Ma, Re-Os; Mark et al., 2004) and
Monakoff (1508 ± 10 Ma, Ar-Ar; Pollard and Perkins, 1997) deposits all formed
coevally with the 1550–1490 Ma Williams-Naraku Batholith.
The Eloise deposit is hosted in the Soldiers Cap Group (Cover Sequence 3) (Baker,
1998). Though formation names are not assigned by Baker (1998), his description of
amphibolite, quartz-biotite (-muscovite) schist, and garnetiferous psammite host rocks is
suggestive of the Toole Creek Volcanics and Mount Norna Quartzite formations. Eloise
mineralisation is composed primarily of chalcopyrite and pyrrhotite, and transitions to
lower-grade, massive, pyrite and magnetite in the southern portion of the deposit.
Mount Elliott occurs within metagreywackes and amphibolites of the Soldiers Cap
Group, while SWAN is hosted within calcareous pelitic schists of the Staveley
Formation (Duncan et al., 2014); the two orebodies are considered related systems. Ore
mineralisation occurs mainly as open-space infill and breccias. Mount Elliott is
characterised by an unusual Cu, Au, Ni, Co, Te, Se mineralisation suite associated with
typical calcic skarn assemblages (Wang and Williams, 1998).

Chapter 2: Geology and Alteration
21
The Ernest Henry and Monakoff deposits are the most proximal known orebodies to the
E1 Group; they are located 8 km west and 21 km south of the E1 Group, respectively
(Fig. 2.1). Ernest Henry is the largest IOCG in the district by contained Cu, with 226 Mt
of resource at grades of 1.1% Cu, 0.51 g/t Au, and 180 ppm Mo (Rusk et al., 2010). It is
hosted within brecciated meta-andesite and of the Mount Fort Constantine Volcanics
and lesser marble and metasiliciclastic rocks of the Corella Formation (Mark et al.,
2006b). Ore mineralisation occurs as breccia infill predominately in the form of
chalcopyrite, and is associated with magnetite, calcite, pyrite, biotite, K-feldspar,
hematite garnet, barite, fluorite, quartz and minor molybdenite (Twyerould, 1997; Mark
et al., 2000). Enriched amounts of uranium and rare earth elements (REE) are also
present. Monakoff is hosted in the Toole Creek (mafic) Volcanics and quartz-mica
schists and ironstones of the Mount Norna Quartzite. The ore body is characterised by
massive to laminated magnetite-barite-carbonate-fluorite ± chalcopyrite.
The geological characteristics of these pre- and syn-Williams-Naraku Batholith IOCGs
are compared and contrasted with the E1 Group later.
Concerning the origin of iron oxide in Cloncurry IOCGs Iron oxide-Cu-Au terminology in the literature often includes the use of the terms
“banded iron formation” and “ironstone,” which have been used by some workers
(David and Large, 1994; Davidson, 1998; Oliver et al., 2008) to describe rocks in the
Cloncurry District that contain abundant, stratiform or stratabound magnetite (-
hematite); these terms can be genetically ambiguous. Such iron-rich rocks are typically
layered, but can also be massive. Some of the ironstones are barren (e.g. those in the
vicinity of the Pumpkin Gully Syncline; Hatton and Davidson, 2004), and some host
potentially economic Cu-Au in the case of Starra, Osborne and Monakoff IOCG
deposits and numerous smaller prospects (e.g. Hot Rocks; Davidson, 1998; Williams et
al., 2005).
While the Cu-Au mineralisation in these systems is considered to be epigenetic, the
origin of the laminated or massive magnetite and hematite is thought by some to be
syngenetic prior to remobilization during peak metamorphism or intrusion of the
Williams-Naraku Batholiths (Davidson and Large, 1994; Davidson, 1998; Hatton and
Davidson, 2004; Oliver et al., 2008). This is in contrast to Ernest Henry, which is a
clearly characterised by abundant hydrothermal, epigenetic, magnetite infill (Mark et

Chapter 2: Geology and Alteration
22
al., 2006b). Other workers (Williams, 1994; Rotherham, 1997; Duncan et al., 2011;
Williams et al., 2015) argue that both the mineralisation and the magnetite in the
ironstones are epigenetic. This study will show that the laminated, and partly-
stratabound, magnetite of the E1 Group is epigenetic.
Sampling and Analytical Methods Whole - rock geochemistry One hundred and eleven host rock samples were collected from drill core along sections
A–A’ and B–B’ (Fig. 2.4) for major, minor and trace element analyses. Samples were
collected to encompass intensely- and weakly-altered host rock compositions with
minimal vein interference, but the limited extent of diamond drilling has prevented
access to unaltered host rocks; the average loss-on-ignition (LOI) values of most of the
host rocks are >5 wt% (Table 2.1). Sample descriptions are shown in Appendix A.
The samples were analysed at Acme Labs in Vancouver, Canada. Major elements and
57 trace elements were analysed using Inductively Coupled Plasma Atomic Emission
Spectroscopy (ICP-AES) for major element oxide abundances and via ICP-Mass
Spectrometry to measure minor and trace elements. Total carbon and total sulfur were
measured via a Leco analyser; Loss on Ignition (LOI) was also analysed. X-ray
fluorescence analysis was also performed on 55 samples that contain greater than the
5% maximum detection limit for barium and fluorine in the AA-Litho Package. The
elements and their detection limits, raw data, digestion, and analytical methods are
presented in Appendix B.
Electron microprobe analysis Polished thin sections and pucks were spot analysed via Wavelength-Dispersive
Spectroscopy (WDS) on a JEOL JXA-8200 Superprobe at the James Cook University
Advanced Analytical Centre (AAC). For WDS analyses, the microprobe was operated
at 15 keV acceleration voltage, 19.7 nA current, 5 μm beam size, and 10.09 mm
working distance. The following AAC standards were used: T-albite for Na2O (all
minerals) and SiO2 and Al2O3 in tectosilicates; A2-almandine for FeO and SiO2 and
Al2O3 in phylosilicates; T-spessartine for MnO; F-TAP for F in phylosilicates and SrF2
for F in apatite; A2-tugtupite for Cl in phylosilicates and apatite; T-P2O5 for Ce2O3,
La2O3 and P2O5 in apatite; T-BaSO4 for BaO; T-TiO2 for TiO; T-wollastonite for CaO in
silicates and apatite and T-calcite for CaO in carbonates; T-olivine for MgO; T-
Chapter 2: Geology and Alteration
23
orthoclase for K2O. To derive concentrations from raw counts, CITZAF® 3.50 software
applying the Armstrong/Love-Scott Phi-Rho-Z correction (Armstrong, 1988) was used.
Detection limits were <0.01 wt% for MgO, K2O and Cl, <0.02 wt% for MnO, Na2O and
SiO2, and <0.03 wt% for FeO and TiO2; F in sheet silicates was < 0.05 wt%. Analytical
errors for major oxides are generally <2%, but increase greatly to >40% near detection
limits. In phylosilicates, F and Cl errors are > 2% in all samples. No F diffusion
correction was carried out for F-rich apatite or biotite, and as a result error in the F
concentrations reported for apatite may be up to 0.5 wt%. Nonetheless, this does not
effect identification of the apatite species reported below. Fluorine analysis in biotite
does not have this problem.
MLA analysis Mineralogical X-ray mapping of thin sections by Mineral Liberation Analysis (MLA)
was conducted at the University of Tasmania Central Science Laboratory on a FEI
Quanta 600 Mk1 ESEM utilizing the GXMAP method of Sylvester (2012). In the
GXMAP mapping procedure, the SEM collects a backscattered electron (BSE) image of
the mapping area, which is divided into frames of specified dimensions. The BSE image
is then automatically particulated and segmented by the MLA software into individual
mineral phases based on their BSE brightness, which is dependent on their mean atomic
(Z) number. Relatively large, homogeneous minerals with sharp BSE boundaries are
easily segmented due to high BSE contrast; they are analysed via a single X-ray
spectrum over an area. Minerals and domains characterised by inclusions, patchy
mineral boundaries, or low BSE contrasts (e.g. quartz and albite), are mapped in greater
detail with X-ray spectra collected at points along predefined step intervals. Smaller
step intervals correspond to finer resolution and longer mapping times. Each X-ray
spectrum is automatically compared to spectra in a reference library, and the mineral
spectrum with the closest match is selected. Prior to the mapping run, the sample is
characterised in EDS to identify spectra that may not be in the MLA Software library.
In this study, a single representative area of 3.5 to 4.7 mm2 was mapped on each of 11
polished thin sections chosen from cross section A–A’ (see Fig. 2.20 for sample
locations). Due to the fine grain size of the minerals (<10 μm), as well as the presence
of inclusions in most minerals, a mapping resolution of 1.7 μm/pixel and stepping size
of 2 pixels were required to accurately identify and map mineral species. Operating
voltage was set to 15 kV. The modal mineralogy, in wt%, of each sample was

Chapter 2: Geology and Alteration
24
automatically calculated from the mapped area % by the MLA software and the average
compositions and densities of the minerals in the MLA library. In order to correct for
variations in composition of mica and carbonate minerals from those of the library
standards, WDS analysis at JCU was used to quantify their composition. However, such
variations result in wt% changes of less than 0.5. MLA maps are presented in Figure 2.9
and modal mineralogy tables are in Appendix C.
Monazite U-Pb Geochronology Monazites in sample EMMD033-79.5m were ablated in-situ using a GeoLas 200
Eximer laser operating at 10 hz with a 24 μm spot size, and the isotopic ratios measured
in a Varian 820 ICP-MS instrument. For dating the primary monazite standard used was
Elk Mountain (1391–1404 Ma; Peterman et al., 2012), and the secondary standard was
Manangoutry (555 Ma; Paquette and Tiepolo, 2007). Some trace elements–Si, P, Th–
were also analysed, with NIST610 as the external standard.
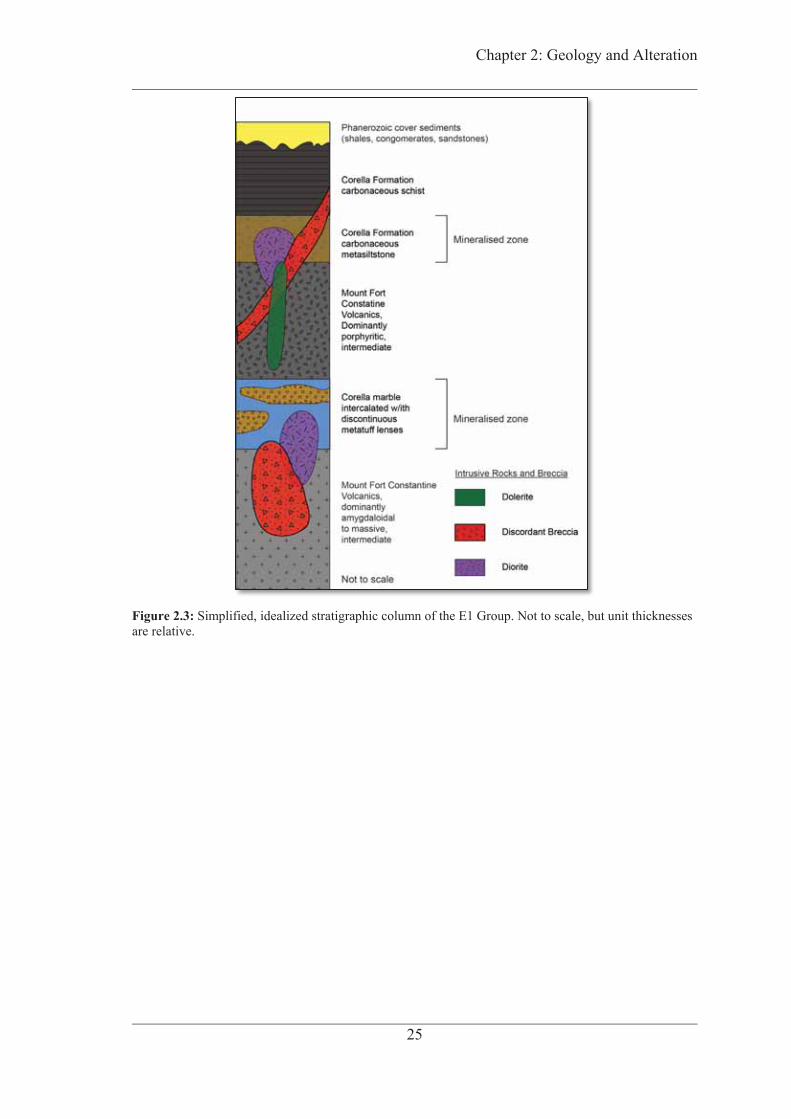
E1 Group Deposit Geology Stratigraphy The mineralisation in the E1 Group deposits is hosted primarily in discontinuous
layered metatuffs and metavolcanic breccias intercalated with marbles and minor
psammites and partly albitised metasiltstone, and also in laminated- to thinly-bedded
carbonaceous metasiltstone which grade upward into carbonaceous schist (Figs. 2.3–
2.5). The host rocks are intercalated with thick (>100 m) sequences of mostly barren
amygdaloidal, massive or porphyritic meta-andesite and meta-basaltic andesite. Prior to
mineralisation, the metavolcanic-sedimentary sequence was intruded by diorite possibly
related to the nearby ~1650 Ma Ernest Henry Diorite suite (Pollard and McNaughton,
1997; Mark et al., 2006b), followed by the formation of a polymictic discordant breccia,
and the later intrusion of minor dolerite dykes. The paucity of drilling outside of the
orebody has made distinguishing between the metatuffs, psammites and marbles
difficult where texture-destructive alteration is prevalent. The descriptions below are
based on the least-altered examples of these rock types. The E1 Group host rocks are
correlated with the Corella Formation and Mount Fort Constantine volcanics in the
Discussion section.
Chapter 2: Geology and Alteration
25
Figure 2.3: Simplified, idealized stratigraphic column of the E1 Group. Not to scale, but unit thicknesses are relative.
Chapter 2: Geology and Alteration
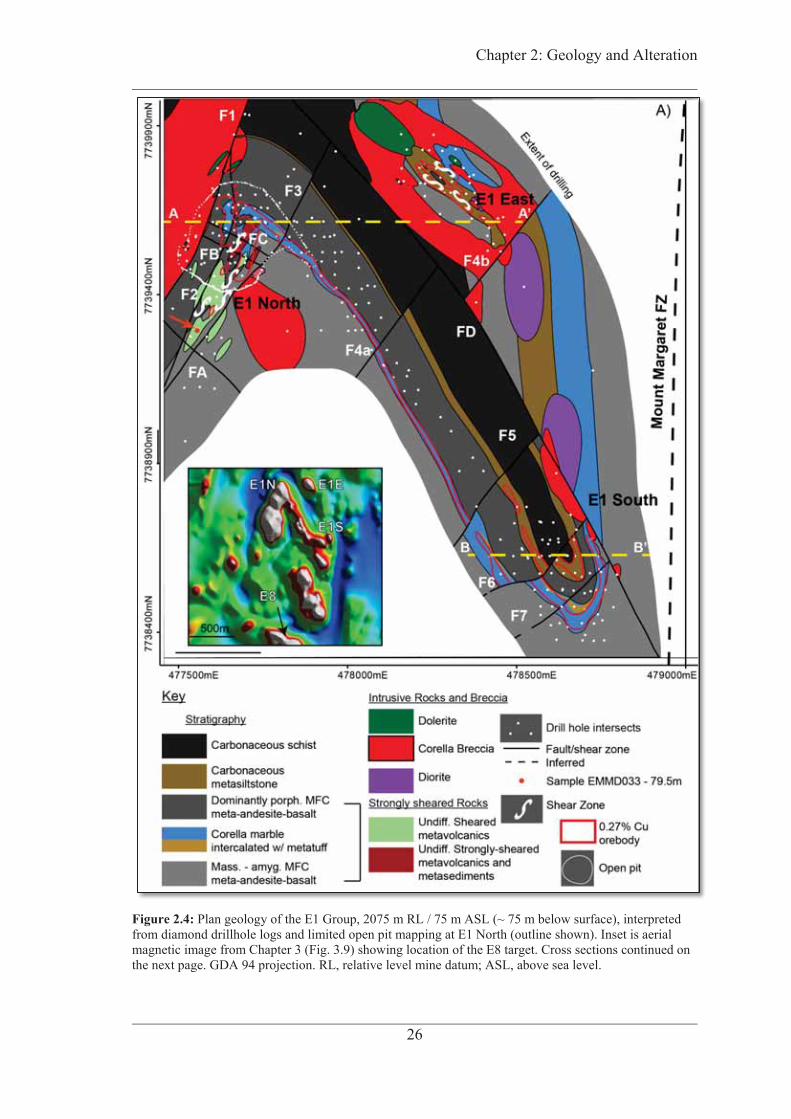
26
Figure 2.4: Plan geology of the E1 Group, 2075 m RL / 75 m ASL (~ 75 m below surface), interpreted from diamond drillhole logs and limited open pit mapping at E1 North (outline shown). Inset is aerial magnetic image from Chapter 3 (Fig. 3.9) showing location of the E8 target. Cross sections continued on the next page. GDA 94 projection. RL, relative level mine datum; ASL, above sea level.

Chapter 2: Geology and Alteration
27
Figure 2.4 (cont.): E1 Group cross sections. B) E1 North and East along A–A’, and C) E1 South along B–B’. Location of monazite sample EMMD033-75.9m indicated. Mineralisation outline traced from assay intersects >0.27% Cu. MFC = Mount Fort Constantine Volcanics. Mass. = massive, amyg. = amygdaloidal. Vertical axis is elevation above sea level.
Chapter 2: Geology and Alteration
28
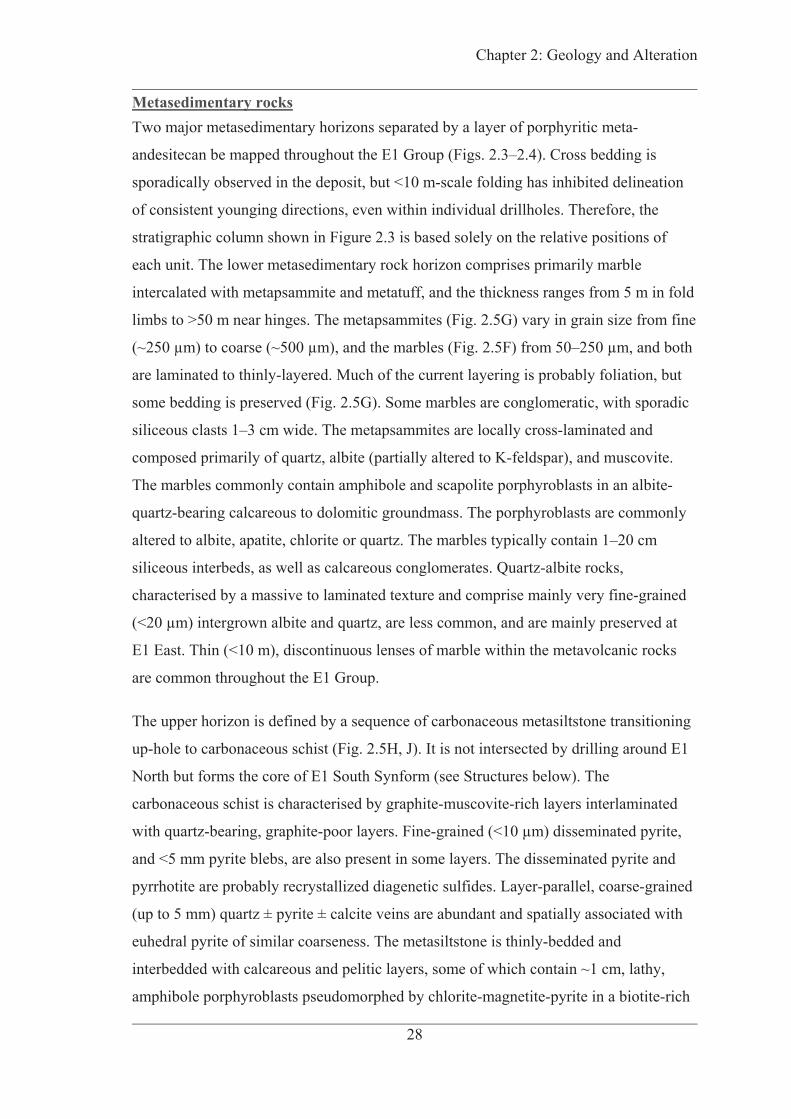
Metasedimentary rocks Two major metasedimentary horizons separated by a layer of porphyritic meta-
andesitecan be mapped throughout the E1 Group (Figs. 2.3–2.4). Cross bedding is
sporadically observed in the deposit, but <10 m-scale folding has inhibited delineation
of consistent younging directions, even within individual drillholes. Therefore, the
stratigraphic column shown in Figure 2.3 is based solely on the relative positions of
each unit. The lower metasedimentary rock horizon comprises primarily marble
intercalated with metapsammite and metatuff, and the thickness ranges from 5 m in fold
limbs to >50 m near hinges. The metapsammites (Fig. 2.5G) vary in grain size from fine
(~250 μm) to coarse (~500 μm), and the marbles (Fig. 2.5F) from 50–250 μm, and both
are laminated to thinly-layered. Much of the current layering is probably foliation, but
some bedding is preserved (Fig. 2.5G). Some marbles are conglomeratic, with sporadic
siliceous clasts 1–3 cm wide. The metapsammites are locally cross-laminated and
composed primarily of quartz, albite (partially altered to K-feldspar), and muscovite.
The marbles commonly contain amphibole and scapolite porphyroblasts in an albite-
quartz-bearing calcareous to dolomitic groundmass. The porphyroblasts are commonly
altered to albite, apatite, chlorite or quartz. The marbles typically contain 1–20 cm
siliceous interbeds, as well as calcareous conglomerates. Quartz-albite rocks,
characterised by a massive to laminated texture and comprise mainly very fine-grained
(<20 μm) intergrown albite and quartz, are less common, and are mainly preserved at
E1 East. Thin (<10 m), discontinuous lenses of marble within the metavolcanic rocks
are common throughout the E1 Group.
The upper horizon is defined by a sequence of carbonaceous metasiltstone transitioning
up-hole to carbonaceous schist (Fig. 2.5H, J). It is not intersected by drilling around E1
North but forms the core of E1 South Synform (see Structures below). The
carbonaceous schist is characterised by graphite-muscovite-rich layers interlaminated
with quartz-bearing, graphite-poor layers. Fine-grained (<10 μm) disseminated pyrite,
and <5 mm pyrite blebs, are also present in some layers. The disseminated pyrite and
pyrrhotite are probably recrystallized diagenetic sulfides. Layer-parallel, coarse-grained
(up to 5 mm) quartz ± pyrite ± calcite veins are abundant and spatially associated with
euhedral pyrite of similar coarseness. The metasiltstone is thinly-bedded and
interbedded with calcareous and pelitic layers, some of which contain ~1 cm, lathy,
amphibole porphyroblasts pseudomorphed by chlorite-magnetite-pyrite in a biotite-rich

Chapter 2: Geology and Alteration
29
groundmass (Fig. 2.7C). At E1 South the mineralised metasiltstone interval is ~20 m
thick, while the metashale layer is about 50 m. The very high Fe2O3 content (mean >20
wt%; Table 2.1) in all metasedimentary rock types except carbonaceous schist is
reflective of magnetite alteration.
Clastic volcanic rocks: Metatuffs and metavolcanic breccias E1 Group metatuffs are characterised by thin (5–1 mm) laminae composed of
alternating quartz and magnetite-biotite. The metavolcanic breccias are typified by
aligned, angular, elongate clasts composed of quartz and plagioclase in a massive or
laminated quartz-bearing matrix (Fig. 2.5D–E). The clasts have various degrees of
magnetite and sericite alteration (Fig. 2.5D). Clast size and shape are highly variable,
ranging from 1mm to >100 mm, and from subrounded to angular. The matrix comprises
varying proportions of quartz, magnetite, chlorite, sulfides, biotite, sericite and
carbonate; most of these phases, except for quartz, may be secondary. Plagioclase
phenocrysts or xenocrysts may be present in both clasts and matrix. The layered
metatuff and metavolcanic breccia form a series of discontinuous lenses intercalated
with coherent andesitic volcanic rocks, and the lenses may vary abruptly in thickness
from 10–100 m. A discontinuous layer (<10 m) of metatuff is present within the lower
marble horizon and is mappable from E1 South to E1 North (Fig. 2.4). The metatuffs
may contain sporadic volcanic clasts grading into clast-dominated intermediate
metavolcanic breccias, and this textural characteristic is useful for identification in
heavily-altered intervals.
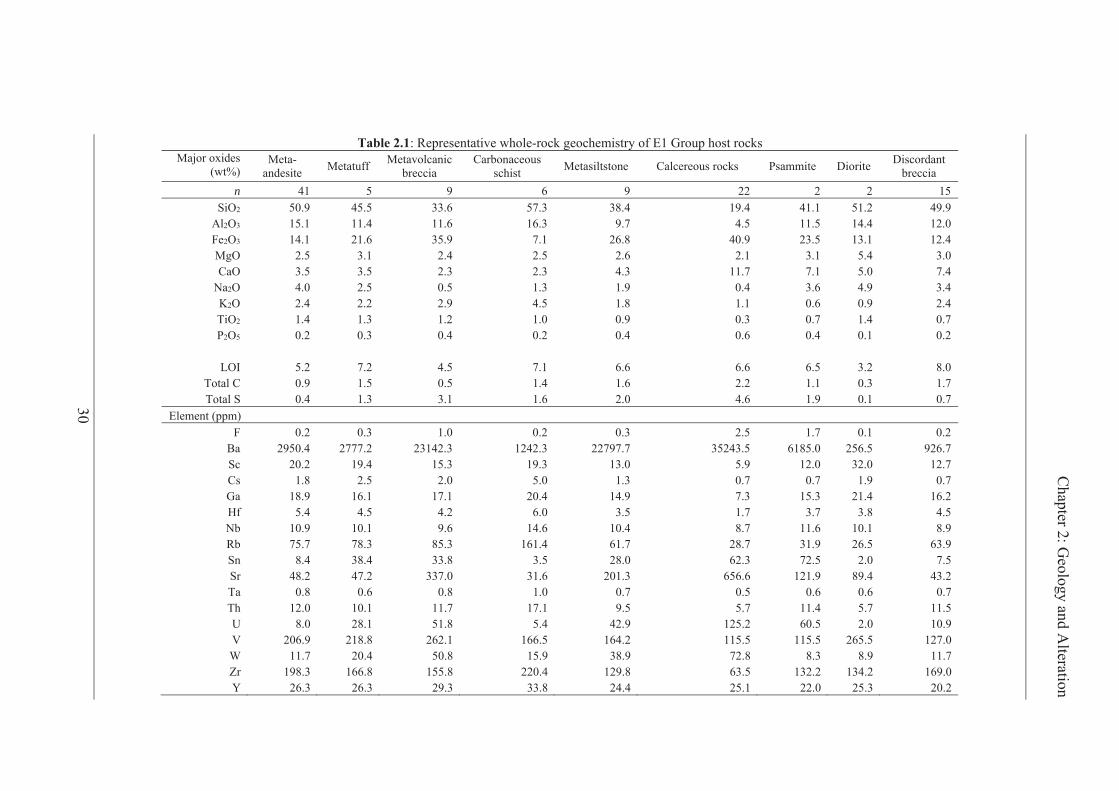
30
Table 2.1: Representative whole-rock geochemistry of E1 Group host rocks Major oxides
(wt%) Meta-
andesite Metatuff Metavolcanic breccia
Carbonaceous schist Metasiltstone Calcereous rocks Psammite Diorite Discordant
breccia n 41 5 9 6 9 22 2 2 15
SiO2 50.9 45.5 33.6 57.3 38.4 19.4 41.1 51.2 49.9 Al2O3 15.1 11.4 11.6 16.3 9.7 4.5 11.5 14.4 12.0 Fe2O3 14.1 21.6 35.9 7.1 26.8 40.9 23.5 13.1 12.4 MgO 2.5 3.1 2.4 2.5 2.6 2.1 3.1 5.4 3.0 CaO 3.5 3.5 2.3 2.3 4.3 11.7 7.1 5.0 7.4
Na2O 4.0 2.5 0.5 1.3 1.9 0.4 3.6 4.9 3.4 K2O 2.4 2.2 2.9 4.5 1.8 1.1 0.6 0.9 2.4 TiO2 1.4 1.3 1.2 1.0 0.9 0.3 0.7 1.4 0.7 P2O5 0.2 0.3 0.4 0.2 0.4 0.6 0.4 0.1 0.2
LOI 5.2 7.2 4.5 7.1 6.6 6.6 6.5 3.2 8.0 Total C 0.9 1.5 0.5 1.4 1.6 2.2 1.1 0.3 1.7 Total S 0.4 1.3 3.1 1.6 2.0 4.6 1.9 0.1 0.7
Element (ppm) F 0.2 0.3 1.0 0.2 0.3 2.5 1.7 0.1 0.2
Ba 2950.4 2777.2 23142.3 1242.3 22797.7 35243.5 6185.0 256.5 926.7 Sc 20.2 19.4 15.3 19.3 13.0 5.9 12.0 32.0 12.7 Cs 1.8 2.5 2.0 5.0 1.3 0.7 0.7 1.9 0.7 Ga 18.9 16.1 17.1 20.4 14.9 7.3 15.3 21.4 16.2 Hf 5.4 4.5 4.2 6.0 3.5 1.7 3.7 3.8 4.5 Nb 10.9 10.1 9.6 14.6 10.4 8.7 11.6 10.1 8.9 Rb 75.7 78.3 85.3 161.4 61.7 28.7 31.9 26.5 63.9 Sn 8.4 38.4 33.8 3.5 28.0 62.3 72.5 2.0 7.5 Sr 48.2 47.2 337.0 31.6 201.3 656.6 121.9 89.4 43.2 Ta 0.8 0.6 0.8 1.0 0.7 0.5 0.6 0.6 0.7 Th 12.0 10.1 11.7 17.1 9.5 5.7 11.4 5.7 11.5 U 8.0 28.1 51.8 5.4 42.9 125.2 60.5 2.0 10.9 V 206.9 218.8 262.1 166.5 164.2 115.5 115.5 265.5 127.0 W 11.7 20.4 50.8 15.9 38.9 72.8 8.3 8.9 11.7 Zr 198.3 166.8 155.8 220.4 129.8 63.5 132.2 134.2 169.0 Y 26.3 26.3 29.3 33.8 24.4 25.1 22.0 25.3 20.2
Chapter 2: Geology and A
lteration
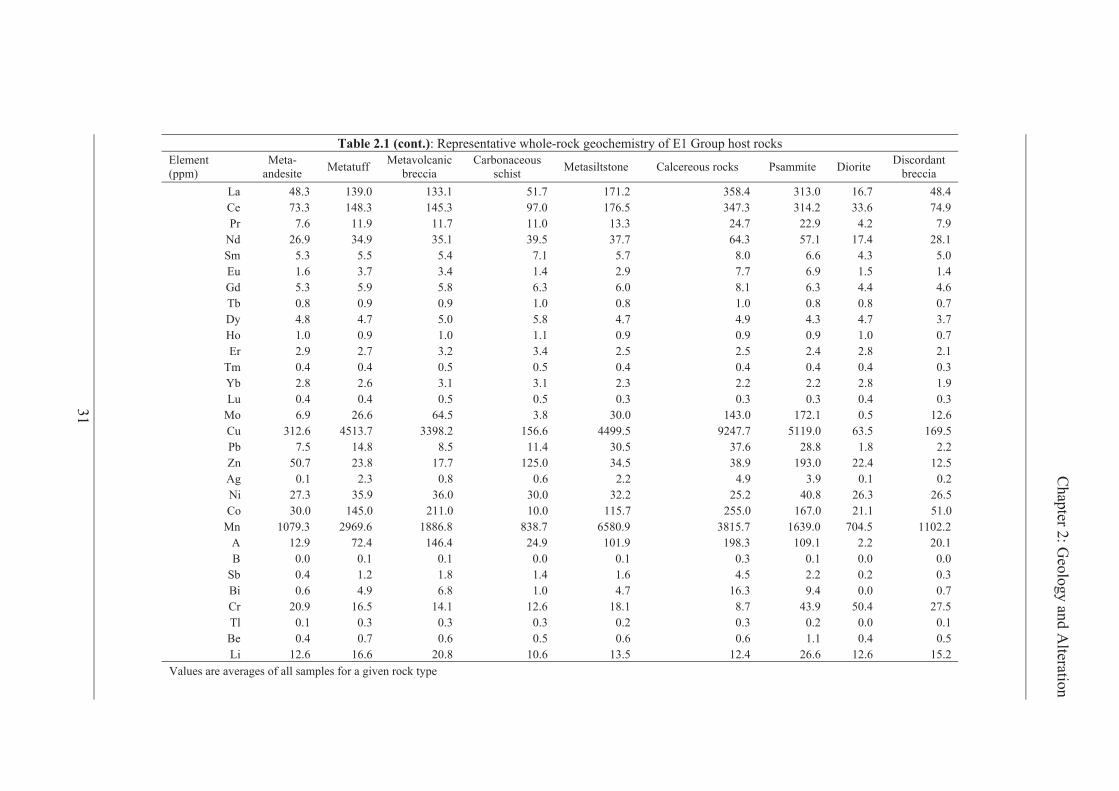
31
Table 2.1 (cont.): Representative whole-rock geochemistry of E1 Group host rocks Element (ppm)
Meta-andesite Metatuff Metavolcanic
breccia Carbonaceous
schist Metasiltstone Calcereous rocks Psammite Diorite Discordantbreccia
La 48.3 139.0 133.1 51.7 171.2 358.4 313.0 16.7 48.4 Ce 73.3 148.3 145.3 97.0 176.5 347.3 314.2 33.6 74.9 Pr 7.6 11.9 11.7 11.0 13.3 24.7 22.9 4.2 7.9
Nd 26.9 34.9 35.1 39.5 37.7 64.3 57.1 17.4 28.1 Sm 5.3 5.5 5.4 7.1 5.7 8.0 6.6 4.3 5.0 Eu 1.6 3.7 3.4 1.4 2.9 7.7 6.9 1.5 1.4 Gd 5.3 5.9 5.8 6.3 6.0 8.1 6.3 4.4 4.6 Tb 0.8 0.9 0.9 1.0 0.8 1.0 0.8 0.8 0.7 Dy 4.8 4.7 5.0 5.8 4.7 4.9 4.3 4.7 3.7 Ho 1.0 0.9 1.0 1.1 0.9 0.9 0.9 1.0 0.7 Er 2.9 2.7 3.2 3.4 2.5 2.5 2.4 2.8 2.1
Tm 0.4 0.4 0.5 0.5 0.4 0.4 0.4 0.4 0.3 Yb 2.8 2.6 3.1 3.1 2.3 2.2 2.2 2.8 1.9 Lu 0.4 0.4 0.5 0.5 0.3 0.3 0.3 0.4 0.3
Mo 6.9 26.6 64.5 3.8 30.0 143.0 172.1 0.5 12.6 Cu 312.6 4513.7 3398.2 156.6 4499.5 9247.7 5119.0 63.5 169.5 Pb 7.5 14.8 8.5 11.4 30.5 37.6 28.8 1.8 2.2 Zn 50.7 23.8 17.7 125.0 34.5 38.9 193.0 22.4 12.5 Ag 0.1 2.3 0.8 0.6 2.2 4.9 3.9 0.1 0.2 Ni 27.3 35.9 36.0 30.0 32.2 25.2 40.8 26.3 26.5 Co 30.0 145.0 211.0 10.0 115.7 255.0 167.0 21.1 51.0
Mn 1079.3 2969.6 1886.8 838.7 6580.9 3815.7 1639.0 704.5 1102.2 A 12.9 72.4 146.4 24.9 101.9 198.3 109.1 2.2 20.1 B 0.0 0.1 0.1 0.0 0.1 0.3 0.1 0.0 0.0
Sb 0.4 1.2 1.8 1.4 1.6 4.5 2.2 0.2 0.3 Bi 0.6 4.9 6.8 1.0 4.7 16.3 9.4 0.0 0.7 Cr 20.9 16.5 14.1 12.6 18.1 8.7 43.9 50.4 27.5 Tl 0.1 0.3 0.3 0.3 0.2 0.3 0.2 0.0 0.1 Be 0.4 0.7 0.6 0.5 0.6 0.6 1.1 0.4 0.5 Li 12.6 16.6 20.8 10.6 13.5 12.4 26.6 12.6 15.2
Values are averages of all samples for a given rock type
Chapter 2: Geology and A
lteration

Chapter 2: Geology and Alteration
32
Coherent volcanic rocks: Basalt meta-andesite and meta-andesite Basaltic meta-andesite and meta-andesite (Fig. 2.5A–C) are the dominant coherent
volcanic rocks at the E1 Group, and exhibit massive, porphyritic, glomerophyric,
amygdaloidal, and/or autobreccia textures. Their unaltered groundmass is typically dark
gray, while chlorite-altered equivalents are green-gray, and they comprise albite (over
60%), 5–30% chlorite or biotite (after amphibole?), 5–10% primary magnetite and <5%
quartz. Phenocrysts, where present, are dominantly plagioclase, although amphibole is
also rarely present, and range in size from 0.5–2 mm. Both the phenocrysts and
groundmass are variably altered by sericite, chlorite and carbonate. Vesicules, where
present, are typically filled with quartz, carbonate, magnetite, pyrite and/or chalcopyrite,
and these minerals may also make the amygdule boundary irregular. The amygdules
may exhibit weak elongation but are generally not as well-aligned as metatuff clasts.
These rocks also make up most of the single diamond hole that was drilled into the E8
target (Fig. 2.4A), and are intercalated with some metavolcanic breccias.
The results of the whole-rock geochemical analyses of the metavolcanic rock samples
are shown in Table 2.1 and Figure 2.6. The meta-andesite rocks, on average, contain
>50 wt% SiO2 and >6 wt% Na2O + K2O (Table 2.1). Most of the metavolcanic rock
samples are characterised by various degrees of alteration as revealed by petrography
and high LOI values (up to 13.5 wt%). Therefore, these major oxide discrimination
diagrams (Fig. 2.6A) are highly scattered and are no longer reliable. Additionally,
mobility of La prohibits the use of the La-Y-Nb discriminant diagram for volcanic
series (i.e. calc-alkaline). The high field strength elements (HFSE), on the other hand,
are typically immobile and can still indicate the original rock type (Pearce, 1996).This
appears to be the case for the E1 rocks, as the ratios of Zr/Ti and Nb/Y overlap
substantially between relatively less-altered (LOI <6.9 wt%, or less than the 75th
percentile) and altered samples (LOI >6.9 wt%); no trends are obvious (Fig. 2.6C). The
E1 Group coherent metavolcanic rocks mostly cluster in the andesite-basaltic andesite
region and uppermost basalt region, and overlap with meta-andesites of the Mount Fort
Constantine Volcanics (Fig. 2.6B). They are distinct from the Toole Creek Volcanics
samples, which plot in the middle of the basalt region. The E1 Group samples mostly
plot in the volcanic arc–syn-collosional region on the Nb-Y diagram (Fig. 2.6D), though
two plot in the within-plate area (Pearce et al., 1984).
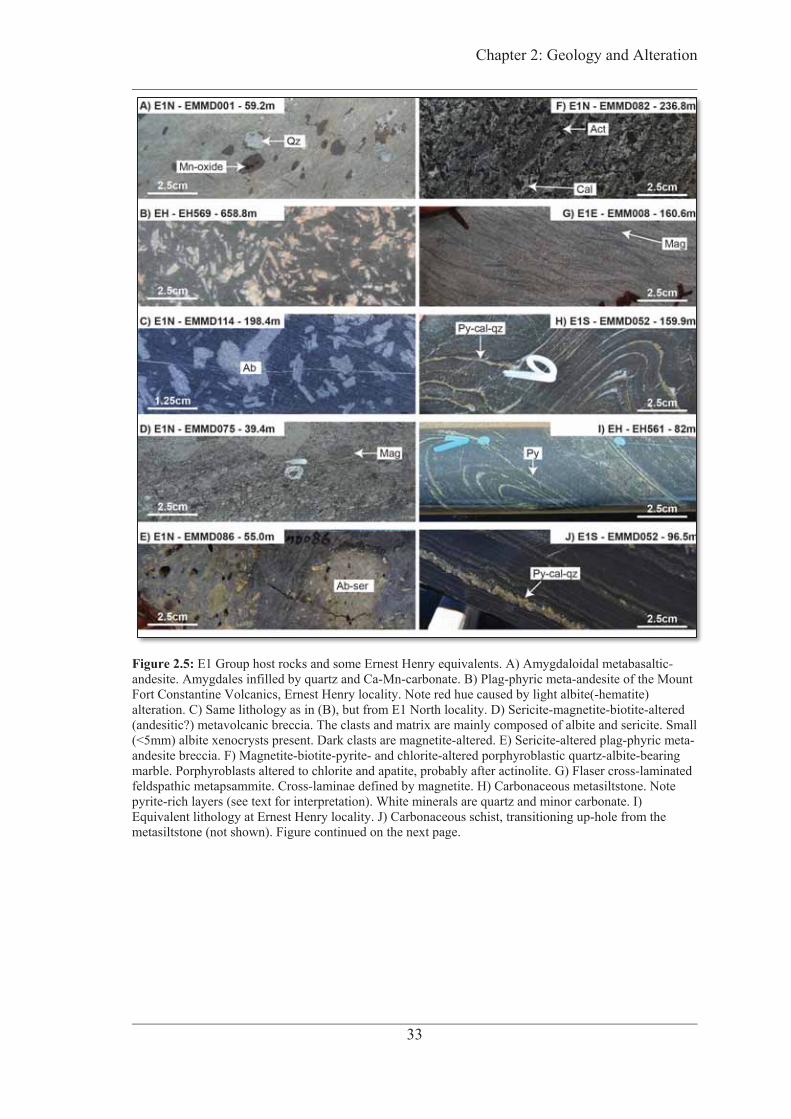
Chapter 2: Geology and Alteration
33
Figure 2.5: E1 Group host rocks and some Ernest Henry equivalents. A) Amygdaloidal metabasaltic-andesite. Amygdales infilled by quartz and Ca-Mn-carbonate. B) Plag-phyric meta-andesite of the Mount Fort Constantine Volcanics, Ernest Henry locality. Note red hue caused by light albite(-hematite) alteration. C) Same lithology as in (B), but from E1 North locality. D) Sericite-magnetite-biotite-altered (andesitic?) metavolcanic breccia. The clasts and matrix are mainly composed of albite and sericite. Small (<5mm) albite xenocrysts present. Dark clasts are magnetite-altered. E) Sericite-altered plag-phyric meta-andesite breccia. F) Magnetite-biotite-pyrite- and chlorite-altered porphyroblastic quartz-albite-bearing marble. Porphyroblasts altered to chlorite and apatite, probably after actinolite. G) Flaser cross-laminated feldspathic metapsammite. Cross-laminae defined by magnetite. H) Carbonaceous metasiltstone. Note pyrite-rich layers (see text for interpretation). White minerals are quartz and minor carbonate. I) Equivalent lithology at Ernest Henry locality. J) Carbonaceous schist, transitioning up-hole from the metasiltstone (not shown). Figure continued on the next page.

Chapter 2: Geology and Alteration
34
Figure 2.5 (Cont.): K) K-feldspar-albite-hematite ± epidote (not shown)-altered diorite. L) Strongly feldspathised discordant breccia with heavy, late chlorite and carbonate overprint of biotite-rich matrix. Note the prominent diorite clast. M) Discordant breccia from the Third Umpire target near Ernest Henry. This specimen is not significantly overprinted by later chlorite-carbonate alteration and the original amphibole-pyroxene-rich matrix is well-preserved. Note the poorly-defined boundary of some of the clasts, indicating some degree of chemical replacement, or ‘chemical milling’. N) Abrupt, discordant contact between metasedimentary rocks (dark banded rock) and discordant breccia (red rock). O) Xenoliths of discordant breccia hosted in late, altered dolerite (Dol).
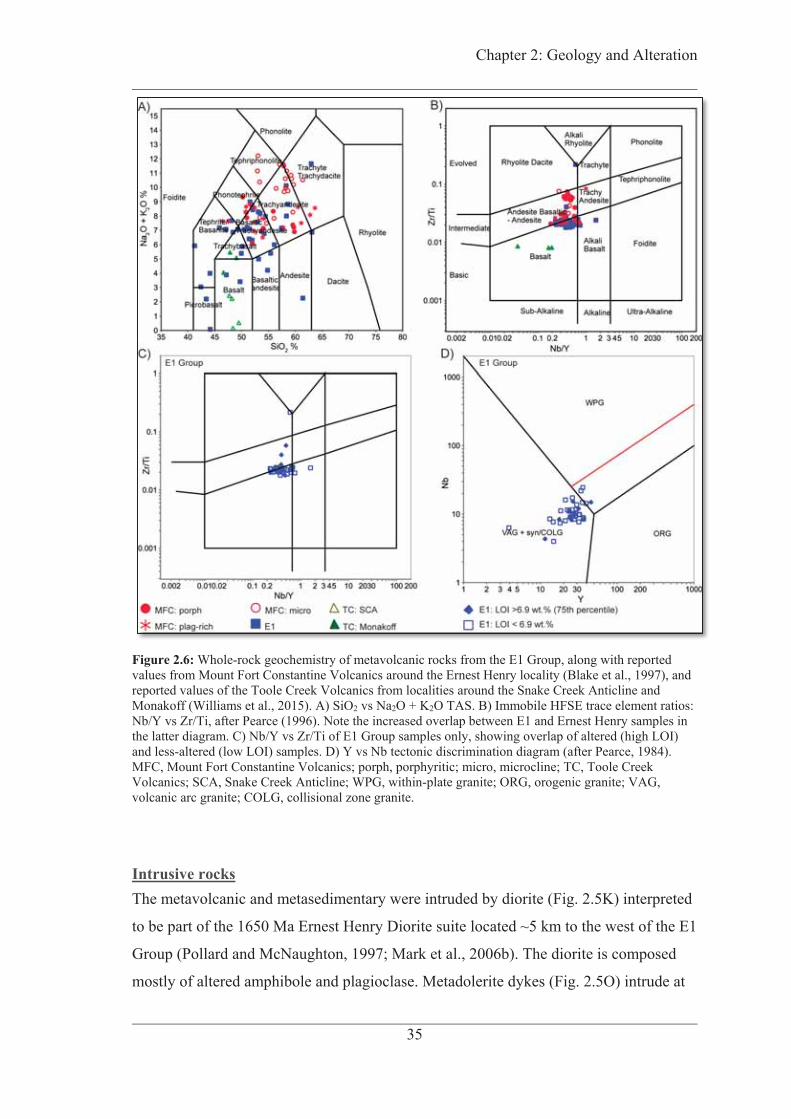
Chapter 2: Geology and Alteration
35
Figure 2.6: Whole-rock geochemistry of metavolcanic rocks from the E1 Group, along with reported values from Mount Fort Constantine Volcanics around the Ernest Henry locality (Blake et al., 1997), and reported values of the Toole Creek Volcanics from localities around the Snake Creek Anticline and Monakoff (Williams et al., 2015). A) SiO2 vs Na2O + K2O TAS. B) Immobile HFSE trace element ratios: Nb/Y vs Zr/Ti, after Pearce (1996). Note the increased overlap between E1 and Ernest Henry samples in the latter diagram. C) Nb/Y vs Zr/Ti of E1 Group samples only, showing overlap of altered (high LOI) and less-altered (low LOI) samples. D) Y vs Nb tectonic discrimination diagram (after Pearce, 1984). MFC, Mount Fort Constantine Volcanics; porph, porphyritic; micro, microcline; TC, Toole Creek Volcanics; SCA, Snake Creek Anticline; WPG, within-plate granite; ORG, orogenic granite; VAG, volcanic arc granite; COLG, collisional zone granite.
Intrusive rocks The metavolcanic and metasedimentary were intruded by diorite (Fig. 2.5K) interpreted
to be part of the 1650 Ma Ernest Henry Diorite suite located ~5 km to the west of the E1
Group (Pollard and McNaughton, 1997; Mark et al., 2006b). The diorite is composed
mostly of altered amphibole and plagioclase. Metadolerite dykes (Fig. 2.5O) intrude at
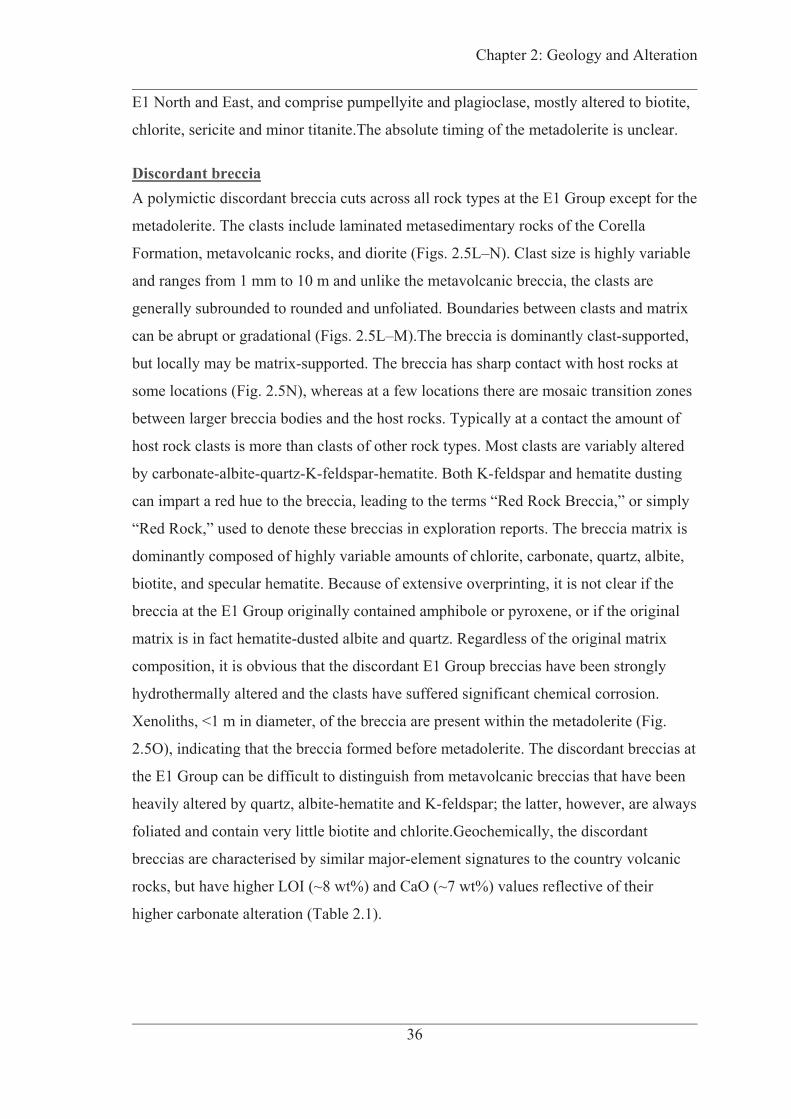
Chapter 2: Geology and Alteration
36
E1 North and East, and comprise pumpellyite and plagioclase, mostly altered to biotite,
chlorite, sericite and minor titanite.The absolute timing of the metadolerite is unclear.
Discordant breccia A polymictic discordant breccia cuts across all rock types at the E1 Group except for the
metadolerite. The clasts include laminated metasedimentary rocks of the Corella
Formation, metavolcanic rocks, and diorite (Figs. 2.5L–N). Clast size is highly variable
and ranges from 1 mm to 10 m and unlike the metavolcanic breccia, the clasts are
generally subrounded to rounded and unfoliated. Boundaries between clasts and matrix
can be abrupt or gradational (Figs. 2.5L–M).The breccia is dominantly clast-supported,
but locally may be matrix-supported. The breccia has sharp contact with host rocks at
some locations (Fig. 2.5N), whereas at a few locations there are mosaic transition zones
between larger breccia bodies and the host rocks. Typically at a contact the amount of
host rock clasts is more than clasts of other rock types. Most clasts are variably altered
by carbonate-albite-quartz-K-feldspar-hematite. Both K-feldspar and hematite dusting
can impart a red hue to the breccia, leading to the terms “Red Rock Breccia,” or simply
“Red Rock,” used to denote these breccias in exploration reports. The breccia matrix is
dominantly composed of highly variable amounts of chlorite, carbonate, quartz, albite,
biotite, and specular hematite. Because of extensive overprinting, it is not clear if the
breccia at the E1 Group originally contained amphibole or pyroxene, or if the original
matrix is in fact hematite-dusted albite and quartz. Regardless of the original matrix
composition, it is obvious that the discordant E1 Group breccias have been strongly
hydrothermally altered and the clasts have suffered significant chemical corrosion.
Xenoliths, <1 m in diameter, of the breccia are present within the metadolerite (Fig.
2.5O), indicating that the breccia formed before metadolerite. The discordant breccias at
the E1 Group can be difficult to distinguish from metavolcanic breccias that have been
heavily altered by quartz, albite-hematite and K-feldspar; the latter, however, are always
foliated and contain very little biotite and chlorite.Geochemically, the discordant
breccias are characterised by similar major-element signatures to the country volcanic
rocks, but have higher LOI (~8 wt%) and CaO (~7 wt%) values reflective of their
higher carbonate alteration (Table 2.1).
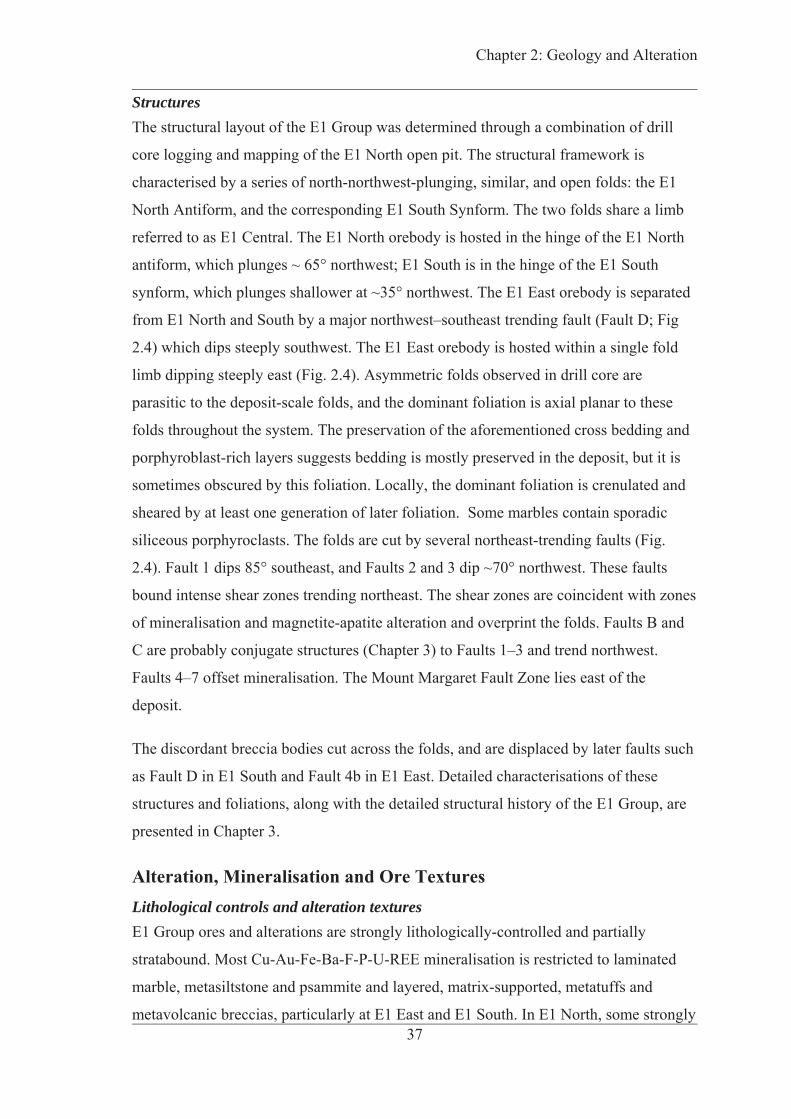
Chapter 2: Geology and Alteration
37
Structures The structural layout of the E1 Group was determined through a combination of drill
core logging and mapping of the E1 North open pit. The structural framework is
characterised by a series of north-northwest-plunging, similar, and open folds: the E1
North Antiform, and the corresponding E1 South Synform. The two folds share a limb
referred to as E1 Central. The E1 North orebody is hosted in the hinge of the E1 North
antiform, which plunges ~ 65° northwest; E1 South is in the hinge of the E1 South
synform, which plunges shallower at ~35° northwest. The E1 East orebody is separated
from E1 North and South by a major northwest–southeast trending fault (Fault D; Fig
2.4) which dips steeply southwest. The E1 East orebody is hosted within a single fold
limb dipping steeply east (Fig. 2.4). Asymmetric folds observed in drill core are
parasitic to the deposit-scale folds, and the dominant foliation is axial planar to these
folds throughout the system. The preservation of the aforementioned cross bedding and
porphyroblast-rich layers suggests bedding is mostly preserved in the deposit, but it is
sometimes obscured by this foliation. Locally, the dominant foliation is crenulated and
sheared by at least one generation of later foliation. Some marbles contain sporadic
siliceous porphyroclasts. The folds are cut by several northeast-trending faults (Fig.
2.4). Fault 1 dips 85° southeast, and Faults 2 and 3 dip ~70° northwest. These faults
bound intense shear zones trending northeast. The shear zones are coincident with zones
of mineralisation and magnetite-apatite alteration and overprint the folds. Faults B and
C are probably conjugate structures (Chapter 3) to Faults 1–3 and trend northwest.
Faults 4–7 offset mineralisation. The Mount Margaret Fault Zone lies east of the
deposit.
The discordant breccia bodies cut across the folds, and are displaced by later faults such
as Fault D in E1 South and Fault 4b in E1 East. Detailed characterisations of these
structures and foliations, along with the detailed structural history of the E1 Group, are
presented in Chapter 3.
Alteration, Mineralisation and Ore Textures Lithological controls and alteration textures E1 Group ores and alterations are strongly lithologically-controlled and partially
stratabound. Most Cu-Au-Fe-Ba-F-P-U-REE mineralisation is restricted to laminated
marble, metasiltstone and psammite and layered, matrix-supported, metatuffs and
metavolcanic breccias, particularly at E1 East and E1 South. In E1 North, some strongly

Chapter 2: Geology and Alteration
38
sheared coherent metavolcanic rocks and clast-supported metavolcanic breccias are also
mineralised; however, the coherent metavolcanic rocks are generally barren. Ore grades
are generally the highest in thinly-layered or laminated protoliths with relatively few
clasts. At E1 North some of this layering is interpreted to represent foliation (e.g. Fig.
2.7F), though away from the core of the orebody, and at E1 South, primary bedding is
preserved.
E1 Group ores and alterations are typified by replacements; veins are less common. The
euhedral, granular, and fine (<100μm)- to medium (~250μm)-grained magnetite ±
carbonate (-Fe-Mg-Mn) ± barite ± fluorite ± biotite ± chlorite ± chalcopyrite ± apatite
alteration dominant in the ore zones (Figs. 2.7D; 2.8B; 2.9A–E) is layer-controlled in
layered rocks (Fig. 2.7A–C), and matrix-controlled in metavolcanic breccias (Fig.
2.7H). The layer-controlled alteration in the metasedimentary rocks is typically defined
by carbonate or quartz-albite(-hematite)-rich layers (lighter color) alternating with
carbonate-magnetite-biotite-sulfide-rich layers with darker color (Fig. 2.7A–B). Less-
commonly, euhedral magnetite, pyrite and arsenopyrite alteration can form sporadic
crystals greater than 3 mm in diameter, and tend to form in layers. In the
metasedimentary-volcaniclastic rocks, replacement becomes texturally-destructive as
alteration intensity increases, eventually forming massive, coarse-grained (>500 μm)
granular magnetite and sulfide alteration which obliterates original layering (Fig. 2.7B,
L). In the metavolcanic breccias most sulfides occur in the matrix, while the clasts are
magnetite-rich; in some instances, the rims of the clasts are depleted in magnetite and
are sericite-rich (Fig. 2.7H). Alteration in metasiltstones is generally finer-grained
(~100–250 μm) and strongly layer-controlled.
In weakly-altered coherent metavolcanic rocks, magnetite-sericite-biotite ± carbonate
alteration is typically disseminated; plagioclase phenocrysts may be preferentially
albitised. Magnetite alteration is focused at plagioclase and biotite grain boundaries in
more strongly-altered rocks (Fig. 2.8C). Chlorite alteration is ubiquitous and ranges
from localized patches to pervasive replacement of the groundmass. In heavily-
deformed metavolcanic rocks at E1 North, alteration follows biotite-muscovite shear
fabric (Fig. 2.8A). Magnetite-sulfide-rich replacement in coherent volcanic rocks is
generally only intense within <5 m from their contacts with metasedimentary rocks and
metavolcanic breccias that are also intensely altered; the exception to this is when the
coherent metavolcanic rocks are proximal (< ~10 m) to the E1 North Shear Zone. Some

Chapter 2: Geology and Alteration
39
coherent metavolcanic rocks are pervasively albite (-hematite)-altered; such rocks are
generally devoid of magnetite and sulfides. The more intensely-albitised rocks are
generally massive, but relict porphyritic and amygdaloidal textures may be preserved.
These alteration styles are also observed at the E8 target, where magnetite-apatite-
pyrite-quartz-chlorite-carbonate ± chalcopyrite alteration is focused mainly in sporadic
intercalations of clastic metavolcanic breccia; the coherent volcanics are less altered by
disseminations of these same minerals.
Significant mineralisation also occurs as carbonate ± quartz ± barite ± fluorite
dominated veins and localised breccias (Fig. 2.7J–K); these minerals comprise multiple
paragenetic stages (see Paragenetic Sequence below). The veins vary in size from <0.5
mm up to 3 m wide. Vein intensity is the greatest in coherent metavolcanic rocks, likely
due to their more brittle rheology. Veins in these rocks, however, tend to be mostly Cu-
Au-barren, and instead contain only minor sulfide in the form of pyrite. The halos of the
veins typically contain pyrite, magnetite, carbonate, chlorite and/or sericite. Petrography
reveals that layer-parallel to layer-subparallel microveins may also be present (Fig.
2.8B).

Chapter 2: Geology and Alteration
40
Figure 2.7: E1 Group ore textures. A) Fine-grained layer-controlled magnetite alteration of marble. B) Coarse-grained layer-controlled alteration of marble and psammitic layers. It is not certain if the layering is primary or tectonic. C) Fine-grained magnetite-pyrite ± chalcopyrite alteration of lathy porphyroblasts in calcareous? metasediment. The original mineral is not preserved but presumably was an amphibole. Groundmass is mostly biotite and chlorite. D) Carbonate-fluorite-barite ± chalcopyrite vein associated with laminated rock completely altered by the same assemblage, plus earlier magnetite. Whole-rock geochemistry indicates that barite content of the laminated domain is over 20 wt%. E) Large, Stage 2a apatite crystals interstitial with magnetite and pyrite. Carbonate and chalcopyrite are Stage 2c and 3 overprints. The calcite vein in the lower-right is Stage 3. The intensity of the apatite-magnetite is typically somewhat gradational, suggesting an alteration texture. Figure continued on the next page.
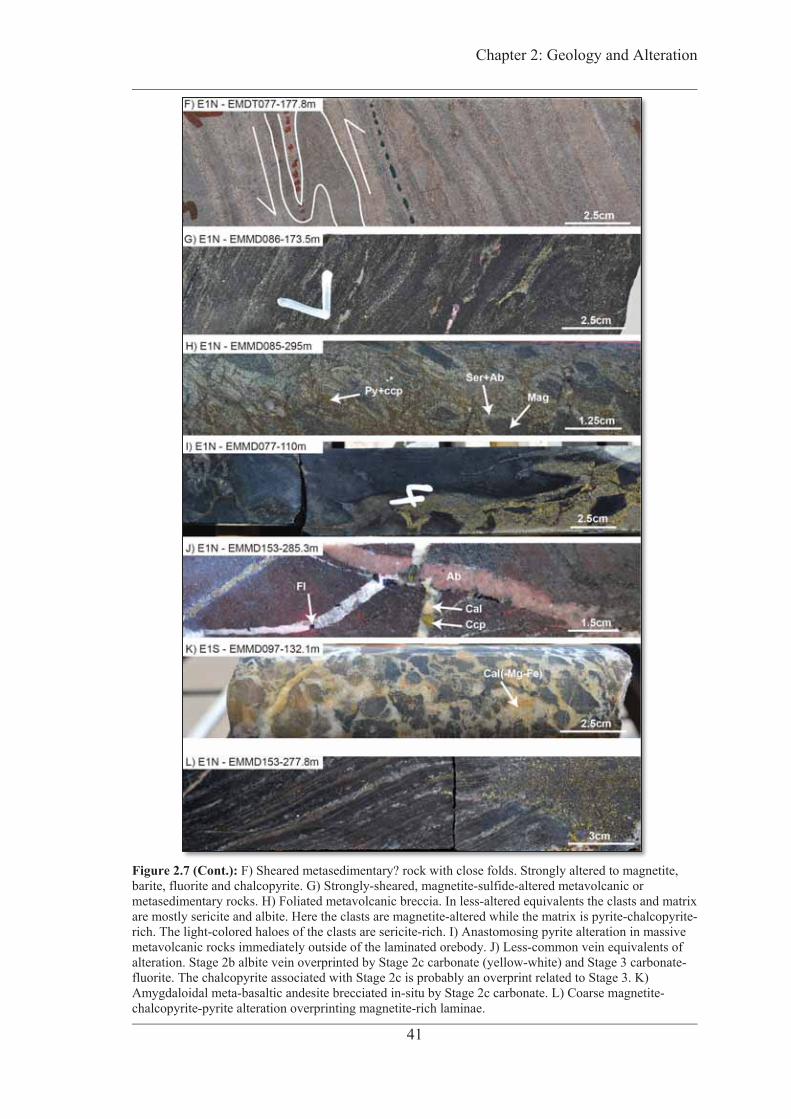
Chapter 2: Geology and Alteration
41
Figure 2.7 (Cont.): F) Sheared metasedimentary? rock with close folds. Strongly altered to magnetite, barite, fluorite and chalcopyrite. G) Strongly-sheared, magnetite-sulfide-altered metavolcanic or metasedimentary rocks. H) Foliated metavolcanic breccia. In less-altered equivalents the clasts and matrix are mostly sericite and albite. Here the clasts are magnetite-altered while the matrix is pyrite-chalcopyrite-rich. The light-colored haloes of the clasts are sericite-rich. I) Anastomosing pyrite alteration in massive metavolcanic rocks immediately outside of the laminated orebody. J) Less-common vein equivalents of alteration. Stage 2b albite vein overprinted by Stage 2c carbonate (yellow-white) and Stage 3 carbonate-fluorite. The chalcopyrite associated with Stage 2c is probably an overprint related to Stage 3. K) Amygdaloidal meta-basaltic andesite brecciated in-situ by Stage 2c carbonate. L) Coarse magnetite-chalcopyrite-pyrite alteration overprinting magnetite-rich laminae.
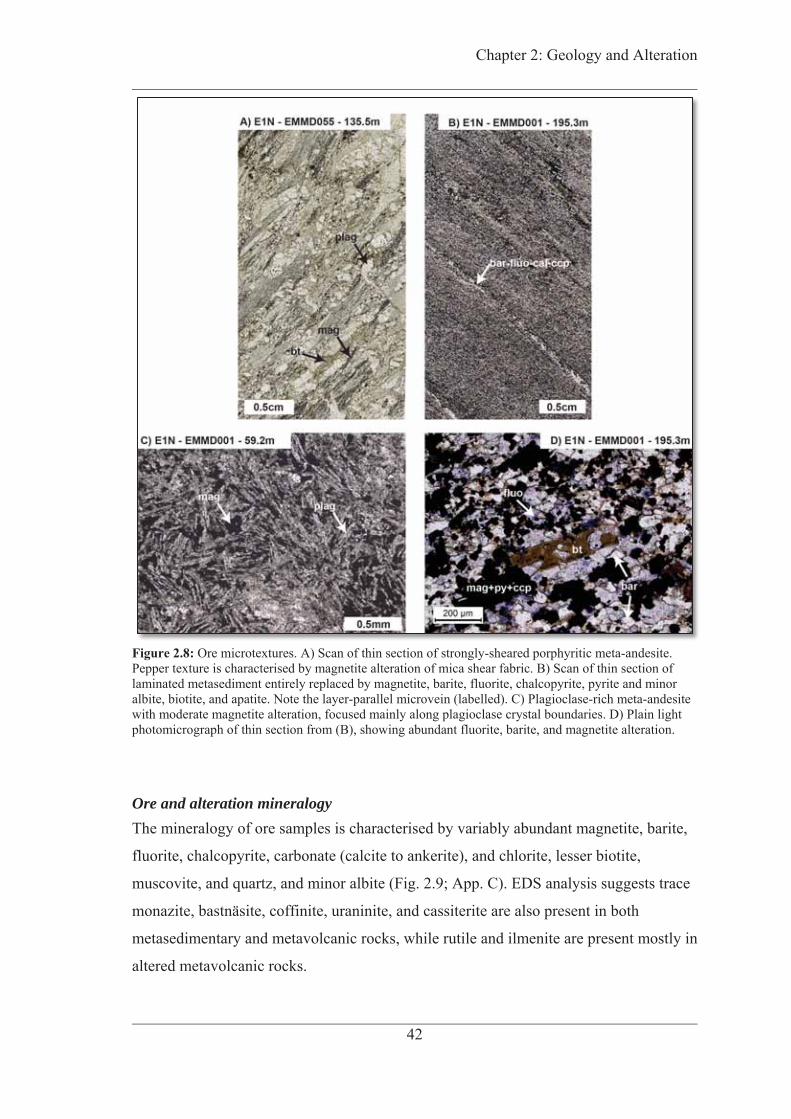
Chapter 2: Geology and Alteration
42
Figure 2.8: Ore microtextures. A) Scan of thin section of strongly-sheared porphyritic meta-andesite. Pepper texture is characterised by magnetite alteration of mica shear fabric. B) Scan of thin section of laminated metasediment entirely replaced by magnetite, barite, fluorite, chalcopyrite, pyrite and minor albite, biotite, and apatite. Note the layer-parallel microvein (labelled). C) Plagioclase-rich meta-andesite with moderate magnetite alteration, focused mainly along plagioclase crystal boundaries. D) Plain light photomicrograph of thin section from (B), showing abundant fluorite, barite, and magnetite alteration.
Ore and alteration mineralogy The mineralogy of ore samples is characterised by variably abundant magnetite, barite,
fluorite, chalcopyrite, carbonate (calcite to ankerite), and chlorite, lesser biotite,
muscovite, and quartz, and minor albite (Fig. 2.9; App. C). EDS analysis suggests trace
monazite, bastnäsite, coffinite, uraninite, and cassiterite are also present in both
metasedimentary and metavolcanic rocks, while rutile and ilmenite are present mostly in
altered metavolcanic rocks.
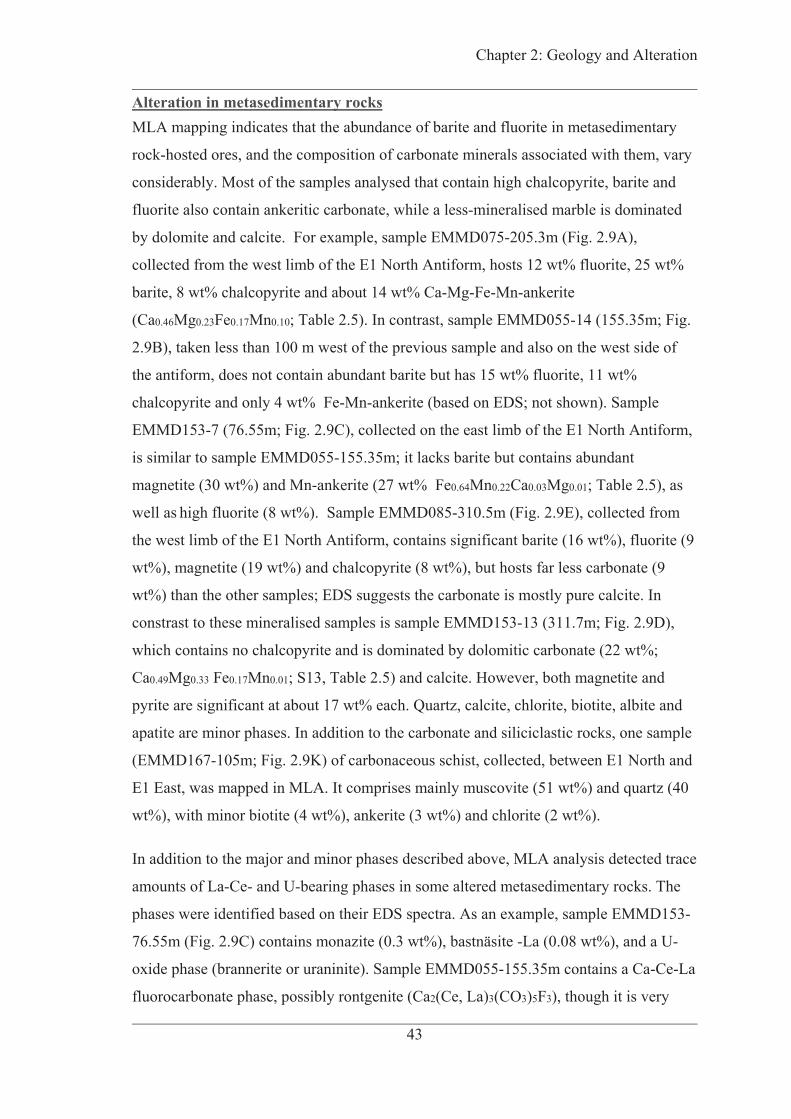
Chapter 2: Geology and Alteration
43
Alteration in metasedimentary rocks MLA mapping indicates that the abundance of barite and fluorite in metasedimentary
rock-hosted ores, and the composition of carbonate minerals associated with them, vary
considerably. Most of the samples analysed that contain high chalcopyrite, barite and
fluorite also contain ankeritic carbonate, while a less-mineralised marble is dominated
by dolomite and calcite. For example, sample EMMD075-205.3m (Fig. 2.9A),
collected from the west limb of the E1 North Antiform, hosts 12 wt% fluorite, 25 wt%
barite, 8 wt% chalcopyrite and about 14 wt% Ca-Mg-Fe-Mn-ankerite
(Ca0.46Mg0.23Fe0.17Mn0.10; Table 2.5). In contrast, sample EMMD055-14 (155.35m; Fig.
2.9B), taken less than 100 m west of the previous sample and also on the west side of
the antiform, does not contain abundant barite but has 15 wt% fluorite, 11 wt%
chalcopyrite and only 4 wt% Fe-Mn-ankerite (based on EDS; not shown). Sample
EMMD153-7 (76.55m; Fig. 2.9C), collected on the east limb of the E1 North Antiform,
is similar to sample EMMD055-155.35m; it lacks barite but contains abundant
magnetite (30 wt%) and Mn-ankerite (27 wt% Fe0.64Mn0.22Ca0.03Mg0.01; Table 2.5), as
well as high fluorite (8 wt%). Sample EMMD085-310.5m (Fig. 2.9E), collected from
the west limb of the E1 North Antiform, contains significant barite (16 wt%), fluorite (9
wt%), magnetite (19 wt%) and chalcopyrite (8 wt%), but hosts far less carbonate (9
wt%) than the other samples; EDS suggests the carbonate is mostly pure calcite. In
constrast to these mineralised samples is sample EMMD153-13 (311.7m; Fig. 2.9D),
which contains no chalcopyrite and is dominated by dolomitic carbonate (22 wt%;
Ca0.49Mg0.33 Fe0.17Mn0.01; S13, Table 2.5) and calcite. However, both magnetite and
pyrite are significant at about 17 wt% each. Quartz, calcite, chlorite, biotite, albite and
apatite are minor phases. In addition to the carbonate and siliciclastic rocks, one sample
(EMMD167-105m; Fig. 2.9K) of carbonaceous schist, collected, between E1 North and
E1 East, was mapped in MLA. It comprises mainly muscovite (51 wt%) and quartz (40
wt%), with minor biotite (4 wt%), ankerite (3 wt%) and chlorite (2 wt%).
In addition to the major and minor phases described above, MLA analysis detected trace
amounts of La-Ce- and U-bearing phases in some altered metasedimentary rocks. The
phases were identified based on their EDS spectra. As an example, sample EMMD153-
76.55m (Fig. 2.9C) contains monazite (0.3 wt%), bastnäsite -La (0.08 wt%), and a U-
oxide phase (brannerite or uraninite). Sample EMMD055-155.35m contains a Ca-Ce-La
fluorocarbonate phase, possibly rontgenite (Ca2(Ce, La)3(CO3)5F3), though it is very
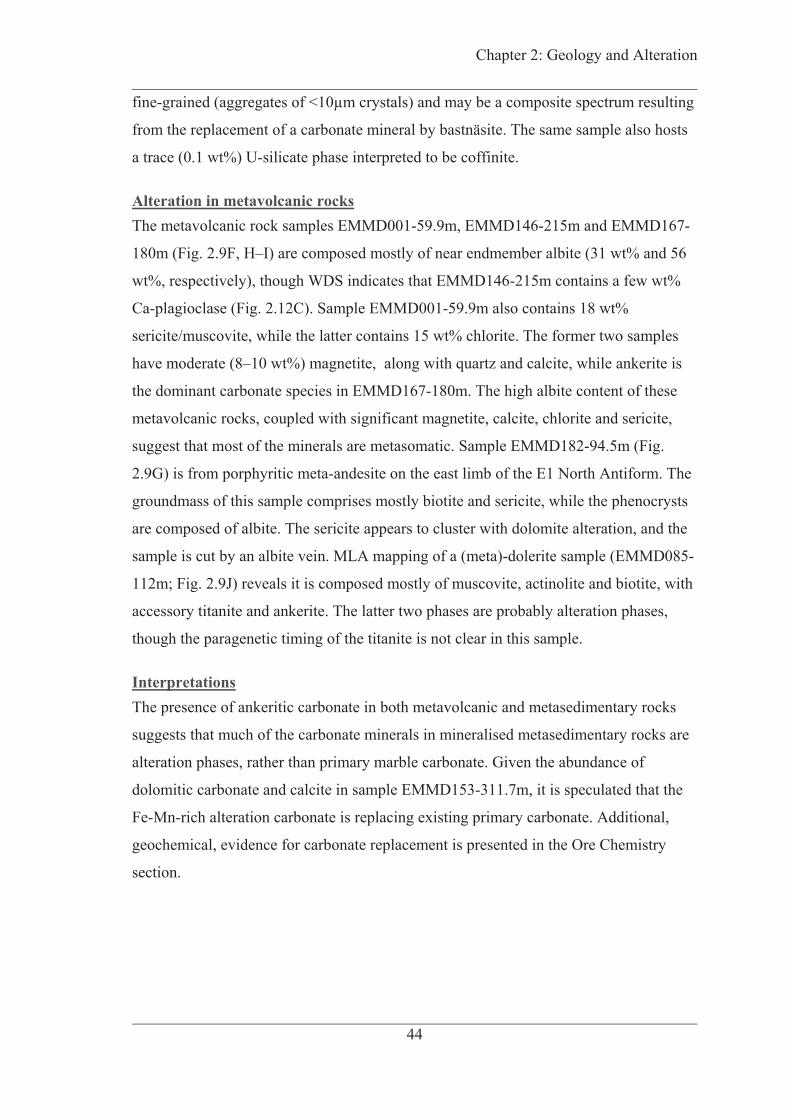
Chapter 2: Geology and Alteration
44
fine-grained (aggregates of <10μm crystals) and may be a composite spectrum resulting
from the replacement of a carbonate mineral by bastnäsite. The same sample also hosts
a trace (0.1 wt%) U-silicate phase interpreted to be coffinite.
Alteration in metavolcanic rocks The metavolcanic rock samples EMMD001-59.9m, EMMD146-215m and EMMD167-
180m (Fig. 2.9F, H–I) are composed mostly of near endmember albite (31 wt% and 56
wt%, respectively), though WDS indicates that EMMD146-215m contains a few wt%
Ca-plagioclase (Fig. 2.12C). Sample EMMD001-59.9m also contains 18 wt%
sericite/muscovite, while the latter contains 15 wt% chlorite. The former two samples
have moderate (8–10 wt%) magnetite, along with quartz and calcite, while ankerite is
the dominant carbonate species in EMMD167-180m. The high albite content of these
metavolcanic rocks, coupled with significant magnetite, calcite, chlorite and sericite,
suggest that most of the minerals are metasomatic. Sample EMMD182-94.5m (Fig.
2.9G) is from porphyritic meta-andesite on the east limb of the E1 North Antiform. The
groundmass of this sample comprises mostly biotite and sericite, while the phenocrysts
are composed of albite. The sericite appears to cluster with dolomite alteration, and the
sample is cut by an albite vein. MLA mapping of a (meta)-dolerite sample (EMMD085-
112m; Fig. 2.9J) reveals it is composed mostly of muscovite, actinolite and biotite, with
accessory titanite and ankerite. The latter two phases are probably alteration phases,
though the paragenetic timing of the titanite is not clear in this sample.
Interpretations The presence of ankeritic carbonate in both metavolcanic and metasedimentary rocks
suggests that much of the carbonate minerals in mineralised metasedimentary rocks are
alteration phases, rather than primary marble carbonate. Given the abundance of
dolomitic carbonate and calcite in sample EMMD153-311.7m, it is speculated that the
Fe-Mn-rich alteration carbonate is replacing existing primary carbonate. Additional,
geochemical, evidence for carbonate replacement is presented in the Ore Chemistry
section.

Chapter 2: Geology and Alteration
45
Figure 2.9: Ore textures observed in Mineral Liberation Analysis (MLA) maps of two distinct ore samples. All abundances are wt%. A) Barite-rich ore from the deeper, barite-rich zone of the E1 North orebody (see Fig. 2.20). B) Barite-poor ore from upper portion of E1 North orebody. Continued on next three pages.

Chapter 2: Geology and Alteration
46
Figure 2.9 (cont): C) Marble? sample from Mn-F-rich zone in upper E1 North orebody (see Fig. 2.20). D) Less-altered marble downhole from the sample in C. E) Barite-fluorite-quarzt-rich ore from deeper part of E1 North orebody.
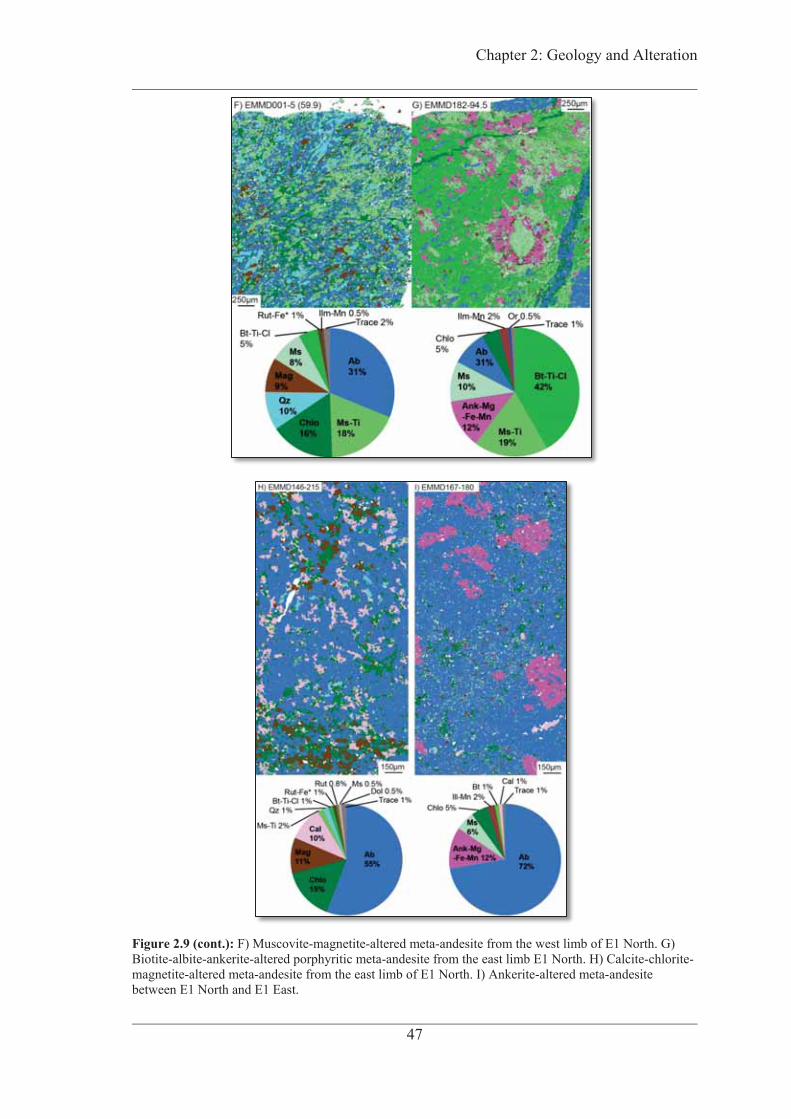
Chapter 2: Geology and Alteration
47
Figure 2.9 (cont.): F) Muscovite-magnetite-altered meta-andesite from the west limb of E1 North. G) Biotite-albite-ankerite-altered porphyritic meta-andesite from the east limb E1 North. H) Calcite-chlorite-magnetite-altered meta-andesite from the east limb of E1 North. I) Ankerite-altered meta-andesite between E1 North and E1 East.

Chapter 2: Geology and Alteration
48
Figure 2.9 (cont.): J) (Meta)-dolerite. K) Carbonaceous muscovite schist between E1 North and E1 East; note that the carbon was likely too fine-grained to be mapped by this method.
Paragenetic Sequence Alteration at the E1 Group is complex, and is grouped into three major paragenetic
stages, with the second, pre-ore, stage comprising three substages (Figs. 2.10–2.11).
The stages are: 1) early sodic-(-calcic), 2a) precursor ferric/ferrous-potassic-silicic, 2b)
intermediate sodic (-Ti), 2c) early carbonate (-Fe-Mg) flooding and mineralisation, and
3) main Cu-Au-carbonate (-Fe-Mn)- barite-fluorite-U-REE mineralisation. This
sequence was also observed at the nearby E8 target.
Stage 1: Early Na-(Ca) alteration: All of the host rocks within the mine lease (at least 2 km from the orebody) are variably
altered by albite (Figs. 2.11A–B, I; 2.9G–I) and, to a lesser extent, quartz, actinolite,
and titanite; the latter two minerals are rare and are only locally abundant in
metadolerite (Fig. 2.9J), diorite and discordant breccia. Red hematite dusting overprints
the albite as a late substage (Fig. 2.11A–B and I). Stage 1 alteration is most abundant in
the discordant breccia, with the assemblage replacing both the infill and the clasts (Fig.
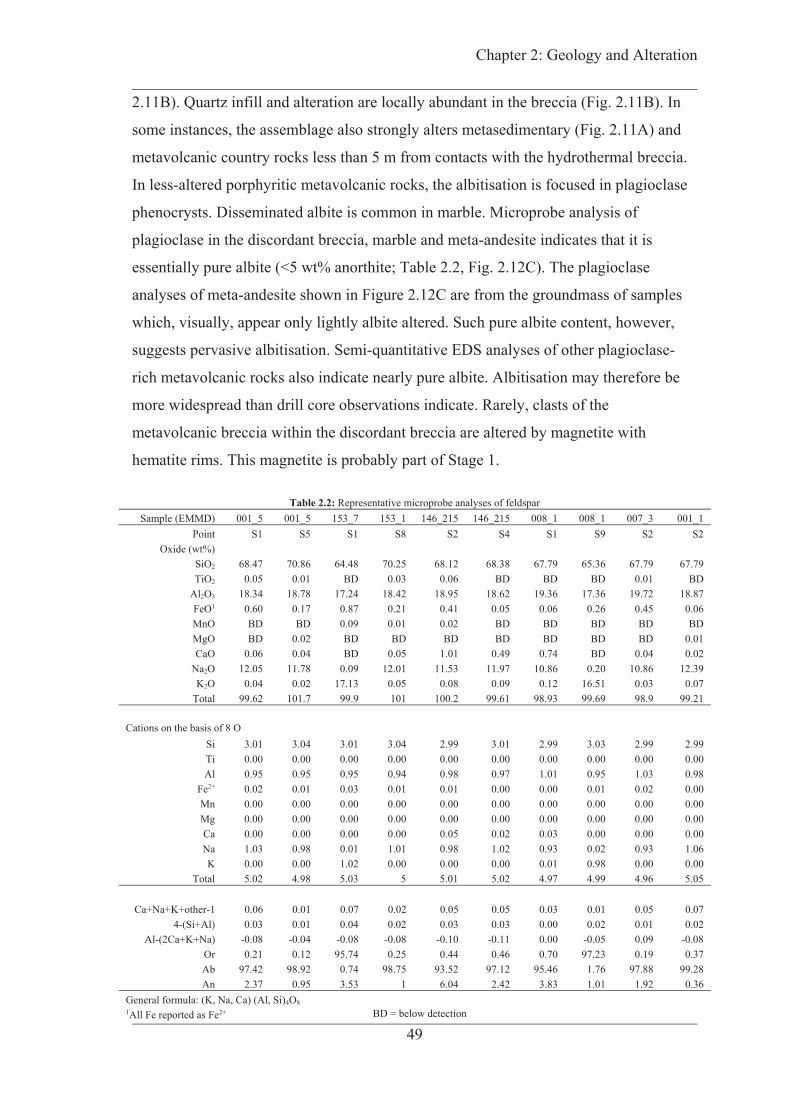
Chapter 2: Geology and Alteration
49
2.11B). Quartz infill and alteration are locally abundant in the breccia (Fig. 2.11B). In
some instances, the assemblage also strongly alters metasedimentary (Fig. 2.11A) and
metavolcanic country rocks less than 5 m from contacts with the hydrothermal breccia.
In less-altered porphyritic metavolcanic rocks, the albitisation is focused in plagioclase
phenocrysts. Disseminated albite is common in marble. Microprobe analysis of
plagioclase in the discordant breccia, marble and meta-andesite indicates that it is
essentially pure albite (<5 wt% anorthite; Table 2.2, Fig. 2.12C). The plagioclase
analyses of meta-andesite shown in Figure 2.12C are from the groundmass of samples
which, visually, appear only lightly albite altered. Such pure albite content, however,
suggests pervasive albitisation. Semi-quantitative EDS analyses of other plagioclase-
rich metavolcanic rocks also indicate nearly pure albite. Albitisation may therefore be
more widespread than drill core observations indicate. Rarely, clasts of the
metavolcanic breccia within the discordant breccia are altered by magnetite with
hematite rims. This magnetite is probably part of Stage 1.
Table 2.2: Representative microprobe analyses of feldspar Sample (EMMD) 001_5 001_5 153_7 153_1 146_215 146_215 008_1 008_1 007_3 001_1
Point S1 S5 S1 S8 S2 S4 S1 S9 S2 S2 Oxide (wt%)
SiO2 68.47 70.86 64.48 70.25 68.12 68.38 67.79 65.36 67.79 67.79 TiO2 0.05 0.01 BD 0.03 0.06 BD BD BD 0.01 BD
Al2O3 18.34 18.78 17.24 18.42 18.95 18.62 19.36 17.36 19.72 18.87 FeO1 0.60 0.17 0.87 0.21 0.41 0.05 0.06 0.26 0.45 0.06 MnO BD BD 0.09 0.01 0.02 BD BD BD BD BD MgO BD 0.02 BD BD BD BD BD BD BD 0.01 CaO 0.06 0.04 BD 0.05 1.01 0.49 0.74 BD 0.04 0.02
Na2O 12.05 11.78 0.09 12.01 11.53 11.97 10.86 0.20 10.86 12.39 K2O 0.04 0.02 17.13 0.05 0.08 0.09 0.12 16.51 0.03 0.07
Total 99.62 101.7 99.9 101 100.2 99.61 98.93 99.69 98.9 99.21
Cations on the basis of 8 O Si 3.01 3.04 3.01 3.04 2.99 3.01 2.99 3.03 2.99 2.99 Ti 0.00 0.00 0.00 0.00 0.00 0.00 0.00 0.00 0.00 0.00 Al 0.95 0.95 0.95 0.94 0.98 0.97 1.01 0.95 1.03 0.98
Fe2+ 0.02 0.01 0.03 0.01 0.01 0.00 0.00 0.01 0.02 0.00 Mn 0.00 0.00 0.00 0.00 0.00 0.00 0.00 0.00 0.00 0.00 Mg 0.00 0.00 0.00 0.00 0.00 0.00 0.00 0.00 0.00 0.00 Ca 0.00 0.00 0.00 0.00 0.05 0.02 0.03 0.00 0.00 0.00 Na 1.03 0.98 0.01 1.01 0.98 1.02 0.93 0.02 0.93 1.06 K 0.00 0.00 1.02 0.00 0.00 0.00 0.01 0.98 0.00 0.00
Total 5.02 4.98 5.03 5 5.01 5.02 4.97 4.99 4.96 5.05
Ca+Na+K+other-1 0.06 0.01 0.07 0.02 0.05 0.05 0.03 0.01 0.05 0.07 4-(Si+Al) 0.03 0.01 0.04 0.02 0.03 0.03 0.00 0.02 0.01 0.02
Al-(2Ca+K+Na) -0.08 -0.04 -0.08 -0.08 -0.10 -0.11 0.00 -0.05 0.09 -0.08 Or 0.21 0.12 95.74 0.25 0.44 0.46 0.70 97.23 0.19 0.37 Ab 97.42 98.92 0.74 98.75 93.52 97.12 95.46 1.76 97.88 99.28 An 2.37 0.95 3.53 1 6.04 2.42 3.83 1.01 1.92 0.36
General formula: (K, Na, Ca) (Al, Si)4O8 1All Fe reported as Fe2+ BD = below detection

Chapter 2: Geology and Alteration
50
Figure 2.10: E1 Group paragenetic sequence, with equivalent Ernest Henry (Mark et al., 2006b) and Monakoff (Williams et al., 2015) stages shown . Bar thickness corresponds to relative abundance. Dashed line indicates uncertain timing. *Indicates phases identified in Williams et al. (2015).
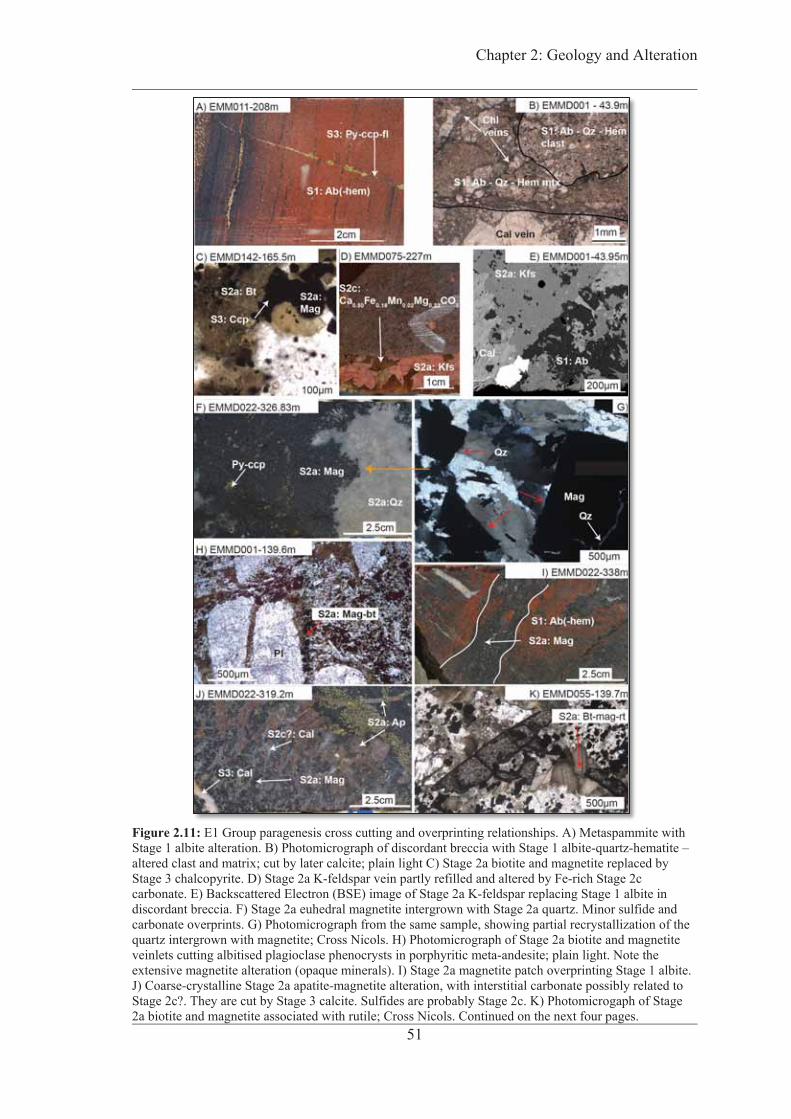
Chapter 2: Geology and Alteration
51
Figure 2.11: E1 Group paragenesis cross cutting and overprinting relationships. A) Metaspammite with Stage 1 albite alteration. B) Photomicrograph of discordant breccia with Stage 1 albite-quartz-hematite –altered clast and matrix; cut by later calcite; plain light C) Stage 2a biotite and magnetite replaced by Stage 3 chalcopyrite. D) Stage 2a K-feldspar vein partly refilled and altered by Fe-rich Stage 2c carbonate. E) Backscattered Electron (BSE) image of Stage 2a K-feldspar replacing Stage 1 albite in discordant breccia. F) Stage 2a euhedral magnetite intergrown with Stage 2a quartz. Minor sulfide and carbonate overprints. G) Photomicrograph from the same sample, showing partial recrystallization of the quartz intergrown with magnetite; Cross Nicols. H) Photomicrograph of Stage 2a biotite and magnetite veinlets cutting albitised plagioclase phenocrysts in porphyritic meta-andesite; plain light. Note the extensive magnetite alteration (opaque minerals). I) Stage 2a magnetite patch overprinting Stage 1 albite. J) Coarse-crystalline Stage 2a apatite-magnetite alteration, with interstitial carbonate possibly related to Stage 2c?. They are cut by Stage 3 calcite. Sulfides are probably Stage 2c. K) Photomicrogaph of Stage 2a biotite and magnetite associated with rutile; Cross Nicols. Continued on the next four pages.

Chapter 2: Geology and Alteration
52
Figure 2.11 (cont.): L) Stage 2b albite veinlets overprinting Stage 2a magnetite; both are cut by Stage 3 carbonate-fluorite veins. M) Photomicrograph of Stage 2b albite cutting Stage 2a magnetite-altered meta-andesite. N) Coarse-crystalline, Stage 2c, magnetite-pyrite-carbonate alteration. O) Stage 2c carbonate vein in discordant breccia, with obvious magnetite-pyrite alteration halo. P) Coarse-crystalline, Stage 2c, magnetite-pyrite-carbonate alteration overprinting a Stage 2a quartz vein and finer-grained Stage 2a magnetite. Q) Stage 2c carbonate-magnetite infill in meta-andesite.
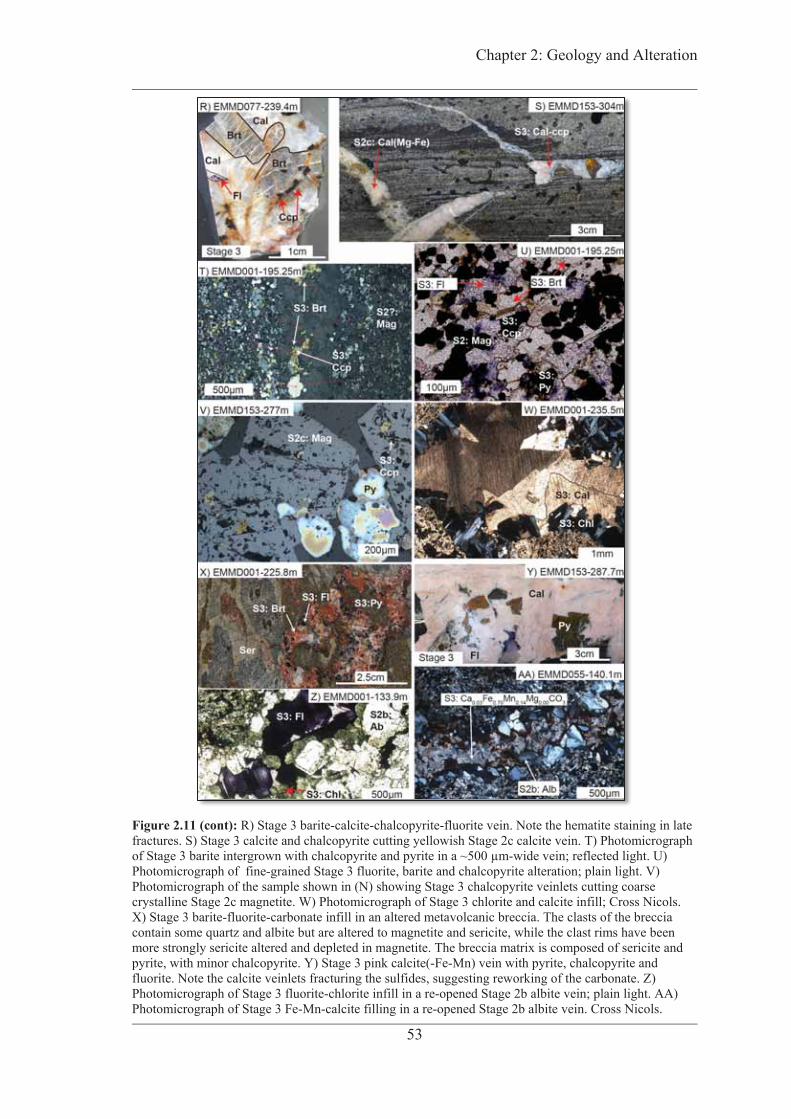
Chapter 2: Geology and Alteration
53
Figure 2.11 (cont): R) Stage 3 barite-calcite-chalcopyrite-fluorite vein. Note the hematite staining in late fractures. S) Stage 3 calcite and chalcopyrite cutting yellowish Stage 2c calcite vein. T) Photomicrograph of Stage 3 barite intergrown with chalcopyrite and pyrite in a ~500 μm-wide vein; reflected light. U) Photomicrograph of fine-grained Stage 3 fluorite, barite and chalcopyrite alteration; plain light. V) Photomicrograph of the sample shown in (N) showing Stage 3 chalcopyrite veinlets cutting coarse crystalline Stage 2c magnetite. W) Photomicrograph of Stage 3 chlorite and calcite infill; Cross Nicols. X) Stage 3 barite-fluorite-carbonate infill in an altered metavolcanic breccia. The clasts of the breccia contain some quartz and albite but are altered to magnetite and sericite, while the clast rims have been more strongly sericite altered and depleted in magnetite. The breccia matrix is composed of sericite and pyrite, with minor chalcopyrite. Y) Stage 3 pink calcite(-Fe-Mn) vein with pyrite, chalcopyrite and fluorite. Note the calcite veinlets fracturing the sulfides, suggesting reworking of the carbonate. Z) Photomicrograph of Stage 3 fluorite-chlorite infill in a re-opened Stage 2b albite vein; plain light. AA) Photomicrograph of Stage 3 Fe-Mn-calcite filling in a re-opened Stage 2b albite vein. Cross Nicols.

Chapter 2: Geology and Alteration
54
Figure 2.11 (cont.): AB) Photomicrograph of same sample showing Stage 3 fluorite filling in another Stage 2b albite vein; plain light. AC) Photomicrograph of same sample showing Stage 3 fluorite replacing Stage 2a biotite along cleavage planes; plain light. AD) Stage 3 calcite-fluorite vein cutting yellow-brown-weathered Stage 2c carbonate(-Fe-rich?). AE) Stage 3 pyrite and chalcopyrite overprinting a large (>1m) Stage 2c sideritic carbonate vein. AF) Stage 3 calcite-barite vein cutting across Stage 1 and 2-altered Discordant breccia. Note the disseminated sulfide alteration probably related to the veining. AG) BSE image of MLA-mapped sample EMMD055-155.35m, showing a barite veinlet cutting across chalcopyrite-magnetite alteration. AH) BSE image of bastnäsite intergrown with chalcopyrite. AI) BSE image from same sample showing U-oxide (uraninite?) inclusion in chalcopyrite. AJ) BSE image of a U-silicate (coffinite?) phase growning around magnetite alteration. AK) BSE image of the sample used for monazite U-Pb dating, showing Stage 3 dolomitic calcite-monazite veinlet cutting across Stage 2a apatite. Note the tiny monazite inclusions and veinlets in the apatite.

Chapter 2: Geology and Alteration
55
Stage 2a: Pre-mineralisation Fe-K-P-Si alteration The precursor ore stage is subdivided into three stages. Stage 2a, the ferric/ferrous-
potassic alteration stage, is characterised by magnetite (Fig. 2.11F–M), biotite (Fig.
2.11C, H, and K), apatite (Fig. 2.11J), K(-Ba)-feldspar (Fig. 2.11D–E), quartz (Fig.
2.11F–G), and pyrite (Fig. 2.11J) alteration. Rutile and ilmenite may also be present in
minor amounts (Fig. 2.11K). K(-Ba)-feldspar and specularite are most common in the
discordant breccia and metasedimentary rocks (Fig. 2.11E), while biotite, magnetite and
some hematite mainly alter the intermediate-mafic metavolcanic rocks and marble. The
discordant breccia is virtually devoid of magnetite. Some of the biotite and magnetite
may be igneous in origin, but the two minerals occur in veins that cut across these
rocks, indicating that much of the biotite and magnetite currently visible are
hydrothermal (Fig. 2.11H). Microprobe analysis indicates that Stage 2a biotite
composition varies significantly between the fluorannite and fluorophlogopite solution
series, but is generally fluorine-rich (up to 4% F) and contains up to 2% Cl (Table
2.3).The molar ratios of TiO2, FeO* (FeO + MnO), and MgO are displayed in Figure
2.12A. This type of ternary plot was demonstrated by Nachit et al. (2005) to
discriminate between magmatic biotite (domain A; Fig. 2.12A), biotite re-equlibrated
with hydrothermal fluids (neoformed; domain B), and hydrothermal biotite (domain C).
The latter has lower TiO2 (<1.5–2.0 mol%). All of the E1 Group biotite analysed plots
outside of the magmatic domain. Most crystals plot in the neoformed domain; one
analysis from a biotite veinlet and two replacement biotite crystals plot in the
hydrothermal domain. Microprobe analyses with totals <95 % were omitted from the
plot, as they are probably partly chloritized.
Biotite and K(-Ba)-feldspar alteration overprint both clasts and infill of discordant
breccia (Fig. 2.11B, E). The replacement of albite by K(-Ba)-feldspar and magnetite is
also common in albitised metapsammites. Coarse-grained (up to 5mm), euhedral
arsenopyrite is ubiquitous, but variable, in the carbonaceous metasiltstone at E1 South
and E1 East. The metasiltstone also hosts widespread magnetite alteration, and
arsenopyrite and magnetite may occur in the same samples. Arsenopyrite is cut by Stage
2c or 3 chalcopyrite veinlets and is interpreted to represent a spatial variation of Stage
2a sulfide species due to the more reducing nature of the carbonaceous host rocks. The
quartz is locally polycrystalline and characterised by microdeformation textures in the
form of undulating grain boundaries (Fig. 2.11G). In some places it appears to overprint
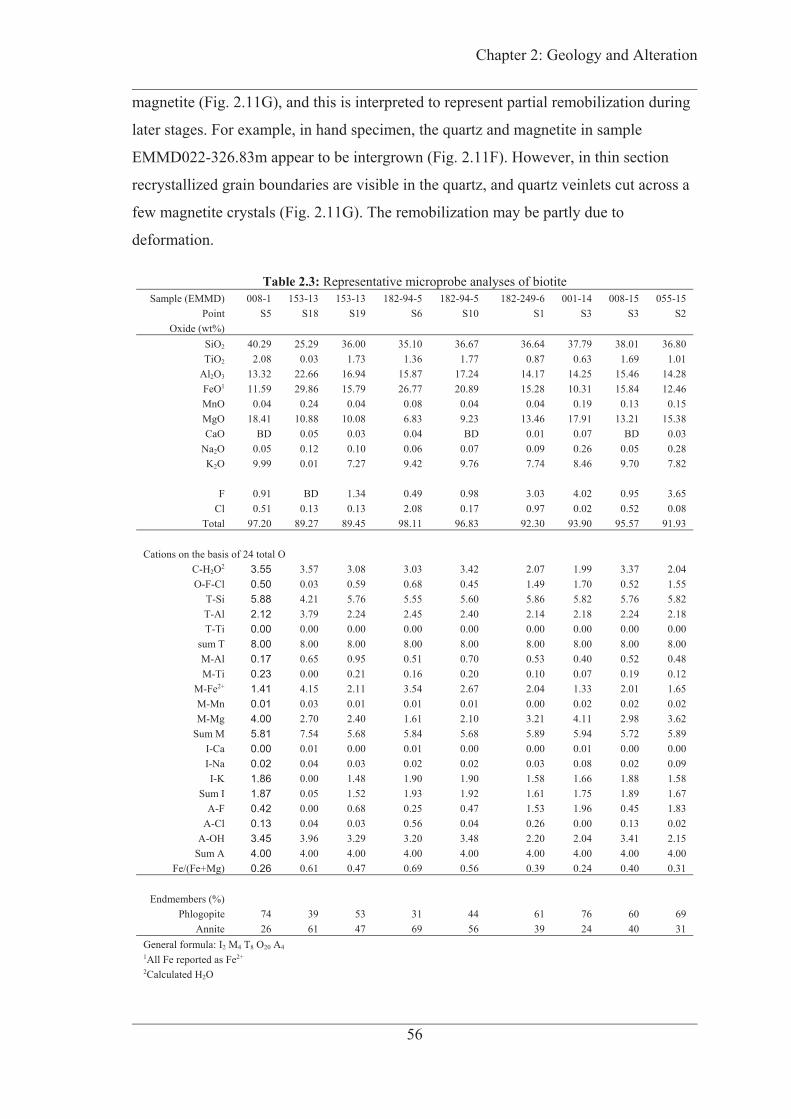
Chapter 2: Geology and Alteration
56
magnetite (Fig. 2.11G), and this is interpreted to represent partial remobilization during
later stages. For example, in hand specimen, the quartz and magnetite in sample
EMMD022-326.83m appear to be intergrown (Fig. 2.11F). However, in thin section
recrystallized grain boundaries are visible in the quartz, and quartz veinlets cut across a
few magnetite crystals (Fig. 2.11G). The remobilization may be partly due to
deformation.
Table 2.3: Representative microprobe analyses of biotite Sample (EMMD) 008-1 153-13 153-13 182-94-5 182-94-5 182-249-6 001-14 008-15 055-15
Point S5 S18 S19 S6 S10 S1 S3 S3 S2 Oxide (wt%)
SiO2 40.29 25.29 36.00 35.10 36.67 36.64 37.79 38.01 36.80 TiO2 2.08 0.03 1.73 1.36 1.77 0.87 0.63 1.69 1.01
Al2O3 13.32 22.66 16.94 15.87 17.24 14.17 14.25 15.46 14.28 FeO1 11.59 29.86 15.79 26.77 20.89 15.28 10.31 15.84 12.46 MnO 0.04 0.24 0.04 0.08 0.04 0.04 0.19 0.13 0.15 MgO 18.41 10.88 10.08 6.83 9.23 13.46 17.91 13.21 15.38 CaO BD 0.05 0.03 0.04 BD 0.01 0.07 BD 0.03
Na2O 0.05 0.12 0.10 0.06 0.07 0.09 0.26 0.05 0.28 K2O 9.99 0.01 7.27 9.42 9.76 7.74 8.46 9.70 7.82
F 0.91 BD 1.34 0.49 0.98 3.03 4.02 0.95 3.65
Cl 0.51 0.13 0.13 2.08 0.17 0.97 0.02 0.52 0.08 Total 97.20 89.27 89.45 98.11 96.83 92.30 93.90 95.57 91.93
Cations on the basis of 24 total O
C-H2O2 3.55 3.57 3.08 3.03 3.42 2.07 1.99 3.37 2.04 O-F-Cl 0.50 0.03 0.59 0.68 0.45 1.49 1.70 0.52 1.55
T-Si 5.88 4.21 5.76 5.55 5.60 5.86 5.82 5.76 5.82 T-Al 2.12 3.79 2.24 2.45 2.40 2.14 2.18 2.24 2.18 T-Ti 0.00 0.00 0.00 0.00 0.00 0.00 0.00 0.00 0.00
sum T 8.00 8.00 8.00 8.00 8.00 8.00 8.00 8.00 8.00 M-Al 0.17 0.65 0.95 0.51 0.70 0.53 0.40 0.52 0.48 M-Ti 0.23 0.00 0.21 0.16 0.20 0.10 0.07 0.19 0.12
M-Fe2+ 1.41 4.15 2.11 3.54 2.67 2.04 1.33 2.01 1.65 M-Mn 0.01 0.03 0.01 0.01 0.01 0.00 0.02 0.02 0.02 M-Mg 4.00 2.70 2.40 1.61 2.10 3.21 4.11 2.98 3.62
Sum M 5.81 7.54 5.68 5.84 5.68 5.89 5.94 5.72 5.89 I-Ca 0.00 0.01 0.00 0.01 0.00 0.00 0.01 0.00 0.00 I-Na 0.02 0.04 0.03 0.02 0.02 0.03 0.08 0.02 0.09 I-K 1.86 0.00 1.48 1.90 1.90 1.58 1.66 1.88 1.58
Sum I 1.87 0.05 1.52 1.93 1.92 1.61 1.75 1.89 1.67 A-F 0.42 0.00 0.68 0.25 0.47 1.53 1.96 0.45 1.83
A-Cl 0.13 0.04 0.03 0.56 0.04 0.26 0.00 0.13 0.02 A-OH 3.45 3.96 3.29 3.20 3.48 2.20 2.04 3.41 2.15
Sum A 4.00 4.00 4.00 4.00 4.00 4.00 4.00 4.00 4.00 Fe/(Fe+Mg) 0.26 0.61 0.47 0.69 0.56 0.39 0.24 0.40 0.31
Endmembers (%)
Phlogopite 74 39 53 31 44 61 76 60 69 Annite 26 61 47 69 56 39 24 40 31
General formula: I2 M4 T8 O20 A4 1All Fe reported as Fe2+ 2Calculated H2O
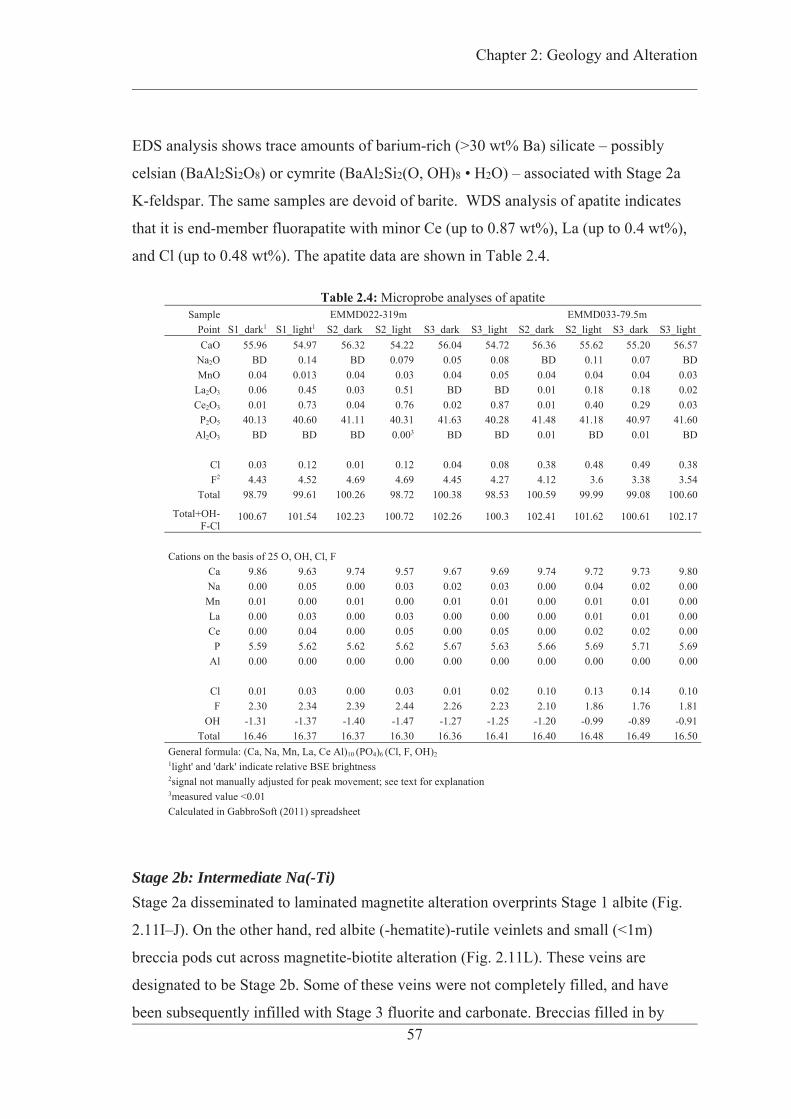
Chapter 2: Geology and Alteration
57
EDS analysis shows trace amounts of barium-rich (>30 wt% Ba) silicate – possibly
celsian (BaAl2Si2O8) or cymrite (BaAl2Si2(O, OH)8 • H2O) – associated with Stage 2a
K-feldspar. The same samples are devoid of barite. WDS analysis of apatite indicates
that it is end-member fluorapatite with minor Ce (up to 0.87 wt%), La (up to 0.4 wt%),
and Cl (up to 0.48 wt%). The apatite data are shown in Table 2.4.
Table 2.4: Microprobe analyses of apatite Sample EMMD022-319m EMMD033-79.5m
Point S1_dark1 S1_light1 S2_dark S2_light S3_dark S3_light S2_dark S2_light S3_dark S3_light CaO 55.96 54.97 56.32 54.22 56.04 54.72 56.36 55.62 55.20 56.57
Na2O BD 0.14 BD 0.079 0.05 0.08 BD 0.11 0.07 BD MnO 0.04 0.013 0.04 0.03 0.04 0.05 0.04 0.04 0.04 0.03
La2O3 0.06 0.45 0.03 0.51 BD BD 0.01 0.18 0.18 0.02 Ce2O3 0.01 0.73 0.04 0.76 0.02 0.87 0.01 0.40 0.29 0.03
P2O5 40.13 40.60 41.11 40.31 41.63 40.28 41.48 41.18 40.97 41.60 Al2O3 BD BD BD 0.003 BD BD 0.01 BD 0.01 BD
Cl 0.03 0.12 0.01 0.12 0.04 0.08 0.38 0.48 0.49 0.38 F2 4.43 4.52 4.69 4.69 4.45 4.27 4.12 3.6 3.38 3.54
Total 98.79 99.61 100.26 98.72 100.38 98.53 100.59 99.99 99.08 100.60
Total+OH-F-Cl
100.67 101.54 102.23 100.72 102.26 100.3 102.41 101.62 100.61 102.17
Cations on the basis of 25 O, OH, Cl, F Ca 9.86 9.63 9.74 9.57 9.67 9.69 9.74 9.72 9.73 9.80 Na 0.00 0.05 0.00 0.03 0.02 0.03 0.00 0.04 0.02 0.00 Mn 0.01 0.00 0.01 0.00 0.01 0.01 0.00 0.01 0.01 0.00 La 0.00 0.03 0.00 0.03 0.00 0.00 0.00 0.01 0.01 0.00 Ce 0.00 0.04 0.00 0.05 0.00 0.05 0.00 0.02 0.02 0.00
P 5.59 5.62 5.62 5.62 5.67 5.63 5.66 5.69 5.71 5.69 Al 0.00 0.00 0.00 0.00 0.00 0.00 0.00 0.00 0.00 0.00
Cl 0.01 0.03 0.00 0.03 0.01 0.02 0.10 0.13 0.14 0.10 F 2.30 2.34 2.39 2.44 2.26 2.23 2.10 1.86 1.76 1.81
OH -1.31 -1.37 -1.40 -1.47 -1.27 -1.25 -1.20 -0.99 -0.89 -0.91 Total 16.46 16.37 16.37 16.30 16.36 16.41 16.40 16.48 16.49 16.50
General formula: (Ca, Na, Mn, La, Ce Al)10 (PO4)6 (Cl, F, OH)2 1light' and 'dark' indicate relative BSE brightness 2signal not manually adjusted for peak movement; see text for explanation 3measured value <0.01 Calculated in GabbroSoft (2011) spreadsheet
Stage 2b: Intermediate Na(-Ti) Stage 2a disseminated to laminated magnetite alteration overprints Stage 1 albite (Fig.
2.11I–J). On the other hand, red albite (-hematite)-rutile veinlets and small (<1m)
breccia pods cut across magnetite-biotite alteration (Fig. 2.11L). These veins are
designated to be Stage 2b. Some of these veins were not completely filled, and have
been subsequently infilled with Stage 3 fluorite and carbonate. Breccias filled in by

Chapter 2: Geology and Alteration
58
Stage 2b albite are characterised by albitised clasts; some clasts also contain extensive
magnetite alteration. It is notable that the dominant Ti-bearing phases in this sodic stage
are rutile and ilmenite, rather than titanite as in Stage 1.
Stage 2c: Early carbonate (-Mg-Fe) flooding and mineralisation Following Stage 2b is a major phase of dolomitic-sideritic-calcite (-Mg-Fe; Table 2.5,
Fig. 2.11D) ± magnetite (2.11N–Q) ± quartz ± pyrite (2.11N, P) ± chalcopyrite (2.11N)
alteration. The Stage 2c assemblage comprises most of the carbonate veins in the
deposit. Stage 2c minerals also make up massive, coarse-grained (>250 μm), domains
that overprint finer-grained magnetite (Fig. 2.11N). In some instances, it may not be
possible to differentiate early (Stage 2a) and later (Stage 2c) magnetite-pyrite alteration.
Stage 2c is, however, interpreted to be later than Stages 2a on the basis that: 1) Fe-Mg-
rich carbonate always overprints or fills open spaces in Stage 2a K-feldspar (Fig. 2.11D)
and quartz veins (Fig. 2.11P), 2) coarse (>5mm) magnetite and sulfide alteration appear
to overprint finer-grained magnetite (Fig. 2.11P), and 3) carbonate overprints Stage 2a
magnetite-apatite (Fig. 2.11J). Albite is never observed to cut carbonate, therefore Stage
2c is later than 2b. Additionally, Coleman (2015) found some examples of magnetite-
calcite veinlets cutting across coarse-grained pyrite; these are probably of Stage 2c. It is
not common, though; typically pyrite, chalcopyrite and carbonate overprint magnetite.
For this reason, it is suggested that most magnetite formed in Stage 2a. Filling in of
voids in Stage 2a and 2b veins by Stage 2c suggests that the latter formed relatively
soon after Stage 2a; this in contrast to Stage 3 minerals, which usually (but not always)
occupy new veins. For the reason, the stages between Stage 1 and Stage 3 are grouped
into Stage 2.
Stage 2c veins may contain Fe-Mg-carbonate (Fig. 2.11D), magnetite, pyrite, and
chalcopyrite. The chalcopyrite appears to be texturally associated with magnetite and
pyrite at hand specimen scale (e.g. Fig 2.11N), but in thin section it overprints these
minerals (Fig. 2.11V). For this reason, it is likely that most of the chalcopyrite is later
than Stage 2c. Stage 2c carbonate veins are often recognizable by the distinct yellow-
brown weathering coloration of the carbonate due to the Fe in them. Smaller veins (100
μm–1 cm) are typically parallel to laminations. Magnetite alteration halos may form
around the smaller veins (<1 cm; Fig. 2.11O).
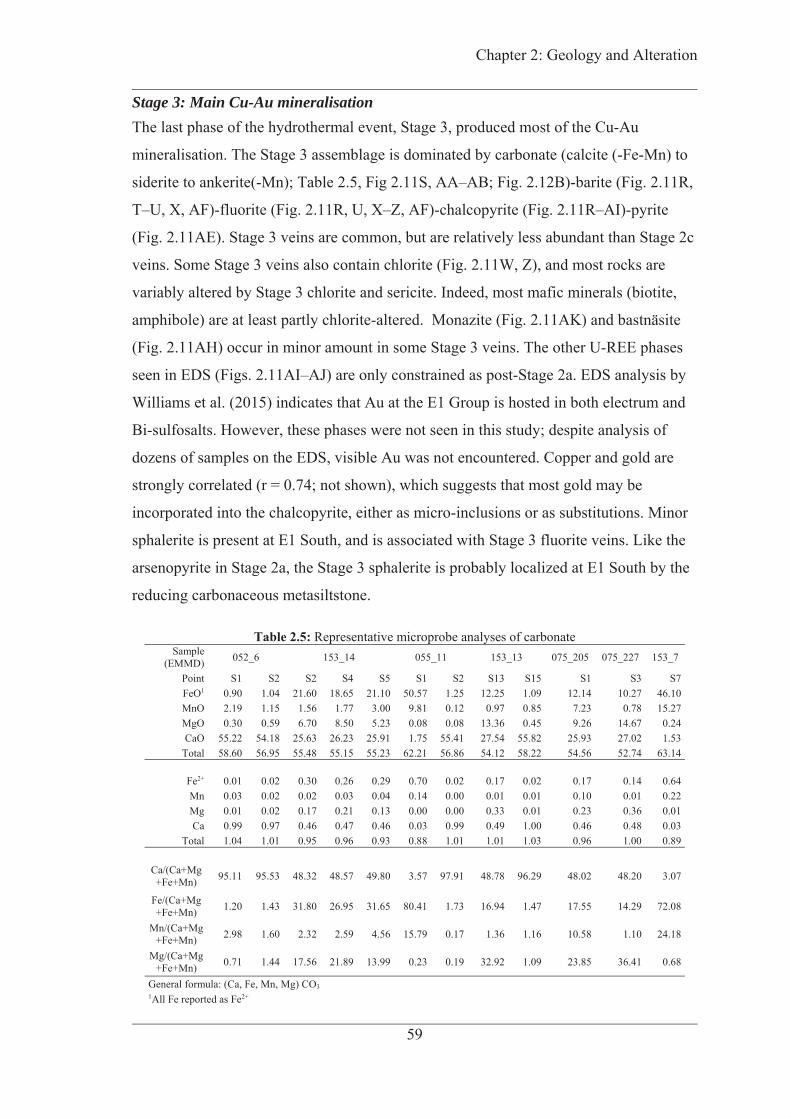
Chapter 2: Geology and Alteration
59
Stage 3: Main Cu-Au mineralisation The last phase of the hydrothermal event, Stage 3, produced most of the Cu-Au
mineralisation. The Stage 3 assemblage is dominated by carbonate (calcite (-Fe-Mn) to
siderite to ankerite(-Mn); Table 2.5, Fig 2.11S, AA–AB; Fig. 2.12B)-barite (Fig. 2.11R,
T–U, X, AF)-fluorite (Fig. 2.11R, U, X–Z, AF)-chalcopyrite (Fig. 2.11R–AI)-pyrite
(Fig. 2.11AE). Stage 3 veins are common, but are relatively less abundant than Stage 2c
veins. Some Stage 3 veins also contain chlorite (Fig. 2.11W, Z), and most rocks are
variably altered by Stage 3 chlorite and sericite. Indeed, most mafic minerals (biotite,
amphibole) are at least partly chlorite-altered. Monazite (Fig. 2.11AK) and bastnäsite
(Fig. 2.11AH) occur in minor amount in some Stage 3 veins. The other U-REE phases
seen in EDS (Figs. 2.11AI–AJ) are only constrained as post-Stage 2a. EDS analysis by
Williams et al. (2015) indicates that Au at the E1 Group is hosted in both electrum and
Bi-sulfosalts. However, these phases were not seen in this study; despite analysis of
dozens of samples on the EDS, visible Au was not encountered. Copper and gold are
strongly correlated (r = 0.74; not shown), which suggests that most gold may be
incorporated into the chalcopyrite, either as micro-inclusions or as substitutions. Minor
sphalerite is present at E1 South, and is associated with Stage 3 fluorite veins. Like the
arsenopyrite in Stage 2a, the Stage 3 sphalerite is probably localized at E1 South by the
reducing carbonaceous metasiltstone.
Table 2.5: Representative microprobe analyses of carbonate Sample
(EMMD) 052_6 153_14 055_11 153_13 075_205 075_227 153_7
Point S1 S2 S2 S4 S5 S1 S2 S13 S15 S1 S3 S7 FeO1 0.90 1.04 21.60 18.65 21.10 50.57 1.25 12.25 1.09 12.14 10.27 46.10 MnO 2.19 1.15 1.56 1.77 3.00 9.81 0.12 0.97 0.85 7.23 0.78 15.27 MgO 0.30 0.59 6.70 8.50 5.23 0.08 0.08 13.36 0.45 9.26 14.67 0.24 CaO 55.22 54.18 25.63 26.23 25.91 1.75 55.41 27.54 55.82 25.93 27.02 1.53
Total 58.60 56.95 55.48 55.15 55.23 62.21 56.86 54.12 58.22 54.56 52.74 63.14
Fe2+ 0.01 0.02 0.30 0.26 0.29 0.70 0.02 0.17 0.02 0.17 0.14 0.64 Mn 0.03 0.02 0.02 0.03 0.04 0.14 0.00 0.01 0.01 0.10 0.01 0.22 Mg 0.01 0.02 0.17 0.21 0.13 0.00 0.00 0.33 0.01 0.23 0.36 0.01 Ca 0.99 0.97 0.46 0.47 0.46 0.03 0.99 0.49 1.00 0.46 0.48 0.03
Total 1.04 1.01 0.95 0.96 0.93 0.88 1.01 1.01 1.03 0.96 1.00 0.89
Ca/(Ca+Mg +Fe+Mn) 95.11 95.53 48.32 48.57 49.80 3.57 97.91 48.78 96.29 48.02 48.20 3.07
Fe/(Ca+Mg +Fe+Mn) 1.20 1.43 31.80 26.95 31.65 80.41 1.73 16.94 1.47 17.55 14.29 72.08
Mn/(Ca+Mg+Fe+Mn) 2.98 1.60 2.32 2.59 4.56 15.79 0.17 1.36 1.16 10.58 1.10 24.18
Mg/(Ca+Mg+Fe+Mn) 0.71 1.44 17.56 21.89 13.99 0.23 0.19 32.92 1.09 23.85 36.41 0.68
General formula: (Ca, Fe, Mn, Mg) CO3 1All Fe reported as Fe2+

Chapter 2: Geology and Alteration
60
Figure 2.12: A) Ternary plot of E1 Group biotite WDS analyses, based on Nachit et al (2005). Domain A is magmatic biotite. Domain B is neoformed or hydrothermally-requilibrated biotite. Domain C is purely new hydrothermal biotite. B) Ternary plot of carbonate WDS analyses, coloured by constrained paragenetic Stage. C) Ternary plot of feldspar WDS analyses.

Chapter 2: Geology and Alteration
61
Stage 3 can typically be distinguished from Stage 2c by the elevated manganese content
of some Stage 3 vein carbonate (Fig. 2.12B), which typically imparts a pink hue
(weathering to black pyrolusite) to the mineral, and is distinct from the yellow-brown
carbonate of Stage 2c. In one sample, EMMD055-155.35m, MLA mapping (Fig. 2.9B)
revealed a barite veinlet cutting across chalcopyrite. In other instances, the two minerals
appear to be cogenetic (Figs. 2.11T–U). It is possible that chalcopyrite in that sample is
related to Stage 2c, or that there may be an additional late barite stage. However, such a
stage appears to be relatively minor. Furthermore, most chalcopyrite-bearing veins cut
across Stage 2c ankeritic-dolomitic carbonate (Fig. 2.11AD–AE). Some Stage 3 fluorite
replaces biotite (Fig. 2.11AC), possibly because it is generally F-rich. Fluorite is also
rarely observed as late infill in Stage 3 carbonate veins, suggesting multiple sub-stages
of fluorite input during this stage. Stage 3 also introduced minor epidote veins and
replacement at E1 East, but they only occur in altered metadolerite. Minor barren calcite
veins cut across Stage 3 assemblages, and are considered the last substage of the
system. These late calcite veins may be of similar timing to the late, barren, barite
veinlets.
Geochronology Sampling A sample from DDH EMMD033 at 79.5m contains hydrothermal monazite appropriate
for in-situ dating. The sample was collected from a zone of abundant magnetite-apatite
alteration southwest of the E1 North orebody (location in Fig. 2.4; alteration in Fig.
2.19). Samples within the orebody also contain monazite associated with chalcopyrite,
but crystals in these samples were either too small (< 40 μm), or contain sulfide
inclusions. The sample is composed of an assemblage of coarse, euhedral magnetite
intergrown with apatite and minor quartz (Fig. 2.11AK), which is overprinted by an
assemblage of pyrite, chalcopyrite, carbonate, chlorite and monazite. The protolith is
obscured by these hydrothermal assemblages, but is adjacent to less altered, sheared,
massive to amygdaloidal metavolcanic rocks. Apatite crystals in this sample are up to 1
cm in length (e.g. Fig. 2.7E), though crystals up to 3 cm are present in other drill holes.
The boundary of the apatite-magnetite-rich domain is gradational and the magnetite-
apatite assemblage is interpreted to be mostly replacement rather than infill. Monazite is
present in carbonate ± chalcopyrite veins and also as veinlets and disseminations
overprinting apatite (Fig. 2.11AK). Bastnäsite is also hosted within some carbonate

Chapter 2: Geology and Alteration
62
veins in this sample. The magnetite and apatite together are part of paragenetic Stage 2a,
and the carbonate, monazite, chalcopyrite and bastnäsite are part of Stage 3 (Fig. 2.10,
2.11AK). Backscatter electron (BSE) imaging revealed that most monazite crystals are
homogenous, though some contain uranium-and thorium bearing minerals as detected
by EDS; these inclusions could be huttonite or uraninite, and were excluded from
analysis. Monazite grain size varies from 40–100 μm. The monazites are characterised
by low Th and U concentrations, as indicated by their count rates; such low counts are
typical for hydrothermal monazite (e.g. Davis et al., 1994; Davidson et al., 2007). The
monazites do not contain significant amounts of 204Pb.
Results Thirty-four monazite crystals were analysed and half were discarded due to interference
from sub-surface inclusions of sulfides, U-silicates, U-oxides and Th-silicates; the
inclusions were visible as distinct U or Th spikes in the ICP-MS signal count. The U-Pb
concordia plot of the remaining 17 spots is shown in Figure 2.13A. Of these 17 spots,
four were highly discordant (Fig. 2.13A) and were therefore removed. Another three
points yielded anomalously young (1350–1250 Ma) ages, and were excluded in from
the U-Pb concordia plot in Figure 2.13B, which shows the remaining 10 points. The
significance of the younger ages is discussed later. The upper intercept age of the
monazite is 1433 ± 28 Ma (MSWD = 0.87, probability of fit (PF) = 0.54; Fig. 2.13B).
The 10 concordant spot analyses have a weighted average 207Pb/206Pb age of 1456 ± 44
Ma (MSWD = 0.90, PF = 0.53; Fig. 2.13C).

Chapter 2: Geology and Alteration
63
Figure 2.13: A) U-Pb Concordia of all 17 monazite analyses. B) U-Pb Concordia of the 10 best monazite analyses, with discordant or anomalously-young ages removed. C) Weighted average 207Pb/206Pb age of the points in (B). Concordia generated in Isoplot for Excel.

Chapter 2: Geology and Alteration
64
Ore Chemistry The whole-rock geochemical data for all samples are presented in Appendix B. To
conduct statistical analyses, geochemical values below the detection limit (DL) were
assigned to be 0.5 DL. The average LOI of the whole-rock samples is 6.1 wt%,
suggesting significant alteration even in metavolcanic rocks that contain few veins.
Thus, meaningful comparisons between unaltered and altered host rocks are not
possible. Instead, comparisons are made based on differences between economic and
sub-economic samples. The cut-off ore grade at the E1 Group is 0.27 wt% Cu. It is
relatively low because it is only 8 km away from an existing concentrator of the same
company. Out of 111 whole-rock samples collected, 24 are of ore grade.
Most unmineralised metavolcanic rock samples show significant enrichment (10x or
100x), relative to primitive mantle, in all elements except for Sr and Tl (Fig. 2.15A).
The ore-grade samples, mainly volcanic breccias and metatuffs, are characterised by
strong (100x to 1000x) enrichment in Pb, Ba, U and La, and are not depleted in Sr. The
metavolcanic and metasedimentary rocks show similar trends compared to average crust
(Fig. 2.15B–C), but the former are relatively more depleted in Sr and Sm (Fig. 2.15B–
C). The unmineralised carbonaceous schists are less enriched in Ba, U, La, Ce, Nd and
P compared to mineralised metasedimentary rocks, but are higher in Th, K, Hf, Zr and
Tl (Fig. 2.15B).
The ore-grade E1 Group samples have high concentrations of Fe (mean 43 wt%), Ba
(up to 22 wt%), F (up to 15 wt%), and are also locally enriched in U (up to 450 ppm),
REE (up to ~1500 ppm total), P (up to 7500 ppm P2O5), Mn (locally over 2100 ppm;
Fig. 2.20), As (locally up to 520 ppm), Co (up to ~500 ppm), Mo (400 ppm), and Sn
(150 ppm), but are depleted in Si, Na, K, Mn (locally; Fig. 2.14) and Zr (Fig. 2.14).
Silver concentrations in ore-grade samples (n = 24) average 6ppm, while sub-grade
samples (n = 87) average 0.27 ppm; both are orders of magnitude higher than mean
crustal concentrations (0.055 ppm; Wedepohl, 1995).
Lead and zinc levels are generally very low in the E1 Group. Lead concentrations
average 6 ppm and 49 ppm in sub-economic and ore-grade samples, respectively. Zinc
abundance in Cu-ores, at 50 ppm, is only 8 ppm higher than in sub-grade samples,
except in the carbonaceous lithologies in E1 South where Zn concentrations are locally
>300 ppm. The overall low concentrations of Pb and Zn are consistent with the presence
Chapter 2: Geology and Alteration
65
of minor to trace amounts of galena and sphalerite. Arsenic is also more enriched in
these protoliths, with As concentrations up to 500 ppm, consistent with the occurrence
of arsenopyrite in these host rocks in E1 South; it is 50–150 ppm in other areas of the
E1 Group of deposits. Compared with the average crust, Ba, U, La, Ce, Nd, and P in E1
Group ores are 10 to 100 more concentrated (Fig. 2.15B–C). In contrast, Rb, Sr, Th, K,
Hf, Zr, and Tl are nearly 100 times more depleted in the ores (Fig. 2.15B–C). The E1
Group ores contain 500–2000 ppm total REE (Fig. 2.14). The ores are enriched in
LREE relative to sub-grade samples, whereas the HREE contents are similar (Fig.
2.15D–E). The ores in all rock types have a positive Eu anomaly whereas the sub-grade
samples do not (Fig. 2.15D–E). The most abundant elements among the REEs are La
and Ce.
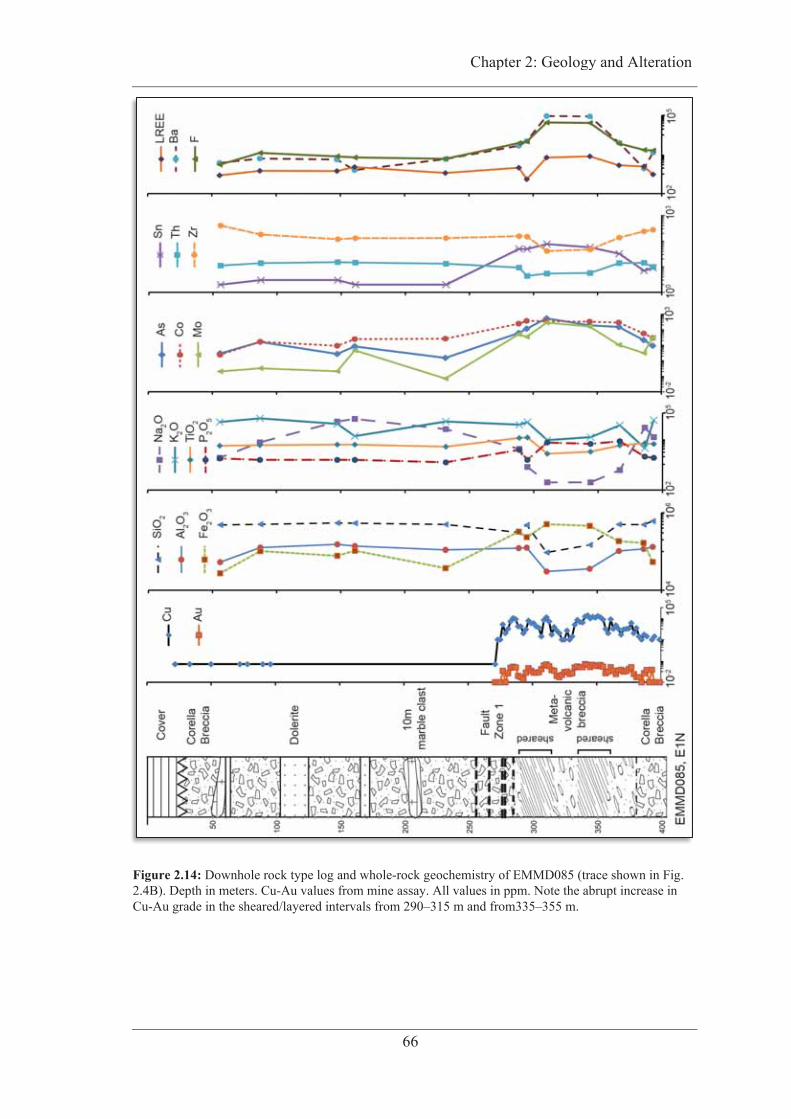
66 66
Figure 2.14: Downhole rock type log and whole-rock geochemistry of EMMD085 (trace shown in Fig. 2.4B). Depth in meters. Cu-Au values from mine assay. All values in ppm. Note the abrupt increase in Cu-Au grade in the sheared/layered intervals from 290–315 m and from335–355 m.
Chapter 2: Geology and Alteration
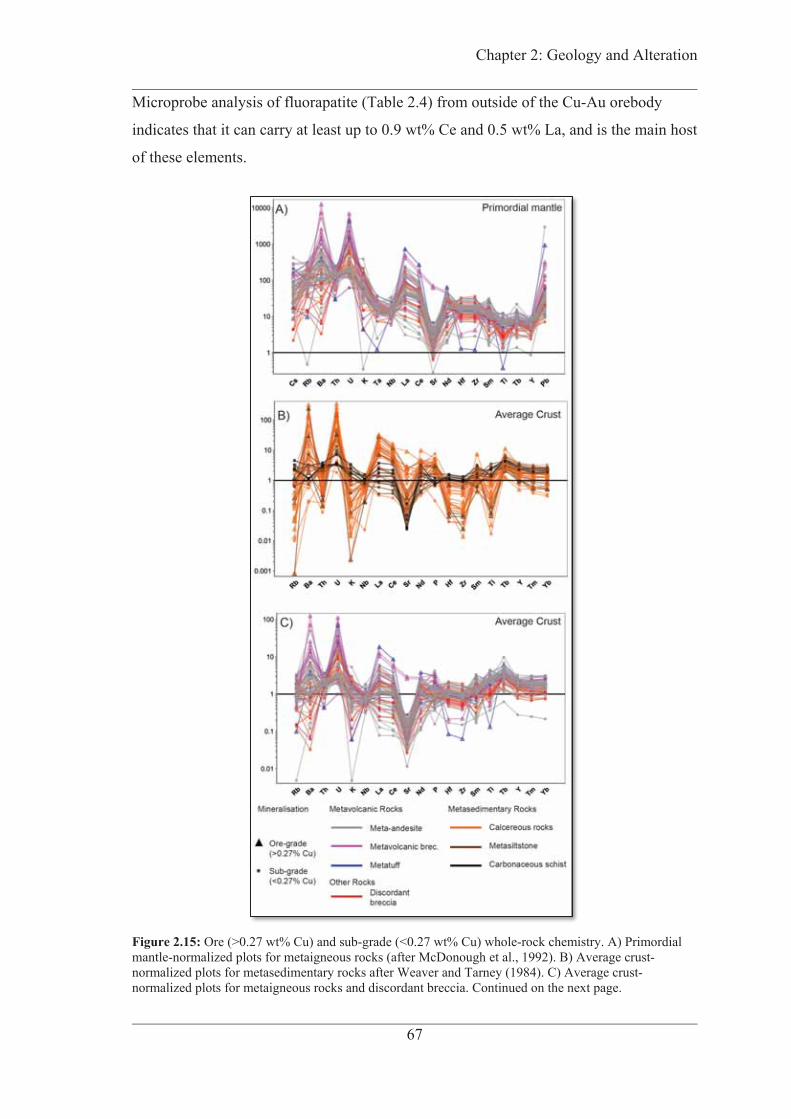
Chapter 2: Geology and Alteration
67
Microprobe analysis of fluorapatite (Table 2.4) from outside of the Cu-Au orebody
indicates that it can carry at least up to 0.9 wt% Ce and 0.5 wt% La, and is the main host
of these elements.
Figure 2.15: Ore (>0.27 wt% Cu) and sub-grade (<0.27 wt% Cu) whole-rock chemistry. A) Primordial mantle-normalized plots for metaigneous rocks (after McDonough et al., 1992). B) Average crust-normalized plots for metasedimentary rocks after Weaver and Tarney (1984). C) Average crust-normalized plots for metaigneous rocks and discordant breccia. Continued on the next page.
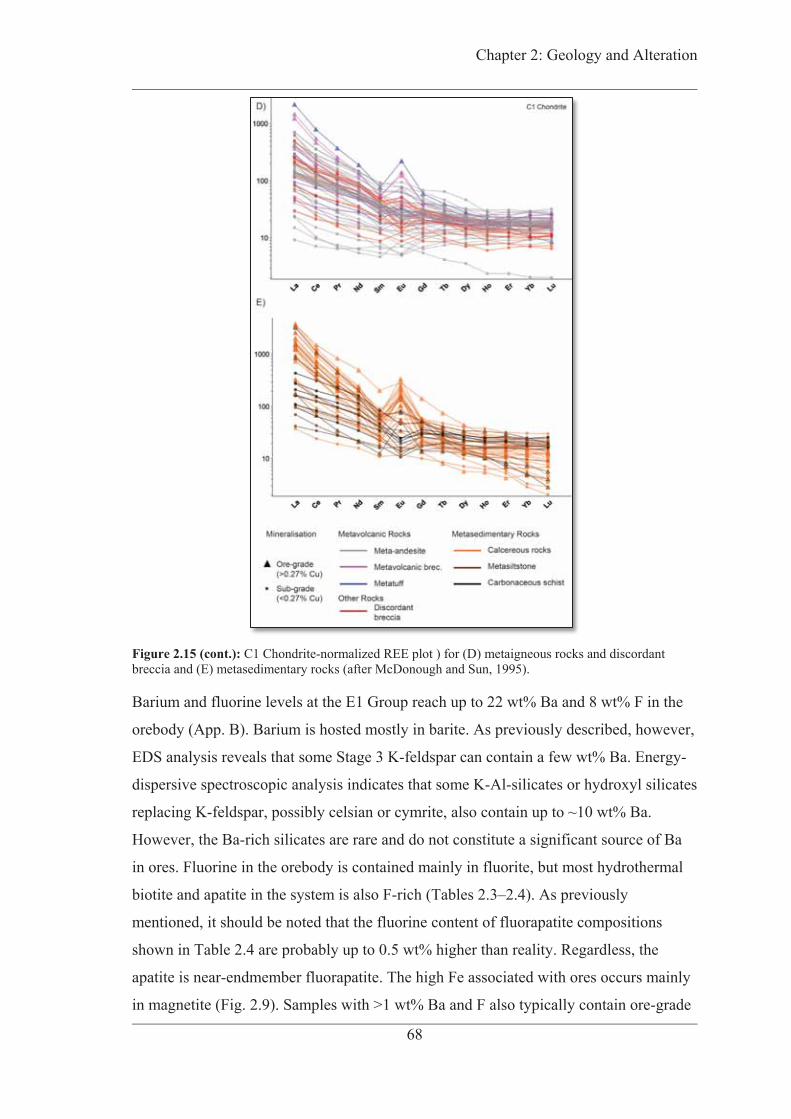
Chapter 2: Geology and Alteration
68
Figure 2.15 (cont.): C1 Chondrite-normalized REE plot ) for (D) metaigneous rocks and discordant breccia and (E) metasedimentary rocks (after McDonough and Sun, 1995).
Barium and fluorine levels at the E1 Group reach up to 22 wt% Ba and 8 wt% F in the
orebody (App. B). Barium is hosted mostly in barite. As previously described, however,
EDS analysis reveals that some Stage 3 K-feldspar can contain a few wt% Ba. Energy-
dispersive spectroscopic analysis indicates that some K-Al-silicates or hydroxyl silicates
replacing K-feldspar, possibly celsian or cymrite, also contain up to ~10 wt% Ba.
However, the Ba-rich silicates are rare and do not constitute a significant source of Ba
in ores. Fluorine in the orebody is contained mainly in fluorite, but most hydrothermal
biotite and apatite in the system is also F-rich (Tables 2.3–2.4). As previously
mentioned, it should be noted that the fluorine content of fluorapatite compositions
shown in Table 2.4 are probably up to 0.5 wt% higher than reality. Regardless, the
apatite is near-endmember fluorapatite. The high Fe associated with ores occurs mainly
in magnetite (Fig. 2.9). Samples with >1 wt% Ba and F also typically contain ore-grade
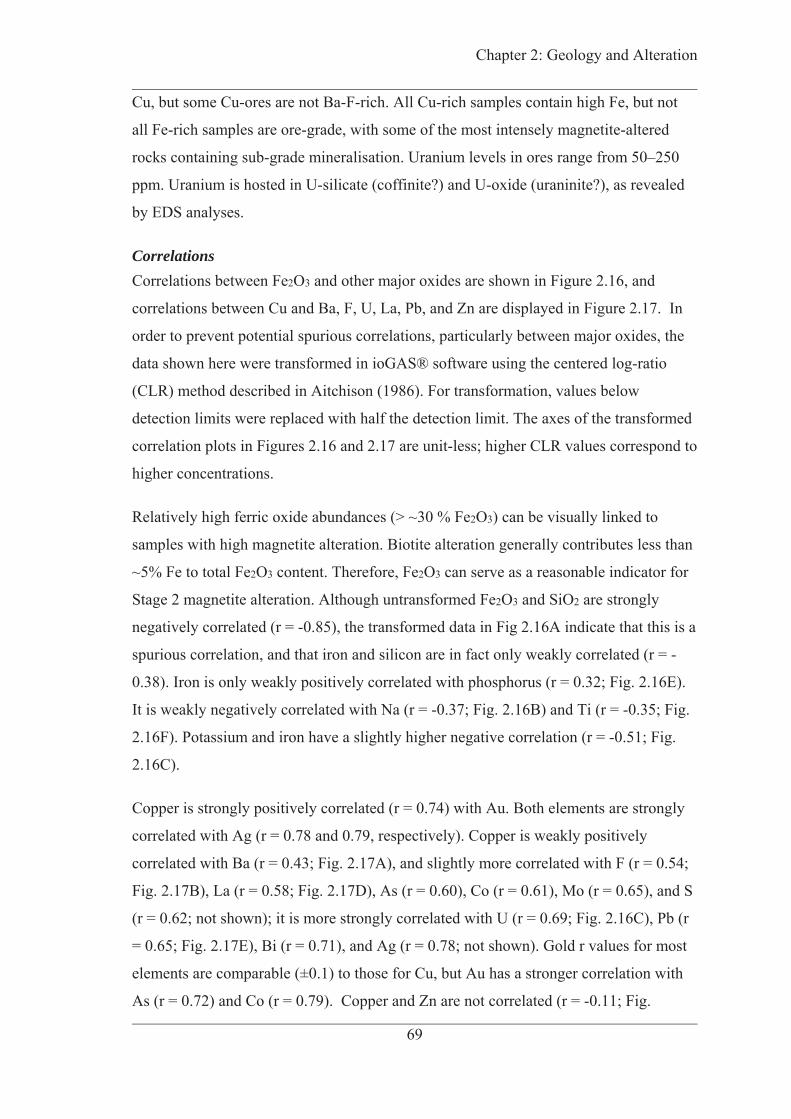
Chapter 2: Geology and Alteration
69
Cu, but some Cu-ores are not Ba-F-rich. All Cu-rich samples contain high Fe, but not
all Fe-rich samples are ore-grade, with some of the most intensely magnetite-altered
rocks containing sub-grade mineralisation. Uranium levels in ores range from 50–250
ppm. Uranium is hosted in U-silicate (coffinite?) and U-oxide (uraninite?), as revealed
by EDS analyses.
Correlations Correlations between Fe2O3 and other major oxides are shown in Figure 2.16, and
correlations between Cu and Ba, F, U, La, Pb, and Zn are displayed in Figure 2.17. In
order to prevent potential spurious correlations, particularly between major oxides, the
data shown here were transformed in ioGAS® software using the centered log-ratio
(CLR) method described in Aitchison (1986). For transformation, values below
detection limits were replaced with half the detection limit. The axes of the transformed
correlation plots in Figures 2.16 and 2.17 are unit-less; higher CLR values correspond to
higher concentrations.
Relatively high ferric oxide abundances (> ~30 % Fe2O3) can be visually linked to
samples with high magnetite alteration. Biotite alteration generally contributes less than
~5% Fe to total Fe2O3 content. Therefore, Fe2O3 can serve as a reasonable indicator for
Stage 2 magnetite alteration. Although untransformed Fe2O3 and SiO2 are strongly
negatively correlated (r = -0.85), the transformed data in Fig 2.16A indicate that this is a
spurious correlation, and that iron and silicon are in fact only weakly correlated (r = -
0.38). Iron is only weakly positively correlated with phosphorus (r = 0.32; Fig. 2.16E).
It is weakly negatively correlated with Na (r = -0.37; Fig. 2.16B) and Ti (r = -0.35; Fig.
2.16F). Potassium and iron have a slightly higher negative correlation (r = -0.51; Fig.
2.16C).
Copper is strongly positively correlated (r = 0.74) with Au. Both elements are strongly
correlated with Ag (r = 0.78 and 0.79, respectively). Copper is weakly positively
correlated with Ba (r = 0.43; Fig. 2.17A), and slightly more correlated with F (r = 0.54;
Fig. 2.17B), La (r = 0.58; Fig. 2.17D), As (r = 0.60), Co (r = 0.61), Mo (r = 0.65), and S
(r = 0.62; not shown); it is more strongly correlated with U (r = 0.69; Fig. 2.16C), Pb (r
= 0.65; Fig. 2.17E), Bi (r = 0.71), and Ag (r = 0.78; not shown). Gold r values for most
elements are comparable (±0.1) to those for Cu, but Au has a stronger correlation with
As (r = 0.72) and Co (r = 0.79). Copper and Zn are not correlated (r = -0.11; Fig.
Chapter 2: Geology and Alteration
70
2.17F). Barium and fluorine are correlated with U (r = 0.52 and 0.61, respectively),
while fluorine is only weakly correlated with La (r = 0.4; not shown). Calcium and
carbon are negatively correlated with iron, barium, fluorine and copper in marble and
metasiltstone samples (Fig. 2.18).
Figure 2.16: Correlations of Fe2O3 with other major oxides. All data were CLR-transformed in ioGAS®. The axes are unitless.

Chapter 2: Geology and Alteration
71
Summary and Interpretations E1 Group Cu-Au ores are highly enriched in Fe, Ba, F, and less enriched in P, Ag, U,
REE, As, Co, Mo, and Sn; Mn is locally enriched. This wide range of elements is
suggestive of a complex hydrothermal system with multiple fluid and/or metal and
halogen sources. The ores are depleted in the rock-forming elements Si, Na and K.
Compared to average crustal values, Rb, Sr, Th, K, Hf, Zr, and Tl are highly (100x)
depleted in the orebody. Such depleted concentrations may be the result of the marble
protolith, which probably has lower concentrations of these elements than average crust.
Iron, barium and fluorine are hosted mostly in magnetite, barite and fluorite,
respectively.
The positive Fe-P correlation is consistent with Fe and P input during Stage 2a
magnetite-apatite alteration. Correlations between Fe and K – the other major input in
Stage 2a – are probably weak because although Stage 2a biotite and magnetite are
typically both abundant in the same samples, Stage 2a K-feldspar and magnetite are not.
Furthermore, magnetite and apatite are only both abundant in the magnetite-apatite zone
southwest of the orebody. The positive correlation between Au and As suggests that
some of the Au may be hosted in As-bearing pyrite (arsenopyrite is rare at E1 North).
The weak correlations between Cu-Au and Ba and F are probably because zones of
enriched barite and fluorite are restricted to the cores of the E1 Group orebodies, and do
not extend spatially as far as Cu and Au. Such restriction may be the result of the
comparatively poor solubility of these minerals with respect to Cu-sulfides and
uraninite. Lanthanum is weakly correlated because it is enriched in the orebody as well
as in the Cu-Au-barren magnetite-apatite zone. MLA mapping indicates that barite,
fluorite, monazite and bastnäsite occur together in the orebody; the weak correlations
between Ba, F, U and La, however, are probably the result of elevated REE in the
apatite-rich zone beyond the orebody, where Ba and F are much less abundant. The
negative correlations between C, CaO and Ba, F, and Fe2O3 in metasedimentary rocks
suggests that much of the magnetite-sulfide-barite-fluorite alteration is replacing
primary carbonate (Fig. 2.18A). This is also apparent in thin section, where magnetite is
shown to replace calcite (Fig. 2.18B).

Chapter 2: Geology and Alteration
72
Figure 2.17: Correlations of Cu with selected elements. All data were CLR-transformed in ioGAS®. The axes are unitless.

Chapter 2: Geology and Alteration
73
Figure 2.18: Alteration in calcareous protoliths. A) Pearson Correlation Coefficients of carbonate rock type-indicators (Ca, CaO) and alteration indicators (Ba, F, Fe2O3). All data CLR-transformed prior to correlation as described in the text. Note that the alteration indicators are negatively correlated with the carbonate indicators. B) Cross-Nicols photomicrograph of magnetite replacing primary calcite along cleavage and twin planes.
Zonation Patterns The construction of the zonation map and cross sections (Figs. 2.19–2.20) The distribution of various types of alterations in E1 North is shown in a plan map at
75m below the surface in Figure 2.19 and along cross section A–A’ (Fig. 2.20; position
of A–A’ shown in Fig. 2.19), based on drillcore logging, petrography and MLA
analysis. Also shown is the 0.27% Cu orebody contour, based on exploration drill hole
(n = 678) and blast hole assays (n = 2300). The Ba, F and Mn element contours
presented in Figures 2.19 and 2.20 are based only on the whole-rock data (n = 111), as
these elements were not assayed previously. The lateral extent of magnetite ± biotite,
apatite, and pyrite in Figure 2.19 are based on a combination of mine Fe-P-S assays, and
open pit and drill core observations. There are insufficient core log and geochemical
data to project the K-feldspar-biotite and Mn-rich zones shown in the Figure 2.20 cross
sections onto the plan map.
The lack of outcrop in the study area has prohibited detailed regional geochemical
surveys, and consequently there are insufficient data to determine regionally significant
geochemical anomaly thresholds for the Ba-F-Mn contours (Figs. 2.19–2.20). However,
Ba, F, and Mn data approximate a log-normal distribution (Fig. 2.21), statistically
Chapter 2: Geology and Alteration
74
enabling the use of the median + 2MAD (median absolute deviation) method (Riemann
et al., 2005) for determining anomalous cutoffs (F: 1804 ppm; Ba: 1746 ppm; Mn: 950
ppm). Therefore, these anomalous thresholds are only valid in the vicinity of the E1
Group deposit. Regardless, some insight may be gained by observing the contours of the
thresholds.
Zones of high Fe (> ~20% Fe) correspond to strong magnetite alteration zones in the
open pit. Most of the magnetite is related to Stage 2a, and less is from Stage 2c. Apatite
is the only P-rich mineral in significant quantities, and thus P abundance is an indicator
of the apatite alteration zones shown in Figure 2.19. Southwest of the E1 North
orebody, pyrite is the only sulfur-bearing mineral observed in major amounts; the pyrite
zone in Figure 2.19 is defined by approximately >4% sulfur, which includes pyrite from
multiple stages.

Chapter 2: Geology and Alteration
75
Figure 2.19: E1 North zonations interpreted at 2075m RL / 75m ASL. A) Stages 1–2c alteration. Strong Stage 1 alteration is mainly only preserved in the discordant Breccias. In other lithologies it is obliterated by later stages. B) Stages 2c alteration. Continued on the next page. GDA 94 projection. RL, relative level mine datum; ASL, above sea level.
Variation within the orebody Barite and fluorite alteration are most abundant in the lower portion of the E1 North
orebody, on the west limb of the E1 North Antiform, where their abundances exceed 5
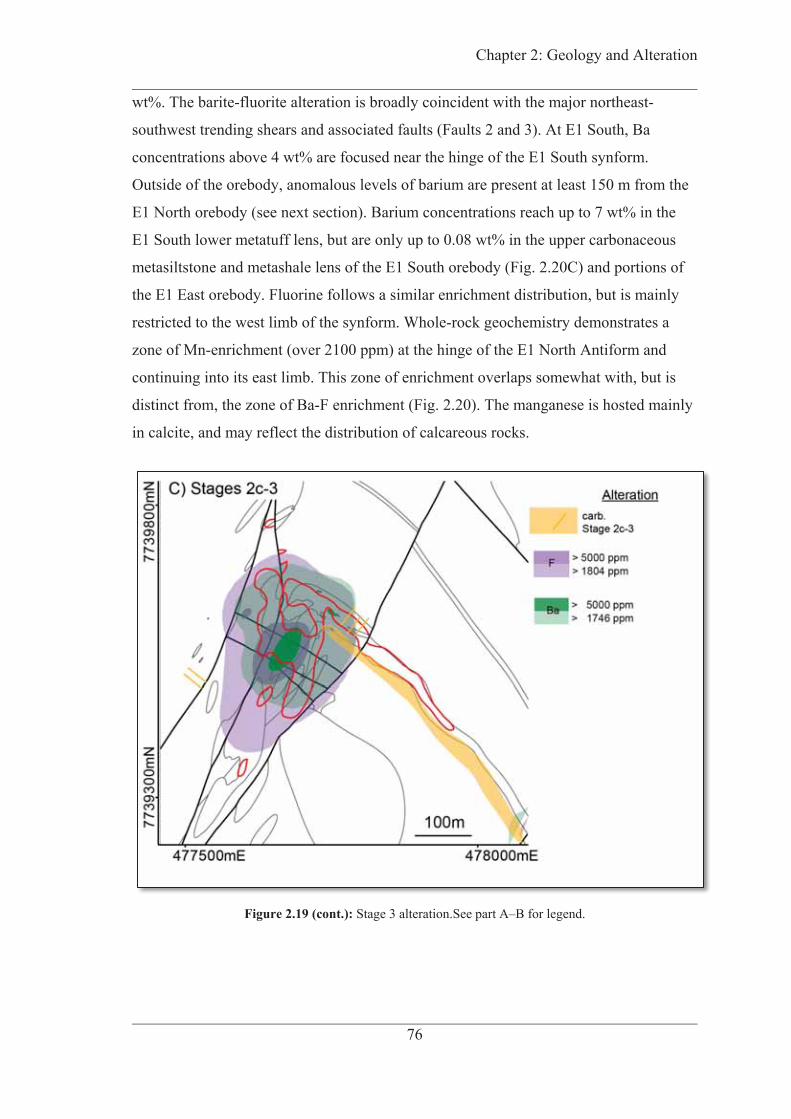
Chapter 2: Geology and Alteration
76
wt%. The barite-fluorite alteration is broadly coincident with the major northeast-
southwest trending shears and associated faults (Faults 2 and 3). At E1 South, Ba
concentrations above 4 wt% are focused near the hinge of the E1 South synform.
Outside of the orebody, anomalous levels of barium are present at least 150 m from the
E1 North orebody (see next section). Barium concentrations reach up to 7 wt% in the
E1 South lower metatuff lens, but are only up to 0.08 wt% in the upper carbonaceous
metasiltstone and metashale lens of the E1 South orebody (Fig. 2.20C) and portions of
the E1 East orebody. Fluorine follows a similar enrichment distribution, but is mainly
restricted to the west limb of the synform. Whole-rock geochemistry demonstrates a
zone of Mn-enrichment (over 2100 ppm) at the hinge of the E1 North Antiform and
continuing into its east limb. This zone of enrichment overlaps somewhat with, but is
distinct from, the zone of Ba-F enrichment (Fig. 2.20). The manganese is hosted mainly
in calcite, and may reflect the distribution of calcareous rocks.
Figure 2.19 (cont.): Stage 3 alteration.See part A–B for legend.
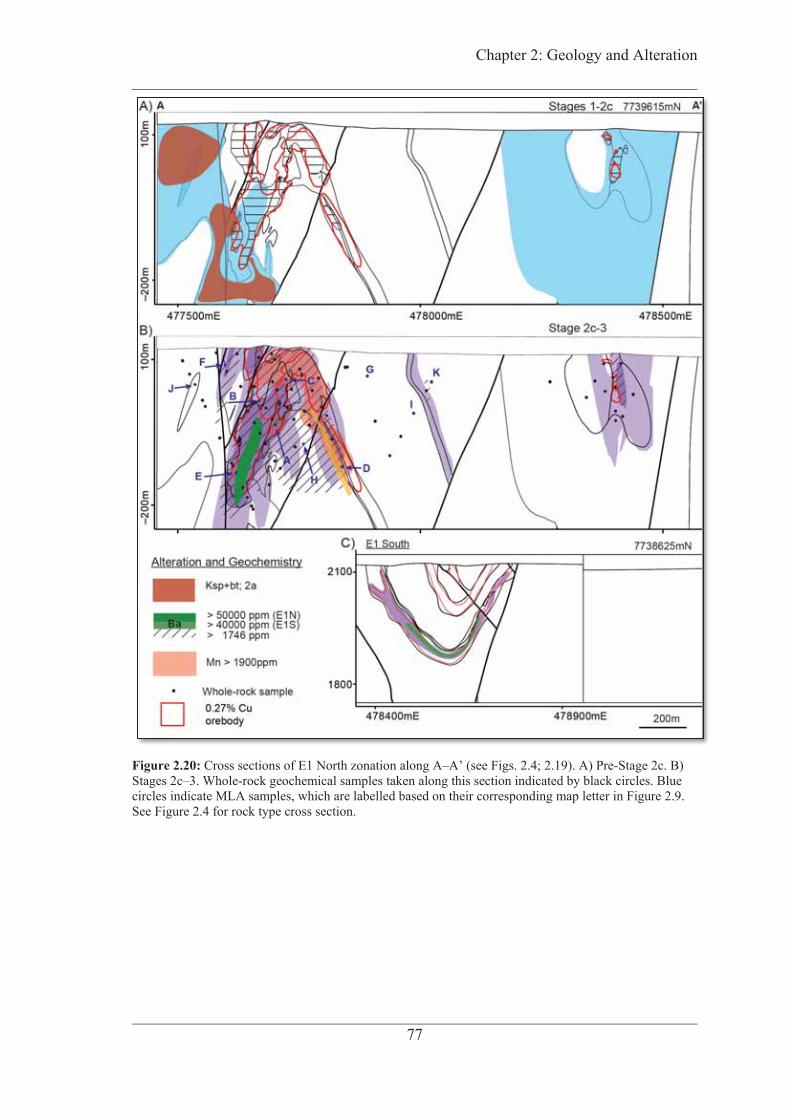
Chapter 2: Geology and Alteration
77
Figure 2.20: Cross sections of E1 North zonation along A–A’ (see Figs. 2.4; 2.19). A) Pre-Stage 2c. B) Stages 2c–3. Whole-rock geochemical samples taken along this section indicated by black circles. Blue circles indicate MLA samples, which are labelled based on their corresponding map letter in Figure 2.9. See Figure 2.4 for rock type cross section.

Chapter 2: Geology and Alteration
78
Figure 2.21: Probability plots of Ba, F, and Mn whole-rock data.
Variation outside the orebody Coherent volcanics proximal to the E1 North orebody are commonly characterised by
abundant carbonate veins, as well as an anastomosing pattern of magnetite-pyrite ±
chalcopyrite alteration (Fig. 2.7I). The anastomosing texture is likely caused by
magnetite-sulfide ± carbonate (calcite, siderite, ankerite or dolomite) veins or veinlets
with wider alteration halo of the same assemblage, and the causative veins are
occasionally visible. Further from the orebody, this stage 2 and 3 carbonate veining
lacks significant sulfide or magnetite alteration, and is visible throughout the E1 Group
mine lease. The veins are generally irregular in shape and vary in size from 1 mm to >2
m.
The orebody transitions southwest to a zone of pyrite-rich alteration (Fig. 2.19B).
Continuing out from the pyrite zone and about 150 m southwest of the E1 North
Chapter 2: Geology and Alteration
79
orebody on the west limb of the E1 North antiform, a distinct zone of abundant coarse
magnetite - pyrite -apatite veins and replacement is present (Fig. 2.19B). Apatite
abundance is significantly higher in this zone (locally up to 2 wt% P) than in the
orebody itself. Most of this alteration is related to Stage 2a, though it is possible that
some of the magnetite and pyrite are from later stages. It is speculated that the orebody
had higher concentrations of apatite during Stage 2, but it was overprinted by later
mineralisation.
Whole-rock geochemical analysis indicates that barium concentrations, which were not
fully tested during the drilling program, remain anomalous (>1750 ppm) up to 100m
from the E1 North orebody (Figs. 2.19–2.20). Barite has not been detected in significant
quantities outside the orebody, and it is likely that distal barium is hosted in K-feldspar
or micas.
Whole-rock geochemical analysis of fluorine, which was also not assayed during
drilling, indicates that anomalous (>1800 ppm) fluorine enrichment may extend over
100m from the orebody (Fig. 2.19). Wedepohl (1995) reported an average fluorine
crustal abundance of 611 ppm, with a maximum average of 800 ppm in granitic crust.
Almost all samples tested in this study contain >900 ppm, suggesting that the ore fluids
were very Ba-F-rich, or that background values in the Ernest Henry–E1 area are higher
than average crust.
Interpretations Variations in mineralogy and element distribution within the orebody are mostly likely
caused by a combination of changes in ore fluid conditions and host rock composition.
This assumes that the ore-stage and pre-ore assemblages are genetically linked. The
limited extent of barite-fluorite alteration with respect to the orebody is probably due to
their relatively low solubilities. Alternatively, barite alteration may also be locally
restricted by available sulfate at the time of deposition, but this does not explain the
coincident limit of high F (>4 wt%) alteration.Concentration of these two elements
around the northeast-trending shears and faults (Faults 2 and 3) and E1 North Antiform
at E1 North, and near the hinge of the E1 South Antiform, suggests that these structures
probably provided conduits for the Ba-F-bearing fluids.

Chapter 2: Geology and Alteration
80
A clear metasedimentary rock compositional control on mineralogy and element
zonation is evident based on the relative lack of barite, and relative abundance of
arsenopyrite and pyrrhotite, in the carbonaceous metasiltstone and schist at E1 South.
The reducing nature of these host rocks likely removed oxidized sulfur from the
mineralising fluids. The presence of abundant magnetite and chalcopyrite in both the
marble and metasiltstone, however, indicates that the redox state of the host rock was
not a vital factor in controlling ore distribution. The cause of Mn abundance in the
upper portion of the E1 North orebody is not obvious. It is possible that this may reflect
protolith composition, as the marble in this zone is less barite-fluorite-altered.
Alternatively, it may represent a distinct zonation in the temperature or composition of
the hydrothermal fluid. Ehrig et al. (2015) reported, based on core logs, a similar spatial
zonation of barite-fluorite to siderite at the Olympic Dam IOCG deposit.
The transition from magnetite-chalcopyrite-barite-fluorite ore to magnetite-apatite-
pyrite alteration southwest of the E1 North orebody (Fig. 2.19) may represent a
temporal zonation. It is speculated that stages 2c and 3 mineralisations obliterated much
of the Stage 2a apatite and pyrite in the orebody, while Stage 2a magnetite was probably
remobilized by Stage 2c and not removed. It is possible that at least some of the Stage 3
fluorite in the orebody was formed by replacement of fluorapatite and F-rich biotite. It
is not clear why Stage 3 mineralisation did not heavily overprint the magnetite and
apatite zones (Fig. 2.19), but it may be the result of a lower-temperature, less-extensive,
system during ore formation.
Discussion Stratigraphic correlations of the E1Group host rocks The upper and lower horizons of metasedimentary rocks at E1 are similar to marbles
and metasiliclastic rocks of the Corella Formation (1750–1720 Ma; Blake and Stewart,
1992; Foster and Austin, 2008) and possible equivalents (Doherty and Staveley
formations; Foster and Austin, 2008; Carson et al., 2011) elsewhere in the Eastern Fold
Belt. In the volcanic Zr/Ti vs Nb/Y diagram (Fig. 2.6B), the previously-logged trachyte
and metabasalt are plot in, or close to, the andesite to andesitic basalt and andesite
domains. Their compositions are different from the Toole Creek Volcanics of Cover
Sequence 3, with higher Nb/Y ratios and significantly higher Zr/Ti ratios. Instead, their
geochemical characteristics are virtually identical to the Mount Fort Constantine
Chapter 2: Geology and Alteration
81
Volcanics (Fig. 2.6B) of upper Cover Sequence 2 (Blake et al., 1997; Page and Sun,
1998; Foster and Austin, 2008). Additionally, the porphyritic and amygdaloidal textures
of the E1 Group metavolcanic rocks described above are also similar to the textures of
the Ernest Henry Mount Fort Constantine Volcanics (Fig. 2.5B–C). Therefore, it is
proposed that the metavolcanic rocks at the E1 Group are part of the Mount Fort
Constantine Volcanics. Regionally, the Mount Fort Constantine Volcanics are
temporally equivalent to Corella Formation (Page and Sun, 1998; Mark et al., 2000;
Foster and Austin, 2008).
Previously, the origin of the Mount Fort Constantine Volcanics as intrusive or extrusive
was ambiguous (Page and Sun, 1998; Mark et al., 2000; Foster and Austin, 2008). We
propose a volcanic origin for at least some of the Mount Fort Constantine Volcanics
based on the following textural evidence at E1: 1) the presence of porphyritic and
amygdaloidal clasts in the metavolcanic breccias (Fig. 2.5E), 2) local autobreccia of
coherent rocks, and 3) a lack of aphanitic cooling margins at coherent/incoherent
igneous contacts. These are typical textures for volcanic rocks (McPhie et al., 1993).
Additionally, irregular and abrupt thickness changes in the metasedimentary and
metavolcanic rock may represent localized volcanic flows.
The E1 Group is hosted in the same Mount Fort Constantine Volcanics and Corella
Formation rocks of Cover Sequence 2 as the Ernest Henry deposit to the west, though
their relative stratigraphic level within these formations is not clear. While some IOCGs
to the south, such as Osborne, Monakoff and Eloise, are hosted in Cover Sequence 3,
others like Mount Elliot-SWAN are hosted along the Cover Sequence 2 / Cover
Sequence 3 contact (Duncan et al., 2014). Clearly, stratigraphic positioning in Cover
Sequence 2 or Cover Sequence 3 is not a significant control on IOCG mineralisation in
the district. With that said, the contact itself may be an important structural control (e.g.
McClellan et al., 2010; Duncan et al., 2014).
Absolute timing of E1 Group mineralisation The 1456 ± 44 Ma age of the E1 Group Stage 3 monazite overlaps in error with a
titanite U-Pb (1514 ± 24 Ma; Mark et al., 2006b) age of pre-ore potassic alteration from
Ernest Henry (Fig. 2.22). It also overlaps in error with the youngest plutons of the Isan
Orogeny: the 1501 ± 9 Ma Capsize Granodiorite, and the 1493 ± 8 Ma Yellow
Waterhole Granite; Page and Sun, 1998). Although syn-ore molybdenite Re-Os ages

Chapter 2: Geology and Alteration
82
from Mount Elliott (1513 ± 5 Ma; Duncan et al., 2011) and Ernest Henry (~1525 Ma;
Mark et al., 2004) are distinctly older, the E1 Group age also overlaps with the
molybdenite Re-Os age of 1487 ± 5 Ma for mineralisation at the Lady Ella IOCG
prospect just south of Mount Elliott (Duncan et al., 2011). The oldest possible monazite
ages at E1 may therefore indicate the maximum age of mineralisation around 1500 Ma.
The youngest possible monazite age of 1410 Ma, based on the 10 points in Figure
2.13B, may represent a younger resetting event; the highly anomalous, concordant, ages
<1350 Ma are also likely reset. Although BSE imaging showed homogeneous monazite
crystals, it may be the case that some of the discordances and younger ages were caused
by mixing of monazite domains of different ages; most crystals were too small to ablate
in different spots, and in some instances U/Th ratios varied down-ablation hole (not
shown). The high closure temperature of monazite (725 ± 25°C; Parrish, 1990)
precludes thermal resetting, but minor hydrothermal alteration could result in Pb-loss
(e.g. Williams et al., 2011). It is possible that the monazite U-Pb age at E1 Group may
represent a mixture of both the late Cu-Au mineralising event around 1500 Ma–
synchronous with younger IOCGs such as Ernest Henry and Mount Elliott–as well as
with a resetting event much later (>100 Myr) than main Cu-Au mineralisation (e.g. the
Oak Dam IOCG deposit, Gawler Craton; Davidson et al., 2007). Resetting of the
monazite may have been related to late magmatism. Although no intrusions younger
than ~1500 Ma have been found in the Cloncurry district, Griffin et al. (2006) found
small detrital zircon populations sourced from the Eastern Fold Belt with concordant
ages between 1490–1420 Ma, and 1340–1280 Ma. They proposed that the ages could
represent primary igneous crystallization. It is possible, though unlikely, that there are
undiscovered 1490–1420 Ma intrusions in the EFB. The <1400 Ma monazite ages may
therefore indicate that the E1 Group of deposits were partly reset by hydrothermal fluids
related to such intrusions.
Nevertheless, the maximum ~1500 Ma age of E1 Group monazite, suggests that the
deposit is part of the syn-Williams-Naraku Batholith group of IOCGs, which includes
Ernest Henry, Monakoff, Mount Elliott, and Eloise. This is compatible with a regional
D4 timing of mineralisation proposed in Chapter 3.

Chapter 2: Geology and Alteration
83
Figure 2.22: A comparison of reported mineralisation ages in Cloncurry IOCGs. See text for references.
Epigenetic origin of banded magnetite at the E1 Group Following the geological evidence presented above, we propose the following evidence
of epigenetic origin for magnetite present in the E1 Group system.
1. Magnetite abundance (>30%) in laminated metasedimentary rocks decreases
away from the core of the E1 North orebody and grades into less-altered
marble containing chloritised actinolite porphyroblasts (Fig. 2.5F).
2. Abundant magnetite (locally up to 78 wt% Fe2O3) is present in both the
matrix and clasts of metavolcanic breccias (Figs. 2.5D, 2.7H), which is
atypical for intermediate volcanic rocks. The only possible sources of
secondary magnetite in the metavolcanic rocks are therefore from
remobilization of Fe in adjacent metasedimentary rocks, or from an external
source. The former source is unlikely, as this would require transport
distances greater than 10 m; this is orders of magnitude greater than the cm-
scale movement suggested for magnetite-sulfide remobilization of ironstones
in the Starra and Osborne systems (Oliver et al., 2008). Furthermore, the
metasedimentary rocks themselves are still highly magnetite-enriched (>70

Chapter 2: Geology and Alteration
84
wt%), which is opposite to the depletion expected if magnetite were
mobilized from the metasedimentary rocks into the metavolcanic rocks.
3. Northeast-southwest-trending faults at E1 North appear to focus magnetite
and chalcopyrite alteration (Fig. 2.19B), suggesting they served as a conduit
for fluids to transport these minerals from elsewhere, rather than from local
remobilization of sedimentary iron. The faults cut the folds and therefore
cannot be pre-Isan Orogeny basin-bounding faults.
An epigenetic origin was also proposed by Coleman (2015), who analysed trace-
elements in both laminated and infill magnetite from Ernest Henry and the E1 Group,
and magnetite from fresh, typical BIF from Western Australia. He found that the E1
Group laminated magnetite exhibited similar Si-Al-V-Ti-Mg-Zn-Cr-Co signatures to E1
Group infill magnetite, but was different from magnetite the Western Australia BIF. He
concluded that most magnetite present in the system was hydrothermal in origin with
only minor detrital magnetite. When coupled with the observations that Cloncurry
District IOCGs occur at varying stratigraphic levels, and in various types of host rocks,
these lines of evidence suggest that most of the IOCG-hosting iron-rich rocks in the
region are epigenetic.
Significance of discordant breccias at the E1 Group and Ernest Henry The Ernest Henry deposit is unique among other IOCGs in the region for being
completely hosted within hydrothermal breccias (Mark et al., 2000). This feature has led
to targeting of regionally abundant albite-magnetite-rich breccias by explorationists;
such breccias turned out to be mostly barren or only lightly mineralised.
The discordant breccias present in the E1 Group are consistent with the “Corella
Breccia” described in Ryburn et al. (1988) and Marshall (2003). The term was applied
to psuedobreccias formed by extreme boudinaging of Corella Formation, as well as to
polymictic breccias containing clasts of Corella metasedimentary and intrusive igneous
rocks, with the matrix containing hydrothermal minerals (Marshall, 2003). The E1
Group breccia is clearly more similar to the latter polymicitic style. The E1 Group
breccia is similar to the Ernest Henry ore breccia in terms of clast composition
(sedimentary rocks and porphyritic volcanic rocks with K-feldspar, albite, and hematite
alteration) and overall degree of clast support, but it is slightly more angular and

Chapter 2: Geology and Alteration
85
variable in size, and contains relatively finer-grained (<5 mm) cement than the Ernest
Henry breccia (up to 1 cm). Unlike the Ernest Henry ore breccia, the E1 Group breccia
is virtually barren and contains only minor mineralisation, disseminated in the breccia
or in carbonate veins that cut across the breccia.
Aside from the Ernest Henry ore breccia, Mark et al. (2000) reported barren, albitised
breccias around the orebody that are virtually identical to the discordant breccia present
at the E1 Group (Fig. 2.5M). Like the breccia at the E1 Group, these breccias are
overprinted by chalcopyrite mineralisation (Mark et al., 2000b). Considering that
crystallization duration for granites (<10 Myr; Patterson et al., 1992) can be less than
the uncertainties of Proterozoic ages, it is possible that the “Corella Breccias” which
formed between 1530–1520 Ma represent many separate hydrothermal brecciation
events, each associated with temporally indistinguishable, yet distinct, magmatic events.
The Ernest Henry ore breccia may represent one of these “Corella” brecciation events. It
is not entirely clear why this particular breccia became mineralised, but it may be
because other systems lacked Cu-Au, an additional fluid, or adequate structural conduits
to drive mixing and ore precipitation (e.g. Mark et al., 2006a; Rusk et al., 2010;
Williams et al., 2015).
Classification of the E1 Group in the iron oxide-Cu-Au family The E1 Group shares multiple characteristics with true IOCGs (e.g. Ernest Henry,
Olympic Dam, Salobo and Candelaria): a Cu-Au-Ba-F-P-U-REE-Co-Mo geochemical
assemblage, albite and magnetite-biotite-K-feldspar alterations, and fault-shear zone
associations (Table 2.6).

86
Table 2.6: Characteristics of major IOCG and IOCG-related deposits
District Deposit Metals Enrichments Dominant ore Dominant gangue Mineralisation styles Host rocks References
Gawler Craton
Olympic Dam
Cu, U, Au, Ag
Fe, Ba, F, P, LREE, Co,
Mo
Chalcopyrite, bornite,
chalcocite, uraninite
hematite (upper), magnetite (lower), quartz, sericite,
carbonate, fluorite, barite
matrix-supported hydrothermal breccia,
crackle-breccia and veins
brecciated granite, metasedimentary and metavolcanic vocks
Roberts and Hudson, 1983; Reynolds, 2000
Candelaria-Punta del
Cobre Candelaria Cu, Au,
Ag Fe, Zn, Mo,
LREE Chalcopyrite magnetite, hematite, pyrite,
actinolite, biotite, K-feldspar, carbonate, epidote
layer/matrix-controlled to massive; brecciation and
veins
siltstone, andesite, dacite, sedimentary breccia
Marschik, et al 2000; Marshik and Fontboté,
2001
Carajás Salobo Cu, Au Fe, F, P, U, REE, Co, Mo
Bornite, chalcocite,
chalcopyrite magnetite, biotite massive amphibolite, metagraywacke,
quartzite, banded ironstone Requia and Fontboté,
2000; Requia et al, 2003
Cloncurry Syn-
Williams-Naraku
Batholith
E1 Group Cu, Au, Fe, Ba, F, P, U,LREE, Co,
Mo Chalcopyrite magnetite, carbonate, barite,
fluorite, biotite
layer/matrix-controlled to massive replacement; some
veins
metavolcanic breccia, metatuff, marble, metapsammite,
metasiltstone this study
Ernest Henry Cu, Au,
Fe, Ba, F, P, U,LREE, Co,
Mo Chalcopyrite magnetite-hematite, carbonate,
fluorite, barite
matrix-supported hydrothermal breccia,
crackle-breccia and veins
brecciated intermediate metavolcanic rocks,
metapsammite, marble, metasiltstone, metashale
this study; Mark et al., 2006b
Monakoff Cu, Au, Fe, Ba, F, P, U,LREE, Co,
Mo Chalcopyrite magnetite, fluorite, barite,
carbonate
massive to layered replacement; dilational
infill banded ironstone? Williams et al., 2015
Mt. Elliott-SWAN Cu, Au
Fe, P, F, Co, Ni, LREE,
Te, Se Chalcopyrite magnetite, pyrrhotite, pyrite,
diopside, andradite, calcite open space infill, breccia,
massive skarn carbonaceous metapelites,
metagreywackes, amphibolites Wang and Williams,
2001
Eloise Cu, Au Fe, Ag, Co, Ni, Zn, F, P Chalcopyrite
pyrrhotite, pyrite, magnetite, albite, amphibole, biotite, quartz,
calcite, chlorite,
breccias, veins, replacement bodies
amphibolite, quartz-biotite-schist, garnet psammite Baker, 1998
Cloncurry Pre-
Williams-Naraku
Batholith
Osborne Cu, Au
Fe, Co, Bi, W, Se, Hg,
Te, Cl, Sn, P, B, Mo
Chalcopyrite magnetite, carbonate, pyrrhotite massive to layered
replacement; breccia and veins
feldspathic metapsammite, ironstone
Adshead, 1995 Fisher and Kendrick,
2008; Oliver et al., 2004
Starra Cu, Au Fe, Co, W,
Sn, F, Mo, Y, REE
Chalcopyrite, bornite,
chalcocite
magnetite, quartz, carbonate, anhydrite, hematite
massive to layered replacement and brecciated
psammite, albitised metasiltstone, schist,
amphibolite, ironstone
Rotherham, 1997; Oliver et al., 2004
Duncan et al., 2014
Chapter 2: Geology and A
lteration
Chapter 2: Geology and Alteration
87
However, the E1 Group has some unique features when compared to IOCGs from the
southern Cloncurry District IOCGs (Starra, Osborne, Mount Elliott-SWAN, Eloise),
which lack substantial Ba-U enrichment (Table 2.6). Unlike the E1 Group, Osborne and
Eloise are not enriched in REE, though these elements are abundant at Mount Elliott
and enriched at Starra (Table 2.6). The geochemistry of the E1 Group is also distinct
from true IOCG deposits such as Olympic Dam, Prominent Hill, Salobo, Candelaria,
and Ernest Henry (Groves et al., 2010). For example, the E1 Group has much higher Ba
(up to 22 wt%) and F (up to 8%) abundance than Ernest These deposits. Its U and total
REE (~1500ppm) content, however, are much lower than Olympic Dam (~5000ppm;
Oreskes and Einaudi, 1990). It is possible that the E1 Group and the nearby Monakoff
(e.g. Williams et al., 2015) deposits represent geochemical end-members of the Cu-Au-
U-REE-Ba-F IOCG assemblage with very high Ba-F content.
Mineralogically, the E1 Group is similar to other IOCG deposits in the Cloncurry
District in that it contains abundant magnetite and some apatite and pyrite (Table 2.6).
Indeed, most of the Fe-oxide Cu-Au orebodies in the region are magnetite-dominated;
the Starra and Osborne deposits and Airport prospects, which also contain substantial
hematite, are exceptions to this. The E1 Group also hosts early sodic and ferric/ferrous-
potassic (-P) alteration assemblages typical of most IOCGs. Interestingly, the
paragenetic sequence of the E1 Group is very similar to those of the nearby Ernest
Henry and Monakoff IOCGs (Fig. 2.10) – all three are characterised by potassc-
ferric/ferrous alteration followed by Ba-F-U-REE-enriched mineralisation. The main
difference is that Monakoff lacks appreciable early sodic-calic alteration.
In contrast, the E1 Group is notably different from other Cloncurry District IOCGs in
several aspects. For example, the southern deposits are generally less sulfate-rich,
though Starra does contain some anhydrite and minor barite. Additionally, although the
E1 Group is hosted mainly in carbonate-rich rocks, it lacks appreciable calcic (garnet,
pyroxene) alteration like the skarn-rich Mount Elliott deposit, which has been classified
as a skarn-like IOCG (Wang and Williams, 2001; Groves et al., 2010). When compared
to deposits in other districts, the E1 Group is unique in that it lacks the abundant
amphibole, associated with early sodic alteration, found in Ernest Henry, Olympic Dam
and Sossego (Moreto et al., 2015). The E1 Group is similar to Olympic Dam, in that
some ores contain abundant barite (up to 38 wt%) and fluorite (up to 17 wt%). The E1

Chapter 2: Geology and Alteration
88
Group and Ernest Henry, however, are both dominated by magnetite whereas Olympic
Dam is hematite-dominated except in the deepest part of the system.
True IOCG deposits exhibit strong structural control (Groves et al., 2010). This control
is exemplified by the presence of IOCG systems adjacent to, or within, fault and shear
zones, such as in the case of Ernest Henry, Candelaria, Starra, Osborne, Monakoff, and
Salobo (Adshead-Bell, 1998; Marschik and Fontboté, 2001; Requia et al., 2003; Mark et
al., 2006b; Fisher and Kendrick, 2008). Although E1 Group mineralisation is
dominantly controlled by protolith, the ore fluids were introduced to the receptive host
rocks through shearing, multiple faults, and fold hinges, suggesting a high degree of
structural control on the system. The chemical similarities between the E1 Group,
Ernest Henry, Olympic Dam and Salobo suggest that breccia mineralisation textures are
not a useful defining feature of IOCG-style deposits. Rather, they are probably
determined by deposit-scale variations in the nature (brittle or ductile) and degree of
structural deformation of the host rocks (see Chapter 3).
To summarise, the E1 Group exhibits all of the major characteristics of true IOCG
deposits, including Ba-F-U-REE enrichment, Na-K-Fe alteration, strong structural
control, and potentially temporal association with felsic intrusions, but varies
considerably in chemistry and mineralogy from the most well-known IOCG deposits.
Implications for IOCG Genesis and Exploration The similarities in paragenesis and ore chemistry between the E1 Group, Ernest Henry
and Monakoff suggests these systems formed from a similar type of hydrothermal fluid
that was present over an area of 120 km2 between the deposits, thus making the area
highly prospective for additional exploration. These similarities also imply that
brecciation is not necessary for the formation of small and medium-sized orebodies.
Indeed, large, mineralised hydrothermal breccia systems like Ernest Henry are the
exception rather than the norm in the Eastern Fold Belt. Replacement of shear zones and
chemically reactive host rocks is a more common IOCG phenomenon as evidenced by
numerous moderately-sized orebodies like the E1 Group, Osborne, Starra and
Monakoff. Brecciation, however, is likely to be important for generating high enough
permeability to form IOCGs with size and grades comparable to Ernest Henry. The
absence of brecciation at the E1 Group and Monakoff may help explain their high barite
and fluorite concentrations. Barium and fluorine in Stage 2 K-feldspar and fluorapatite

Chapter 2: Geology and Alteration
89
indicate that both elements were present in the hydrothermal fluid(s) before and during
ore deposition. It is hypothesized that protracted replacement at the E1 Group over
multiple paragenetic stages, presumably associated with minor volume change, led to
increasing total Ba-F content over time. This is consistent with the observed tendency
for fluorite to replace F-rich biotite in the E1 Group ores, as well as with the apparent
lack of fluorapatite in ores, which was probably also replaced by fluorite. In contrast,
brecciation and infill during ore formation at Ernest Henry probably caused a much
greater increase in the overall volume of the system (e.g, Oliver et al., 2006), and
therefore diluted these elements over multiple stages in a more open system.
Fluorine and barium are potential vectoring elements to the E1 Group orebody.
Anomalously-high fluorine is traceable for >100 m around the orebody, and it probably
occurs mostly in apatite and biotite. Ernest Henry and the E1 Group are both
characterised by magnetite-apatite haloes extending over 200 m outside of the orebody.
Barium is also above background levels for at least 100 m outside of the E1 Group ore
zone.
Conclusions The E1 Group of iron oxide-Cu-Au deposits is hosted in a sequence of metatuff, marble,
metavolcanic breccia, metasiltstone, metashale, and variably-porphyritic and
amygdaloidal metavolcanic rocks of the ~1740 Ma Corella Formation and Mount Fort
Constantine Volcanics of upper Cover Sequence 2, which was intruded by diorite, then
brecciated, then intruded by dolerite prior to mineralisation. The geometry of the deposit
is characterised by north-northwest-plunging folds that are cut by faults and shear zones
coincident with mineralisation. The E1 Group has a Cu-Au-Ba-F-Mn-U-REE-As-Mo-
Co-rich ore assemblage, similar to the nearby Ernest Henry IOCG deposit, but the
mineralisation style of the E1 Group is dominantly characterised by layer- and matrix-
controlled replacement of metasediment and metavolcanic rocks, whereas Ernest Henry
is entirely hosted in a breccia. The alteration paragenesis occurred in three major stages,
with the second stage divided into three substages: 1) early albitisation, 2a)
ferric/ferrous-potassic magnetite-biotite-apatite-K-feldspar-pyrite, 2b) intermediate
albitisation, 2c) early carbonate flooding and mineralisation, and 3) late carbonate-
barite-fluorite flooding and main mineralisation. Whole-rock geochemistry and MLA
analysis shows that the E1 Group orebody contains significantly more barite and
Chapter 2: Geology and Alteration
90
fluorite alteration (associated with Stage 3) than most IOCGs, and at E1 North both are
most abundant in the deeper portion of the orebody. Barium and fluorine concentrations
in the sampled area exceed average crustal values, suggesting either a source rich in Ba
and F, or an anomalously high regional background.
An epigenetic origin, at 1456 ± 44 Ma, is proposed for both the E1 Group
mineralisation and the magnetite in the banded, iron-rich host rocks, based on a
combination of drill core and thin section observations, and geochemical data. Despite
the contrasting mineralisation style between the E1 Group and the classic IOCG Ernest
Henry, the former fits within the family of iron oxide-copper-gold deposits sensu
stricto, and is more similar to Ernest Henry than to the Osborne or the Starra deposits in
the Cloncurry district. E1 Group mineralisation is mostly dependent on a combination
of structures and host rock permeability and chemical suitability. The E1 Group
contains comparable copper resources to Starra, and a similar amount to Osborne
(though the latter two systems are more Au-rich), indicating that brecciation is not
necessary to produce moderately large copper orebodies in the Cloncurry District.
Furthermore, the pre-mineralisation timing of hydrothermal breccias at E1 suggests that
similar breccias in this area are not related to mineralisation, and that the Ernest Henry
breccia represents a separate event. Alternatively, it is possible that there were multiple
stages of Cu-Au-bearing fluids in the area, but that the early breccias did not focus the
metals. Barium and fluorine enrichment at E1 may be the result of temporally protracted
enrichment through replacement, as opposed to Ernest Henry-style brecciation that may
have diluted these elements in a more open system. The similarity in ore chemistry and
parageneses of Ernest Henry, E1 and Monakoff suggests these deposits were formed
from similar types of hydrothermal fluids, consequently making this area highly
prospective for additional deposits.
Chapter 2: Geology and Alteration
91
References
Abu Sharib, A.S. a. a., and Bell, T.H., (2011). Radical changes in bulk shortening directions during orogenesis: Significance for progressive development of regional folds and thrusts: Precambrian Research, 188, p.1–20.
Adshead, N. D., (1995). Geology, Alteration and Geochemistry of the Osborne Cu-Au Deposit, Cloncurry District, N.W. Queensland, Australia: PhD thesis, James Cook University, QLD, Australia.
Adshead-Bell, N., (1998). Evolution of the Starra and Selwyn high-strain zones, Eastern fold belt, Mount Isa Inlier; implications for Au-Cu mineralisation: Economic Geology, 93, p.1450–1462.
Aitchison, J., (1986). The statistical analysis of compositional data: Chapman and Hall, London, UK, 416p.
Armstrong, J.T., (1988). Quantitative analysis of silicate and oxide materials: in Newbury, D.E. (ed.)
1988, Microbeam Analysis, San Francisco Press, Inc., San Fransisco, CA, United States, p.239–246.
Baker, T., (1998). Alteration, mineralisation, and fluid evolution at the Eloise Cu-Au deposit, Cloncurry District, northwest Queensland, Australia: Economic Geology, 93, p.1213–1236.
Baker, T., Perkins, C., Blake, K. L., and Williams, P. J., (2001). Radiogenic and stable isotope constraints on the genesis of the Eloise Cu-Au deposit, Cloncurry district, northwest Queensland: Economic Geology, 96, p.723–742.
Bertelli, M., and Baker, T., (2010). A fluid inclusion study of the Suicide Ridge Breccia Pipe, Cloncurry district, Australia: Implication for Breccia Genesis and IOCG mineralisation: Precambrian Research, 179, p.69–87.
Betts, P.G., Armit, R.J., Hutton, L.J., Withnall, I.W., and Donchak, P.J.T., (2011). Proterozoic Mount Isa synthesis: in Northwest Queensland Minerals and Energy Province Report, Appendix 1. Queensland Department of Employment, Economic Development and Innovation, Brisbane, 56p.
Betts, P., and Giles, D., (2006). The 1800–1100Ma tectonic evolution of Australia: Precambrian Research, 144, p.92–125.
Chapter 2: Geology and Alteration
92
Blake, D.H., (1987). Geology of the Mount Isa Inlier and environs, Queensland and Northern Territory: Bureau of Mineral Resources, Geology and Geophysics Bulletin: 225, Department of Resources and Energy, Canberra, ACT, Australia, 83p.
Blake, D.H., Etheridge, R.J., Page, R. W., Stewart, A.J., Williams, P.R., and Wyborn, L.A.I., (1990). Mount Isa Inlier - regional geology and mineralisation: in: Hughes, F.E. (Ed.), Geology of the Mineral Deposits of Australia and Papua New Guinea: Australian Institute of Mining and Metallurgy Monagraph 14, p.915–925.
Blake, D.H. and Stewart, A.J., (1992). Stratigraphic and tectonic framework, Mount Isa Inlier: in Stewart, A. and Blake, D.H. (eds.), Detailed Studies of the Mount Isa Inlier: Australia Geological Survey Bulletin, 243, p.1–11.
Blake, K. L., Pollard, P. J., and Xu, G., (1997). Alteration and mineralisation in the Mount Fort Constantine volcanics, Cloncurry district, northwest Queensland: in: Pollard, PJ (ed.) AMIRA P438: Cloncurry Base Metals and Gold Final Report, Australian Institute of Mining and Metallurgy, 53p.
Carson, C.J., Hutton, L.J., Withnall, I.W., Perkins, W.G., Donchak, P.J.T., Parsons, A., Blake, P.R., Sweet, I.P., Neumann, N.L. and Lambeck, A., (2011). Summary of results: Joint GSQ-GA NGA geochronology project, Mount Isa region, 2009–2010: Queensland Geological Record 2011/03, Geological Survey of Queensland, Brisbane, QLD, Australia.
Coleman, R., (2015). Magnetite geochemistry and its implication on the genesis of magnetite in laminated rocks in the E1 Group deposits, Cloncurry District, Queensland, Australia: Honours thesis, James Cook University, Townsville, QLD, Australia.
Davidson, G. J., (1998). Variation in copper - gold styles through time in the Proterozoic Cloncurry goldfield , Mt Isa Australian Journal of Earth Sciences, 45(3), p.445–462.
Davidson, G., and Large, R., (1994). Gold metallogeny and the copper-gold association of the Australian Proterozoic: Mineralium Deposita, 29, p.208–223.
Davidson, G.J., Paterson, H., Meffre, S., and Berry, R.F., (2007). Characteristics and origin of the oak dam East Breccia-Hosted, iron oxide Cu-U-(Au) Deposit: Olympic Dam region, Gawler Craton, South Australia: Economic Geology, 102(8), p.1471–1498.

Chapter 2: Geology and Alteration
93
Davis, B.K., Pollard, P.J., Lally, J.H., McNaughton, N.J., Blake, K., and Williams, P.J., (2001). Deformation history of the Naraku Batholith, Mt Isa Inlier, Australia: Implications for pluton ages and geometries from structural study of the Dipvale Granodiorite and Levian Granite: Australian Journal of Earth Sciences, 48, p.113–129.
Davis, D.W., Schandl, E.S., and Wasteneys, H.A., (1994). U-Pb dating of minerals in alteration halos of Superior Province massive sulfide deposits: syngenesis versus metamorphism: Contributions to Mineralogy and Petrology, 115, p.427–437.
Duncan, R.J., Hitzman, M.W., Nelson, E.P., and Togtokhbayar, O., (2014). Structural and Lithological Controls on Iron Oxide Copper-Gold Deposits of the Southern Selwyn-Mount Dore Corridor, Eastern Fold Belt, Queensland, Australia: Economic Geology, 109, p.419–456.
Duncan, R.J., Stein, H., Evans, K., Hitzman, M., Nelson, E., and Kirwin, D., (2011). Geochronological Framework for Mineralisation and Alteration in the Selwyn-Mount Dore Corridor, Eastern Fold Belt, Mount Isa Inlier, Australia: Genetic Implications. Economic Geology, 106(2), p.169–192.
Ehrig, K., (2015). Olympic Dam - Future Directions: BHP - Billiton Presentation, 11 Dec 2015, 28p. Retrieved 4 May 2016 from http://www.saexplorers.com.au/presentations/2015/1600ehrig.pdf.
Ehrig, K., Kamenetsky, V.S., Kamenetsky, M., Cook, N.J., Ciobanu, C.L., and Haynes, D., (2015). Olympic Dam Fe Oxide Cu-U-Au-Ag Deposit: Discovery to Recovery, SEG 2015 World-Class Ore Deposits: Discovery to Recovery, Sep. 27–30 2015, Hobart, TAS, Australia.
Fisher, L., and Kendrick, M., (2008). Metamorphic fluid origins in the Osborne Fe oxide-Cu-Au deposit, Australia: evidence from noble gases and halogens. Mineralium Deposita, 43, p.483–497.
Foster, D., and Austin, J., (2008). The 1800-1610Ma stratigraphic and magmatic history of the Eastern Succession, Mount Isa Inlier, and correlations with adjacent Paleoproterozoic terranes: Precambrian Research, 163(1–2), p.7–30.
GabbroSoft, (2011). Apatite Calculation Sheet: GabbroSoft, http://www.gabbrosoft.org/index.html.
Gauthier L., Hall G., Stein H. and Schaltegger, U., 2001, The Osborne deposit, Cloncurry district: a 1595 Ma Cu-Au skarn deposit: in Williams P. J. (ed.), 2001: A Hydrothermal Odyssey, Extended Conference Abstracts: James Cook University, Townsville, QLD, Australia, p.58–59.

Chapter 2: Geology and Alteration
94
Geological Survey of Queensland, (2011). Northwest Queensland Minerals and Energy Province Report. Queensland Department of Employment, Economic Development and Innovation, Brisbane, 102p.
Giles, D., Ailléres, L., Jeffries, D., Betts, P., and Lister, G., (2006). Crustal architecture of basin inversion during the Proterozoic Isan Orogeny, Eastern Mount Isa Inlier, Australia: Precambrian Research, 148(1–2), p.67–84.
Giles, D., and Nutman, A., (2002). SHRIMP U-Pb monazite dating of 1600-1580 Ma amphibolite facies metamorphism in the southeastern Mt Isa Block, Australia: Australian Journal of Earth Sciences, 49, p.455–465.
Griffin, W.L., Belousova, E. a., Walters, S.G., and O’Reilly, S.Y., (2006). Archaean and Proterozoic crustal evolution in the Eastern Succession of the Mt Isa district, Australia: U – Pb and Hf-isotope studies of detrital zircons: Australian Journal of Earth Sciences, 53, p.125–149.
Groves, D. I., Bierlein, F. P., Meinert, L. D., and Hitzman, M. W., (2010). Iron oxide copper-gold (IOCG) deposits through Earth history: Implications for origin, lithospheric setting, and distinction from other epigenetic iron oxide deposits: Economic Geology, 105, p.641–654.
Hammerli, J., Spandler, C., Oliver, N.H.S., and Rusk, B., (2014). Cl/Br of scapolite as a fluid tracer in the earth’s crust: insights into fluid sources in the Mary Kathleen Fold Belt, Mt. Isa Inlier, Australia: Journal of Metamorphic Geology, 32, p.93–112.
Hatton, O., and Davidson, G., (2004). Soldiers Cap Group iron-formations, Mt Isa Inlier, Australia, as windows into the hydrothermal evolution of a base-metal-bearing Proterozoic rift basin: Australian Journal of Earth Sciences, p.37–41.
Hayward, N. and Skirrow, R.G., (2010). Geodynamic setting and controls on iron oxide Cu-Au (±U) ore in the Gawler Craton, South Australia: in Porter, T.M., (ed.), Hydrothermal Iron Oxide Copper-Gold and Related Deposits: A Global Perspective: PGC Publishing, 3, Adelaide, SA, Australia, p.119–146.
Hitzman, M. W. (2000). Iron oxide-Cu-Au deposits: What, where, when and why: in Porter, T. M. (ed.) Hydrothermal Iron Oxide Copper-Gold and Related Deposits: A Global Perspective: PGC Publishing, 1, Adelaide, SA, Australia, p.9–25.
Hitzman, M. W., Oreskes, N., and Einaudi, M. T., (1992). Geological characteristics and tectonic setting of Proterozoic iron oxide (Cu-U-Au-REE) deposits: Precambrian Research, 58(1–4), p.241–287.

Chapter 2: Geology and Alteration
95
Jackson, M.J., Scott, D.L., and Rawlings, D.J., (2000). Stratigraphic framework for the Leichhardt and Calvert superbasins: Review and correlations of the pre-1700 Ma successions between Mt Isa and McArthur River: Australian Journal of Earth Sciences, 47, p.381–403.
Knipping, J.L., Bilenker, L.D., Simon, A.C., Reich, M., Barra, F., Deditius, A.P., Lundstrom, C., Bindeman, I., and Munizaga, R., (2015). Giant Kiruna-type deposits form by efficient flotation of magmatic magnetite suspensions: Geology, 43, p.591–594.
Mark, G., Oliver, N. H. S., and Carew, M. J., (2006a). Insights into the genesis and diversity of epigenetic Cu - Au mineralisation in the Cloncurry district, Mt Isa Inlier, northwest Queensland: Australian Journal of Earth Sciences, 53(1), p.109–124.
Mark, G., Oliver, N. H. S., and Williams, P. J., (2006b). Mineralogical and chemical evolution of the Ernest Henry Fe oxide-Cu-Au ore system, Cloncurry district, northwest Queensland, Australia: Mineralium Deposita, 40(8), p.769–801.
Mark, G., Oliver, N.H.S., Williams, P.J., Valenta, R.K. and Crookes, R.A., (2000). The evolution of the Ernest Henry Fe-Oxide-(Cu-Au) hydrothermal system: in: Porter, T. M. (ed.) Hydrothermal Iron Oxide Copper-Gold and Related Deposits: A Global Perspective: PGC Publishing, 1, Adelaide, SA, Australia, p.123–136.
Mark, G.M., Stein, H. and Salt, C., (2004). Re-Os isotopic evidence for two periods of sulfide mineralisation in the vicinity of the Ernest henry Cu-Au deposit, northwest queensland, australia. in: AGC Geological Society of Australia: Proceedings, 17th. p.96.
Marschik, R., and Fontboté, L., (2001). The Candelaria-Punta del Cobre iron oxide Cu-Au (-Zn-Ag) deposits, Chile. Economic Geology, 96, p.1799–1826.
Marschik, R., Leveille, R.A. Martin, W., (2000). La Candelaria and the Punta del Cobre District, Chile: Early Cretaceous Iron-Oxide Cu-Au(-Zn-Ag) Mineralisation: in Porter, T.M. (Ed.), Hydrothermal Iron Oxide Copper-Gold and Related Deposits: A Global Perspective: PGC Publishing, 1, Adelaide, SA, Australia, p.163–175.
Marshall L.J., (2003). Brecciation within the Mary Kathleen Group of the Eastern Succession, Mt Isa Block, Australia: Implications of District-scale Structural and Metasomatic Processes for Fe-oxide-Cu-Au Mineralisation: unpublished PhD Thesis: James Cook University, Townsville, QLD, Australia.

Chapter 2: Geology and Alteration
96
Marshall, L.J. and Oliver, N.H.S., (2008). Constraints on hydrothermal fluid pathways within Mary Kathleen Group stratigraphy of the Cloncurry iron-oxide–copper–gold District, Australia: Precambrian Research, 163, p.151–158.
McDonough, W.F., and Sun, S. -s., (1995). The composition of the Earth: Chemical Geology, 120, p.223–253.
McDonough, W.F., Sun, S. -s., Ringwood, A. E., Jagoutz, E., and Hofmann, A. W., (1992). Potassium, rubidium, and cesium in the Earth and Moon and the evolution of the mantle of the Earth. Geochimica et Cosmochimica Acta, 56(3), p.1001–1012.
McLellan, J.G., Mustard, R., Blenkinsop, T., Oliver, N. H. S., and McKeagney, C., (2010). Critical ingredients of IOCG mineralisation in the Eastern Fold Belt of the Mount Isa Inlier: Insights from combining spatial analysis with mechanical numerical modeling: in: Porter, T. M. (ed.) Hydrothermal Iron Oxide Copper-Gold and Related Deposits: A Global Perspectiv: PGC Publishing, 3, Adelaide, SAAustralia, p.233–256.
McPhie, J., Doyle, M., Allen, R. L., and Allen, R., (1993). Volcanic textures: a guide to the interpretation of textures in volcanic rocks: CODES, University of Tasmania.
Moreto, C.P.N., Monteiro, L.V.S., Xavier, R.P., Creaser, R.A., Dufrane, S.A., Tassinari, C.C.G., Sato, K., Kemp, A.I.S., and Amaral, W.S., (2015). Neoarchean and Paleoproterozoic Iron Oxide-Copper-Gold Events at the Sossego Deposit, Carajás Province , Brazil -Os and U-Pb Geochronological Evidence: Economic Geology, 110, p.809–835.
Nachit, H., Ibhi, A., Abia, E.H., and Ben Ohoud, M., (2005). Discrimination between primary magmatic biotites, reequilibrated biotites and neoformed biotites: Comptes Rendus Geoscience, 337(16), p.1415–1420.
Neumann, N.L., Southgate, P.N., and Gibson, G.M., (2009). Defining unconformities in Proterozoic sedimentary basins using detrital geochronology and basin analysis-An example from the Mount Isa Inlier, Australia: Precambrian Research, 168, p.149–166.
O’dea, M. G., Betts, P. G., MacCready, T., andAillères, L., (2006). Sequential development of a mid-crustal fold-thrust complex: evidence from the MitakoodiCulminationin the eastern Mt Isa Inlier, Australia. Australian Journal of Earth Sciences, 53, p.69–90.

Chapter 2: Geology and Alteration
97
O’dea, M. G., Lister, G. S., Maccready, T., Betts, P. G., Oliver, N. H. S., Pound, K. S., and Valenta, R. K., (1997). Geodynamic evolution of the Proterozoic Mount Isa terrain: Geological Society of London Special Publications, 121(1), p.99–122.
Oliver, N., Butera, K., Rubenach, M., Marshall, L., Cleverley, J., Mark, G., Tullemans, F., and Esser, D., (2008). The protracted hydrothermal evolution of the Mount Isa Eastern Succession: A review and tectonic implications: Precambrian Research, 163(1-2), p.108–130.
Oliver, N.H.S., Cleverley, J.S., Mark, G., Pollard, P.J., Bin, F., Marshall, L.J., Rubenach, M.J., Williams, P.J., and Baker, T., (2004). Modeling the role of sodic alteration in the genesis of iron oxide-copper-gold deposits, eastern Mount Isa block, Australia: Economic Geology, 99, p.1145–1176.
Oliver, N.H.S., Rubenach, M.J., Fu, B., Baker, T., Blenkinsop, T.G., Cleverley, J.S., Marshall, L.J., and Ridd, P.J., (2006). Granite-related overpressure and volatile release in the mid crust: fluidized breccias from the Cloncurry District, Australia: Geofluids, 6, p.346–358.
Oreskes, N., and Einaudi, M., (1990). Origin of rare earth element-enriched hematite breccias at the Olympic Dam Cu-U-Au-Ag deposit, Roxby Downs, South Australia: Economic Geology, 85, p.1–28.
Page, R.W., and Sun, S., (1998). Aspects of geochronology and crustal evolution in the Eastern Fold Belt, Mt Isa Inlier: Australian Journal of Earth Sciences, 45, p.343–361.
Paquette, J.L., and Tiepolo, M., (2007). High resolution (5μm) U-Th-Pb isotope dating of monazite with excimer laser ablation (ELA)-ICPMS: Chemical Geology, 240, p.222–237.
Parrish, R., (1990). U-Pb dating of monazite and its application to geological problems: Canadian Journal of Earth Sciences, 27, p.1431–1450.
Passchier, C.W., (1992). Geology of Myubee area, Mount Isa Inlier, Queensland: in in Stewart, A. and Blake, B.H. (ed.), Detailed Studies of the Mount Isa Inlier: Australia Geological Survey Bulletin, 243, p.199–208.
Paterson, S.R., and Tobisch, O.T., (1992). Rates of processes in magmatic arcs: implications for the timing and nature of pluton emplacement and wall rock deformation: Journal of Structural Geology, 14, p.291–300.

Chapter 2: Geology and Alteration
98
Pearce, J. A., (1996). A user's guide to basalt discrimination diagrams: in: Wyman, D. A. (ed.) Trace Element Geochemistry of Volcanic Rocks: Applications for Massive Sulfide Exploration: Geological Association of Canada, Short Course Notes 12, p.79–113.
Pearce, J.A., Harris, N.B.W., and Tindle, A.G., (1984). Trace element discrimination diagrams for the tectonic interpretation of granitic rocks: Journal of Petrology, 25, p.956–983.
Peterman, E.M., Mattinson, J.M., and Hacker, B.R., (2012). Multi-step TIMS and CA-TIMS monazite U-Pb geochronology: Chemical Geology, 312–313, p.58–73.
Pollard P.J. and McNaughton N., (1997). U-Pb geochronology and Sm/ Nd isotope characteristics of Proterozoic intrusive rocks in the Cloncurry district, Mount Isa Inlier, Australia: in: Pollard, PJ (ed.) AMIRA P438: Cloncurry Base Metals and Gold Final Report, Australian Institute of Mining and Metallurgy, 19p.
Pollard, P.J. and Perkins, C., (1997). 40Ar/39Ar geochronology of alteration and Cu-Au-Co mineralisation in the Cloncurry District, Mount Isa Inlier: in: Pollard, PJ (ed.) AMIRA P438: Cloncurry Base Metals and Gold Final Report, Australian Institute of Mining and Metallurgy, 40p.
Requia, K.and Fontboté, L., (2000). The Salobo iron oxide copper-gold deposit, Carajás, Northern Brazil: in Porter, T.M. (ed.), Hydrothermal Iron Oxide Copper-Gold and Related Deposits: A Global Perspective: PGC Publishing, 1, Adelaide, SA, Australia, p.225–236.
Requia, K., Stein, H., Fontbote, L., and Chiaradia, M., (2003). Re-Os and Pb-Pb geochronology of the Archean Salobo iron oxide copper-gold deposit, Carajás mineral province, northern Brazil. Mineralium Deposita, 38(6), p.727–738.
Reinhardt, J., (1992). The Corella Formation of the Rosebud Syncline (central Mount Isa Inlier): deposition, deformation, and metamorphism: in Stewart, A. and Blake, B.H. (ed.), Detailed Studies of the Mount Isa Inlier: Australia Geological Survey Bulletin, 243, p.229–255.
Reimann, C., Filzmoser, P. and Garrett, R.G., (2005) Background and threshold: critical comparison of methods of determination: Science of the Total Environment, 346, p.1–16.
Reynolds, L.J., (2000). Geology of the Olympic Dam Cu-U-Au-Ag-REE deposit: in Porter, T. M. (ed.) Hydrothermal Iron Oxide Copper-Gold and Related Deposits: A Global Perspective: PGC Publishing, 1, Adelaide, SA, Australia, p.93–104.

Chapter 2: Geology and Alteration
99
Roberts, D., and Hudson, G., (1983). The Olympic Dam copper-uranium-gold deposit, Roxby Downs, SA: Economic Geology, 78(5), p.799–822.
Rotherham, J., (1997). A metasomatic origin for the iron-oxide Au-Cu Starra orebodies, eastern fold belt, Mount Isa Inlier: Mineralium Deposita, 32, p.205–218.
Rubenach, M. (2013). Structural controls of metasomatism on a regional scale, in Metasomatism and the Chemical Transformation of Rock, Harlov, D. and Austrheim, H: Springer, 2013, Chap. 4, p.93–140.
Rubenach, M., Foster, D., Evins, P., Blake, K., and Fanning, C., (2008). Age constraints on the tectonothermal evolution of the Selwyn Zone, Eastern Fold Belt, Mount Isa Inlier: Precambrian Research, 163, p.81–107.
Rubenach, M., and Lewthwaite, K., (2002). Metasomaticalbitites and related biotite-rich schists from a low-pressure polymetamorphic terrane, Snake Creek Anticline, Mount Isa Inlier, north-eastern Australia: microstructures and P-T-d paths: Journal of Metamorphic Geology, 20, p.191–202.
Rusk, B.G., Oliver, N.H.S., Cleverley, J.S., Blenkinsop, T.G., Zhang, D., Williams, P.J. and Habermann, P., (2010). Physical and Chemical Characteristics of the Ernest Henry Iron Oxide Copper Gold Deposit, Australia; Implications for IOCG Genesis: in Porter, T.M., (ed.), Hydrothermal Iron Oxide Copper-Gold and Related Deposits: A Global Perspective: PGC Publishing, 3, Adelaide, SA, Australia p.201–218.
Ryburn R. J., Wilson I. H., Grimes R. M. and Hill R. M., (1988). Cloncurry, Queensland, 1:100 000 geological map commentary: Bureau of Mineral Resources, Canberra, ACT, Australia.
Scott, D.L., Bradshaw, B.E., and Tarlowski, C.Z., (1998). The tectonostratigraphic history of the Proterozoic Northern Lawn Hill Platform, Australia: An integrated intracontinental basin analysis: Tectonophysics, 300, p.329–358.
Sylvester, P., (2012). Use of the Mineral Liberation Analyser (MLA) for mineralogical Studies of sediments and sedimentary rocks, in Mineralogical Association of Canada Short Course 42, St. John’s NL, p.1–16.
Twyerould, S.C., (1997). The geology and genesis of the Ernest Henry Fe-Cu-Au deposit, northwest Queensland, Australia: PhD thesis, University of Oregon, Eugene, OR, United States, 494p.
Wang, S., and Williams, P. J., (2001). Geochemistry and origin of Proterozoic skarns at the Mount Elliott Cu-Au(-Co-Ni) deposit, Cloncurry district, NW Queensland, Australia. Mineralium Deposita, 36(2), p.109–124.

Chapter 2: Geology and Alteration
100
Weaver, B.L. and Tarney, J., (1984). Major and trace element composition of the continental lithosphere: Physics and Chemistry of the Earth, 15, p.39–68.
Wedepohl, K.H., (1995). The composition of the continental crust: Geochimica et cosmochimica Acta, 59, p.1217–1232.
Williams, M.R., Holwell, D. A., Lilly, R.M., Case, G.N.D., and McDonald, I., (2015). Mineralogical and fluid characteristics of the fluorite-rich Monakoff and E1 Cu–Au deposits, Cloncurry region, Queensland, Australia: Implications for regional F–Ba-rich IOCG mineralisation: Ore Geology Reviews, 64, p.103–127.
., and Hetherington, C.J., (2011). Resetting monazite ages during fluid-related alteration: Chemical Geology, 283, p.218–225.
Williams, P.J., (1994). Iron mobility during synmetamorphic alteration in the Selwyn Range area, NW Queensland: implications for the origin of ironstone-hosted Au-Cu deposits: Mineralium Deposita, 29, p.250–260.
Williams, P.J., (1998). Metalliferous economic geology of the Mt Isa Eastern Succession, Queensland: Australian Journal of Earth Sciences, 45, p.329–341.
Williams, P.J., Barton, M., Johnson, D. A., Fontboté, L., Haller, A. de, Mark, G., Oliver, N. H. S., and Marschik, R., (2005). Iron oxide copper-gold deposits: geology, space-time distribution, and possible modes of origin. Economic Geology: 100th Anniversary Volume, p.371–405.
Wyborn, L. and Page, R., (1983). The Proterozoic Kalkadoon and Ewen Batholiths, Mount Isa Inlier, Queensland: source, chemistry, age and metamorphism: BMR Journal of Australian Geology and Geophysics, 8, p.53–69.
Wyborn, L., Page, R. and McCulloch, M., (1988). Petrology, geochronology and isotope geochemistry of the post-1820 Ma granites of the Mount Isa Inlier: mechanisms for the generation of Proterozoic anorogenic granites: Precambrian Research, 40–41, p.509–541.

101
Chapter 3 Delineating the structural controls on iron oxide-Cu-Au deposit genesis through implicit modeling: A case study
from the E1 Group, Cloncurry District, Australia George Case1*, Thomas Blenkinsop1, 2, Zhaoshan Chang1, Jan Marten Huizenga1, 3,
Richard Lilly4, 5 and John McLellan1, 6
1EGRU (Economic Geology Research Centre), College of Science and Engineering,
James Cook University, Townsville, Queensland 4811, Australia
2 School of Earth and Ocean Sciences, Cardiff University, Cardiff, Wales CF10 3XQ,
United Kingdom
3Department of Geology, University of Johannesburg, Auckland Park, Johannesburg
2006, South Africa
4Department of Earth Sciences, University of Adelaide, Adelaide, South Australia 5005,
Australia
5Mount Isa Mines, Mount Isa, Queensland 4825, Australia
6Geological Modeling for Exploration (GMEX), PO Box 695, Deeragun, Queensland
4818, Australia
Author’s Note: This chapter has been by the Geological Society of London
Special Publication volume: Advances in the Characterisation of Ore-Forming Systems from Geological,
Geochemical and Geophysical data. The content of the chapter is nearly identical to the final publication
version, but minor changes have been made to maintain format and style consistencies with the rest of the
thesis.

Chapter 3: Structural Controls
102
Abstract Iron oxide-Cu-Au (IOCG) deposits encompass a range of orebody shapes, including
stratabound replacement ores and hydrothermal breccias. We use the implicit method to
make a detailed 3-D geological model of a stratabound IOCG in the Cloncurry district,
the E1 Group, to elucidate structural controls on mineralisation. This model is compared
to the nearby, world-class, Ernest Henry breccia-hosted IOCG deposit. Copper
mineralisation in the E1 Group occurs as structurally-controlled, mainly stratabound,
replacement bodies hosted in metasedimentary and metavolcaniclastic rocks intercalated
with barren meta-andesite. Replacement bodies in the E1 Group conform to a series of
north-northwest plunging folds formed in regional D2 during peak metamorphism.
Folding was followed by local D3 / regional D4 shortening that formed a dextral,
transpressional Riedel brittle to ductile system along the regional Cloncurry Fault Zone.
Modeling suggests that much of the Cu-Au mineralisation is controlled by synthetic R
structures associated with this Riedel system. The deformation sequence at Ernest
Henry is comparable, but differences in host rock rheology, permeability and fluid
pressure may explain the variation in ore body types and total Cu-Au resource between
the two deposits. The results carry implications for other districts containing these styles
of IOCG mineralisation.
Introduction Although fluid sources and genetic models for iron oxide-Cu-Au (IOCG) deposits are
debated at the global scale (e.g. Barton and Johnson, 2000; Hitzman, 2000; Pollard,
2000; Williams et al., 2005; Hunt et al., 2007; Groves et al., 2010), IOCGs sensu stricto
are primarily controlled by splays or intersections of regional faults and shear zones
(Hitzman et al., 1992; Groves et al., 2010). However, knowledge about the structural
controls of these deposits is less advanced than, for example, epigenetic gold deposits.
A comparison between the major IOCG districts (Fig. 3.1) including the Gawler Craton
and Cloncurry District, Australia (e.g. Oreskes and Einaudi 1990; Oreskes and Einaudi
1992; Haynes 2000; Belperio et al., 2007; Mark et al., 2006a; Oliver et al., 2004, 2006,
2008; Rubenach et al., 2008; McLellan et al., 2010), the Fennoscandian shield,
Scandinavia (Billström et al., 2010), Punta del Cobre, Chile (Marschik and Fontboté
2001), and Carajás, Brazil (Ronzê et al., 2000; Grainger et al., 2008), reveals some
similar structural settings for IOCG-style orebodies. These settings include
hydrothermal breccias, veins or replacement bodies associated with the intersections

Chapter 3: Structural Controls
103
between faults and shears and specific rock types, and location within dilational fault or
shear jogs. Some rock types (e.g. calcareous or carbonaceous sedimentary rocks) can act
as ideal chemical traps, or may focus permeability by brecciating. Fe-oxide-Cu-Au
deposits appear to have formed both at relatively shallow (<5 km) depths, as in the case
of Olympic Dam (Oreskes and Einaudi, 1992; Haynes et al., 1995), and at deeper levels
(~10 km), in the case of Ernest Henry (Kendrick et al., 2007). Some of the major IOCG
districts, such as the Fennoscandian shield, Carajás, and Cloncurry, are characterised by
protracted periods of metamorphism, magmatism and metasomatism that enhance
existing ores and generate new orebodies (Kirchenbaur et al., 2016; Macmillan et al.,
2016; Billström et al., 2010; Oliver et al., 2008). Thus, understanding the relative timing
of IOCG mineralisation with respect to regional deformation events is critical for
developing genetic models that include fluid transportation conduits and trapping
mechanisms.
The Cloncurry District of northwest Queensland, Australia, hosts numerous IOCG
deposits, all associated with shear zones (e.g. Baker and Laing 1998; Coward 2001;
Davidson et al., 2002; Duncan et al., 2014). The recently discovered E1 Group of IOCG
deposits (10.1 Mt at 0.73 % Cu, 0.22 g/t Au), located 40 km northeast of Cloncurry
(Fig. 3.2), has not been extensively studied and may offer new insights into regional
structural controls and genesis of IOCG deposits. The E1 Group comprises three distinct
orebodies: E1 North (the largest), E1 East, and E1 South. The orebodies were
discovered in 1990 by Western Mining Corporation, but were not extensively drilled out
until the early 2000s by EXCO Resources. The E1 Group is located 8 km east from the
world-class Ernest Henry system which has total resources of 226 Mt at 1.1% Cu and
0.51 g/t Au (Rusk et al., 2010), and is the largest Cu-Au deposit in the Cloncurry
District (Mark et al., 2006a). The area surrounding the E1 Group and Ernest Henry is
characterised by sparse outcrop, and as a result past exploration has been heavily
dependent on geophysical techniques in order to resolve regional- and deposit-scale
structures that host the IOCG mineralisation.
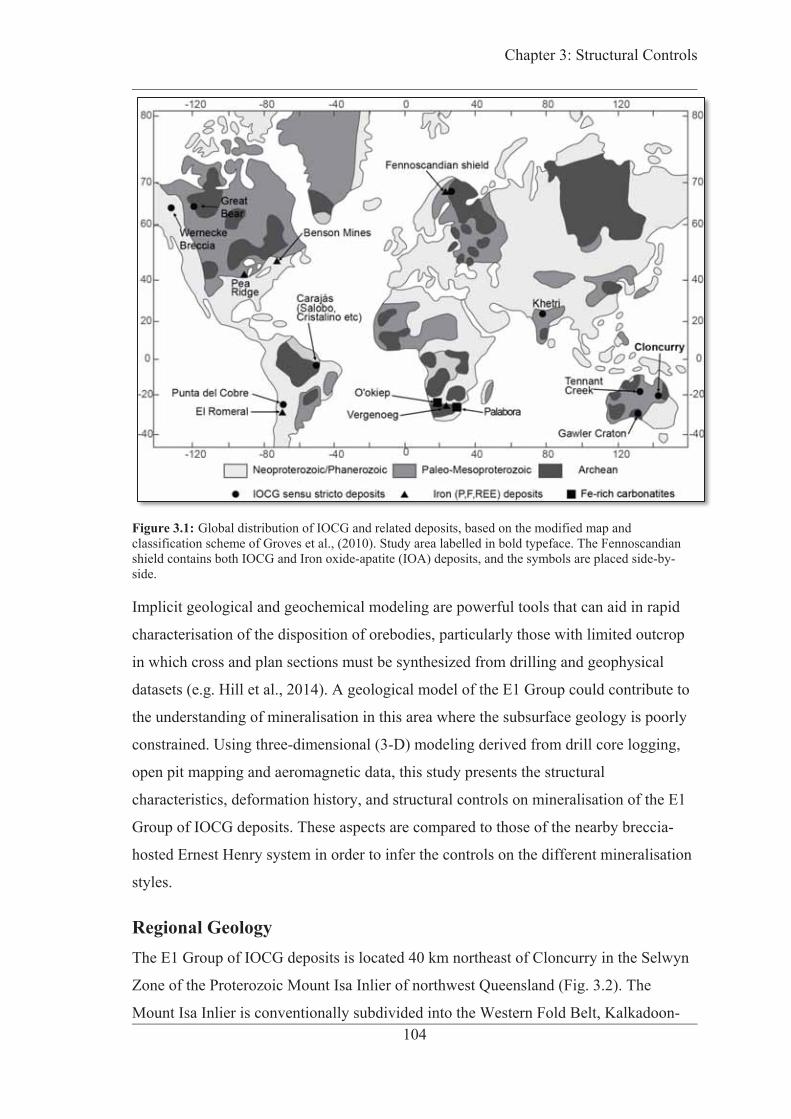
Chapter 3: Structural Controls
104
Figure 3.1: Global distribution of IOCG and related deposits, based on the modified map and classification scheme of Groves et al., (2010). Study area labelled in bold typeface. The Fennoscandian shield contains both IOCG and Iron oxide-apatite (IOA) deposits, and the symbols are placed side-by-side.
Implicit geological and geochemical modeling are powerful tools that can aid in rapid
characterisation of the disposition of orebodies, particularly those with limited outcrop
in which cross and plan sections must be synthesized from drilling and geophysical
datasets (e.g. Hill et al., 2014). A geological model of the E1 Group could contribute to
the understanding of mineralisation in this area where the subsurface geology is poorly
constrained. Using three-dimensional (3-D) modeling derived from drill core logging,
open pit mapping and aeromagnetic data, this study presents the structural
characteristics, deformation history, and structural controls on mineralisation of the E1
Group of IOCG deposits. These aspects are compared to those of the nearby breccia-
hosted Ernest Henry system in order to infer the controls on the different mineralisation
styles.
Regional Geology The E1 Group of IOCG deposits is located 40 km northeast of Cloncurry in the Selwyn
Zone of the Proterozoic Mount Isa Inlier of northwest Queensland (Fig. 3.2). The
Mount Isa Inlier is conventionally subdivided into the Western Fold Belt, Kalkadoon-
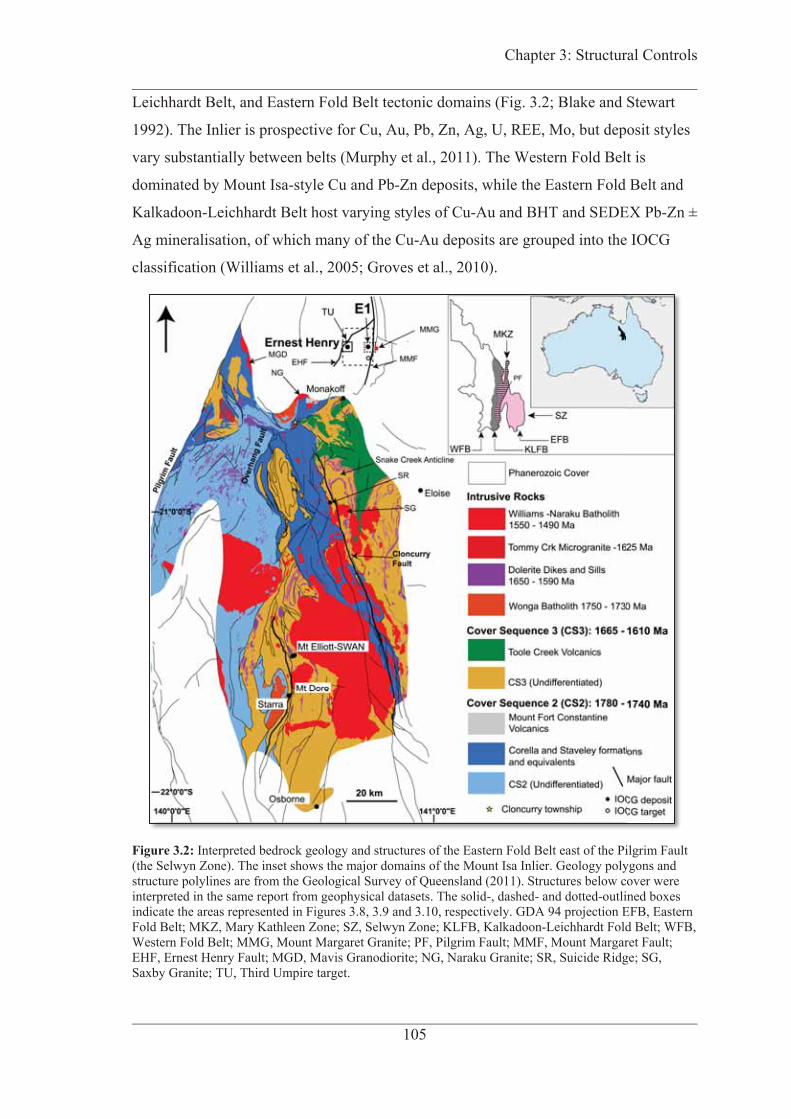
Chapter 3: Structural Controls
105
Leichhardt Belt, and Eastern Fold Belt tectonic domains (Fig. 3.2; Blake and Stewart
1992). The Inlier is prospective for Cu, Au, Pb, Zn, Ag, U, REE, Mo, but deposit styles
vary substantially between belts (Murphy et al., 2011). The Western Fold Belt is
dominated by Mount Isa-style Cu and Pb-Zn deposits, while the Eastern Fold Belt and
Kalkadoon-Leichhardt Belt host varying styles of Cu-Au and BHT and SEDEX Pb-Zn ±
Ag mineralisation, of which many of the Cu-Au deposits are grouped into the IOCG
classification (Williams et al., 2005; Groves et al., 2010).
Figure 3.2: Interpreted bedrock geology and structures of the Eastern Fold Belt east of the Pilgrim Fault (the Selwyn Zone). The inset shows the major domains of the Mount Isa Inlier. Geology polygons and structure polylines are from the Geological Survey of Queensland (2011). Structures below cover were interpreted in the same report from geophysical datasets. The solid-, dashed- and dotted-outlined boxes indicate the areas represented in Figures 3.8, 3.9 and 3.10, respectively. GDA 94 projection EFB, Eastern Fold Belt; MKZ, Mary Kathleen Zone; SZ, Selwyn Zone; KLFB, Kalkadoon-Leichhardt Fold Belt; WFB, Western Fold Belt; MMG, Mount Margaret Granite; PF, Pilgrim Fault; MMF, Mount Margaret Fault; EHF, Ernest Henry Fault; MGD, Mavis Granodiorite; NG, Naraku Granite; SR, Suicide Ridge; SG, Saxby Granite; TU, Third Umpire target.
Chapter 3: Structural Controls
106
Cover sequence deposition and early intrusions The sedimentary and volcanic country rocks of the Eastern Fold Belt were deposited
between 1875 and 1610 Ma in an intracratonic rift setting (Blake, 1987 and references
therein; O’dea et al., 1997). They overlie the ~1900 Ma basement rocks of the
Barramundi Orogen and are divided into three major unconformable cover sequences
(Fig. 3.3; Page and Williams, 1988; Blake and Stewart, 1992).
Cover Sequence 1, composed mostly of mafic-felsic extrusive rocks, was deposited
from 1870 1840 Ma (Wyborn and Page, 1983). Following a significant hiatus,
mudstones, sandstones, carbonates, and evaporites of Cover Sequence 2 were laid down
between 1780 and 1740 Ma. In the area around the E1 Group and Ernest Henry, Cover
Sequence 2 rocks are represented by the intermediate Mount Fort Constantine Volcanics
and Corella Formation carbonates and siliclastic rocks; they formed synchronously from
1750 1740 Ma (Page and Sun, 1998; Foster and Austin, 2008). Equivalents of the
Corella Formation, including possibly the Staveley Formation, may be as young as 1720
Ma (Betts et al., 2011). After deposition of Cover Sequence 2, granites of the ~1740 Ma
Wonga Batholith were intruded mostly in the western portion of the Eastern Fold Belt
(Wyborn et al., 1988). Cover Sequence 3 sedimentary rocks and mafic volcanics were
deposited between 1690 and 1650 Ma (Foster and Austin, 2008; Rubenach et al., 2008).
Mafic dykes and sills were also intruded during this time period (Rubenach et al., 2008).
The Ernest Henry Diorite suite crystallized around 1650 Ma (Page and Sun 1998) in the
region around Ernest Henry. Scott et al., (1998), Jackson et al., (2000), Betts and Giles
(2006) and Neumann et al., (2009) present an alternative stratigraphic framework for the
entire Mount Isa Inlier, and Betts and Giles (2006) consider the Western and Eastern
fold belts to be broadly stratigraphically correlated in the form of superbasins. Those
authors have grouped the formations of Cover Sequence 2 into the Leichhardt
Superbasin, while those of Cover Sequence 3 are divided into the Calvert Superbasin
(Llewellyn Creek Formation-Mount Norna Quartzite) and Isa Superbasin (Toole Creek
Volcanics and Staveley Formation). Similar correlations have also been proposed by
Foster and Austin (2008).
Isan Orogeny: deformation and metamorphism The post-1900 Ma deformation history of the Mount Isa Inlier is dominated by the
1650–1500 Ma Isan Orogeny (Rubenach et al., 2008). Deformation and metamorphism
related to this orogeny is complex in the Eastern Fold Belt, and there is no consensus on

Chapter 3: Structural Controls
107
the timing and number of individual events. Most studies in the Eastern Fold Belt have
focused on the well-exposed areas south and west of Cloncurry (Fig. 3.2) such as the
Selwyn zone, Snake Creek Anticline, and Mary Kathleen Domain (e.g. Looseveld and
Schreurs 1987; Adshead-Bell 1998; Rubenach and Lewthwaite 2002; Giles et al., 2006;
O’dea et al., 2006; Rubenach et al., 2008; Abu Sharib and Bell 2011). Those workers
generally concluded that at least four major deformation events took place in the region
(Fig. 3.3). Rubenach and Lewthwaite (2002) and Giles et al., (2006) describe an early
(1680–1640 Ma, Rubenach et al., 2008) extension-related event (denoted Dbp by
Rubenach et al., 2008), resulting in a bedding subparallel foliation (Fig. 3.3). This
extensional event was followed by three or four major crustal shortening events (Mark
et al., 2000; Blenkinsop et al., 2008; Rubenach et al., 2008; Abu Sharib and Bell, 2011).
Figure 3.3: Diagram showing the major depositional, deformation, magmatic and mineraliztion events in the Eastern Fold Belt of the Mount Isa Inlier after 1900 Ma. See text for references. PM, Peak metamorphism.
The D1 event (1630–1600 Ma; Rubenach et al., 2008) is poorly preserved, and is
characterised by east-west folds and steep, east-west S1 foliation (Bell 1983; Adshead-
Bell 1998; Bell and Hickey 1998; Rubenach and Lethwaite 2002; O’dea et al., 2006;
Rubenach et al., 2008). The dominant north-south-trending, steep, and upright to
vertical folds and fabric recognizable widely throughout the Mount Isa Inlier resulted

Chapter 3: Structural Controls
108
from the D2 (1600 1580) event at amphibolite facies peak metamorphic conditions
(Page and Sun 1998; Giles and Nutman 2002; Foster and Rubenach 2006; Rubenach et
al., 2008). This was followed by D3 (1550 Ma; Page and Sun 1998; Rubenach et al.,
2008; Duncan et al., 2011) which is characterised by north-northwest-south-southeast-
trending folds with steeply dipping axial surfaces and penetrative crenulation of S2
(Rubenach et al., 2008). Northeast-southwest-trending folds with steep axial surfaces
are considered by Rubenach et al., (2008) to be a late D4 event synchronous with
intrusion of the ~1527 Ma Saxby Granite; D4 may have continued until ~1500 Ma
(Davis et al., 2001; Duncan et al., 2011). Some authors (e.g. Beardsmore 1992; Austin
and Blenkinsop 2010) tly brittle event
(D5) characterised by northeast-southwest extension. Major regional structures such as
the Cloncurry and Pilgrim faults (Fig. 3.2) likely originated as basin-bounding faults
during extension that were subsequently reactivated as reverse or transform structures
during the Isan Orogeny (Blenkinsop et al., 2008; Austin and Blenkinsop 2010).
As a result of poor outcrop, deformation in the area northeast of Cloncurry has not been
extensively studied, except at isolated deposits such as Ernest Henry (Twyerould 1997;
Mark et al., 2000; Coward 2001). Figure 3.4 displays the local deformation schemes
interpreted by these authors as correlated to the regional deformation history south of
Cloncurry.
Figure 3.4: A comparison of reported local deformation schemes at Ernest Henry and the E1 Group, with the regional events shown in Figure 3.3. See text for references.
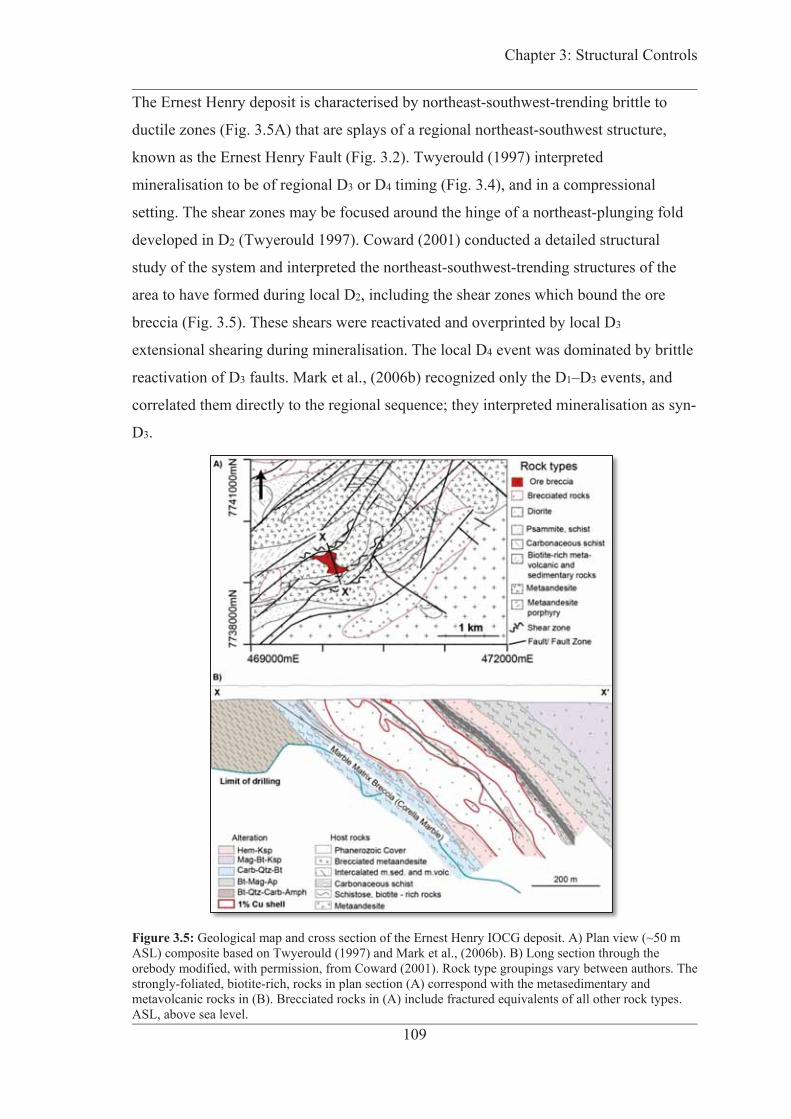
Chapter 3: Structural Controls
109
The Ernest Henry deposit is characterised by northeast-southwest-trending brittle to
ductile zones (Fig. 3.5A) that are splays of a regional northeast-southwest structure,
known as the Ernest Henry Fault (Fig. 3.2). Twyerould (1997) interpreted
mineralisation to be of regional D3 or D4 timing (Fig. 3.4), and in a compressional
setting. The shear zones may be focused around the hinge of a northeast-plunging fold
developed in D2 (Twyerould 1997). Coward (2001) conducted a detailed structural
study of the system and interpreted the northeast-southwest-trending structures of the
area to have formed during local D2, including the shear zones which bound the ore
breccia (Fig. 3.5). These shears were reactivated and overprinted by local D3
extensional shearing during mineralisation. The local D4 event was dominated by brittle
reactivation of D3 faults. Mark et al., (2006b) recognized only the D1–D3 events, and
correlated them directly to the regional sequence; they interpreted mineralisation as syn-
D3.
Figure 3.5: Geological map and cross section of the Ernest Henry IOCG deposit. A) Plan view (~50 m ASL) composite based on Twyerould (1997) and Mark et al., (2006b). B) Long section through the orebody modified, with permission, from Coward (2001). Rock type groupings vary between authors. The strongly-foliated, biotite-rich, rocks in plan section (A) correspond with the metasedimentary and metavolcanic rocks in (B). Brecciated rocks in (A) include fractured equivalents of all other rock types. ASL, above sea level.

Chapter 3: Structural Controls
110
Late intrusions and IOCG mineralisation Following peak metamorphism in the Isan Orogeny, voluminous A-type granitoids of
the Williams-Naraku Batholith (1550 1490 Ma; Fig. 3.3) were intruded throughout the
Eastern Fold Belt (Page and Sun 1998). The closest Williams-Naraku intrusion to the
E1 Group is the Mount Margaret Granite, 2 km east of the deposits (Fig. 3.2); it is dated
at 1530 Ma (Page and Sun 1998). No other granites are spatially associated with Ernest
Henry or the E1 Group; the nearest other granite pluton, the Naraku Granite, crops out
20 km southwest (Fig. 3.2). IOCG-style mineralisation in the Mount Isa inlier occurred
over ~100 Myr (1595 1500 Ma): Osborne formed during peak metamorphism at ~1595
Ma (Gauthier et al., 2001) and Starra at 1568 ± 7 Ma (Duncan et al., 2011). Both
deposits are interpreted to have formed from metamorphic fluids (Fisher and Kendrick
2008; Duncan et al., 2011). Other IOCGs in the district, such as Ernest Henry and
Mount Elliott, formed much later between 1530 1500 Ma (Wang and Williams 2001;
Mark et al., 2006b; Duncan et al., 2011), overlapping in time with intrusion of the
Williams-Naraku Batholith. These granites have been postulated as one potential source
of Cu-Au-bearing fluids for the younger IOCGs (Kendrick et al., 2007; Oliver et al.,
2008; Williams et al., 2015).
Host Rocks and Paragenetic Sequence of the E1 Group The E1 Group is hosted in a sequence of Corella Formation metasedimentary rocks
intercalated with intermediate Mount Fort Constantine metavolcanic rocks, both of
Cover Sequence 2 (Chapter 2). The host rocks do not crop out and are unconformably
overlain by 30–50 m of Mesozoic sedimentary rocks. The metasedimentary rocks
comprise marbles, psammites, and carbonaceous metasiltstones and pelites (Fig. 3.6A–
C). The metavolcanic rocks consist of basaltic meta-andesite to meta-andesite with
variable porphyritic, amygdaloidal and massive textures, as well as metavolcanic
breccia and metatuff (Fig. 3.6D–E). The rocks are similar to those that host the nearby
Ernest Henry deposit. This metavolcano-sedimentary rock package is intruded by
diorite (Fig. 3.6F), which is likely related to the Ernest Henry Diorite suite (~1650 Ma;
Page and Sun 1998). Clasts of the diorite are present in albite-hematite-K-feldspar-
biotite-altered, discordant, breccia (Fig. 3.6G–I), that cuts across the system (Fig. 3.6I).
The discordant breccia is intruded by dolerite dykes of unconstrained age (Fig. 3.6J).
Ores are hosted primarily in the metasedimentary rocks (excluding the carbonaceous

Chapter 3: Structural Controls
111
pelite), but strongly-sheared metavolcanic rocks are also mineralised in the E1 North
Shear zone.
Figure 3.6: Drill core photographs of E1 Group host rocks. A) Porphyroblastic marble with disseminated magnetite and sulfide alteration. Porphyroblasts are chlorite after actinolite. B) Carbonaceous metasiltstone with pyrite-carbonate-quartz alteration and veining. Note dilational fold microreefs infilled with carbonate and quartz. C) Carbonaceous schist/phyllite with similar pyrite-carbonate-quartz alteration. D) Representative plagioclase-phyric meta-andesite in the metavolcanic rocks above and below the marble unit in Fig. 3.7. Note slight albite(-hematite) alteration of phenocrysts. E) Metatuff. F) Diorite inferred to be from the Ernest Henry Diorite suite. G) Diorite clast in discordant breccia. H) Less altered discordant breccia from Third Umpire prospect north of Ernest Henry. The matrix is composed mainly of albite, amphibole and pyroxene. (I) Discordant contact of metasiltstone (upper right part of core tray) with discordant breccia. (J) Dolerite with discordant breccia xenoliths. E1N, E1 North; E1E, E1 East; E1S, E1 South. Act, actinolite; Cal, calcite; Py, pyrite; Qz, quartz; Bt, biotite; Chl, chlorite; Ab, albite; K-spar, K-feldspar; Px, pyroxene; Dol, dolerite.

Chapter 3: Structural Controls
112
Mineralisation at the E1 Group is characterised by layer-controlled replacement of the
metasedimentary rocks, accompanied by relatively minor veining (Chapter 2).
Alteration at the E1 Group is complex, and is grouped into three major paragenetic
stages, with the second, pre-ore, stage comprising three substages (Chapter 2, Figs.
2.10–2.11). The stages are: 1) early sodic-(-calcic), 2a) precursor ferric/ferrous-potassic-
silicic, 2b) intermediate sodic (-Ti), 2c) early carbonate (-Fe-Mg) flooding and
mineralisation, and 3) main Cu-Au-carbonate(-Fe-Mn)- barite-fluorite-U-REE
mineralisation (Chapter 2). This sequence is comparable to that of the nearby Ernest
Henry deposit, which suggests similar chemistry of the mineralising fluid(s) in both
deposits (Chapter 2). Such similarity, however, does not necessarily indicate a common
origin.
3-D Geological Modeling The development of three-dimensional (3-D) implicit modeling software in the last
decade has provided geologists with new means for quickly visualizing the geology of
mineralised systems in 3-D space (e.g. Cowan 2003; Alcaraz et al., 2011; Hill et al.,
2014; Stewart et al., 2014). The E1 Group represents an ideal study area to conduct
implicit modeling for detailed subsurface geological characterisation, as it is sufficiently
small and is represented by substantial assay and core photo databases.
Datasets A 3-D geological model of the E1 Group was generated from a combination of diamond
drill hole (DDH) logging, open pit mapping, and ground and aerial magnetic surveys
(Figs. 3.7–3.9). Twenty-three diamond holes were physically logged and observations
from these holes were used to log lithologies of remaining 260 diamond holes using the
core photo database. Structural measurements from oriented drill core were made using
a goniometer, and - were converted to dip/dip direction using
GEOCalculator software (Holcombe, 2013). Geophysical datasets were provided by the
mine operator and include a regional aerial magnetic survey with 50 m flight and 500 m
tie-line spacing (Fig. 3.8), as well as a ground magnetic survey across the E1 Group
with 50 m line spacing (Fig. 3.9). All drill hole and geophysical datasets were converted
to GDA 94 projection.
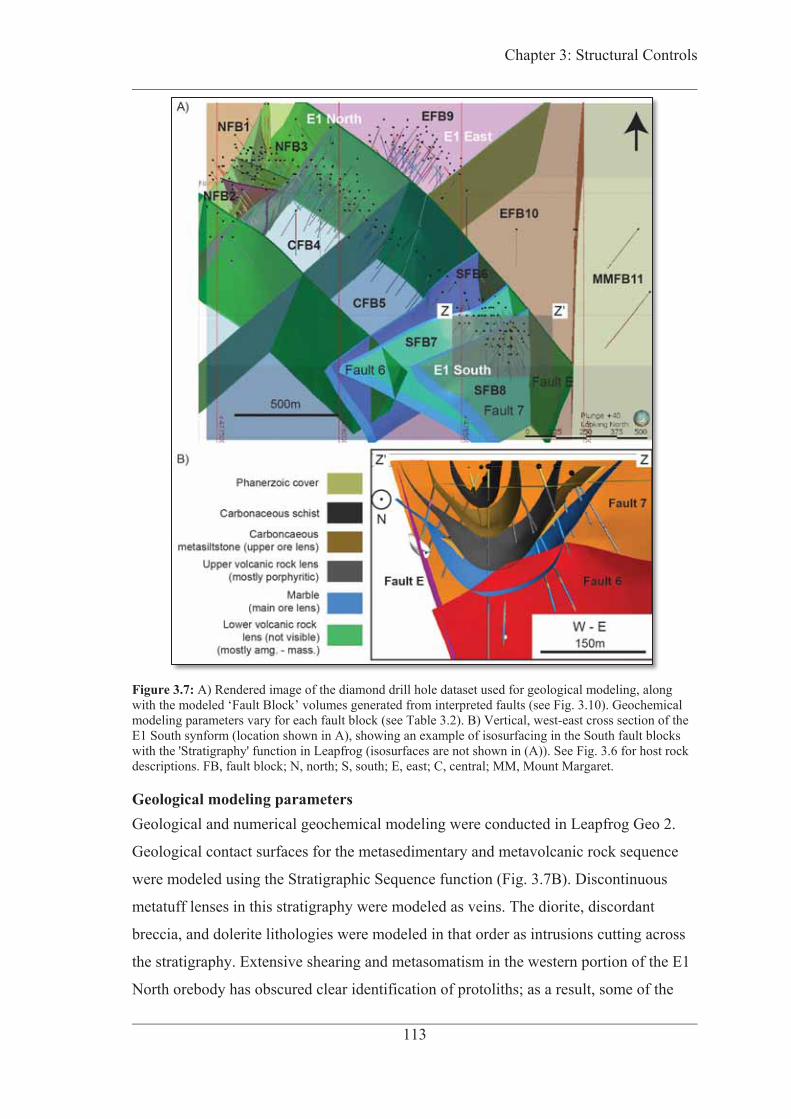
Chapter 3: Structural Controls
113
Figure 3.7: A) Rendered image of the diamond drill hole dataset used for geological modeling, along with the modeled ‘Fault Block’ volumes generated from interpreted faults (see Fig. 3.10). Geochemical modeling parameters vary for each fault block (see Table 3.2). B) Vertical, west-east cross section of the E1 South synform (location shown in A), showing an example of isosurfacing in the South fault blocks with the 'Stratigraphy' function in Leapfrog (isosurfaces are not shown in (A)). See Fig. 3.6 for host rock descriptions. FB, fault block; N, north; S, south; E, east; C, central; MM, Mount Margaret.
Geological modeling parameters Geological and numerical geochemical modeling were conducted in Leapfrog Geo 2.
Geological contact surfaces for the metasedimentary and metavolcanic rock sequence
were modeled using the Stratigraphic Sequence function (Fig. 3.7B). Discontinuous
metatuff lenses in this stratigraphy were modeled as veins. The diorite, discordant
breccia, and dolerite lithologies were modeled in that order as intrusions cutting across
the stratigraphy. Extensive shearing and metasomatism in the western portion of the E1
North orebody has obscured clear identification of protoliths; as a result, some of the
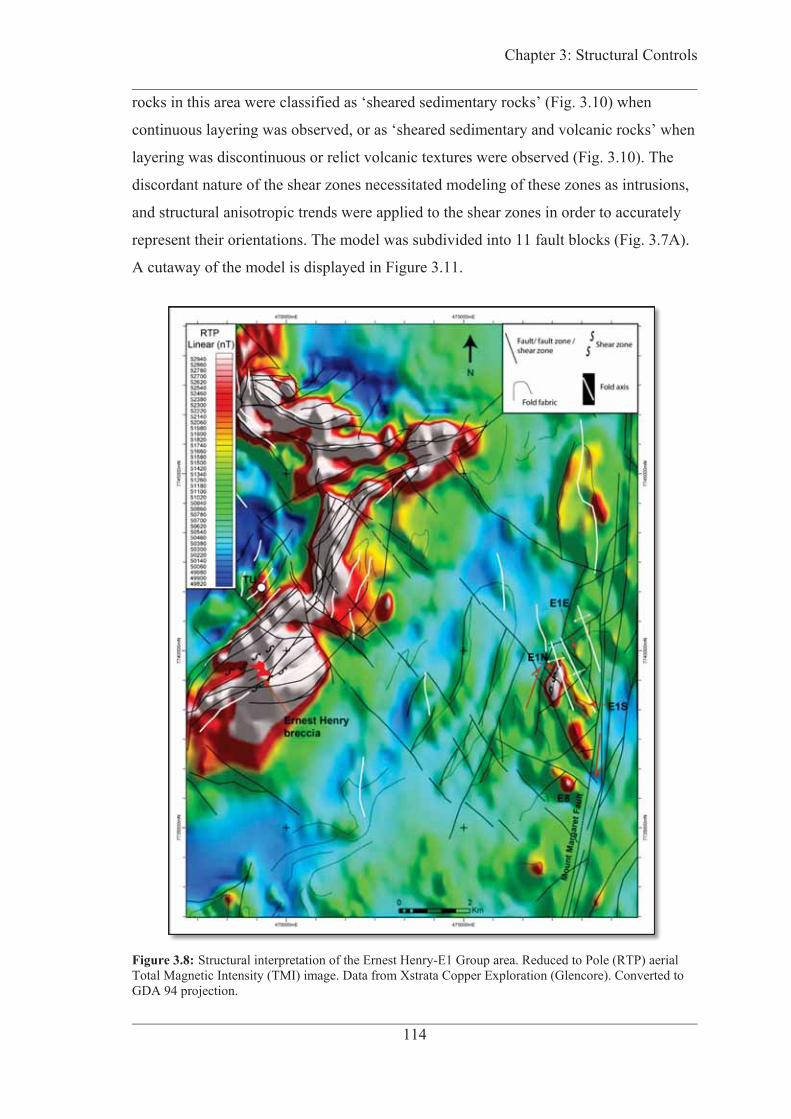
Chapter 3: Structural Controls
114
rocks in this area were classified as ‘sheared sedimentary rocks’ (Fig. 3.10) when
continuous layering was observed, or as ‘sheared sedimentary and volcanic rocks’ when
layering was discontinuous or relict volcanic textures were observed (Fig. 3.10). The
discordant nature of the shear zones necessitated modeling of these zones as intrusions,
and structural anisotropic trends were applied to the shear zones in order to accurately
represent their orientations. The model was subdivided into 11 fault blocks (Fig. 3.7A).
A cutaway of the model is displayed in Figure 3.11.
Figure 3.8: Structural interpretation of the Ernest Henry-E1 Group area. Reduced to Pole (RTP) aerial Total Magnetic Intensity (TMI) image. Data from Xstrata Copper Exploration (Glencore). Converted to GDA 94 projection.

Chapter 3: Structural Controls
115
Figure 3.9: Structural interpretation of E1 Group area. Based on RTP aerial TMI survey conducted using 50 m flight line and 500 m tie-line spacing with 25 m clearance. Data from Xstrata Copper Exploration (Glencore), and converted to Geocentric Datum of Australia (GDA) 94 projection. E1N, E1 North; E1S, E1 South; E1E, E1 East.
E1 Structural Geology The E1 Group does not outcrop, and as a result the understanding of its structures
comes mostly from 3-D modeling derived from drill core and limited mapping of the
orebody periphery in the E1 North open pit.
Chapter 3: Structural Controls
116
Deposit geometry and macrostructures The topography of the Proterozoic-Mesozoic unconformity forms a ~10 m culmination
over the E1 North orebody. The general geometry of the E1 Group orebody is
characterised by northwest- to north-northwest plunging similar, open folds with near-
vertical axial surfaces (Figs. 3.10–3.12). E1 North is hosted near the hinge of a north-
northwest-plunging antiform, and the eastern limb of the antiform transitions into the
west limb of the northwest-plunging E1 South synform which contains the E1 South
orebody. The metasedimentary rock layers thin substantially on the limb connecting the
folds, and the marble layer appears to pinch out on the west limb of the E1 North
Antiform although it may be obscured by the intense shearing and metasomatism in that
zone. Drilling indicates that the E1 East orebody dips steeply to the east, and regional
aerial magnetic data suggest that it is part of the overturned southwest limb of the north-
northwest-plunging E1 East Antiform (Fig. 3.9). This antiform continues from the east
limb of the E1 South Synform and the thickness of the metasedimentary rocks increases
between E1 South and E1 East. The metavolcanic sequence present between the marble
and metasiltstone units at E1 North and South is mostly absent at E1 East with the
exception of some isolated pods of porphyritic metavolcanic rocks.
The folds are cut by several faults of multiple generations (Table 3.1). The E1 North
Antiform is cross-cut by a series of northeast-southwest-trending, northwest-dipping,
shear zones collectively referred to as the E1 North Shear Zone (Figs. 3.13; 3.14A–B).
The most intense shearing in this zone is mostly developed in marble, metatuff and
metavolcanic breccias, but some shear fabric is also developed in the coherent
porphyritic and amygdaloidal metavolcanic rocks (Figs. 3.13C; 3.14A; 3.15B). A
combination of high strain and metasomatism associated with the E1 North Shear Zone,
coupled with significantly deeper weathering, have inhibited clear protolith
identification within some portion of the shear zone (e.g. Figs. 3.15B; 3.17C). As a
result, it is not certain whether the Corella marble horizon pinches out on the west limb
of the antiform, or is simply obscured by alteration and shear fabrics (see next section).
Drill core observations from within the shear zone yield shear senses in multiple
directions, possibly due to reactivation, causing ambiguity regarding the deposit-scale
sense of movement. However, an isolated lens of mineralised Corella marble adjacent to
the main lens probably moved down and to the west with respect to the main horizon,
suggesting a normal component of shear.
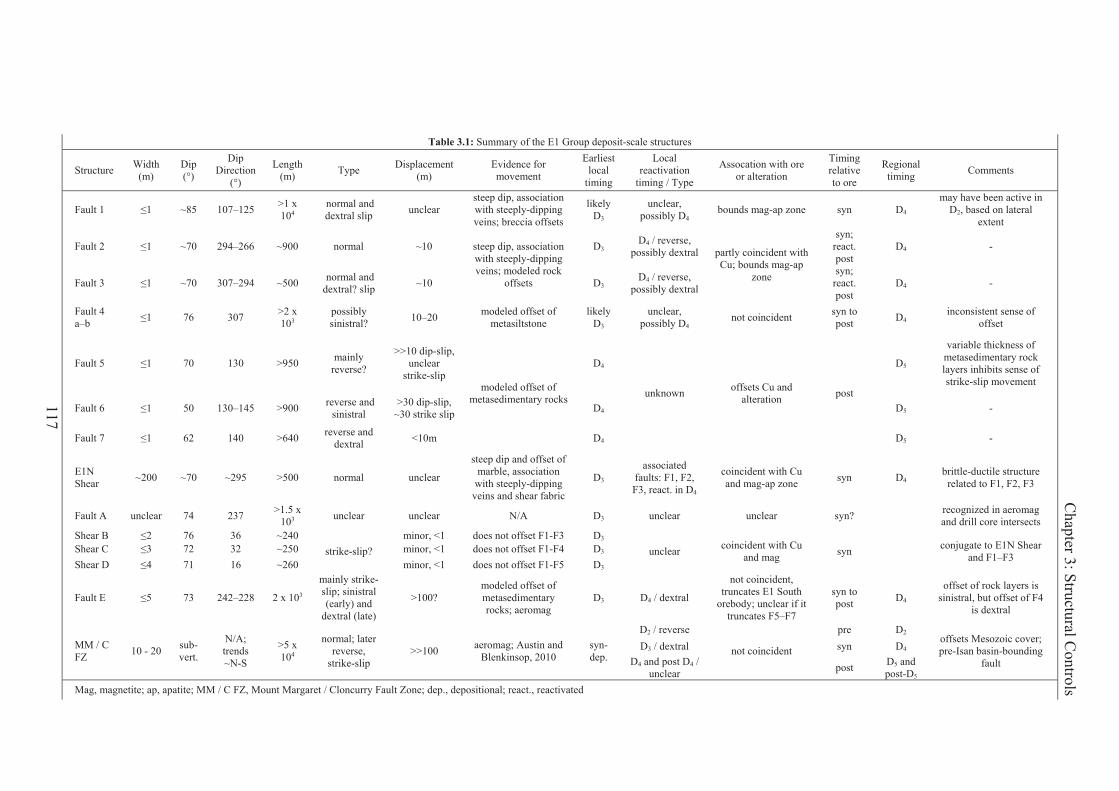
117
Table 3.1: Summary of the E1 Group deposit-scale structures
Structure Width(m)
Dip (°)
Dip Direction
(°)
Length (m) Type Displacement
(m) Evidence for movement
Earliest local
timing
Local reactivation
timing / Type
Assocation with ore or alteration
Timing relative to ore
Regional timing Comments
Fault 1 ~85 107–125 >1 x10⁴
normal and dextral slip unclear
steep dip, association with steeply-dipping veins; breccia offsets
likely D3
unclear, possibly D4
bounds mag-ap zone syn D4 may have been active in
D2, based on lateral extent
Fault 2 ~70 294–266 ~900 normal ~10 steep dip, association with steeply-dipping veins; modeled rock
offsets
D3 D4 / reverse,
possibly dextral partly coincident with Cu; bounds mag-ap
zone
syn; react. post
D4 -
Fault 3 ~70 307–294 ~500 normal and dextral? slip ~10 D3
D4 / reverse, possibly dextral
syn; react. post
D4 -
Fault 4 a–b 76 307 >2 x
103 possibly sinistral? 10–20 modeled offset of
metasiltstone likely
D3 unclear,
possibly D4 not coincident syn to
post D4 inconsistent sense of
offset
Fault 5 70 130 >950 mainly reverse?
>>10 dip-slip, unclear
strike-slipmodeled offset of
metasedimentary rocks
D4
unknown offsets Cu and alteration post
D5
variable thickness of metasedimentary rock layers inhibits sense of strike-slip movement
Fault 6 50 130–145 >900 reverse and sinistral
>30 dip-slip, ~30 strike slip D4 D5 -
Fault 7 62 140 >640 reverse and dextral <10m D4 D5 -
E1N Shear ~200 ~70 ~295 >500 normal unclear
steep dip and offset of marble, association
with steeply-dipping veins and shear fabric
D3 associated
faults: F1, F2, F3, react. in D4
coincident with Cu and mag-ap zone syn D4
brittle-ductile structure related to F1, F2, F3
Fault A unclear 74 237 >1.5 x10³ unclear unclear N/A D3 unclear unclear syn? recognized in aeromag
and drill core intersects Shear B 76 36 ~240
strike-slip? minor, <1 does not offset F1-F3 D3
unclear coincident with Cu and mag syn conjugate to E1N Shear
and F1–F3 Shear C 72 32 ~250 minor, <1 does not offset F1-F4 D3 Shear D 71 16 ~260 minor, <1 does not offset F1-F5 D3
Fault E 73 242–228 2 x 10³
mainly strike-slip; sinistral (early) and
dextral (late)
>100? modeled offset of metasedimentary rocks; aeromag
D3 D4 / dextral
not coincident, truncates E1 South
orebody; unclear if it truncates F5–F7
syn to post D4
offset of rock layers is sinistral, but offset of F4
is dextral
MM / C FZ 10 - 20 sub-
vert.
N/A; trends ~N-S
>5 x10⁴
normal; later reverse,
strike-slip >>100 aeromag; Austin and
Blenkinsop, 2010 syn-dep.
D2 / reverse
not coincident
pre D2 offsets Mesozoic cover; pre-Isan basin-bounding
fault D3 / dextral syn D4
D4 and post D4 / unclear post D5 and
post-D5 Mag, magnetite; ap, apatite; MM / C FZ, Mount Margaret / Cloncurry Fault Zone; dep., depositional; react., reactivated
Chapter 3: Structural Controls

Chapter 3: Structural Controls
118
Figure 3.10: 2075 m RL / 75 m ASL plan section of the E1 Group rendered from the 3-D geological model (extent shown in Fig. 3.9), showing the rock types, major folds, faults, and shear zones of the E1 Group. The metatuff is conformable, but was modeled as a ‘Vein’ in the Leapfrog software because of its lateral discontinuity. Copper and iron outlines are sections rendered from the modeling interpolants in Fig. 3.18. GDA 94 projection. RL, relative level mine datum; ASL, above sea level.
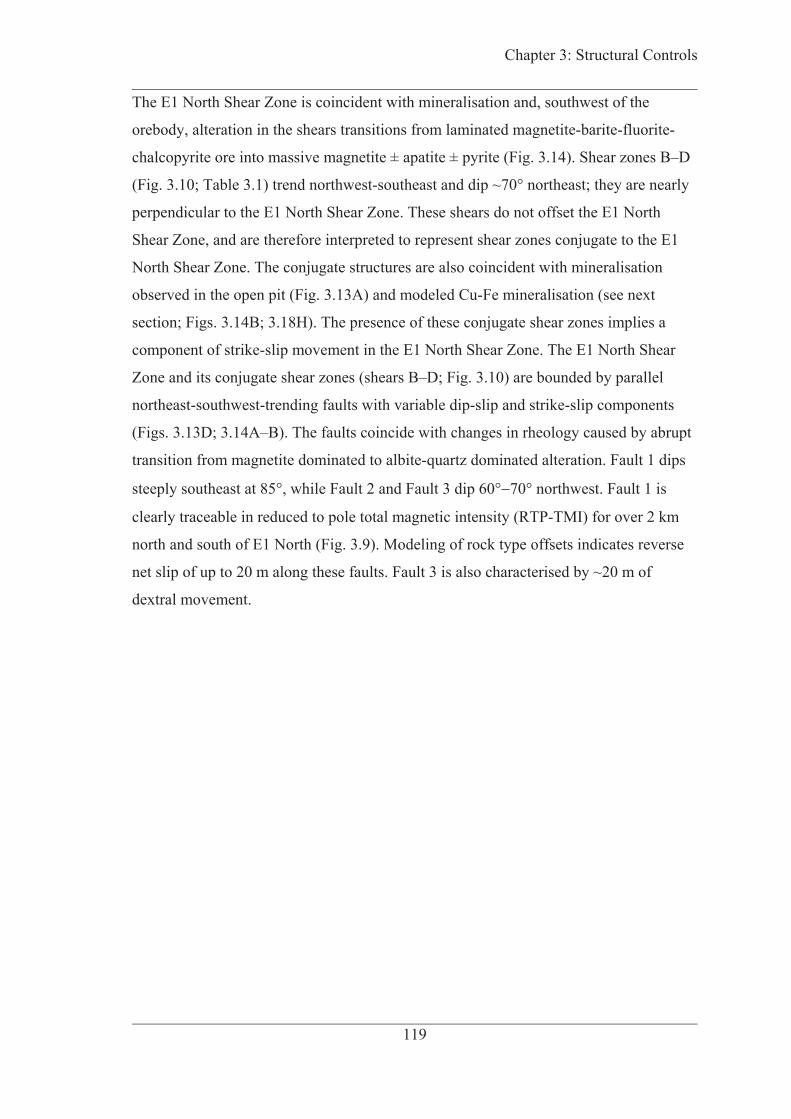
Chapter 3: Structural Controls
119
The E1 North Shear Zone is coincident with mineralisation and, southwest of the
orebody, alteration in the shears transitions from laminated magnetite-barite-fluorite-
chalcopyrite ore into massive magnetite ± apatite ± pyrite (Fig. 3.14). Shear zones B–D
(Fig. 3.10; Table 3.1) trend northwest-southeast and dip ~70° northeast; they are nearly
perpendicular to the E1 North Shear Zone. These shears do not offset the E1 North
Shear Zone, and are therefore interpreted to represent shear zones conjugate to the E1
North Shear Zone. The conjugate structures are also coincident with mineralisation
observed in the open pit (Fig. 3.13A) and modeled Cu-Fe mineralisation (see next
section; Figs. 3.14B; 3.18H). The presence of these conjugate shear zones implies a
component of strike-slip movement in the E1 North Shear Zone. The E1 North Shear
Zone and its conjugate shear zones (shears B–D; Fig. 3.10) are bounded by parallel
northeast-southwest-trending faults with variable dip-slip and strike-slip components
(Figs. 3.13D; 3.14A–B). The faults coincide with changes in rheology caused by abrupt
transition from magnetite dominated to albite-quartz dominated alteration. Fault 1 dips
steeply southeast at 85°, while Fault 2 and Fault 3 dip 60° 70° northwest. Fault 1 is
clearly traceable in reduced to pole total magnetic intensity (RTP-TMI) for over 2 km
north and south of E1 North (Fig. 3.9). Modeling of rock type offsets indicates reverse
net slip of up to 20 m along these faults. Fault 3 is also characterised by ~20 m of
dextral movement.

Chapter 3: Structural Controls
120
Figure 3.11: Three-dimensional cutaway of E1 Group 3-D geological model, showing the major D2 folds that define the E1 North and E1 South orebody geometries. Red faults are syn-D2 or pre-D2 . Green faults are syn- (local) D3 and later. Blue faults are syn- (local) D4 and later. Vertical axis is elevation above sea level (m). See Fig. 3.10 for legend. GDA 94 projection.
E1 South Faults 5 7 (Figs. 3.10; 3.14D; Table 3.1) exhibit reverse and strike-slip
separation, and dip from ~80° to 60° to the southeast. Kinks in Faults 5 and 6 are
interpreted to have been caused by rheological contrast between the ductile marble and
brittle coherent metavolcanic layers. Unlike the E1 North faults, these structures do not
coincide with high Cu-Fe concentrations or shear zones, and they offset all alteration. A
major northwest-southeast trending fault (Fault E; Fig. 3.10) separates E1 East from E1
North and South. Truncation of the metasedimentary rock horizon hosting the E1 East
and E1 South orebodies by Fault E suggests strike-slip movement along this structure of
hundreds of meters. Fault A (Fig. 3.10) is inferred mainly from aeromagnetics and its
offset is not clear. Faults 4a and 4b likely represent a single northeast-southwest
structure offset by Fault E.
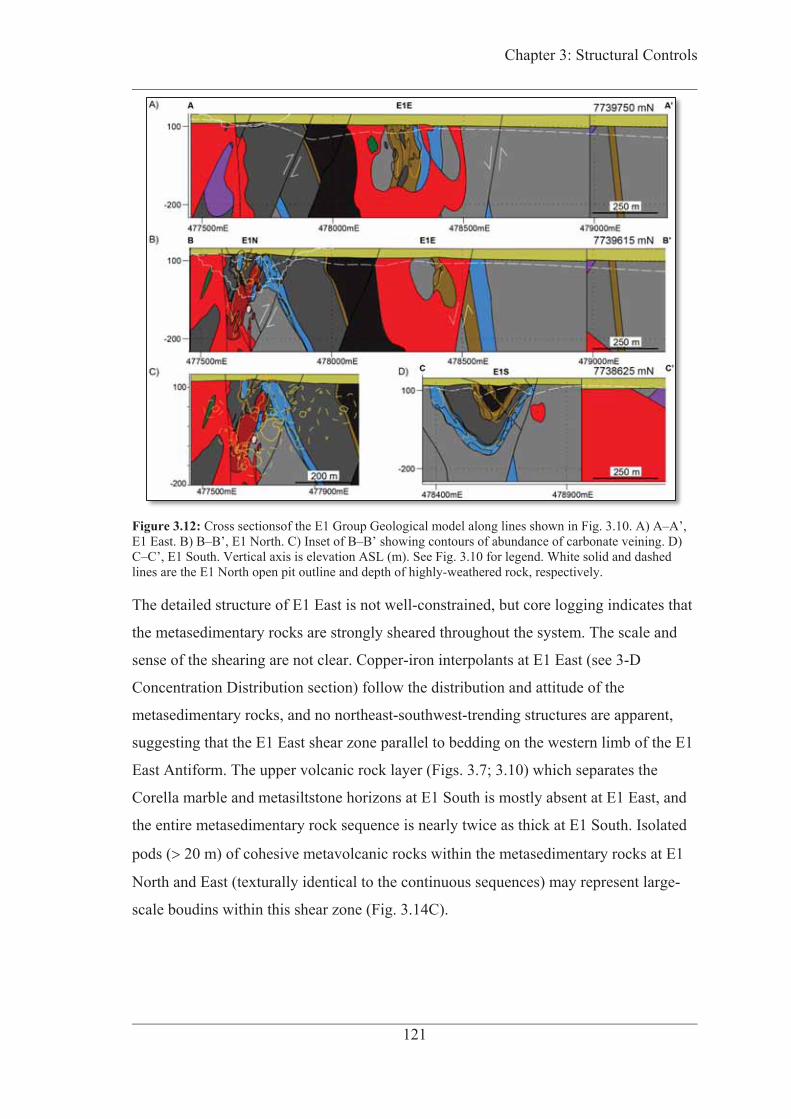
Chapter 3: Structural Controls
121
Figure 3.12: Cross sectionsof the E1 Group Geological model along lines shown in Fig. 3.10. A) A–A’, E1 East. B) B–B’, E1 North. C) Inset of B–B’ showing contours of abundance of carbonate veining. D) C–C’, E1 South. Vertical axis is elevation ASL (m). See Fig. 3.10 for legend. White solid and dashed lines are the E1 North open pit outline and depth of highly-weathered rock, respectively.
The detailed structure of E1 East is not well-constrained, but core logging indicates that
the metasedimentary rocks are strongly sheared throughout the system. The scale and
sense of the shearing are not clear. Copper-iron interpolants at E1 East (see 3-D
Concentration Distribution section) follow the distribution and attitude of the
metasedimentary rocks, and no northeast-southwest-trending structures are apparent,
suggesting that the E1 East shear zone parallel to bedding on the western limb of the E1
East Antiform. The upper volcanic rock layer (Figs. 3.7; 3.10) which separates the
Corella marble and metasiltstone horizons at E1 South is mostly absent at E1 East, and
the entire metasedimentary rock sequence is nearly twice as thick at E1 South. Isolated
pods ( 20 m) of cohesive metavolcanic rocks within the metasedimentary rocks at E1
North and East (texturally identical to the continuous sequences) may represent large-
scale boudins within this shear zone (Fig. 3.14C).

Chapter 3: Structural Controls
122
Figure 3.13: E1 North fault and shear structures visible in the E1 North open pit. A) Fault/shear zones C and D (see Fig. 3.10). Dark material is magnetite alteration. B) Sub-vertical carbonate fluorite barite sulfide tension veins near Fault 1. C) Photograph of a drill core intersection of sheared metavolcanic breccia in the E1 North Shear Zone. D) Three magnetite-pyrite-apatite-altered shear zones (white outline) of the E1N Shear Zone exposed in the southwest wall of the E1 North open pit. Arrow indicates approximate location of the drill core intersect in (D). These correspond to the modeled linear zones of high (> 20 wt%) Fe shown in Figs. 3.14A–B and 3.18H. Straight white lines indicate ~ 45° dipping carbonate veins associated with Fault 2. The orientation of these veins and those in (B) suggest extensional or normal movement along the faults and shear zones during mineralisation (local D3); reverse movement took place in local D4 after mineralisation.
Meso- and micro-scale structures Ductile structures are prevalent in metasedimentary rocks throughout the study area.
Close to open, asymmetric folds with 10 cm to 10 m wavelengths are common. The
northwest-southeast to southwest-northeast trend of their hinge surfaces (Fig. 3.16B) is
consistent with that of the E1 North Antiform and E1 South Synform and they are
considered to be parasitic. The variations in dip and strike of some of the axial surfaces
may be due to refolding (see Deformation sequence below). Sporadic flaser cross-
bedding (Fig. 2.5G; Chapter 2) found in E1 East metasedimentary rocks indicates that
some bedding is overturned by <10 m-scale folding. Disharmonic folding of siliceous

Chapter 3: Structural Controls
123
and pelitic layers within the metasiltstone has formed dilational zones in the fold hinges
infilled with carbonate, quartz and sulfide (Fig. 3.6B). Microfaulting is abundant in the
metasedimentary rocks and is typically associated with boudinage of siliceous layers in
between calcareous and pelitic layers. The geometry of, and distance between, boudins
at the drill core scale are variable, with thicker beds with relatively narrow ( 5 cm)
zones of infill between boudins, (Fig. 3.15A) and others completely fragmented into
breccia-like textures surrounded by shear fabric. These pseudo-breccia textures are
nearly identical to those observed in the Marble Matrix Breccia at Ernest Henry
(Twyerould 1997; Marshall and Oliver 2008), and are common in Cover Sequence 2
rocks across the Eastern Fold Belt. The boudins are typically sheared and imbricated.
Foliation is widespread across the E1 Group and is generally restricted to
metasedimentary rocks except in high-strain zones like the E1 North Shear Zone. The
foliation is defined by mica but in highly-mineralised zones it is defined by sulfide and
magnetite alteration. Kinematic indicators in coarse-grained clastic rocks (Fig. 3.15B)
indicate that much of this foliation in the E1 North Shear zone formed by normal
shearing, but the nature of foliation in marble and other metasedimentary rocks is less
clear.
Veins are ubiquitous across the deposit, but contain less ore compared to bedding and
foliation replacements. Early, small ( 10 cm), irregular, Stage 1 albite and Stage 2 K-
feldspar veins are common, and are less voluminous than later stages. Stage 2 magnetite
and biotite veins are typically less than 1 cm thick, although the boundary between
magnetite veins and magnetite alteration is usually impossible to distinguish. Indeed,
much of the magnetite is characterised by massive texture and cannot be linked to
obvious conduits at sub-meter scales. Albite, K-feldspar, hematite and biotite veins are
generally absent in the discordant breccia, though it is extensively altered by these same
minerals. Stage 2c and Stage 3 carbonate veins are found throughout the mine lease and
extend beyond drilling; they are volumetrically the dominant vein stages. They range in
apparent width in drill core from sub-millimeter to 5 m. Within and proximal to the
ore zone, the Stage 3 carbonate veins host barite, fluorite, chalcopyrite, and pyrite.
Carbonate, fluorite and barite in these veins are typified by large (10–50% of the vein
width), euhedral crystals; the relative locations of these minerals within veins varies
considerably (e.g. Fig. 2.7, Chapter 2). Where growth directions of these minerals are
visible, they are generally normal to the vein wall (not shown). Carbonate veins are
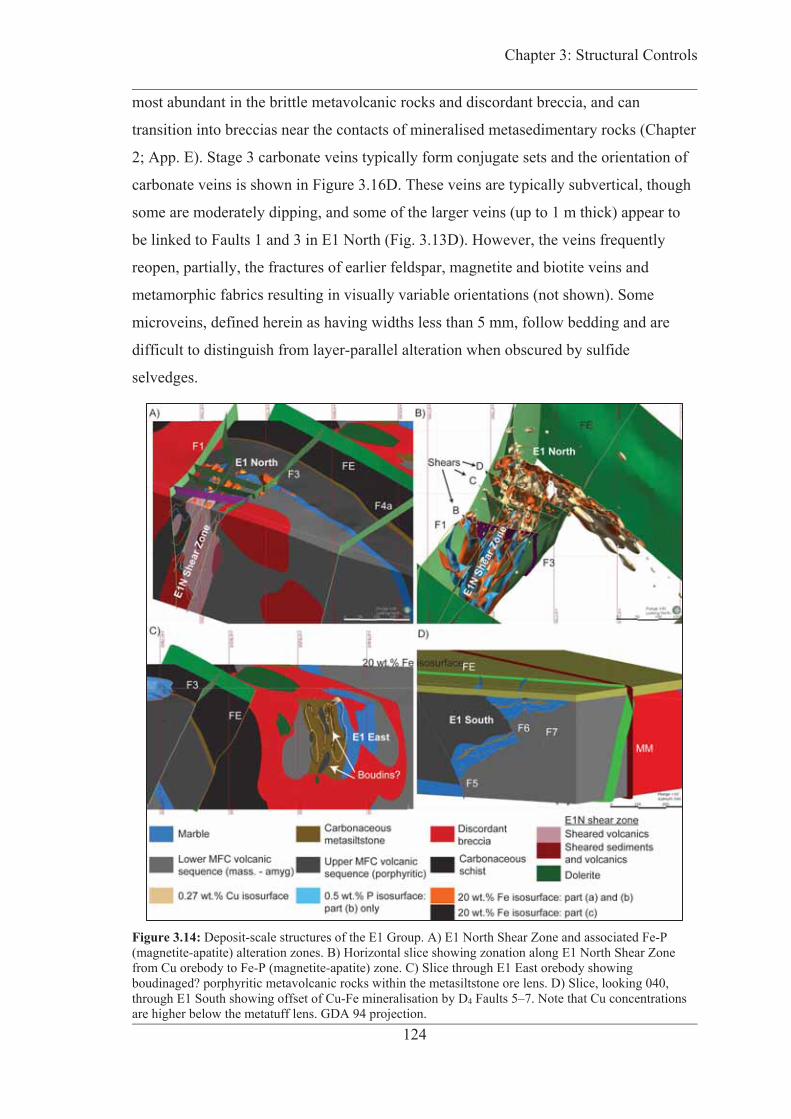
Chapter 3: Structural Controls
124
most abundant in the brittle metavolcanic rocks and discordant breccia, and can
transition into breccias near the contacts of mineralised metasedimentary rocks (Chapter
2; App. E). Stage 3 carbonate veins typically form conjugate sets and the orientation of
carbonate veins is shown in Figure 3.16D. These veins are typically subvertical, though
some are moderately dipping, and some of the larger veins (up to 1 m thick) appear to
be linked to Faults 1 and 3 in E1 North (Fig. 3.13D). However, the veins frequently
reopen, partially, the fractures of earlier feldspar, magnetite and biotite veins and
metamorphic fabrics resulting in visually variable orientations (not shown). Some
microveins, defined herein as having widths less than 5 mm, follow bedding and are
difficult to distinguish from layer-parallel alteration when obscured by sulfide
selvedges.
Figure 3.14: Deposit-scale structures of the E1 Group. A) E1 North Shear Zone and associated Fe-P (magnetite-apatite) alteration zones. B) Horizontal slice showing zonation along E1 North Shear Zone from Cu orebody to Fe-P (magnetite-apatite) zone. C) Slice through E1 East orebody showing boudinaged? porphyritic metavolcanic rocks within the metasiltstone ore lens. D) Slice, looking 040, through E1 South showing offset of Cu-Fe mineralisation by D4 Faults 5–7. Note that Cu concentrations are higher below the metatuff lens. GDA 94 projection.

Chapter 3: Structural Controls
125
Figure 3.15: Small-scale structures. A) Boudinage of silica-rich layers in siliceous marble. Note carbonate-fluorite-pyrite-chalcopyrite veins forming boudin necks. B) Sheared metavolcanic breccia? or siliceous metasedimentary rock. Groundmass is entirely pyrite-magnetite-chalcopyrite-barite-albite-fluorite-altered. C) Dilation in magnetite-altered marble with magnetite-pyrite-chalcopyrite infill, associated with faulting and shearing? Ccp, chalcopyrite; Mag, magnetite; Bar, barite; Fluo, fluorite; Py, pyrite. The kinematic indicators are sinistral but the lack of oriented core inhibits determination of their true sense.
Deformation Sequence The deformation events presented in this section refer to local events in the E1 area,
except in instances where a regional correlation is explicitly made. Correlations between
E1 and regional deformation are discussed later.
D1 and D2 and earlier deformation events The earliest deformation in the E1 Group area is represented by foliation sub-parallel to
compositional layering preserved in some pelitic metasiltstones (Fig. 3.17A), and is
interpreted as an S1 fabric formed during local D1. This fabric is largely obscured by D2
and D3 fabrics. The most prominent D2 structure is the Mount Margaret Fault, which is

Chapter 3: Structural Controls
126
a first-order, north-south-trending, structure clearly visible in aerial RTP-TMI over 20
km north and south of the E1 Group (Fig. 3.8). It is the only structure in the vicinity of
the E1 Group that clearly offsets the Mesozoic cover. Blenkinsop et al., (Fig. 10A;
2008) implied, based on geophysical interpretations, that the Mount Margaret Fault
represents a northern equivalent of the regional Cloncurry Fault structure, which
probably originated as a syn-depositional basin-bounding normal fault and was
subsequently reactivated as a major thrust during regional D2 and later episodes of the
Isan Orogeny (Austin and Blenkinsop 2008; Blenkinsop et al., 2008; Austin and
Blenkinsop 2010). The possibility that Fault 1 was also active during D2 cannot be
precluded. D2 also formed the S2 foliation which is dominant throughout the E1 Group
area. S2 foliation is defined by mica cleavage in pelites as well as flattening and
alignment of metavolcanic breccia clasts and amygdules (Fig. 3.17B). Fine-grained (
100 μm), highly-deformed quartz veins, up to 1–2 cm thick, are present in some schists
and are folded into alignment with S2, and are interpreted to represent pre- to early syn-
metamorphic veining. S2 trends north-northwest-south-southeast and dips subvertically
either east-northeast or west-southwest (Fig. 3.16A), and is typically parallel to axial
surfaces of parasitic macrofolds observed in drill core (Fig. 3.17D). Primary flow
textures are preserved in most plagioclase-rich metavolcanic rocks, implying that they
were not highly penetratively strained during D2. Development of S2 foliation was
concurrent with formation of the deposit-scale folds, which were caused by east-
northeast-west-southwest crustal shortening. The orientation of S2 and the folds are
similar to D3 fabric reported by Rubenach et al., (2008); this event, however, did not
produce major folding in the Eastern Fold Belt and D2 structures at the E1 Group most
likely correspond to regional D2 and peak metamorphism. The lack of unaltered host
rocks in the E1 Group drilling area has inhibited estimation of the peak metamorphic
grade reached in the deposit, but it is inferred to be amphibolite facies like Ernest Henry
8 km to the west (Mark et al., 2006b).

Chapter 3: Structural Controls
127
Figure 3.16: Poles of drill core structures plotted on equal-area southern hemisphere projection stereoplot. Contours based on the Kamb (1959) method. A) Poles to S2 fabric associated with D2, generally axial planar to F2 folds. B) Poles to F2 fold axes. C) Poles to bedding from both limbs of the E1 South synform and calculated axial plane of the synform. D) Poles to orientations of Stage 3 carbonate veins.
D3 deformation event The E1 North Shear Zone, which cuts across the E1 North Antiform formed during D2,
represents a D3 structure. The limited amount of ductile strain and abundance of veins in
the metavolcanic rocks suggest that the E1 North Shear Zone, its bounding faults, and
associated Stage 3 veins are a collective brittle-ductile zone. Stage 3 carbonate veins
exposed in the E1 North open pit near Fault 3 are mostly subvertical and dip southeast
(Fig. 3.13B), though some of the larger veins (up to 1 m thick), observed in drill core
and modeled, dip ~60°. Other large veins form perpendicular to Fault 2 and dip ~45°
west-southwest (Fig. 3.13D). These orientations indicate mostly normal sense
movement under locally extension-dominant stress regimes, and the veins are
interpreted to represent mainly extension vein structures associated with the steep shear
zones and faulting in the E1 North Shear Zone; they are not, however, purely
extensional. Asymmetric boudinage is common throughout metasedimentary rocks in
the E1 Group, but it is not clear at the drill core scale if it is related to extension or
compression. The extensional movement of the E1 North Shear Zone and related faults
can be explained by accommodation of sinistral movement of Faults E and A in
response to dextral movement along Fault 1 and the Mount Margaret Fault caused by
northeast-southwest shortening. S2 foliation is crenulated by S3 fabric (Fig. 3.17), and F2

Chapter 3: Structural Controls
128
folds are refolded. Within the E1 North Shear Zone, S2 is sheared and locally
completely overprinted by S3 shear fabric (Fig. 3.17). E1 East metasedimentary rocks
are also strongly sheared but the kinematics in this area are not constrained, though the
distribution of ores suggest that shearing was parallel to the northwest-southeast trend
of the E1 East Antiform in which the orebody is hosted (Fig. 3.10).
Unlike the strongly-foliated metavolcanic breccias, the discordant feldspar altered
breccias cutting across the system are generally only locally deformed and contain clasts
of actinolite-porphyroblastic metasedimentary rocks, indicating that this breccia formed
after D2 and peak metamorphism.Weak foliation (S3?) is developed in the biotite-rich
matrix of the discordant breccia, and clasts are very locally strongly foliated. The
contact of the breccia with intact wall rock is strongly sheared at E1 North, and the
breccia is discordant with D2 folds, therefore it is likely that brecciation occurred after
D2 and prior to or during D3.
Figure 3.17: Representative deformation fabrics. A) S1 compositional layering, or possibly S0 / S1 composite layering, in graphitic chlorite metasiltstone, crenulated by S2 and S3. B) S2 flattening of metavolcanic breccia clasts. Note the white haloes in clasts caused by magnetite destruction. C) S3 shearing of S2-foliated metavolcanic rocks. Groundmass is mostly magnetite with blebby sulfides. Note phenocrysts in “clasts”. The magnetite may replace a S3 shear fabric resulting in psuedobreccia in porphyritic metavolcanic rocks, or may replace a primary breccia matrix. Continued on the next page.
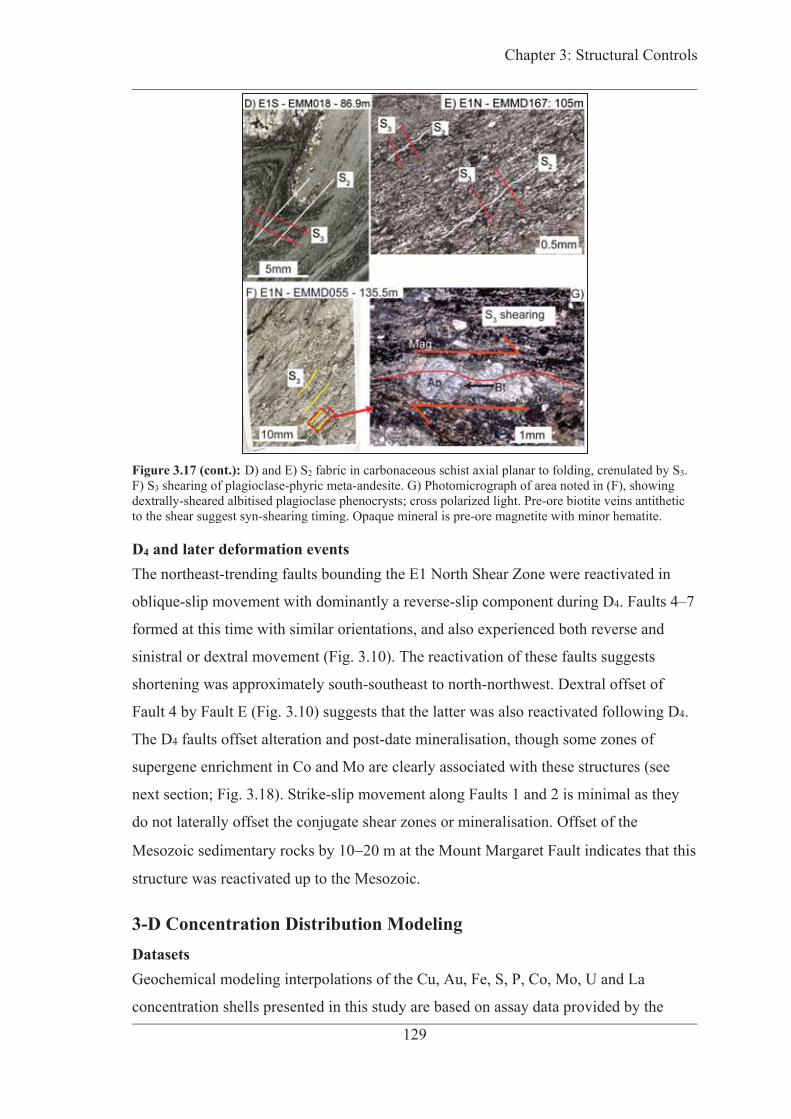
Chapter 3: Structural Controls
129
Figure 3.17 (cont.): D) and E) S2 fabric in carbonaceous schist axial planar to folding, crenulated by S3. F) S3 shearing of plagioclase-phyric meta-andesite. G) Photomicrograph of area noted in (F), showing dextrally-sheared albitised plagioclase phenocrysts; cross polarized light. Pre-ore biotite veins antithetic to the shear suggest syn-shearing timing. Opaque mineral is pre-ore magnetite with minor hematite.
D4 and later deformation events The northeast-trending faults bounding the E1 North Shear Zone were reactivated in
oblique-slip movement with dominantly a reverse-slip component during D4. Faults 4–7
formed at this time with similar orientations, and also experienced both reverse and
sinistral or dextral movement (Fig. 3.10). The reactivation of these faults suggests
shortening was approximately south-southeast to north-northwest. Dextral offset of
Fault 4 by Fault E (Fig. 3.10) suggests that the latter was also reactivated following D4.
The D4 faults offset alteration and post-date mineralisation, though some zones of
supergene enrichment in Co and Mo are clearly associated with these structures (see
next section; Fig. 3.18). Strike-slip movement along Faults 1 and 2 is minimal as they
do not laterally offset the conjugate shear zones or mineralisation. Offset of the
Mesozoic sedimentary rocks by 10 20 m at the Mount Margaret Fault indicates that this
structure was reactivated up to the Mesozoic.
3-D Concentration Distribution Modeling Datasets Geochemical modeling interpolations of the Cu, Au, Fe, S, P, Co, Mo, U and La
concentration shells presented in this study are based on assay data provided by the

Chapter 3: Structural Controls
130
current mine operator, which consists of a pre-open pit DDH and RC (Reverse
Circulation) multi-element suite including all of the aforementioned elements, as well as
a dataset from blast hole sampling for E1 North open pit which includes Cu, Au, Fe, S,
and Co. The assays were prepared by triple-acid (HCl, HNO3, and HClO4) digestion and
analysed via inductively-coupled plasma atomic emission spectroscopy (ICP-AES) for
Au and trace elements at ALS Laboratories in Townsville, Australia. Copper was
analysed by inductively-coupled plasma atomic absorption spectrometry (ICP-AAS).
Assay interval lengths generally vary between 1 m and 2 m for DDH and RC samples,
and many visually unmineralised intervals were not sampled. Blast hole samples
represent homogenised averages of the entire hole length, which varies from 8 m to over
20 m. While down-hole sample resolution is lower in the blast holes compared to the
DDH and RC holes, the former are spaced 5 m in all directions and provide much
higher spatial resolution in the E1 North orebody. Phosphorus, U and La were not
analysed in blast hole samples, but a comparison of Cu interpolants incorporating and
excluding blast hole data demonstrates that major structures can still be resolved with
only DDH and RC drilling, and meaningful interpretations can be made. Below-
detection values are not listed in the database and could not be distinguished from
unsampled intervals. For this reason, below-detection values were not replaced and all
missing values were omitted from interpolation. Summary statistics of the assay data are
available in Appendix E. Energy-Dispersive Spectroscopy (EDS) was conducted on a
JEOL JXA-8200 Superprobe at the James Cook University Advanced Analytical Centre
to help identify the host minerals of the modeled elements.
Concentration interpolation parameters for the E1 Group Numerical implicit modeling of geochemical assay data was conducted using the Multi-
domained Interpolation function. Leapfrog uses fast-Radial Basis Functions (RBF) for
implicit modeling, as described in detail in Stewart et al. (2014). The output of fast-
RBFs is comparable to ordinary and dual kriging (Stewart et al., 2014). Table 3.2
displays the interpolation parameters used for all elements in this study. In addition to
these parameters, a structural anisotropic trend was applied to each interpolant to reflect
the stratabound morphology of the orebody. The orientation of the trend is derived
directly from the combination of meshes of the modeled metasedimentary rock units
that host the ores, as well as from meshes of the mineralised D3 structures observed at
E1 North. Isosurfaces of the output interpolants are presented in Figures 3.18–3.19.
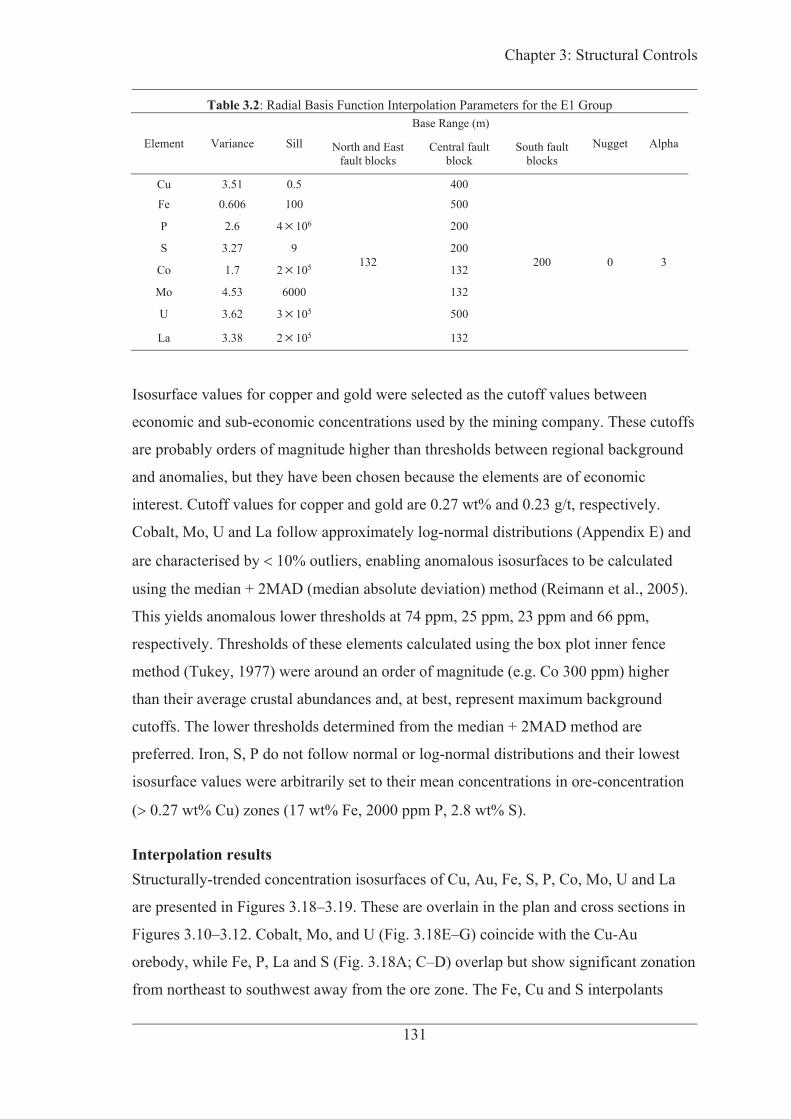
Chapter 3: Structural Controls
131
Table 3.2: Radial Basis Function Interpolation Parameters for the E1 Group
Element Variance Sill
Base Range (m)
Nugget Alpha North and East fault blocks
Central fault block
South fault blocks
Cu 3.51 0.5
132
400
200 0 3
Fe 0.606 100 500
P 2.6 4 106 200
S 3.27 9 200
Co 1.7 2 105 132
Mo 4.53 6000 132
U 3.62 3 105 500
La 3.38 2 105 132
Isosurface values for copper and gold were selected as the cutoff values between
economic and sub-economic concentrations used by the mining company. These cutoffs
are probably orders of magnitude higher than thresholds between regional background
and anomalies, but they have been chosen because the elements are of economic
interest. Cutoff values for copper and gold are 0.27 wt% and 0.23 g/t, respectively.
Cobalt, Mo, U and La follow approximately log-normal distributions (Appendix E) and
are characterised by 10% outliers, enabling anomalous isosurfaces to be calculated
using the median + 2MAD (median absolute deviation) method (Reimann et al., 2005).
This yields anomalous lower thresholds at 74 ppm, 25 ppm, 23 ppm and 66 ppm,
respectively. Thresholds of these elements calculated using the box plot inner fence
method (Tukey, 1977) were around an order of magnitude (e.g. Co 300 ppm) higher
than their average crustal abundances and, at best, represent maximum background
cutoffs. The lower thresholds determined from the median + 2MAD method are
preferred. Iron, S, P do not follow normal or log-normal distributions and their lowest
isosurface values were arbitrarily set to their mean concentrations in ore-concentration
( 0.27 wt% Cu) zones (17 wt% Fe, 2000 ppm P, 2.8 wt% S).
Interpolation results Structurally-trended concentration isosurfaces of Cu, Au, Fe, S, P, Co, Mo, U and La
are presented in Figures 3.18–3.19. These are overlain in the plan and cross sections in
Figures 3.10–3.12. Cobalt, Mo, and U (Fig. 3.18E–G) coincide with the Cu-Au
orebody, while Fe, P, La and S (Fig. 3.18A; C–D) overlap but show significant zonation
from northeast to southwest away from the ore zone. The Fe, Cu and S interpolants

Chapter 3: Structural Controls
132
(Fig. 3.18A, C, H) strongly coincide with E1 North Shear Zone structures, including
shears C and D (Fig. 3.18H); the Cu and Au interpolants follow the E1 South Synform
and E1 North Antiform down-plunge (Fig. 3.19). Although the resolution of the P assay
is lower, it is high enough to resolve association with the E1 North Shear Zone
southwest of the orebody (Fig. 3.18C). All elements are enriched within the Corella
3.18E) extends beyond mineralisation for up to 20 m in the more stratabound zones of
the orebody, but extends along strike of the E1 North Shear Zone for over 150 m.
Anomalous La and U ( 66 ppm and 23 ppm, respectively) are modeled up to 250 m
and 180 m respectively along the shear zone, and are restricted to 20 40 m outside the
Cu orebody at E1 East and South (Fig. 3.18D, G). The Mo anomaly ( 25 ppm; Fig.
3.18F) is present up to 50 m outside mineralisation at E1 North, but is restricted to 20
m elsewhere in the E1 Group.

Chapter 3: Structural Controls
133
Figure 3.18: Plan view of isosurfaces of structurally-trended interpolants. Note the higher resolution at E1 North for Cu, Fe, S, and Mo as a result of additional blast hole data. Copper and gold isosurface values are based on mining cutoff concentrations, while S, P, and Fe are based on the mean concentrations of these elements in ores. Isosurface values for La, Co, Mo and U are based on anomalous cutoffs determined using the median + 2MAD (median absolute deviation) method (Reimann et al., 2005). A) Cu and Fe isosurfaces. B) Cu-Au. C) S and P. D) La isosurfaces at anomalous and 2x anomalous values. UTM grid is in meters. GDA 94 projection. Continued on the next page.

Chapter 3: Structural Controls
134
Figure 3.18 (cont.): E) Co isosurfaces at anomalous and 2x anomalous values. F) Mo. G) U isosurfaces at anomalous and 2x anomalous values. H) Close-up view, dipping 70°, of E1 North orebody showing the Cu-Fe trends coincident with Fault 2 and Shears C–D. Blowouts (green arrows) in S, Co, Mo, U are artificial and extend into the unaltered cover sedimentary rocks. This is caused by the interpolation models having the same extents as the geological model in which they are subdomained. Leapfrog cannot clip the interpolants to a particular surface or volume.
Chapter 3: Structural Controls
135
Interpretations Drill core, petrographic, and EDS observations enable the modeled element
distributions to be linked to specific alteration phases. Drill core logging indicates that
the interpolated high-S zone corresponds to pyrite alteration, while the Fe-P-rich zone is
characterised by widespread coarse-grained, euhedral magnetite-apatite ± pyrite
replacement. Energy-dispersive spectroscopic analysis demonstrates that the high La
anomaly is hosted within apatite and trace monazite. In the ore zone there is less apatite
and REE alteration is also contained in bastnäsite and monazite. Uranium and S are
enriched to over 200 ppm and 10 wt%, respectively, in the carbonaceous metapelite at
E1 South. Such high S content is attributable to the ~5 vol% pyrite content of this rock,
which may be diagenetic in origin but has since been recrystallized. Uranium is
naturally high in carbonaceous metasedimentary rocks (Vine and Tourtelot, 1970),
which may explain the elevated values. Enrichment of Co, Mo and U near the
basement-cover unconformity (the ‘blowout blobs’ in Fig. 3.18) is likely due to
supergene remobilization. These elements are also anomalous in soil samples at the
surface above 30 50 m of thick cover (R. Lilly, pers. comm.). Molybdenite is rare in the
deposit, and Mo and Co-rich phases have not been observed in EDS analysis,
suggesting that they are hosted mostly within another phase.

Chapter 3: Structural Controls
136
Figure 3.19: 3-D renders of the 0.27% Cu (A) and 0.1ppm Au (B) interpolants; view is bearing south (opposite to Figure 3.18) and dipping 30°. Both interpolants are clearly controlled strongly by the plunge and attitudes of the E1 North Antiform and E1 South synform. The orebodies are open at depth. GDA 94 projection.
Chapter 3: Structural Controls
137
Discussion Relative timing of alteration and mineralisation At the deposit scale, interpolated Cu and Fe element concentration shells and observed
magnetite-rich zones form clear lineaments associated with the E1 North Shear Zone
and conjugate shear zones B–D, indicating that these local D3 structures were likely
active during at least Stage 2 alteration and Stage 3 mineralisation (Figs. 3.13; 3.14;
3.18; 3.20). This is consistent with microscale observations of Stage 2 biotite veins
cutting across antithetically to dextrally-sheared, albitised (Stage 1), plagioclase
phenocrysts (Fig. 3.17G), which indicates a pre- to syn-local D3 shearing timing for
Stage 1 albite alteration, and syn-shearing timing for Stage 2 alteration (Fig. 3.20).
Furthermore, hematite alteration associated with Stage 1 is aligned to the shear fabric
(Fig. 3.17G), which is also consistent with a pre to syn-shearing timing for Stage 1.
Stage 2 quartz associated with Stage 2 magnetite is locally deformed at grain boundaries
and provides further evidence of on-going deformation during alteration. Faults 4 to 7
are not associated with alteration or veins and offset the former, indicating that local D4
took place after mineralisation (Fig. 3.20). Additionally, a lack of abundant horizontal
veining associated with Faults 1 3 suggests that the reverse movement on these
structures during local D4 was not associated with any substantial hydrothermal activity
and alteration.

Chapter 3: Structural Controls
138
Figure 3.20: Integrated structural and alteration schematic of the E1 Group. The local deformation sequence is correlated to the regional sequence. E1NSZ, E1 North Shear Zone; Disc. brec., discordant breccia; bt, biotite.
Structural controls on mineralisation in the E1 Group Structural permeability in the E1 Group is provided mainly by fold hinges and shear
zones. Mineralisation is focused at/near the hinges of the E1 North Antiform and E1
South Synform, and the paucity of major mineralised structures at E1 South suggests
that dilation in the synform hinge itself acted as a major fluid focusing zone during
mineralisation. This is in agreement with the presence of small-scale dilations in the
hinges of <1m parasitic folds at E1 South. These dilations focus hydrothermal
carbonate, quartz and pyrite. The bounding of the E1 metasedimentary rock horizons by
relatively impermeable metavolcanic rocks may have enhanced focusing of fluids into
these dilational zones. Intersection of the E1 North Antiform, in particular the marble
horizon that defines it, with the E1 North Shear Zone (Fig. 3.14) is the most likely
explanation for higher ore concentration and tonnage at E1 North (Table 1.1) compared
to East and South. It is also possible that the E1 North antiform experienced more
dilation than E1 South, but this does not explain the extent of alteration along strike of
the southwest limb. The E1 North Shear Zone focuses alteration along strike, nearly
parallel to the limb of the antiform, for more than 1 km. Alteration along the shear zone
changes from the apatite ± magnetite zone in the southwest, to the magnetite zone,
pyrite zone, and finally the magnetite-barite-fluorite-carbonate-chalcopyrite ore zone
near the hinge of the E1 North Antiform. The orientation of the shear zone appears to be

Chapter 3: Structural Controls
139
mostly controlled by the west limb of the antiform. It is possible that strain partitioning
along this shear zone may have been enhanced by the discordant breccia body that is
partially fault-bound to the west by Fault 1 (Fig. 3.10). This breccia is relatively
undeformed compared to the adjacent strongly-sheared metavolcanic breccias and
metasedimentary rocks in the E1 North Shear Zone. The breccia also shows strong
albite-K-feldspar-alteration, which was more likely to fracture than rather than shear
except at localized high-strain zones 5 m wide.
The northeast-southwest trending shear zones at E1 North are not recognized at E1 East.
Interpolation of Cu concentration suggests that the orebody trends in the same direction
as the host limb of the E1 East Antiform. However, it is notable that the E1 East ore
zone occurs adjacent to the onset of major curvature in this antiform. Shearing parallel
to layering is abundant in drill core and probably acted as the major fluid conduit at E1
East. The contact between metasedimentary and metavolcanic rocks, regardless of
stratigraphic conformity, is not a significant control on mineralisation at the deposit
scale, as high ore concentrations ( 1 wt% Cu) are typically found over 5–10m away
from contacts at E1 South (Fig. 3.12D).
At the deposit scale, the 3-D geochemical models suggest that ores not directly
associated with a specific structure are restricted mostly to the Corella metasedimentary
rocks. This may suggest that metasedimentary composition and bedding are major
mineralisation controls. The chemical favourability of carbonate rocks for sulfide
alteration is well-documented in skarns (Meinert, 1992). Evidence of these controls at
smaller scales can be observed in preferential alteration along beds, including flaser
crossbedding. Although bedding contacts are not a major control at the deposit scale,
lamination-parallel microveining ( 5 mm width) is common and may have acted as a
major fluid pathway. These microveins are difficult to distinguish from coarse-grained
( 2 mm) alteration without petrographic analysis. It is possible that the microveins
open along bedding sub-parallel S1, and that S1 itself has enhanced bedding
permeability. Locally, high ore concentrations are carried by thick ( 30 cm) carbonate
veins that typically reopen earlier veins of quartz, albite and K-feldspar. The carbonate
veining and localized brecciation is more abundant in the more competent coherent
metavolcanic rocks, but these veins and breccias are only slightly mineralised.
Disseminated carbonate alteration haloes are associated with some carbonate veins, but

Chapter 3: Structural Controls
140
at the drill core scale these haloes are only sporadically associated with strong
magnetite-chalcopyrite alteration. It may be that these larger veins were either not a
major conduit for mineralisation, or that the system at that time was characterised by
relatively low water-rock ratios. Boudin necks and microfaults within the
metasedimentary rocks focus alteration and are typically infilled by carbonate,
chalcopyrite and pyrite veining with wide (~1 cm) chalcopyrite-pyrite selvedges.
Timing of IOCG mineralisation in Cloncurry Understanding the relative timing of mineralisation with respect to formation of
structural conduits is critical for improving IOCG genetic models. At the Ernest Henry
deposit, mineralisation is interpreted to have taken place after peak metamorphism (D2)
and during both local and regional D3 (Twyerould, 1997; Coward, 2001; Mark et al.,
2006b). These relationships are consistent with the E1 Group orebody having formed
during local D3. Ernest Henry alteration has been dated via Re-Os (molybdenite) by
Mark et al., (2004) and via U-Pb (titanite) by Mark et al., (2006b). These data are shown
in Figure 3.4, together with correlations between the E1 Group and Ernest Henry and
regional deformation histories. Both dating methods constrain the timing of ore genesis
at Ernest Henry to 1530–1500 Ma.
Ernest Henry and the E1 Group share local D3 mineralisation timing and regional D3
kinematics. The absolute age of Ernest Henry, however, is closer to regional D4 (Figs.
3.3–3.4). The 1456 ± 44 Ma U-Pb monazite age reported for the E1 Group in Chapter 2
suggests that it formed coevally with the 1550–1490 Ma Williams-Naraku suite; it
overlaps in time with Ernest Henry. The discrepancy between the relative and absolute
timing of these deposits with respect to regional D3 and D4 could be explained in two
ways. First, regional D3 may not be focused significantly in the E1 Group–Ernest Henry
area. Variability in the intensity of regional D3 and D4 fabrics and structures have been
documented by other authors (e.g. Rubenach and Barker, 1998; Austin and Blenkinsop,
2010; Duncan et al., 2014), especially in the vicinity of the Cloncurry Fault (Austin and
Blenkinsop, 2010). Second, it is possible that the direction of shortening in regional D4
is heterogeneous over the distance between the Snake Creek Anticline and the E1
Group. Such heterogeneity has been documented across the Mount Isa Inlier by Abu
Sharib and Bell (2011), who describe zones of dominantly east-west shortening, north-
south shortening, and northeast-southwest shortening. Furthermore, the diorite bodies
around Ernest Henry and the E1 Group may account for some strain heterogeneity. The

Chapter 3: Structural Controls
141
latter is more localized, especially in the northern part of the Inlier where Ernest Henry
and the E1 Group are located. The preferred explanation is a combination thereof, in
which regional D3 strain was not focused in the E1 Group–Ernest Henry region, and the
direction of subsequent regional D4 shortening shifted from northwest-southeast in the
Snake Creek Anticline, to northeast-southwest. Thus, despite being characterised by
kinematics similar to regional D3, the E1 Group probably formed during regional D4.
The post-mineralisation, local D4, structures thus formed in a regional D5 event which
has been recognized by some workers (Fig. 3.3; Austin and Blenkinsop, 2010; Duncan
et al., 2014). At Ernest Henry evidence for this is observable as late, northeast-
southwest-trending reverse faults transecting the orebody (Coward, 2001), as well as
gentle folding of the orebody about an east-northeast-west-southwest-trending hinge
(Fig. 3.21C).

Chapter 3: Structural Controls
142
Figure 3.21: Conceptual model (plan view) of the structural history of the E1 Group and Ernest Henry deposits. Large black arrows are 1 direction. A) Regional D2 folding generates pre-mineralisation tectonic fabric. At E1, Fault 1 and Mount Margaret faults probably activated as thrusts during this time. At Ernest Henry, sedimentary rocks are folded around Ernest Henry Diorite, and the orebody-bounding shear zones, possibly parallel to existing sediment layers, are initiated. B) In local D3 / regional D4, the shortening direction (indicated by the black arrows) shifts northward causing dextral reactivation of D2 faults at E1. Sinistral northwest-trending faults are formed, and E1 North shear zone develops as probably normal-dextral conjugate structures, with shear zones mainly focused along the marble horizon between more competent breccia and volcanic rocks. At Ernest Henry, D2 shear zones reactivated in a reverse flower structure in response to probably dextral shearing along the main shear zone around the competent diorite bodies. During this time, mineralisation takes place in both systems. At Ernest Henry, competent volcanics between sheared metasedimentary rocks deform in a brittle manner and brecciate with sufficient fluid overpressure. At E1, strain is mostly focused in the metasedimentary rocks and volcanic breccias. C) After local D3, northwest-southeast-directed shortening (local D4) causes reverse faulting at E1, and northeast-southwest-oriented gentle folding of the Ernest Henry orebody.

Chapter 3: Structural Controls
143
Comparison of the structural controls on the E1Group and Ernest Henry deposits The structural setting of the Ernest Henry deposit has been extensively analysed, and
deposit-scale controls on mineralisation are well-constrained (Twyerould, 1997; Mark
et al., 2000; Coward 2001; Mark et al., 2006b). However, camp- and regional-scale
controls have not been well-studied in this area due to the paucity of outcrop. Although
structural controls in ore deposits are typically complex and somewhat unique to each
system, similarities and differences can be found between Ernest Henry and the E1
Group which may help to explain structural factors influencing the style of IOCG
mineralisation in a given district: i.e., breccia-hosted Ernest Henry-style orebodies
compared to shear-replacement E1 Group-style orebodies. In the case of these two
deposits, at least four major factors combined to influence their location and
mineralisation styles throughout their structural evolution: 1) structural ground
preparation through D2 folding and faulting, and alteration, 2) local normal or reverse
faults/shear zones, formed within larger wrench shear systems, enabling dilation and
fluid influx, 3) strain partitioning caused by rheological contrast between volcanic and
sedimentary protoliths and, 4) fluid overpressuring.
The major folds hosting Ernest Henry and the E1 Group were developed prior to
mineralisation. The hanging wall and footwall shear zones that bound the Ernest Henry
orebody are splay structures related to a larger, northeast-southwest-trending, brittle to
ductile zone that developed in east-west shortening during regional D2. The shear zones
provided the structural framework for later syn-mineralisation deformation (Twyerould,
1997; Coward, 2001). The northeast-southwest-trending orientation of these shear
zones, along with the possible fold hinge they form around, are not consistent with
north-northwest-south-southeast D2 fabrics. This suggests that they may have been
rotated during local D3 (Fig. 3.21C). At the E1 Group, D2 formed the north-northwest
plunging E1 North Antiform with its western limb trending northeast-southwest.
During local D3 / regional D4, the D2 structures in both deposits were reactivated with
components of dip- and strike-slip movement, leading to dilation that could focus
mineralising fluids (Fig. 3.21). In the E1 Group, the north-northeast-south-southwest-
trending Fault 1 and Mount Margaret Fault structures probably experienced dextral and
reverse slip in response to northeast-southwest shortening, resulting in formation of a
transpressional Riedel brittle to ductile system (Cloos, 1928; Riedel, 1929; Davis et al.,
2000) (Fig. 3.21B–C). Less competent sedimentary and volcaniclastic rocks
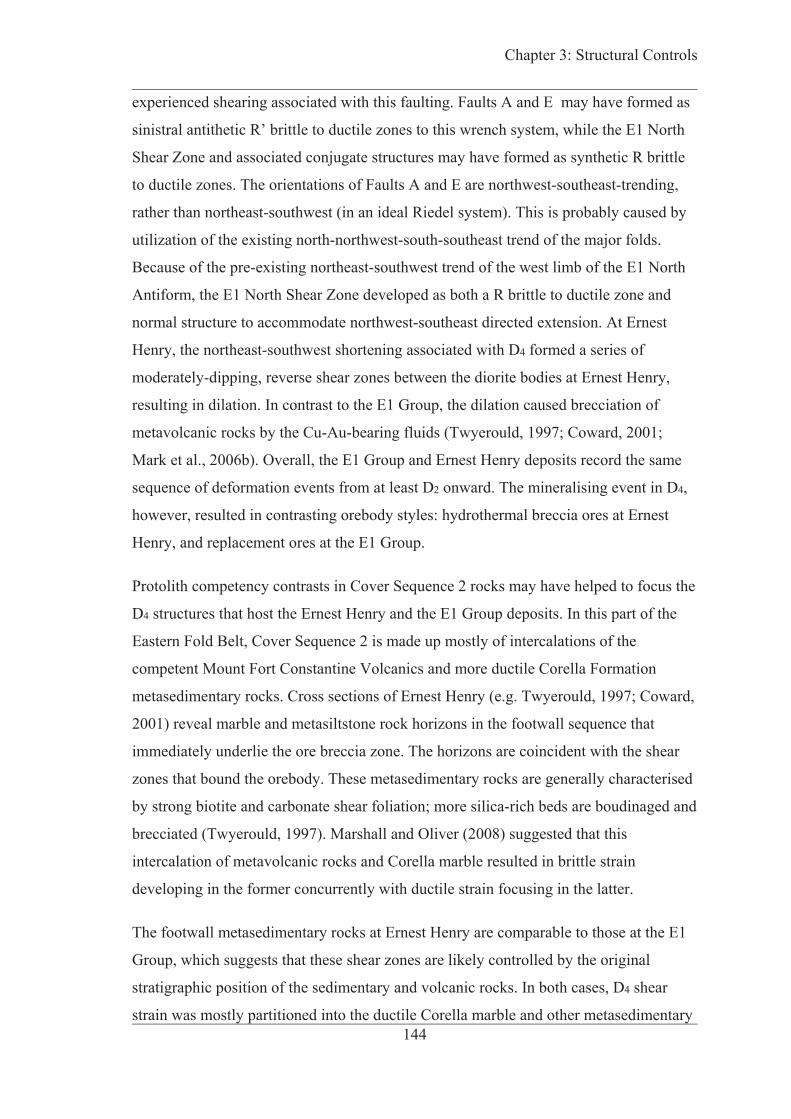
Chapter 3: Structural Controls
144
experienced shearing associated with this faulting. Faults A and E may have formed as
sinistral antithetic R’ brittle to ductile zones to this wrench system, while the E1 North
Shear Zone and associated conjugate structures may have formed as synthetic R brittle
to ductile zones. The orientations of Faults A and E are northwest-southeast-trending,
rather than northeast-southwest (in an ideal Riedel system). This is probably caused by
utilization of the existing north-northwest-south-southeast trend of the major folds.
Because of the pre-existing northeast-southwest trend of the west limb of the E1 North
Antiform, the E1 North Shear Zone developed as both a R brittle to ductile zone and
normal structure to accommodate northwest-southeast directed extension. At Ernest
Henry, the northeast-southwest shortening associated with D4 formed a series of
moderately-dipping, reverse shear zones between the diorite bodies at Ernest Henry,
resulting in dilation. In contrast to the E1 Group, the dilation caused brecciation of
metavolcanic rocks by the Cu-Au-bearing fluids (Twyerould, 1997; Coward, 2001;
Mark et al., 2006b). Overall, the E1 Group and Ernest Henry deposits record the same
sequence of deformation events from at least D2 onward. The mineralising event in D4,
however, resulted in contrasting orebody styles: hydrothermal breccia ores at Ernest
Henry, and replacement ores at the E1 Group.
Protolith competency contrasts in Cover Sequence 2 rocks may have helped to focus the
D4 structures that host the Ernest Henry and the E1 Group deposits. In this part of the
Eastern Fold Belt, Cover Sequence 2 is made up mostly of intercalations of the
competent Mount Fort Constantine Volcanics and more ductile Corella Formation
metasedimentary rocks. Cross sections of Ernest Henry (e.g. Twyerould, 1997; Coward,
2001) reveal marble and metasiltstone rock horizons in the footwall sequence that
immediately underlie the ore breccia zone. The horizons are coincident with the shear
zones that bound the orebody. These metasedimentary rocks are generally characterised
by strong biotite and carbonate shear foliation; more silica-rich beds are boudinaged and
brecciated (Twyerould, 1997). Marshall and Oliver (2008) suggested that this
intercalation of metavolcanic rocks and Corella marble resulted in brittle strain
developing in the former concurrently with ductile strain focusing in the latter.
The footwall metasedimentary rocks at Ernest Henry are comparable to those at the E1
Group, which suggests that these shear zones are likely controlled by the original
stratigraphic position of the sedimentary and volcanic rocks. In both cases, D4 shear
strain was mostly partitioned into the ductile Corella marble and other metasedimentary
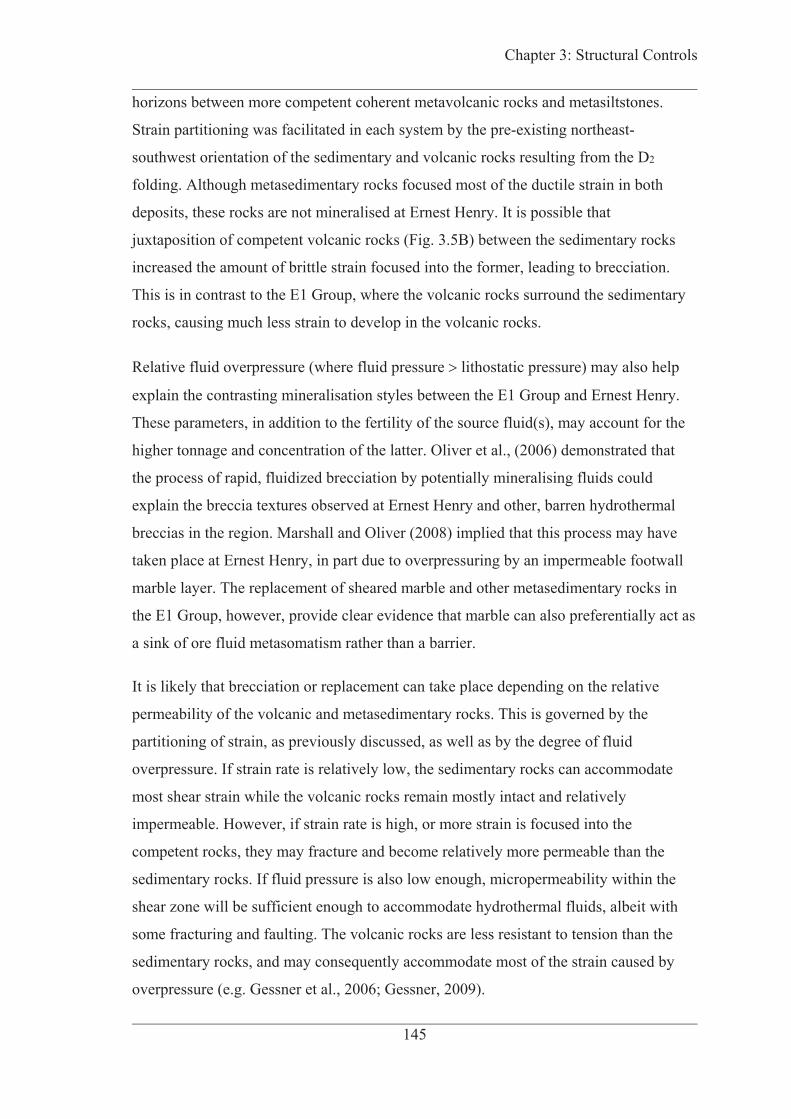
Chapter 3: Structural Controls
145
horizons between more competent coherent metavolcanic rocks and metasiltstones.
Strain partitioning was facilitated in each system by the pre-existing northeast-
southwest orientation of the sedimentary and volcanic rocks resulting from the D2
folding. Although metasedimentary rocks focused most of the ductile strain in both
deposits, these rocks are not mineralised at Ernest Henry. It is possible that
juxtaposition of competent volcanic rocks (Fig. 3.5B) between the sedimentary rocks
increased the amount of brittle strain focused into the former, leading to brecciation.
This is in contrast to the E1 Group, where the volcanic rocks surround the sedimentary
rocks, causing much less strain to develop in the volcanic rocks.
Relative fluid overpressure (where fluid pressure lithostatic pressure) may also help
explain the contrasting mineralisation styles between the E1 Group and Ernest Henry.
These parameters, in addition to the fertility of the source fluid(s), may account for the
higher tonnage and concentration of the latter. Oliver et al., (2006) demonstrated that
the process of rapid, fluidized brecciation by potentially mineralising fluids could
explain the breccia textures observed at Ernest Henry and other, barren hydrothermal
breccias in the region. Marshall and Oliver (2008) implied that this process may have
taken place at Ernest Henry, in part due to overpressuring by an impermeable footwall
marble layer. The replacement of sheared marble and other metasedimentary rocks in
the E1 Group, however, provide clear evidence that marble can also preferentially act as
a sink of ore fluid metasomatism rather than a barrier.
It is likely that brecciation or replacement can take place depending on the relative
permeability of the volcanic and metasedimentary rocks. This is governed by the
partitioning of strain, as previously discussed, as well as by the degree of fluid
overpressure. If strain rate is relatively low, the sedimentary rocks can accommodate
most shear strain while the volcanic rocks remain mostly intact and relatively
impermeable. However, if strain rate is high, or more strain is focused into the
competent rocks, they may fracture and become relatively more permeable than the
sedimentary rocks. If fluid pressure is also low enough, micropermeability within the
shear zone will be sufficient enough to accommodate hydrothermal fluids, albeit with
some fracturing and faulting. The volcanic rocks are less resistant to tension than the
sedimentary rocks, and may consequently accommodate most of the strain caused by
overpressure (e.g. Gessner et al., 2006; Gessner, 2009).

Chapter 3: Structural Controls
146
Figure 3.22: Cartoon of fluid and structural models for Ernest Henry and E1 Group mineralisation. A) At Ernest Henry, a combination of fluid pressures significantly higher than lithostatic pressure, and positioning of competent metavolcanic rocks between impermeable, ductile, metasedimentary rocks (mostly marble) leads to overpressuring of a magmatic-hydrothermal fluid and brecciation of the competent metavolcanic rocks. During this brecciation, an external fluid mixes with the magmatic fluid. B) At the E1 Group, the ductile metasedimentary rocks, bounded by brittle metavolcanic rocks, focus shearing and lithostatic pressure).
The degree of fluid overpressure in either system may be related to the overall size and
H2O content of the granitic intrusion that probably contributed to the mineralising fluids
in both Ernest Henry (Twyerould, 1997; Mark et al., 2006b; Kendrick et al., 2007;
Oliver et al., 2008) and the E1 Group (Williams et al., 2015). The P-T conditions at the
time of fluid exsolution from the magma, along with the availability of ligands, Cl, and
S for transporting and precipitating Cu and Au, are also important. Indeed, models for
IOCG genesis in the region (e.g. Mark et al., 2006b; Kendrick et al., 2007; Williams et
al., 2015) invoke the mixing of a magmatic fluid with another fluid (i.e. basinal or
meteoric; Fig. 3.22), which may have carried much of the necessary sulfur, in order to
generate Ernest Henry ore. The size of the E1 Group may be partly dependent on the
degree of mixing between such fluids; brecciation may serve as an efficient mixing
mechanism. However, the similar mineralogy and chemistry of the two deposits
suggests that their fluid characteristics were comparable during mineralisation (e.g.
Williams et al., 2015). The high tonnage and concentration of Ernest Henry compared to
the E1 Group is probably a result of either higher overall permeability generated
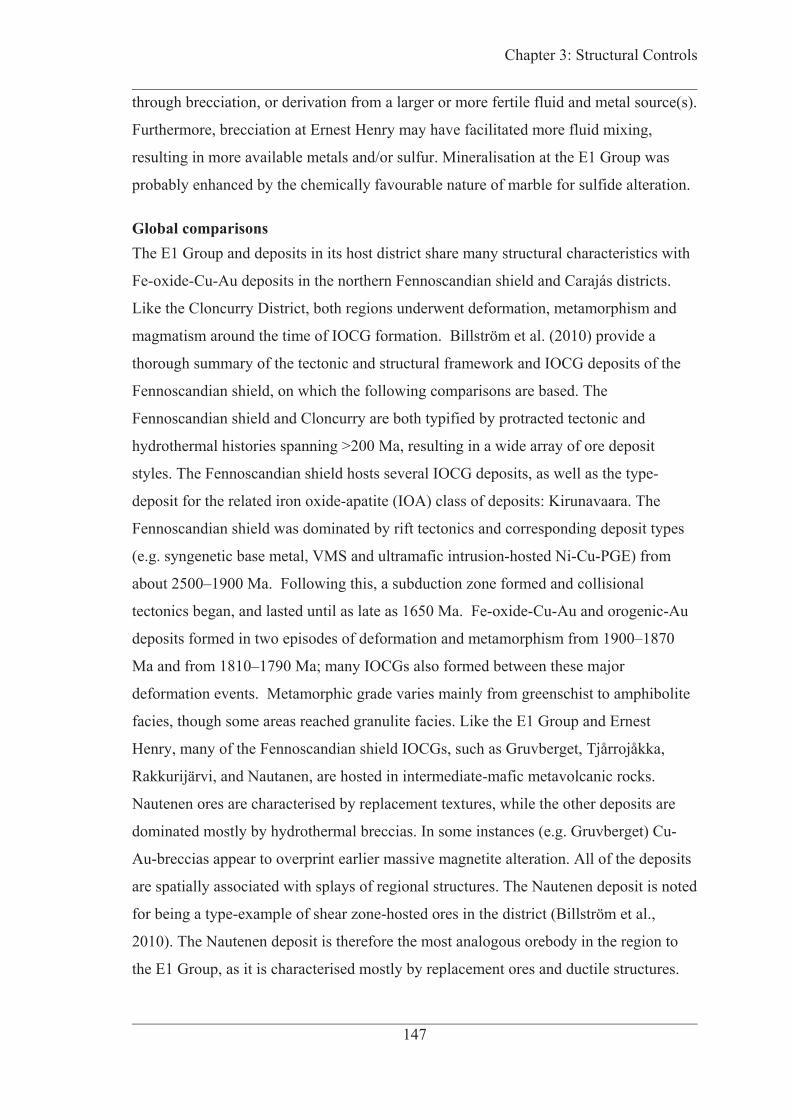
Chapter 3: Structural Controls
147
through brecciation, or derivation from a larger or more fertile fluid and metal source(s).
Furthermore, brecciation at Ernest Henry may have facilitated more fluid mixing,
resulting in more available metals and/or sulfur. Mineralisation at the E1 Group was
probably enhanced by the chemically favourable nature of marble for sulfide alteration.
Global comparisons The E1 Group and deposits in its host district share many structural characteristics with
Fe-oxide-Cu-Au deposits in the northern Fennoscandian shield and Carajás districts.
Like the Cloncurry District, both regions underwent deformation, metamorphism and
magmatism around the time of IOCG formation. Billström et al. (2010) provide a
thorough summary of the tectonic and structural framework and IOCG deposits of the
Fennoscandian shield, on which the following comparisons are based. The
Fennoscandian shield and Cloncurry are both typified by protracted tectonic and
hydrothermal histories spanning >200 Ma, resulting in a wide array of ore deposit
styles. The Fennoscandian shield hosts several IOCG deposits, as well as the type-
deposit for the related iron oxide-apatite (IOA) class of deposits: Kirunavaara. The
Fennoscandian shield was dominated by rift tectonics and corresponding deposit types
(e.g. syngenetic base metal, VMS and ultramafic intrusion-hosted Ni-Cu-PGE) from
about 2500–1900 Ma. Following this, a subduction zone formed and collisional
tectonics began, and lasted until as late as 1650 Ma. Fe-oxide-Cu-Au and orogenic-Au
deposits formed in two episodes of deformation and metamorphism from 1900–1870
Ma and from 1810–1790 Ma; many IOCGs also formed between these major
deformation events. Metamorphic grade varies mainly from greenschist to amphibolite
facies, though some areas reached granulite facies. Like the E1 Group and Ernest
Henry, many of the Fennoscandian shield IOCGs, such as Gruvberget, Tjårrojåkka,
Rakkurijärvi, and Nautanen, are hosted in intermediate-mafic metavolcanic rocks.
Nautenen ores are characterised by replacement textures, while the other deposits are
dominated mostly by hydrothermal breccias. In some instances (e.g. Gruvberget) Cu-
Au-breccias appear to overprint earlier massive magnetite alteration. All of the deposits
are spatially associated with splays of regional structures. The Nautenen deposit is noted
for being a type-example of shear zone-hosted ores in the district (Billström et al.,
2010). The Nautenen deposit is therefore the most analogous orebody in the region to
the E1 Group, as it is characterised mostly by replacement ores and ductile structures.

Chapter 3: Structural Controls
148
However, it is distinct from the E1 Group in that it may have formed prior to or during
peak metamorphism (Martinsson and Wanhainen, 2004).
The Carajás district in Brazil hosts world-class IOCG deposits including Salobo and
Sossego. These two deposits form part of the group of Archean (~2.5 Ga) Fe-oxide-
associated Cu-Au ± Mo ± Ag ± U ± REE deposits (Grainger et al., 2008). The deposits
are hosted mainly in a series of Neoarchean (2.75–2.68 Ga) intermediate-mafic
metavolcanic and metasedimentary rocks interpreted to have been laid down in an
intracratonic rift basin (Grainger et al., 2008), which is analogous to Cloncurry. As with
the Cloncurry and Fennoscandian shield, metamorphism in this area reached greenschist
to amphibolite facies, with local migmatite formation. The Igarapé Bahia-Alemão,
Crisalino and Sossego-Sequerinho deposits are typified by breccia-hosted Fe-oxide-Cu-
Au ores, while Salobo – the largest deposit in the district – is dominated by massive
replacement magnetite-Cu-Au bodies (Requia et al., 2003; Grainger et al., 2008).
Salobo is characterised by ductile-brittle shear zone controls, whereas the others
deposits are mostly associated with brittle structures (Requia et al., 2003). Grainger et
al., (2008) suggested that this may be the result of greater formation depth and
metamorphic grade (amphibolite facies) at Salobo than at the other systems (greenschist
facies). The Cinzento strike-slip fault system – one of the more prominent regional
structures associated with these deposits – was active at 2.5 Ga (Pinheiro and
Holdsworth, 1997). Requia et al., (2003) interpret multiple Re-Os (molybdenite)
mineralisation ages at Salobo (2576 ± 6 and 2572 ± 8 Ma) to represent reactivation of
the shear zone and brittle structures that control the orientation of the orebody.
From comparing the Fennoscandian shield and Carajás districts to the Cloncurry
District, a clear association can be made between ductile or ductile-brittle structural
settings, and the formation of replacement IOCG orebodies such as the E1 Group,
Nautenen and Salobo. Multiple factors may explain the presence of both breccia-hosted
and shear-hosted IOCG deposits in these regions. In the case of the Carajás District, the
variation in deformation style between Salobo and other deposits may be attributable to
the grade of metamorphism (Grainger et al., 2008), with Salobo forming in a higher-
grade zone dominated by ductile strain. Another factor that may be important is the
volume of fluids expelled from possible source magmas, as previously discussed for
Ernest Henry and the E1 Group; more fluids can lead to higher fluid pressure, causing
brecciation. However, the large size of the Salobo orebody (789 Mt at 0.96% Cu and

Chapter 3: Structural Controls
149
0.52 g/t Au; Souza and Vieira, 2000) indicates that shear zone replacement by magmatic
fluids can form large IOCG deposits. Instead, the rate of fluid flow is probably more
important, with breccia orebodies possibly characterised by higher rates. Lastly, late
brittle deformation and mineralisation may take place in systems affected by earlier
metasomatism. For example, Billström et al., (2010) suggested that earlier Na-Ca and/or
magnetite/hematite alteration structurally prepared the host rocks of some deposits (e.g.
Gruvberget-Cu?) in this district for hydrothermal brecciation by increasing their
rigidity.
Regardless of structural regime, deposits in all three districts are commonly controlled
by shifts in the competency of the host rocks. Examples of this are apparent at Salobo,
where ores are hosted in a metagreywacke bounded by more competent quartzite and
gneiss (Requia et al., 2003). In the Fennoscandian shield, deposits such as Nautanen
and Aitik are hosted within schist surrounded by gneiss and granite (Billström et al.,
2010). Overall, it is clear that the structural controls and setting of the E1 Group and
Ernest Henry deposits are comparable to IOCGs in other provinces, and the results
presented in this study may be applied to shear-hosted, replacement-style IOCG
orebodies elsewhere.
Conclusions Three-dimensional geological modeling and geochemical interpolation, when combined
with drill core and open pit observations, can facilitate the spatial and temporal
understanding of deposit evolution. The E1 Group of Fe-oxide Cu-Au deposits is
characterised by four major deformational events recognizable at small scales through
drill core logging, and at large scales through deposit-scale modeling. Although much
of the mineralisation in the E1 Group is hosted within metasedimentary rocks, the E1
North orebody is substantially larger than other orebodies in the Group due to the
intersection of the E1 North Shear Zone with the Corella marble horizon. Mineralisation
took place during local D3 / regional D4 shearing and faulting in a transpressional Riedel
brittle to ductile system associated with the major Cloncurry Fault Zone. At E1 North,
this deformation was focused along the E1 North Shear Zone trending northeast-
southwest and parallel with the west limb of the north-northwest plunging E1 North
Antiform. Fluids at E1 South were focused in the hinge of the E1 South Synform.
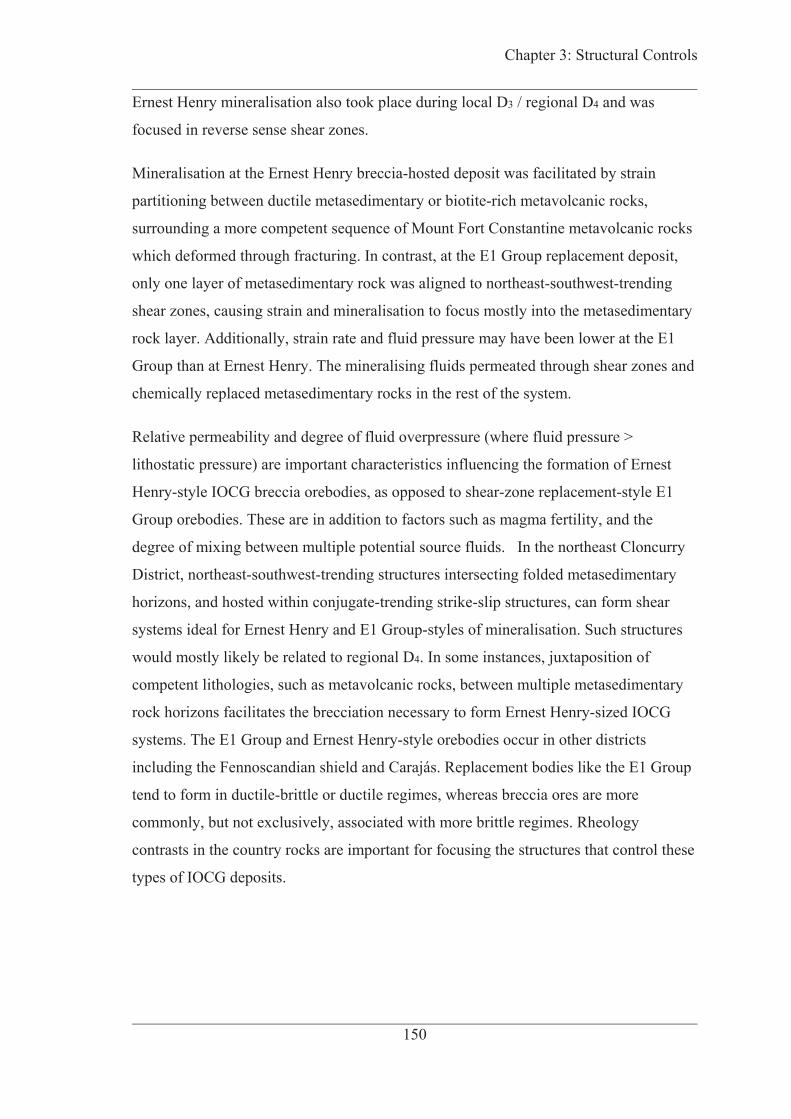
Chapter 3: Structural Controls
150
Ernest Henry mineralisation also took place during local D3 / regional D4 and was
focused in reverse sense shear zones.
Mineralisation at the Ernest Henry breccia-hosted deposit was facilitated by strain
partitioning between ductile metasedimentary or biotite-rich metavolcanic rocks,
surrounding a more competent sequence of Mount Fort Constantine metavolcanic rocks
which deformed through fracturing. In contrast, at the E1 Group replacement deposit,
only one layer of metasedimentary rock was aligned to northeast-southwest-trending
shear zones, causing strain and mineralisation to focus mostly into the metasedimentary
rock layer. Additionally, strain rate and fluid pressure may have been lower at the E1
Group than at Ernest Henry. The mineralising fluids permeated through shear zones and
chemically replaced metasedimentary rocks in the rest of the system.
Relative permeability and degree of fluid overpressure (where fluid pressure >
lithostatic pressure) are important characteristics influencing the formation of Ernest
Henry-style IOCG breccia orebodies, as opposed to shear-zone replacement-style E1
Group orebodies. These are in addition to factors such as magma fertility, and the
degree of mixing between multiple potential source fluids. In the northeast Cloncurry
District, northeast-southwest-trending structures intersecting folded metasedimentary
horizons, and hosted within conjugate-trending strike-slip structures, can form shear
systems ideal for Ernest Henry and E1 Group-styles of mineralisation. Such structures
would mostly likely be related to regional D4. In some instances, juxtaposition of
competent lithologies, such as metavolcanic rocks, between multiple metasedimentary
rock horizons facilitates the brecciation necessary to form Ernest Henry-sized IOCG
systems. The E1 Group and Ernest Henry-style orebodies occur in other districts
including the Fennoscandian shield and Carajás. Replacement bodies like the E1 Group
tend to form in ductile-brittle or ductile regimes, whereas breccia ores are more
commonly, but not exclusively, associated with more brittle regimes. Rheology
contrasts in the country rocks are important for focusing the structures that control these
types of IOCG deposits.
Chapter 3: Structural Controls
151
References
Abu Sharib, A.S. a. a., and Bell, T.H., (2011). Radical changes in bulk shortening directions during orogenesis: Significance for progressive development of regional folds and thrusts: Precambrian Research, 188, p.1–20.
Adshead-Bell, N., (1998). Evolution of the Starra and Selwyn high-strain zones, Eastern fold belt, Mount Isa Inlier; implications for Au-Cu mineralisation: Economic Geology, 93, p.1450–1462.
Alcaraz, S., Lane, R. and Spragg, K., (2011). 3D geological modeling using new Leapfrog Geothermal software: in: Proceedings, Thirty-Sixth Workshop on Geothermal Reservoir Engineering, Stanford University, Stanford, California, USA, Jan 31–Feb 2, 2011, SGP-TR-191. https://pangea.stanford.edu/ERE/db/IGAstandard/record_detail.php?id=7165.
Austin, J., and Blenkinsop, T. (2008). The Cloncurry Lineament: Geophysical and geological evidence for a deep crustal structure in the Eastern Succession of the Mount Isa Inlier: Precambrian Research, 163(1–2), p.50–68.
Austin, J. R., and Blenkinsop, T. G., (2010). Cloncurry Fault Zone: strain partitioning and reactivation in a crustal-scale deformation zone, Mt Isa Inlier: Australian Journal of Earth Sciences, 57(1), p.1–21.
Baker, T., and Laing, W., (1998). Eloise Cu-Au deposit, East Mt Isa Block: Structural environment and structural controls on ore: Australian Journal of Earth Sciences, 55, p.429–444.
Barton, M.D.and Johnson, D.A., (2000). Alternative Brine Sources for Fe-Oxide (-Cu-Au) Systems: Implications for Hydrothermal Alteration and Metals: in Porter, T.M. (ed.), Hydrothermal Iron Oxide Copper-Gold and Related Deposits: A Global Perspective: PGC Publishing, 1, Adelaide, p.43–60.
Beardsmore, T.J., (1992). Petrogenesis of Mount Dore-style breccia-hosted copper ± gold mineralisation in the Kuridala-Selwyn region of northwestern Queensland: PhD thesis, Queensland, Australia, James Cook University, 282p.
Bell, T., (1983). Thrusting and duplex formation at Mount Isa, Queensland, Australia: Nature, 304, p.493–497.
Bell, T.H., and Hickey, K.A. (1998). Multiple deformations with successive subvertical and subhorizontal axial planes in the Mount Isa region; their impact on geometric development and significance for mineralisation and exploration: Economic Geology, 93, p.1369–1389.

Chapter 3: Structural Controls
152
Belperio, A., Flint, R., and Freeman, H., (2007). Prominent Hill: A Hematite-Dominated, Iron Oxide Copper-Gold System: Economic Geology, 102(8), p.1499–1510.
Betts, P.G., Armit, R.J., Hutton, L.J., Withnall, I.W., and Donchak, P.J.T., (2011). Proterozoic Mount Isa synthesis: in Northwest Queensland Minerals and Energy Province Report, Appendix 1. Queensland Department of Employment, Economic Development and Innovation, Brisbane, 56p.
Betts, P., and Giles, D., (2006). The 1800–1100Ma tectonic evolution of Australia: Precambrian Research, 144, p.92–125.
Billström, K, Eilu, P., Martinsson, O., Niiranen, T., Broman, C., Weihed, P., Wanhainen, C. and Ojala, J., (2010). IOCG and related mineral deposits of the Northern Fennoscandian Shield: in Porter, T. M. (ed.) Hydrothermal Iron Oxide Copper-Gold and Related Deposits: A Global Perspective, 4, PGC Publishing, Adelaide, Australia, p.381–414.
Blake, D.H., (1987). Geology of the Mount Isa Inlier and environs, Queensland and Northern Territory: Bureau of Mineral Resources, Geology and Geophysics Bulletin: 225, Department of Resources and Energy, Canberra, ACT, Australia, 83p.
Blake, D.H. and Stewart, A.J., (1992). Stratigraphic and tectonic framework, Mount Isa Inlier: in Stewart, A. and Blake, D.H. (eds.), Detailed Studies of the Mount Isa Inlier: Australia Geological Survey Bulletin, 243, p.1–11.
Blenkinsop, T., Huddlestoneholmes, C., Foster, D., Edmiston, M., Lepong, P., Mark, G., Austin, J., Murphy, F.C., Ford, A., and Rubenach, M.J., (2008). The crustal scale architecture of the Eastern Succession, Mount Isa: The influence of inversion. Precambrian Research, 163(1-2), p.31–49.
Cloos, H., (1928). Experimentenzurinneren Tektonik. Centralblattfur Mineralogie and Paleontologie, 1928B, 609p.
Cowan, E., Beatson, R., Ross, H., Fright, W., McLennan, T., Evans, T. and Titley, M., (2003). Practical implicit geological modeling: in: Fifth International Mining Geology Conference Proceedings, Bendigo, VIC, Australia, Nov 17-19 2003, p.89–99. https://www.ausimm.com.au/publications/publication.aspx?ID=188
Coward, M., (2001). Structural Controls on Ore Formation and Distribution at the Ernest Henry Cu-Au Deposit, NW Qld: Honours Thesis, James Cook University, Townsville, QLD, Australia.

Chapter 3: Structural Controls
153
Davidson, G.J., Davis, B.K. and Garner, A., (2002). Structural and Geochemical Constraints on the Emplacement of the Monakoff Oxide Cu-Au (-Co-U-REE-Ag-Zn-Pb) Deposit, Mt Isa Inlier, Australia: in Porter, T.M. (ed.), Hydrothermal Iron Oxide Copper-Gold and Related Deposits: A Global Perspective: PGC Publishing, 2, Adelaide, p.49–75.
Davis, G. H., Bump, A. P., Garcia, P. E., andAhlgren, S. G., (2000). Conjugate Riedel deformation band shear zones: Journal of Structural Geology, 22(2), p.169–190.
Davis, B.K., Pollard, P.J., Lally, J.H., McNaughton, N.J., Blake, K., and Williams, P.J., (2001). Deformation history of the Naraku Batholith, Mt Isa Inlier, Australia: Implications for pluton ages and geometries from structural study of the Dipvale Granodiorite and Levian Granite: Australian Journal of Earth Sciences, 48, p.113–129.
Duncan, R.J., Hitzman, M.W., Nelson, E.P., and Togtokhbayar, O., (2014). Structural and Lithological Controls on Iron Oxide Copper-Gold Deposits of the Southern Selwyn-Mount Dore Corridor, Eastern Fold Belt, Queensland, Australia: Economic Geology, 109, p.419–456.
Duncan, R.J., Stein, H., Evans, K., Hitzman, M., Nelson, E., and Kirwin, D., (2011). Geochronological Framework for Mineralisation and Alteration in the Selwyn-Mount Dore Corridor, Eastern Fold Belt, Mount Isa Inlier, Australia: Genetic Implications. Economic Geology, 106(2), p.169–192.
Fisher, L., and Kendrick, M., (2008). Metamorphic fluid origins in the Osborne Fe oxide-Cu-Au deposit, Australia: evidence from noble gases and halogens. Mineralium Deposita, 43, p.483–497.
Foster, D.R.W., and Rubenach, M.J. (2006). Isograd pattern and regional low-pressure, high-temperature metamorphism of pelitic, mafic and calc-silicate rocks along an east – west section through the Mt Isa Inlier: Australian Journal of Earth Sciences, 53, p.167–186.
Foster, D., and Austin, J., (2008). The 1800-1610Ma stratigraphic and magmatic history of the Eastern Succession, Mount Isa Inlier, and correlations with adjacent Paleoproterozoic terranes: Precambrian Research, 163(1–2), p.7–30.
Gauthier L., Hall G., Stein H. and Schaltegger, U., 2001, The Osborne deposit, Cloncurry district: a 1595 Ma Cu-Au skarn deposit: in Williams P. J. (ed.), 2001: A Hydrothermal Odyssey, Extended Conference Abstracts: James Cook University, Townsville, QLD, Australia, p.58–59.
Chapter 3: Structural Controls
154
Gessner, K., Jones, P.A., Wilde, A.R. and Kühn, M., (2006). Significance of strain localization and fracturing in relation to hydrothermal mineralisation at Mount Isa, Australia: Journal of Geochemical Exploration, 89, p.129–132.
Gessner, K., (2009). Coupled models of brittle-plastic deformation and fluid flow: Approaches, methods, and application to mesoproterozoic mineralisation at mount Isa, Australia: Surveys in Geophysics, 30, p.211–232.
Geological Survey of Queensland, (2011). Northwest Queensland Minerals and Energy Province Report. Queensland Department of Employment, Economic Development and Innovation, Brisbane, 102p.
Giles, D., Ailléres, L., Jeffries, D., Betts, P., and Lister, G., (2006). Crustal architecture of basin inversion during the Proterozoic Isan Orogeny, Eastern Mount Isa Inlier, Australia: Precambrian Research, 148(1–2), p.67–84.
Giles, D., and Nutman, A., (2002). SHRIMP U-Pb monazite dating of 1600-1580 Ma amphibolite facies metamorphism in the southeastern Mt Isa Block, Australia: Australian Journal of Earth Sciences, 49, p.455–465.
Grainger, C.J., Groves, D.I., Tallarico, F.H.B., and Fletcher, I.R., (2008). Metallogenesis of the Carajás mineral province, southern Amazon craton, Brazil: Varying styles of Archean through Paleoproterozoic to Neoproterozoic base-and precious-metal mineralisation: Ore Geology Reviews, 33, p.451–489.
Groves, D. I., Bierlein, F. P., Meinert, L. D., and Hitzman, M. W., (2010). Iron oxide copper-gold (IOCG) deposits through Earth history: Implications for origin, lithospheric setting, and distinction from other epigenetic iron oxide deposits: Economic Geology, 105, p.641–654.
Haynes, D.W., (2000). Iron Oxide Copper (-Gold) Deposits: Their Position in the Ore Deposit Spectrum and Modes of Origin: in Porter, T.M. (ed.), Hydrothermal Iron Oxide Copper-Gold and Related Deposits: A Global Perspective: PGC Publishing, 1, Adelaide, p.71–90.
Haynes, D. W., Cross, K. C., Bills, R. T., and Reed, M. H., (1995). Olympic Dam ore genesis: a fluid-mixing model: Economic Geology, 90(2), p.281–307.
Hill, E. J., Oliver, N. H. S., Cleverley, J. S., Nugus, M. J., Carswell, J., and Clark, F., (2014). Characterisation and 3D modeling of a nuggety, vein-hosted gold ore body, Sunrise Dam, Western Australia: Journal of Structural Geology, 67, p.222–234.

Chapter 3: Structural Controls
155
Hitzman, M. W. 2000. Iron oxide-Cu-Au deposits: What, where, when and why: in Porter, T. M. (ed.) Hydrothermal Iron Oxide Copper-Gold and Related Deposits: A Global Perspective: PGC Publishing, 1, Adelaide, SA, Australia, p.9–25.
Hitzman, M. W., Oreskes, N., and Einaudi, M. T., (1992). Geological characteristics and tectonic setting of Proterozoic iron oxide (Cu-U-Au-REE) deposits: Precambrian Research, 58(1-4), p.241–287.
Holcombe, R. (2013). GeoCalculator 4.9.7 software: Holcombe Coughlin Oliver, P.O. Box 1618, Mudgeeraba, Queensland 4213, Australia, 9 Jan 2013.
Hunt, J., Baker, T., and Thorkelson, D., (2007). A review of iron oxide copper-gold deposits, with focus on the Wernecke Breccias, Yukon, Canada, as an example of a non-magmatic end member and implications for IOCG genesis and classification: Exploration and Mining Geology, 16(3–4), p.209–232.
Jackson, M.J., Scott, D.L., and Rawlings, D.J., (2000). Stratigraphic framework for the Leichhardt and Calvert superbasins: Review and correlations of the pre-1700 Ma successions between Mt Isa and McArthur River: Australian Journal of Earth Sciences, 47, p.381–403.
Kamb, W.B., (1959). Ice petrofabric observations from Blue Glacier, Washington, in relation to theory and experiment: Journal of Geophysical Research, 64, p.1891–1909.
Kendrick, M. A., Mark, G., and Phillips, D., (2007). Mid-crustal fluid mixing in a Proterozoic Fe oxide-Cu-Au deposit, Ernest Henry, Australia: Evidence from Ar, Kr, Xe, Cl, Br, and I. Earth and Planetary Science Letters, 256(3–4), p.328–343.
Kirchenbaur, M., Maas, R., Ehrig, K., Kamenetsky, V.S., Strub, E., Ballhaus, C. and Münker, C., (2016). Uranium and Sm isotope studies of the supergiant Olympic Dam Cu-Au-U-Ag deposit, South Australia. Geochimica et Cosmochimica Acta, 180, p.15–32.
Loosveld, R., and Schreurs, G., (1987). Discovery of thrust klippen, northwest of Mary Kathleen, Mt Isa Inlier, Australia: Australian Journal of Earth Sciences, 34, p.387–402.
Macmillan, E., Cook, N.J., Ehrig, K., Ciobanu, C.L. and Pring, A. (2016). Uraninite from the Olympic Dam IOCG-U-Ag deposit: linking textural and compositional variation to temporal evolution: American Mineralogist, 101, p.1295–1320.

Chapter 3: Structural Controls
156
Mark, G., Oliver, N. H. S., and Carew, M. J., (2006a). Insights into the genesis and diversity of epigenetic Cu - Au mineralisation in the Cloncurry district, Mt Isa Inlier, northwest Queensland: Australian Journal of Earth Sciences, 53(1), p.109–124.
Mark, G., Oliver, N. H. S., and Williams, P. J., (2006b). Mineralogical and chemical evolution of the Ernest Henry Fe oxide-Cu-Au ore system, Cloncurry district, northwest Queensland, Australia: Mineralium Deposita, 40(8), p.769–801.
Mark, G., Oliver, N.H.S., Williams, P.J., Valenta, R.K. and Crookes, R.A., (2000). The evolution of the Ernest Henry Fe-Oxide-(Cu-Au) hydrothermal system: in: Porter, T. M. (ed.) Hydrothermal Iron Oxide Copper-Gold and Related Deposits: A Global Perspective: PGC Publishing, 1, Adelaide, SA, Australia, p.123–136.
Mark, G.M., Stein, H. and Salt, C., (2004). Re-Os isotopic evidence for two periods of sulfide mineralisation in the vicinity of the Ernest henry Cu-Au deposit, northwest queensland, australia. in: AGC Geological Society of Australia: Proceedings, 17th. p.96.
Marschik, R., and Fontboté, L., (2001). The Candelaria-Punta del Cobre iron oxide Cu-Au (-Zn-Ag) deposits, Chile. Economic Geology, 96, p.1799–1826.
Marshall, L.J. and Oliver, N.H.S., (2008). Constraints on hydrothermal fluid pathways within Mary Kathleen Group stratigraphy of the Cloncurry iron-oxide–copper–gold District, Australia: Precambrian Research, 163, p.151–158.
Martinsson, O. and Wanhainen, C., (2004). Character of Cu-Au mineralisation and related hydrothermal alterations along the Nautanen deformation zone, Gällivare area, northern Sweden: in: Allen, R., Martinsson, O. and Weihed, P., (eds.), Svecofennian Ore-Forming Environments Field Trip: Volcanic-associated Zn-Cu-Au-Ag and Magnetite-apatite, Sedimen-hosted Pb-Zn, and Intrusion-associated Cu-Au Deposits in Northern Sweden. Society of Economic Geologists Guidebook Series, 33, p.149–160.
McLellan, J.G., Mustard, R., Blenkinsop, T., Oliver, N. H. S., and McKeagney, C., (2010). Critical ingredients of IOCG mineralisation in the Eastern Fold Belt of the Mount Isa Inlier: Insights from combining spatial analysis with mechanical numerical modeling: in: Porter, T. M. (ed.) Hydrothermal Iron Oxide Copper-Gold and Related Deposits: A Global Perspectiv: PGC Publishing, 3, Adelaide, SAAustralia, p.233–256.
Meinert, L., (1992). Skarns and skarn deposits. Geoscience Canada, 19(4), p.145–162.

Chapter 3: Structural Controls
157
Murphy, F.C., Hutton, L.J., Walshe, J.L., Cleverly, J.S., Kendrick, M.A., McLellan, J., Rubenach, M.J.,Oliver, N.H.S., et al., (2011). Mineral system analysis of the Mt Isa-McArthur River region, Northern Australia: Australian Journal of Earth Sciences, 58, p.849–873.
Neumann, N.L., Southgate, P.N., and Gibson, G.M., (2009). Defining unconformities in Proterozoic sedimentary basins using detrital geochronology and basin analysis-An example from the Mount Isa Inlier, Australia: Precambrian Research, 168, p.149–166.
O’dea, M. G., Betts, P. G., MacCready, T., andAillères, L., (2006). Sequential development of a mid-crustal fold-thrust complex: evidence from the MitakoodiCulminationin the eastern Mt Isa Inlier, Australia. Australian Journal of Earth Sciences, 53, p.69–90.
O’dea, M. G., Lister, G. S., Maccready, T., Betts, P. G., Oliver, N. H. S., Pound, K. S., and Valenta, R. K., (1997). Geodynamic evolution of the Proterozoic Mount Isa terrain: Geological Society of London Special Publications, 121(1), p.99–122.
Oliver, N., Butera, K., Rubenach, M., Marshall, L., Cleverley, J., Mark, G., Tullemans, F., and Esser, D., (2008). The protracted hydrothermal evolution of the Mount Isa Eastern Succession: A review and tectonic implications: Precambrian Research, 163(1–2), p.108–130.
Oliver, N.H.S., Cleverley, J.S., Mark, G., Pollard, P.J., Bin, F., Marshall, L.J., Rubenach, M.J., Williams, P.J., and Baker, T., (2004). Modeling the role of sodic alteration in the genesis of iron oxide-copper-gold deposits, eastern Mount Isa block, Australia: Economic Geology, 99, p.1145–1176.
Oliver, N.H.S., Rubenach, M.J., Fu, B., Baker, T., Blenkinsop, T.G., Cleverley, J.S., Marshall, L.J., and Ridd, P.J., (2006). Granite-related overpressure and volatile release in the mid crust: fluidized breccias from the Cloncurry District, Australia: Geofluids, 6, p.346–358.
Oreskes, N., and Einaudi, M., (1990). Origin of rare earth element-enriched hematite breccias at the Olympic Dam Cu-U-Au-Ag deposit, Roxby Downs, South Australia: Economic Geology, 85, p.1–28.
Oreskes, N. and Einaudi, M.T., (1992). Origin of hydrothermal fluids at Olympic Dam; preliminary results from fluid inclusions and stable isotopes: Economic Geology, 87, p.64–90.
Page, R.W., and Sun, S., (1998). Aspects of geochronology and crustal evolution in the Eastern Fold Belt, Mt Isa Inlier: Australian Journal of Earth Sciences, 45, p.343–361.

Chapter 3: Structural Controls
158
Page, R.W. and Williams, I.S., (1988). Age of the Barramundi Orogeny in northern Australia by means of ion microprobe and conventional U-Pb zircon studies: Precambrian Research, 40-41, p.21–36.
Pinheiro, R.V.L. and Holdsworth, R.E., (1997). Reactivation of Archaean strike-slip fault systems, Amazon region, Brazi:. Journal of the Geological Society, 154, p.99–103.
Pollard, P.J., (2000). Evidence of a Magmatic Fluid and Metal Source for Fe-Oxide Cu-Au Mineralisation: in Porter, T.M. (ed.), Hydrothermal Iron Oxide Copper-Gold and Related Deposits: A Global Perspective: PGC Publishing, 1, Adelaide, p.27–41.
Requia, K., Stein, H., Fontbote, L., and Chiaradia, M., (2003). Re-Os and Pb-Pb geochronology of the Archean Salobo iron oxide copper-gold deposit, Carajás mineral province, northern Brazil. Mineralium Deposita, 38(6), p.727–738.
Reimann, C., Filzmoser, P. and Garrett, R.G., (2005) Background and threshold: critical comparison of methods of determination: Science of the Total Environment, 346, p.1–16.
Riedel, W., (1929). Zurmechanikgeologischerbrucherscheinungen: Centralblatt fur Minerologie, Geologie, und Paleontologie 1929B, 354p.
Roberts, D., and Hudson, G., (1983). The Olympic Dam copper-uranium-gold deposit, Roxby Downs, SA: Economic Geology, 78(5), p.799–822.
Ronzê, P.C., Soares, A.D.V., Santos, M.G.S and Barreira, C.F. (2000). Alemão copper-gold (U-REE) deposit, Carajás, Brazil: in Porter, T. M. (ed.) Hydrothermal Iron Oxide Copper-Gold and Related Deposits: A Global Perspective, 1, PGC Publishing, Adelaide, Australia, p.191–202.
Rubenach, M., and Barker, A., (1998). Metamorphic and metasomatic evolution of the Snake Creek Anticline, Eastern Succession, Mt Isa Inlier: Australian Journal of Earth Sciences, 45, p.37–41.
Rubenach, M., Foster, D., Evins, P., Blake, K., and Fanning, C., (2008). Age constraints on the tectonothermal evolution of the Selwyn Zone, Eastern Fold Belt, Mount Isa Inlier: Precambrian Research, 163, p.81–107.
Rubenach, M., and Lewthwaite, K., (2002). Metasomaticalbitites and related biotite-rich schists from a low-pressure polymetamorphic terrane, Snake Creek Anticline, Mount Isa Inlier, north-eastern Australia: microstructures and P-T-d paths: Journal of Metamorphic Geology, 20, p.191–202.
Chapter 3: Structural Controls
159
Rusk, B.G., Oliver, N.H.S., Cleverley, J.S., Blenkinsop, T.G., Zhang, D., Williams, P.J. and Habermann, P., (2010). Physical and Chemical Characteristics of the Ernest Henry Iron Oxide Copper Gold Deposit, Australia; Implications for IOCG Genesis: in Porter, T.M., (ed.), Hydrothermal Iron Oxide Copper-Gold and Related Deposits: A Global Perspective: PGC Publishing, 3, Adelaide, SA, Australia p.201–218.
Scott, D.L., Bradshaw, B.E., and Tarlowski, C.Z., (1998). The tectonostratigraphic history of the Proterozoic Northern Lawn Hill Platform, Australia: An integrated intracontinental basin analysis: Tectonophysics, 300, p.329–358.
Souza, L. H. and Vieira, E. A. P., (2000). Salobo Alpha 3 deposit: Geology and mineralisation: in: Porter, T. M. (ed.) Hydrothermal Iron Oxide Copper-Gold and Related Deposits: A Global Perspective: PGC Publishing, 1, Adelaide, Australia, p.213–224.
Stewart, M., de Lacey, J., Hodkiewicz, P.F. and Lane, R., (2014). Grade Estimation from Radial Basis Functions – How Does it Compare with Conventional Geostatistical Estimation?: in Ninth International Mining Geology Conference. Adelaide, Australia, p.129–139.
Tukey, J.W., (1977). Exploratory Data Analysis: Addison-Wesley, Reading, MA, United States, 688p.
Twyerould, S.C., (1997). The geology and genesis of the Ernest Henry Fe-Cu-Au deposit, northwest Queensland, Australia: PhD thesis, University of Oregon, Eugene, OR, United States, 494p.
Vine, J. D., and Tourtelot, E.B., (1970). Geochemistry of black shale deposits; a summary report: Economic Geology 65, p.253–272.
Wang, S., and Williams, P. J., (2001). Geochemistry and origin of Proterozoic skarns at the Mount Elliott Cu-Au(-Co-Ni) deposit, Cloncurry district, NW Queensland,
Williams, M.R., Holwell, D. A., Lilly, R.M., Case, G.N.D., and McDonald, I., (2015). Mineralogical and fluid characteristics of the fluorite-rich Monakoff and E1 Cu–Au deposits, Cloncurry region, Queensland, Australia: Implications for regional F–Ba-rich IOCG mineralisation: Ore Geology Reviews, 64, p.103–127.
Williams, P.J., Barton, M., Johnson, D. A., Fontboté, L., Haller, A. de, Mark, G., Oliver, N. H. S., and Marschik, R., (2005). Iron oxide copper-gold deposits: geology, space-time distribution, and possible modes of origin. Economic Geology: 100th Anniversary Volume, p.371–405.

Chapter 3: Structural Controls
160
Wyborn, L. and Page, R., (1983). The Proterozoic Kalkadoon and Ewen Batholiths, Mount Isa Inlier, Queensland: source, chemistry, age and metamorphism: BMR Journal of Australian Geology and Geophysics, 8, p.53–69.
Wyborn, L., Page, R. and McCulloch, M., (1988). Petrology, geochronology and isotope geochemistry of the post-1820 Ma granites of the Mount Isa Inlier: mechanisms for the generation of Proterozoic anorogenic granites: Precambrian Research, 40-41, p.509–541.

161
Chapter 4 The evolution and sources of mineralising fluids at the E1
Group IOCG deposits, Cloncurry District, Queensland, Australia
George Case1, Zhaoshan Chang1, Jan Marten Huizenga1, 2, Richard Lilly3, 4, Richard
Armstrong5 and Peter McGoldrick6
1EGRU (Economic Geology Research Centre), College of Science and Engineering,
James Cook University, Townsville, Queensland 4811, Australia
2Department of Geology, University of Johannesburg, Auckland Park, Johannesburg
2006, South Africa
3Department of Earth Sciences, University of Adelaide, Adelaide, South Australia 5005,
Australia
4Mount Isa Mines, Mount Isa, Queensland 4825, Australia
5Research School of Earth Science, Australian National University, Canberra,
Australian Capital Territory 0200, Australia
6ARC Centre of Excellence in Ore Deposits, University of Tasmania, Hobart, Tasmania
7005, Australia

Chapter 4: Fluid Evolution
162
Abstract Proposed fluids and metal origins and ore precipitation mechanisms of iron oxide-Cu-
Au (IOCG) deposits vary from both magmatic and non-magmatic hydrothermal sources,
and at present the genetic model of this deposit class remains ambiguous. Combined,
detailed, fluid inclusion and isotope studies of oxygen and sulfur in individual deposits
can provide great insight into IOCG fluid evolution and possible sources. This study
presents quartz and barite fluid inclusion data, coupled with isotopic studies of oxygen
in quartz and magnetite, and sulfur in barite, chalcopyrite and pyrite from the E1 Group
of IOCG deposits in the Cloncurry District, Australia.
Fluid inclusion analyses were conducted on pre-ore quartz (Stage 2a), associated with
magnetite, on syn-ore barite (Stage 3), associated with chalcopyrite and fluorite, and on
post-ore calcite (late Stage 3). Stage 2a quartz hosts two fluid inclusion assemblages
(FIA): 1A and 1B. Assemblage 1A is characterised by primary, aqueous liquid-solid-
vapour fluid inclusions. Many of the 1A inclusions are almost entirely occupied by
halite and were heterogeneously trapped. Assemblage 1B is composed of secondary,
liquid-vapour, inclusions too small to study.
Stage 3 barite hosts three FIAs: 2A, 2B and 2C. Assemblage 2A comprises primary,
aqueous liquid-vapour, moderate to low salinity (< 15 wt% NaCleq), inclusions that
homogenise between 160° and 190°C. Assemblage 2B is comprises a first generation of
secondary, moderately saline (< 9 wt% NaCl; < 18 wt% CaCl2), liquid-vapour
inclusions. Assemblage 2C is a later secondary generation of liquid-vapour inclusions
that were also too small to analyse. Late Stage 3 calcite, which precipitated sequentially
after barite, hosts Assemblage 2D. This assemblage is made up of primary, moderately
saline (< 7 wt% NaCl; < 16 wt% CaCl2), liquid-vapour inclusions.
Stable isotopes of Stage 2a quartz-magnetite, Stages 2–3 pyrite and Stage 3 barite-
chalcopyrite were measured via in-situ SHRIMP and ex-situ conventional mass
spectrometry methods. The 18OVSMOW values of quartz at E1 North and E1 South fall in
a narrow range from +12.7 to +14.8‰, while magnetite values are characterised by a
much broader range of 0 to +8‰; such a range may be the result of partial isotopic
reequilibrium. 34SCDT values from E1 North, the largest orebody by total contained
Cu-Au, range from –5‰ to +3‰ for chalcopyrite, +1 to +8‰ for pyrite, and +7 to
+21‰ for barite. E1 South and East are characterise 34S values nearly 10‰ higher
Chapter 4: Fluid Evolution
163
than E1 North for all three minerals. Despite such variation, calculated barite-
chalcopyrite equilibrium temperatures range from 230 to 330°C in all three deposits,
though equilibrium was only approached in fine-grained alteration samples that
probably formed over timescales greater than 10 Kyr 34S of the bulk fluid (34 S ) at E1 North is +4 to +5‰, whereas at E1 South it is much higher at +16‰. The
34 S value of 34S values of Corella marble
carbonate-associated-sulfate 34S values of the minerals and bulk fluid
constrain 2Of and pH conditions to a narrow range near the barite stability boundary. 34S from E1 North to E1 South is most likely explained by the
addition of sulfur from a second source.
The pre-ore fluid composition and oxygen isotope signature are most consistent with a
magmatic- 34S signature of the ore-stage fluid at E1 North
is consistent with that of magmatic-hydrothermal deposits. The magma was probably an
evolved, alkaline, oxidized, and Cu-Au-F-U-REE-bearing granite, and is speculated to
be related to the Williams-Naraku Batholith 34S value of E1 South is
interpreted to represent mixing of the magmatic fluid with a shallower fluid that
equilibrated isotopically with Corella Formation sulfate. The steeply-plunging folds and
shear zones hosting the E1 Group orebodies may have served as conduits for such an
external fluid to interact with the Corella.
Precipitation of chalcopyrite was probably caused by salinity decrease brought upon by
mixing of the magmatic fluid with fluids in equilibrium with Corella Formation marble.
CO2 is not present in any FIA in E1 Group samples analysed in this study, suggesting
that much of the 2-3CO may have been derived locally from the calcareous host rocks.
The paucity of CO2 may explain the absence of ore brecciation in contrast to the
adjacent Ernest Henry IOCG breccia system.
Introduction The fluid and metal sources of iron oxide-Cu-Au (IOCG) deposits (e.g. Hitzman et al.,
1992) have been investigated mainly through a combination of fluid inclusions, stable
isotopes of oxygen, hydrogen and sulfur, and noble gas and halogen abundances.
Proposed fluid and metal sources for IOCGs are exclusively magmatic (e.g. Pollard,
2000), exclusively non-magmatic (i.e. metamorphic or evaporitic; Barton and Johnson,
Chapter 4: Fluid Evolution
164
1996; Barton and Johnson, 2004; Kendrick et al., 2006), and finally a hybrid mixing of
both styles (Barton and Johnson, 2004; Kendrick et al., 2007; Hunt et al., 2007).These
proposed fluid and metal sources appear to vary substantially between individual IOCG
deposits, even within the same district (e.g. Fisher and Kendrick, 2008; Oliver et al.,
2008). Thus, a detailed fluid characterisation of individual deposits is necessary to
develop models of IOCG genesis. This chapter aims to characterise the fluid evolution
of the E1 Group in order to improve the understanding of the IOCG genetic model.
Here, fundamental fluid inclusion and oxygen and sulfur stable isotope evidence are
presented, and possible fluid and metal source(s) of the E1 Group are discussed.
In the Cloncurry District, much of the previous work on IOCG fluids has been focused
on quartz-hosted fluid inclusion and oxygen and sulfur stable isotope studies of these
systems. Though these data alone may be equivocal, when combined they can provide
significant insight into the origin and evolution of mineralising fluids. They may also be
supplemented by studies on the abundances and ratios of noble gases and halogens,
which have provided further constraint on the origins of fluids responsible for regional
Na-Ca alteration and mineralisation at Mount Isa and Ernest Henry (Kendrick et al.,
2006; 2007; 2008; 2011).
Fluid inclusion microthermometry and chemical analyses require a detailed
petrographic and paragenetic understanding in order to draw meaningful geological
conclusions. Consequently, an objective of this study is to delineate the fundamental
petrographic relationships of fluid inclusions in paragenetically-constrained pre-ore and
syn-ore samples, followed by fundamental microthermometric characterisation of the
fluid inclusions.
Sulfur isotope studies of hydrothermal ore deposits necessitate both sulfide and sulfate
mineral data in order to unequivocally interpret the origin of the source sulfur
reservoir(s) (e.g. Ohmoto, 1972; Ohmoto and Lasaga, 1982). Without cogenetic sulfate
data, the possible range of 34 S values that can be constrained by the measured 34Ssulfide values is broad because of possible variations in temperature, pH and 2Of .
Previous sulfur isotopic studies on IOCGs in the Cloncurry District have focused
mainly on sulfides, and are therefore limited in the constraints they place on the isotopic
values and origin of total sulfur, 34 S . This chapter presents cogenetic sulfide-sulfate
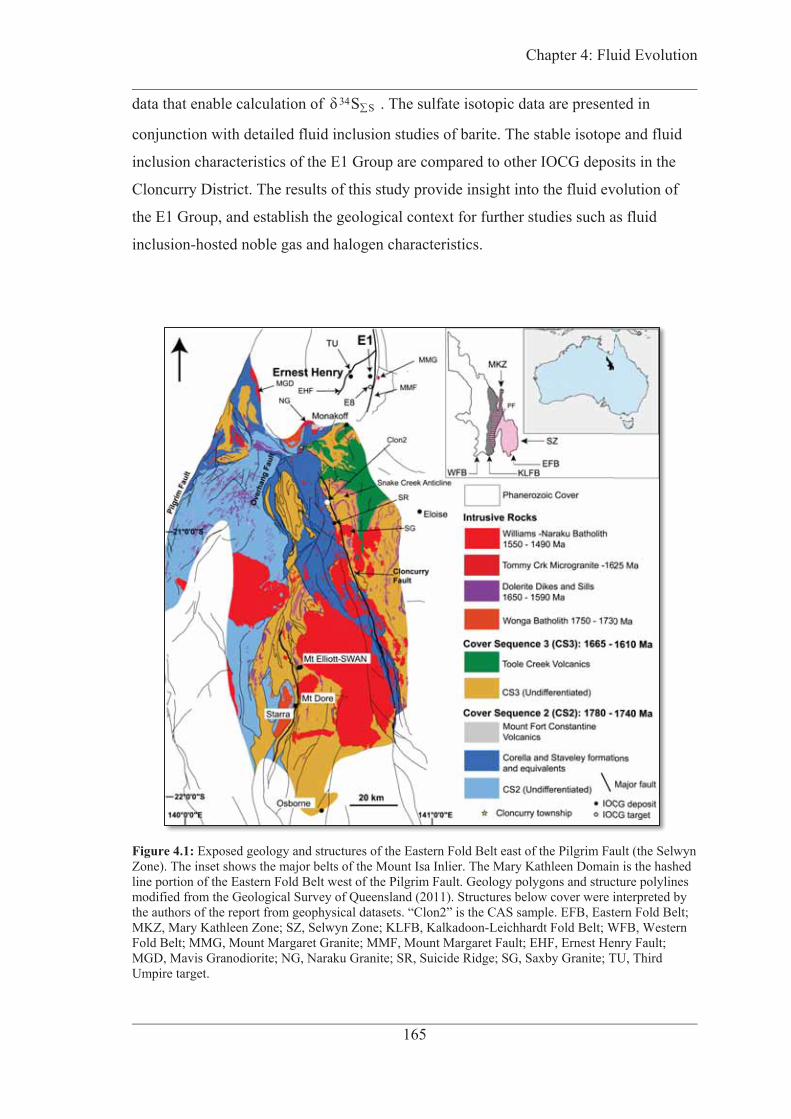
Chapter 4: Fluid Evolution
165
data that enable calculation of 34 S . The sulfate isotopic data are presented in
conjunction with detailed fluid inclusion studies of barite. The stable isotope and fluid
inclusion characteristics of the E1 Group are compared to other IOCG deposits in the
Cloncurry District. The results of this study provide insight into the fluid evolution of
the E1 Group, and establish the geological context for further studies such as fluid
inclusion-hosted noble gas and halogen characteristics.
Figure 4.1: Exposed geology and structures of the Eastern Fold Belt east of the Pilgrim Fault (the Selwyn Zone). The inset shows the major belts of the Mount Isa Inlier. The Mary Kathleen Domain is the hashed line portion of the Eastern Fold Belt west of the Pilgrim Fault. Geology polygons and structure polylines modified from the Geological Survey of Queensland (2011). Structures below cover were interpreted by the authors of the report from geophysical datasets. “Clon2” is the CAS sample. EFB, Eastern Fold Belt; MKZ, Mary Kathleen Zone; SZ, Selwyn Zone; KLFB, Kalkadoon-Leichhardt Fold Belt; WFB, Western Fold Belt; MMG, Mount Margaret Granite; MMF, Mount Margaret Fault; EHF, Ernest Henry Fault; MGD, Mavis Granodiorite; NG, Naraku Granite; SR, Suicide Ridge; SG, Saxby Granite; TU, Third Umpire target.
Chapter 4: Fluid Evolution
166
Cloncurry District Geology and Fluid Characteristics The E1 Group of IOCG deposits is located 40 km northeast of the town of Cloncurry in
the Selwyn Zone of the Eastern Fold Belt of the Proterozoic Mount Isa Inlier of
northwest Queensland (Fig. 4.1). The Mount Isa Inlier is subdivided into the Western
Fold Belt, Kalkadoon-Leichhardt Belt, and Eastern Fold Belt tectonic domains (Blake,
1987). The Eastern Fold Belt is further subdivided into the Mary Kathleen Zone west of
the Pilgrim Fault, and the Selwyn Zone east of the fault (Fig. 4.1). Ore deposit styles
vary greatly between belts; the Western Fold Belt is dominated by Mount Isa-style Cu
and Pb-Zn deposits, while the Eastern Fold Belt and Kalkadoon-Leichhardt Belt host
varying styles of Cu-Au and Pb-Zn-Ag mineralisation, of which many are grouped into
the IOCG classification (Williams et al., 2005; Groves et al., 2010).
Cover sequence deposition and early intrusions The sedimentary and volcanic country rocks of the Eastern Fold Belt were laid down
between 1875 and 1610 Ma in an intracratonic rift setting (Blake, 1987 and references
therein; O’dea et al., 1997). They overlie ~1900 Ma basement rocks related to the
Barramundi Orogen and are grouped into three major unconformable cover sequences
(Blake and Stewart, 1992).
Cover Sequence 1 includes the 1870–1840 Ma Leichhardt (mafic) Volcanics and the
Kalkadoon and Ewen granites, which are assumed to be their source magmas (Wyborn
and Page, 1983). The Argylla Formation, Marraba (mafic) Volcanics, Mitakoodi
Quartzite, Overhang Jaspilite, Corella/Doherty Formation and Mount Fort Constantine
(intermediate) Volcanics of Cover Sequence 2 were then deposited between 1780 and
1740 Ma. The sedimentary rocks in the sequence were composed mainly of mudstones,
sandstones, carbonate rocks, shales and evaporite rocks. Granites of the ~1740 Ma
Wonga Batholith were intruded mostly in the western portion of the Eastern Fold Belt
(Wyborn et al., 1988). Cover Sequence 3 was then deposited between 1690 and 1650
Ma; it includes turbidites of the Llewellyn Creek Formation, shales and sandstones of
the Mount Norna Quartzite, and basalts and black shales of the Toole Creek Volcanics
(Foster and Austin, 2008; Rubenach et al., 2008). The Staveley Formation has been
considered by some to be part of Cover Sequence 3 (Foster and Austin, 2008), but may
be as old as ~1740–1720 Ma and correlate with the Corella Formation (Betts et al.,
2011; Carson et al., 2011).

Chapter 4: Fluid Evolution
167
Isan Orogeny: deformation and metamorphism Deformational events in post-Barramundian rocks in the Eastern Fold Belt are related
mostly to the 1650–1500 Ma Isan Orogeny (Blake et al., 1990; Rubenach et al., 2008).
The deformation and metamorphic history of this orogeny is complex, but most workers
(e.g. Adshead-Bell, 1998; Rubenach and Lewthwaite, 2002; Giles et al., 2006; O’dea et
al., 2006; Rubenach et al., 2008; Abu Sharib and Bell, 2011) agree that at least four
major contractional events occurred. The D1 event (1630–1600 Ma) formed poorly-
preserved east-west trending, steep, folds (Rubenach et al., 2008). The dominant north-
south-trending, steep, folds and fabric ubiquitous in the Eastern Fold Belt formed in D2
(1600-1580) at amphibolite facies peak metamorphic conditions (Page and Sun, 1998;
Giles and Nutman, 2002; Rubenach et al., 2008). This was followed by the D3 event
(~1550 Ma; Page and Sun, 1998; Rubenach et al., 2008; Duncan et al., 2011), which
generated steep north-northwest-trending folds and crenulation of S2 (Rubenach et al.,
2008). Steep, northeast-trending folds associated with additional crenulation of S2 fabric
are a late D4 event that lasted from around 1530 to 1500 Ma (Davis et al., 2001;
Rubenach et al., 2008).
Late intrusions, sodic-calcic metasomatism and IOCG mineralisation After D2 peak metamorphism in the Isan Orogeny, voluminous A-type granitoids of the
Williams-Naraku Batholith (1550–1490 Ma) were intruded across the Eastern Fold Belt
(Fig. 4.1; Page and Sun, 1998). The Mount Margaret Granite, 2 km east of the E1
Group, is the nearest Williams-Naraku Batholith outcrop to the deposit and intruded at
1530 Ma (Fig. 4.1; Page and Sun, 1998). No other outcrops of Williams-Naraku
Batholith granites occur near Ernest Henry or E1; the next closest other granite pluton,
the ~1505 Ma Malakoff Granite (Page and Sun, 1998) crops out 20 km southwest.
During the 1600-1500 Ma period, many regional sodic (albite ± scapolite) and sodic-
calcic (albite ± actinolite ± scapolite ± diopside ± titanite) alteration and brecciation
events also took place throughout the Eastern Fold Belt (Rubenach, 2013 and references
therein). Major examples of extensive alteration include those coincident with the
Osborne and Starra deposits (1600–1580 Ma, Gauthier et al., 2001; Duncan et al.,
2011), Knobby Quarry albitite (1555 ± 9 Ma, Oliver et al., 2004), Suicide Ridge (1530–
1525 Ma, Bertelli and Baker, 2010; Rubenach et al., 2008) and Ernest Henry (1529 +
11/-8 Ma; Mark et al., 2006b). Regionally, sodic-calcic alteration is mostly barren, but
some is associated with some IOCG orebodies and may be genetically related (e.g.
Chapter 4: Fluid Evolution
168
Ernest Henry; Mark et al., 2006b; Rusk et al., 2010; Osborne; Fisher and Kendrick,
2008; Mount Elliott; Wang and Williams, 2001; E1 Group; Chapter 2).
IOCG ores in the Cloncurry District formed between 1600 and 1490 Ma (Duncan et al.,
2011). Temporally, the IOCG deposits can be grouped into those that formed prior to
the 1550–1490 Ma Williams-Naraku Batholith (early or pre-Williams-Naraku
Batholith), and those that formed during intrusion (late or syn-Williams-Naraku
Batholith). The pre-Williams-Naraku Batholith IOCG deposits are Osborne and Starra,
while the syn-Williams-Naraku Batholith deposits are the E1 Group, Ernest Henry,
Monakoff, Mount Elliott-SWAN and Eloise (Chapter 2; Duncan et al., 2011 and
references therein).
Fluid characteristics and genetic Models Fluid inclusions and stable isotopes of ore deposits and barren alterations in the
Cloncurry District, and in other IOCG districts in general, encompass a significant
range of characteristics that are not easily reconciled by derivation from a single fluid
source. Some existing fluid inclusion and stable isotope data and fluid source genetic
models for the district are summarised below.
Fluid inclusions Much of the work on IOCG fluid inclusions has been summarised in Pollard (2000),
Williams and Skirrow (2000), and Hunt et al. (2007). The halogen and noble gas
compositions of fluid inclusions in the Cloncurry District have been studied by
Kendrick et al (2006; 2007; and 2008), as well as by Fisher and Kendrick (2008) and
Baker et al. (2008). The characteristics of fluid inclusions in Cloncurry District IOCGs
are shown in Table 4.6. Most of these fluid inclusions appear to be similar between all
IOCG districts (Pollard, 2000; Hunt et al., 2007). Almost all fluid inclusion studies
focus on quartz, as it appears to preserve more inclusions than other phases (e.g. Baker,
1996). Typical IOCG fluid inclusions hosted in pre-ore and ore-stage quartz are
characterised by high- to hypersalinity (>30 wt% NaCl), with multiple daughter phases
including halite, sylvite, magnetite, sulfides, and various Fe-Mn-salts, in association
with CO2-rich fluid inclusions (e.g. Adshead, 1995; Baker, 1998; Fisher and Kendrick,
2008; Kendrick et al., 2007; Hunt et al., 2007; Baker et al., 2008). At Ernest Henry,
these ultra-saline (up to 70 wt% NaCleq) fluid inclusions are characterised by molar 40Ar/36Ar values ranging from about 29,000 to <2,500, Br/Cl values of -32×10 to

Chapter 4: Fluid Evolution
169
-30.4×10 and I/Cl values of -611×10 to -61×10 (Kendrick et al., 2007); these ranges
are considered by those authors to represent two distinct compositional endmembers.
Osborne ore-stage fluids are variably saline (<12–65 wt% NaCleq), and some are CO2-
rich (Fisher and Kendrick, 2008). In contrast to Ernest Henry, their molar 40Ar/36Ar
values are <2,200, though their Br/Cl ( -30.3–3.8×10 ) and I/Cl ( -62.4–7×10 ) values
are similarly highly variable (Fisher and Kendrick, 2008).
In some cases, ore-stage and late-stage fluids are characterised by low to moderate
salinities (Baker, 1998; Xu, 2000; Fisher and Kendrick, 2008); low-salinity and CO2-
rich fluid inclusions at Ernest Henry have molar 40Ar/36Ar values less than 2,500. In
contrast, Xu (2000) documented late incursion of low to high-salinity H2O-NaCl-CaCl2
fluids in multiple IOCG deposits in the region, and in many cases observed an apparent
salinity increase through time. Regional, barren, sodic-calcic (Na-Ca) and magnetite
(e.g. Lightning Creek) alteration zones are generally characterised by similar, low- to
high-salinity and CO2-rich, early and late fluid inclusion populations (Blake et al., 1997;
Perring et al., 2001); their molar 40Ar/36Ar (2,700 to 25,000), Br/Cl ( -30.3–4×10 ) and
I/Cl ( -60.2–35×10 ) values also vary widely (Kendrick et al., 2008).
Oxygen and sulfur isotopes Numerous studies have been published on oxygen and sulfur isotopes in IOCG deposits;
Davidson and Dixon (1992), Mark et al. (2000), Marschik and Fontboté (2001), and
Hunt et al. (2007) provide summaries on much of the data. Table 4.6 summarises sulfur
isotope data for deposits in the Cloncurry District. Oxygen isotopes from quartz,
magnetite, and carbonate have been analysed in Adshead (1995), Twyerould (1997),
Little (1999), Mark et al. (2000), Perring et al. (2001), Baker et al. (2001), Marshall et
al. (2006) and Hunt et al. (2007). Calculated equilibrium temperatures for quartz -
magnetite assemblages in Cloncurry IOCGs, which typically pre-date mineralisation,
are mostly higher than 400°C 18OVSMOW values derived from the same
assemblages generally fall in a narrow range of +7‰ to +10‰ (Hunt et al., 2007).
However, late-stage hematite and carbonate assemblages are characterised by a much 18Ofluid values (–5‰ to +15‰; Mark et al., 2006a; Hunt et al., 2007).
34S values typically cluster near 0‰, and range from –2‰ to
+5‰ (Table 4.6). Sulfate minerals (barite or anhydrite), which have not been
significantly studied in the district, are significantly heavier due to the tendency of 34S
Chapter 4: Fluid Evolution
170
to become enriched in more oxidized sulfur species (Seal, 2000); they range from +5‰
to +15‰ (Table 4.6; Davidson and Dixon, 1992; Oreskes and Einaudi, 1992;
Twyerould, 1997; Andrew et al., 2001; Hunt et al., 2007).
Genetic models Genetic models (i.e. hydrothermal fluid and metal sources and traps) for IOCG deposits
remain the subject of debate in the Cloncurry District and world-wide. Although
magmatic-hydrothermal fluid ± metal involvement has been proposed in many IOCGs
(e.g. Pollard, 2000; Barton and Johnson, 2000; Sillitoe, 2003; Pollard, 2006; Knipping
et al., 2015), fluid inclusion, stable isotope and halogen and noble gas data are in some
cases equivocal, and most deposits have not been spatially linked to a causative
intrusion. Consequently, non-magmatic and magmatic-non-magmatic hybrid mixing
systems have been invoked to explain the genesis of many IOCG ores (Fig. 4.2; Barton
and Johnson, 2000; Haynes, 2000; Mark et al., 2000; Mathur et al., 2002; Chiaradia et
al., 2006; Hunt et al, 2007; Groves et al, 2010; Marschik and Kendrick, 2015). Some
models suggest a common source for the fluids and metals, but the two may be distinct
in some deposits.
In most magmatic-hydrothermal models, intrusions provide the dominant source of
fluids and metals (Fig. 4.2A), although external fluids may provide sulfur and some
metals (Pollard, 2006). The combination of hypersaline fluid inclusions and low 34Ssulfide and narrow rang 18Owater values described above have been interpreted as
evidence for magmatic fluid and sulfur components (Hunt et al., 2007). Although the 34Ssulfide values alone are equivocal, the higher 40Ar/36Ar and I/Cl values for Ernest
Henry described above add further evidence to a significant magmatic component in
some IOCGs (Kendrick et al., 2007). Regional faults, commonly associated with
IOCGs, may allow vertical and or/lateral movement of fluids kilometers away from
source intrusions, concealing their association with the resulting deposit (Sillitoe, 2003).
An example of the magmatic-hydrothermal fluid-dominated model in the Cloncurry
District is the Lightning Creek magnetite prospect (> 2 Gt Fe; Perring et al., 2001),
which is interpreted as a magmatic-hydrothermal precursor to IOCG ore (Perring et al.,
2001).
Alternatively, non-magmatic fluid sources, such as basinal/connate waters and resultant
halite-dissolution brines (Kendrick et al., 2007), bittern brines (Hammerli et al., 2014;
Chapter 4: Fluid Evolution
171
Marschik and Kendrick, 2015), or metamorphic fluids (i.e. fluids released during
metamorphic dewatering reactions; Barton and Johnson, 2004; Duncan et al., 2011),
may have been dominant in some IOCGs (Fig. 4.2B–C). The hypersaline fluids and
metals could be derived from connate fluids in basin evaporite rocks like the
Corella/Doherty Formations, and possibly also in mafic volcanic rocks such as the
Toole Creek Volcanics. These basinal fluids may be convected through regional faults
or shear zones by magmatic heat (Barton and Johnson, 1996, 2000, 2004), or expelled
during metamorphism (Williams, 1994). In both cases, the fluids leach metals from the
country rocks, though the magmas may also contribute metals (Barton and Johnson,
2004). As an example, the low 40Ar/36Ar and I/Cl values described above at the pre-
Williams-Naraku Batholith Osborne deposit are considered evidence for substantial
involvement of metamorphic brines, derived from metamorphosed evaporite-containing
sedimentary rocks, in this deposit (Fisher and Kendrick, 2008). A similar source is
interpreted for the Starra deposit, based on geochronological evidence placing it prior to
the Wiliams-Naraku Batholith (Duncan et al., 2011); Cu and Au were probably derived
from alteration of mafic country rocks by these fluids (Oliver et al., 2008).
Many authors (Mark et al., 2000; Barton and Johnson 2000, 2004; Williams et al., 2005;
Hunt et al., 2007; Groves et al., 2010) argue that most IOCGs form from a combination
of the aforementioned fluid types (Fig. 4.2A). Interaction between magmatic-
hydrothermal and shallower fluids could be facilitated by the first- and second-order
structures typically associated with IOCG deposits. Hybrid mixing models have been
proposed for major IOCGs such as the Olympic Dam deposit in South Australia,
(Haynes et al., 1995; Reynolds, 2000), and for deposits in the Cloncurry District that
formed coevally with regional magmas, such as Ernest Henry (Twyerould, 1997; Mark
et al., 2006b; Kendrick et al., 2007), Mount Elliott (Wang and Williams, 2001),
Monakoff (Williams et al., 2015) and Eloise (Baker et al., 2001). At Ernest Henry, a
broad range of oxygen and sulfur isotopes (Twyerould, 1997; Mark et al., 2006a) and
mixed 40Ar/36Ar and halogen ratios (Kendrick et al., 2007) indicate that magmatic and
metamorphic or halite-dissolution fluids where involved in ore formation.
Mixing of the fluids described above is the preferred driver of ore precipitation in most
deposits (e.g. Haynes et al., 1995; Chiaradia et al., 2006; Kendrick et al., 2007;
Williams et al., 2015). Meteoric or near-surface-derived waters may also be involved in
mixing. Such mixing, in addition to wall-rock interactions, can lead to temperature and
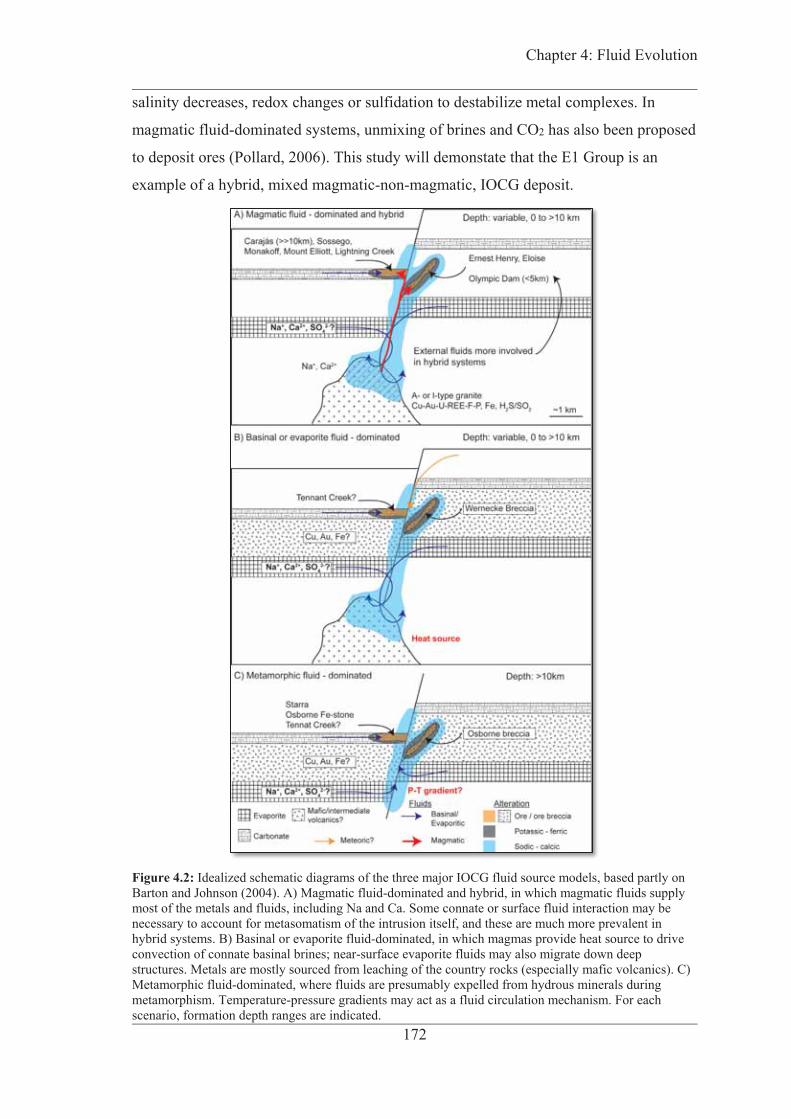
Chapter 4: Fluid Evolution
172
salinity decreases, redox changes or sulfidation to destabilize metal complexes. In
magmatic fluid-dominated systems, unmixing of brines and CO2 has also been proposed
to deposit ores (Pollard, 2006). This study will demonstate that the E1 Group is an
example of a hybrid, mixed magmatic-non-magmatic, IOCG deposit.
Figure 4.2: Idealized schematic diagrams of the three major IOCG fluid source models, based partly on Barton and Johnson (2004). A) Magmatic fluid-dominated and hybrid, in which magmatic fluids supply most of the metals and fluids, including Na and Ca. Some connate or surface fluid interaction may be necessary to account for metasomatism of the intrusion itself, and these are much more prevalent in hybrid systems. B) Basinal or evaporite fluid-dominated, in which magmas provide heat source to drive convection of connate basinal brines; near-surface evaporite fluids may also migrate down deep structures. Metals are mostly sourced from leaching of the country rocks (especially mafic volcanics). C) Metamorphic fluid-dominated, where fluids are presumably expelled from hydrous minerals during metamorphism. Temperature-pressure gradients may act as a fluid circulation mechanism. For each scenario, formation depth ranges are indicated.
Chapter 4: Fluid Evolution
173
E1 Group Geology, Structures and Paragenesis The E1 Group of Cu-Au deposits – E1 North, East, and South – is located in the
northeast Cloncurry District of the Eastern Fold Belt, 8 km east of the Ernest Henry
IOCG deposit (Fig. 4.1). E1 East lies 700 m northeast of E1 North, and E1 South is 1
km southeast. The closest other target is E8, 2 km south of E1 South (Fig. 4.3). The E1
Group is hosted within Corella Formation metasedimentary rocks intercalated with
intermediate Mount Fort Constantine metavolcanic rocks, both of Cover Sequence 2
(Chapter 2). The host rocks do not crop out and are unconformably covered by 30–50 m
of Mesozoic sedimentary rocks. The metasedimentary rocks comprise marble,
psammite, and carbonaceous metasiltstone and pelite (Fig. 4.4A–C). The metavolcanic
rocks are basaltic meta-andesite to meta-andesite with variable porphyritic,
amygdaloidal and massive textures, and metavolcanic breccia and metatuff (Fig. 4.4D–
E). This metavolcano-sedimentary rock package is intruded by diorite (Fig. 4.4F),
which is probably a part of the Ernest Henry Diorite suite (~1650 Ma; Page and Sun
1998). Clasts of the diorite are present in albite-hematite-K-feldspar-biotite-altered,
discordant, breccia (Fig. 4.4G–I), that cuts across the system (Fig. 4.4I). The discordant
breccia is intruded by dolerite dykes of unknown age (Fig. 4.4J). E1 Group ores are
hosted mainly in the metasedimentary rocks (excluding the carbonaceous pelite), but
strongly-sheared metavolcanic rocks are also mineralised in the E1 North Shear zone.
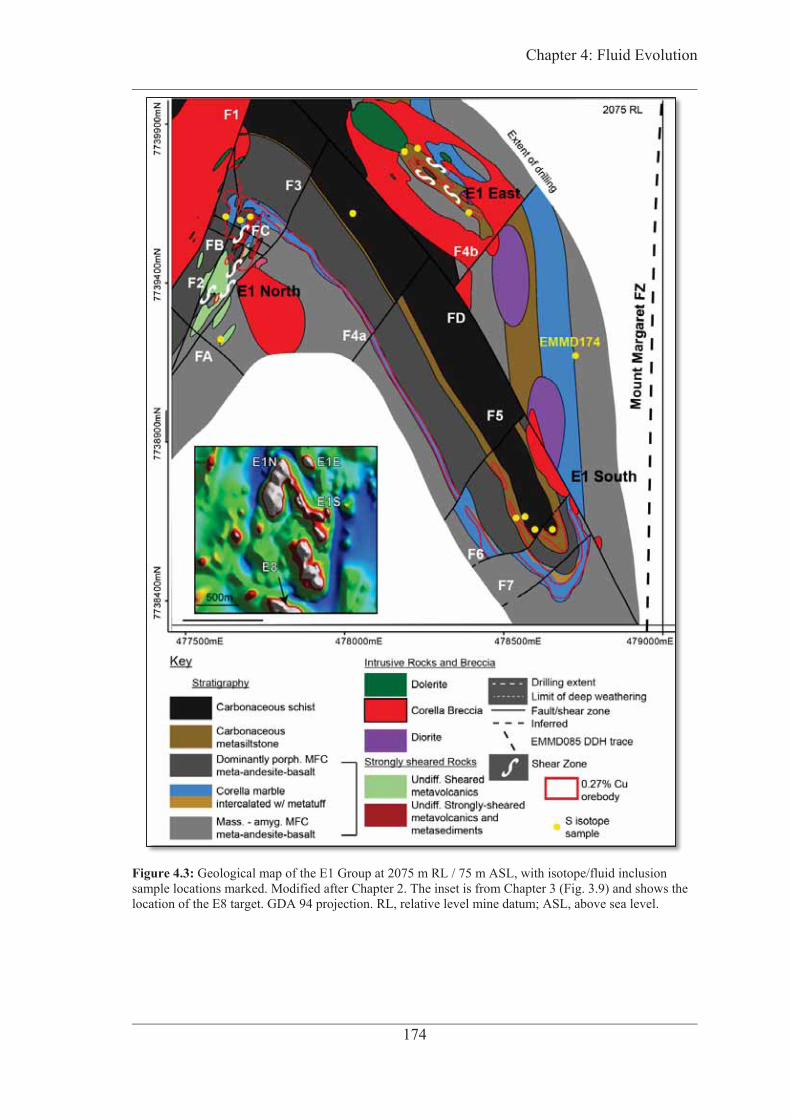
Chapter 4: Fluid Evolution
174
Figure 4.3: Geological map of the E1 Group at 2075 m RL / 75 m ASL, with isotope/fluid inclusion sample locations marked. Modified after Chapter 2. The inset is from Chapter 3 (Fig. 3.9) and shows the location of the E8 target. GDA 94 projection. RL, relative level mine datum; ASL, above sea level.

Chapter 4: Fluid Evolution
175
Figure 4.4: Drill core photographs of E1 Group host rocks. A) Porphyroblastic marble with disseminated magnetite and sulfide alteration. Porphyroblasts are chlorite after actinolite. B) Carbonaceous metasiltstone with pyrite-carbonate-quartz alteration and veining. Note dilational fold microreefs infilled with carbonate and quartz. C) Carbonaceous schist/phyllite with similar pyrite-carbonate-quartz alteration. D) Representative plagioclase-phyric meta-andesite in metavolcanic rocks intercalated with Corella marble. Note slight albite(-hematite) alteration of phenocrysts. E) Metatuff. F) Diorite inferred to be from the Ernest Henry Diorite suite. G) Diorite clast in discordant breccia. H) Discordant breccia from Third Umpire prospect north of Ernest Henry. The matrix is composed mainly of albite, amphibole and pyroxene. (I) Strongly albite(-hematite)-K-feldspar-biotite-chlorite-carbonate-altered discordant contact of metasiltstone (upper right part of core tray) with discordant breccia at E1 East. (J) Dolerite with discordant breccia xenoliths. E1N, E1 North; E1E, E1 East; E1S, E1 South. Act, actinolite; Cal, calcite; Py, pyrite; Qz, quartz; Bt, biotite; Chl, chlorite; Ab, albite; K-spar, K-feldspar; Px, pyroxene; Dol, dolerite.

Chapter 4: Fluid Evolution
176
The structures and deformation history of the E1 Group are described in detail in
Chapter 3. The E1 North, South and East orebodies are hosted in a series of northwest -
plunging regional D2 folds: the E1 North Antiform, the E1 South Synform, and the E1
East Antiform, respectively (Fig. 4.3). These folds are related to smaller-scale F2 folds,
and the dominant S2 folation, observed in drill core (Chapter 3). The folds are cut by
several northeast-southwest-trending and northwest-southeast-trending faults at E1
North (Faults 1–3 and B–D, Fig. 4.3). The faults bound intense shear zones trending
northeast, collectively referred to as the E1 North Shear Zone. The shear zones are
coincident with mineralisation and magnetite-apatite alteration along strike (Chapter 2;
Chapter 3). Early movement on the faults was related to development of the E1 North
Shear Zone in local D3 / regional D4 (Chapter 3). Faults 4–7 offset mineralisation, and
are local D4 / regional D5 structures; Faults 1–3 were reactivated as oblique reverse
faults during this event (Chapter 3). The Mount Margaret Fault Zone lies east of the
deposit (Fig. 4.3); it is a long-lived structure that was probably active during deposition
of the host rocks, and subsequently reactived during local/regional D2, local D3 and later
events (Chapter 3).
Mineralisation and alteration in the E1 Group are characterised by layer-controlled
replacement bodies in the metasedimentary rocks, coupled with volumetrically minor
veins (Chapter 2). Alteration in the E1 Group is complex, and is grouped into three
main paragenetic stages, with the second, pre-ore, stage comprising three substages
(Fig. 4.5). The stages are: 1) early sodic-(-calcic), 2a) precursor ferric/ferrous-potassic-
silicic, 2b) intermediate sodic (-Ti), 2c) early carbonate (-Fe-Mg) flooding and
mineralisation, and 3) main Cu-Au-carbonate(-Fe-Mn)- barite-fluorite-U-REE
mineralisation (Chapter 2).

Chapter 4: Fluid Evolution
177
Figure 4.5: E1 Group paragenetic sequence from Chapter 2, with equivalent Ernest Henry and Monakoff stages as reported by Mark et al. (2006b) and Williams et al. (2015), respectively. Bar thickness corresponds to relative abundance. Dashed line indicates uncertain timing. *Indicates phases identified in Williams et al. (2015).

Chapter 4: Fluid Evolution
178
Fluid Inclusion and Stable Istope Systematics Determiniation of fluid inclusion origin Fluid inclusions in E1 Group samples were grouped into fluid inclusion assemblages
(FIA) based on their origin: primary or secondary. Criteria described in Roedder (1984)
and Van den Kerkhof and Hein (2001) were used to interpret the origin of the fluid
inclusions. Namely, fluid inclusions were interpreted to be primary if they were:
isolated or occurred in non-linear clusters, relatively large with respect to their host
mineral, and not in trails except those parallel to mineral growth zones
(i.e.‘pseusecondary’). Although not necessarily diagnostic, negative crystal shape was
considered as additional evidence for a primary origin (Roedder, 1979). Fluid inclusions
not characterised by these features were assumed to be secondary in origin.
Calculation of system physiochemical parameters The fluid inclusion and stable isotope data presented are used to constrain
physiochemical parameters such as pressure and temperature conditions of ore 34S ( 34 S ) 18Owater, salinity, pH and 2Of . All
18O values (‰) normalized to the Vienna
Standard Mean Ocean Water (VSMOW), and all sulfur isotope ratios are reported as 34S (‰) normalized to Canyon Diablo Troilite (CDT).
Temperature Isotope-pair geothermometry relies on the assumptions that the mineral pairs of interest
formed under equilibrium conditions at the same time, and that neither mineral has been
subjected to later partial or total isotopic reequilibrium (Ohmoto and Rye, 1979; Seal,
2006). Theoretical aspects of isotope geothermometry are presented for oxygen in
Clayton and Epstein (1961), and for sulfur in Sakai (1968), Ohmoto (1972). The
temperature equations used for quartz-magnetite and barite-chalcopyrite temperature
calculations are shown in Table 4.1.
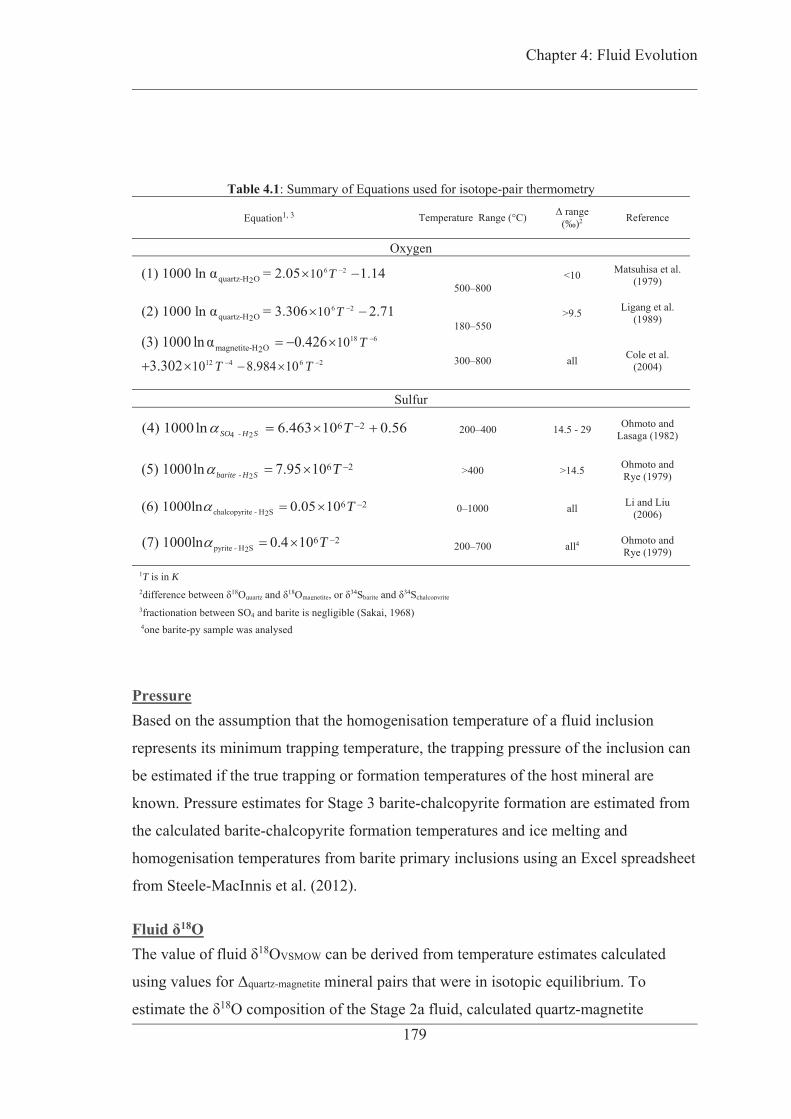
Chapter 4: Fluid Evolution
179
Table 4.1: Summary of Equations used for isotope-pair thermometry
Equation1, 3 Temperature Range (°C) (‰)2 Reference
Oxygen 6 2
quartz-H O2 10(1) 1000 ln T 500–800
<10 Matsuhisa et al. (1979)
6 2quartz-H O2 10(2) 1000 ln T
180–550 >9.5 Ligang et al.
(1989)
18
4 212
6
6
magnetite-H O2 10
10 8.984 10
(3) 1000 ln3.302
T
T T
300–800 all Cole et al.
(2004)
Sulfur
- 4 26 2(4) 1000ln 6.463 10 0.56SO H S T 200–400 14.5 - 29 Ohmoto and
Lasaga (1982)
- 26 2(5) 1000ln 7.95 10barite H S T >400 >14.5 Ohmoto and
Rye (1979)
chalcopyrite - H S26 2(6) 1000ln 0.05 10 T 0–1000 all Li and Liu
(2006)
200–700 all4 Ohmoto and Rye (1979)
1T is in K 2 18Oquartz 18Omagnetite
34Sbarite 34Schalcopyrite 3fractionation between SO4 and barite is negligible (Sakai, 1968) 4one barite-py sample was analysed
Pressure Based on the assumption that the homogenisation temperature of a fluid inclusion
represents its minimum trapping temperature, the trapping pressure of the inclusion can
be estimated if the true trapping or formation temperatures of the host mineral are
known. Pressure estimates for Stage 3 barite-chalcopyrite formation are estimated from
the calculated barite-chalcopyrite formation temperatures and ice melting and
homogenisation temperatures from barite primary inclusions using an Excel spreadsheet
from Steele-MacInnis et al. (2012).
Fluid 18O 18OVSMOW can be derived from temperature estimates calculated
quartz-magnetite mineral pairs that were in isotopic equilibrium. To 18O composition of the Stage 2a fluid, calculated quartz-magnetite
pyrite - H S26 2(7) 1000ln 0.4 10 T

Chapter 4: Fluid Evolution
180
temperatures were substituted into equations (1) and (2) (Table 4.1) to derive the 1000
ln 2quartz-H O of the fluid and 18O composition.
System total sulfur 34S of an aqueous system ( 34 S ) is more complex than oxygen
because of the numerous aqueous sulfur species and minerals typically present in
hydrothermal systems (Sakai, 1968). Sakai (1968), Ohmoto (1972), and Ohmoto and
Lasaga (1982) demonstrated that, when in chemical and isotopic equilibrium,
fractionation between sulfur isotopes in various aqueous sulfur species and precipitated
minerals is dependent on a combination of temperature, pH, 2Of , and the bulk fluid
34S ( 34 S ).
To determine 34 S , the following assumptions must be valid: (1) 34 S must be
constant throughout the precipitation process, with deviations only due to fractionation
between 24SO and H2S, and (2) the mole ratio of 2
4SO /H2S must not change
significantly (Field and Gustafson, 1976; Seal, 2006). In order to satisfy assumption (1),
the sulfur reservoir of the system must be, for practical purposes, unlimited in order to
prevent Rayleigh fractionation. These assumptions appear to be generally valid for
many porphyry systems dominated by oxidized magmatic-hydrothermal fluids, in which
the dominant sulfur species is SO2 (Seal, 2006). In such systems, SO2 undergoes
disproportionation (hydrolysis) into SO4 and H2S according to the reaction:
4 H2O + 4 SO2 H2S + 3 H+ + 3 4HSO
With these assumptions in mind, 34 S can be regressed using two types of plots of 34 - (e.g. Fig. 4.17; Field and Gustafson, 1976) -
diagram (e.g. Fig. 4.18; Gregory and Criss, 1986; Criss et al., 1987; Fifarek and Rye,
2005). Both diagrams also provide estimations of mole fractions of 24SO and H2S in
the fluid phase, and provide constraints in the pH and 2Of conditions of the system.
When coupled with mineral assemblage observations, pH and 2Of can validate 34 S
estimations. The utility and caveats of these methods are described in Field and
Gustafson (1976), Rye (2005) and Seal (2006).

Chapter 4: Fluid Evolution
181
Sampling Individual sample descriptions for fluid inclusion and oxygen and sulfur isotope
samples are detailed in Appendix G (the same samples were used for both studies).
Sulfur isotope sample locations are shown in Figure 4.3.
Fluid inclusion samples For fluid inclusion studies, two drill core samples each were selected of pre-ore, Stage
2a quartz (Fig. 4.5) and syn-ore, Stage 3 barite (Fig. 4.5). Several quartz vein samples
were collected from other areas of E1 North and E1 East, but almost every sample
lacked fluid inclusions large enough to make useful observations. Ongoing deformation
during mineralisation (Chapter 3) probably partially recrystallized much of the Stage 2a
quartz in the system. One sample from Stage 2a (Figs. 4.6A; 4.8A) was collected from
326.83 m in drill hole EMMD022 (sample EMMD022-326.83m), and is characterised
by massive, moderately-crystalline (0.5–1 mm) quartz associated with euhedral, 0.5–2
mm magnetite; visually, it is only weakly mineralised. The drillhole transects the E1
North Shear Zone on the west limb of the E1 North Antiform (Fig. 4.3). At the drill core
scale, the quartz and magnetite are probably infill in a vein which has been partly
obscured by alteration selvedges of magnetite. This sample is outside of the main E1
North orebody, but contains some late irregular veinlets and alterations of carbonate and
chalcopyrite that overprint the magnetite and quartz. Most of the protolith textures near
the sample have been destroyed by extensive deformation and metasomatism, but
sporadic amygdules indicate that much of the drillhole is composed of sheared Mount
Fort Constantine intermediate-mafic meta-andesite-basalt.
Undulose extinction and irregular boundaries in some quartz crystals (Figs. 4.8C; 4.9D)
indicate that some quartz has been subjected to a moderate degree of microstructural
deformation (e.g. White, 1973). The euhedral nature of the magnetite suggests it was
originally intergrown with the quartz. Cathodoluminescence imaging of the quartz (Fig.
4.9E) yields no obvious difference between the quartz interstitial to magnetite, and the
veinlets within it. It is thus likely that the quartz veinlets represent local reprecipitation
of quartz removed via pressure dissolution during deformation. Stage 2 magnetite-
quartz-biotite is syn-local D3 /regional D4 (Chapter 3); it is not clear if the deformation
in the quartz is related to local D3 or a later event. Partial recrystallization and

Chapter 4: Fluid Evolution
182
deformation of the quartz formed secondary inclusions near the crystal boundaries (Fig.
4.9D), but isolated primary fluid inclusions are preserved near the centers of crystals.
Figure 4.6: Fluid inclusion samples. A) Stage 2a quartz and magnetite, with minor Stage 3 chalcopyrite and calcite overprints. Collected from drillhole EMMD022-326.83 m. B) Stage 2a quartz vein with later Stage 2c calcite and Stage 3 chalcopyrite infill. Collected from drillhole EMMD153-150.6m. C) Stage 3 barite-chalcopyrite vein with late calcite substage (white mineral) that has re-opened the vein around the edges. EMM019-310.9m. D) Sample EMMD077-239.4m from E1 North, which is composed of a Stage 3 vein with early barite-chalcopyrite and late sub-stage calcite and fluorite infill.
Another Stage 2a quartz sample (EMMD153-150.6m; Figs. 4.6B; 4.9A) was taken from
the east limb of the E1 North Antiform and within the orebody. It is clearly vein-hosted,
and is characterised by large (up to 1 cm), euhedral quartz with little or no deformation.
The sample lacks magnetite, but examples of vein-hosted Stage 2a magnetite are shown
Chapter 4: Fluid Evolution
183
in Figures 4.7G, I, J, L and Figure 4.8B; these magnetite-bearing quartz veins were not
selected as they lacked sufficiently-large fluid inclusions. The vein in sample
EMMD153-150.6m cuts across a deformed metatuff lens that is altered by magnetite,
sericite, and carbonate. The metatuff lens is intercalated with Corella Formation marble.
The calcite, pyrite and chalcopyrite, related to Stage 2c, precipitated after the quartz. In
thin section the carbonate and sulfides are observed to replace the quartz at crystal
edges. The relationship of the quartz and carbonate in this sample is consistent with the
observation that carbonate and chalcopyrite of Stage 2c or later always overprint or fill
the interstices of existing quartz crystals (Chapter 2); therefore, the carbonate in this
sample is likely to be related to Stage 2c (Fig. 4.5).
A Stage 3 sample (EMMD077-239.4m; Figs. 4.6D; 4.9C) was collected from the west
limb of the E1 North Antiform and within the E1 North orebody, and comprises vein-
hosted, euhedral (~0.5–1 cm), barite associated with carbonate, chalcopyrite, and
fluorite. The vein cuts across strongly sheared and metasomatized rock altered mostly to
magnetite, barite, fluorite, and chalcopyrite. The protolith was either a volcaniclastic or
calcareous sedimentary rock. The order of precipitation is barite calcite ± fluorite.
Chalcopyrite inclusions (< 5 μm) are present within the barite which suggests the two
minerals are cogenetic rather than sequential.
Another Stage 3 sample (EMM019-310.9m; Fig. 4.6C; 4.9F) comes from drillhole
EMM019 and intersects the Corella Formation marble horizon near the hinge of the E1
South Synform. The marble is strongly magnetite-chalcopyrite-pyrite-biotite-altered.
The sample is vein-hosted and is characterised by a complex paragenesis with multiple
stages of vein opening; the early vein was infilled mainly by barite and chalcopyrite,
and was re-opened along the edges and filled in with late, white, calcite (Fig. 4.6C). The
barite sample was collected from the vein at 310.9 m depth (EMM019-310.9m), and an
additional calcite sample was taken from the same vein at 311.1 m (EMM019-311.1m;
Fig. 4.9B).
Stable isotope samples In order to adequately characterise the oxygen and sulfur isotope signatures of differing
styles of E1 Group ores, samples were collected from both fine-crystalline Stage 2a
quartz-magnetite and Stage 3 barite-chalcopyrite alteration, as well as from temporally-
Chapter 4: Fluid Evolution
184
equivalent veins. Figure 4.8 displays representative examples of the microtextures of
quartz-magnetite and barite-chalcopyrite samples analysed via SHRIMP.
Oxygen isotope samples Quartz-magnetite samples are characterised by fine- to medium-crystalline infill of
vesicles in metavolcanic rocks and veins in both metavolcanic rocks and marble (Figs.
4.7G–H; 4.8A–C), and include sample EMMD022-326.83m described in the previous
section. Quartz and magnetite are interpreted to have originally formed at the same
time, based on intergrowth of the two minerals and the presence of magnetite inclusions
in quartz (Figs. 4.6A; 4.8A–C).
Barite-chalcopyrite and pyrite samples Five fine-crystalline chalcopyrite ± barite samples were collected from laminated,
strongly magnetite-barite-fluorite-sulfide altered, carbonate-rich rocks in E1 North and
South (Figs. 4.7A–D; 4.8D–E). The same samples also host laminae-parallel microveins
(Figs. 4.7B; 4.8D; maximum width ~500 μm) containing barite and chalcopyrite. In
addition to the fine-grained samples, three vein-hosted barite-chalcopyrite-pyrite
samples were analysed for isotope pairs, including the previously-described fluid
inclusion samples EMM019-310.9m and EMM019-311.1m. Barite-chalcopyrite
cogenesis in E1 samples is interpreted from intergrowth textures (Figs. 2.11T, Chapter
2; 4.8D–E), as well as from the presence of chalcopyrite inclusions in barite veins.

Chapter 4: Fluid Evolution
185
Figure 4.7: Representative photos of oxygen and sulfur isotope samples. A) Stage 3 carbonate-fluorite-barite-sulfide vein cutting metasedimentary rock completely altered by the same assemblage, and magnetite. The groundmass in the sample was also mapped by MLA (see Figure 2.9A). B) Layered rock (metasedimentary?) completely altered by magnetite-barite-fluorite-chalcopyrite-pyrite. C) Marble partly altered by magnetite, barite, fluorite, chalcopyrite. D) Marble with alternating pyrite-chalcopyrite-rich and -poor layers. Arrows point to analysis points. E) Porphyroblastic metasedimentary rock (marble?). Groundmass rich in biotite and chlorite; porphyroblasts may have been actinolite but now replaced by magnetite, pyrite and chalcopyrite. F) Carbonaceous schist (meta-black shale) with disseminated and blebby pyrite. G) deformed Stage 2a quartz-magnetite vein in meta-andesite. H) Stage 2a quartz (-magnetite)-infilled amydules in meta-andesite. I) Thin section from core shown in Figure 2.11P. Stage 2c magnetite (-quartz) and pyrite with Stage 3 chalcopyrite; infill? in siliceous marble. J) Stage 2c calcite-magnetite-pyrite vein cutting meta-andesite, overprinted by Stage 3? calcite. K) Stage 3 barite (and late substage) calcite vein cutting meta-andesite. L) Stage 2c calcite-magnetite-pyrite vein and breccia in meta-andesite cutting Stage 1 or 2b red alteration.
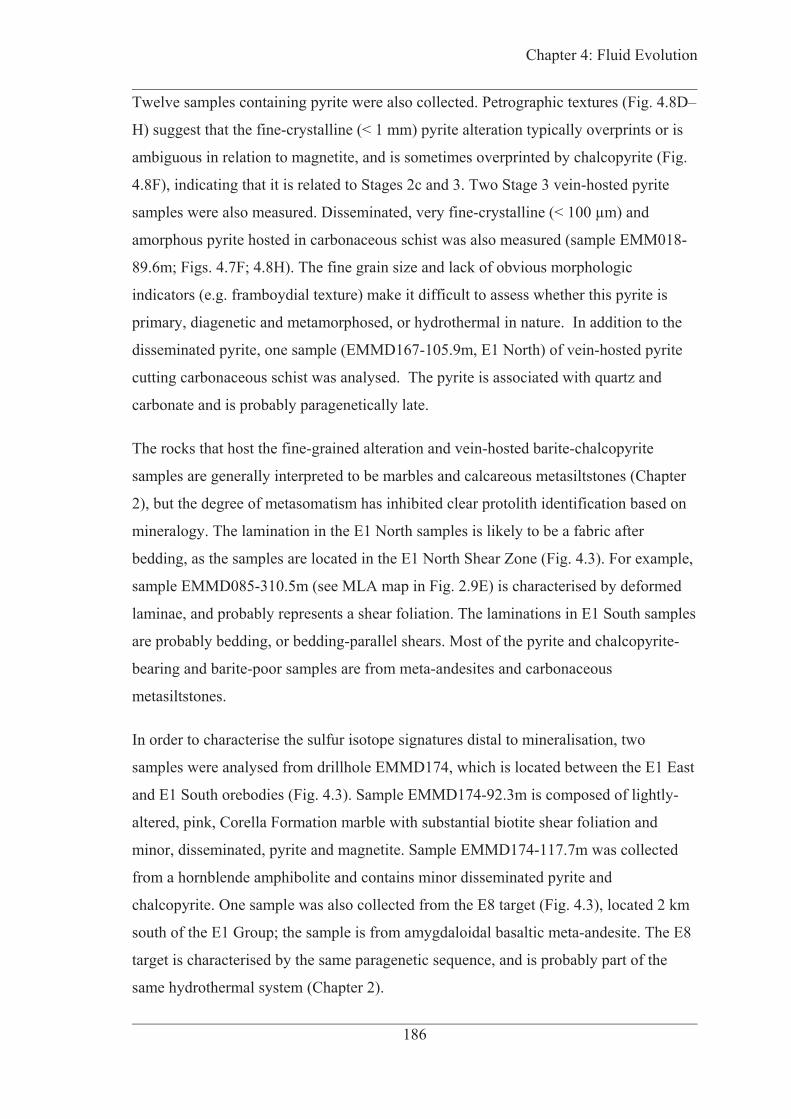
Chapter 4: Fluid Evolution
186
Twelve samples containing pyrite were also collected. Petrographic textures (Fig. 4.8D–
H) suggest that the fine-crystalline (< 1 mm) pyrite alteration typically overprints or is
ambiguous in relation to magnetite, and is sometimes overprinted by chalcopyrite (Fig.
4.8F), indicating that it is related to Stages 2c and 3. Two Stage 3 vein-hosted pyrite
samples were also measured. Disseminated, very fine-crystalline (< 100 μm) and
amorphous pyrite hosted in carbonaceous schist was also measured (sample EMM018-
89.6m; Figs. 4.7F; 4.8H). The fine grain size and lack of obvious morphologic
indicators (e.g. framboydial texture) make it difficult to assess whether this pyrite is
primary, diagenetic and metamorphosed, or hydrothermal in nature. In addition to the
disseminated pyrite, one sample (EMMD167-105.9m, E1 North) of vein-hosted pyrite
cutting carbonaceous schist was analysed. The pyrite is associated with quartz and
carbonate and is probably paragenetically late.
The rocks that host the fine-grained alteration and vein-hosted barite-chalcopyrite
samples are generally interpreted to be marbles and calcareous metasiltstones (Chapter
2), but the degree of metasomatism has inhibited clear protolith identification based on
mineralogy. The lamination in the E1 North samples is likely to be a fabric after
bedding, as the samples are located in the E1 North Shear Zone (Fig. 4.3). For example,
sample EMMD085-310.5m (see MLA map in Fig. 2.9E) is characterised by deformed
laminae, and probably represents a shear foliation. The laminations in E1 South samples
are probably bedding, or bedding-parallel shears. Most of the pyrite and chalcopyrite-
bearing and barite-poor samples are from meta-andesites and carbonaceous
metasiltstones.
In order to characterise the sulfur isotope signatures distal to mineralisation, two
samples were analysed from drillhole EMMD174, which is located between the E1 East
and E1 South orebodies (Fig. 4.3). Sample EMMD174-92.3m is composed of lightly-
altered, pink, Corella Formation marble with substantial biotite shear foliation and
minor, disseminated, pyrite and magnetite. Sample EMMD174-117.7m was collected
from a hornblende amphibolite and contains minor disseminated pyrite and
chalcopyrite. One sample was also collected from the E8 target (Fig. 4.3), located 2 km
south of the E1 Group; the sample is from amygdaloidal basaltic meta-andesite. The E8
target is characterised by the same paragenetic sequence, and is probably part of the
same hydrothermal system (Chapter 2).

Chapter 4: Fluid Evolution
187
Figure 4.8: Representative photomicrographs of fine-grained samples analysed via in-situ SHRIMP. A) Stage 2a coarse-grained (>1mm) quartz-magnetite from the core shown in Fig. 4.6A; reflected light. Points correspond to the values reported in Table 4.3. B) Stage 2a quartz-magnetite vein overprinted by Stage 3 calcite; cross-nicols. C) Small amygdule with deformed Stage 2a quartz-magnetite infill in thin section from Fig. 4.7H; cross-nicols. D) Barite-chalcopyrite -pyrite microveinlet in the sample shown in Fig. 4.7B; reflected light. E) Reflected light view of groundmass from the sample in Fig. 4.7A. F) Reflected light view of the pyrite-chalcopyrite-magnetite-rich layer in the upper-right of the sample in Fig. 4.7D. G) Reflected light view of blebby infill? quartz-pyrite in the carbonaceous schist smaple in Fig. 4.7F. H) Disseminated pyrite and chalcopyrite in the same sample. Red dots are analytical spots. Analytical spot size ~20–30 μm.
Along with sulfur isotope analyses of the mineralised E1 Group samples, two whole-
rock specimens of unmineralised Corella Formation marble were sampled in an attempt
to characterise the isotope signature of carbonate-associated sulfur (CAS; Kaplan et al.,
1963) in the calcareous Corella Formation host rocks of the E1 Group. Carbonate

Chapter 4: Fluid Evolution
188
associated sulfate isotope analysis has been widely applied to ancient carbonates (e.g.,
Ueda et al., 1987; Gellatly and Lyons, 1996) and modern settings (Burdett et al., 1989).
These samples were collected in the Snake Creek Anticline area south of Cloncurry
(‘Clon02’ in Fig. 4.1) and away from any significant known Cu-Au deposits. The
samples are characterised by relict interlaying of siliclastic-calcareous sedimentary
rocks. The siliclastic layers have been boudinaged and albitised, and much of the
original marble carbonate has recrystallized in boudin necks. The samples are composed
of about 30–40% calcite, 30% quartz and/or albite, and 10–20% biotite, and contain
minor scapolite, garnet and magnetite. The albite and magnetite are likely to be
metasomatic. This style of deformation and mineralogy is typical of Corella Formation
marbles throughout the Eastern Fold Belt (e.g. Marshall et al., 2006; Marshall and
Oliver, 2008). No sulfide minerals are observed, i.e. sulfur measured in the analysis is
probably hosted within carbonate and is not associated with metasomatism.
Analytical Methods Fluid inclusions Samples for making fluid inclusion thick sections were cut off from thin section sample
blocks and mounted onto glass slides using beeswax. Next, the offcuts were ground and
doubly-polished to sections between 200–300 μm in thickness. After polishing, the
sample was removed from the glass plate and the beeswax was removed by melting the
sample to 50°C. Most samples contain several different minerals of varying hardness
including quartz, calcite, pyrite, chalcopyrite, barite, fluorite and chlorite, which
hindered the grinding-polishing process and necessitated thicker sections to prevent
sample destruction. For this reason the carbonate in most samples was not translucent
enough for optical petrography and a separate sample from EMM019-310.9m was made
to analyse carbonate related to the ore-stage. The thick sections were then split into
chips < 5 mm in size in order to fit in the heating-freezing stage.
Fluid inclusion studies were conducted on a Linkam heating-freezing stage (MDS600),
which is attached to an Olympus BX52 microscope with 40x and 50x long working
distance objectives. Schematic maps (Fig. 4.9) of the analysed inclusions were made
before analysis. Each inclusion was sketched to record potential expansion or leaking,
or phase changes (e.g., nucleation of solid phases) due to heating and/or freezing
experiments. Low-temperature phase changes were measured prior to homogenisation

Chapter 4: Fluid Evolution
189
to maximize the number of analyses prior to potential decrepitation or expansion of
fluid inclusions during heating. Low-temperature calibration of the heating-freezing
stage was done by using a fluid inclusion standard (supplied by FluidInc) containing
mixed H2O-CO2 inclusions and measuring the melting temperature of CO2 (–56.6°C).
Positive or negative deviations of this melting temperature, caused by instrument drift,
were factored into observed melting temperatures in this study. These deviations are
±0.3°C, but are consistent throughout a given day; calibration is done daily.
Observational error for final ice melting measurements is about ±0.5°C.
Calibration for heating runs is carried out weekly using the critical temperature of
vapour-into-liquid homogenisation ( l-vhT ) of H2O (374°C); precision for these runs is
typically ±4°C. This is comparable to observational error of l-vhT in the samples, which
is about 5°C because the vapour bubble shrinks beyond visual recognition immediately
prior to homogenisation. To observe melting phase changes, the samples were cooled to
below –100°C and subsequently heated to room temperature. Melting temperatures
were measured using a heating rate of 2°C/min. Homogenisation temperatures were
determined with a heating rate of 5°C/min. To ensure the reliability of homogenisation
into the liquid phase, samples were heated until the vapour bubble was no longer
visible, and then immediately cooled by 20°C to test for delayed bubble reappearance.
Composition and density for H2O-NaCl and H2O-NaCl-CaCl2 fluid inclusions were
calculated from numerical models by Steele-MacInnis et al. (2011, 2012) using their
Excel spreadsheets. Microthermometry data are presented in Appendix F and
histograms are displayed in Figure 4.11.
Stable isotopes 18O were measured from quartz- 34S from barite-chalcopyrite
and pyrite (Figs. 4.6–4.8). The abundance of fine-crystalline alteration, with most barite,
chalcopyrite, quartz and magnetite crystals smaller than 100 μm, and the relative
paucity of veins in the deposit, necessitated in-situ analysis of most samples using
Sensitive High Resolution Ion Microprobe (SHRIMP) instruments at the Australian 18O analysis are detailed in Ickert et
34S in Eldridge et al. (1987). The measured v 18 34S
of the internal laboratory standards, and their error, for each run are available in
Appendix G. The following standards were used: UWQ-1 quartz ( 18OVSMOW =

Chapter 4: Fluid Evolution
190
+12.3‰; Kelly et al., 2007); 5830 magnetite ( 18OVSMOW = +4.5‰; Huberty et al.,
2010); Norilsk chalcopyrite (+8.0‰; Crowe and Vaughan, 1996); Ba2 (+57.0‰) and
Ba4 (+3.5‰) barites of Eldridge et al. (1987); and Ruttan pyrite (+1.2‰; Crowe and
Vaughan, 1996). 18O values are about 0.6‰ for quartz and
1.2‰ (App. G) 34S values are generally ±0.3 to 0.5‰ for all
sulfur minerals (App. G). In order to assess potential variation within the fine-grained
samples, as well as zonation within larger vein-hosted minerals, numerous spots were
analysed in each sample. The total numbers of analysed spots are 64 for chalcopyrite, 42
for pyrite, 40 for barite, and 9 for both quartz and magnetite.
In addition to SHRIMP, three sample each of vein-hosted quartz, magnetite,
chalcopyrite, pyrite and barite were analysed using conventional ex-situ mass
spectrometry (MS). The quartz and magnetite vein and vesicle infill samples were
prepared using the BrF5 technique (Clayton and Mayeda, 1963) and analysed ex-situ on
a Finnigan MAT 252 IRMS at the US Geological Survey. The sulfur samples were
analysed ex-situ via conventional Isotope Ratio Mass Spectrometry (IRMS) at the
Stable Isotope Geochemistry Laboratory at the University of Queensland. The vein
samples were crushed and sonic-washed, and grains of barite, chalcopyrite and pyrite
were hand-picked for bulk analysis. Standards used by UQ are NBS127 (BaSO4; 34SCDT = +20.3‰), IAEA S- 34SCDT = –0.3‰), and IAEA S- 34SCDT = +32.3‰).
Analytical errors for ex-situ analyses of quartz, magnetite and sulfur minerals are in the
same range as the SHRIMP errors described above (App. G). This method was used to
analyse sulfur isotope pairs for barite and chalcopyrite in sample EMMD077-239.4m,
which was also studied for barite fluid inclusions.
The whole-rock Corella carbonate associated sulfate (CAS) samples were processed and
analysed at the University of Tasmania. CAS extraction techniques have been refined
over the last two decades (see Wotte et al. 2012 and references therein) but, essentially,
all use HCl to dissolve carefully washed and cleaned sedimentary (or metasedimentary)
carbonate rocks. This releases lattice-bound and micro-inclusion sulfate from carbonate
minerals in the rock. BaCl2 is added to the resultant solution to precipitate BaSO4 which
is filtered from solution and analysed by conventional stable isotope mass spectrometric
methods.
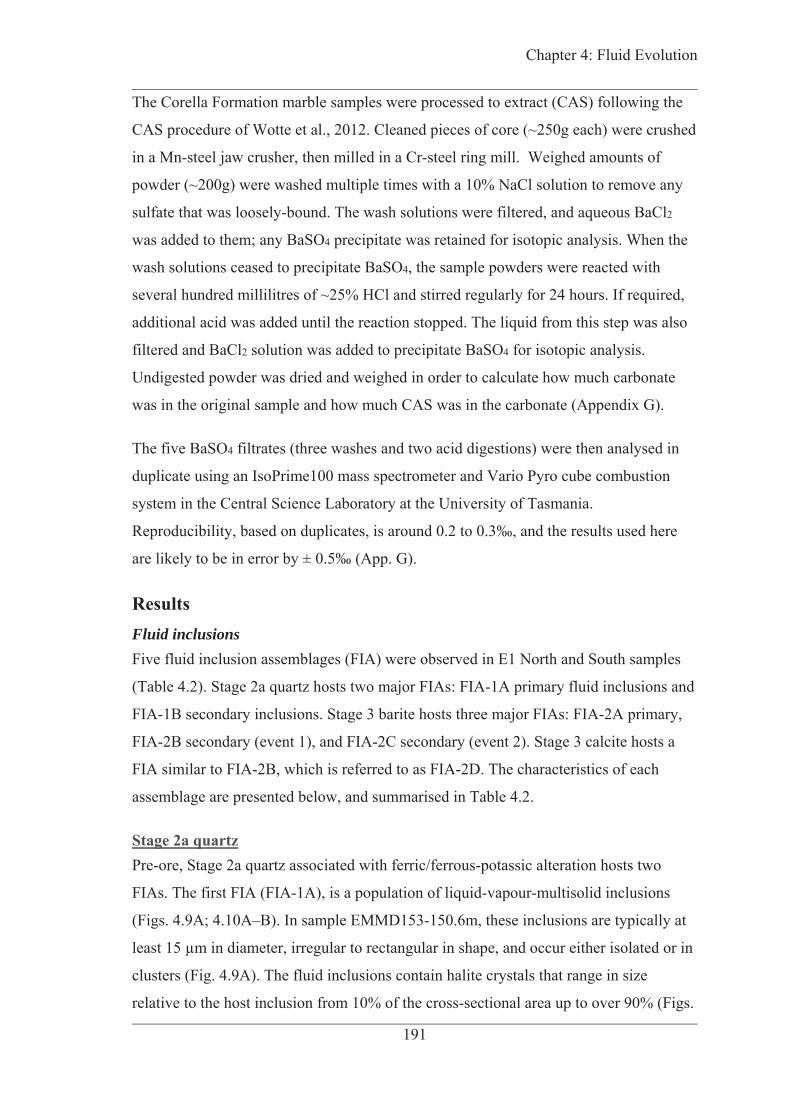
Chapter 4: Fluid Evolution
191
The Corella Formation marble samples were processed to extract (CAS) following the
CAS procedure of Wotte et al., 2012. Cleaned pieces of core (~250g each) were crushed
in a Mn-steel jaw crusher, then milled in a Cr-steel ring mill. Weighed amounts of
powder (~200g) were washed multiple times with a 10% NaCl solution to remove any
sulfate that was loosely-bound. The wash solutions were filtered, and aqueous BaCl2
was added to them; any BaSO4 precipitate was retained for isotopic analysis. When the
wash solutions ceased to precipitate BaSO4, the sample powders were reacted with
several hundred millilitres of ~25% HCl and stirred regularly for 24 hours. If required,
additional acid was added until the reaction stopped. The liquid from this step was also
filtered and BaCl2 solution was added to precipitate BaSO4 for isotopic analysis.
Undigested powder was dried and weighed in order to calculate how much carbonate
was in the original sample and how much CAS was in the carbonate (Appendix G).
The five BaSO4 filtrates (three washes and two acid digestions) were then analysed in
duplicate using an IsoPrime100 mass spectrometer and Vario Pyro cube combustion
system in the Central Science Laboratory at the University of Tasmania.
Reproducibility, based on duplicates, is around 0.2 to 0.3‰, and the results used here
are likely to be in error by ± 0.5‰ (App. G).
Results Fluid inclusions Five fluid inclusion assemblages (FIA) were observed in E1 North and South samples
(Table 4.2). Stage 2a quartz hosts two major FIAs: FIA-1A primary fluid inclusions and
FIA-1B secondary inclusions. Stage 3 barite hosts three major FIAs: FIA-2A primary,
FIA-2B secondary (event 1), and FIA-2C secondary (event 2). Stage 3 calcite hosts a
FIA similar to FIA-2B, which is referred to as FIA-2D. The characteristics of each
assemblage are presented below, and summarised in Table 4.2.
Stage 2a quartz Pre-ore, Stage 2a quartz associated with ferric/ferrous-potassic alteration hosts two
FIAs. The first FIA (FIA-1A), is a population of liquid-vapour-multisolid inclusions
(Figs. 4.9A; 4.10A–B). In sample EMMD153-150.6m, these inclusions are typically at
least 15 μm in diameter, irregular to rectangular in shape, and occur either isolated or in
clusters (Fig. 4.9A). The fluid inclusions contain halite crystals that range in size
relative to the host inclusion from 10% of the cross-sectional area up to over 90% (Figs.
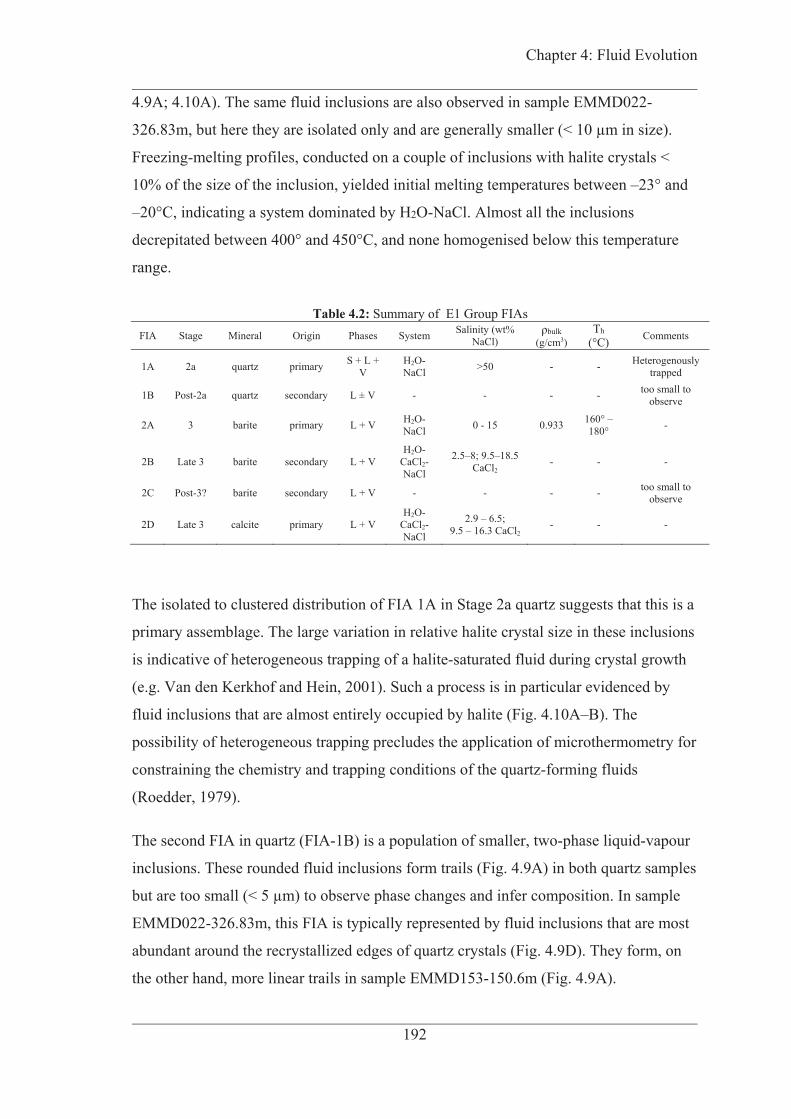
Chapter 4: Fluid Evolution
192
4.9A; 4.10A). The same fluid inclusions are also observed in sample EMMD022-
326.83m, but here they are isolated only and are generally smaller (< 10 μm in size).
Freezing-melting profiles, conducted on a couple of inclusions with halite crystals <
10% of the size of the inclusion, yielded initial melting temperatures between –23° and
–20°C, indicating a system dominated by H2O-NaCl. Almost all the inclusions
decrepitated between 400° and 450°C, and none homogenised below this temperature
range.
Table 4.2: Summary of E1 Group FIAs FIA Stage Mineral Origin Phases System Salinity (wt%
NaCl) bulk
(g/cm3) Th
(°C) Comments
1A 2a quartz primary S + L + V
H2O-NaCl >50 - - Heterogenously
trapped
1B Post-2a quartz secondary L ± V - - - - too small to observe
2A 3 barite primary L + V H2O-NaCl 0 - 15 0.933 160° –
180° -
2B Late 3 barite secondary L + V H2O-
CaCl2-NaCl
2.5–8; 9.5–18.5 CaCl2
- - -
2C Post-3? barite secondary L + V - - - - too small to observe
2D Late 3 calcite primary L + V H2O-
CaCl2-NaCl
2.9 – 6.5; 9.5 – 16.3 CaCl2
- - -
The isolated to clustered distribution of FIA 1A in Stage 2a quartz suggests that this is a
primary assemblage. The large variation in relative halite crystal size in these inclusions
is indicative of heterogeneous trapping of a halite-saturated fluid during crystal growth
(e.g. Van den Kerkhof and Hein, 2001). Such a process is in particular evidenced by
fluid inclusions that are almost entirely occupied by halite (Fig. 4.10A–B). The
possibility of heterogeneous trapping precludes the application of microthermometry for
constraining the chemistry and trapping conditions of the quartz-forming fluids
(Roedder, 1979).
The second FIA in quartz (FIA-1B) is a population of smaller, two-phase liquid-vapour
inclusions. These rounded fluid inclusions form trails (Fig. 4.9A) in both quartz samples
but are too small (< 5 μm) to observe phase changes and infer composition. In sample
EMMD022-326.83m, this FIA is typically represented by fluid inclusions that are most
abundant around the recrystallized edges of quartz crystals (Fig. 4.9D). They form, on
the other hand, more linear trails in sample EMMD153-150.6m (Fig. 4.9A).

Chapter 4: Fluid Evolution
193
Fluid inclusion assemblage 1B is considered to be secondary in origin, based on the
small size of the inclusions relative to 1A, and their distribution in trails and along
crystal deformation boundaries (Fig. 4.9A, D).
Figure 4.9: Schematic maps of E1 Group FIAs. A) FIA-1A in Stage 2a quartz. B) FIA-2D in Stage 3 calcite. C) FIA-2A and FIA-2B (secondary trails) in Stage 3 barite. Continued on the next page.
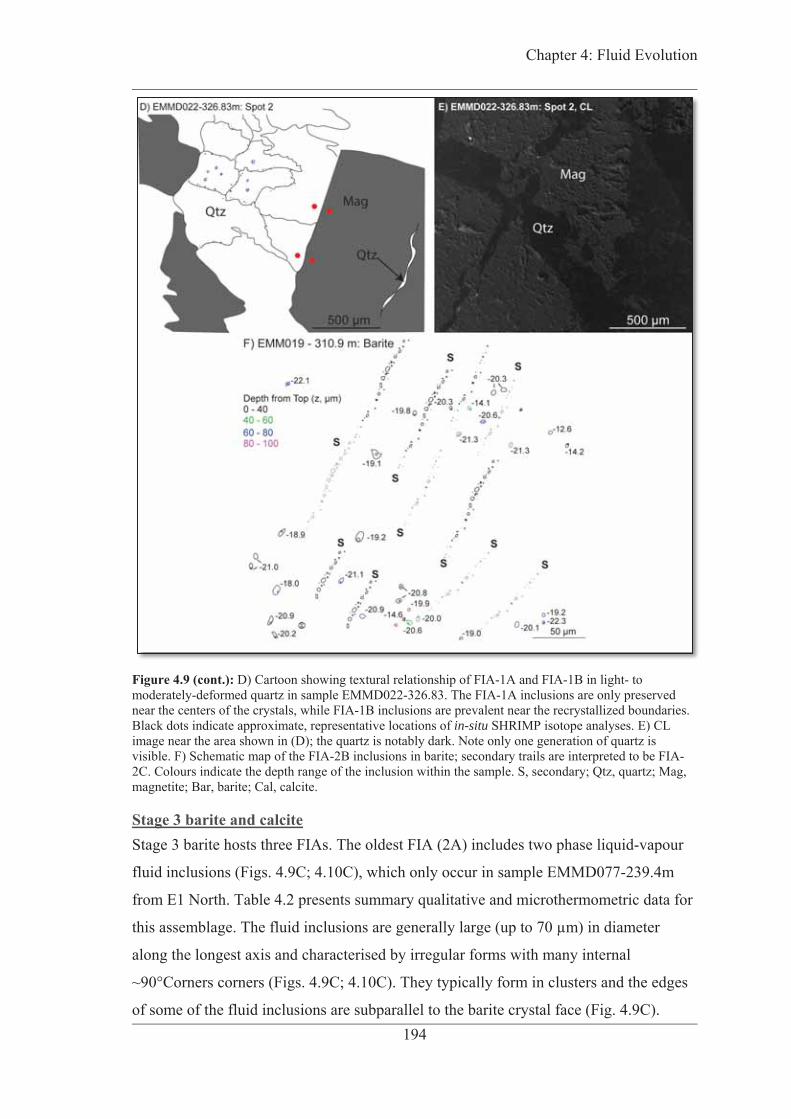
Chapter 4: Fluid Evolution
194
Figure 4.9 (cont.): D) Cartoon showing textural relationship of FIA-1A and FIA-1B in light- to moderately-deformed quartz in sample EMMD022-326.83. The FIA-1A inclusions are only preserved near the centers of the crystals, while FIA-1B inclusions are prevalent near the recrystallized boundaries. Black dots indicate approximate, representative locations of in-situ SHRIMP isotope analyses. E) CL image near the area shown in (D); the quartz is notably dark. Note only one generation of quartz is visible. F) Schematic map of the FIA-2B inclusions in barite; secondary trails are interpreted to be FIA-2C. Colours indicate the depth range of the inclusion within the sample. S, secondary; Qtz, quartz; Mag, magnetite; Bar, barite; Cal, calcite.
Stage 3 barite and calcite Stage 3 barite hosts three FIAs. The oldest FIA (2A) includes two phase liquid-vapour
fluid inclusions (Figs. 4.9C; 4.10C), which only occur in sample EMMD077-239.4m
from E1 North. Table 4.2 presents summary qualitative and microthermometric data for
this assemblage. The fluid inclusions are generally large (up to 70 μm) in diameter
along the longest axis and characterised by irregular forms with many internal
~90°Corners corners (Figs. 4.9C; 4.10C). They typically form in clusters and the edges
of some of the fluid inclusions are subparallel to the barite crystal face (Fig. 4.9C).
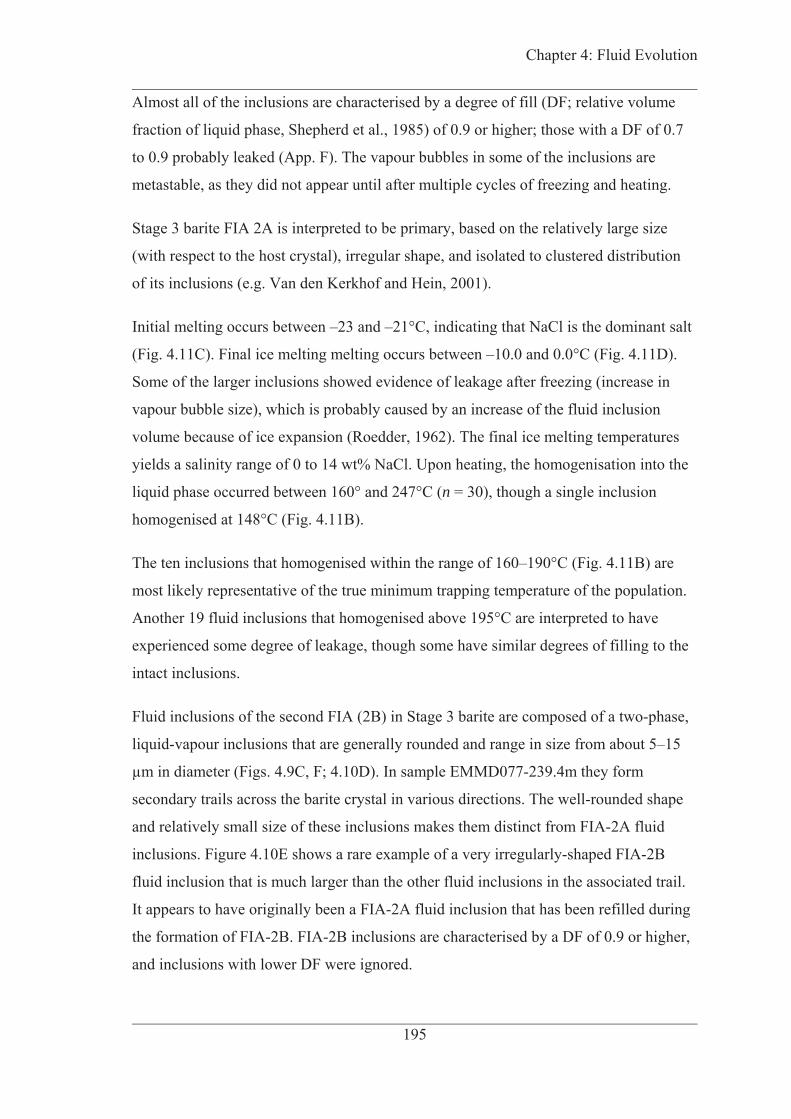
Chapter 4: Fluid Evolution
195
Almost all of the inclusions are characterised by a degree of fill (DF; relative volume
fraction of liquid phase, Shepherd et al., 1985) of 0.9 or higher; those with a DF of 0.7
to 0.9 probably leaked (App. F). The vapour bubbles in some of the inclusions are
metastable, as they did not appear until after multiple cycles of freezing and heating.
Stage 3 barite FIA 2A is interpreted to be primary, based on the relatively large size
(with respect to the host crystal), irregular shape, and isolated to clustered distribution
of its inclusions (e.g. Van den Kerkhof and Hein, 2001).
Initial melting occurs between –23 and –21°C, indicating that NaCl is the dominant salt
(Fig. 4.11C). Final ice melting melting occurs between –10.0 and 0.0°C (Fig. 4.11D).
Some of the larger inclusions showed evidence of leakage after freezing (increase in
vapour bubble size), which is probably caused by an increase of the fluid inclusion
volume because of ice expansion (Roedder, 1962). The final ice melting temperatures
yields a salinity range of 0 to 14 wt% NaCl. Upon heating, the homogenisation into the
liquid phase occurred between 160° and 247°C (n = 30), though a single inclusion
homogenised at 148°C (Fig. 4.11B).
The ten inclusions that homogenised within the range of 160–190°C (Fig. 4.11B) are
most likely representative of the true minimum trapping temperature of the population.
Another 19 fluid inclusions that homogenised above 195°C are interpreted to have
experienced some degree of leakage, though some have similar degrees of filling to the
intact inclusions.
Fluid inclusions of the second FIA (2B) in Stage 3 barite are composed of a two-phase,
liquid-vapour inclusions that are generally rounded and range in size from about 5–15
μm in diameter (Figs. 4.9C, F; 4.10D). In sample EMMD077-239.4m they form
secondary trails across the barite crystal in various directions. The well-rounded shape
and relatively small size of these inclusions makes them distinct from FIA-2A fluid
inclusions. Figure 4.10E shows a rare example of a very irregularly-shaped FIA-2B
fluid inclusion that is much larger than the other fluid inclusions in the associated trail.
It appears to have originally been a FIA-2A fluid inclusion that has been refilled during
the formation of FIA-2B. FIA-2B inclusions are characterised by a DF of 0.9 or higher,
and inclusions with lower DF were ignored.
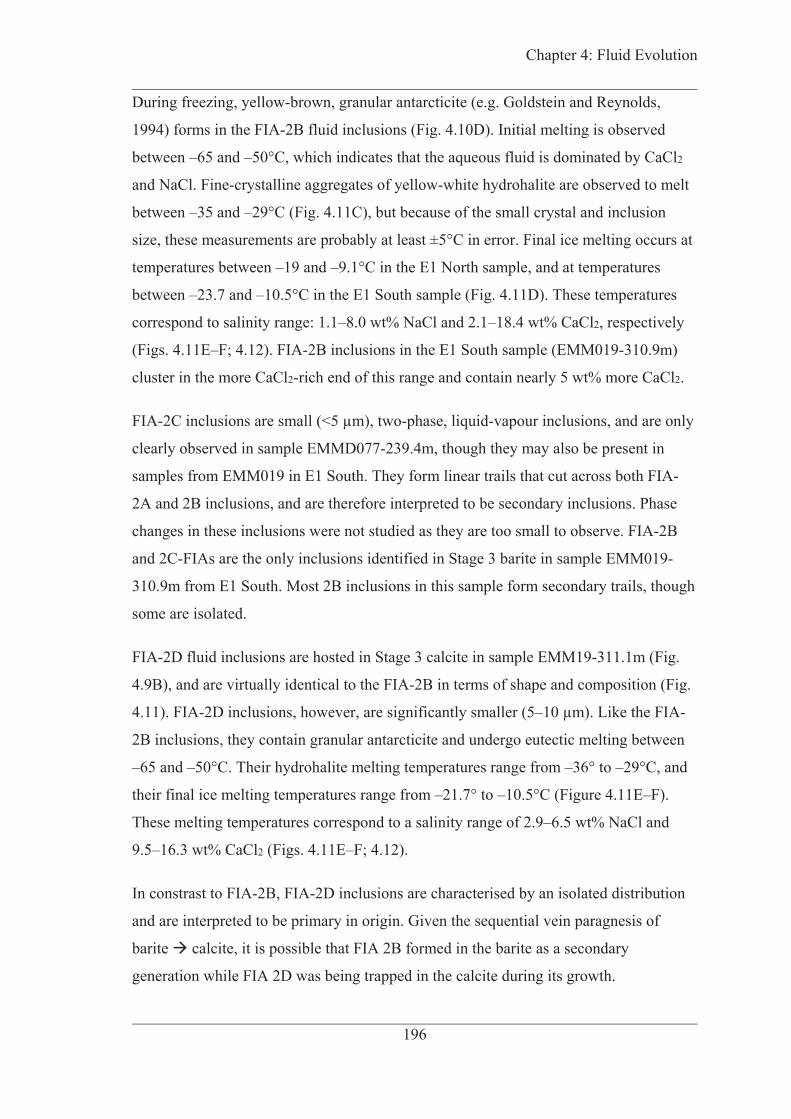
Chapter 4: Fluid Evolution
196
During freezing, yellow-brown, granular antarcticite (e.g. Goldstein and Reynolds,
1994) forms in the FIA-2B fluid inclusions (Fig. 4.10D). Initial melting is observed
between –65 and –50°C, which indicates that the aqueous fluid is dominated by CaCl2
and NaCl. Fine-crystalline aggregates of yellow-white hydrohalite are observed to melt
between –35 and –29°C (Fig. 4.11C), but because of the small crystal and inclusion
size, these measurements are probably at least ±5°C in error. Final ice melting occurs at
temperatures between –19 and –9.1°C in the E1 North sample, and at temperatures
between –23.7 and –10.5°C in the E1 South sample (Fig. 4.11D). These temperatures
correspond to salinity range: 1.1–8.0 wt% NaCl and 2.1–18.4 wt% CaCl2, respectively
(Figs. 4.11E–F; 4.12). FIA-2B inclusions in the E1 South sample (EMM019-310.9m)
cluster in the more CaCl2-rich end of this range and contain nearly 5 wt% more CaCl2.
FIA-2C inclusions are small (<5 μm), two-phase, liquid-vapour inclusions, and are only
clearly observed in sample EMMD077-239.4m, though they may also be present in
samples from EMM019 in E1 South. They form linear trails that cut across both FIA-
2A and 2B inclusions, and are therefore interpreted to be secondary inclusions. Phase
changes in these inclusions were not studied as they are too small to observe. FIA-2B
and 2C-FIAs are the only inclusions identified in Stage 3 barite in sample EMM019-
310.9m from E1 South. Most 2B inclusions in this sample form secondary trails, though
some are isolated.
FIA-2D fluid inclusions are hosted in Stage 3 calcite in sample EMM19-311.1m (Fig.
4.9B), and are virtually identical to the FIA-2B in terms of shape and composition (Fig.
4.11). FIA-2D inclusions, however, are significantly smaller (5–10 μm). Like the FIA-
2B inclusions, they contain granular antarcticite and undergo eutectic melting between
–65 and –50°C. Their hydrohalite melting temperatures range from –36° to –29°C, and
their final ice melting temperatures range from –21.7° to –10.5°C (Figure 4.11E–F).
These melting temperatures correspond to a salinity range of 2.9–6.5 wt% NaCl and
9.5–16.3 wt% CaCl2 (Figs. 4.11E–F; 4.12).
In constrast to FIA-2B, FIA-2D inclusions are characterised by an isolated distribution
and are interpreted to be primary in origin. Given the sequential vein paragnesis of
barite calcite, it is possible that FIA 2B formed in the barite as a secondary
generation while FIA 2D was being trapped in the calcite during its growth.

Chapter 4: Fluid Evolution
197
Figure 4.10: FIA photomicrographs. A-B) FIA-1A inclusions in quartz. Note the large halite crystals occupying almost the entire inclusion in some instances. C) Freezing-heating profile of FIA-2A inclusions (H2O-NaCl). Hydrohalite melts first, leaving behind ice crystals. Grainy yellowish material in center image is hydrohalite. D) Freezing-heating profile of FIA-2B and 2D (not shown) inclusions (H2O-CaCl2-NaCl). Brown material present at freezing is antarcticite. Hydrohalite melts ~ –35 to –30°C, leaving ice behind. E) Irregularly-shaped inclusion with FIA-2B composition, interpreted to have originally been a FIA-2A inclusion later refilled by 2B.

Chapter 4: Fluid Evolution
198
Figure 4.11: Microthermometry histograms. A) FIA-2A final melting temperatures and calculated salinities. B) FIA-2A homogenisation temperatures. C) FIA-2B and 2D hydrohalite melting temperatures. D) FIA-2B and 2D ice melting temperatures. E) FIA-2B and 2D calculated NaCl salinity. F) FIA-2B and 2D calculated CaCl2 salinities.
Figure 4.12: H2O-CaCl2-NaCl ternary plot of FIA-2B (barite-hosted) and FIA-2D (calcite-hosted) FIAs. Compositions calculated using the model from Steele-MacInnis et al. (2011).

Chapter 4: Fluid Evolution
199
Stable isotopes Oxygen Table 4.3 18OVSMOW data and statistics for all quartz and
magnetite samples, and histograms are shown in Figure 4.13 18O values fall in
a narrow range from +12.7 to +14.8‰ (mean = +13.6 ± 0.7‰), with the exception of
sample EMMD142-117.5m, which is significantly higher at +17.1‰. Sample
EMM019-318m (+14.8‰) from E1 South is within error of the highest E1 North values 18O values are lower and vary widely from 0 to +8‰ (mean =
+3.3 ± 2.5‰). Variation within samples and within individual grains (e.g. Fig. 4.8A) is
also high, especially in EMMD022-326.83m, which has a minimum of +1.1‰ and
maximum value of +8‰ (Table 4.3). A single E1 South analysis from sample
EMM019-318m 18O of 5.0‰, which overlaps with E1 North.
Sulfur 34SCDT of all samples are shown in in Figure 4.14; the tabulated raw data
are available in Appendix G. Summarised statistics are presented in Table 4.4. In 34S values in all minerals between each
orebody; the values at E1 East and South are consistently higher than those from E1
North and E8. Intra- 34S values are consistent in all sulfur minerals analysed
(App. G). 34S values at E1 North, in both alteration and vein
samples, range from –5.8 to +2.7‰ (mean = –0.7 ± 2.0‰). However, sample
EMMD153-277.5m 34S value of +13.9‰. Pre-Stage 3 34S values from E1 North are mostly higher and range from +1.2 to +7.7‰
(mean = +4.4 ± 3.5‰). The higher values are found in samples of vein-hosted pyrite 34S value of pyrite (+14.5‰) in
EMMD153-277.5m 34S values of
Stage 3 barite in fine-crystalline alteration and microvein samples at E1 North are much
higher than chalcopyrite and pyrite, and have a range of +15.9 to +21.2‰ (mean =
+18.9 ± 1.9‰). The two vein-hosted Stage 3 barite samples, EMMD077-239.4m and
EMMD055-155.35m, are characterise 34S values of +6.7‰ and
+11.5‰.

Table 4.3: 18O Results
Site Drillhole - depth
Paragenetic Stage Description and protolith Spot
18Oqtz (‰)
Error (‰; 95% CI)
18Omag (‰)
Error (‰; 95% CI)
Calculated Temperature
(°C)
Error (°C)
Calculated 18Ofluid
E1 North
EMMD153 - 277.5m 2a
Stage 2a mag-qtz veining with Stage 2c calcite and Stage 3 py-ccp overprint and
alteration of siliceous marble
S1-1 14.3 0.5 0.7 1.2 376 69 9.2 S2-1 13.5 0.5 1.7 1.2 447 82 9.8 Mean 13.9 - 1.2 - - - -
EMMD001 - 59.2m 2a Dissem. mag-qtz alteration and infill of
amyg. meta-andesite
S2-1 13.4 0.6 2.9 1.2 506 92 10.7 S3-1 12.9 0.5 3.4 1.2 558 102 10.8 S3-2 13.4 0.6 0.0 1.2 386 71 8.4 Mean 13.2 - 2.1 - - - -
EMMD022 - 326.83m 2a Massive, polycrystalline qtz associated
with euhedral magnetite
S1-1 13.6 0.6 5.3 1.2 625 146 - S1-2 13.2 0.6 6.1 1.2 703 175 - S1-3 13.2 0.5 8.0 1.2 855 260 - S2-2 12.7 0.6 1.1 1.2 457 84 9.2 Mean 13.2 - 5.1 - - - -
Ex - situ EMMD153 - 150.6m 2a Stage 2a quartz vein with later Stage 2c
infill cutting volcaniclastic breccia WM 14.6 0.2 - - - - -
EMMD142 - 117.5m 2a Qtz infill of amygdule in meta-andesite,
overprinted by calcite WM 17.1 0.2 - - - - -
E1 South
EMM019 -318m 2a
Stage 2a qtz-mag vein with 2c cal-py infill cutting silicified and albitised
meta-andesite WM 14.8 0.2 5.0 1.2 515 93 12.5
E1 East
EMMD007 - 223.6m 2a
Stage 2a qtz-mag vein with 2c cal-py infill cutting silicified and albitised
meta-andesite WM - - 2.3 1.2 - - -
Statistics All data normalized to VSMOW
All samples
Mean 13.6 3.3 464 85 10 WM = whole mineral Std Dev 0.7 2.5 68 12 1
Min 12.7 0.0 376 69 8 Max 17.1 8.0 855 102 12
CI, confidence interval
200
Chapter 4: Fluid Evolution

Chapter 4: Fluid Evolution
201
Figure 4.13: 18 18O for the fluid.
34S values are characterised by a much greater range than E1
North values, between +1.7 to +17.3‰, and are much higher at a mean of +11.1 ±
3.5‰). Most values are above +6.8‰, with two exceptions. A single analysis of
disseminated chalcopyrite from sample EMM018-86.9m, hosted in carbonaceous schist, 34S of +3.0‰ and one analysis in EMMD052-285.85m 34S = +1.7‰. Vein-
34S (mean = +12.1‰) is similar with that of chalcopyrite alteration
in laminated marbles, which falls between +7.8‰ and +11.7‰. Pyrite values are even
more spread out and range between +2.0‰ and 20.1‰ (mean = 9.9 ± 7.6‰). In general,
pyrite values from E1 South are similar to chalcopyrite values in the same sample,
except in sample EMM019-202.1m, where the pyrite is enriched by about 2‰. Pyrite in
sample EMMD052-285.85m 34S of +8.5‰ in
the sulfide-rich layer (Figs. 4.7D; 4.8F, Spot 2) to +12.6‰ in a less altered layer.
Paragenetically-later chalcopyrite in the less-altered layer of this sample averages +11.7
± 0.4‰, which is similar to the pyrite in the same layer. The aforementioned anomalous 34S value of +1.7‰ from this sample is from the same layer as the
enriched pyrite. Pyrite from sample EMM019-86.9m 34S value of +2.2‰,
which is similar to the low chalcopyrite value (+3.0‰) in this sample, and about 3‰
less than pyrite associated with the same lithology analysed near E1 North in sample
EMMD167-105.9m 34S values for pyrite
(mean = +19.2) and chalcopyrite (mean = +17.1) in sample EMM019-202.1m, which
was collected from a similar carbonaceous metasiltstone that grades into the schist. 34S values from laminated marbles (+26.6 to +29.5‰) in E1 South are higher

Chapter 4: Fluid Evolution
202
than those in E1 North laminated rocks, but despite this vein- 34S values at
E1 South are lower (+19.1 to +21.2‰) than those from alteration barite.
Figure 4.14: 34S histograms for all locations. A) Chalcopyrite. B) Barite. C) Pyrite.
34S values of E1 East chalcopyrite range from +12.5 to +16.9‰ (mean = +14.7 ±
1.6), and are the highest of the three orebodies. Although this range overlaps with E1 34S values of vein-hosted chalcopyrite (mean = +16.0 ±
34S values are
also higher than in the other orebodies and fall between +13.4‰ and +21.4‰ (mean = 34S values are mostly enriched relative to
chalcopyrite values in the same sample. The highest value of +21.4‰ comes from vein-
hosted pyrite cutting a meta-andesite (EMMD007-223.6m). B 34S values in E1
East were measured in three vein-hosted samples, and range from +5.6‰ to +26.5‰.
The latter sample (EMMD008-114.45m) is similar to most E1 North and South barite

Chapter 4: Fluid Evolution
203
values, but the other is much lower than barites in these two orebodies, except for
sample EMMD077-239.4m from E1 North.
34S from drill hole EMMD174 (samples EMMD174-117.7m and
EMMD174-92.3m), which is poorly mineralised, average at +3.0‰ and +4.0‰ for
pyrite and chalcopyrite, respectively. This drill hole is located between the E1 East and
E1 South orebodies, and transects less-altered marble along strike from the E1 East 34S from chalcopyrite in sample EMMD226-130.4m, hosted in
meta-andesite and located at the E8 target, average +0.7‰ 34S has a value 34S values of sulfides from these two drillholes are similar to E1 North.
The two bulk-rock samples of Corella Formation marble CAS, collected from the Snake 34S values of +11.6‰ and +12.5‰. These values overlap with
34S values
in marble- 34S in poorly-
mineralised marble in drill hole EMMD174.

Chapter 4: Fluid Evolution
204
Table 4.4: 34S Statistics 34SCDT (‰)
Chalcopyrite Pyrite Barite E1 North
Mean –0.1 4.4 17.9 1) 3.5 3.5 3.6
Minimum –5.8 1.2 6.7 Maximum 13.9 14.5 21.2
Excluding EMMD153-277.5 Excluding Veins Maximum 2.7 7.7 Minimum (excl. veins) 15.9
Mean –0.7 3.6 Mean (excl. veins) 18.9 1) 2.1 1.9 1) 1.9
E1 East Mean 14.7 17.6 10.3
1) 1.6 2.4 7.5 Minimum 12.5 13.4 4.5 Maximum 16.9 21.4 26.5
E1 South Mean 11.1 9.9 24.3
1) 3.5 7.6 3.9 Minimum 1.7 2.0 18.2 Maximum 17.3 20.1 29.7
Mean excl EMM018-86.9 11.4 - - Minimum 1.7 - -
1) 3.2 - - EMMD174
Mean 4.0 3.0 - 1) - 3.1 -
Minimum - 0.5 - Maximum - 8.2 -
E8 Mean 0.69 1.57 -
Total
n (in-situ) 63 41 40
n (ex-situ) 3 3 3
Physiochemical Characteristics The fluid inclusion and isotope data can be used to estimate some of the physiochemical
characteristics of the fluids, including temperature and salinity of both pre-ore and 18Ofluid of the pre-ore fluid, and 34 S , oxygen fugacity and pH
of the mineralising fluid. In previous sections, the fluid inclusion and stable isotope
aspects were reported separately; here they are combined.

Chapter 4: Fluid Evolution
205
Temperature Stage 2a quartz-magnetite Calculated quartz-magnetite equilibrium temperatures vary considerably between the
three samples, from 354° to 915°C, and also within individual samples. This variation is 18 18O values are
18O values of three pairs resulted in temperatures above 600°C,
including the 915°C maximum; the validity of these temperatures is discussed below.
The other seven analyses fall within the range of 354° to 535°C (mean = 442 ± 90°C),
and represent reasonable isotopic equilibrium temperatures based on the mineral
assemblage. The high mean error is caused by the relatively high analytical errors of the
magnetite oxygen isotope analysis. Uncertainties in the empirical constants of equations
1–2 are only ~0.1‰. Sample EMM019-318m from E1 South has a calculated
temperature of 515°C, which is comparable to E1 North.
Stage 3 barite-chalcopyrite E1 North ore formation temperatures, calculated from measurements in laminated ore
samples, range from 233° to 343°C, with a mean temperature of 300°C and an average
analytical error of ±12°C (Table 4.5; Fig. 4.15) 34S of 34S values of both minerals
are proportionately higher at E1 South and result in sulfate-sulfide values
between 18‰ and 23‰. This corresponds to calculated temperatures of about 320°C,
which are similar to values from E1 North (Fig. 4.15). The only apparent valid E1 East
temperature calculation is from pyrite-chalcopyrite and is 290°C (Fig. 4.15). Variation
within individual samples ranges from 10° to 40°C (Table 4.5), which cannot be
explained by error alone and is probably not reasonable over sub-cm distances. Such
variation suggests local disequilibrium or partial isotopic reequilibrium of chalcopyrite 34S values (e.g. Seal, 2006). Alternatively, the variation may represent multiple fluid
pulses over short time periods, rather than continuous alteration. The highest
temperature estimates, > ~340°C, are over 20°C higher than other spot analyses in
individual samples and probably also represent isotopic reequilibrium in chalcopyrite.

Chapter 4: Fluid Evolution
206
Table 4.5: Calculated Barite-Chalcopyrite Equilibrium Temperatures
Sample Spot -sulfide Calculated Temperature (°C) Error (±°C)
E1 North
EMMD075 - 205.3
S1-1.1 17.5 341 15 S1-1.2 20.5 294 12 S1-2.1 20.9 288 11 S2-1.1 20.3 297 12 S2-2.1 20.9 288 12 S2-3.1 20.0 301 13 S2-4.1 19.7 305 13 Mean 20.0 302 13
Standard 1)
1.2 18 1
EMMD001-195.25
S1-1.1 19.6 308 12 S1-1.2 19.3 312 13 S1-2.1 17.3 347 15 S3-1.1 18.8 320 13 S3-1.2 17.9 334 15 Mean 18.6 324 14
Standard 1)
1.0 16 1
EMMD085-310.5
S1-6a 22.9 262 10 S1-9a 25.6 233 9 S1-7a 21.2 284 11 S1-10a 22.4 269 10 Mean 23.0 262 10
Standard 1)
1.8 21 1
EMMD077-239.4 Mean* 4.0 1137 +166/-123 EMMD055-14 Mean* 10.3 605 +37/-32
Summary Mean 20.3 300 12
Minimum T 233 Maximum T 347
MA96740 (EMM019 - UD)
S1-1.1 19.1 315 14 S1-1.2 18.7 322 13 S2-1.1 17.8 338 14 S2-1.2 18.8 319 14 S2-1.3 18.9 317 14 S3-1.1 19.4 311 13 S3-1.2 19.6 307 12 Mean 18.9 318 13
Standard 1)
0.6 10 1
EMM019-311.1 S1-2.1 4.7 1022 +125/-97 S1-2.1 4.2 1103 +154/-115 S1-2.3 7.2 780 +65/-54
EMM019-310.9 S1-1a 6.8 807 +70/-58 S1-3a 8.4 700 +50/-43
EMMD052 - 285.85 S3-2 18.1 332 12 S3-3 17.7 339 13
Summary Mean 18.9 322 13
Minimum T 307 Maximum T 339
EMMD008-114.15 Mean* 11.85** 546 +29/-26
Py-ccp 1.1*** 290 +270/-130 *ex-situ samples **combination of mean ex-situ and in-situ values ***mean in-situ py and ccp values red temperatures are likely to be erroneous (see text)
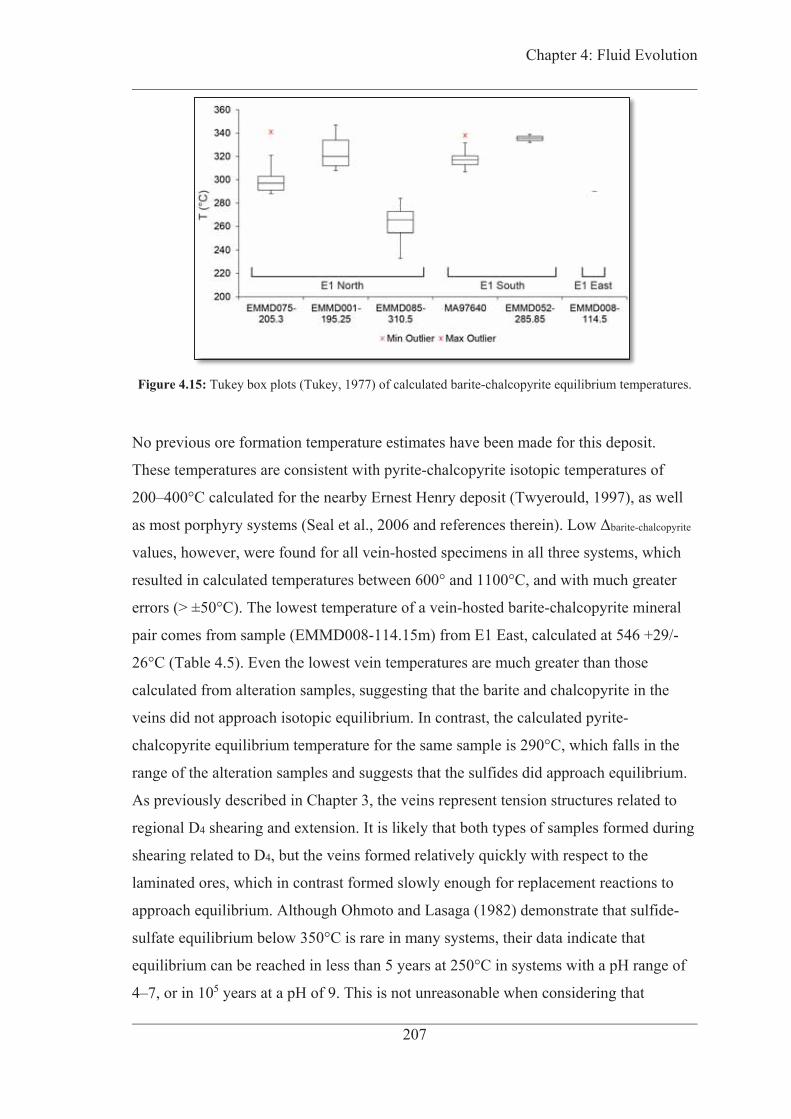
Chapter 4: Fluid Evolution
207
Figure 4.15: Tukey box plots (Tukey, 1977) of calculated barite-chalcopyrite equilibrium temperatures.
No previous ore formation temperature estimates have been made for this deposit.
These temperatures are consistent with pyrite-chalcopyrite isotopic temperatures of
200–400°C calculated for the nearby Ernest Henry deposit (Twyerould, 1997), as well
as most porphyry systems (Seal et al., 2006 and references therein). L barite-chalcopyrite
values, however, were found for all vein-hosted specimens in all three systems, which
resulted in calculated temperatures between 600° and 1100°C, and with much greater
errors (> ±50°C). The lowest temperature of a vein-hosted barite-chalcopyrite mineral
pair comes from sample (EMMD008-114.15m) from E1 East, calculated at 546 +29/-
26°C (Table 4.5). Even the lowest vein temperatures are much greater than those
calculated from alteration samples, suggesting that the barite and chalcopyrite in the
veins did not approach isotopic equilibrium. In contrast, the calculated pyrite-
chalcopyrite equilibrium temperature for the same sample is 290°C, which falls in the
range of the alteration samples and suggests that the sulfides did approach equilibrium.
As previously described in Chapter 3, the veins represent tension structures related to
regional D4 shearing and extension. It is likely that both types of samples formed during
shearing related to D4, but the veins formed relatively quickly with respect to the
laminated ores, which in contrast formed slowly enough for replacement reactions to
approach equilibrium. Although Ohmoto and Lasaga (1982) demonstrate that sulfide-
sulfate equilibrium below 350°C is rare in many systems, their data indicate that
equilibrium can be reached in less than 5 years at 250°C in systems with a pH range of
4–7, or in 105 years at a pH of 9. This is not unreasonable when considering that

Chapter 4: Fluid Evolution
208
timescales involved in ductile shearing and carbonate replacement are likely to be much
greater than 103 years (Skinner, 1997).
Stage 3 trapping pressure estimates The calculated isotopic temperatures of Stage 3 barite-chalcopyrite are compatible with
the barite fluid inclusion data. The fluid inclusions that homogenised above 200°C were
likely disturbed, while those that homogenised between 148° to 190°C likely represent
true minimum trapping temperatures. The isotopic equilibrium temperature could not be
determined for the vein-hosted sample EMMD077-239.4m, which was studied for FIA-
2A inclusions, because equilibrium was not attained between the barite and chalcopyrite
in this sample. However, calculated temperatures for two nearby samples, EMMD001-
195.25m and EMMD075-205.3m, were within 20°C of one another, suggesting that
temperature variations within the center of the E1 North orebody were minor. The
variation is not much higher than the mean analytical error (±12°C); therefore, the mean
temperature of these two samples (~315°C) is considered a reasonable approximation
for the true trapping temperature in the vicinity of EMMD077-239.4m. The calculated
trapping pressures for 2A FIAs range from 2200 to 3300 (±500) bar (Fig. 4.16), which
correspond to an approximate depth range of 8–12 km (assuming a density of 2.7
g/cm3). This depth range is comparable to estimates of ore formation from 6–10 km at
Ernest Henry, made by Kendrick et al. (2007) based on fluid inclusion halogen ratios.
This depth range is compatible with the brittle-ductile strain patterns discussed in
Chapter 2.
Figure 4.16: P-T diagram of calculated isochores and resultant true trapping pressures and errors for FIA-2A barite inclusions, based on a calculated isotopic true temperature of 315°C (see text). Isochores calculated using Hokieflincs (Steele-MacInnis et al., 2012).
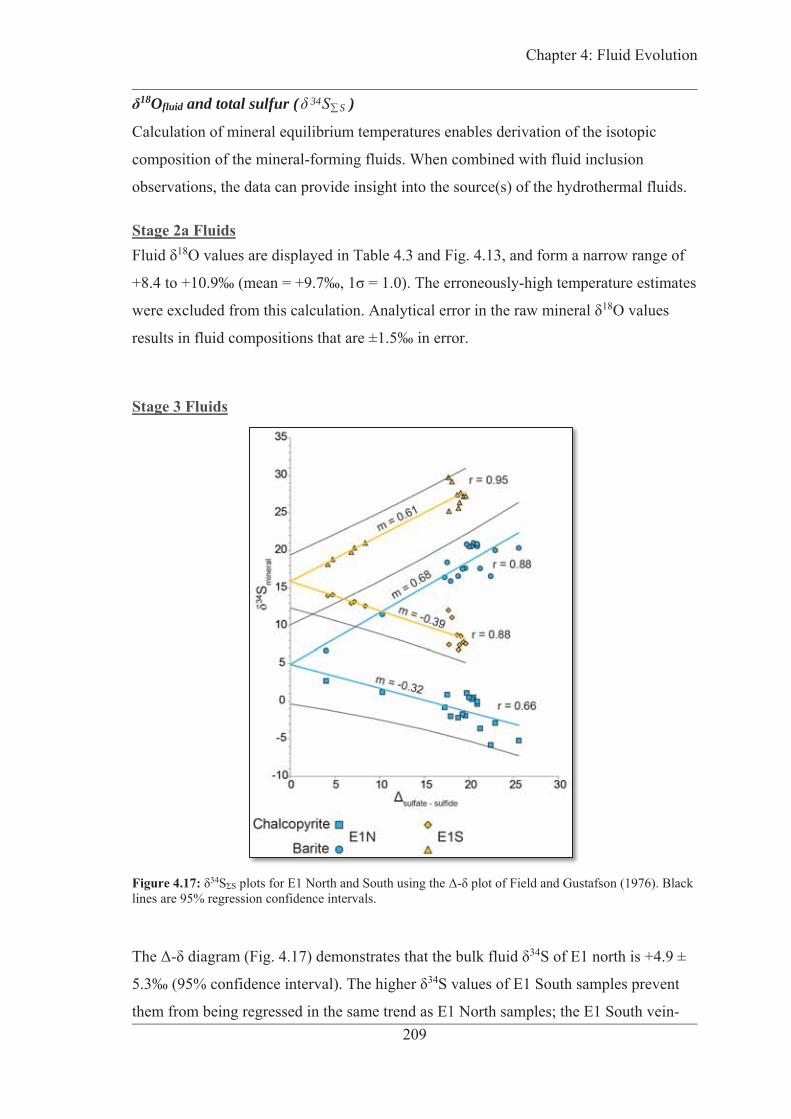
Chapter 4: Fluid Evolution
209
18Ofluid and total sulfur ( 34S )
Calculation of mineral equilibrium temperatures enables derivation of the isotopic
composition of the mineral-forming fluids. When combined with fluid inclusion
observations, the data can provide insight into the source(s) of the hydrothermal fluids.
Stage 2a Fluids 18O values are displayed in Table 4.3 and Fig. 4.13, and form a narrow range of
+8.4 to +10.9‰ (mean = +9.7‰, 1 -high temperature estimates 18O values
results in fluid compositions that are ±1.5‰ in error.
Stage 3 Fluids
Figure 4.17: 34S -lines are 95% regression confidence intervals.
- 7) demonstrates 34S of E1 north is +4.9 ±
5.3‰ (95% confidence interval). T 34S values of E1 South samples prevent
them from being regressed in the same trend as E1 North samples; the E1 South vein-

Chapter 4: Fluid Evolution
210
hosted and alteration-hosted samples form linear trends that converge at +15.9 ± 3.6‰
(95% confidence). Although the aforementioned r values indicate reasonable
correlations between the sulfide and sulfate minerals, it is visually evident that some of
the analyses are not linear. Following Figure 3 of Field and Gustafson (1976), the slopes
of the E1 North chalcopyrite (m = –0.32) and barite (m = 0.68) trends suggest a 2
24SO / H S mole ratio of about 35:65. E1 South, on the other hand, is characterised by
slightly shallower barite (m = 0.61) and slightly steeper chalcopyrite (m = 0.39) slopes,
which indicate a more sulfate-rich fluid with around 30:70 ratio.
Regressions - for E1 North and South are shown in Figure 4.18. With
the exception of analyses from sample EMMD075-205.3m, the E1 North samples form
a linear trend (r = 0.82) that intersects the tie line at +4.2 ± 3.7‰. This is compatible
- The non-linearity of analyses from sample
EMMD075-205.3m is much mor - -
Although it does not fall along the trend of the other E1 North analyses, the calculated
mean barite-chalcopyrite equilibrium temperature for the sample is 302°C, which is
similar to others from E1 North and South.
Figure 4.18: 34S -
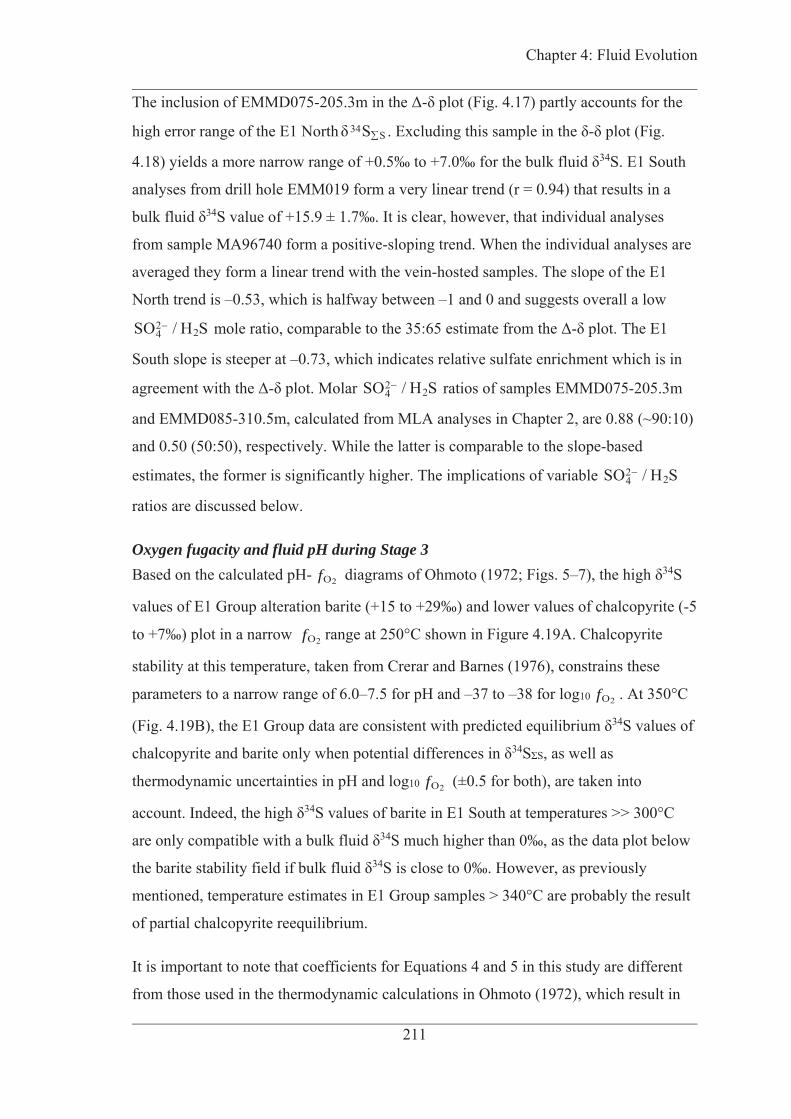
Chapter 4: Fluid Evolution
211
The inclusion of EMMD075-205.3m - (Fig. 4.17) partly accounts for the
high error range of the E1 North 34 S . - (Fig.
4.18) yields a more narrow range of +0.5‰ 34S. E1 South
analyses from drill hole EMM019 form a very linear trend (r = 0.94) that results in a 34S value of +15.9 ± 1.7‰. It is clear, however, that individual analyses
from sample MA96740 form a positive-sloping trend. When the individual analyses are
averaged they form a linear trend with the vein-hosted samples. The slope of the E1
North trend is –0.53, which is halfway between –1 and 0 and suggests overall a low 2
24SO / H S -
South slope is steeper at –0.73, which indicates relative sulfate enrichment which is in
- Molar 224SO / H S ratios of samples EMMD075-205.3m
and EMMD085-310.5m, calculated from MLA analyses in Chapter 2, are 0.88 (~90:10)
and 0.50 (50:50), respectively. While the latter is comparable to the slope-based
estimates, the former is significantly higher. The implications of variable 224SO / H S
ratios are discussed below.
Oxygen fugacity and fluid pH during Stage 3 Based on the calculated pH- 2Of diagrams of Ohmoto (1972; Figs. 5– 34S
values of E1 Group alteration barite (+15 to +29‰) and lower values of chalcopyrite (-5
to +7‰) plot in a narrow 2Of range at 250°C shown in Figure 4.19A. Chalcopyrite
stability at this temperature, taken from Crerar and Barnes (1976), constrains these
parameters to a narrow range of 6.0–7.5 for pH and –37 to –38 for log10 2Of . At 350°C
(Fig. 4.19B), the E1 Group 34S values of
chalcopyrite and barite only when 34S , as well as
thermodynamic uncertainties in pH and log10 2Of (±0.5 for both), are taken into 34S values of barite in E1 South at temperatures >> 300°C
are only compatible with 34S much higher than 0‰, as the data plot below 34S is close to 0‰. However, as previously
mentioned, temperature estimates in E1 Group samples > 340°C are probably the result
of partial chalcopyrite reequilibrium.
It is important to note that coefficients for Equations 4 and 5 in this study are different
from those used in the thermodynamic calculations in Ohmoto (1972), which result in

Chapter 4: Fluid Evolution
212
34S contour errors of up to 2‰. Regardless, the pH and 2Of ranges are near
the barite-sulfide stability boundary, which is consistent with the observed mineral
assemblage of barite-chalcopyrite-pyrite-carbonate. The plots in Ohmoto (1972) assume
a 34 S of 0‰, but 34S between +29.8 and 0‰ suggests 34S from 0‰ would not greatly affect the pH- 2Of
range at 250°C 34S values (< +10‰) of vein-hosted barite suggest highly-
oxidizing conditions during vein formation. The implications of the variation between 34S values on these parameters are discussed below.
Figure 4.19: E1 Group Stage 3 pH-fO2 rang 34S values of barite and chalcopyrite, using the thermodynamically-modeled diagrams of Ohmoto (1972) at 250°C (A) and 350°C
34 34S chalcopyrite values in square brackets. The left- 34S = 0‰. Center values assume
34S = +4.5‰, while right- 34S = +16‰. Contour values at 350°C are derived from equilibrium fractionation factors between H2S and chalcopyrite or sulfate from Ohmoto (1972). Dashed lines are mineral stability boundaries. Chalcopyrite stability field at 250°C is from Crerar and Barnes (1976).

Chapter 4: Fluid Evolution
213
Discussion Validating assumptions of isotopic equilibrium The oxygen and sulfur temperature data and 34 S and 2Of - pH diagrams provide a
means to assess whether or not isotopic equilibrium was reached in some or all of the
quartz-magnetite and barite-chalcopyrite samples. The Stage 2a temperatures in excess
of 600°C are not likely to be reasonable equilibrium temperatures, given the paucity of
high-temperature mineral assemblages. Additionally, temperatures below 400°C may
represent post-Stage 2c remobilization or renewed magnetite alteration. The analyses in
the range of 400° to ~550°C are more likely true equilibrium temperatures based on
mineral assemblage. 18OVSMOW values of around 8‰ in
sample EMMD022-326.83m, the erroneously high calculated temperatures (> 600°C) 18O values may be caused by late isotopic
reequilibrium of the magnetite under different conditions. Alternatively, the magnetite
and quartz may not have reached equilibrium in some instances. Despite the evidence of
penetrative strain in the quartz, the consistent isotopic signature across samples suggests
that deformation did not have a significant effect on quartz oxygen isotope values.
Temperature calculations from barite-chalcopyrite pairs in vein-hosted samples in E1
North and South yielded unrealistically high temperatures, indicating that the minerals
were either formed sequentially, formed at the same time but in isotopic disequilibrium,
or disturbed after deposition. The vein-hosted samples, however, form linear trends on
the - - diagrams with the alteration-hosted samples including E1 North
chalcopyrite (r = 0.66; Fig. 4.17), E1 North barite (r = 0.88), E1 South chalcopyrite (r =
0.88), and E1 South barite (r = 0.95). The regressions are statistically significant (p =
0.000) at the 95% confidence interval.
Shelton and Rye (1982) documented the same phenomenon in the Mines Gaspe
porphyry deposit, in which samples with erroneous temperatures formed linear trends
- systematic disequilibrium between 24SO
and H2 sulfate-sulfide values for pyrite-anhydrite
and chalcopyrite-anhydrite pairs during precipitation. Most of their pyrite-chalcopyrite
pairs did approach equilibrium, so the apparent disequilibrium between 24SO and H2S
was interpreted to be a result of lower equilibration rates between sulfates and sulfides
- 4.17) suggest that this

Chapter 4: Fluid Evolution
214
process also took place in vein-hosted barite-chalcopyrite samples in the E1 Group, and
that the vein-hosted barite and chalcopyrite were in cogenetic disequilibrium.
Although calculated temperatures are consistent at E1 North and South, non-linearity in
some samples may suggest local isotopic reequilibrium or fluctuations in 224SO / H S
within the deposit. -
EMMD075-205.3m does not fall on the main E1 North trend (Fig. 4.18). Despite this,
the calculated temperatures for this sample (~290° to 305°C) are comparable to the
other E1 North analyses. Such temperature similarity, coupled with the clustering of
individual analyses, suggests that re- 34S
values. Instead, either a local heterogeneity in the 224SO / H S mole ratio is proposed to
explain the discrepancy. Alternatively, temporal variation within samples (i.e. cyclic
fluid input at sub-cm scales) may be a factor, especially when considering the
timescales involved in ductile deformation and host rock replacement.
Such discrepancies are also present in the E1 South sample from drillhole EMM019
(MA96740). Like sample EMMD075-205.3m, temperature calculations from this
sample (mean = 315°C) are comparable to others and it appears that barite and
chalcopyrite w 34S
values suggest that the mineral may have experience some degree of reequilibrium at
sub-mm scales. Sample EMMD052-285.85m is similar to EMMD05-205.3m in that it
has an equilibrium temperature (335°C) similar to other samples, but does not fall on
the E1 South trend. Again, this is probably due to local variation in 224SO / H S mole
ratio. In conclusion, it appears that the assumption of isotopic equilibrium for
temperature calculation is valid for most samples. Despite local variations, the overall 2
24SO / H Smole ratio is fairly consistent, and it is clear from both the pH- 2Of and
34 S plots that the sulfur minerals from E1 North originated from distinct 34 S
values to those in E1 South.
Fluid sources Stage 2a
18Ofluid of +8.4 to +10.9‰ (Fig. 4.13) for pre-ore quartz-magnetite
(Stage 2a) is within that of metamorphic waters derived from igneous rocks, sandstones
or volcanogenic sedimentary rocks (+3 to +25‰; Fig. 4.20; Taylor, 1974), but also
Chapter 4: Fluid Evolution
215
overlaps with the upper limit of magmatic waters (+5 to +9‰; Fig.4.20); they are much
lower than metamorphic waters derived from shales, limestones and cherts (+15 to 18O values found in
18Ofluid estimates
overlap with those from Ernest Henry, Osborne, Eloise and Mount Elliott (Fig. 4.20),
but are slightly higher than Starra (+5 to +8‰).
The halite-rich inclusions from FIA-1A hosted in Stage 2a quartz were heterogeneously
trapped from a fluid that was supersaturated in halite. In order for such a supersaturated
fluid to exist at the calculated isotopic equilibrium temperature range of 450–550°C, the
fluid would have to have a salinity of at least 50 wt% NaCleq (Sourirajan and Kennedy,
1962). This high salinity fluid could be an early magmatic aqueous fluid (Sillitoe,
2010), or metamorphic water that has dissolved halite in the country rocks, or
magmatically-heated bittern brine (e.g. Hardie et al., 1982; Barton and Johnson, 1996;
Hammerli et al., 2014).
The Stage 2a 18Ofluid values disprove a metamorphic fluid hypothesis, as the +8 to
+11‰ range at the E1 Group is not compatible with the +15 to +35‰ range of
metamorphic fluids derived from shales, limestones and cherts (Fig. 4.20) associated
with evaporite rocks (i.e. the Corella Formation). In addition, most halite would not be
preserved in the Corella Formation host rocks by the time of E1 Group mineralisation in
local D3 / regional D4 (Tompkins, A., pers. comm.; Hammerli et al., 2014). Involvement
of shallow basinal brines waters cannot be excluded based on Stage 2a minimum 18Ofluid values close to +8‰. The maximum values close to +11‰, however, suggest
that such a basinal component is minor. Based on the above reasons, a magmatic-
hydrothermal fluid is believed to be more likely for Stage 2a.

Chapter 4: Fluid Evolution
216
Figure 4.20: 18 d composition of Cloncurry IOCG deposits and regional Na-Ca alteration.
18 Meteoric water line and ranges of magmatic and metamorphic waters are from Taylor (1974). The horizontal hashed area in the metamorphic range corresponds to metamorphosed sandstones and volcanogenic sedimentary rocks, while the diagonal hashsed area represents metamorphosed shales, limestones and cherts. Metamorphosed igneous rocks span the entire metamorphic water range. See Table 4.6 for deposit references; regional Na-Ca range is from Mark et al. (2006a)
Stage 3 The value of 34 S at E1 North (~ +4.5‰) is consistent with that of sulfur in
magmatic-hydrothermal systems (+1 to +8‰; Seal, 2006 and references therein), but is
noticeably higher than juvenile magmatic sulfur (0‰). This may be due to assimilation
of sedimentary country rocks into the source magma. Given the late 1456 ± 44 Ma age
of syn-ore monazite presented in Chapter 2, it is possible that this magma would be
associated with the Williams-Naraku Batholith. This is compatible with the
interpretations of magmatic involvement by other workers at the nearby Ernest Henry
(Kendrick et al., 2007) and Monakoff (Williams et al., 2015) deposits. The low salinity
of Stage 3 FIA-2A inclusions may be compatible with late-stage magmatic-
hydrothermal fluids (Sillitoe, 2010), but may also have formed by dilution with a less
saline, external, fluid. The E1 North bulk 34 S value is distinct from the high 34 S
value of E1 South (+15.9‰), which is more consistent with sulfur derived from, or
equilibrated with, an evaporitic source. Such a source is also consistent with Ernest

Chapter 4: Fluid Evolution
217
Henry, which appears to have received input of nearer-surface halite dissolution brines
along with the magmatic fluid (Kendrick et al. 2007). Williams et al. (2015) interpreted
a distinct, reduced, fluid at Monakoff, but suggested it could represent either the
evolution of the magmatic fluid, or input of an external fluid. The reduced fluid may be
related to the local Cover Sequence 3 host rocks (metabasalt, gabbro, and schist) that are
not present at the E1 Group or Ernest Henry.
A two-fluid mixing model - - of 34 S for the individual systems
(E1 North: +4 to +5‰; E1 South +15.9‰. The spread of over 10‰ between these
orebodies, coupled with the decrease in salinity between stages 2a and 3, are not easily
reconciled by a single fluid, or by mixing of magmatic and non-magmatic brines.
Instead, the difference between 34 S in E1 North and E1 South (and presumably
between E1 East) may be explained by a two-fluid mixing model that involves a saline
magmatic fluid and a low-salinity, shallower, fluid. However, as is discussed below, it
is possible that oxidized sulfur was supplied by one or both fluids. The E1 Group can be
classified as an example of a hybrid magmatic-non-magmatic IOCG deposit (e.g. Hunt
et al., 2007).
In the two-fluid model, the dominant fluid at E1 North, denoted as Fluid 1, is 34S
values of +4 to +5‰ of E1 North, the presence of hypersaline FIA-1A inclusions in
Stage 2a quartz, and the prevalence of F-rich phases, fluorapatite and fluorite, in the
paragenetic sequence (Chapter 2). This magmatic fluid was probably derived from an
evolved, alkaline, A-type granite, which can explain the anomalous U-REE
concentrations in E1 Group ores (see Chapter 2 and Chapter 3); it is speculated to be
related to the Williams-Naraku Batholith. Geochemical data from the Williams-Naraku
granites suggests that the magmas were magnetite-bearing and relatively oxidized, and
would have presumably carried sulfur as H2S and SO2 (Wyborn, 1998). Therefore, as
previously described, cooling of the exsolved fluid would result in hydrolysis of SO2 to
H2S and 24SO - 4.17 - 4.18)
diagrams provide evidence of this process.
The second fluid (Fluid 2) 34S value of
+15.9‰ for E1 South is consistent with that of sulfur either derived from, or
Chapter 4: Fluid Evolution
218
equilibrated with, evaporitic Mesoproterozoic sedimentary rocks (Canfield, 2004; Seal,
2006), which have been documented in the Corella Formation and its temporal
equivalents throughout the Eastern Fold Belt by earlier workers (Blake and Stewart, 34S of +12‰ measured in this study of carbonate-
associated sulfate (CAS) from unmineralised Corella Formation marble. It is proposed 34S values of E1 South can be explained by interaction with
Fluid 1, present at E1 North, with a second, oxidized, fluid carrying sulfate derived
from, or equilibrated with, the Corella Formation during dissolution and metasomatism
of the calcareous and evaporitic protolith. This is consistent with both textural and
geochemical evidence presented in Chapter 2 that indicates that much of the E1 Group 34S values of +8.5 to +20.1‰ of
pre-ore pyrite at E1 South, which are much heavier than pyrite from E1 North, suggest
that this process was continuous through the paragenetic evolution of the system.
The presence of Fluid 2 is further corroborated by FIA-2B inclusions in Stage 3 barite
and carbonate. The low-moderate salinity and CaCl2-NaCl-H2O composition of these
inclusions are consistent with basinal or fluids (Davisson and Criss, 1996; Hardie et al.,
2003). The absence of FIA-2A inclusions in the E1 South barite samples and abundance
of FIA-2B inclusions is consistent with the isotopic evidence of progressively-
increasing dominance of the Corella Formation-derived fluid toward E1 South. Low-
salinity, FIA-2A, primary inclusions in E1 North barite probably represent the diluted
product of mixing of Fluid 1 with Fluid 2. Furthermore, the higher CaCl2 content of the
E1 South FIA-2B inclusions may be the result of greater basinal fluid component, or an
increase in Ca2+ caused by extensive dissolution of the host Corella Formation marble.
The signature of Fluid 2 suggests derivation from the Corella Formation itself, but as
previously mentioned, this unlikely given the relative timing of ore formation after peak
metamorphism. It is probable that most of the connate fluids originally present in the
Corella Formation limestones and evaporites were expelled by D4 time. For this reason,
it is more likely the isotopic signature of the Corella metasedimentary rocks were
imparted into an external fluid that passed through the Corella Formation. Such a fluid
may have come from basinal water closer to the surface, but isotopic reequilibrium by
the fluid or local host rock interaction precludes anything other than speculation about
its original source. Equilibration between the fluid-poor Corella and an external fluid
Chapter 4: Fluid Evolution
219
(presumably CO2 - poor) may also partly explain the lack of CO2 present in the
mineralising fluid(s).
The addition of 24SO from the Corella Formation into mineralising fluid system, would
shift the SO2 disproportionation reaction to the left, forming more SO2 and
simultaneously increasing 234 SO until it has equilibrated with Corella Formation-
derived 24SO . It appears that this process could have happened over a short distance, as
one sample from E1 North, EMMD153-277.5 34Ssulfide values (+13
to +14‰) than other E1 North samples (mean = –0.7‰, 1
in less-altered, barite-poor, Corella Formation marble less than 500 m from the heavily
barite-fluorite-magnetite-sulfide-altered core of the E1 North orebody. When
considering E1 South 34S was re-
equilibrated rapidly as it permeated through the Corella Formation, resulting in a near 34S. The intensity of metasomatism and shearing at E1 North has made it
difficult to map out the full extent of Corella Formation marble horizons. It is likely that
the more altered barite-fluorite-rich zone of E1 North was infiltrated by higher volumes
of magmatic fluid, therefore limiting the isotopic contribution of Corella
metasedimentary rocks. Input of sulfate from the Corella Formation could account for
the increase in the 24SO / H2S mole ratio from E1 North to South.
Alternatively, it is possible that only Fluid 1 carried sulfur. The increase in 34 S
towards E1 South and E1 East could instead be the result of progressive oxidation by
Fluid 2. In this hypothesis, the magmatic fluid would most likely need to be reduced,
and the most abundant sulfur species would be H2S (rather than SO2). The
unidirectional oxidation of H2S to 24SO would cause enrichment of 34S in the H2S
reactant, and 34S depletion in the 24SO product. Continued oxidation would follow a
Rayleigh distillation model as progressive enrichment of the reactant causes enrichment
of 24SO (Seal, 2006). The Rayleigh model can be described by the equation:
34 34f ifluid fluid ,
24SO and H2S, and f is the fraction of the
fluid H2S remaining.

Chapter 4: Fluid Evolution
220
To the author’s knowledge, the kinetic or equilibrium fractionation factor for this
reaction has not been published. However, assuming it is comparable to the equilibrium
fractionation factor of 1.019 for 24SO 2S at 300°C (Ohmoto and Lasaga, 1982),
34Sffluid 34S value from E1
South at values of f 34S of +4‰ for 34Sifluid. 34S values of E1 South are also consistent with
such a Rayleigh model. Furthermore, the low values of vein-hosted barite are also
compatible with sudden increases in 2Of 34S from Stage 2 pyrite to
Stage 3 chalcopyrite at E1 North is also indicative of increasing oxygen fugacity 34S values of sample EMMD153-277.5m would suggest
that this process happened rapidly as the magmatic fluid permeated the calcareous rocks
at E1 North.
34S for the bulk fluid was
constant throughout the mineralising process, which would invalidate - -
diagrams of E1 South. On the other hand 34S in
chalcopyrite between the E1 North orebody (mean = –0.7‰) and sample EMMD153-
277.5 (+13.9‰) may suggest that the oxidation reaction took place quickly enough to 34S in E1 South. Furthermore, the linearity of these plots
and apparent isotopic equilibrium of alteration samples indicates that such a process
involved substantial isotopic exchange between the reactant H2S and product 24SO .
Ideal Rayleigh models do not permit such exchange, and consequently a batch
distillation model shown in the equation below would more accurately describe the
process (e.g. Valley, 1986; Zheng, 1990).
2-34 34 4
2
SOf ifluid fluid H S×1000 ln
This model predicts a f34fluid value around 2‰ lower than the Rayleigh model for a
given f value.
Although the batch distillation model for H2S oxidation may account for the higher E1 34S values, it implies that the original magmatic fluid was relatively
reduced, which is not consistent with the highly oxidized, U-F-rich geochemistry of
Williams-Naraku granites northeast of Cloncurry (Wyborn, 1998). Furthermore, the

Chapter 4: Fluid Evolution
221
34S value of the bulk fluid for E1 North is slightly higher than ideal magmatic
sulfur (0‰), which suggests incorporation of sulfur from oxidized sedimentary rocks
into the magma. Though there is some evidence of sulfur oxidation, it is not clear that
this was the dominant process which resulted in th 34S values.
Indeed, when adjusting in the pH- 2Of range (Fig. 4.19) for the estimated 34 S
values, it suggests that changes in 2Of were in the order of 1–2 log units, except during
vein formation. Finally, if such a reduced fluid had passed through the carbonaceous
metasiltstones of E1 South and E1 East, it seems unlikely that sufficient oxidation
would take place to caused mineralisation in these rocks. It is more likely that the 34S between E1 North, E1 East, and E1 South is a
combination of both scenarios, in which an oxidized, evolved magmatic fluid interacted
with a more-oxidized sulfate-bearing fluid that equilibrated with sulfur in the Corella
Formation. More data focusing on detailed spatial and lithological isotopic distributions
would be necessary to test the validity of the hydrolysis and distillation models.
Precipitation mechanisms The deposition of ore minerals can be brought upon by changes in temperature, pH,
oxygen fugacity, salinity, fluid phase, or a combination thereof, which ultimately shift
the stability of the ore components into insoluble regimes. These changes can be caused
by fluid upwelling, wall rock interaction, or mixing with one or more other fluids. The
sulfur isotope and fluid inclusion data discussed above indicate that ore genesis at the
E1 Group involved a substantial component of fluid mixing, which initiated salinity and
temperature drop, and possibly an increase in 2Of . Changes in 2Of have a major
influence in ore mineralogy in some IOCG deposits, such as Olympic Dam (Oreskes
and Einaudi, 1990; Haynes et al., 1995), which is reflected in transitions from
magnetite-chalcopyrite zones to hematite-bornite zones (e.g. Fig. 4.19). The sulfur
isotope data of E1 Group barite and chalcopyrite, however, fall into a limited range of
2Of conditions, which suggests that these parameters were relatively stable throughout
the system, and were not the most important factor in causing chalcopyrite precipitation,
despite the possible effect on isotopic shift between E1 North and South. In contrast to
chalcopyrite, the observed oxidation shifts of 1–2 log10 units may have played a major
role in barite precipitation, especially if pH and 2Of conditions were near the barite
stability boundary. Nevertheless, the similar proportions of barite, fluorite, chalcopyrite

Chapter 4: Fluid Evolution
222
and magnetite in both E1 North and South (Fig. 2.20) indicate that oxygen fugacity was
not substantially different between the systems.
The exceptions to this are ores hosted in the carbonaceous metasiltstone unit present at
E1 South and East. At E1 South, the metasiltstone grades upward to a carbonaceous
schist that is unmineralised. The metasiltstone hosts magnetite and chalcopyrite
alteration, in addition to pyrrhotite and arsenopyrite, but does not contain any sulfate
minerals. This unit clearly acted locally as a reductant to the ore fluids passing through
it, but it is not structurally or stratigraphically linked to the marble unit and
consequently did not react with those fluids. It is interesting that some of the highest 34S values (+20 and +17‰) measured in the E1 Group are from
34S values overlap with the
wide range of sedimentary sulfide from –50 to +40‰ (Seal, 2006 and references
therein), and thus the simplest exp 34S values
are inherited locally from the host rock. Alternatively, reduction of a fluid with a high 34 34S values for pyrite and chalcopyrite in
the carbonaceous rocks.
Ohmoto and Lasaga (1982) concluded that in hydrothermal systems below 350°C,
temperature changes alone are not a major factor in the deposition of cogenetic sulfide
and sulfate minerals, and instead invoke mixing as a significant driver. In a mixing
system, dilution of the high-salinity magmatic fluid, Fluid 1, with the relatively less-
saline Corella Formation-derived fluid, would result in a substantial salinity decrease
that could destabilize the Fe- and Cu chlorine complexes and lead to mineralisation.
This is consistent with the observed salinity decrease between Stage 2a quartz-hosted,
FIA-1A inclusions, and Stage 3 barite-hosted, FIA-2A inclusions. The fluid mixing
model also explains the presence of barite. If the Corella Formation-hosted fluid was
more oxidized than the magmatic fluid, some oxidation of H2S may have occurred. The
mixing process was probably not uniform across space and time in the deposit, and may
have taken place in multiple cycles. This is evidenced by the fluorite-hosted FIAs
identified by Williams et al. (2015), which are probably slightly later than the primary
FIAs in barite, and which may represent renewed input of this higher-salinity,
magmatic-hydrothermal F-rich, Fluid 1 into the system. This could also explain the
observed 34S values within individual fine-grained,
alteration-hosted, samples that results in non- 34S diagrams.
Chapter 4: Fluid Evolution
223
Metal sources Potential metal source(s) for the E1 Group ores can be inferred from a combination of
mineralogical, fluid inclusion and stable isotope evidence. The highly F-rich and U-
REE anomalous nature of the E1 Group orebody is consistent with a source from an
evolved alkaline magma. In addition, the E1 North orebody, which is characterised by a
magmatic isotopic signature, contains the most Cu and Au of the three orebodies. For
these reasons, Cu, Au, F, P, U, and REE are interpreted to have been derived from an
evolved, Williams-Naraku-type, granite. Alternatively, some Fe, Cu, and Au may have
been leached from mafic country rocks by the magmatic fluid during earlier Na-Ca
alteration (e.g. Oliver et al., 2004; 2008); the only significant mafic rocks around the
deposit are metadolerite dykes. As previously discussed, sulfur probably came from
both the magma and Corella formation, especially if the latter contained metaevaporite
beds. The oxidized nature of the calcareous rocks leaves the magma as the only likely
source of reduced sulfur (H2S), though 24SO may have come from both sources.
The main source of Ba2+ is not clear, but it was probably not directly from a magma.
The presence of Ba-rich K-feldspar in Stage 2a alteration at the E1 Group (Chapter 2),
as well as at Ernest Henry (Mark et al., 2006b), may be a result of Ba-leaching from
igneous K-feldspar during metasomatism of the Mount Fort Constantine Volcanics. It is
speculated that barium produced in Stage 3 may have been sourced from continued
alteration of the metavolcanic rocks, as well as from overprinting of Stage 2a K-
feldspar. The Ba would have been soluble in the early high-salinity magmatic brine
prior to sulfur disproportionation, which could explain its incorporation into Stage 2a K-
feldspar. An alternative Ba source may be metaevaporite rocks in the Corella
Formation. This possibility is less likely, however, because barite alteration is restricted
to within the Cu-Au orebody and is not present in significant amounts in the less-altered
marble horizon between E1 North and E1 South. Additionally, Ba in the Corella
formation would probably already exist as barite, and would consequently be difficult to
remobilize in significant amounts during mineralisation. The relative insolubility of
fluorite suggests that Ca and F were carried by separate fluids. When considering the
extent of carbonate replacement observed in the E1 Group, it is not unreasonable to
conclude that much of the Ca and 23CO were probably locally derived from dissolution
of Corella Formation marble. This hypothesis does not require a CO2-rich fluid, and
Chapter 4: Fluid Evolution
224
could therefore help to reconcile the paucity of CO2 inclusions in the E1 Group samples
studied.
18 34S and fluid inclusion data from pre-ore and ore-stage minerals
indicate that ore was precipitated mainly by salinity decrease, and possibly oxidation,
caused by mixing of a high-salinity, oxidized, magmatic fluid (Fluid 1) with a lower-
salinity, fluid (Fluid 2) derived from an external source and equilibrated with the local
Corella Formation metasedimetary rocks. Such a fluid may have originated from
shallower basinal waters, or possibly even meteoric sources (e.g. Kerrich et al., 1984),
prior to incorporating Corella Formation sulfur; the external fluid was also oxidized.
The magmatic fluid is the proposed source of Cu, Au, H2S, F, U, REE, and probably24SO , while Fluid 2 probably carried Ca and 2
4SO . The source of barium is
ambiguous, but may have been leached from the intermediate-felsic Mount Fort
Constantine metavolcanic rocks during early albitisation and potassic metasomatism.
This mixing model is combined with the structural aspects from Chapter 3 and
presented visually in Figure 5.1.
Implications IOCG genesis and regional comparisons The fluid inclusion and isotopic characteristics of pre-ore and ore-stage fluids of the E1
Group are similar to those in other IOCG deposits, but have some differences. The high-
salinity, FIA-1A Fluid Inclusion Assemblage observed at the E1 Group is similar to
fluid inclusion populations reported in most IOCG deposits (Table 4.6) in the Cloncurry
District, and in other districts (Hunt et al., 2007). Such hypersaline waters (> 50 wt%
NaCleq) are probably capable of mobilizing a variety of elements, which can help to
explain the broad suite of anomalous elements in IOCG deposits like the E1 Group
(Chapter 2). The basinal, NaCl-CaCl2-rich fluid inclusions described by Xu (2000), and
present across the Eastern Fold Belt, are abundant at the E1 Group, and probably
represent direct evidence of another fluid which could have caused dilution of the
hypersaline magmatic fluid to drive ore precipitation.
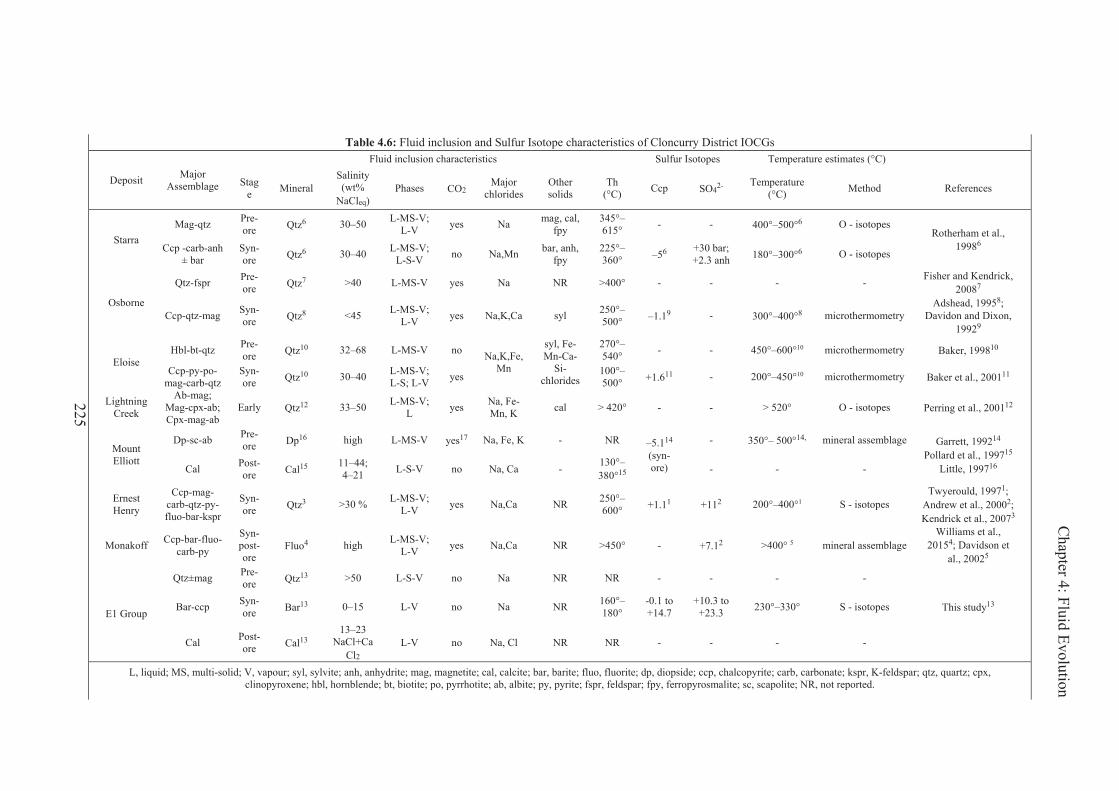
225
Table 4.6: Fluid inclusion and Sulfur Isotope characteristics of Cloncurry District IOCGs
Deposit Major Assemblage
Fluid inclusion characteristics Sulfur Isotopes Temperature estimates (°C)
Stage Mineral
Salinity (wt%
NaCleq) Phases CO2 Major
chlorides Other solids
Th (°C) Ccp SO42- Temperature
(°C) Method References
Starra Mag-qtz Pre-
ore Qtz6 30–50 L-MS-V;L-V yes Na mag, cal,
fpy 345°– 615° - - 400°–500°6 O - isotopes
Rotherham et al., 19986 Ccp -carb-anh
± bar Syn-ore Qtz6 30–40 L-MS-V;
L-S-V no Na,Mn bar, anh, fpy
225°– 360° –56 +30 bar;
+2.3 anh 180°–300°6 O - isotopes
Osborne
Qtz-fspr Pre-ore Qtz7 >40 L-MS-V yes Na NR >400° - - - - Fisher and Kendrick,
20087
Ccp-qtz-mag Syn-ore Qtz8 <45 L-MS-V;
L-V yes Na,K,Ca syl 250°– 500° –1.19 - 300°–400°8 microthermometry
Adshead, 19958; Davidon and Dixon,
19929
Eloise Hbl-bt-qtz Pre-
ore Qtz10 32–68 L-MS-V no Na,K,Fe,Mn
syl, Fe-Mn-Ca-
Si-chlorides
270°– 540° - - 450°–600°10 microthermometry Baker, 199810
Ccp-py-po-mag-carb-qtz
Syn-ore Qtz10 30–40 L-MS-V;
L-S; L-V yes 100°– 500° +1.611 - 200°–450°10 microthermometry Baker et al., 200111
Lightning Creek
Ab-mag; Mag-cpx-ab; Cpx-mag-ab
Early Qtz12 33–50 L-MS-V;L yes Na, Fe-
Mn, K cal > 420° - - > 520° O - isotopes Perring et al., 200112
Mount Elliott
Dp-sc-ab Pre-ore Dp16 high L-MS-V yes17 Na, Fe, K - NR –5.114
(syn- ore)
- 350°– 500°14, mineral assemblage Garrett, 199214 Pollard et al., 199715
Little, 199716 Cal Post-ore Cal15 11–44;
4–21 L-S-V no Na, Ca - 130°–380°15 - - -
Ernest Henry
Ccp-mag-carb-qtz-py-fluo-bar-kspr
Syn-ore Qtz3 >30 % L-MS-V;
L-V yes Na,Ca NR 250°–600° +1.11 +112 200°–400°1 S - isotopes
Twyerould, 19971; Andrew et al., 20002; Kendrick et al., 20073
Monakoff Ccp-bar-fluo-carb-py
Syn-post-ore
Fluo4 high L-MS-V;L-V yes Na,Ca NR >450° - +7.12 >400° 5 mineral assemblage
Williams et al., 20154; Davidson et
al., 20025
E1 Group
Qtz±mag Pre-ore Qtz13 >50 L-S-V no Na NR NR - - - -
This study13 Bar-ccp Syn-ore Bar13 0–15 L-V no Na NR 160°–
180° -0.1 to+14.7
+10.3 to+23.3 230°–330° S - isotopes
Cal Post-ore Cal13
13–23 NaCl+Ca
Cl2 L-V no Na, Cl NR NR - - - -
L, liquid; MS, multi-solid; V, vapour; syl, sylvite; anh, anhydrite; mag, magnetite; cal, calcite; bar, barite; fluo, fluorite; dp, diopside; ccp, chalcopyrite; carb, carbonate; kspr, K-feldspar; qtz, quartz; cpx, clinopyroxene; hbl, hornblende; bt, biotite; po, pyrrhotite; ab, albite; py, pyrite; fspr, feldspar; fpy, ferropyrosmalite; sc, scapolite; NR, not reported.
Chapter 4: Fluid Evolution
Chapter 4: Fluid Evolution
226
The E1 Group is unique among the deposits in the area in that it lacks CO2 - rich fluid
inclusion populations. Given the extensive deformation of Stage 2a quartz, it is possible
that these inclusions are simply not well-preserved in the few samples analysed.
Alternatively, the apparent absence of CO2 may account for the observed textural
differences between the E1 Group and Ernest Henry deposits. In Chapter 3, it was
proposed that the E1 Group was subjected to less fluid overpressure (that is, the
difference between hydrostatic and lithostatic pressure was lower) than Ernest Henry,
and as a consequence there was insufficient force to initiate a fluidized brecciation
process as described by Oliver et al. (2006) and Bertelli and Baker (2010). Those
authors concluded that CO2 release from Williams-Naraku granites contributed to most
of the fluid overpressure at Ernest Henry and regional, unmineralised, breccias. Instead,
fluid pressure at the E1 Group was low enough for permeability generated by shearing
to accommodate much of the exsolved magmatic fluids. Oliver et al. (2008) suggested
that the CO2 probably originated from mafic magmas in the mantle, which subsequently
rose and mixed with Williams-Naraku magmas. It is not clear why CO2 may have been
absent in the case of the E1 Group, but a possible explanation may be simply that the
granitic precursor melt did not interact with mafic magmas.
While E1 Group FIAs are mostly comparable to regional IOCG fluid inclusions, the 34S values of E1 North chalcopyrite
and pyrite are similar to those of Ernest Henry, Starra, Osborne and Eloise (Fig. 4.21).
E1 East and South, however, are characterise 34S than any
other system in the region. Sulfate data for the region is limited, but E1 Group barite is
similar to that in Ernest Henry (Fig. 4.21C). Barite at Starra (+30‰) is characterised by 34S values to E1 South barite, but Starra anhydrite values are much lower
(+2‰). It is worth noting that Ernest Henry is the only other system with a spread in 34S values (>15‰) comparable to E1 East and South (Fig. 4.21). In that deposit the
higher chalcopyrite and pyrite values are below the economic orebody in the footwall 34S values are associated with Corella
Formation marbles, which compose much of the footwall sequence at Ernest Henry. 34S values between deposits, ore formation temperature estimates
overlap between most of them (Fig. 4.21D).
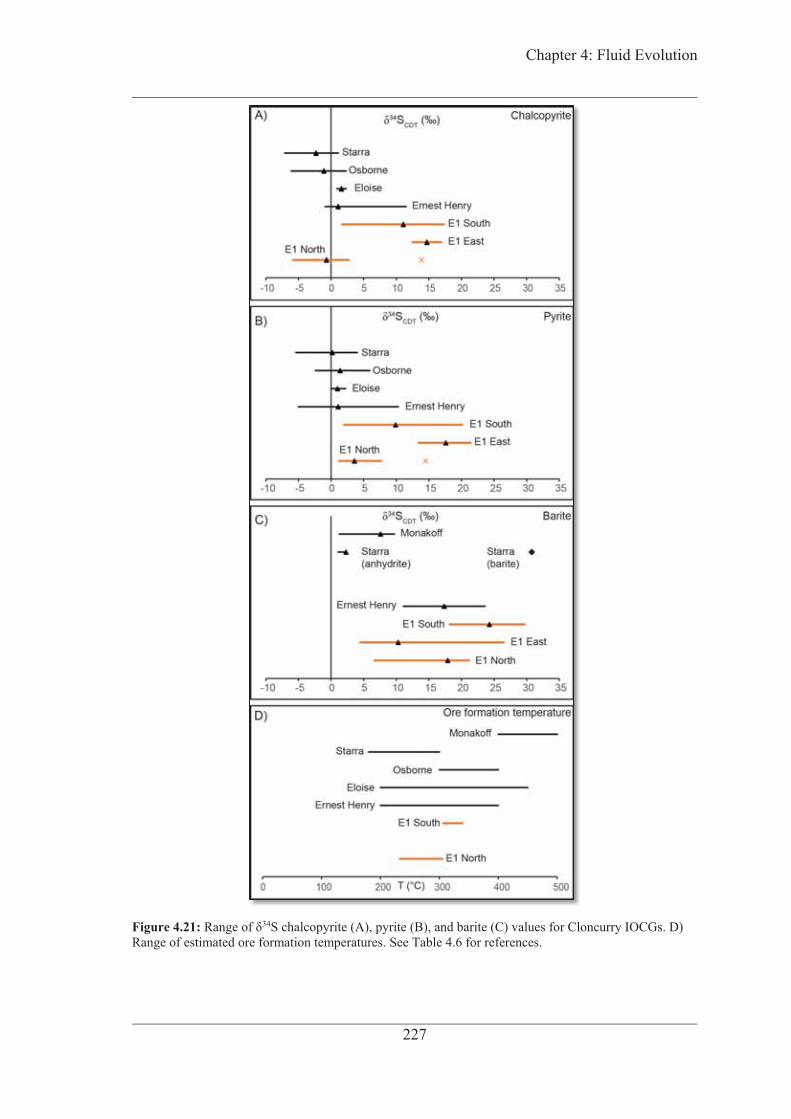
Chapter 4: Fluid Evolution
227
Figure 4.21: 34S chalcopyrite (A), pyrite (B), and barite (C) values for Cloncurry IOCGs. D) Range of estimated ore formation temperatures. See Table 4.6 for references.

Chapter 4: Fluid Evolution
228
34S values at the E1 Group and Ernest Henry appear to reflect a
substantial amount of wall rock and external fluid interaction. This suggests that the
orebodies in some of the other deposits are much closer to their potential source
magmas than the E1 South and E1 East ore zones, or that the ore fluids passed through
markedly different host rocks prior to deposition, or both. The E1 Group as a whole
may represent an oxidized end-member to this process, in which an oxidized magmatic
fluid permeated oxidized metasedimentary rocks (e.g. marble). It is proposed that the
Eloise Cu-Au deposit may represent another end-member. In contrast to the E1 Group,
Eloise contains magnetite but is dominated by pyrrhotite and pyrite, indicating a
reducing environment during ore deposition (Baker, 1998; Baker et al., 2001). Eloise is
also different in that it is hosted in metasedimentary and mafic rocks of the Soldiers Cap
Group of Cover Sequence 3 (Baker, 1998), which include the graphitic pelites and
mafic rocks of the Toole Creek Volcanics. Fluids in both deposits, however, are
interpreted to be mostly magmatic in origin (Baker et al., 2001). It is possible that a
Williams-Naraku-related granite, initially oxidized, passed through these reduced rocks
and was altered to a low 2Of state by the time the Eloise ores were precipitated. This is
consistent with the interpretation by Baker (1998) that Eloise is a distal magmatic
deposit. Thus, Cu-Au mineralisation in the Eastern Fold Belt may represent a
continuum of magmatic-hydrothermal systems, in which the oxidation state of the local
country rocks plays a major role in ultimately developing either a true IOCG such as the
E1 Group, or an iron sulfide-Cu-Au deposit (ISCG) like Eloise.
Global comparisons The fluid mixing model of the E1 Group is compatible with genetic models of IOCGs in
other districts, including the Gawler Craton, Punta del Cobre and Carajás. At the
Olympic Dam (Gawler Craton) deposit, McPhie et al. (2011b) linked the high fluorine
enrichment in the orebody to a magmatic-hydrothermal fluid derived from coeval, F-
rich, granites; this fluid mixed with a shallower (basinal or near-surface) fluid during
ore genesis (e.g. Haynes et al., 1995; Reynolds, 2000; McPhie et al., 2011a). Mixing of
a deep-seated magmatic fluid with an external fluid has also been proposed for
Candelaria, Mantoverde and Sossego (Chapter 1), but there is interpreted variation in
the relative ratios of these types of fluids between deposits. For example, Mantoverde
(Coastal Cordillera) may have been dominated by non-magmatic fluids (mostly basinal
brines) during mineralisation (Benavides et al., 2007), while Sossego (Carajás) and
Chapter 4: Fluid Evolution
229
Candelaria (Coastal Cordillera) were characterised by relatively higher magmatic-
hydrothermal input. Indeed, as demonstrated above for the E1 Group, the degree of
involvement of magmatic and non-magmatic fluids can vary even within an individual
deposit. The fluid evolution of the E1 Group thus provides additional evidence of the
hybrid magmatic and non-magmatic fluid source model for IOCG deposits and, when
coupled with comparisons to other deposits, suggests that few IOCG systems are
exclusively magmatic or non-magmatic.
Exploration The genetic model of the E1 Group can provide insight into the features of a prospective
IOCG system. For example, the combination of fluid inclusion and stable isotope data
indicate that ore precipitation was caused primarily by a decrease in salinity, and
possibly an increase oxidation state, as the result of mixing between a magmatic fluid
and another fluid probably derived from a shallow connate fluid. This is in contrast to
unmineralised Fe-oxide-rich systems like Lightning Creek, which were dominated
almost entirely by magmatic fluids. In the case of the E1 Group, the mixing process
generates the most copper and gold at the intersection of a shear zone with another
conduit such as a fold hinge, which enables such shallow fluids to permeate deep
enough to interact with a magmatic fluid at depth (>6 km). Fold hinges alone can still
focus economic mineralisation. Marbles and metaevaporitic rocks, such as those in the
Corella Formation, may have lost most of their original connate waters prior to
mineralisation 34S signature on the ore
assemblage in systems like E1 South. Furthermore, they can act as a chemical trap for
ores over distances of at least 1–2 km along strike.
Sulfur isotopes of sulfides and sulfates may serve as potential vectors to the high-grade
centers of these mixed magmatic- 34S values
of chalcopyrite at E1 North (–5.8 to +2.7‰), the largest orebody in the E1 Group, are
mostly consistent with sulfur isotopes from other magmatic-dominated Cu-Au deposits
in the Eastern Fold Belt such as Ernest Henry and Eloise. These values increase away
from the E1 North orebody to E1 East and South. A similar trend may be observed at 34S values decrease from the sub-economic footwall into the ore
zone (Twyerould, 1997). Thus, zones with calculated 34 S values between ~0 and
+7‰ may represent the high-grade, magmatic fluid-dominated 34 S , hydrothermal

Chapter 4: Fluid Evolution
230
centers. However, it is cautioned that much more isotopic data is needed over greater
distances to fully verify these trends, as well as to better understand the rate at which
sulfur isotope fractionation changes in space. In-situ isotopic analysis via SHRIMP may
be necessary to obtain accurate results in fine-grained alteration samples for IOCG
deposits characterised by replacement-style orebodies, such as E1.
Conclusions Fluid inclusion and stable isotope data reveal a complex ore genesis process in the E1
Group of IOCG deposits. Pre-ore fluids, hosted in quartz associated with the main phase
of Fe-oxide input, are characterised by hypersalinity and an oxygen isotope signature
that together suggest a dominantly magmatic origin. In contrast, ore-stage fluids, hosted
in barite associated with chalcopyrite, are characterised by a lower salinity and mixed
sulfur isotope signatures. The E1 Group can therefore be placed into the mixed
magmatic-non-magmatic family of IOCG deposits. E1 North ore-bearing fluid is
dominated by a magmatic sulfur signature with oxidized sediment input, while E1 South
has a much heavier isotopic signature resulting from contribution of sulfur from
metasedimentary host rocks in the Corella Formation and an external fluid which
equilibrated with these rocks and obtained their isotopic signature. Alternatively, but
less likely, the higher E1 South signature could be caused by batch distillation through
oxidation of a reduced magmatic fluid by the oxidized metasedimentary rocks of the
Corella Formation. The most likely scenario involves a combination of both processes.
Ore precipitation was probably caused by a salinity decrease that resulted from mixing
of the hypersaline magmatic fluid with the less-saline external fluid – possibly of
basinal or meteoric origin. Barite precipitation was probably driven by a combination of
sulfate input from mixing with the Corella Formation-derived fluid, hydrolysis of
magmatic SO2, and minor variations in oxygen fugacity caused by fluid mixing. The
magmatic fluid was most likely derived from an oxidized, evolved, F-U-REE-bearing,
and alkaline, A-type granite. It is speculated that such a granite was related to the 1550–
1490 Ma Williams-Naraku Batholith. Barium may have been derived from evaporites in
the Corella, or from leaching of feldspars in the abundant Mount Fort Constantine
Volcanics. The variation in sulfur isotope signature between E1 North, the largest and
most concentrated orebody in the E1 Group, and E1 South, suggests that sulfur isotopes
may be useful for vectoring to the magmatic-dominated, high-grade, centers of
economic mineralisation.
Chapter 4: Fluid Evolution
231
References
Abu Sharib, A.S. a. a., and Bell, T.H., (2011). Radical changes in bulk shortening directions during orogenesis: Significance for progressive development of regional folds and thrusts: Precambrian Research, 188, p.1–20.
Adshead, N. D., (1995). Geology, Alteration and Geochemistry of the Osborne Cu-Au Deposit, Cloncurry District, N.W. Queensland, Australia: PhD thesis, James Cook University, QLD, Australia.
Adshead-Bell, N., (1998). Evolution of the Starra and Selwyn high-strain zones, Eastern fold belt, Mount Isa Inlier; implications for Au-Cu mineralisation: Economic Geology, 93, p.1450–1462.
Andrew, A. S., Whitford, D. J., Carr, G. R., Denton, G. J., Korsch, M. J., and Parr, J. M. (2000). Barite in the Mount Isa Inlier and McArthur Basin: in AMIRA P480 User Friendly Isotope Technologies in Mineral Exploration Final Report: Division of Exploration and Mining, CSIRO, North Ryde, NSW, 44p.
Baker, T., (1996). The geology and genesis of the Eloise Cu-Au Deposit, Cloncurry District, N.W. Queensland, Australia: unpublished Ph. D. Thesis, James Cook University, 1996.
Baker, T., (1998). Alteration, mineralisation, and fluid evolution at the Eloise Cu-Au deposit, Cloncurry District, northwest Queensland, Australia: Economic Geology, 93, p.1213–1236.
Baker, T., Mustard, R., Fu, B., and Williams, P., (2008). Mixed messages in iron oxide-copper-gold systems of the Cloncurry district, Australia: insights from PIXE analysis of halogens and copper in fluid inclusions: Mineralium Deposita, 43, p.599–608.
Baker, T., Perkins, C., Blake, K. L., and Williams, P. J., (2001). Radiogenic and stable isotope constraints on the genesis of the Eloise Cu-Au deposit, Cloncurry district, northwest Queensland: Economic Geology, 96, p.723–742.
Barton, M.D., and Johnson, D. A., (1996). Evaporitic-source model for igneous-related Fe oxide-(REE-Cu-Au-U) mineralisation: Geology, 24, p.259.
Barton, M.D.and Johnson, D.A., (2000). Alternative Brine Sources for Fe-Oxide (-Cu-Au) Systems: Implications for Hydrothermal Alteration and Metals: in Porter, T.M. (ed.), Hydrothermal Iron Oxide Copper-Gold and Related Deposits: A Global Perspective: PGC Publishing, 1, Adelaide, p.43–60.

Chapter 4: Fluid Evolution
232
Barton, M.D. and Johnson, D.A., (2004). Footprints of Fe-oxide(-Cu-Au) systems. Society of Economic Geologists 2004: Predictive Mineral Discovery Under Cover: Centre for Global Metallogeny, Spec. Pub. 33: The University of Western Australia, p.112–116.
Benavides, J., Kyser, T. K., Clark, A. H., Oates, C. J., Zamora, R., Tarnovschi, R., and Castillo, B., (2007). The Mantoverde iron oxide-copper-gold District, III Región, Chile: The role of regionally derived, nonmagmatic fluids in chalcopyrite mineralisation: Economic Geology, 102, p.415–440.
Bertelli, M., and Baker, T., (2010). A fluid inclusion study of the Suicide Ridge Breccia Pipe, Cloncurry district, Australia: Implication for Breccia Genesis and IOCG mineralisation: Precambrian Research, 179, p.69–87.
Betts, P.G., Armit, R.J., Hutton, L.J., Withnall, I.W., and Donchak, P.J.T., (2011). Proterozoic Mount Isa synthesis: in Northwest Queensland Minerals and Energy Province Report, Appendix 1. Queensland Department of Employment, Economic Development and Innovation, Brisbane, 56p.
Blake, D.H., (1987). Geology of the Mount Isa Inlier and environs, Queensland and Northern Territory: Bureau of Mineral Resources, Geology and Geophysics Bulletin: 225, Department of Resources and Energy, Canberra, ACT, Australia, 83p.
Blake, D.H., Etheridge, R.J., Page, R. W., Stewart, A.J., Williams, P.R., and Wyborn, L.A.I., (1990). Mount Isa Inlier - regional geology and mineralisation: in: Hughes, F.E. (Ed.), Geology of the Mineral Deposits of Australia and Papua New Guinea: Australian Institute of Mining and Metallurgy Monagraph 14, p.915–925.
Blake, D.H. and Stewart, A.J., (1992). Stratigraphic and tectonic framework, Mount Isa Inlier: in Stewart, A. and Blake, D.H. (eds.), Detailed Studies of the Mount Isa Inlier: Australia Geological Survey Bulletin, 243, p.1–11.
Blake, K. L., Pollard, P. J., and Xu, G., (1997). Alteration and mineralisation in the Mount Fort Constantine volcanics, Cloncurry district, northwest Queensland: in: Pollard, PJ (ed.) AMIRA P438: Cloncurry Base Metals and Gold Final Report, Australian Institute of Mining and Metallurgy, 53p.
Burdett, J.W., Arthur, M.A., Richardson, M., (1989). A Neogene seawater sulfur isotope age curve from calcareous pelagic microfossils: Earth and Planetary Science Letters, 94, p.189–198.

Chapter 4: Fluid Evolution
233
Canfield, D. E., (2004). The evolution of the Earth surface sulfur reservoir: American Journal of Science, 304(10), p.839–861.
Carson, C.J., Hutton, L.J., Withnall, I.W., Perkins, W.G., Donchak, P.J.T., Parsons, A., Blake, P.R., Sweet, I.P., Neumann, N.L. and Lambeck, A., (2011). Summary of results: Joint GSQ-GA NGA geochronology project, Mount Isa region, 2009–2010: Queensland Geological Record 2011/03, Geological Survey of Queensland, Brisbane, QLD, Australia.
Chiaradia M., Banks D., Cliff R., Marschik, R., and Haller, A. d., (2006). Origin of fluids in iron oxide-copper-gold deposits: Constrai 37Cl, 87Sr/86Sr and Cl/Br: Mineralium Deposita 41, p.565–573.
Clayton, R.N., and Epstein, S., (1961). The use of oxygen isotopes in high-temperature geological thermometry: The Journal of Geology, 69(4), p.447–452.
Clayton, R. N., and Mayeda, T. K. (1963). The use of bromine pentafluoride in the extraction of oxygen from oxides and silicates for isotopic analysis: Geochimica et Cosmochimica Acta, 27(1), p.43–52.
Cole, D. R., Horita, J., Polyakov, V. B., Valley, J. W., Spicuzza, M. J., and Coffey, D. W., (2004). An experimental and theoretical determination of oxygen isotope fractionation in the system magnetite-H2O from 300 to 800°C. Geochimica et Cosmochimica Acta, 68(17), p.3569–3585.
Crerar, D. A., and Barnes, H. L., (1976). Ore solution chemistry v solubilities of chalcopyrite and chalcocite assemblages in hydrothermal solution at 200 degree to 350 degree C: Economic Geology, 71(4), p.772–794.
Criss, R.E., Gregory, R.T., Taylor Jr., H.P., (1987). Kinetic theory of oxygen isotope exchange between minerals and water. Geochimica et Cosmochimica Acta, 51, p.1099–1108.
Crowe, D.E., and Vaughan, R.G., (1996). Characterisation and use of isotopically homogeneous standards for in situ laser microprobe analysis of 34S/32S ratios: American Mineralogist, 81, p.187–193.
Davidson, G.J., Davis, B.K. and Garner, A., (2002). Structural and Geochemical Constraints on the Emplacement of the Monakoff Oxide Cu-Au (-Co-U-REE-Ag-Zn-Pb) Deposit, Mt Isa Inlier, Australia: in Porter, T.M. (ed.), Hydrothermal Iron Oxide Copper-Gold and Related Deposits: A Global Perspective: PGC Publishing, 2, Adelaide, p.49–75.

Chapter 4: Fluid Evolution
234
Davidson, G., and Dixon, G., (1992). Two sulfur isotope provinces deduced from ores in the Mount Isa Eastern Succession, Australia: Mineralium Deposita, 41, p.30–41.
Davis, B.K., Pollard, P.J., Lally, J.H., McNaughton, N.J., Blake, K., and Williams, P.J., (2001). Deformation history of the Naraku Batholith, Mt Isa Inlier, Australia: Implications for pluton ages and geometries from structural study of the Dipvale Granodiorite and Levian Granite: Australian Journal of Earth Sciences, 48, p.113–129.
Davisson, M.L., and Criss, R.E., (1996). Na-Ca-Cl relations in basinal fluids: Geochimica et Cosmochimica Acta, 60, p.2743–2752.
Duncan, R.J., Stein, H., Evans, K., Hitzman, M., Nelson, E., and Kirwin, D., (2011). Geochronological Framework for Mineralisation and Alteration in the Selwyn-Mount Dore Corridor, Eastern Fold Belt, Mount Isa Inlier, Australia: Genetic Implications. Economic Geology, 106(2), p.169–192.
Eldridge, C. S., Compston, W., Williams, I. S., Walshe, J. L., and Both, R. A., (1987). In situ microanalysis for 34S/32S ratios using the ion microprobe SHRIMP. International Journal of Mass Spectrometry and Ion Processes, 76(1), p.65–83.
Field, C. W., and Gustafson, L. B., (1976). Sulfur isotopes in the porphyry copper deposit at El Salvador, Chile: Economic Geology, 71(8), p.1533–1548.
Fifarek, R.H., Rye, R.O., (2005). Stable-isotope geochemistry of the Pierina high-sulfidation Au–Ag deposit, Peru: influence of hydrodynamics on SO42-–H2S sulfur–isotope exchange in magmatic-steam and steam-heated environments. Chemical Geology, 215, p.253–279.
Fisher, L., and Kendrick, M., (2008). Metamorphic fluid origins in the Osborne Fe oxide-Cu-Au deposit, Australia: evidence from noble gases and halogens. Mineralium Deposita, 43, p.483–497.
Foster, D., and Austin, J., (2008). The 1800-1610Ma stratigraphic and magmatic history of the Eastern Succession, Mount Isa Inlier, and correlations with adjacent Paleoproterozoic terranes: Precambrian Research, 163(1–2), p.7–30.
Garrett, S.J.M., (1992). The geology and geochemistry of the Mount Elliott copper-gold deposit, Northwest Queensland: MSc thesis, University of Tasmania, Hobart, TAS, Australia, 139p.

Chapter 4: Fluid Evolution
235
Gauthier L., Hall G., Stein H. and Schaltegger, U., 2001, The Osborne deposit, Cloncurry district: a 1595 Ma Cu-Au skarn deposit: in Williams P. J. (ed.), 2001: A Hydrothermal Odyssey, Extended Conference Abstracts: James Cook University, Townsville, QLD, Australia, p.58–59.
Gellatly, A.M., and Lyons, T.W., (2005). Trace sulfate in mid-Proterozoic carbonates and the sulfur isotope record of biospheric evolution: Geochimica et Cosmochimica Acta, 69, p.3813–3829.
Geological Survey of Queensland, (2011). Northwest Queensland Minerals and Energy Province Report. Queensland Department of Employment, Economic Development and Innovation, Brisbane, 102p.
Giles, D., Ailléres, L., Jeffries, D., Betts, P., and Lister, G., (2006). Crustal architecture of basin inversion during the Proterozoic Isan Orogeny, Eastern Mount Isa Inlier, Australia: Precambrian Research, 148(1–2), p.67–84.
Giles, D., and Nutman, A., (2002). SHRIMP U-Pb monazite dating of 1600-1580 Ma amphibolite facies metamorphism in the southeastern Mt Isa Block, Australia: Australian Journal of Earth Sciences, 49, p.455–465.
Gregory, R.T., Criss, R.E., (1986). Isotopic exchange in open and closed systems: in Valley, J.W., Taylor Jr., H.P., O’Neil, J.R. (Eds.), Stable Isotopes in High Temperature Geological Processes, Reviews in Mineralogy, 16, p.91–127.
Goldstein, R. H., and Reynolds, J.T. (1994). Fluid inclusions and their origin: in Goldstein, R. H. and Reynolds, J.T. (Eds.), Systematics of fluid inclusions in diagenetic minerals: SEPM Short Course Notes 31: Society for Sedimentary Geology, 1994, 2, p.5–21.
Groves, D. I., Bierlein, F. P., Meinert, L. D., and Hitzman, M. W., (2010). Iron oxide copper-gold (IOCG) deposits through Earth history: Implications for origin, lithospheric setting, and distinction from other epigenetic iron oxide deposits: Economic Geology, 105, p.641–654.
Hammerli, J., Spandler, C., Oliver, N.H.S., and Rusk, B., (2014). Cl/Br of scapolite as a fluid tracer in the earth’s crust: insights into fluid sources in the Mary Kathleen Fold Belt, Mt. Isa Inlier, Australia: Journal of Metamorphic Geology, 32, p.93–112.
Hardie, C. E., Eugster, H. P., and Weare, J. M., (1982). Mineral equilibria in the six-component seawater system, Na-K-Mg-Ca-SO4-Cl-HO at 250°C, II: Components of the saturated solutions: Geochimica et Cosmochimica Acta, 46, p.1603–1618.

Chapter 4: Fluid Evolution
236
Hardie, L. A, Lowenstein, T.K., Timofeeff, M.N., and Demicco, R. V., (2003). Secular variation in seawater chemistry and the origin and significance of calcium chloride basinal brines: Geological Society of America, 2003 annual meeting Seattle, WA, United States, Nov. 2–5, 2003, 35, p.201.
Haynes, D.W., (2000). Iron Oxide Copper (-Gold) Deposits: Their Position in the Ore Deposit Spectrum and Modes of Origin: in Porter, T.M. (ed.), Hydrothermal Iron Oxide Copper-Gold and Related Deposits: A Global Perspective: PGC Publishing, 1, Adelaide, p.71–90.
Haynes, D. W., Cross, K. C., Bills, R. T., and Reed, M. H., (1995). Olympic Dam ore genesis: a fluid-mixing model: Economic Geology, 90(2), p.281–307.
Hitzman, M. W. 2000. Iron oxide-Cu-Au deposits: What, where, when and why: in Porter, T. M. (ed.) Hydrothermal Iron Oxide Copper-Gold and Related Deposits: A Global Perspective: PGC Publishing, 1, Adelaide, SA, Australia, p.9–25.
Hitzman, M. W., Oreskes, N., and Einaudi, M. T., (1992). Geological characteristics and tectonic setting of Proterozoic iron oxide (Cu-U-Au-REE) deposits: Precambrian Research, 58(1–4), p.241–287.
Huberty, J.M., Kita, N.T., Kozdon, R., Heck, P.R., Fournelle, J.H., Spicuzza, M.J., Xu, H., and Valley, J.W., (2010). 18O for magnetite and hematite by SIMS: Chemical Geology, 276, p.269–283.
Hunt, J., Baker, T., and Thorkelson, D., (2007). A review of iron oxide copper-gold deposits, with focus on the Wernecke Breccias, Yukon, Canada, as an example of a non-magmatic end member and implications for IOCG genesis and classification: Exploration and Mining Geology, 16(3–4), p.209–232.
Ickert, R.B., Hiess, J., Williams, I.S., Holden, P., Ireland, T.R., Lanc, P., Schram, N., Foster, J.J., and Clement, S.W., (2008). Determining high precision, in situ, oxygen isotope ratios with a SHRIMP II: Analyses of MPI-DING silicate-glass reference materials and zircon from contrasting granites: Chemical Geology, 257, p.114–128.
Kaplan, I. R., Emery, K. O., and Rittenbebg, S. C., (1963). The distribution and isotopic abundance of sulfur in recent marine sediments off southern California: Geochimica et Cosmochimica Acta, 27(4), p.297–331.
Kelly, J.L., Fu, B., Kita, N.T., and Valley, J.W. (2007). Optically continuous silcrete quartz cements of the St. Peter Sandstone: High precision oxygen isotope analysis by ion microprobe: Geochimica et Cosmochimica Acta, 71, p.3812–3832.

Chapter 4: Fluid Evolution
237
Kendrick, M.A., Baker, T., Fu, B., Phillips, D., and Williams, P.J., (2008). Noble gas and halogen constraints on regionally extensive mid-crustal Na–Ca metasomatism, the Proterozoic Eastern Mount Isa Block, Australia: Precambrian Research, 163, p.131–150.
Kendrick, M.A., Duncan, R.J., and Phillips, D., (2006). Noble gas and halogen constraints on mineralising fluids of metamorphic versus surficial origin: Mt Isa, Australia: Chemical Geology, 235, p.325–351.
Kendrick, M. A., Honda, M., Oliver, N.H.S., and Phillips, D., (2011). The noble gas systematics of late-orogenic H2O–CO2 fluids, Mt Isa, Australia: Geochimica et Cosmochimica Acta, 75, p.1428–1450.
Kendrick, M. A., Mark, G., and Phillips, D., (2007). Mid-crustal fluid mixing in a Proterozoic Fe oxide-Cu-Au deposit, Ernest Henry, Australia: Evidence from Ar, Kr, Xe, Cl, Br, and I. Earth and Planetary Science Letters, 256(3–4), p.328–343.
Kerrich, R., La Tour, T.E., and Willmore, L., (1984). Fluid participation in deep fault zones: Evidence from geological, geochemical, and 18O/16O relations: Journal of Geophysical Research: Solid Earth, 89, p.4331–4343.
Knipping, J.L., Bilenker, L.D., Simon, A.C., Reich, M., Barra, F., Deditius, A.P., Lundstrom, C., Bindeman, I., and Munizaga, R., (2015). Giant Kiruna-type deposits form by efficient flotation of magmatic magnetite suspensions: Geology, 43, p.591–594.
Li, Y., and Liu, J., (2006). Calculation of sulfur isotope fractionation in sulfides: Geochimica et Cosmochimica Acta, 70, p.1789–1795.
Ligang, Z., Jingxiu, L., Huanbo, Z., and Zhensheng, C., (1989). Oxygen isotope fractionation in the quartz-water-salt system. Economic Geology, 84(6), 1643–1650.
Little, G., (1997). Structural evolution and paragenesis of alteration and mineralisation at Mount Elliott Cu-Au Mine, northwest Queensland: Honours thesis, James Cook University, Townsville, QLD, Australia.
Mark, G., Oliver, N. H. S., and Carew, M. J., (2006a). Insights into the genesis and diversity of epigenetic Cu - Au mineralisation in the Cloncurry district, Mt Isa Inlier, northwest Queensland: Australian Journal of Earth Sciences, 53(1), p.109–124.

Chapter 4: Fluid Evolution
238
Mark, G., Oliver, N. H. S., and Williams, P. J., (2006b). Mineralogical and chemical evolution of the Ernest Henry Fe oxide-Cu-Au ore system, Cloncurry district, northwest Queensland, Australia: Mineralium Deposita, 40(8), p.769–801.
Mark, G., Oliver, N.H.S., Williams, P.J., Valenta, R.K. and Crookes, R.A., (2000). The evolution of the Ernest Henry Fe-Oxide-(Cu-Au) hydrothermal system: in: Porter, T. M. (ed.) Hydrothermal Iron Oxide Copper-Gold and Related Deposits: A Global Perspective: PGC Publishing, 1, Adelaide, SA, Australia, p.123–136.
Mark, G.M., Stein, H. and Salt, C., (2004). Re-Os isotopic evidence for two periods of sulfide mineralisation in the vicinity of the Ernest henry Cu-Au deposit, northwest queensland, australia. in: AGC Geological Society of Australia: Proceedings, 17th. p.96.
Marschik, R., and Fontboté, L., (2001). The Candelaria-Punta del Cobre iron oxide Cu-Au (-Zn-Ag) deposits, Chile. Economic Geology, 96, p.1799–1826.
Marschik, R., and Kendrick, M.A., (2015). Noble gas and halogen constraints on fluid sources in iron oxide-copper-gold mineralisation: Mantoverde and La Candelaria, Northern Chile: Mineralium Deposita, 50, p.357–371.
Marshall, L.J. and Oliver, N.H.S., (2008). Constraints on hydrothermal fluid pathways within Mary Kathleen Group stratigraphy of the Cloncurry iron-oxide–copper–gold District, Australia: Precambrian Research, 163, p.151–158.
Marshall, L. J., Oliver, N. H. S., and Davidson, G. J., (2006). Carbon and oxygen isotope constraints on fluid sources and fluid-wallrock interaction in regional alteration and iron-oxide-copper-gold mineralisation, eastern Mt Isa Block, Australia: Mineralium Deposita, 41(5), p.429–452.
Mathur, R., Marschik, R., Ruiz, J., Munizaga, F., Leveille, R.A., and Martin, W., (2002). Age of mineralisation of the Candelaria Fe oxide Cu-Au deposit and the rigin of the Chilean Iron Belt , based on Re-Os isotopes: Economic Geology, 97, p.59–71.
Matsuhisa, Y., Goldsmith, J. R., and Clayton, R. N., (1979). Oxygen isotopic fractionation in the system quartz-albite-anorthite-water: Geochimica et Cosmochimica Acta, 43(7), p.1131–1140.
McPhie, J., Kamenetsky, V.S., Chambefort, I., Ehrig, K., and Green, N., (2011a). Origin of the supergiant Olympic Dam Cu-U-Au-Ag deposit, South Australia: Was a sedimentary basin involved?: Geology, 39, p.795–798.
Chapter 4: Fluid Evolution
239
McPhie, J., Kamenetsky, V., Allen, S., Ehrig, K., Agangi, A., and Bath, A., (2011b). The fluorine link between a supergiant ore deposit and a silicic large igneous province: Geology, 9, p.1003–1006.
O’dea, M. G., Betts, P. G., MacCready, T., andAillères, L., (2006). Sequential development of a mid-crustal fold-thrust complex: evidence from the MitakoodiCulminationin the eastern Mt Isa Inlier, Australia. Australian Journal of Earth Sciences, 53, p.69–90.
O’dea, M. G., Lister, G. S., Maccready, T., Betts, P. G., Oliver, N. H. S., Pound, K. S., and Valenta, R. K., (1997). Geodynamic evolution of the Proterozoic Mount Isa terrain: Geological Society of London Special Publications, 121(1), p.99–122.
Ohmoto, H., (1972). Systematics of sulfur and carbon isotopes in hydrothermal ore deposits: Economic Geology, 67(5), p.551–578.
Ohmoto, H., and Lasaga, A., (1982). Kinetics of reactions between aqueous sulfates and sulfides in hydrothermal systems: Geochimica et Cosmochimica Acta, v. 46, p.1727–1745.
Ohmoto, H., and Rye, R. O., (1979). Isotopes of sulfur and carbon: in Geochemistry of Hydrothermal Ore Deposits, Barnes, HL, (ed.): Wiley and Sons, New York, NY, United States, 1979, p.509–567.
Oliver, N., Butera, K., Rubenach, M., Marshall, L., Cleverley, J., Mark, G., Tullemans, F., and Esser, D., (2008). The protracted hydrothermal evolution of the Mount Isa Eastern Succession: A review and tectonic implications: Precambrian Research, 163(1–2), p.108–130.
Oliver, N.H.S., Cleverley, J.S., Mark, G., Pollard, P.J., Bin, F., Marshall, L.J., Rubenach, M.J., Williams, P.J., and Baker, T., (2004). Modeling the role of sodic alteration in the genesis of iron oxide-copper-gold deposits, eastern Mount Isa block, Australia: Economic Geology, 99, p.1145–1176.
Oliver, N.H.S., Rubenach, M.J., Fu, B., Baker, T., Blenkinsop, T.G., Cleverley, J.S., Marshall, L.J., and Ridd, P.J., (2006). Granite-related overpressure and volatile release in the mid crust: fluidized breccias from the Cloncurry District, Australia: Geofluids, 6, p.346–358.
Oreskes, N., and Einaudi, M., (1990). Origin of rare earth element-enriched hematite breccias at the Olympic Dam Cu-U-Au-Ag deposit, Roxby Downs, South Australia: Economic Geology, 85, p.1–28.
Chapter 4: Fluid Evolution
240
Oreskes, N. and Einaudi, M.T., (1992). Origin of hydrothermal fluids at Olympic Dam; preliminary results from fluid inclusions and stable isotopes: Economic Geology, 87, p.64–90.
Page, R.W., and Sun, S., (1998). Aspects of geochronology and crustal evolution in the Eastern Fold Belt, Mt Isa Inlier: Australian Journal of Earth Sciences, 45, p.343–361.
Perring, C.S., Pollard, P.J., Donc, A., Nunn, J., and Blake, K.L., (2001). The Lightning Creek Sill Complex, Cloncurry District, Northwest Queensland: A Source of Fluids for Fe Oxide Cu-Au Mineralisation and Sodic-Calcic Alteration: Economic Geology, 95, p.1067–1089.
Pollard, P.J., (2000). Evidence of a Magmatic Fluid and Metal Source for Fe-Oxide Cu-Au Mineralisation: in Porter, T.M. (ed.), Hydrothermal Iron Oxide Copper-Gold and Related Deposits: A Global Perspective: PGC Publishing, 1, Adelaide, p.27–41.
Pollard, P.J., (2006). An intrusion-related origin for Cu–Au mineralisation in iron oxide-copper-gold (IOCG) provinces: Mineralium Deposita, 41, p.179–187.
Pollard, P.J., Blake, K.L., and Dong, G., (1997). Proterozoic Cu-Au-Co and Pb-Zn-Ag mineralization in the Cloncurry district, eastern Mount Isa Inlier, Australia. Constraints on fluids sources from mineralogical, fluid inclusion and stable isotope data: in: Pollard, PJ (ed.) AMIRA P438: Cloncurry Base Metals and Gold Final Report, Australian Institute of Mining and Metallurgy.
Reynolds, L.J., (2000). Geology of the Olympic Dam Cu-U-Au-Ag-REE deposit: in Porter, T. M. (ed.) Hydrothermal Iron Oxide Copper-Gold and Related Deposits: A Global Perspective: PGC Publishing, 1, Adelaide, SA, Australia, 93–104.
Roedder, E. (1962). Studies of fluid inclusions I: Low temperature application of a dual-purpose freezing and heating stage. Economic Geology, 57, p.1045–1061.
Roedder, E., (1979). Fluid inclusions as samples of ore fluids. In Geochemistry of Hydrothermal Ore Deposits, ed. H. L. Barnes, 684–737. New York: Wiley.
Roedder, E., (1984). Fluid Inclusions: in Ribbe, P.H. (ed.), Reviews in Mineralogy, 12, Mineralogical Society of America, 646p.
Rotherham, J., Blake, K., Cartwright, I., and Williams, P., (1998). Stable isotope evidence for the origin of the Mesoproterozoic Starra Au-Cu deposit, Cloncurry district, Northwest Queensland: Economic Geology, 93, p.1435–1449.
Chapter 4: Fluid Evolution
241
Rubenach, M. (2013). Structural controls of metasomatism on a regional scale, in Metasomatism and the Chemical Transformation of Rock, Harlov, D. and Austrheim, H: Springer, 2013, Chap. 4, p.93–140.
Rubenach, M., Foster, D., Evins, P., Blake, K., and Fanning, C., (2008). Age constraints on the tectonothermal evolution of the Selwyn Zone, Eastern Fold Belt, Mount Isa Inlier: Precambrian Research, 163, p.81–107.
Rubenach, M., and Lewthwaite, K., (2002). Metasomaticalbitites and related biotite-rich schists from a low-pressure polymetamorphic terrane, Snake Creek Anticline, Mount Isa Inlier, north-eastern Australia: microstructures and P-T-d paths: Journal of Metamorphic Geology, 20, p.191–202.
Rusk, B.G., Oliver, N.H.S., Cleverley, J.S., Blenkinsop, T.G., Zhang, D., Williams, P.J. and Habermann, P., (2010). Physical and Chemical Characteristics of the Ernest Henry Iron Oxide Copper Gold Deposit, Australia; Implications for IOCG Genesis: in Porter, T.M., (ed.), Hydrothermal Iron Oxide Copper-Gold and Related Deposits: A Global Perspective: PGC Publishing, 3, Adelaide, SA, Australia p.201–218.
Rye, R. O., (2005). A review of the stable-isotope geochemistry of sulfate minerals in selected igneous environments and related hydrothermal systems: Chemical Geology, 215, p.5–36.
Sakai, H., (1968). Isotopic properties of sulfur compounds in hydrothermal processes: Geochemical Journal, 2(1), p.29–49.
Seal, R. R., (2006). Sulfur Isotope Geochemistry of Sulfide Minerals: Reviews in Mineralogy and Geochemistry, 61(1), p.633–677.
Seal, R. R., Alpers, C. N., and Rye, R. O., (2000). Stable Isotope Systematics of Sulfate Minerals: Reviews in Mineralogy and Geochemistry, 40(1), p.541–602.
Shelton, K. L., and Rye, D. M., (1982). Sulfur isotopic compositions of ores from Mines Gaspe, Quebec: an example of sulfate-sulfide isotopic disequilibria in ore-forming fluids with applications to other porphyry-type deposits, Economic Geology, 77(7), p.1688–1709.
Shepherd, T. J., Rankin, A. H., and Alderton, D. H. M., (1985). A practical guide to fluid inclusion studies: Blackie, London, UK.
Sillitoe, R. H., (2003). Iron oxide-copper-gold deposits: an Andean view: Mineralium Deposita, 38(7), p.787–812.
Sillitoe, R. H., (2010). Porphyry copper systems: Economic Geology, 105, p.3–41.

Chapter 4: Fluid Evolution
242
Skinner, B.J. (1997). Hydrothermal mineral deposits: What we do and don’t know, in: Barnes, Hubert Lloyd (ed.): Geochemistry of hydrothermal ore deposits, 1, John Wiley and Sons.
Sourirajan, S., and Kennedy, G.C., (1962). The System H2O-NaCl at Elevated Temperatures and Pressures: American Journal of Science, 260, p.115–141.
Steele-MacInnis, M., Bodnar, R. J., and Naden, J., (2011). Numerical model to determine the composition of H2O-NaCl-CaCl2 fluid inclusions based on microthermometric and microanalytical data: Geochimica et Cosmochimica Acta, 75(1), p.21–40.
Steele-MacInnis, M., Lecumberri-Sanchez, P., and Bodnar, R. J., (2012). HokieFlincs_H2O-NaCl: A Microsoft Excel spreadsheet for interpreting microthermometric data from fluid inclusions based on the PVTX properties of H2O-NaCl: Computers and Geosciences, 49, p.334–337.
Taylor, H. P., (1974). The application of oxygen and hydrogen isotope studies to problems of hydrothermal alteration and ore deposition: Economic Geology, 69(6), p.843–883.
Tukey, J.W., (1977). Exploratory Data Analysis: Addison-Wesley, Reading, MA, United States, 688p.
Twyerould, S.C., (1997). The geology and genesis of the Ernest Henry Fe-Cu-Au deposit, northwest Queensland, Australia: PhD thesis, University of Oregon, Eugene, OR, United States, 494p.
Ueda, A., Campbell, F.A., Krouse, H.R., and Spencer, R.J., (1987). 34S/32S Variations in trace sulfide and sulfate in carbonate rocks of a Devonian reef, Alberta, Canada, and the Precambrian Siyeh formation, Montana, U.S.A.: Chemical Geology: Isotope Geoscience section, 65, p.383–390.
Valley, J. W., (1986). Stable isotope geochemistry of metamorphic rocks, In: Valley, J. W, Taylor, H. P., Jr., O'Neil, J. R. O. (eds.) Stable Isotopes in High Temperature Geological Processes, Reviews in Mineralogy, 16, Washington: Mineralogical Society of America, p.445–489.
Van den Kerkhof, A. M., and Hein, U. F., (2001). Fluid inclusion petrography: Lithos, 55(1–4), p.27–47.
Wang, S., and Williams, P. J., (2001). Geochemistry and origin of Proterozoic skarns at the Mount Elliott Cu-Au(-Co-Ni) deposit, Cloncurry district, NW Queensland,
Chapter 4: Fluid Evolution
243
White, S., (1973). Syntectonic Recrystallization and Texture Development in Quartz. Nature, 244 (5414), p.276–278.
Williams, M.R., Holwell, D. A., Lilly, R.M., Case, G.N.D., and McDonald, I., (2015). Mineralogical and fluid characteristics of the fluorite-rich Monakoff and E1 Cu–Au deposits, Cloncurry region, Queensland, Australia: Implications for regional F–Ba-rich IOCG mineralisation: Ore Geology Reviews, 64, p.103–127.
Williams, P.J., (1994). Iron mobility during synmetamorphic alteration in the Selwyn Range area, NW Queensland: implications for the origin of ironstone-hosted Au-Cu deposits: Mineralium Deposita, 29, p.250–260.
Williams, P.J., Barton, M., Johnson, D. A., Fontboté, L., Haller, A. de, Mark, G., Oliver, N. H. S., and Marschik, R., (2005). Iron oxide copper-gold deposits: geology, space-time distribution, and possible modes of origin. Economic Geology: 100th Anniversary Volume, p.371–405.
Williams, P.J., and Skirrow, R.G., (2000). Overview of iron oxide-copper-gold deposits in the Curnamona Province and Cloncurry District (Eastern Mount Isa Block), Australia: in: Porter, T. M. (ed.) Hydrothermal Iron Oxide Copper-Gold and Related Deposits: A Global Perspective: PGC Publishing, 1, Adelaide, SA, Australia, p.105–122.
Wotte, T., Shields-Zhou, G.A., and Strauss, H., (2012). Carbonate-associated sulfate: Experimental comparisons of common extraction methods and recommendations toward a standard analytical protocol: Chemical Geology, 326–327, p.132–144.
Wyborn, L., (1998). Younger ca 1500 Ma granites of the Williams and Naraku Batholiths, Cloncurry district, eastern Mt Isa Inlier: Geochemistry, origin, metallogenic significance and exploration indicators: Australian Journal of Earth Sciences, 45, p.397–411.
Wyborn, L. and Page, R., (1983). The Proterozoic Kalkadoon and Ewen Batholiths, Mount Isa Inlier, Queensland: source, chemistry, age and metamorphism: BMR Journal of Australian Geology and Geophysics, 8, p.53–69.
Wyborn, L., Page, R. and McCulloch, M., (1988). Petrology, geochronology and isotope geochemistry of the post-1820 Ma granites of the Mount Isa Inlier: mechanisms for the generation of Proterozoic anorogenic granites: Precambrian Research, 40–41, p.509–541.
Chapter 4: Fluid Evolution
244
Xu, G., (2000). Fluid inclusions with NaCl-CaCl2-H 2 O composition from the Cloncurry hydrothermal system, NW Queensland, Australia: Lithos, 53, p.21–35.
Zheng, Y. F., (1990). Carbon-oxygen isotopic covariation in hydrothermal calcite during degassing of CO2 - A quantitative evaluation and application to the Kushikino gold mining area in Japan, Mineralium Deposita, 25(4), p.246–250.

245
Chapter 5 Conclusions

Chapter 5: Conclusions
246
A Genetic Model of the E1 Group This chapter combines the interpretations of the previous chapters into a comprehensive
ore genesis model for the E1 Group. The model is presented chronologically, and as
such the geological, paragenetic, structural and geochemical aspects discussed
separately in the previous chapters are interwoven to form a timeline, from host rock
deposition to mineralisation. The model is shown visually in Figure 5.1.
Phase 1: Host rock deposition and early intrusions. E1 Group ores are hosted mostly in marble and carbonaceous metasiltstone and schist of
the Corella Formation, and also in metatuffs and metavolcanic breccia portions of the
Mount Fort Constantine Volcanics; these rocks are intercalated with mostly barren
meta-andesite and meta-andesite-basalt that are also part of the latter formation. From
bottom to top, the local stratigraphy is: variably amygdaloidal, massive and porphyitic
meta-andesite, siliceous marble intercalated with metatuff and metavolcanic breccia,
porphyritic meta-andesite, carbonaceous metasiltstone grading up into schist.
Regionally, the Corella Formation was deposited between 1750 and 1720 Ma as part of
the regional Cover Sequence 2. The 1750–1740 Ma old Mount Fort Constantine
Volcanics probably represent volcanic flows erupted onto the sediments of the Corella
Formation while hypabyssal sills intruded into it. It is likely that the Mount Margaret
Fault, which forms the northern portion of the regional Cloncurry Fault Zone, was
active during this time as a basin-bounding normal fault. The rocks were intruded by
diorite that is probably part of the local Ernest Henry Diorite suite that crystallized
around 1650 Ma.
Phase 2: Pre-ore deformation.
The S1 foliation is not well-preserved and is related to a local D1 event. The axial planar
S2 foliation is related to the formation of the major north-northwest-plunging folds that
dominate the E1 Group geometry, namely the E1 North Antiform, E1 South Synform,
and E1 East Antiform. These folds formed from east-northeast and west-southwest
shortening during regional peak metamorphism (D2), which has been dated to between
1600 and 1580 Ma. The Mount Margaret Fault was likely reactivated with components
of reverse and strike-slip movement during this time. The northeast-southwest-trending
orientation of the west limb of the E1 North Antiform caused by D2 folding and

Chapter 5: Conclusions
247
faulting/shearing provided the structural architecture for later mineralisation. The
regional D3 event does not appear to be preserved in the mine lease.
Figure 5.1: Generalized genetic model for an E1 Group-style, Cloncurry-type IOCG, based on the 3-D geological model presented in Chapter 3. A magmatic fluid, most likely oxidized and enriched in Cu-Au-F-U-REE-H2S-SO2, permeates through the E1 North shear zone, or a dilated fold hinge, and mixes with a fluid that interacted with sulfur in the Corella Formation. The mixing process takes place during D4, in a Riedel brittle-ductile system (marked as R and R’) that was formed by transpressional movement along the Mount Margaret Fault (MMF). Temperature decrease initiates SO2 hydrolysis. The mixing decreases salinity and initiates ore precipitation. Sulfate is generated through hydrolysis, and additional contribution from Corella Formation metaevaporites. At E1 North, the magmatic fluid dominates the system and
34S values. E1 East and South, more distal from the magma source, are dominated by the Corella Formation- 34S values. S, shear zone.
Chapter 5: Conclusions
248
Phase 3: Local D3 / regional D4 deformation and early alteration paragenesis.
During local D3 / regional D4, the shortening direction shifted to northeast-southwest,
and the Mount Margaret Fault was reactivated as a transpressional Riedel fault-shear
system. The northeast-southwest-trending structures comprising the E1 North Shear
Zone formed as oblique extensional, antithetic, R-shears to this Riedel system. The
northeast-southwest trend and northwest dip of the E1 North Shear Zone was at least
partly controlled by the dip of the west limb of the E1 North Antiform. These brittle-
ductile R-shears, along with the hinges of the E1 North Antiform and E1 South
Synform, provided the permeability necessary for the hydrothermal fluids. The local
stratigraphy at the E1 Group – ductile marble and metavolcaniclastic rocks in between
coherent, competent, massive to porphyritic metavolcanic rocks – caused D4 ductile
strain to be partitioned into the metasedimentary rock horizons, as well as into the
clastic metavolcanic rocks. As a result, the ore fluids were focused into chemically-
reactive marble of the Corella Formation, which in other instances can be a fluid barrier.
Unlike Ernest Henry, fluid pressure was insufficient to cause brecciation; instead, the
mineralisation formed as stratabound replacement bodies in the shear zones and fold
hinges. This, coupled with the chemical favourability of the marble host rocks, resulted
in the observed layer-controlled ore textures in metasedimentary rocks and layered
metatuffs, along with matrix-controlled replacement of metavolcanic breccias. The
marble of the Corella Formation was also chemically receptive to replacement, causing
mineralisation to extend over 500 m along the limbs of the folds.
A discordant, barren, breccia found throughout the E1 Group mine lease, as well as at
nearby targets, is post-regional D2 to syn-regional D4 in timing. The breccia is strongly
altered by Stage 1 albite (-hematite), Stage 2 K-feldspar-biotite, and later carbonate.
Many clasts show evidence of chemical abrasion. The breccia is similar to many sodic-
calcic-altered breccias around the area. The breccia, however, does not appear to be
related to mineralisation.
Stage 2a quartz and magnetite formed from a fluid characterise 18OVSMOW
composition from +8 to +12 ‰. Fluid inclusions in the quartz were heterogeneously
trapped from a fluid with a salinity exceeding 50 wt% NaCleq. 18O values and fluid
salinities are most consistent with a magmatic-hydrothermal fluid. The calculated
formation temperature range for these two minerals is 400° to 550°C.

Chapter 5: Conclusions
249
Phase 4: Mineralisation
Stage 2a alteration was followed by a minor albite-rutile stage (Stage 2b), and then by
Stage 2c carbonate flooding; some mineralisation probably formed during Stage 2c. The
main Cu-Au mineralising event was Stage 3; local D3 / regional D4 deformation was
ongoing during this time.
34S values of Stage 3 barite and chalcopyrite suggest a mineralisation temperature
range of 230° to 330°C 34 CDT values of Stage 3 chalcopyrite
and barite range from +4.9‰ at E1 North to +15.9‰ at E1 South. Low-salinity (< 15
wt% NaCl) fluid inclusions in Stage 3 barite fluid inclusions homogenised between
160° and 190°C. Trapping pressure estimates for the fluid inclusions, derived from the
barite-chalcopyrite formation temperatures and barite fluid inclusion homogenisation
temperatures, are between 2200 and 3300 bar, corresponding to a depth range of 8–12
km. Such a depth range is consistent with the brittle-ductile transition zone.
The most likely ore genesis hypothesis to explain these fluid and isotope characteristics
is a hybrid magmatic-non-magmatic fluid-fluid mixing model. The increase in 34 S of
the fluids between E1 North and E1 South was the result of mixing of a sulfur-bearing
magmatic fluid with another fluid that equilibrated with sulfur derived locally from the
Corella Formation. Alternatively, but less likely, oxidation of the magmatic fluid
through interaction with the second fluid may have caused batch distillation, which
could explain the values. The second fluid probably originated from shallower depths,
possibly from a basinal source, and descended through the shear zones and fold hinges. 34S values at E1 North; it was probably sourced from
an evolved, alkaline, A-type granite, which is speculated to be part of the Williams-
Naraku Batholith. The fluid-fluid mixing model also explains the presence of insoluble
barite. The magmatic fluid likely contributed most of the Cu, Au, F, U and REE to the
ores, as well as sulfur in the form of both H2S and 2-4SO ; the second fluid also
contributed 2-4SO . It is unlikely that either fluid carried Ba, and its source is not clear. It
may have been derived from metavolcanic rocks during Stage 1 and 2 alterations, or
locally from meta-evaporite rock layers in the Corella Formation. Precipitation of the
ores was driven mainly by a salinity decrease caused by mixing of the high-salinity
magmatic fluid with the lower-salinity fluid. Locally, rapid oxidation may have
precipitated much of the barite. In contrast to the nearby Ernest Henry deposit, the Stage

Chapter 5: Conclusions
250
2 and 3 fluids were not CO2-rich, which may partly explain why fluid pressure was
insufficient to cause Ernest Henry-style brecciation.
Implications for IOCG Genesis and Exploration The geochemistry and paragenesis, structural controls and ore genesis model of the E1
Group carry implications for IOCG formation and exploration in the Cloncurry District,
and globally.
The similarities in paragenesis, ore chemistry and timing (1530–1500 Ma) between the
E1 Group, Ernest Henry and Monakoff suggests these systems formed from a similar
type of hydrothermal fluid that was present over an area of 120 km2 between the
deposits, thus making the area highly prospective for additional exploration. This does
not necessarily imply, however, that these deposits formed at exactly the same time, or
from the same hydrothermal system. Fluorine and barium may serve as vectoring
elements to orebodies in this region. Anomalously-high fluorine is traceable for at least
100 m around the E1 Group orebody, and is probably mostly hosted in apatite and
biotite in this zone. Barium is also above background levels for at least 100 m outside of
the ore zone.
The absence of brecciation at E1 Group may help explain the high barite and fluorite
concentrations in the ores. Barium and fluorine in Stage 2 K-feldspar and fluorapatite
indicate that both elements were present in the magmatic hydrothermal fluid throughout
the evolution of the system. It is possible that protracted replacement over multiple
paragenetic stages, probably associated with minor volume change, led to increasing
total Ba-F content over time. This is consistent with the observed tendency for fluorite
to replace F-rich biotite in the E1 Group ores, and explains the apparent lack of
fluorapatite in ores, which was probably also replaced by fluorite. On the other hand,
brecciation during ore formation at Ernest Henry probably caused a much greater
increase in the overall volume of the system, and resulted in dilution of these elements
with each paragenetic stage. The same principle may apply to other breccia-hosted
IOCG deposits like Olympic Dam and Prominent Hill in the Gawler Craton
In the northeast Cloncurry District, northeast-trending ductile-brittle structures that
intersect folded metasedimentary rock horizons, and are hosted within Riedel strike-slip
structures, can form fault-shear systems ideal for both Ernest Henry and E1 Group-

Chapter 5: Conclusions
251
styles of mineralisation. These structures formed in the regional D4 event, but may
appear to be D3-related if the latter event is not locally preserved. Where such D4
structures occur, the degree of fluid overpressure and relative permeability of the host
rocks are important characteristics that probably influence the formation of stratabound
replacement-style E1 Group orebodies, as opposed to breccia-hosted Ernest Henry-style
ores. These parameters may also influence the size and grade of the deposits. In some
cases, juxtaposition of competent lithologies, such as metavolcanic rocks, between
impermeable metasedimentary rock horizons, may have generated fluid overpressure
and facilitated the brecciation needed to form an IOCG deposit like Ernest Henry, rather
than a stratabound replacement orebody such as the E1 Group. When the E1 Group is
compared to IOCG deposits in other districts such as Fennoscandia and Carajás, an
obvious association can be seen between ductile structural regimes and replacement
orebodies. Given the 8–12 km depth of ore genesis at the E1 Group, it is suggested that
replacement orebodies probably form at similar depths. Conversely, breccia ores are
typically, but not always, formed in dominantly brittle regimes. Such regimes may be
shallower, but do not have to be if hydrostatic pressure is high. If precise lithostatic
pressure constraints are known, fluid inclusion data can provide estimates of fluid
overpressure and potential for breccia-hosted mineralisation.
The genetic model of the E1 Group can yield understanding into the characteristics of a
prospective IOCG system. The magmatic and external fluid mixing process that formed
the E1 Group ores generated the highest Cu and Au grades at the intersection of a shear
zone with another conduit, such as a steeply-plunging regional D2 fold hinge. This
intersection enables shallow fluids to permeate deep enough to interact with a magmatic
fluid at depth (>6 km); similar controls are observed at other Cloncurry District Cu-Au
deposits (e.g. Ernest Henry, Eloise). Fold hinges alone can still focus economic
mineralisation, albeit with slightly lower tonnage and grade. Meta-evaporitic rocks and
marbles, like those in the Corella Formation, likely lost most of their original connate
waters to metamorphism before mineralisation; they can nevertheless result in a distinct 34S signature on ores hosted in these rocks, like those at E1 South. Furthermore, they
can serve as a chemical sink for ores over distances of at least 2 km along strike. The 34S values of sulfides and sulfates may potentially serve as vectors to the high-grade,
magmatic fluid-dominated, areas of these mixed magmatic-hydrothermal systems,
where values of 34 S are between 0 and ~ +7 ‰.

Appendix A Drill Core Sample Locations and Descriptions
252
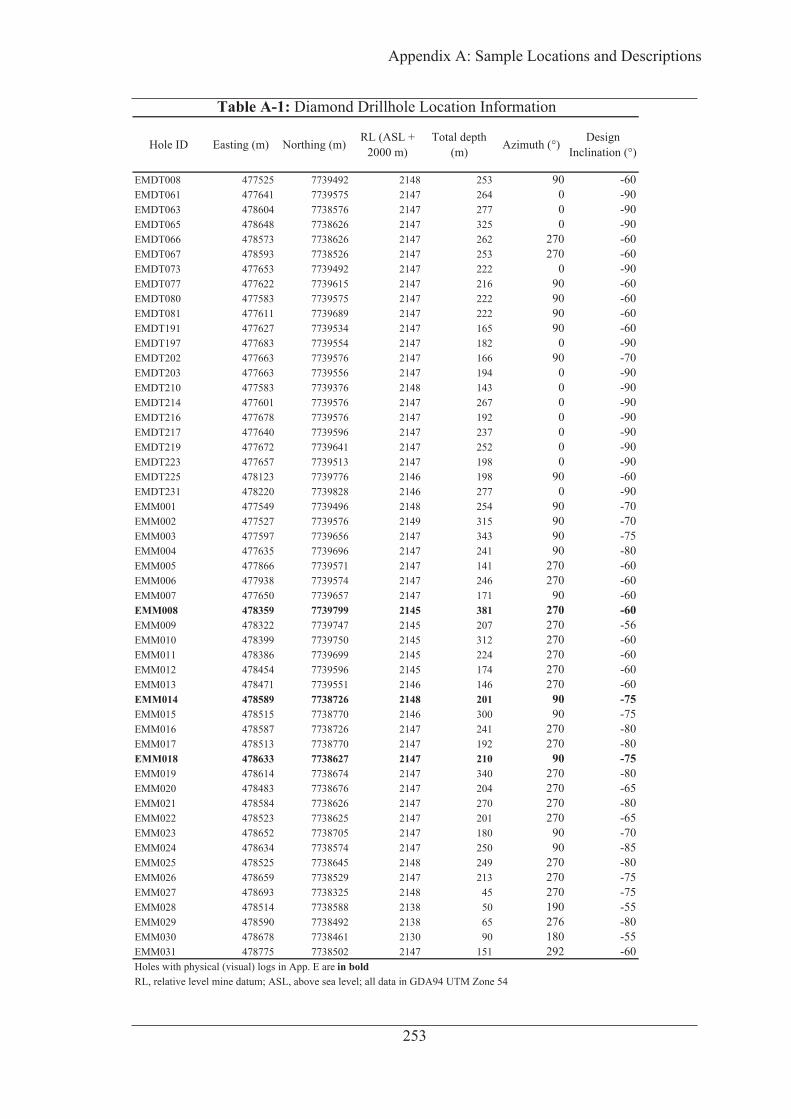
Hole ID Easting (m) Northing (m) RL (ASL + 2000 m)
Total depth (m) Azimuth (°) Design
Inclination (°)
EMDT008 477525 7739492 2148 253 90 -60EMDT061 477641 7739575 2147 264 0 -90EMDT063 478604 7738576 2147 277 0 -90EMDT065 478648 7738626 2147 325 0 -90EMDT066 478573 7738626 2147 262 270 -60EMDT067 478593 7738526 2147 253 270 -60EMDT073 477653 7739492 2147 222 0 -90EMDT077 477622 7739615 2147 216 90 -60EMDT080 477583 7739575 2147 222 90 -60EMDT081 477611 7739689 2147 222 90 -60EMDT191 477627 7739534 2147 165 90 -60EMDT197 477683 7739554 2147 182 0 -90EMDT202 477663 7739576 2147 166 90 -70EMDT203 477663 7739556 2147 194 0 -90EMDT210 477583 7739376 2148 143 0 -90EMDT214 477601 7739576 2147 267 0 -90EMDT216 477678 7739576 2147 192 0 -90EMDT217 477640 7739596 2147 237 0 -90EMDT219 477672 7739641 2147 252 0 -90EMDT223 477657 7739513 2147 198 0 -90EMDT225 478123 7739776 2146 198 90 -60EMDT231 478220 7739828 2146 277 0 -90EMM001 477549 7739496 2148 254 90 -70EMM002 477527 7739576 2149 315 90 -70EMM003 477597 7739656 2147 343 90 -75EMM004 477635 7739696 2147 241 90 -80EMM005 477866 7739571 2147 141 270 -60EMM006 477938 7739574 2147 246 270 -60EMM007 477650 7739657 2147 171 90 -60EMM008 478359 7739799 2145 381 270 -60EMM009 478322 7739747 2145 207 270 -56EMM010 478399 7739750 2145 312 270 -60EMM011 478386 7739699 2145 224 270 -60EMM012 478454 7739596 2145 174 270 -60EMM013 478471 7739551 2146 146 270 -60EMM014 478589 7738726 2148 201 90 -75EMM015 478515 7738770 2146 300 90 -75EMM016 478587 7738726 2147 241 270 -80EMM017 478513 7738770 2147 192 270 -80EMM018 478633 7738627 2147 210 90 -75EMM019 478614 7738674 2147 340 270 -80EMM020 478483 7738676 2147 204 270 -65EMM021 478584 7738626 2147 270 270 -80EMM022 478523 7738625 2147 201 270 -65EMM023 478652 7738705 2147 180 90 -70EMM024 478634 7738574 2147 250 90 -85EMM025 478525 7738645 2148 249 270 -80EMM026 478659 7738529 2147 213 270 -75EMM027 478693 7738325 2148 45 270 -75EMM028 478514 7738588 2138 50 190 -55EMM029 478590 7738492 2138 65 276 -80EMM030 478678 7738461 2130 90 180 -55EMM031 478775 7738502 2147 151 292 -60
RL, relative level mine datum; ASL, above sea level; all data in GDA94 UTM Zone 54 Holes with physical (visual) logs in App. E are in bold
Table A-1: Diamond Drillhole Location Information
253
Appendix A: Sample Locations and Descriptions

Hole ID Easting (m) Northing (m) RL (ASL + 2000 m)
Total depth (m) Azimuth (°) Design
Inclination (°)
Table A-1: Diamond Drillhole Location Information
EMM032 478374 7739660 2121 60 155 -55EMM033 478280 7739711 2120 60 43 -55EMM034 478272 7739694 2120 55 24 -60EMM035 478673 7738526 2130 111 165 -60EMM036 478720 7738567 2131 100 160 -60EMM037 478671 7738588 2130 160 283 -65EMM038 478711 7738572 2130 90 75 -60EMM039 478627 7738437 2138 65 225 -70EMM040 478218 7739744 2120 70 95 -55EMM041 478343 7739646 2120 135 90 -68EMM042 478448 7739674 2135 165 230 -57EMMD001 477572 7739615 2147 279 96 -60EMMD002 477677 7739666 2147 251 0 -90EMMD003 477603 7739531 2147 214 96 -60EMMD004 477638 7739596 2147 222 90 -60EMMD005 478247 7739701 2146 192 91 -60EMMD006 478262 7739774 2146 306 0 -90EMMD007 478277 7739829 2146 225 270 -60EMMD008 478440 7739630 2146 150 270 -60EMMD009 478499 7739629 2145 201 270 -60EMMD010 478370 7739700 2146 163 270 -60EMMD011 478383 7739776 2145 393 268 -60EMMD012 478356 7739830 2145 361 276 -65EMMD013 478400 7739627 2146 172 0 -90EMMD014 478213 7739776 2146 297 0 -90EMMD015 478183 7739876 2146 200 270 -70EMMD016 478158 7739828 2146 277 88 -76EMMD017 478406 7739626 2146 101 90 -60EMMD018 478405 7739626 2146 139 270 -60EMMD019 478413 7739701 2146 241 270 -60EMMD020 478333 7739782 2146 248 227 -60EMMD021 477522 7739576 2147 379 0 -90EMMD022 477470 7739518 2148 369 90 -65EMMD023 477524 7739634 2147 402 90 -60EMMD024 477573 7739396 2148 208 90 -60EMMD025 477574 7739715 2147 412 90 -70EMMD026 477520 7739476 2148 359 90 -80EMMD027 478280 7739874 2146 247 270 -70EMMD028 477584 7739275 2148 144 90 -60EMMD029 477541 7739276 2148 192 90 -60EMMD030 478454 7739529 2146 120 270 -60EMMD031 478493 7739527 2145 179 270 -60EMMD032 477502 7739276 2148 268 90 -60EMMD033 477565 7739224 2148 147 90 -60EMMD034 477526 7739225 2148 295 90 -60EMMD035 477564 7739122 2148 208 90 -60EMMD036 477521 7739124 2148 203 90 -60EMMD037 478423 7738774 2147 238 270 -60EMMD038 478703 7738434 2148 150 180 -60EMMD039 478637 7738747 2147 175 90 -60EMMD040 478699 7738534 2147 222 174 -75EMMD041 477472 7739124 2148 291 90 -60EMMD042 478492 7738628 2147 191 270 -60EMMD043 478462 7738624 2147 173 270 -60EMMD044 478576 7738871 2147 179 90 -60EMMD045 478598 7738673 2147 322 200 -80
254
Appendix A: Sample Locations and Descriptions
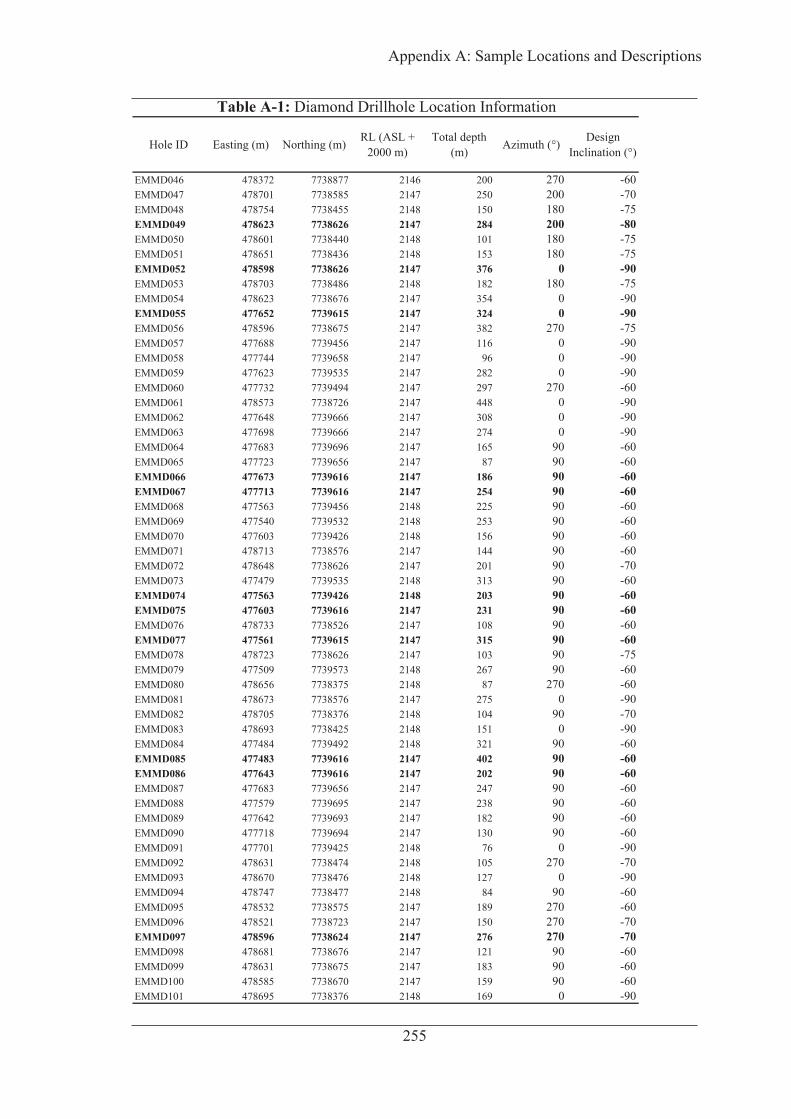
Hole ID Easting (m) Northing (m) RL (ASL + 2000 m)
Total depth (m) Azimuth (°) Design
Inclination (°)
Table A-1: Diamond Drillhole Location Information
EMMD046 478372 7738877 2146 200 270 -60EMMD047 478701 7738585 2147 250 200 -70EMMD048 478754 7738455 2148 150 180 -75EMMD049 478623 7738626 2147 284 200 -80EMMD050 478601 7738440 2148 101 180 -75EMMD051 478651 7738436 2148 153 180 -75EMMD052 478598 7738626 2147 376 0 -90EMMD053 478703 7738486 2148 182 180 -75EMMD054 478623 7738676 2147 354 0 -90EMMD055 477652 7739615 2147 324 0 -90EMMD056 478596 7738675 2147 382 270 -75EMMD057 477688 7739456 2147 116 0 -90EMMD058 477744 7739658 2147 96 0 -90EMMD059 477623 7739535 2147 282 0 -90EMMD060 477732 7739494 2147 297 270 -60EMMD061 478573 7738726 2147 448 0 -90EMMD062 477648 7739666 2147 308 0 -90EMMD063 477698 7739666 2147 274 0 -90EMMD064 477683 7739696 2147 165 90 -60EMMD065 477723 7739656 2147 87 90 -60EMMD066 477673 7739616 2147 186 90 -60EMMD067 477713 7739616 2147 254 90 -60EMMD068 477563 7739456 2148 225 90 -60EMMD069 477540 7739532 2148 253 90 -60EMMD070 477603 7739426 2148 156 90 -60EMMD071 478713 7738576 2147 144 90 -60EMMD072 478648 7738626 2147 201 90 -70EMMD073 477479 7739535 2148 313 90 -60EMMD074 477563 7739426 2148 203 90 -60EMMD075 477603 7739616 2147 231 90 -60EMMD076 478733 7738526 2147 108 90 -60EMMD077 477561 7739615 2147 315 90 -60EMMD078 478723 7738626 2147 103 90 -75EMMD079 477509 7739573 2148 267 90 -60EMMD080 478656 7738375 2148 87 270 -60EMMD081 478673 7738576 2147 275 0 -90EMMD082 478705 7738376 2148 104 90 -70EMMD083 478693 7738425 2148 151 0 -90EMMD084 477484 7739492 2148 321 90 -60EMMD085 477483 7739616 2147 402 90 -60EMMD086 477643 7739616 2147 202 90 -60EMMD087 477683 7739656 2147 247 90 -60EMMD088 477579 7739695 2147 238 90 -60EMMD089 477642 7739693 2147 182 90 -60EMMD090 477718 7739694 2147 130 90 -60EMMD091 477701 7739425 2148 76 0 -90EMMD092 478631 7738474 2148 105 270 -70EMMD093 478670 7738476 2148 127 0 -90EMMD094 478747 7738477 2148 84 90 -60EMMD095 478532 7738575 2147 189 270 -60EMMD096 478521 7738723 2147 150 270 -70EMMD097 478596 7738624 2147 276 270 -70EMMD098 478681 7738676 2147 121 90 -60EMMD099 478631 7738675 2147 183 90 -60EMMD100 478585 7738670 2147 159 90 -60EMMD101 478695 7738376 2148 169 0 -90
255
Appendix A: Sample Locations and Descriptions
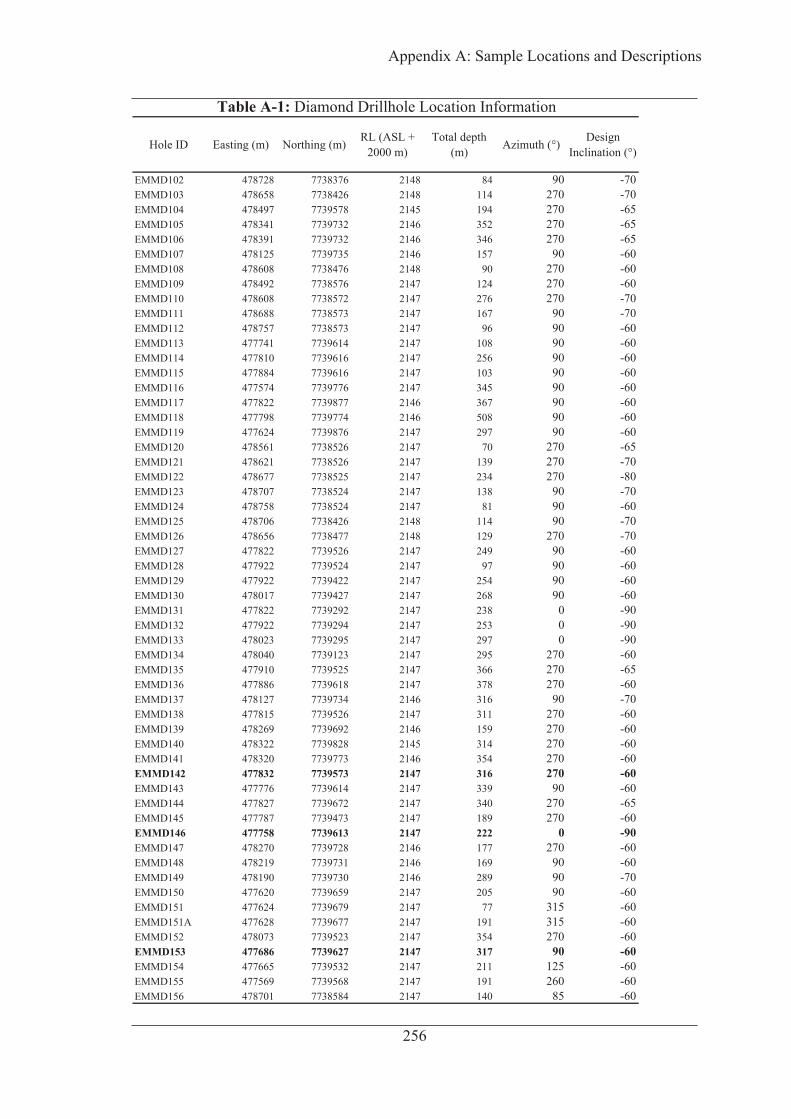
Hole ID Easting (m) Northing (m) RL (ASL + 2000 m)
Total depth (m) Azimuth (°) Design
Inclination (°)
Table A-1: Diamond Drillhole Location Information
EMMD102 478728 7738376 2148 84 90 -70EMMD103 478658 7738426 2148 114 270 -70EMMD104 478497 7739578 2145 194 270 -65EMMD105 478341 7739732 2146 352 270 -65EMMD106 478391 7739732 2146 346 270 -65EMMD107 478125 7739735 2146 157 90 -60EMMD108 478608 7738476 2148 90 270 -60EMMD109 478492 7738576 2147 124 270 -60EMMD110 478608 7738572 2147 276 270 -70EMMD111 478688 7738573 2147 167 90 -70EMMD112 478757 7738573 2147 96 90 -60EMMD113 477741 7739614 2147 108 90 -60EMMD114 477810 7739616 2147 256 90 -60EMMD115 477884 7739616 2147 103 90 -60EMMD116 477574 7739776 2147 345 90 -60EMMD117 477822 7739877 2146 367 90 -60EMMD118 477798 7739774 2146 508 90 -60EMMD119 477624 7739876 2147 297 90 -60EMMD120 478561 7738526 2147 70 270 -65EMMD121 478621 7738526 2147 139 270 -70EMMD122 478677 7738525 2147 234 270 -80EMMD123 478707 7738524 2147 138 90 -70EMMD124 478758 7738524 2147 81 90 -60EMMD125 478706 7738426 2148 114 90 -70EMMD126 478656 7738477 2148 129 270 -70EMMD127 477822 7739526 2147 249 90 -60EMMD128 477922 7739524 2147 97 90 -60EMMD129 477922 7739422 2147 254 90 -60EMMD130 478017 7739427 2147 268 90 -60EMMD131 477822 7739292 2147 238 0 -90EMMD132 477922 7739294 2147 253 0 -90EMMD133 478023 7739295 2147 297 0 -90EMMD134 478040 7739123 2147 295 270 -60EMMD135 477910 7739525 2147 366 270 -65EMMD136 477886 7739618 2147 378 270 -60EMMD137 478127 7739734 2146 316 90 -70EMMD138 477815 7739526 2147 311 270 -60EMMD139 478269 7739692 2146 159 270 -60EMMD140 478322 7739828 2145 314 270 -60EMMD141 478320 7739773 2146 354 270 -60EMMD142 477832 7739573 2147 316 270 -60EMMD143 477776 7739614 2147 339 90 -60EMMD144 477827 7739672 2147 340 270 -65EMMD145 477787 7739473 2147 189 270 -60EMMD146 477758 7739613 2147 222 0 -90EMMD147 478270 7739728 2146 177 270 -60EMMD148 478219 7739731 2146 169 90 -60EMMD149 478190 7739730 2146 289 90 -70EMMD150 477620 7739659 2147 205 90 -60EMMD151 477624 7739679 2147 77 315 -60EMMD151A 477628 7739677 2147 191 315 -60EMMD152 478073 7739523 2147 354 270 -60EMMD153 477686 7739627 2147 317 90 -60EMMD154 477665 7739532 2147 211 125 -60EMMD155 477569 7739568 2147 191 260 -60EMMD156 478701 7738584 2147 140 85 -60
256
Appendix A: Sample Locations and Descriptions
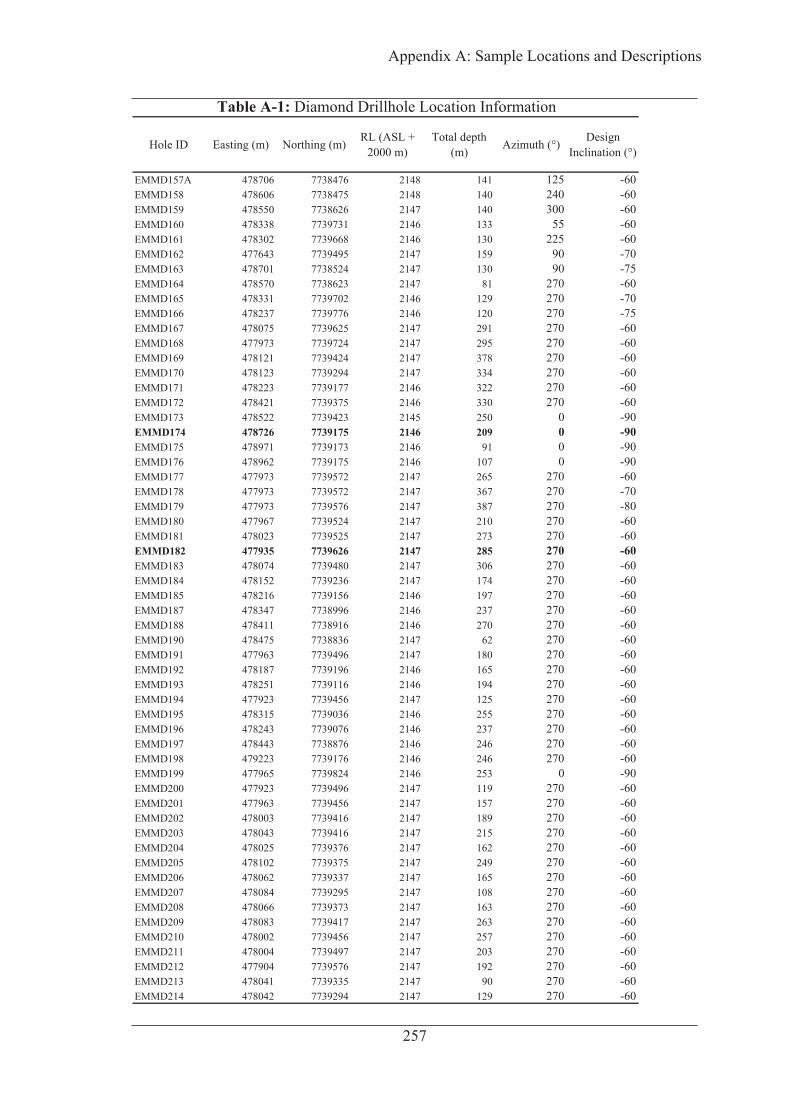
Hole ID Easting (m) Northing (m) RL (ASL + 2000 m)
Total depth (m) Azimuth (°) Design
Inclination (°)
Table A-1: Diamond Drillhole Location Information
EMMD157A 478706 7738476 2148 141 125 -60EMMD158 478606 7738475 2148 140 240 -60EMMD159 478550 7738626 2147 140 300 -60EMMD160 478338 7739731 2146 133 55 -60EMMD161 478302 7739668 2146 130 225 -60EMMD162 477643 7739495 2147 159 90 -70EMMD163 478701 7738524 2147 130 90 -75EMMD164 478570 7738623 2147 81 270 -60EMMD165 478331 7739702 2146 129 270 -70EMMD166 478237 7739776 2146 120 270 -75EMMD167 478075 7739625 2147 291 270 -60EMMD168 477973 7739724 2147 295 270 -60EMMD169 478121 7739424 2147 378 270 -60EMMD170 478123 7739294 2147 334 270 -60EMMD171 478223 7739177 2146 322 270 -60EMMD172 478421 7739375 2146 330 270 -60EMMD173 478522 7739423 2145 250 0 -90EMMD174 478726 7739175 2146 209 0 -90EMMD175 478971 7739173 2146 91 0 -90EMMD176 478962 7739175 2146 107 0 -90EMMD177 477973 7739572 2147 265 270 -60EMMD178 477973 7739572 2147 367 270 -70EMMD179 477973 7739576 2147 387 270 -80EMMD180 477967 7739524 2147 210 270 -60EMMD181 478023 7739525 2147 273 270 -60EMMD182 477935 7739626 2147 285 270 -60EMMD183 478074 7739480 2147 306 270 -60EMMD184 478152 7739236 2147 174 270 -60EMMD185 478216 7739156 2146 197 270 -60EMMD187 478347 7738996 2146 237 270 -60EMMD188 478411 7738916 2146 270 270 -60EMMD190 478475 7738836 2147 62 270 -60EMMD191 477963 7739496 2147 180 270 -60EMMD192 478187 7739196 2146 165 270 -60EMMD193 478251 7739116 2146 194 270 -60EMMD194 477923 7739456 2147 125 270 -60EMMD195 478315 7739036 2146 255 270 -60EMMD196 478243 7739076 2146 237 270 -60EMMD197 478443 7738876 2146 246 270 -60EMMD198 479223 7739176 2146 246 270 -60EMMD199 477965 7739824 2146 253 0 -90EMMD200 477923 7739496 2147 119 270 -60EMMD201 477963 7739456 2147 157 270 -60EMMD202 478003 7739416 2147 189 270 -60EMMD203 478043 7739416 2147 215 270 -60EMMD204 478025 7739376 2147 162 270 -60EMMD205 478102 7739375 2147 249 270 -60EMMD206 478062 7739337 2147 165 270 -60EMMD207 478084 7739295 2147 108 270 -60EMMD208 478066 7739373 2147 163 270 -60EMMD209 478083 7739417 2147 263 270 -60EMMD210 478002 7739456 2147 257 270 -60EMMD211 478004 7739497 2147 203 270 -60EMMD212 477904 7739576 2147 192 270 -60EMMD213 478041 7739335 2147 90 270 -60EMMD214 478042 7739294 2147 129 270 -60
257
Appendix A: Sample Locations and Descriptions
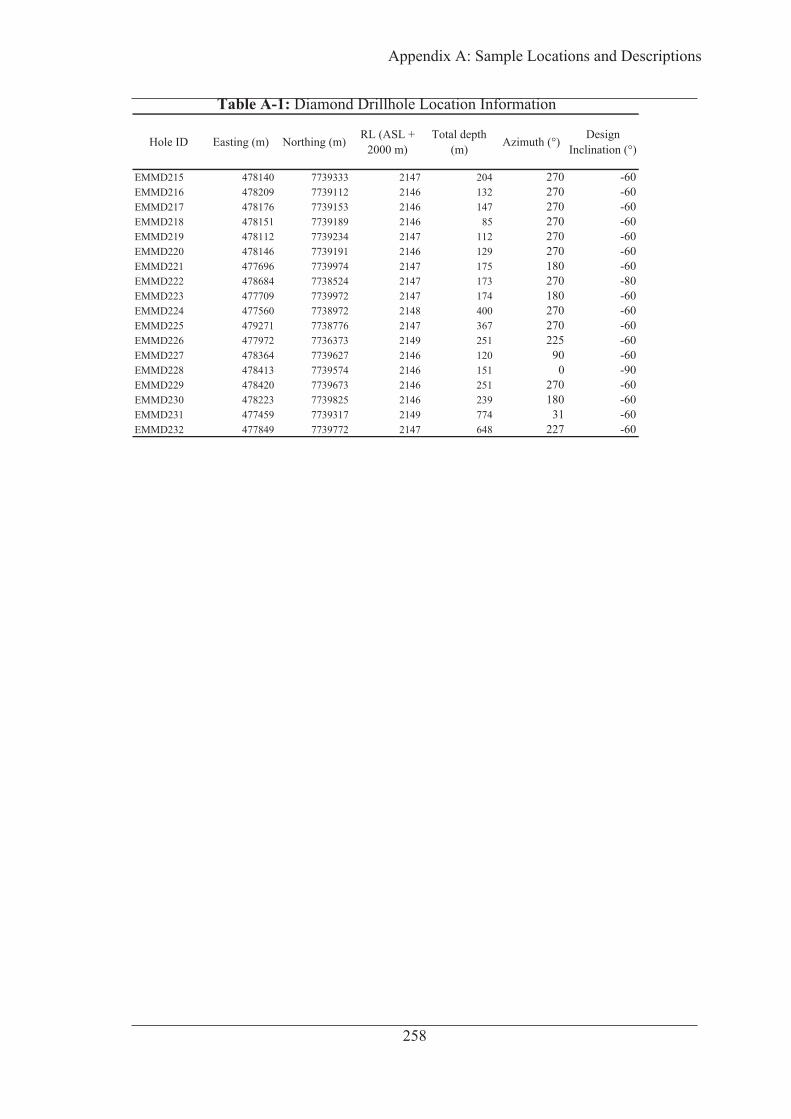
Hole ID Easting (m) Northing (m) RL (ASL + 2000 m)
Total depth (m) Azimuth (°) Design
Inclination (°)
Table A-1: Diamond Drillhole Location Information
EMMD215 478140 7739333 2147 204 270 -60EMMD216 478209 7739112 2146 132 270 -60EMMD217 478176 7739153 2146 147 270 -60EMMD218 478151 7739189 2146 85 270 -60EMMD219 478112 7739234 2147 112 270 -60EMMD220 478146 7739191 2146 129 270 -60EMMD221 477696 7739974 2147 175 180 -60EMMD222 478684 7738524 2147 173 270 -80EMMD223 477709 7739972 2147 174 180 -60EMMD224 477560 7738972 2148 400 270 -60EMMD225 479271 7738776 2147 367 270 -60EMMD226 477972 7736373 2149 251 225 -60EMMD227 478364 7739627 2146 120 90 -60EMMD228 478413 7739574 2146 151 0 -90EMMD229 478420 7739673 2146 251 270 -60EMMD230 478223 7739825 2146 239 180 -60EMMD231 477459 7739317 2149 774 31 -60EMMD232 477849 7739772 2147 648 227 -60
258
Appendix A: Sample Locations and Descriptions

Hole ID Down-hole depth (m) epyTnoitpircseD*DI elpmaS
EMMD001 43.95 EMMD001-1 altered breccia; carbonate vein TS - only
ylno - STsediflus nwonknu3-100DMME5.44100DMME
EMMD001 59.2 EMMD001-4 metavolcanic rock with quartz - carbonate infill TS - only
EMMD001 59.9 EMMD001-5 metavolcanic rock with quartz - carbonate infill TS - only
EMMD001 62.25 EMMD001-6 multiple generations of carbonate veining in metavolcanic TS - only
ylno - STaiccerb dezilarenim7-100DMME6.911100DMME
ylno - STaiccerb9-100DMME9.331100DMME
EMMD001 141.7 EMMD001-10 altered fabric or bedding TS - only
ylno - STseludgyma11-100DMME1.551100DMME
EMMD001 190.6 EMMD001-13 brecciated metavolcanics TS - only
ylno - STnieV ?etirab41-100DMME7.491100DMME
ylno - STgniddeb elbissop51-100DMME52.591100DMME
ylno - STetaremolgnocatem61-100DMME59.202100DMME
ylno - STniev etanobrac nworb 71-100DMME5.532100DMME
EMMD001 233.4 EMMD001-18 carbonate and unknown mineral small vein TS - only
ylno - STetyhcart deretla-der91-100DMME6.931100DMME
EMMD001 225.8 EMMD001-22 heavily altered "flattened" breccia TS - only
EMMD001 273.5 EMMD001-24 albite vein overprinted by biotite (partially chloritized?) TS - only
ylno - ST?etimmasp1-241DMME56241DMME
EMMD142 84.9 EMMD142-2 intercalated metasediments and metatuff? TS - only
Table A-2: Sample Descriptions
*This is the label associated with the sample. BU, bulk whole-rock; IS, isotope; FL, fluid inclusion; GC, geochronology. The abbrevations indicate that the sample was initially collected for the given type of analysis, but not all collected samples were analyzed.
E1 North
259
Appendix A: Sample Locations and Descriptions
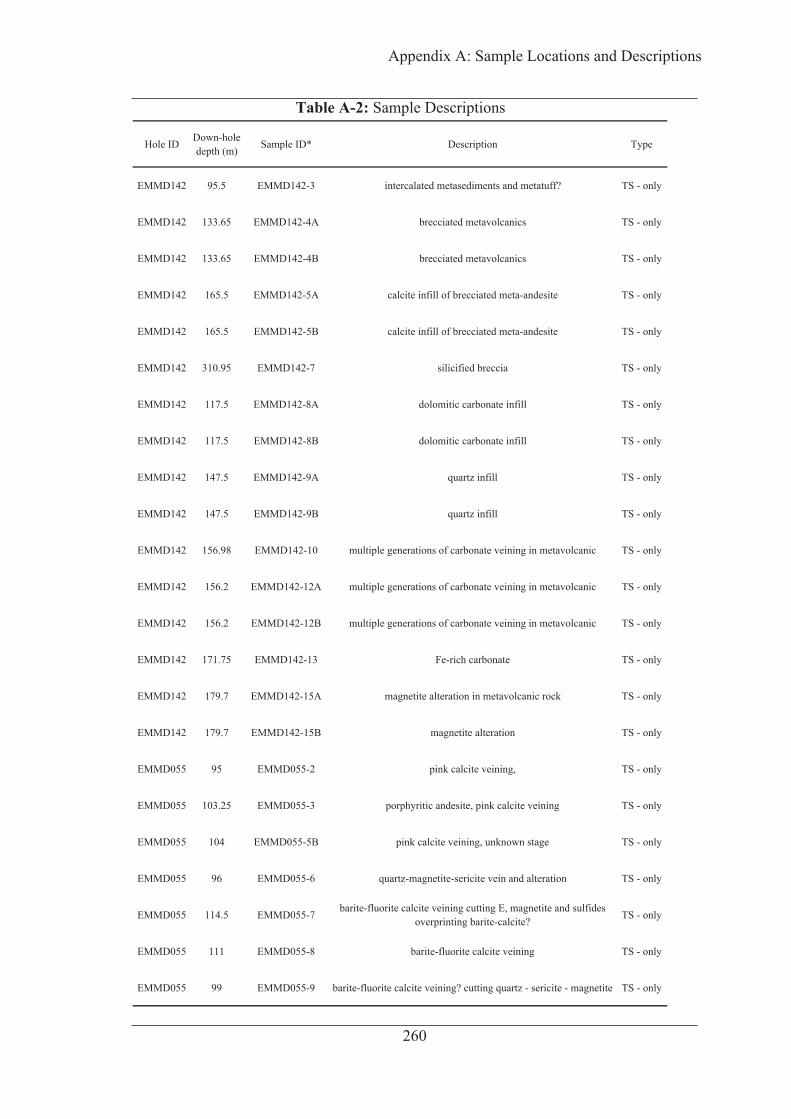
Hole ID Down-hole depth (m) epyTnoitpircseD*DI elpmaS
Table A-2: Sample Descriptions
EMMD142 95.5 EMMD142-3 intercalated metasediments and metatuff? TS - only
EMMD142 133.65 EMMD142-4A brecciated metavolcanics TS - only
EMMD142 133.65 EMMD142-4B brecciated metavolcanics TS - only
EMMD142 165.5 EMMD142-5A calcite infill of brecciated meta-andesite TS - only
EMMD142 165.5 EMMD142-5B calcite infill of brecciated meta-andesite TS - only
ylno - STaiccerb deificilis7-241DMME59.013241DMME
EMMD142 117.5 EMMD142-8A dolomitic carbonate infill TS - only
EMMD142 117.5 EMMD142-8B dolomitic carbonate infill TS - only
ylno - STllifni ztrauqA9-241DMME5.741241DMME
ylno - STllifni ztrauqB9-241DMME5.741241DMME
EMMD142 156.98 EMMD142-10 multiple generations of carbonate veining in metavolcanic TS - only
EMMD142 156.2 EMMD142-12A multiple generations of carbonate veining in metavolcanic TS - only
EMMD142 156.2 EMMD142-12B multiple generations of carbonate veining in metavolcanic TS - only
ylno - STetanobrac hcir-eF31-241DMME57.171241DMME
EMMD142 179.7 EMMD142-15A magnetite alteration in metavolcanic rock TS - only
ylno - STnoitaretla etitengamB51-241DMME7.971241DMME
ylno - ST ,gniniev eticlac knip2-550DMME59550DMME
EMMD055 103.25 EMMD055-3 porphyritic andesite, pink calcite veining TS - only
EMMD055 104 EMMD055-5B pink calcite veining, unknown stage TS - only
EMMD055 96 EMMD055-6 quartz-magnetite-sericite vein and alteration TS - only
EMMD055 114.5 EMMD055-7 barite-fluorite calcite veining cutting E, magnetite and sulfides overprinting barite-calcite? TS - only
EMMD055 111 EMMD055-8 barite-fluorite calcite veining TS - only
EMMD055 99 EMMD055-9 barite-fluorite calcite veining? cutting quartz - sericite - magnetite TS - only
260
Appendix A: Sample Locations and Descriptions
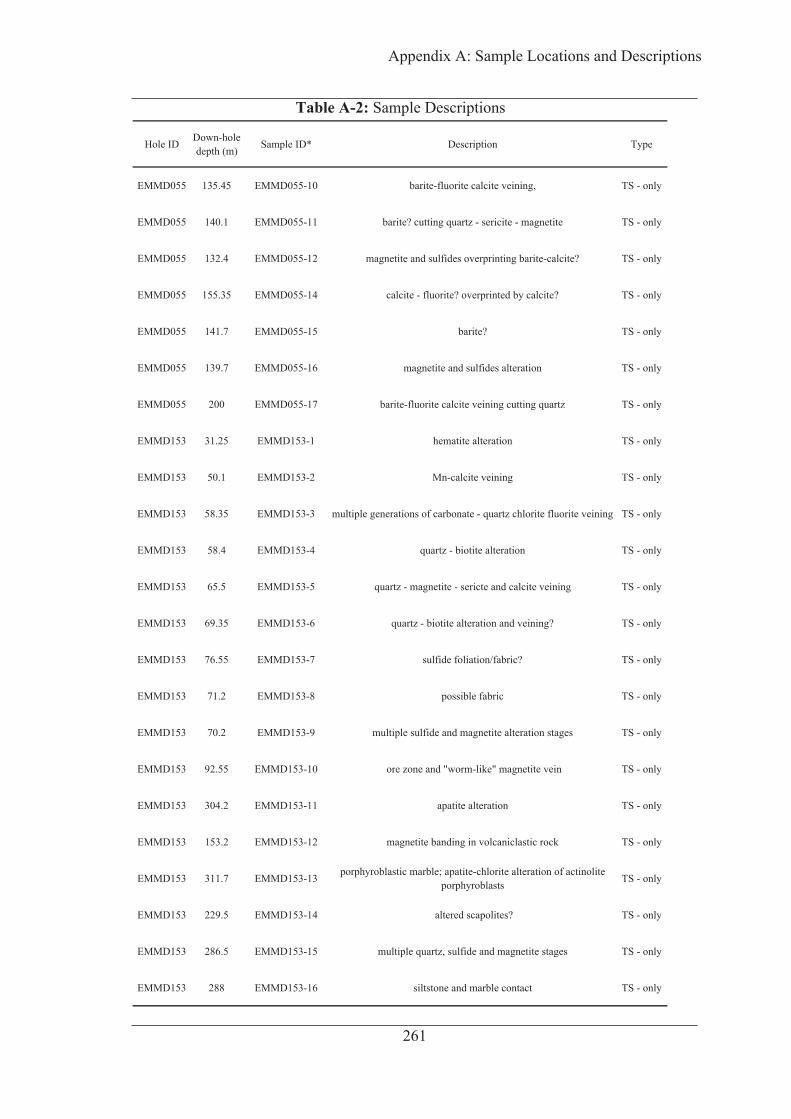
Hole ID Down-hole depth (m) epyTnoitpircseD*DI elpmaS
Table A-2: Sample Descriptions
EMMD055 135.45 EMMD055-10 barite-fluorite calcite veining, TS - only
EMMD055 140.1 EMMD055-11 barite? cutting quartz - sericite - magnetite TS - only
EMMD055 132.4 EMMD055-12 magnetite and sulfides overprinting barite-calcite? TS - only
EMMD055 155.35 EMMD055-14 calcite - fluorite? overprinted by calcite? TS - only
ylno - ST ?etirab51-550DMME7.141550DMME
EMMD055 139.7 EMMD055-16 magnetite and sulfides alteration TS - only
EMMD055 200 EMMD055-17 barite-fluorite calcite veining cutting quartz TS - only
ylno - STnoitaretla etitameh1-351DMME52.13351DMME
ylno - STgniniev eticlac-nM2-351DMME1.05351DMME
EMMD153 58.35 EMMD153-3 multiple generations of carbonate - quartz chlorite fluorite veining TS - only
EMMD153 58.4 EMMD153-4 quartz - biotite alteration TS - only
EMMD153 65.5 EMMD153-5 quartz - magnetite - sericte and calcite veining TS - only
EMMD153 69.35 EMMD153-6 quartz - biotite alteration and veining? TS - only
ylno - ST?cirbaf/noitailof ediflus7-351DMME55.67351DMME
ylno - STcirbaf elbissop8-351DMME2.17351DMME
EMMD153 70.2 EMMD153-9 multiple sulfide and magnetite alteration stages TS - only
EMMD153 92.55 EMMD153-10 ore zone and "worm-like" magnetite vein TS - only
ylno - STnoitaretla etitapa11-351DMME2.403351DMME
EMMD153 153.2 EMMD153-12 magnetite banding in volcaniclastic rock TS - only
EMMD153 311.7 EMMD153-13 porphyroblastic marble; apatite-chlorite alteration of actinolite porphyroblasts TS - only
ylno - ST?setilopacs deretla 41-351DMME5.922351DMME
EMMD153 286.5 EMMD153-15 multiple quartz, sulfide and magnetite stages TS - only
EMMD153 288 EMMD153-16 siltstone and marble contact TS - only
261
Appendix A: Sample Locations and Descriptions

Hole ID Down-hole depth (m) epyTnoitpircseD*DI elpmaS
Table A-2: Sample Descriptions
ylno - STgniniev eticlac71-351DMME52.762351DMME
EMMD153 288.9 EMMD153-18 quartz - magnetite veining? TS - only
EMMD153 208 EMMD153-19 deformed quartz veining TS - only
EMMD153 306.5 - 306.7 IS005 collected for isotope analysis of the marble as well as a better TS core+TS
EMMD153 301.55 IS006 distinct calcite stage cut by pink calcite core+TS
EMMD153 288 IS007 very late pink calcite+-fluorite+-quartz+-cpy (which cuts the yellow calcite); TS for the host rock fragments core
EMMD153 287.6 IS008 Large, 20 cm pink calcite-chalcopyrite-fluorite vein in marble; some reworking of the calcite core
EMMD153 293.2 IS009 pink calcite-pyrite-chalcopyrite vein cutting marble core
EMMD153 301.55 IS010 (301.55C) chalcopyrite associated w/ yellow calcite vein stage core
EMMD153 277.5 IS011 yellow calcite stage w/ cpy and qtz; marked C, A, B respectively; TS for host rock portion core+TS
EMMD153 283.6 IS013 very coarse, late magnetite+- sulfide banding; also carbonate and qtz? core
EMMD146 216.3 IS014 massive metavolcanic rock, irregular chalcopyrite infill? And alteration core
EMMD146 214.9 - 215.05 IS015 large irregular yellow calcite infill core+TS
EMMD146 111.4 IS016 very fine-grained (early) magnetite layer in suspected corella marble, w/ some Fe-calcite core+TS
EMMD146 78 IS017 also minor magnetite; try and separate?? core
EMMD146 154.6 FL001 going to try and find fluid inclusions in the albite core+TS
EMMD135 153 GC03 metavolcanic rock?; minor carbonate veining & alteration core
EMMD182 82.3 EMMD182-82.3 calcite-biotite vein in andesite; also may be viable for carbonate isotopes core+TS
EMMD182 91.7- 92.3 GC06 relatively "fresh" andesite w/ some minor chlorite alteration and carbonate and albite? veining core
262
Appendix A: Sample Locations and Descriptions
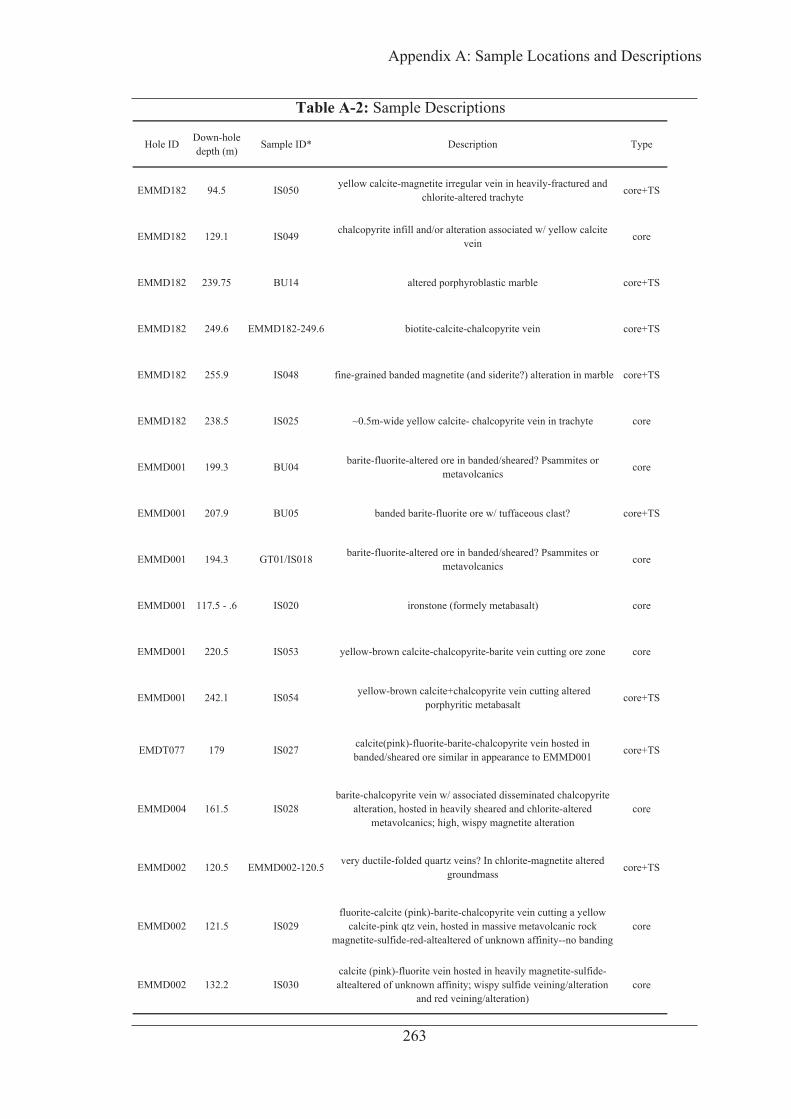
Hole ID Down-hole depth (m) epyTnoitpircseD*DI elpmaS
Table A-2: Sample Descriptions
EMMD182 94.5 IS050 yellow calcite-magnetite irregular vein in heavily-fractured and chlorite-altered trachyte core+TS
EMMD182 129.1 IS049 chalcopyrite infill and/or alteration associated w/ yellow calcite vein core
ST+erocelbram citsalboryhprop deretla41UB57.932281DMME
EMMD182 249.6 EMMD182-249.6 biotite-calcite-chalcopyrite vein core+TS
EMMD182 255.9 IS048 fine-grained banded magnetite (and siderite?) alteration in marble core+TS
EMMD182 238.5 IS025 ~0.5m-wide yellow calcite- chalcopyrite vein in trachyte core
EMMD001 199.3 BU04 barite-fluorite-altered ore in banded/sheared? Psammites or metavolcanics core
EMMD001 207.9 BU05 banded barite-fluorite ore w/ tuffaceous clast? core+TS
EMMD001 194.3 GT01/IS018 barite-fluorite-altered ore in banded/sheared? Psammites or metavolcanics core
eroc)tlasabatem ylemrof( enotsnori020SI6. - 5.711100DMME
EMMD001 220.5 IS053 yellow-brown calcite-chalcopyrite-barite vein cutting ore zone core
EMMD001 242.1 IS054 yellow-brown calcite+chalcopyrite vein cutting altered porphyritic metabasalt core+TS
EMDT077 179 IS027 calcite(pink)-fluorite-barite-chalcopyrite vein hosted in banded/sheared ore similar in appearance to EMMD001 core+TS
EMMD004 161.5 IS028barite-chalcopyrite vein w/ associated disseminated chalcopyrite
alteration, hosted in heavily sheared and chlorite-altered metavolcanics; high, wispy magnetite alteration
core
EMMD002 120.5 EMMD002-120.5 very ductile-folded quartz veins? In chlorite-magnetite altered groundmass core+TS
EMMD002 121.5 IS029fluorite-calcite (pink)-barite-chalcopyrite vein cutting a yellow
calcite-pink qtz vein, hosted in massive metavolcanic rock magnetite-sulfide-red-altealtered of unknown affinity--no banding
core
EMMD002 132.2 IS030calcite (pink)-fluorite vein hosted in heavily magnetite-sulfide-altealtered of unknown affinity; wispy sulfide veining/alteration
and red veining/alteration)core
263
Appendix A: Sample Locations and Descriptions
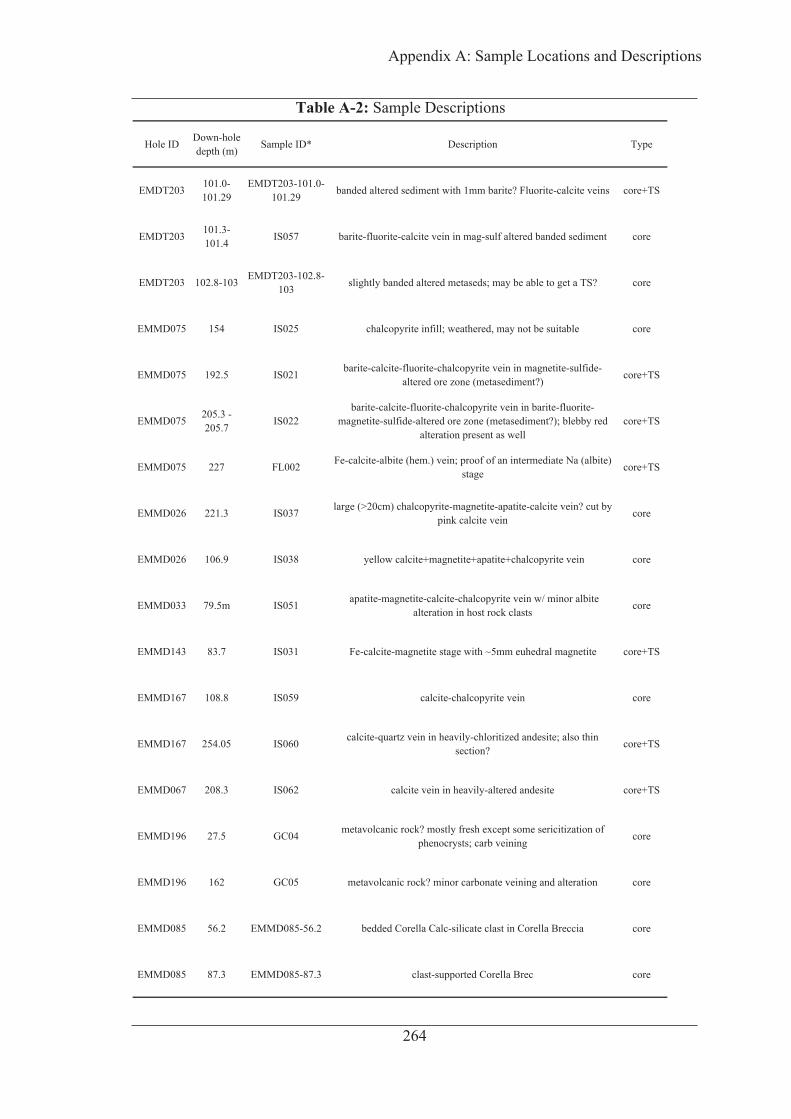
Hole ID Down-hole depth (m) epyTnoitpircseD*DI elpmaS
Table A-2: Sample Descriptions
EMDT203 101.0-101.29
EMDT203-101.0-101.29 banded altered sediment with 1mm barite? Fluorite-calcite veins core+TS
EMDT203 101.3-101.4 IS057 barite-fluorite-calcite vein in mag-sulf altered banded sediment core
EMDT203 102.8-103 EMDT203-102.8-103 slightly banded altered metaseds; may be able to get a TS? core
EMMD075 154 IS025 chalcopyrite infill; weathered, may not be suitable core
EMMD075 192.5 IS021 barite-calcite-fluorite-chalcopyrite vein in magnetite-sulfide-altered ore zone (metasediment?) core+TS
EMMD075 205.3 - 205.7 IS022
barite-calcite-fluorite-chalcopyrite vein in barite-fluorite-magnetite-sulfide-altered ore zone (metasediment?); blebby red
alteration present as wellcore+TS
EMMD075 227 FL002 Fe-calcite-albite (hem.) vein; proof of an intermediate Na (albite) stage core+TS
EMMD026 221.3 IS037 large (>20cm) chalcopyrite-magnetite-apatite-calcite vein? cut by pink calcite vein core
EMMD026 106.9 IS038 yellow calcite+magnetite+apatite+chalcopyrite vein core
EMMD033 79.5m IS051 apatite-magnetite-calcite-chalcopyrite vein w/ minor albite alteration in host rock clasts core
EMMD143 83.7 IS031 Fe-calcite-magnetite stage with ~5mm euhedral magnetite core+TS
erocniev etirypoclahc-eticlac950SI8.801761DMME
EMMD167 254.05 IS060 calcite-quartz vein in heavily-chloritized andesite; also thin section? core+TS
EMMD067 208.3 IS062 calcite vein in heavily-altered andesite core+TS
EMMD196 27.5 GC04 metavolcanic rock? mostly fresh except some sericitization of phenocrysts; carb veining core
EMMD196 162 GC05 metavolcanic rock? minor carbonate veining and alteration core
EMMD085 56.2 EMMD085-56.2 bedded Corella Calc-silicate clast in Corella Breccia core
EMMD085 87.3 EMMD085-87.3 clast-supported Corella Brec core
264
Appendix A: Sample Locations and Descriptions

Hole ID Down-hole depth (m) epyTnoitpircseD*DI elpmaS
Table A-2: Sample Descriptions
EMMD085 147.3 EMMD085-147.3 clast-supported Corella Brec core
EMMD085 161 EMMD085-161 matrix-supported Corella Brec core
EMMD085 231.7 EMMD085-231.7 Corella Brec. w/ calcite infill core
EMMD085 393.2 EMMD085-393.2 tuff clast? In Corella Brec core
EMMD085 386.2 EMMD085-386.2 clast-supported Corella Brec core
EMMD085 169 EMMD085-169 altered phaneritic clast in Corella Breccia core
EMMD085 112.8 EMMD085-112.8 slightly altered metadolerite intruding Corella Breccia core
erocffut dezilarenim5.013-580DMME5.013580DMME
erocffut dezilarenim1.443-580DMME1.443580DMME
erocffut dezilarenim8.663-580DMME8.663580DMME
EMMD085 288.75 EMMD085-288.75 tuff with fabric; mostly unmineralized core
EMMD086 105.9 EMMD086-105.9 vein-like "autobreccia" features?; chlo mtx; qtz-mag "veins"/clasts core
EMMD086 194.9 EMMD086-194.9 massive metavolcanic rock; minor stg-3 veining; most likely albite-altered; very little magnetite core
EMMD086 167.9 EMMD086-167.9 metadolerite? Fine- to fine-med-grained (coarser than basalt); massive metavolcanic rock; mag+mafic minerals core
EMMD086 48.4 EMMD086-48.4 moderate clast flattening-alignment; mag-rich clasts in chlo-serc mtx; core
EMMD086 125 EMMD086-125 clastic; flattened; aligned; chlo-mag-qtz-carb matrix w/ blotchy py+cpy core
EMMD136 124 EMMD136-124 porphyritic; 0.5x2mm phenocrysts (sericitized); red alteration and sulfides core
erocderetla ;citiryhprop9.17-631DMME9.17631DMME
265
Appendix A: Sample Locations and Descriptions

Hole ID Down-hole depth (m) epyTnoitpircseD*DI elpmaS
Table A-2: Sample Descriptions
EMMD136 215 EMMD136-215 massive metavolcanic rock; carbonate altered? core
EMMD136 361.8 EMMD136-361.8 massive metavolcanic rock; altered; contacts with sample 362.2 core
EMMD136 321.03 EMMD136-321.03 porphyritic and amygdaloidal metavolcanic rock; phenocrysts red-altered core
EMMD136 267.5 EMMD136-267.5 disseminated pyrite; sheared amygdales nearby (no O-line) core
EMMD136 362.2 EMMD136-362.2 heavily-altered w/ mag-sulf; wispy banding = tuff?; split into two samples: B = fresher basalt 361.8 core
EMMD136 170 EMMD136-170 bedded/layered but some 1-5mm clasts; siderite-mag-chlo-sulfide alteration core
EMMD075 166 EMMD075-166 massive metavolcanic rockcontacting thin banded layer (sample is basalt); porphyritic? (now partially carb-altered? 0.5 - 1mm core
EMMD075 116.2 EMMD075-116.2 chlo-alb; minor magnetite; weathered core
EMMD075 39.4 EMMD075-39.4clastic tuff? Clasts aligned but not much flattening; mostly qtz-ser-
chlo clasts (w/ some mag); chlo-mag-ser mtx; plag phenocrysts 0.5 - 2mm (not tabular); dissem sulfides
core
EMMD077 37.5 EMMD077-37.5 phaneritic clast in breccia; red-altered core
EMMD077 162.4 EMMD077-162.4 could be metadolerite? Med-grained but may be alteration texture (chlorite); not much mica core
EMMD077 81.7 EMMD077-81.7 amygdaloidal metavolcanic rock; chlorite-mag-alt core
EMMD077 249.95 EMMD077-249.95 clastic; aligned; partially-flattened clasts; very angular; mtx-spt; mag mtx; qtz-ser clasts w/ alteration haloes; stg 3 veins core
EMMD077 201.5 EMMD077-201.5 clastic tuff; moderately-aligned; similar alt-style to sample 249.95; clast-supported, 1-20mm core
EMMD077 290 EMMD077-290 clastic tuff; moderate-well aligned; somewhat flattened; angular to subrounded, 1-30mm; similar alt style to 249.95 core
EMMD113 97.6 EMMD113-97.6weathered; bedded; mostly hematite+sulfides; carbonate??;
moderate magnetite; [probably supergene]; med-grained; stg 3 veins
core
erocsniev 4 gts ;sreyal yp-ztq5.501-761DMME5.501761DMME
eroc5.501 ees721-761DMME721761DMME
266
Appendix A: Sample Locations and Descriptions

Hole ID Down-hole depth (m) epyTnoitpircseD*DI elpmaS
Table A-2: Sample Descriptions
EMMD167 234 EMMD167-234 red-altered phenocrysts, 1-30mm; chlorite groundmass core
EMMD167 279.8 EMMD167-279.8stg 3? 4? Veining w/ red alteration; phenocrysts (1-20mm)
heavily altered and hard to tell from groundmass (which is bio-chlo)
core
EMMD167 180.3 EMMD167-180.3 chlorite groundmass; blebby carb alt; vesicular? 2 - 15mm phenocrysts core
eroccitiryhprop781-760DMME781760DMME
erocdenettalF ?ffut citsalc721-760DMME721760DMME
erocderehtaeW ?ffut citsalc67-760DMME67760DMME
EMMD114 70.8 EMMD114-70.8 porphyritic; dark-gray (relatively-fresh?) groundmass core
EMMD114 198.4 EMMD114-198.4 metaandesite contacting w/ heavily-altered "flow"? (sample is from less-altered portion) core
E1 East
EMMD007 58.4 BU001 relatively unaltered, some calcite veining and chloritization of matrix core
EMMD007 63.5 BU002 presumably unaltered? (hematite-stained) calc-silicate layer core
EMMD007 110.2 BU003 banded ore, w/ magnetite, sulfides and siderite? Stage uncertain core
erocniev etirab-eticlac knip etal100SI8.211700DMME
erocniev etirab-eticlac knip etal200SI5.302700DMME
EMMD007 104.4 IS003 2cm band of fine-grained magnetite (early) core
ST+erocniev etirab-eticlac knip etal400SI2.112700DMME
EMMD007 223.6 IS012 large, euhedral magnetite infill in white (pink?) calcite+mag+cpy vein core+TS
eroc620SI5.671110MME
EMM011 202 IS055 barite-calcite vein cut by calcite vein; in magnetite-altered laminated Corella core+TS
EMM011 208.1 EMM011-208.1 albite?-rich banded and mineralized Corella core+TS
EMM008 93.1 EMM008-93.1 epidote-chlorite-albite altered diorite core+TS
267
Appendix A: Sample Locations and Descriptions

Hole ID Down-hole depth (m) epyTnoitpircseD*DI elpmaS
Table A-2: Sample Descriptions
EMM008 134.5 IS039 pink calcite+qtz+minor chalcopyrite partially brecciating a chlorite-calcite altered metabasal core
EMMD008 60.55 EMMD008-1 unknown sulfide? Clast, unit 1 breccia TS - only
EMMD008 114.45 EMMD008-2 barite cutting calcite vein? TS - only
EMMD008 119.09 EMMD008-3 multiple calcite vein stages TS - only
EMMD008 119 EMMD008-4 multiple calcite vein stages TS - only
EMMD008 118.95 EMMD008-5 multiple calcite vein stages TS - only
ylno - ST?etirab gnittuc eticlac6-800DMME5.931800DMME
EMMD008 143.75 EMMD008-7 feldspar veining cut by calcite TS - only
ylno - STsegats elpitlum M egats8-800DMME53.77800DMME
ylno - STelbram deretla9-800DMME2.96800DMME
ylno - ST?etimmasp01-800DMME8.67800DMME
EMMD008 108.8 EMMD008-11 metavolcaniclastic rock TS - only
EMMD008 108.1 EMMD008-12 altered porphyroblastic metasediment TS - only
EMMD008 145.8 EMMD008-14A calcite - barite - fluorite veining TS - only
ylno - STgniniev etirolhc eticlac51-800DMME52.431800DMME
ylno - STgniniev etirolhc eticlac61-800DMME53.431800DMME
ylno - ST?gniniev etirab71-800DMME53.131800DMME
ylno - STgniniev etirypoclahc81-800DMME5.07800DMME
ylno - ST?etilopacs tciler91-800DMME51.611800DMME
ylno - STaiccerb dednuor1-700DMME2.36700DMME
ylno - STetiroid2-700DMME6.98700DMME
268
Appendix A: Sample Locations and Descriptions

Hole ID Down-hole depth (m) epyTnoitpircseD*DI elpmaS
Table A-2: Sample Descriptions
EMMD007 107.4 EMMD007-3 flaser cross-bedding in psammite TS - only
EMMD007 53.7 EMMD007-4 unidentified alteration assemblage TS - only
EMMD007 174.6 EMMD007-5 unknown volcanic material TS - only
ylno - STkcor cinaclovatem6-700DMME51.641700DMME
EMMD007 220.7 EMMD007-7 unknown lithology with carbonate veining TS - only
EMMD007 212 EMMD007-8 carbonate vein and sedimentary clast TS - only
EMMD007 118.5 EMMD007-9A carbonate veining and sulfides TS - only
EMMD007 118.5 EMMD007-9B carbonate veining and sulfides TS - only
EMMD007 155.9 EMMD007-10A carbonate veining cutting chlorite? TS - only
EMMD007 155.9 EMMD007-10B carbonate veining cutting chlorite? TS - only
EMMD007 159 EMMD007-11 carbonate veining cutting chlorite? TS - only
EMMD007 113.9 EMMD007-12 possibly multiple stages of sulfide and magnetite alteration TS - only
ylno - STgniniev etanobrac31-700DMME9.701700DMME
EMMD007 114.6 EMMD007-14A possibly multiple stages of sulfide and magnetite alteration TS - only
EMMD007 114.6 EMMD007-14B possibly multiple stages of sulfide and magnetite alteration TS - only
EMMD007 115.5 EMMD007-15A quartz-magnetite infill and alteration TS - only
EMMD007 115.5 EMMD007-15B quartz-magnetite infill and alteration TS - only
EMMD008 60.5 EMMD008-60.5 matrix-supported Corella Brec core
EMMD008 125.9 EMMD008-125.9 porphyritic (1mm); red alteration core
EMMD008 93.3 EMMD008-93.3 laminated silt, mineralized core
EMMD013 170.9 EMMD013-170.9 uncertain lith; biotite mtx, red-altered clasts; clasts not well-defined; lots of qtz veining core
269
Appendix A: Sample Locations and Descriptions

Hole ID Down-hole depth (m) epyTnoitpircseD*DI elpmaS
Table A-2: Sample Descriptions
EMMD013 150.8 EMMD013-150.8 heavily-veined; not logged before; lots of qtz-veining parallel & perpendicular to bedding core
EMMD013 101.6 EMMD013-101.6 laminated silt, mineralized; mag-altered; carbonaceous? core
EMMD066 40 EMMD066-40 metaandesite flow in porphyritic volcaniclastic core
EMMD066 123.6 EMMD066-123.6 massive metavolcanic rock core
EMMD066 176 EMMD066-176 massive metavolcanic rock core
EMMD066 53.6 EMMD066-53.6 psammite? in layered clastic tuff core
EMMD066 100.4 EMMD066-100.4 clastic tuff; mineralized; in footwall of major FZ core
EMMD009 182.3 EMMD009-182.3 unmineralized, laminated; heavily-veined; similar to EMMD013 150.8 core
EMMD009 131.9 EMMD009-131.9 partially-mineralized; heavily-veined core
erocstsyrconehp mm5.0101-810DMME101810DMME
EMMD018 139 EMMD018-139 massive metavolcanic rock; similar to 101 core
EMMD018 60.9 EMMD018-60.9 fine psammite-silt; boudinaged silaceous layer core
EMMD097 128.5 EMMD097-128.5 massive metavolcanic rock; blebby carbonate alt core
EMMD097 174.1 EMMD097-174.1 massive metavolcanic rock; carbonate veining core
EMMD097 269 EMMD097-269 porphyritic? Partially carbonate-altered (blebby carbonate instead?) core
EMMD097 74.14 EMMD097-74.14 partially-mineralized; interbedded calcereous and chlo-altered layers; supergene w/ native-Cu core
EMMD097 226.15 EMMD097-226.15 calcereous (Fe-rich, not much fizz); magnetite-laminae; core
EMMD078 89 EMMD078-89 massive metavolcanic rock; chrysocolla in weathered veins core
270
Appendix A: Sample Locations and Descriptions
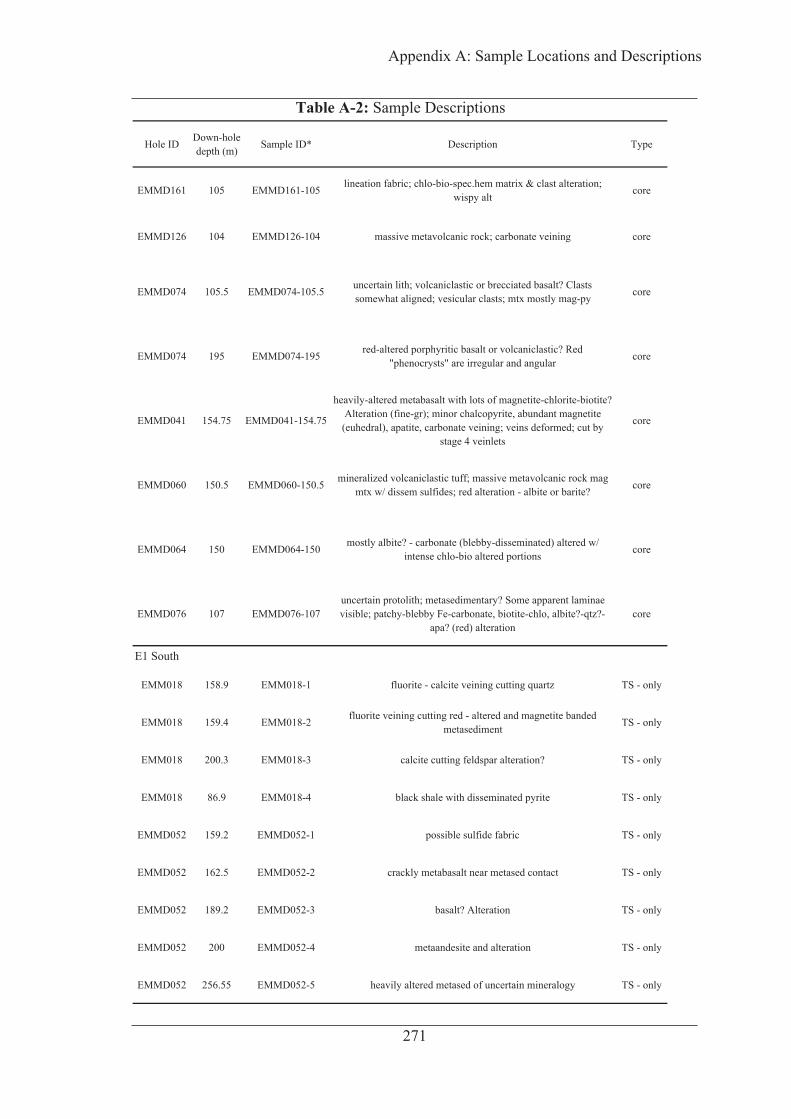
Hole ID Down-hole depth (m) epyTnoitpircseD*DI elpmaS
Table A-2: Sample Descriptions
EMMD161 105 EMMD161-105 lineation fabric; chlo-bio-spec.hem matrix & clast alteration; wispy alt core
EMMD126 104 EMMD126-104 massive metavolcanic rock; carbonate veining core
EMMD074 105.5 EMMD074-105.5 uncertain lith; volcaniclastic or brecciated basalt? Clasts somewhat aligned; vesicular clasts; mtx mostly mag-py core
EMMD074 195 EMMD074-195 red-altered porphyritic basalt or volcaniclastic? Red "phenocrysts" are irregular and angular core
EMMD041 154.75 EMMD041-154.75
heavily-altered metabasalt with lots of magnetite-chlorite-biotite? Alteration (fine-gr); minor chalcopyrite, abundant magnetite (euhedral), apatite, carbonate veining; veins deformed; cut by
stage 4 veinlets
core
EMMD060 150.5 EMMD060-150.5 mineralized volcaniclastic tuff; massive metavolcanic rock mag mtx w/ dissem sulfides; red alteration - albite or barite? core
EMMD064 150 EMMD064-150 mostly albite? - carbonate (blebby-disseminated) altered w/ intense chlo-bio altered portions core
EMMD076 107 EMMD076-107uncertain protolith; metasedimentary? Some apparent laminae visible; patchy-blebby Fe-carbonate, biotite-chlo, albite?-qtz?-
apa? (red) alterationcore
E1 South
EMM018 158.9 EMM018-1 fluorite - calcite veining cutting quartz TS - only
EMM018 159.4 EMM018-2 fluorite veining cutting red - altered and magnetite banded metasediment TS - only
EMM018 200.3 EMM018-3 calcite cutting feldspar alteration? TS - only
EMM018 86.9 EMM018-4 black shale with disseminated pyrite TS - only
ylno - STcirbaf ediflus elbissop1-250DMME2.951250DMME
EMMD052 162.5 EMMD052-2 crackly metabasalt near metased contact TS - only
ylno - STnoitaretlA ?tlasab3-250DMME2.981250DMME
EMMD052 200 EMMD052-4 metaandesite and alteration TS - only
EMMD052 256.55 EMMD052-5 heavily altered metased of uncertain mineralogy TS - only
271
Appendix A: Sample Locations and Descriptions

Hole ID Down-hole depth (m) epyTnoitpircseD*DI elpmaS
Table A-2: Sample Descriptions
ylno - ST?tnemidesatem deretla6-250DMME6.362250DMME
EMMD052 285.85 EMMD052-7 metasediment? w/ disseminated sulfides TS - only
EMMD052 362.65 EMMD052-8 carbonate-cemented breccia TS - only
ylno - STrolyaT .R yb detcelloc937695.361910MME
ylno - STrolyaT .R yb detcelloc04769nwonknu910MME
EMMD046 59.7 GC07 metavolcanic rock? Andesite w/ carbonate veinin core
EMM018 134.5 IS061 calcite-quartz-chalcopy veining in altered metabasalt? core
EMMD042 171.2 GC02 metavolcanic rock? some disseminated Fe-calcite alteration & veining, but little chlorite-sericite core
EMM023 178.3 EMM023-178.3 albite vein (possibly stage 3? or overprinted by it) core+TS
eroctnemidesatem dezilarenim klub60UB1.351320MME
EMMD052 314.5 BU13/IS041 slightly mineralized, banded dolomitic marble w/ fluorite alteration core
EMMD052 343 IS042 yellow calcite vein in massive metavolcanic rock-amygdaloidal metavolcanic rock metabsalt core
EMMD045 178.9-179.3 BU09/IS021 multiple samples; one for bulk ore, one for carbonate isotopes? core+TS
EMMD043 82.5 EMMD043-82.5 calcite vein in andesite/trachyte core
ST+erocklub ;stnemidesatem S1E80UB9.611340DMME
erocero klub70UB8.511340DMME
EMMD043 168.9 IS058 large irregular infill in amygdaloidal metavolcanic rock metabasalt; calcite+quartz core+TS
EMM019 126.8 IS023 bulk sample of black shale for C isotopes? + TS; contains significant pyrrhotite core
EMM019 137.65 IS024 epigenetic (late stage) pyrite alteration in qtz-rich layer of black shale core
EMM019 177.7 IS044 yellow-brown calcite+qtz+chalcopyrite+pyrite vein in metasilt core
EMM019 192 IS040 yelow calcite-chalcopyrite vein cutting metasilts; remaining 1/4 core taken core
EMM019 202.5 EMM019-202.5 coarse arsenopyrite for probing; chlorite-altered groundmass core+TS
EMM019 205.4 IS043 fine-grained sulfide alteration and birds-wing calcite veining core
272
Appendix A: Sample Locations and Descriptions
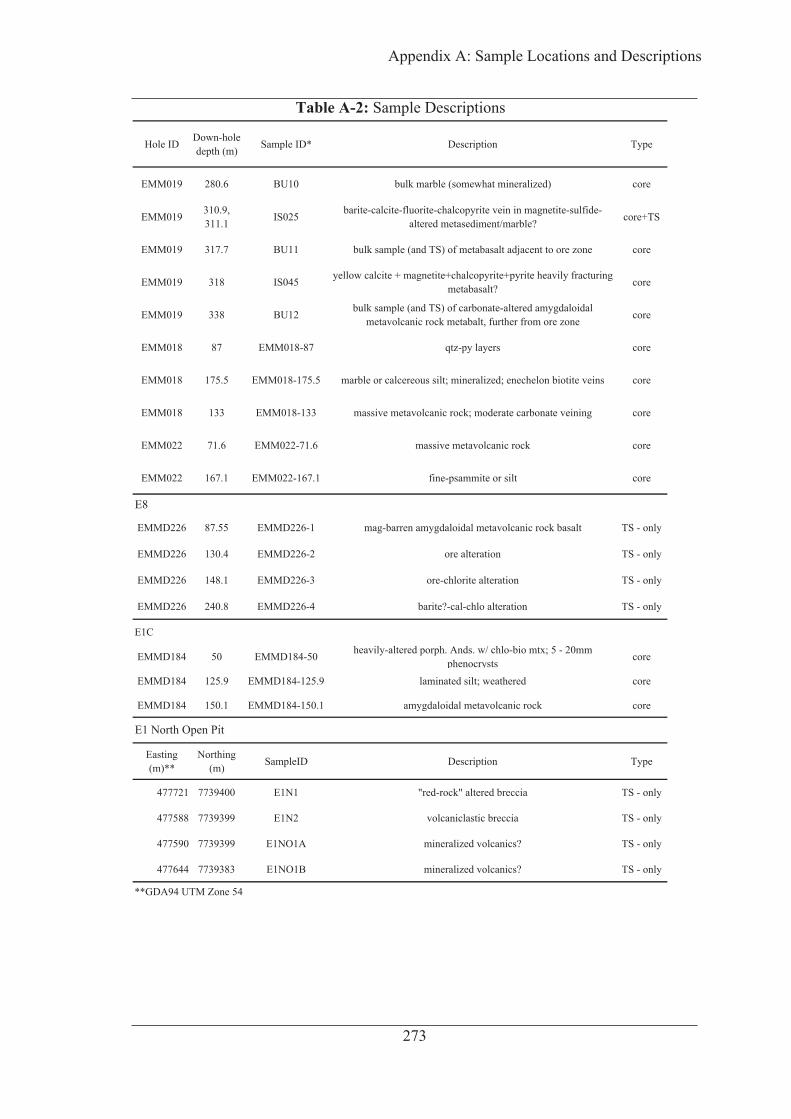
Hole ID Down-hole depth (m) epyTnoitpircseD*DI elpmaS
Table A-2: Sample Descriptions
EMM019 280.6 BU10 bulk marble (somewhat mineralized) core
EMM019 310.9, 311.1 IS025 barite-calcite-fluorite-chalcopyrite vein in magnetite-sulfide-
altered metasediment/marble? core+TS
EMM019 317.7 BU11 bulk sample (and TS) of metabasalt adjacent to ore zone core
EMM019 318 IS045 yellow calcite + magnetite+chalcopyrite+pyrite heavily fracturing metabasalt? core
EMM019 338 BU12 bulk sample (and TS) of carbonate-altered amygdaloidal metavolcanic rock metabalt, further from ore zone core
erocsreyal yp-ztq78-810MME78810MME
EMM018 175.5 EMM018-175.5 marble or calcereous silt; mineralized; enechelon biotite veins core
EMM018 133 EMM018-133 massive metavolcanic rock; moderate carbonate veining core
EMM022 71.6 EMM022-71.6 massive metavolcanic rock core
eroctlis ro etimmasp-enif1.761-220MME1.761220MME
E8
EMMD226 87.55 EMMD226-1 mag-barren amygdaloidal metavolcanic rock basalt TS - only
ylno - STnoitaretla ero2-622DMME4.031622DMME
ylno - STnoitaretla etirolhc-ero3-622DMME1.841622DMME
EMMD226 240.8 EMMD226-4 barite?-cal-chlo alteration TS - only
E1C
EMMD184 50 EMMD184-50 heavily-altered porph. Ands. w/ chlo-bio mtx; 5 - 20mm phenocrysts core
erocderehtaew ;tlis detanimal9.521-481DMME9.521481DMME
EMMD184 150.1 EMMD184-150.1 amygdaloidal metavolcanic rock core
Easting (m)**
Northing (m) epyTnoitpircseDDIelpmaS
ylno - STaiccerb deretla "kcor-der"1N1E0049377127774
ylno - STaiccerb citsalcinaclov2N1E9939377885774
ylno - ST?scinaclov dezilarenimA1ON1E9939377095774
ylno - ST?scinaclov dezilarenimB1ON1E3839377446774
**GDA94 UTM Zone 54
E1 North Open Pit
273
Appendix A: Sample Locations and Descriptions

Appendix B Whole-Rock Geochemical Data
274

Analytical methods and data tables The whole-rock samples were analyzed by AMCE Analytical Laboratories, Inc. in
Vancouver, British Columbia, Canada. The ACME method codes mentioned below
were listed in 2014 and may be different to current codes. Samples were jaw crushed
and sieved to 10 mesh (2 mm), and a 250 g aliquot was pulverized and sieved to 150
mesh (100 μm).
For major oxides, LOI, total C and S and Sc, a 0.2g aliquot was fused with 1.5 g of
LiBO2 / LiB4O7 flux at 1000° C. The resulting fusion was digested in 100 ml of 5%
HNO3, and analyzed by inductively coupled plasma emission spectroscopy (ICP-ES) for
the major oxides. All iron is reported as Fe2O3. Loss on Ignition was measured by
igniting a 1g pulp at 1000° C (ACME code TG001). Total carbon and sulfur were
determined by Leco analysis of 0.2 g pulps (ACME code TC000). For elements Ba, Cs,
Ga, Hf, Nb, Rb, Sn, Sr, Ta, Th, U, V, W, Y, Zr, La, Ce, Pr, Nd, Sm, Eu, Gd, Tb, Dy,
Ho, Er, Tm, Yb, and Lu, aliquots of the LiBO2 / LiB4O7 fusions were measured by
inductively coupled plasma mass spectrometry (ICP-MS) (ACME package G4NI, code
LF200).
For elements Au, Ag, As, B, Be, Bi, Cd, Co, Cr, Cu, Ge, Hg, In, Li, Mn, Mo, Ni, Pb,
Pd, Pt, Re, Sb, Se, Te, Tl, and Zn, a 30 g pulp was digested in 180ml of 95° C modified
Aqua Regia (equal parts HCl, HNO3 and H2O) for one hour, then cooled and added to
5% HCl to yield a 600 ml solution which was analyzed by ICP-MS (ACME package
G4NI, code AQ252). Total digestion was not guaranteed for B, Be, Cr, Ge, Li, Mn, Ni,
Pd, and Pt. Nickel was also analyzed by ICP-ES after being digested in 20 ml of Aqua
Regia + HF at 190° C, dried, and dissolved again in 16 ml of 50% HCl at 95° C for an
hour, and then reacted with 5% HCl to form a 100 ml solution.
X-ray fluorescence (XRF) single-element analyses were also performed on fused discs
of samples (n = 55 for Ba, F; n = 61 for Cu) suspected to contain greater than the 5%
maximum detection limit for Ba (ACME code LF700-Ba), F (ACME code GC841), and
Cu (ACME code LF700).
Duplicate analyses were conducted on 28 samples for quality control. Precision was
sufficient to report all elements analyzed, and reproducibility was approximately <1–2%
for major oxides, and <5% for trace elements; these values are much higher (>10–15%)
Appendix B: Whole-Rock Geochemical Data
275
near detection limits. Hollings et al. (2011) demonstrated that ACME protocols yielded
comparable results to other laboratories. Detection limits and reproducibility data are
shown in Table B-1. Table B-2 contains the raw data for all samples, while Table B-3
shows the CLR-transformed data for all samples. Tables B-2 and B-3 are spread over
multiple pages and print left-to-right, then down.
References
Hollings, P., Cooke, D.R., Waters, P.J., and Cousens, B., (2011). Igneous geochemistry of mineralized rocks of the Baguio district, Philippines: Implications for tectonic evolution and the genesis of porphyry-style mineralization: Economic Geology, 106, p.1317–1333.
Appendix B: Whole-Rock Geochemical Data
276

Analyte Method Detection Limit Reproducibility (%) Analyte Method Detection Limit Reproducibility (%) Analyte Method Detection Limit Reproducibility (%)SiO2 LF200 0.01 wt% 1.0 Sr LF200 0.5 ppm 4.0 Pb AQ252 0.01 ppm 2.9Al2O3 LF200 0.01 1.0 Ta LF200 0.1 15.2 Zn AQ252 0.1 8.1Fe2O3 LF200 0.04 0.9 Th LF200 0.2 2.0 Ni AQ252 0.1 3.7MgO LF200 0.01 1.2 U LF200 0.1 4.5 Co AQ252 0.1 3.9CaO LF200 0.01 0.7 V LF200 8 2.4 Mn AQ252 1 1.7Na2O LF200 0.01 1.5 W LF200 0.5 5.5 As AQ252 0.1 20.5K2O LF200 0.01 0.6 Zr LF200 0.1 2.9 Cd AQ252 0.01 10.5TiO2 LF200 0.01 1.0 Y LF200 0.1 3.5 Sb AQ252 0.02 8.4P2O5 LF200 0.01 1.3 La LF200 0.1 1.2 Bi AQ252 0.02 1.9MnO LF200 0.01 0.8 Ce LF200 0.1 1.8 Cr AQ252 0.5 4.6Cr2O3 LF200 0.002 16.4 Pr LF200 0.02 2.3 B AQ252 1 40.0Ba LF700 0.01 0.3 Nd LF200 0.3 4.7 Tl AQ252 0.02 6.1Cu LF700 0.01 2.0 Sm LF200 0.05 4.6 Se AQ252 0.1 0.0F GC841 0.01 0.8 Eu LF200 0.02 9.0 Te AQ252 0.02 16.2LOI TG001 -5.1 3.6 Gd LF200 0.05 4.9 Ge AQ252 0.1 46.2Total C TC000 0.01 3.4 Tb LF200 0.01 4.3 In AQ252 0.02 0.9Total S TC000 0.01 2.2 Dy LF200 0.05 5.2 Be AQ252 0.1 43.3Ba LF200 1 ppm 3.2 Ho LF200 0.02 4.8 Li AQ252 0.1 6.1Sc LF200 1 0.0 Er LF200 0.03 7.6 Pd AQ252 10 ppb BDLCs LF200 0.1 13.5 Tm LF200 0.01 4.7 Pt AQ252 2 BDLGa LF200 0.5 9.5 Yb LF200 0.05 3.6 Hg AQ252 5 16.9Hf LF200 0.1 6.6 Lu LF200 0.01 1.0 Au AQ252 0.2 49.7Nb LF200 0.1 3.5 Ni MA370 10 3.9 Ag AQ252 2 17.2Rb LF200 0.1 3.2 Mo AQ252 0.01 3.7 Re AQ252 1 10.6Sn LF200 1 7.3 Cu AQ252 0.01 2.0
Table B-1: Whole-rock geochemical detection limits and duplicate reproducibility
Appendix B: W
hole-Rock Geochem
ical Data
277
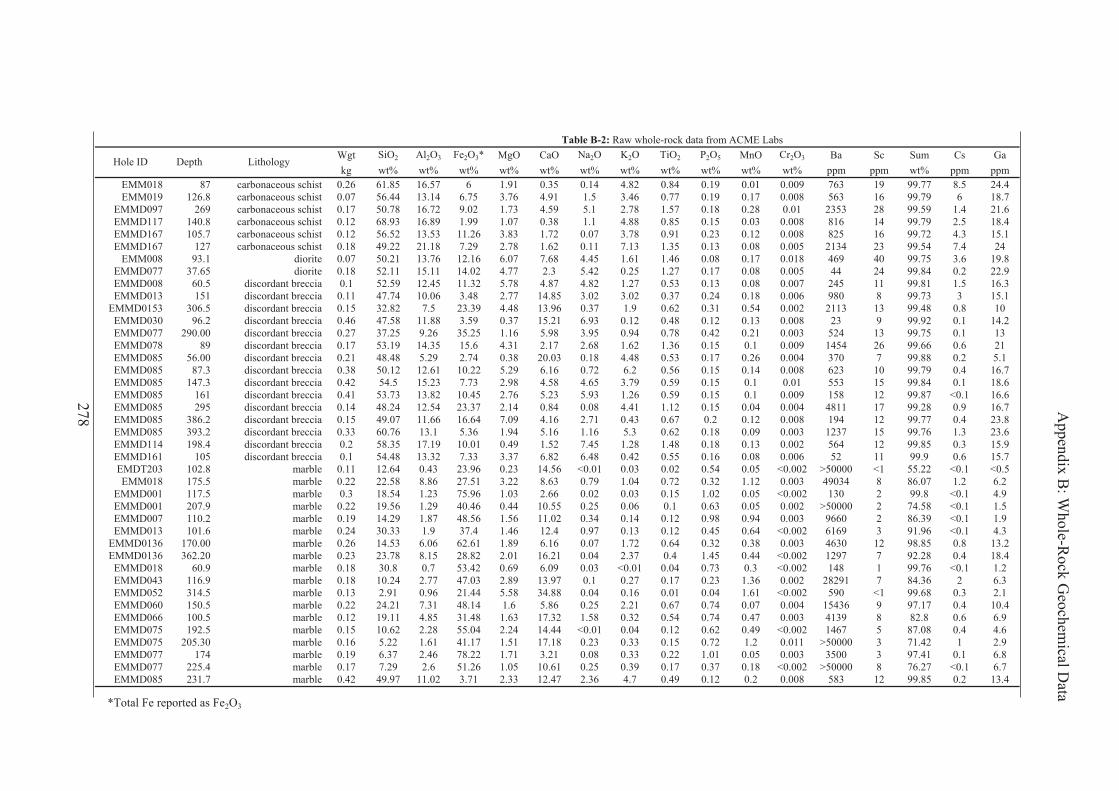
Wgt SiO2 Al2O3 Fe2O3* MgO CaO Na2O K2O TiO2 P2O5 MnO Cr2O3 Ba Sc Sum Cs Gakg wt% wt% wt% wt% wt% wt% wt% wt% wt% wt% wt% ppm ppm wt% ppm ppm
EMM018 87 carbonaceous schist 0.26 61.85 16.57 6 1.91 0.35 0.14 4.82 0.84 0.19 0.01 0.009 763 19 99.77 8.5 24.4EMM019 126.8 carbonaceous schist 0.07 56.44 13.14 6.75 3.76 4.91 1.5 3.46 0.77 0.19 0.17 0.008 563 16 99.79 6 18.7
EMMD097 269 carbonaceous schist 0.17 50.78 16.72 9.02 1.73 4.59 5.1 2.78 1.57 0.18 0.28 0.01 2353 28 99.59 1.4 21.6EMMD117 140.8 carbonaceous schist 0.12 68.93 16.89 1.99 1.07 0.38 1.1 4.88 0.85 0.15 0.03 0.008 816 14 99.79 2.5 18.4EMMD167 105.7 carbonaceous schist 0.12 56.52 13.53 11.26 3.83 1.72 0.07 3.78 0.91 0.23 0.12 0.008 825 16 99.72 4.3 15.1EMMD167 127 carbonaceous schist 0.18 49.22 21.18 7.29 2.78 1.62 0.11 7.13 1.35 0.13 0.08 0.005 2134 23 99.54 7.4 24
EMM008 93.1 diorite 0.07 50.21 13.76 12.16 6.07 7.68 4.45 1.61 1.46 0.08 0.17 0.018 469 40 99.75 3.6 19.8EMMD077 37.65 diorite 0.18 52.11 15.11 14.02 4.77 2.3 5.42 0.25 1.27 0.17 0.08 0.005 44 24 99.84 0.2 22.9EMMD008 60.5 discordant breccia 0.1 52.59 12.45 11.32 5.78 4.87 4.82 1.27 0.53 0.13 0.08 0.007 245 11 99.81 1.5 16.3EMMD013 151 discordant breccia 0.11 47.74 10.06 3.48 2.77 14.85 3.02 3.02 0.37 0.24 0.18 0.006 980 8 99.73 3 15.1
EMMD0153 306.5 discordant breccia 0.15 32.82 7.5 23.39 4.48 13.96 0.37 1.9 0.62 0.31 0.54 0.002 2113 13 99.48 0.8 10EMMD030 96.2 discordant breccia 0.46 47.58 11.88 3.59 0.37 15.21 6.93 0.12 0.48 0.12 0.13 0.008 23 9 99.92 0.1 14.2EMMD077 290.00 discordant breccia 0.27 37.25 9.26 35.25 1.16 5.98 3.95 0.94 0.78 0.42 0.21 0.003 524 13 99.75 0.1 13EMMD078 89 discordant breccia 0.17 53.19 14.35 15.6 4.31 2.17 2.68 1.62 1.36 0.15 0.1 0.009 1454 26 99.66 0.6 21EMMD085 56.00 discordant breccia 0.21 48.48 5.29 2.74 0.38 20.03 0.18 4.48 0.53 0.17 0.26 0.004 370 7 99.88 0.2 5.1EMMD085 87.3 discordant breccia 0.38 50.12 12.61 10.22 5.29 6.16 0.72 6.2 0.56 0.15 0.14 0.008 623 10 99.79 0.4 16.7EMMD085 147.3 discordant breccia 0.42 54.5 15.23 7.73 2.98 4.58 4.65 3.79 0.59 0.15 0.1 0.01 553 15 99.84 0.1 18.6EMMD085 161 discordant breccia 0.41 53.73 13.82 10.45 2.76 5.23 5.93 1.26 0.59 0.15 0.1 0.009 158 12 99.87 <0.1 16.6EMMD085 295 discordant breccia 0.14 48.24 12.54 23.37 2.14 0.84 0.08 4.41 1.12 0.15 0.04 0.004 4811 17 99.28 0.9 16.7EMMD085 386.2 discordant breccia 0.15 49.07 11.66 16.64 7.09 4.16 2.71 0.43 0.67 0.2 0.12 0.008 194 12 99.77 0.4 23.8EMMD085 393.2 discordant breccia 0.33 60.76 13.1 5.36 1.94 5.16 1.16 5.3 0.62 0.18 0.09 0.003 1237 15 99.76 1.3 23.6EMMD114 198.4 discordant breccia 0.2 58.35 17.19 10.01 0.49 1.52 7.45 1.28 1.48 0.18 0.13 0.002 564 12 99.85 0.3 15.9EMMD161 105 discordant breccia 0.1 54.48 13.32 7.33 3.37 6.82 6.48 0.42 0.55 0.16 0.08 0.006 52 11 99.9 0.6 15.7EMDT203 102.8 marble 0.11 12.64 0.43 23.96 0.23 14.56 <0.01 0.03 0.02 0.54 0.05 <0.002 >50000 <1 55.22 <0.1 <0.5EMM018 175.5 marble 0.22 22.58 8.86 27.51 3.22 8.63 0.79 1.04 0.72 0.32 1.12 0.003 49034 8 86.07 1.2 6.2
EMMD001 117.5 marble 0.3 18.54 1.23 75.96 1.03 2.66 0.02 0.03 0.15 1.02 0.05 <0.002 130 2 99.8 <0.1 4.9EMMD001 207.9 marble 0.22 19.56 1.29 40.46 0.44 10.55 0.25 0.06 0.1 0.63 0.05 0.002 >50000 2 74.58 <0.1 1.5EMMD007 110.2 marble 0.19 14.29 1.87 48.56 1.56 11.02 0.34 0.14 0.12 0.98 0.94 0.003 9660 2 86.39 <0.1 1.9EMMD013 101.6 marble 0.24 30.33 1.9 37.4 1.46 12.4 0.97 0.13 0.12 0.45 0.64 <0.002 6169 3 91.96 <0.1 4.3
EMMD0136 170.00 marble 0.26 14.53 6.06 62.61 1.89 6.16 0.07 1.72 0.64 0.32 0.38 0.003 4630 12 98.85 0.8 13.2EMMD0136 362.20 marble 0.23 23.78 8.15 28.82 2.01 16.21 0.04 2.37 0.4 1.45 0.44 <0.002 1297 7 92.28 0.4 18.4EMMD018 60.9 marble 0.18 30.8 0.7 53.42 0.69 6.09 0.03 <0.01 0.04 0.73 0.3 <0.002 148 1 99.76 <0.1 1.2EMMD043 116.9 marble 0.18 10.24 2.77 47.03 2.89 13.97 0.1 0.27 0.17 0.23 1.36 0.002 28291 7 84.36 2 6.3EMMD052 314.5 marble 0.13 2.91 0.96 21.44 5.58 34.88 0.04 0.16 0.01 0.04 1.61 <0.002 590 <1 99.68 0.3 2.1EMMD060 150.5 marble 0.22 24.21 7.31 48.14 1.6 5.86 0.25 2.21 0.67 0.74 0.07 0.004 15436 9 97.17 0.4 10.4EMMD066 100.5 marble 0.12 19.11 4.85 31.48 1.63 17.32 1.58 0.32 0.54 0.74 0.47 0.003 4139 8 82.8 0.6 6.9EMMD075 192.5 marble 0.15 10.62 2.28 55.04 2.24 14.44 <0.01 0.04 0.12 0.62 0.49 <0.002 1467 5 87.08 0.4 4.6EMMD075 205.30 marble 0.16 5.22 1.61 41.17 1.51 17.18 0.23 0.33 0.15 0.72 1.2 0.011 >50000 3 71.42 1 2.9EMMD077 174 marble 0.19 6.37 2.46 78.22 1.71 3.21 0.08 0.33 0.22 1.01 0.05 0.003 3500 3 97.41 0.1 6.8EMMD077 225.4 marble 0.17 7.29 2.6 51.26 1.05 10.61 0.25 0.39 0.17 0.37 0.18 <0.002 >50000 8 76.27 <0.1 6.7EMMD085 231.7 marble 0.42 49.97 11.02 3.71 2.33 12.47 2.36 4.7 0.49 0.12 0.2 0.008 583 12 99.85 0.2 13.4
Hole ID Depth Lithology
Table B-2: Raw whole-rock data from ACME Labs
*Total Fe reported as Fe2O3
Appendix B: W
hole-Rock Geochem
ical Data
278

EMM018 87 carbonaceous schistEMM019 126.8 carbonaceous schist
EMMD097 269 carbonaceous schistEMMD117 140.8 carbonaceous schistEMMD167 105.7 carbonaceous schistEMMD167 127 carbonaceous schist
EMM008 93.1 dioriteEMMD077 37.65 dioriteEMMD008 60.5 discordant brecciaEMMD013 151 discordant breccia
EMMD0153 306.5 discordant brecciaEMMD030 96.2 discordant brecciaEMMD077 290.00 discordant brecciaEMMD078 89 discordant brecciaEMMD085 56.00 discordant brecciaEMMD085 87.3 discordant brecciaEMMD085 147.3 discordant brecciaEMMD085 161 discordant brecciaEMMD085 295 discordant brecciaEMMD085 386.2 discordant brecciaEMMD085 393.2 discordant brecciaEMMD114 198.4 discordant brecciaEMMD161 105 discordant brecciaEMDT203 102.8 marbleEMM018 175.5 marble
EMMD001 117.5 marbleEMMD001 207.9 marbleEMMD007 110.2 marbleEMMD013 101.6 marble
EMMD0136 170.00 marbleEMMD0136 362.20 marble
EMMD018 60.9 marbleEMMD043 116.9 marbleEMMD052 314.5 marbleEMMD060 150.5 marbleEMMD066 100.5 marbleEMMD075 192.5 marbleEMMD075 205.30 marbleEMMD077 174 marbleEMMD077 225.4 marbleEMMD085 231.7 marble
Hole ID Depth Lithology Hf Nb Rb Sn Sr Ta Th U V W Zr Y La Ce Pr Nd Smppm ppm ppm ppm ppm ppm ppm ppm ppm ppm ppm ppm ppm ppm ppm ppm ppm5.4 16.9 200.6 4 25.4 1 17.8 4.5 157 6.2 192.7 26.4 23 39.9 4.57 15.8 3.365.1 19.5 137.1 3 34.8 0.8 15 4.6 110 3 181 26.1 38.5 77.4 8.82 31.8 6.26.1 10.8 63 2 84.7 0.8 13.2 4.7 255 4.1 230.8 38.7 25.7 51.6 5.98 22.5 5.116.6 14.1 153.5 3 18.5 1.1 18.6 4.4 106 68.7 239.8 35.5 104.8 193.7 21.06 73.7 12.555.4 11.7 136 4 14 0.8 16.1 4.6 124 5.4 200.3 32.1 50.3 96.1 10.97 40.4 6.967.3 14.4 278.4 5 12.3 1.2 21.8 9.3 247 8.2 277.7 43.7 67.8 123.3 14.46 52.9 8.713.1 10.9 43.8 1 141.1 0.5 2.5 1.3 318 0.5 103.2 24.5 10.8 21.2 2.83 12.8 3.514.5 9.2 9.2 3 37.7 0.7 8.8 2.6 213 17.3 165.1 26.1 22.6 46 5.5 21.9 5.023.6 8.8 67.2 4 24.2 0.8 12.2 6.5 131 4.9 135 10.7 49.4 77.2 7.85 25.6 4.062.8 9.1 100.6 2 84.6 0.6 12 7.9 90 2.7 100 25.7 46.7 88.4 10.09 35.9 6.372.5 4.6 60 12 47.8 0.3 8.6 25.4 140 18.5 87.5 27.4 120.8 143.7 12.67 40 6.393.4 8.2 8.2 3 69 0.7 12.8 4.5 69 4.2 119.4 18.3 57 94.2 10.35 36.8 5.972.6 6.5 23 5 36.1 0.3 7.7 36.6 218 12.1 98.2 12.8 115.7 144.7 12.58 40.7 6.295.3 9.7 41.9 6 35.4 0.8 11.6 2.7 239 31.2 201 20.5 49.1 71.1 7.89 29.4 5.97
10.1 7.9 99.2 2 51.4 0.6 11 5.2 52 2.6 397.8 22.7 17 32.9 3.95 16 3.384.9 10.4 113.8 3 61.5 0.9 13.8 11.2 96 2.1 178 19.6 31.6 61.1 7.13 26.7 4.643.4 9.5 87.9 3 40 0.8 15.1 4.3 120 3.5 117.7 21.2 28.9 56.2 6.65 25.9 4.613.5 9.2 22.5 2 50.8 0.8 14.5 5.4 114 1.6 128.8 21.3 51.6 97 11 41.9 7.114 9.9 103 49 13.2 0.6 4.4 18.6 157 62.2 147 13 11.7 15.4 1.48 4.9 1.32
6.2 11.1 9.4 7 17.3 1 14.2 12.8 141 7.9 235.9 17.8 59.6 102.8 11.55 40.7 7.137.2 10.8 148.3 9 27.7 0.9 9.8 14.6 61 10.1 271.5 23.9 19.3 34.6 4.04 14.9 3.065.5 9.8 46.2 4 60.6 0.7 13.1 4.1 169 8.2 208 30 59.8 91.1 9.92 35.7 6.953.1 8.2 27.1 2 27.9 0.6 11.2 3.4 108 3.2 109.4 18 7.1 13 1.62 6.8 1.80.5 3.3 0.8 122 4620.3 1.7 0.9 202.2 57 33.2 2.9 21.3 816.3 710.5 44.28 97.3 10.123.1 7.3 24.8 21 843 0.7 6.8 42.6 105 78.8 109.1 12.2 219.2 208.9 13.94 36 3.760.6 9.7 0.6 30 17.5 <0.1 5.9 10.9 94 5.4 23.7 14.8 399.8 408.5 32.54 94.8 13.590.5 15.1 1.5 63 1481.8 0.4 3.7 451.4 62 298.4 17 24.7 316.5 307.4 20.71 50 5.950.8 9.9 3.4 82 871.7 0.3 2.4 150.7 43 13 21.9 7 286.8 223.1 13.53 27.2 2.90.8 7.8 2.8 78 527.1 0.1 3.2 145.1 69 157.2 26.1 22.4 458.6 447.3 30.07 71.6 7.631.9 7.5 48.6 34 52.4 0.3 5.4 38.3 207 19.2 69.2 16.9 79.7 96 7.8 22.5 3.684.2 8.7 52.1 22 69.6 0.6 14.2 30.6 214 21.9 167.7 53.5 187.7 256.1 22.95 77.1 11.390.2 13.1 <0.1 40 104.6 <0.1 1 65.5 48 15.3 8.8 19.2 285.2 286.7 19.73 46.7 5.030.6 6.3 10.8 121 713 0.4 2.2 59.7 76 40.7 22.3 28.9 485.1 456.2 29.89 68.8 7.070.2 0.3 3.8 3 242.6 <0.1 0.5 5.7 12 1.7 7.6 15.5 76.5 79.7 6.38 20 3.762.3 8.6 47.9 51 155.5 0.3 8.3 122.8 214 60.8 91.1 31.9 386.7 393.3 28.22 75.7 9.52.2 11 11.1 99 201.7 0.5 6.6 192.2 128 26.5 85.4 41.7 619.7 557.2 37.4 91.2 11.110.5 6.7 2.8 81 140.8 1.3 2.7 236.4 89 16.7 19.2 17.9 329.6 292.7 18.48 44.1 5.030.9 12.2 7.3 134 1112.9 1.5 3.6 245.9 92 278.6 20.5 25.5 904.6 802.4 49.46 113.2 10.360.9 12.3 8.9 100 45.3 0.3 5.3 338.7 180 26.6 33.6 40.8 867.2 923 77.15 227.8 30.340.8 4.8 15.4 108 1291.4 0.3 3.1 66.8 153 318.1 23 20.7 227.2 211.2 14.94 37 4.833.6 9.1 98.7 2 52.2 0.6 13 5 92 2.4 129.6 26.8 23.3 44.9 5.11 18.8 3.94
Table B-2: Raw whole-rock data from ACME Labs
Appendix B: W
hole-Rock Geochem
ical Data
279

EMM018 87 carbonaceous schistEMM019 126.8 carbonaceous schist
EMMD097 269 carbonaceous schistEMMD117 140.8 carbonaceous schistEMMD167 105.7 carbonaceous schistEMMD167 127 carbonaceous schist
EMM008 93.1 dioriteEMMD077 37.65 dioriteEMMD008 60.5 discordant brecciaEMMD013 151 discordant breccia
EMMD0153 306.5 discordant brecciaEMMD030 96.2 discordant brecciaEMMD077 290.00 discordant brecciaEMMD078 89 discordant brecciaEMMD085 56.00 discordant brecciaEMMD085 87.3 discordant brecciaEMMD085 147.3 discordant brecciaEMMD085 161 discordant brecciaEMMD085 295 discordant brecciaEMMD085 386.2 discordant brecciaEMMD085 393.2 discordant brecciaEMMD114 198.4 discordant brecciaEMMD161 105 discordant brecciaEMDT203 102.8 marbleEMM018 175.5 marble
EMMD001 117.5 marbleEMMD001 207.9 marbleEMMD007 110.2 marbleEMMD013 101.6 marble
EMMD0136 170.00 marbleEMMD0136 362.20 marble
EMMD018 60.9 marbleEMMD043 116.9 marbleEMMD052 314.5 marbleEMMD060 150.5 marbleEMMD066 100.5 marbleEMMD075 192.5 marbleEMMD075 205.30 marbleEMMD077 174 marbleEMMD077 225.4 marbleEMMD085 231.7 marble
Hole ID Depth Lithology Eu Gd Tb Dy Ho Er Tm Yb Lu Ni LOI Total C Total S Mo Cu Pbppm ppm ppm ppm ppm ppm ppm ppm ppm ppm wt% wt% wt% ppm ppm ppm0.77 3.6 0.71 4.44 0.91 2.82 0.43 2.82 0.44 25 7.1 1.25 1.49 4.37 54.71 25.251.1 5.19 0.86 4.5 0.89 2.63 0.39 2.43 0.39 20 8.7 2 1.33 1.32 52.58 13.661.4 5.81 1.08 6.83 1.39 4.11 0.58 3.64 0.53 15 6.8 1.61 0.03 1.18 192.75 2.75
2.61 9.8 1.27 6.52 1.19 3.47 0.51 3.12 0.48 <10 3.5 1.06 <0.01 1.77 14.83 2.241.23 6.37 1.01 5.66 1.12 3.35 0.44 2.86 0.41 65 7.7 0.88 3.78 2.2 127.95 16.021.4 7.32 1.14 7.02 1.36 4.3 0.6 3.94 0.64 35 8.6 1.89 2.98 11.78 496.93 8.36
1.49 3.93 0.77 4.74 0.96 2.65 0.4 2.69 0.42 51 2.1 0.15 0.04 0.53 52.12 2.81.44 4.95 0.83 4.67 1.01 3.04 0.44 2.92 0.45 22 4.3 0.48 0.13 0.45 74.9 0.830.75 3.03 0.36 1.9 0.33 1.08 0.16 1.17 0.18 30 6 1.08 0.26 1.38 41.9 1.420.74 5.41 0.89 5.02 0.9 2.55 0.39 2.46 0.37 40 14 3.24 0.62 6.57 379.49 3.482.87 6.27 0.92 5.25 1.02 2.86 0.41 2.57 0.37 24 13.6 4.14 1.96 77.3 774.19 5.061.41 4.94 0.64 3.58 0.68 2.02 0.29 1.7 0.27 <10 13.5 3.11 0.1 0.2 136.62 1.582.89 5.37 0.67 3.03 0.5 1.26 0.18 1.13 0.16 29 4.5 1.54 0.47 28.87 652.47 1.72.41 6.06 0.91 4.4 0.81 2.25 0.32 2.16 0.37 44 4.1 0.34 0.05 0.46 147.95 1.20.85 3.76 0.67 4.04 0.81 2.3 0.35 2.33 0.37 <10 17.3 4.29 <0.01 0.2 6.61 0.721.03 4.19 0.66 3.64 0.69 1.93 0.28 1.7 0.26 28 7.6 1.33 0.09 0.32 20.7 1.370.93 4.2 0.63 3.77 0.74 2.24 0.32 1.95 0.29 36 5.5 1 0.02 0.21 5.01 0.51.12 5.57 0.76 4.14 0.74 2 0.28 1.88 0.29 31 5.9 1.1 0.17 4.67 6.26 0.710.7 1.73 0.31 1.74 0.44 1.27 0.21 1.52 0.27 31 6.3 0.25 5.54 34.49 277.7 8.94
1.58 6.01 0.77 3.61 0.62 1.68 0.27 1.64 0.26 45 7 0.86 1.37 3.11 11.57 1.780.85 3.57 0.7 4.06 0.89 2.63 0.43 2.69 0.41 <10 6.1 1.14 0.26 30 44.44 2.182.14 6.12 0.91 5.04 1.03 3.05 0.42 2.61 0.41 <10 1.8 0.23 <0.01 0.78 13.41 1.590.49 2.38 0.44 2.81 0.58 1.67 0.23 1.65 0.28 24 6.9 1.46 <0.01 0.92 23.93 1.4612.09 11.28 1.01 4.68 0.74 1.96 0.26 1.32 0.12 22 2.8 0.34 8 252.15 >10000.00 46.813.08 4.66 0.51 2.81 0.56 1.68 0.28 1.97 0.32 23 10.6 3.33 6.28 53.01 803.92 25.347.43 11.62 1.1 4.08 0.54 0.94 0.11 0.53 0.07 <10 -0.9 0.28 0.04 33.27 128.71 3.419.37 6.77 0.92 5.76 1.09 3.05 0.4 2.33 0.25 26 1.2 0.11 8.09 414.41 >10000.00 141.555.81 2.66 0.29 1.4 0.3 0.68 0.13 0.78 0.09 <10 6.6 2.79 4.88 90.42 8495.77 67.0211.41 7.41 0.79 3.98 0.75 2.22 0.31 1.79 0.21 15 4.5 2 3.8 121.91 >10000.00 84.821.89 3.88 0.59 3.41 0.67 1.94 0.32 1.93 0.3 57 4.5 1.65 3.69 43.33 3751.87 9.723.21 11.56 1.75 9.86 2.08 5.14 0.77 4.95 0.74 83 8.6 3.16 6.46 18.86 1570.37 5.229.11 4.88 0.65 3.41 0.6 1.6 0.19 0.91 0.1 <10 7 2.29 0.01 8.52 590.6 27.5110.02 7.58 0.84 4.24 0.81 2.37 0.34 1.91 0.23 19 4.9 2.77 4.75 85.79 7556.74 29.743.17 4.48 0.56 2.44 0.39 0.84 0.09 0.46 0.05 12 32 9.78 0.99 4.16 685.5 10.637.5 9.84 1.15 5.59 1.11 3.08 0.43 2.86 0.43 39 6.1 0.33 9.89 135.55 6869.52 29.96
14.42 11.69 1.51 8.32 1.41 3.92 0.57 3.38 0.45 44 4.7 3.65 5.5 221.82 >10000.00 72.898.39 4.59 0.61 3.28 0.59 1.73 0.26 1.45 0.18 25 1.2 1.23 5.44 259 >10000.00 47.2619.18 10.99 1.06 5.58 1.08 2.97 0.46 2.72 0.33 21 2.1 1.78 5.84 264.92 >10000.00 54.0816.44 28.53 2.72 11 1.58 3.48 0.44 2.51 0.28 59 3.7 0.25 5.82 484.6 >10000.00 79.776.01 5.31 0.69 3.85 0.86 2.52 0.3 2.16 0.31 14 1.8 0.92 4.77 100.02 8442.18 310.8 4.12 0.73 4.47 0.89 2.62 0.42 2.53 0.36 34 12.5 2.75 0.02 0.07 8.02 0.62
Table B-2: Raw whole-rock data from ACME Labs
Appendix B: W
hole-Rock Geochem
ical Data
280

EMM018 87 carbonaceous schistEMM019 126.8 carbonaceous schist
EMMD097 269 carbonaceous schistEMMD117 140.8 carbonaceous schistEMMD167 105.7 carbonaceous schistEMMD167 127 carbonaceous schist
EMM008 93.1 dioriteEMMD077 37.65 dioriteEMMD008 60.5 discordant brecciaEMMD013 151 discordant breccia
EMMD0153 306.5 discordant brecciaEMMD030 96.2 discordant brecciaEMMD077 290.00 discordant brecciaEMMD078 89 discordant brecciaEMMD085 56.00 discordant brecciaEMMD085 87.3 discordant brecciaEMMD085 147.3 discordant brecciaEMMD085 161 discordant brecciaEMMD085 295 discordant brecciaEMMD085 386.2 discordant brecciaEMMD085 393.2 discordant brecciaEMMD114 198.4 discordant brecciaEMMD161 105 discordant brecciaEMDT203 102.8 marbleEMM018 175.5 marble
EMMD001 117.5 marbleEMMD001 207.9 marbleEMMD007 110.2 marbleEMMD013 101.6 marble
EMMD0136 170.00 marbleEMMD0136 362.20 marble
EMMD018 60.9 marbleEMMD043 116.9 marbleEMMD052 314.5 marbleEMMD060 150.5 marbleEMMD066 100.5 marbleEMMD075 192.5 marbleEMMD075 205.30 marbleEMMD077 174 marbleEMMD077 225.4 marbleEMMD085 231.7 marble
Hole ID Depth Lithology Zn Ag Ni Co Mn As Au Cd Sb Bi Cr B Tl Hg Se Teppm ppb ppm ppm ppm ppm ppb ppm ppm ppm ppm ppm ppm ppb ppm ppm331.5 418 25.4 9.9 76 26.6 0.9 0.3 2.09 0.44 4.1 4 0.3 <5 0.3 0.0776.4 124 21.6 9.8 1258 4.2 1.1 0.15 0.33 0.38 15 3 0.53 <5 0.1 <0.0221.2 125 22.7 12.9 1896 23.1 2.4 0.01 0.96 0.04 29 <1 0.15 <5 <0.1 <0.025.1 66 5.6 2.6 169 8.6 <0.2 <0.01 0.15 0.04 6.7 <1 0.05 <5 <0.1 <0.02309 1393 67.8 15.9 980 64.8 2.8 1.1 3.86 2.88 17.2 2 0.42 17 0.3 0.09
7 1680 36.8 8.9 653 21.9 <0.2 0.08 0.96 1.92 3.8 3 0.17 <5 0.4 0.1631.7 75 28.1 18.6 842 2.1 7.9 <0.01 0.24 0.03 74.6 2 <0.02 <5 0.1 <0.0213 27 24.4 23.5 567 2.3 0.8 <0.01 0.07 0.04 26.2 <1 <0.02 <5 <0.1 <0.02
35.6 68 32.3 28.2 529 3.6 1.5 0.02 0.14 0.26 43.7 <1 0.05 <5 0.2 0.057.1 237 33.5 25.8 1345 56.9 16.3 <0.01 0.22 0.64 35.5 <1 0.2 <5 0.6 0.1313 263 23.5 146.6 3909 52.8 21 0.1 0.71 1.78 11.8 <1 0.34 24 <0.1 0.20.4 28 11.2 10.6 1078 1.8 1.5 0.02 0.04 0.07 21.6 <1 <0.02 <5 <0.1 0.043.9 103 19.3 26 1458 6.4 12.8 0.02 0.22 0.56 11.4 1 <0.02 <5 0.2 <0.02
32.3 24 46.8 14.5 723 3.8 <0.2 0.02 0.33 0.02 46.8 <1 <0.02 <5 0.1 0.022.1 14 9 2.4 2115 2.9 <0.2 0.03 0.04 0.04 10.1 <1 <0.02 <5 <0.1 <0.02
13.9 29 29.2 16.5 1023 16 0.6 <0.01 0.05 0.05 30.8 <1 <0.02 10 <0.1 0.079.1 28 35.7 9 774 2.7 1.1 0.01 0.09 0.02 31.1 <1 <0.02 15 <0.1 0.038.6 20 32.4 24.3 756 8.3 11.4 <0.01 0.12 0.06 54 <1 <0.02 <5 0.3 <0.0210 1420 37.2 364.6 265 113.4 103.9 0.03 2 5.56 12.9 3 0.15 36 0.9 1.88
27.1 129 44.6 56 946 20.9 11.5 <0.01 0.09 1.08 34.2 <1 <0.02 11 0.4 0.189.1 83 11.8 29.2 704 9.1 6.7 <0.01 0.23 0.53 11 3 0.06 12 <0.1 0.194.3 13 7.5 3.3 270 1 1.5 <0.01 0.2 0.02 16.7 <1 <0.02 5 <0.1 0.08
10.7 64 23 8.6 638 2.2 5.2 0.02 0.06 0.04 40.5 <1 0.05 5 <0.1 <0.023.8 6188 15.6 176.1 291 173.3 411.1 <0.01 5.4 28.94 1.2 1 0.03 259 1.6 0.9
29.7 4745 20 267.4 8224 255.2 140 <0.01 3.2 41.3 19.6 5 1.3 58 0.9 0.7623.8 475 5.5 4.4 314 24.4 20.1 <0.01 4.12 0.56 2 <1 <0.02 17 <0.1 0.0748 30526 21.5 475.5 256 434.1 1667.7 <0.01 24.07 64.35 1.8 4 0.06 768 3 1.95
32.6 3135 9 224.6 7301 350.9 237 <0.01 5.69 12.32 1.5 <1 0.24 18 1.4 0.9213 6474 12.3 212.2 4891 322.9 325.5 0.31 5.56 38.02 3.1 3 0.11 115 1.9 0.6912.1 658 36.2 288.5 2619 134 134.1 0.02 1.72 3.73 8.2 2 0.22 63 0.7 0.711 521 73.1 350.8 3379 283.6 133.2 <0.01 0.53 2.43 2.2 1 0.06 11 2.9 0.21
54.8 653 4.4 52.7 2266 43.8 152.9 0.16 3.28 2.56 3 4 <0.02 8 <0.1 0.07139 12563 16.2 261.8 >10000 52.2 213.5 0.03 5.18 19.75 7.5 <1 1.07 86 1.2 0.5332.5 177 14.2 25.1 >10000 11.8 12 0.1 0.58 0.86 0.6 <1 0.02 16 <0.1 <0.0214.9 1342 32.7 527 506 371.7 252.3 0.02 3.63 12.14 8.4 5 0.16 47 2.5 1.3239.9 7162 45 589.4 3687 327.5 582.2 <0.01 4.65 22.39 10.3 3 0.45 74 2.4 1.3723.3 4306 23.5 408.2 3642 289.9 782.9 <0.01 3.49 16.98 2.7 2 0.13 30 2.7 1.2911.2 8550 16.7 239.9 8689 201.2 389.3 <0.01 4.4 41.89 2.7 2 0.05 * 2.2 1.139.1 4057 44.7 446.4 295 227.9 164.3 0.17 5.98 13.17 3.4 2 0.29 116 2.8 1.83
29.7 8906 14.4 149.1 1259 97.2 227.5 0.09 6.98 14.61 2.5 <1 0.09 <5 0.7 0.766.1 23 40.9 26.1 1584 1.5 3.3 0.01 0.04 <0.02 44.9 <1 <0.02 <5 <0.1 <0.02
Table B-2: Raw whole-rock data from ACME Labs
Appendix B: W
hole-Rock Geochem
ical Data
281
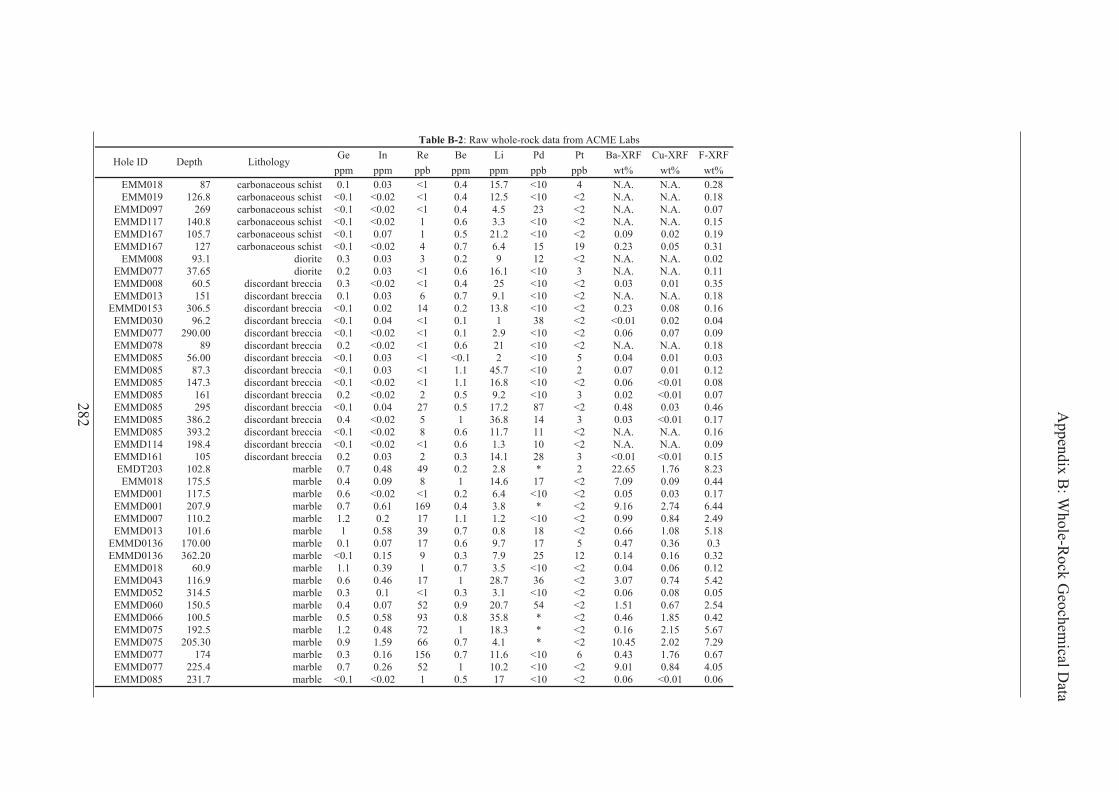
EMM018 87 carbonaceous schistEMM019 126.8 carbonaceous schist
EMMD097 269 carbonaceous schistEMMD117 140.8 carbonaceous schistEMMD167 105.7 carbonaceous schistEMMD167 127 carbonaceous schist
EMM008 93.1 dioriteEMMD077 37.65 dioriteEMMD008 60.5 discordant brecciaEMMD013 151 discordant breccia
EMMD0153 306.5 discordant brecciaEMMD030 96.2 discordant brecciaEMMD077 290.00 discordant brecciaEMMD078 89 discordant brecciaEMMD085 56.00 discordant brecciaEMMD085 87.3 discordant brecciaEMMD085 147.3 discordant brecciaEMMD085 161 discordant brecciaEMMD085 295 discordant brecciaEMMD085 386.2 discordant brecciaEMMD085 393.2 discordant brecciaEMMD114 198.4 discordant brecciaEMMD161 105 discordant brecciaEMDT203 102.8 marbleEMM018 175.5 marble
EMMD001 117.5 marbleEMMD001 207.9 marbleEMMD007 110.2 marbleEMMD013 101.6 marble
EMMD0136 170.00 marbleEMMD0136 362.20 marble
EMMD018 60.9 marbleEMMD043 116.9 marbleEMMD052 314.5 marbleEMMD060 150.5 marbleEMMD066 100.5 marbleEMMD075 192.5 marbleEMMD075 205.30 marbleEMMD077 174 marbleEMMD077 225.4 marbleEMMD085 231.7 marble
Hole ID Depth Lithology Ge In Re Be Li Pd Pt Ba-XRF Cu-XRF F-XRFppm ppm ppb ppm ppm ppb ppb wt% wt% wt%0.1 0.03 <1 0.4 15.7 <10 4 N.A. N.A. 0.28
<0.1 <0.02 <1 0.4 12.5 <10 <2 N.A. N.A. 0.18<0.1 <0.02 <1 0.4 4.5 23 <2 N.A. N.A. 0.07<0.1 <0.02 1 0.6 3.3 <10 <2 N.A. N.A. 0.15<0.1 0.07 1 0.5 21.2 <10 <2 0.09 0.02 0.19<0.1 <0.02 4 0.7 6.4 15 19 0.23 0.05 0.310.3 0.03 3 0.2 9 12 <2 N.A. N.A. 0.020.2 0.03 <1 0.6 16.1 <10 3 N.A. N.A. 0.110.3 <0.02 <1 0.4 25 <10 <2 0.03 0.01 0.350.1 0.03 6 0.7 9.1 <10 <2 N.A. N.A. 0.18
<0.1 0.02 14 0.2 13.8 <10 <2 0.23 0.08 0.16<0.1 0.04 <1 0.1 1 38 <2 <0.01 0.02 0.04<0.1 <0.02 <1 0.1 2.9 <10 <2 0.06 0.07 0.090.2 <0.02 <1 0.6 21 <10 <2 N.A. N.A. 0.18
<0.1 0.03 <1 <0.1 2 <10 5 0.04 0.01 0.03<0.1 0.03 <1 1.1 45.7 <10 2 0.07 0.01 0.12<0.1 <0.02 <1 1.1 16.8 <10 <2 0.06 <0.01 0.080.2 <0.02 2 0.5 9.2 <10 3 0.02 <0.01 0.07
<0.1 0.04 27 0.5 17.2 87 <2 0.48 0.03 0.460.4 <0.02 5 1 36.8 14 3 0.03 <0.01 0.17
<0.1 <0.02 8 0.6 11.7 11 <2 N.A. N.A. 0.16<0.1 <0.02 <1 0.6 1.3 10 <2 N.A. N.A. 0.090.2 0.03 2 0.3 14.1 28 3 <0.01 <0.01 0.150.7 0.48 49 0.2 2.8 * 2 22.65 1.76 8.230.4 0.09 8 1 14.6 17 <2 7.09 0.09 0.440.6 <0.02 <1 0.2 6.4 <10 <2 0.05 0.03 0.170.7 0.61 169 0.4 3.8 * <2 9.16 2.74 6.441.2 0.2 17 1.1 1.2 <10 <2 0.99 0.84 2.491 0.58 39 0.7 0.8 18 <2 0.66 1.08 5.18
0.1 0.07 17 0.6 9.7 17 5 0.47 0.36 0.3<0.1 0.15 9 0.3 7.9 25 12 0.14 0.16 0.321.1 0.39 1 0.7 3.5 <10 <2 0.04 0.06 0.120.6 0.46 17 1 28.7 36 <2 3.07 0.74 5.420.3 0.1 <1 0.3 3.1 <10 <2 0.06 0.08 0.050.4 0.07 52 0.9 20.7 54 <2 1.51 0.67 2.540.5 0.58 93 0.8 35.8 * <2 0.46 1.85 0.421.2 0.48 72 1 18.3 * <2 0.16 2.15 5.670.9 1.59 66 0.7 4.1 * <2 10.45 2.02 7.290.3 0.16 156 0.7 11.6 <10 6 0.43 1.76 0.670.7 0.26 52 1 10.2 <10 <2 9.01 0.84 4.05
<0.1 <0.02 1 0.5 17 <10 <2 0.06 <0.01 0.06
Table B-2: Raw whole-rock data from ACME Labs
Appendix B: W
hole-Rock Geochem
ical Data
282

Wgt SiO2 Al2O3 Fe2O3* MgO CaO Na2O K2O TiO2 P2O5 MnO Cr2O3 Ba Sc Sum Cs Gakg wt% wt% wt% wt% wt% wt% wt% wt% wt% wt% wt% ppm ppm wt% ppm ppm
Hole ID Depth Lithology
Table B-2: Raw whole-rock data from ACME Labs
EMMD085 310.5 marble 0.29 9.44 3.03 50.64 1.04 8.68 0.02 0.88 0.26 0.71 0.05 0.006 >50000 4 73.58 0.1 5.2EMMD097 226.15 marble 0.22 20.14 12.3 33.68 4.15 8.9 0.22 2.67 1.09 0.33 0.79 0.011 40937 16 94.89 6 14.5EMMD136 361.85 marble 0.11 54.09 12.07 11.74 1.64 5.86 0.11 4.21 0.36 0.2 0.11 <0.002 2044 11 99.65 0.8 21.5EMMD182 239.75 marble 0.15 19.28 4.8 28.22 6.52 14.88 0.06 1.55 0.46 0.89 0.65 0.002 2102 5 90.3 1.4 8.2
EMM017 154.3 metaandesite 0.11 56.08 15.55 11.39 3.49 1.62 4.33 1.66 1.6 0.18 0.08 0.006 2985 26 99.51 1.8 20EMM018 133 metaandesite 0.18 43.4 15.25 20.17 5.21 3.66 0.18 2.02 1.56 0.16 0.18 0.006 3932 25 99.36 2 20.8EMM019 338 metaandesite 0.09 51.94 14.37 10.34 1.63 6.45 4.56 1.76 1.48 0.15 0.25 0.006 2599 27 99.62 1 19.5EMM022 74.6 metaandesite 0.19 63.1 14.96 8.86 1.14 1.11 4.97 1.9 1.57 0.19 0.06 0.006 1071 20 99.8 1.5 19.4
EMMD002 120.5 metaandesite 0.12 44.1 13.77 25.37 3.81 1.92 0.12 3.87 2.13 0.28 0.19 0.003 4869 24 99.07 3.8 21.1EMMD008 126 metaandesite 0.09 52.94 14.91 12.35 4.05 2.66 5.57 2.02 1.45 0.15 0.07 0.009 607 24 99.72 3.6 18.9EMMD018 101 metaandesite 0.14 52.05 15.12 12.14 3.78 2.93 6.02 2.42 1.43 0.17 0.07 0.009 568 25 99.78 3 19.2EMMD041 154.75 metaandesite 0.12 48.39 14.04 21.52 3.79 0.87 5.99 0.88 1.01 0.08 0.05 <0.002 84 17 99.83 1.3 17.9EMMD042 171.2 metaandesite 0.09 51.46 14.17 12.65 2.81 3.77 5.54 1.56 1.42 0.14 0.25 0.005 754 25 99.79 5 18.2EMMD043 169.9 metaandesite 0.1 48.09 17.4 7.91 1.51 7.14 4.72 2.95 1.28 0.14 0.28 0.005 2297 22 99.66 1.4 20.4EMMD064 150 metaandesite 0.21 53.44 17.24 9.14 3.28 3.06 6.24 1.96 1.44 0.1 0.18 0.003 630 19 99.77 3.4 22.2EMMD066 40 metaandesite 0.16 49.28 18.85 15.98 2.91 0.38 4.77 2.29 1.65 0.2 0.11 0.004 11197 19 98.6 1.6 20.6EMMD066 123.6 metaandesite 0.17 54.18 14.41 13.05 2 3.16 5.09 1.69 2.13 0.25 0.18 0.002 1901 26 99.62 1.4 22.6EMMD066 176 metaandesite 0.16 50.14 14.94 10.42 1.62 5.81 2.29 3.59 1.44 0.14 0.34 0.005 4879 27 99.29 1.3 21.1EMMD067 187 metaandesite 0.18 51.02 16.67 12.31 2.17 2.83 4.74 2.45 2.01 0.26 0.2 0.003 2104 24 99.62 1.1 23.8EMMD074 195 metaandesite 0.14 62.96 13.91 1.97 0.49 4.12 0.47 11.19 0.27 0.07 0.1 <0.002 1821 2 99.74 0.3 8EMMD075 116.2 metaandesite 0.2 42.41 15.45 24.53 1.99 0.56 0.13 2.91 2.39 0.3 0.57 0.003 5018 29 99.24 1.5 23.1EMMD077 81.7 metaandesite 0.24 41.24 14.79 24.46 3.16 3.6 0.88 5.04 1.48 0.16 0.25 0.005 7079 28 99.02 2.1 20.8EMMD077 162.4 metaandesite 0.25 33.28 13.16 41.95 2.62 0.52 3.65 1.82 1.52 0.18 0.04 0.007 2798 23 99.55 0.5 18.5EMMD085 366.8 metaandesite 0.35 49.71 10.32 18.45 1.64 4.14 0.06 3.35 0.55 0.8 0.1 <0.002 3996 7 99.29 0.3 12.2EMMD086 167.9 metaandesite 0.24 27.18 17.42 33.4 4.4 2.16 0.2 5.27 2.6 0.33 0.23 0.002 34998 26 95.71 6 29.5EMMD097 74.14 metaandesite 0.16 44.14 8.14 30.93 2.97 3.68 0.07 0.01 0.48 0.23 0.11 <0.002 121 9 99.47 0.2 8.2EMMD097 174.1 metaandesite 0.24 57.47 16.33 7.58 2.19 3.13 5.99 1.18 1.66 0.25 0.11 0.006 963 27 99.75 0.9 22.4EMMD114 71 metaandesite 0.13 58.59 18.08 4.76 1.03 3.23 7.64 1.19 1.56 0.2 0.12 0.003 862 13 99.77 0.5 16.8EMMD118 143.8 metaandesite 0.29 54.82 15.58 13.86 3.68 1.65 3.22 0.99 1.3 0.09 0.11 0.005 2116 23 99.63 0.7 26EMMD119 174.9 metaandesite 0.35 55.4 9.98 8.41 4.41 7.82 0.08 5.32 0.44 0.11 0.16 0.006 699 9 99.8 0.3 16.4EMMD126 104 metaandesite 0.16 49.94 15.24 12.07 3.62 4.84 4.73 0.66 1.44 0.15 0.26 0.009 224 22 99.82 0.9 19EMMD129 155 metaandesite 0.2 57.42 16.56 7.22 1.93 3.43 5.63 1.44 1.48 0.32 0.14 <0.002 707 18 99.75 1.2 15.2EMMD136 71.9 metaandesite 0.24 54.43 17.52 6.4 1.63 4.64 5.91 2.06 1.49 0.3 0.14 0.003 1070 18 99.72 1.6 21.4EMMD136 124 metaandesite 0.19 53.09 15.98 8.66 1.25 5.11 7.57 0.72 1.27 0.26 0.21 0.003 494 12 99.7 0.3 15.3EMMD136 215 metaandesite 0.17 47.06 14.34 6.79 2.23 8.66 4.73 2.34 1.39 0.15 0.37 0.004 1741 27 99.67 1.4 18.9EMMD136 267.5 metaandesite 0.27 61.4 6.3 25.32 0.7 0.87 0.06 2.2 0.22 0.07 0.04 <0.002 4583 5 99.31 1.6 11.9EMMD136 321 metaandesite 0.15 58.36 16.61 10.29 0.6 1.84 4.58 3.42 1.28 0.11 0.13 0.005 2551 22 99.65 0.5 19.8EMMD167 180.3 metaandesite 0.15 51.93 17.32 6.38 1.94 4.37 7.6 1.16 1.48 0.16 0.3 0.005 771 20 99.82 1.3 15.9EMMD167 234 metaandesite 0.26 47.14 15.94 16.02 4.78 3.62 3.05 0.84 1.25 0.03 0.18 <0.002 433 18 99.71 0.7 22.9EMMD167 279.7 metaandesite 0.08 53.15 15 12.13 3.69 3.39 3.6 1.4 1.24 0.25 0.13 <0.002 456 17 99.76 0.8 18.4EMMD182 91.7 metaandesite 0.13 58.29 18.96 5.75 0.6 1.59 8.75 1.37 1.42 0.18 0.1 0.002 783 11 99.84 0.6 12.4
Appendix B: W
hole-Rock Geochem
ical Data
283

Hole ID Depth Lithology
EMMD085 310.5 marbleEMMD097 226.15 marbleEMMD136 361.85 marbleEMMD182 239.75 marble
EMM017 154.3 metaandesiteEMM018 133 metaandesiteEMM019 338 metaandesiteEMM022 74.6 metaandesite
EMMD002 120.5 metaandesiteEMMD008 126 metaandesiteEMMD018 101 metaandesiteEMMD041 154.75 metaandesiteEMMD042 171.2 metaandesiteEMMD043 169.9 metaandesiteEMMD064 150 metaandesiteEMMD066 40 metaandesiteEMMD066 123.6 metaandesiteEMMD066 176 metaandesiteEMMD067 187 metaandesiteEMMD074 195 metaandesiteEMMD075 116.2 metaandesiteEMMD077 81.7 metaandesiteEMMD077 162.4 metaandesiteEMMD085 366.8 metaandesiteEMMD086 167.9 metaandesiteEMMD097 74.14 metaandesiteEMMD097 174.1 metaandesiteEMMD114 71 metaandesiteEMMD118 143.8 metaandesiteEMMD119 174.9 metaandesiteEMMD126 104 metaandesiteEMMD129 155 metaandesiteEMMD136 71.9 metaandesiteEMMD136 124 metaandesiteEMMD136 215 metaandesiteEMMD136 267.5 metaandesiteEMMD136 321 metaandesiteEMMD167 180.3 metaandesiteEMMD167 234 metaandesiteEMMD167 279.7 metaandesiteEMMD182 91.7 metaandesite
Hf Nb Rb Sn Sr Ta Th U V W Zr Y La Ce Pr Nd Smppm ppm ppm ppm ppm ppm ppm ppm ppm ppm ppm ppm ppm ppm ppm ppm ppm
Table B-2: Raw whole-rock data from ACME Labs
1.2 11 22.9 76 1439.1 0.5 5.4 246.5 198 42.8 40.6 27 302.5 296.3 20.08 49.9 6.673.9 8.8 123.2 61 384.3 0.7 10.4 45.5 199 98.5 139.7 22.8 398.2 365 25.59 64.5 7.476.2 12 89.2 24 20.2 0.6 8.2 26.1 44 30.6 267.1 19.9 41.7 57.7 5.62 17.7 3.431.7 5.7 54 18 58 0.3 12 25.6 164 15.6 71.7 40.3 173.4 215.9 19.29 61.9 8.865.6 9.9 51.6 2 53 0.9 13 3.5 275 2.5 216.3 32.4 28.4 54.7 6.73 25.4 5.335.7 15.5 56.4 2 38.7 0.8 12.9 4.4 248 23.1 207.8 26.3 37.6 66.2 7.6 29.5 5.94.9 16.1 40.3 5 62.3 0.8 9.6 5.2 206 4.8 174.7 21.2 5.7 9.4 1.09 4.2 1.235.7 10.1 72.1 3 28.8 0.8 12.6 4 189 3.1 205.9 27.2 2.2 4.4 0.6 3 1.077.8 14.8 172.3 16 27 1.2 14.4 16.1 276 29.5 283.4 35.2 35.6 46.6 4.39 15.5 3.196.2 24.4 86.6 7 55.4 0.9 12.7 3 223 10.9 214.5 35.7 167.5 220.2 19.97 64.6 12.985.6 21.9 122.2 4 54.8 0.8 11.7 3.3 243 6.8 206.4 33.8 59.1 96.2 10.6 37.9 8.463.5 4 39.2 3 16.5 0.4 7.1 2.7 165 1.4 123 14.9 33.3 55.2 5.86 21.4 3.844.7 11.6 89 2 69.7 0.6 10.2 3.1 240 2.3 173.5 26 27.3 50.5 5.66 22.3 4.833.9 11.1 105.2 3 41.6 0.6 6.9 5 209 7.5 139.2 23.7 6.9 13.7 1.68 7.4 2.215.6 9.9 89 2 77.6 0.8 13.7 3.7 179 3 206.6 26.8 34.1 60.1 7.11 26.1 5.265.9 11.5 63.4 12 39.6 0.9 15 31.6 183 26.2 220.2 22.5 20.1 27.5 2.56 8.4 2.017.8 14.3 46.8 4 111.9 1.2 17.7 5.6 277 5.9 290.3 39.5 45.5 87.5 10.49 39.9 8.365.1 9 112.2 4 30.7 0.7 10.2 3.2 234 7.5 179 23.7 32.9 57.2 6.31 23.8 4.748.2 13.7 92.2 9 26.7 1.1 17.4 8.1 266 8.8 287.5 29.7 41.4 67.7 7.4 26.5 5.468.2 11.2 145.7 2 47.2 0.7 17.2 8.8 <8 7.3 351.5 18.4 9.8 17.3 1.91 7.8 1.758.3 15.1 78.5 5 31.3 1.2 17.6 14.1 319 37.7 312.1 45.2 47.1 79.6 9.16 35.2 7.545.1 9.1 150.1 20 31.6 0.8 11.5 12.3 256 9.4 180.4 24.6 167.1 219.4 20.98 68.6 11.934.8 8.5 41.3 8 25.9 0.6 9.9 7.6 350 32.6 182.4 13.3 5.5 6.4 0.65 2.5 0.693.6 12.2 64.3 32 27.7 0.7 13.8 62.7 86 42.3 134.3 31.1 89 121.7 10.94 35.8 5.879.6 17.3 186.1 75 77.7 1.5 19.2 19.5 354 51.9 350 26.2 148.8 143 10.23 27.4 3.982.3 4.4 0.3 27 58.2 0.3 5.8 21.5 102 46.1 79.8 11.4 67 80.4 5.6 15.1 2.216.2 11.7 37.1 4 59.2 0.9 13.9 4.4 264 5.5 228.9 29 33.5 62.6 7.56 29.4 6.196 11 41 4 76.2 1 14.4 4.2 164 8.4 221.3 23.8 109.7 178.6 17.76 59.9 10.56
4.1 7.4 29.9 3 19.6 0.5 9.9 4.8 265 12 160 18.1 15.9 25.5 2.68 9.8 2.144.2 8.5 86.9 3 45 0.9 10.3 3.6 81 2.6 155.8 17.4 33.5 65.4 7.26 25.9 4.595.5 9.8 21.6 2 91.2 0.8 12.3 3.6 216 3 211.1 31.8 30.5 57 6.69 26.2 5.625.4 9.7 50.3 3 61.6 0.8 13.5 3.8 164 2 204.9 26.7 44.4 78.7 8.25 29.9 5.685.7 10.5 72.5 3 95.8 0.8 13.9 4.8 180 5.3 214.9 29 99.4 149.2 15.2 50.9 9.665 9.3 25.6 3 57.2 0.7 13.1 4.1 136 8.1 184.8 28.7 96.1 138.5 13.85 49.2 9.49
4.8 8.4 93.6 4 41.4 0.6 9.9 2.7 232 4.8 176.1 36.3 31 52.8 6.14 22.9 5.010.8 6.3 58.7 43 5.8 0.1 3.1 8.5 113 11.9 31.7 3.9 21.3 20.8 1.74 5.3 0.964 7.7 102.6 4 16.9 0.5 7.5 4.3 220 8.4 143.8 14.7 3.6 5.9 0.7 2.9 0.81
4.8 8.3 45.9 3 35.8 0.5 10.2 4.4 193 3.9 179.1 25.2 15.7 24.9 2.94 12.1 2.625 8.4 37.3 2 27.3 0.7 10.7 4.3 200 4.1 174.4 27.6 34.4 63.5 7.06 26.3 4.76
4.7 8.9 46.5 5 33.1 0.7 12.3 2.4 185 7 170.8 36.2 110.1 168.6 18.5 66.7 13.735.4 8.5 56.8 2 53.4 0.7 12.2 3.7 112 11.5 198.8 36.6 35.2 53.7 5.71 20.7 4.25
Appendix B: W
hole-Rock Geochem
ical Data
284

Hole ID Depth Lithology
EMMD085 310.5 marbleEMMD097 226.15 marbleEMMD136 361.85 marbleEMMD182 239.75 marble
EMM017 154.3 metaandesiteEMM018 133 metaandesiteEMM019 338 metaandesiteEMM022 74.6 metaandesite
EMMD002 120.5 metaandesiteEMMD008 126 metaandesiteEMMD018 101 metaandesiteEMMD041 154.75 metaandesiteEMMD042 171.2 metaandesiteEMMD043 169.9 metaandesiteEMMD064 150 metaandesiteEMMD066 40 metaandesiteEMMD066 123.6 metaandesiteEMMD066 176 metaandesiteEMMD067 187 metaandesiteEMMD074 195 metaandesiteEMMD075 116.2 metaandesiteEMMD077 81.7 metaandesiteEMMD077 162.4 metaandesiteEMMD085 366.8 metaandesiteEMMD086 167.9 metaandesiteEMMD097 74.14 metaandesiteEMMD097 174.1 metaandesiteEMMD114 71 metaandesiteEMMD118 143.8 metaandesiteEMMD119 174.9 metaandesiteEMMD126 104 metaandesiteEMMD129 155 metaandesiteEMMD136 71.9 metaandesiteEMMD136 124 metaandesiteEMMD136 215 metaandesiteEMMD136 267.5 metaandesiteEMMD136 321 metaandesiteEMMD167 180.3 metaandesiteEMMD167 234 metaandesiteEMMD167 279.7 metaandesiteEMMD182 91.7 metaandesite
Eu Gd Tb Dy Ho Er Tm Yb Lu Ni LOI Total C Total S Mo Cu Pbppm ppm ppm ppm ppm ppm ppm ppm ppm ppm wt% wt% wt% ppm ppm ppm
Table B-2: Raw whole-rock data from ACME Labs
8.2 6.68 0.97 5.53 1.2 2.95 0.43 2.55 0.33 29 -1.2 0.33 6.97 277.43 >10000.00 28.837.62 7.59 0.83 4.56 0.95 2.85 0.43 3 0.44 33 10.6 2.9 1.36 234.94 1542.29 13.251.14 3.54 0.56 3.2 0.66 2.15 0.36 2.8 0.55 12 9.3 1.28 3.76 2.21 31.73 8.832.82 8.99 1.36 7.42 1.59 4.3 0.62 3.82 0.56 54 13 5.38 4.87 39.1 3273.16 9.141.21 5.87 0.97 5.75 1.14 3.44 0.49 3.04 0.45 36 3.5 0.35 <0.01 0.47 26.9 1.891.31 5.01 0.83 5 1.14 3.43 0.53 3.42 0.52 31 7.6 0.83 0.02 0.76 42.21 2.140.28 1.86 0.43 3.28 0.79 2.51 0.41 2.71 0.4 24 6.7 1.49 <0.01 0.08 7.26 3.680.3 2.12 0.58 4.43 1.06 3.21 0.47 2.93 0.43 13 1.9 0.19 0.02 1.67 13.03 3.11
1.16 3.85 0.78 5.38 1.39 4.55 0.73 4.69 0.66 28 3.5 0.32 0.38 61.09 1641.84 2.125.34 13.64 2.35 11.41 1.54 3.19 0.42 2.69 0.47 53 3.5 0.54 0.05 1.1 82.81 2.822.35 7.84 1.24 6.57 1.25 3.66 0.55 3.72 0.54 58 3.6 0.64 0.03 3.04 11.22 1.740.62 3.51 0.48 2.58 0.51 1.45 0.21 1.48 0.24 40 3.2 0.21 0.84 1.02 321.21 1.421.17 4.6 0.78 4.49 0.92 2.68 0.39 2.61 0.37 48 6 1.32 <0.01 1.2 30.03 2.430.72 2.92 0.67 4.35 0.95 2.8 0.41 2.63 0.4 16 8.2 1.7 0.04 2.17 7.65 1.261.43 5.26 0.87 5.29 1.06 2.86 0.42 2.75 0.43 36 3.7 0.63 0.02 0.22 153.08 4.580.73 2.44 0.49 3.55 0.8 2.55 0.4 2.69 0.43 30 2.2 0.12 0.03 2.75 163.45 2.631.81 7.86 1.36 7.68 1.57 4.51 0.69 4.48 0.66 24 3.5 0.72 0.02 2.39 97.83 3.461.21 4.64 0.71 4.16 0.84 2.63 0.41 2.73 0.44 13 8.5 1.88 0.06 0.69 494.58 1.251.59 5.5 0.85 5.06 1.05 3.54 0.55 3.63 0.57 27 5 1.01 0.03 3.33 63.86 1.870.41 2.08 0.42 2.81 0.68 2.17 0.36 2.63 0.42 <10 4.2 0.94 0.29 1.77 17.03 1.92.33 8.2 1.36 8.08 1.67 4.97 0.74 4.75 0.71 35 8 1.36 0.1 7.04 276.85 2.584.37 10.22 1.23 5.48 0.85 2.52 0.4 2.81 0.44 36 3.9 0.84 0.41 9.8 33.28 1.490.51 1.27 0.27 2.04 0.49 1.75 0.26 2.05 0.33 70 0.8 0.02 0.03 17.46 21.94 2.11.62 5.88 0.92 5.43 1.1 3.35 0.51 3.42 0.54 37 10.2 0.92 9.65 10.43 955.52 14.262.38 4.74 0.69 4.28 1.05 3.83 0.69 4.74 0.79 16 2.5 0.33 0.14 40.81 1059.45 2.321.58 2.2 0.33 1.92 0.42 1.29 0.19 1.23 0.21 17 8.7 1.4 0.05 6.81 2505.01 209.691.39 6.02 0.91 5.17 1.05 3.2 0.49 3.2 0.49 13 3.8 0.64 0.03 0.4 126.66 1.673.62 8.41 1.11 5.07 0.88 2.57 0.39 2.74 0.42 <10 3.4 0.61 0.02 0.74 37.06 3.110.6 2.49 0.47 3.12 0.69 2.21 0.34 2.06 0.35 52 4.3 0.34 0.08 1.07 20.76 1
0.95 3.95 0.61 3.21 0.6 1.59 0.26 1.52 0.23 20 7.7 1.65 0.25 0.29 7.35 0.641.41 5.69 0.95 5.48 1.12 3.07 0.49 3.12 0.48 44 6.8 1.22 <0.01 1.92 3.51 1.041.68 5.44 0.8 4.83 0.99 2.99 0.46 3.16 0.5 20 4.2 0.69 0.06 0.44 568.24 1.493.48 8.56 1.17 5.89 1.08 2.97 0.44 3.04 0.5 14 5.2 0.91 0.03 3.78 251.85 9.733.66 9.22 1.26 5.7 0.96 2.67 0.42 2.52 0.42 <10 5.6 1.33 0.15 0.45 1205.06 1.941.53 5.58 0.94 6.05 1.29 3.66 0.52 3.18 0.47 20 11.6 2.69 0.01 0.72 158.35 1.20.4 1.09 0.15 0.88 0.13 0.38 0.06 0.33 0.05 21 2.1 0.21 1.35 91.93 838.61 2.39
0.28 1.39 0.31 2.37 0.54 1.71 0.26 2 0.31 <10 2.4 0.36 <0.01 0.31 104.52 0.690.93 3.44 0.62 4 0.83 2.56 0.4 2.57 0.42 <10 7.2 1.51 <0.01 0.47 32.23 1.191.29 4.62 0.75 4.45 0.94 2.96 0.42 2.71 0.43 47 6.8 0.84 0.09 0.17 672.07 0.924.42 12.52 1.67 7.56 1.34 3.18 0.42 2.63 0.38 39 5.8 0.71 0.08 0.19 180.87 0.791.24 4.34 0.82 5.68 1.28 3.75 0.53 3 0.47 <10 2.8 0.44 <0.01 2.85 19.44 1.77
Appendix B: W
hole-Rock Geochem
ical Data
285

Hole ID Depth Lithology
EMMD085 310.5 marbleEMMD097 226.15 marbleEMMD136 361.85 marbleEMMD182 239.75 marble
EMM017 154.3 metaandesiteEMM018 133 metaandesiteEMM019 338 metaandesiteEMM022 74.6 metaandesite
EMMD002 120.5 metaandesiteEMMD008 126 metaandesiteEMMD018 101 metaandesiteEMMD041 154.75 metaandesiteEMMD042 171.2 metaandesiteEMMD043 169.9 metaandesiteEMMD064 150 metaandesiteEMMD066 40 metaandesiteEMMD066 123.6 metaandesiteEMMD066 176 metaandesiteEMMD067 187 metaandesiteEMMD074 195 metaandesiteEMMD075 116.2 metaandesiteEMMD077 81.7 metaandesiteEMMD077 162.4 metaandesiteEMMD085 366.8 metaandesiteEMMD086 167.9 metaandesiteEMMD097 74.14 metaandesiteEMMD097 174.1 metaandesiteEMMD114 71 metaandesiteEMMD118 143.8 metaandesiteEMMD119 174.9 metaandesiteEMMD126 104 metaandesiteEMMD129 155 metaandesiteEMMD136 71.9 metaandesiteEMMD136 124 metaandesiteEMMD136 215 metaandesiteEMMD136 267.5 metaandesiteEMMD136 321 metaandesiteEMMD167 180.3 metaandesiteEMMD167 234 metaandesiteEMMD167 279.7 metaandesiteEMMD182 91.7 metaandesite
Zn Ag Ni Co Mn As Au Cd Sb Bi Cr B Tl Hg Se Teppm ppb ppm ppm ppm ppm ppb ppm ppm ppm ppm ppm ppm ppb ppm ppm
Table B-2: Raw whole-rock data from ACME Labs
9 4160 23.8 342.8 386 524.5 597.5 <0.01 3.7 7.38 4.4 4 0.2 64 2.2 1.1685.4 2336 26.6 82.8 5755 48.9 48.1 0.13 4.01 6.9 54.1 7 1.09 <5 0.4 0.186.7 334 13.2 189.4 770 83.2 60.1 0.03 1.24 3.2 1.1 1 0.06 12 0.9 0.37
20.9 538 44.6 270.4 4829 101.9 127.8 0.05 1.86 4.21 5.2 <1 0.26 52 1.1 0.5166.3 22 32.7 14.7 297 0.8 <0.2 0.03 0.37 <0.02 28.8 4 0.25 <5 <0.1 <0.02116.8 34 28.7 9.2 1257 2.3 0.5 0.03 0.42 <0.02 26.4 7 0.04 <5 <0.1 <0.0232.4 28 26.3 7.9 1551 1.1 <0.2 0.03 0.69 0.02 27.3 2 0.06 <5 <0.1 0.0311.4 45 15.6 4.4 191 1.8 1.1 <0.01 0.18 <0.02 24.1 <1 0.02 <5 <0.1 0.0254.4 298 31.4 45.6 752 18.5 31.6 0.12 0.3 0.35 10.6 2 0.36 <5 0.3 0.0493.7 56 52.1 13.2 479 3.2 0.4 <0.01 0.29 0.02 54.5 <1 0.62 <5 <0.1 <0.0216 39 49.2 13.4 511 3 1.6 0.02 0.12 <0.02 54.9 <1 0.6 <5 <0.1 <0.02
14.8 45 38.5 64.5 320 20.3 2.4 0.02 0.17 0.38 2 <1 0.11 <5 0.4 0.0443.6 40 40.1 12 1692 1.6 1.5 0.01 0.22 0.04 34.8 <1 0.49 <5 <0.1 <0.028.9 23 11.2 7.9 1956 3.4 0.6 <0.01 0.2 0.06 16.9 3 0.06 <5 <0.1 0.02
45.8 37 28.5 22.3 848 2.9 2 0.01 0.22 0.03 15.5 1 0.28 <5 <0.1 <0.0241.1 58 32.5 15.3 491 4.5 2.4 0.01 0.44 0.05 15.1 3 0.11 <5 <0.1 0.0333.1 38 27 6.6 659 3.9 1.3 0.01 1.11 <0.02 13.4 <1 0.21 <5 <0.1 <0.024.5 72 13.6 1.9 2345 <0.1 2.9 <0.01 0.2 <0.02 12.9 <1 0.06 <5 <0.1 0.038.2 13 27.9 6.4 1261 0.7 1.3 <0.01 0.12 <0.02 15.3 <1 0.03 <5 0.1 <0.027.9 42 1.7 15.8 741 3.6 2.1 0.07 0.08 0.14 1.6 <1 <0.02 <5 <0.1 0.02
26.4 112 32.4 74.3 3971 18.5 7 0.02 1.32 0.22 12.7 6 0.14 13 <0.1 0.0323.6 51 39.2 28.2 1292 20.3 2.5 <0.01 0.63 0.14 21.7 2 0.39 <5 0.4 <0.028.7 83 45.2 4.7 262 3.1 2.6 0.06 0.43 0.16 26.4 1 0.05 <5 <0.1 <0.02
12.8 963 33.7 282.8 750 147.9 109 0.05 0.92 6.86 2.7 2 0.06 21 2.7 1.7330.5 317 17.2 4.8 622 4.1 14.4 <0.01 1.58 0.18 9.8 2 0.61 <5 <0.1 <0.02991 638 14.9 67.4 769 118.6 85.2 0.7 1.34 2.83 10.2 13 0.03 16 0.1 0.1326.6 21 21.7 16.3 448 5.1 2 <0.01 0.25 0.02 32.5 <1 0.02 8 0.1 <0.028.3 21 16.7 8.3 502 1.3 2.5 0.02 0.19 0.04 15.5 2 0.02 <5 <0.1 0.02
33.1 85 49.7 18.2 694 5.5 22.2 <0.01 0.06 0.06 29.3 1 <0.02 <5 <0.1 0.058.3 24 26.5 14.8 1155 17.5 1.4 <0.01 0.06 0.05 32.8 <1 <0.02 <5 <0.1 <0.0241 14 48.6 14.4 1709 1.4 <0.2 <0.01 0.2 <0.02 52 2 0.08 <5 <0.1 <0.02
10.9 59 24.5 11.2 778 0.8 3.4 <0.01 0.08 0.04 13.8 2 0.02 <5 <0.1 <0.0224.3 33 22.9 11.2 777 2.5 1.3 <0.01 0.16 0.05 11.7 3 0.09 <5 <0.1 <0.029.8 125 14.3 9.2 1443 2.1 6.3 <0.01 0.16 0.04 15.8 <1 <0.02 <5 <0.1 <0.026.7 33 14.8 5.4 2734 4.5 1.2 0.03 0.1 0.03 12.3 <1 0.06 <5 <0.1 0.022.4 436 18.1 273 215 78 229.8 <0.01 0.77 11.94 3.6 2 0.06 75 3.2 4.691.6 23 7 0.8 343 0.7 2.1 0.01 0.11 <0.02 25 <1 <0.02 <5 <0.1 0.037.7 32 17.2 8 2093 0.6 1.6 <0.01 0.09 0.03 28.2 <1 <0.02 <5 <0.1 0.02
53.6 64 46.1 41.6 1235 4.3 3.1 <0.01 0.08 0.05 12.5 1 <0.02 <5 0.2 <0.0225.4 34 43.5 17.6 989 7.5 7.3 <0.01 0.13 0.05 14 3 <0.02 <5 <0.1 <0.022.3 28 3.8 1.2 577 0.6 1.3 0.04 0.1 0.04 15.9 3 0.02 <5 <0.1 0.03
Appendix B: W
hole-Rock Geochem
ical Data
286

Hole ID Depth Lithology
EMMD085 310.5 marbleEMMD097 226.15 marbleEMMD136 361.85 marbleEMMD182 239.75 marble
EMM017 154.3 metaandesiteEMM018 133 metaandesiteEMM019 338 metaandesiteEMM022 74.6 metaandesite
EMMD002 120.5 metaandesiteEMMD008 126 metaandesiteEMMD018 101 metaandesiteEMMD041 154.75 metaandesiteEMMD042 171.2 metaandesiteEMMD043 169.9 metaandesiteEMMD064 150 metaandesiteEMMD066 40 metaandesiteEMMD066 123.6 metaandesiteEMMD066 176 metaandesiteEMMD067 187 metaandesiteEMMD074 195 metaandesiteEMMD075 116.2 metaandesiteEMMD077 81.7 metaandesiteEMMD077 162.4 metaandesiteEMMD085 366.8 metaandesiteEMMD086 167.9 metaandesiteEMMD097 74.14 metaandesiteEMMD097 174.1 metaandesiteEMMD114 71 metaandesiteEMMD118 143.8 metaandesiteEMMD119 174.9 metaandesiteEMMD126 104 metaandesiteEMMD129 155 metaandesiteEMMD136 71.9 metaandesiteEMMD136 124 metaandesiteEMMD136 215 metaandesiteEMMD136 267.5 metaandesiteEMMD136 321 metaandesiteEMMD167 180.3 metaandesiteEMMD167 234 metaandesiteEMMD167 279.7 metaandesiteEMMD182 91.7 metaandesite
Ge In Re Be Li Pd Pt Ba-XRF Cu-XRF F-XRFppm ppm ppb ppm ppm ppb ppb wt% wt% wt%
Table B-2: Raw whole-rock data from ACME Labs
0.7 0.23 128 1.2 12.6 * <2 9.25 2.61 4.30.2 0.21 43 0.7 38.9 * <2 4.23 0.16 1.28
<0.1 0.02 <1 0.1 9.3 <10 <2 N.A. N.A. 0.3<0.1 0.07 37 0.1 11.6 <10 2 0.23 0.33 0.32<0.1 <0.02 <1 0.4 18.4 11 <2 N.A. N.A. 0.090.1 0.02 <1 0.5 28.8 <10 <2 N.A. N.A. 0.11
<0.1 <0.02 <1 0.2 9.9 <10 <2 N.A. N.A. 0.08<0.1 <0.02 2 0.4 6.9 20 4 N.A. N.A. 0.140.2 0.05 20 0.5 20 20 11 0.5 0.16 0.530.2 <0.02 1 1.7 10.9 13 <2 N.A. N.A. 0.320.4 <0.02 <1 0.6 10.6 <10 9 N.A. N.A. 0.320.1 <0.02 3 0.7 10.8 <10 3 0.01 0.04 0.10.3 <0.02 1 0.4 14 17 <2 N.A. N.A. 0.15
<0.1 0.03 <1 0.5 8.7 19 <2 N.A. N.A. 0.130.1 <0.02 <1 0.5 11 <10 <2 N.A. N.A. 0.12
<0.1 <0.02 4 0.4 27.2 <10 8 N.A. N.A. 0.34<0.1 <0.02 <1 0.4 8 <10 5 N.A. N.A. 0.16<0.1 0.02 <1 0.6 2.1 17 <2 N.A. N.A. 0.16<0.1 <0.02 2 0.3 5.7 13 <2 N.A. N.A. 0.16<0.1 <0.02 <1 0.1 2.4 <10 <2 0.19 <0.01 0.030.1 0.02 5 0.9 21.4 <10 <2 0.55 0.03 0.29
<0.1 0.03 2 0.7 18.9 30 <2 N.A. N.A. 0.610.2 <0.02 <1 0.2 13.2 <10 <2 0.29 0.01 0.25
<0.1 0.03 32 0.4 7.4 <10 <2 0.41 0.1 0.36<0.1 0.07 <1 0.9 57.1 * 5 N.A. N.A. 1.22
1 0.12 1 1 20.9 <10 <2 0.01 0.23 0.090.1 0.02 <1 0.4 12.2 <10 4 N.A. N.A. 0.07
<0.1 <0.02 <1 0.3 4.1 <10 7 N.A. N.A. 0.17<0.1 <0.02 <1 0.5 16.2 <10 <2 N.A. N.A. 0.090.2 <0.02 <1 0.7 22.7 21 <2 0.06 <0.01 0.110.1 0.02 2 0.4 25 <10 3 N.A. N.A. 0.090.1 <0.02 <1 0.2 8 <10 <2 N.A. N.A. 0.1
<0.1 <0.02 4 0.2 6.3 <10 <2 N.A. N.A. 0.16<0.1 0.03 <1 <0.1 2.7 <10 <2 N.A. N.A. 0.16<0.1 <0.02 2 0.2 3.2 <10 <2 N.A. N.A. 0.18<0.1 <0.02 <1 0.2 3.6 <10 <2 N.A. N.A. 0.19<0.1 <0.02 <1 0.2 2 <10 <2 N.A. N.A. 0.13<0.1 <0.02 <1 0.3 3.1 <10 <2 N.A. N.A. 0.07<0.1 <0.02 <1 <0.1 19.7 <10 <2 N.A. N.A. 0.08<0.1 <0.02 <1 0.6 11.9 <10 <2 N.A. N.A. 0.15<0.1 <0.02 <1 0.3 0.7 <10 <2 N.A. N.A. 0.08
Appendix B: W
hole-Rock Geochem
ical Data
287

Wgt SiO2 Al2O3 Fe2O3* MgO CaO Na2O K2O TiO2 P2O5 MnO Cr2O3 Ba Sc Sum Cs Gakg wt% wt% wt% wt% wt% wt% wt% wt% wt% wt% wt% ppm ppm wt% ppm ppm
Hole ID Depth Lithology
Table B-2: Raw whole-rock data from ACME Labs
EMMD184 50 metaandesite 0.27 45.85 15.88 11.33 3.69 6.19 3.88 3.3 1.35 0.13 0.22 0.003 1322 17 99.64 9.6 22.5EMMD184 150.1 metaandesite 0.19 50.47 16.01 16.22 1.93 1.92 4.9 2.16 1.62 0.15 0.21 0.012 3301 31 99.51 2.1 21EMMD196 27.5 metaandesite 0.12 51.57 16.93 3.74 0.49 8.5 7.71 1.28 1.57 0.19 0.24 0.003 811 18 99.81 1.2 13.1EMMD196 162 metaandesite 0.11 51.39 14.03 14.35 1.27 4.3 3.83 2.57 1.47 0.15 0.24 0.004 773 26 99.81 1.8 18.6
EMM023 153.1 metasiltstone 0.14 3.42 0.93 66.62 2.14 8.77 <0.01 0.37 0.05 0.61 0.99 <0.002 1279 2 88.35 1.1 3.3EMMD008 93.50 metasiltstone 0.22 14.06 1.31 44.67 0.69 2.95 <0.01 <0.01 0.04 0.45 0.22 0.002 >50000 3 66.38 0.1 2.3EMMD009 131.9 metasiltstone 0.12 56.77 11.77 8.27 5.58 3.87 3.21 2.16 0.67 0.65 0.05 0.007 514 10 99.78 0.8 15.5EMMD009 182.3 metasiltstone 0.23 57.08 15.11 5.97 3.06 4.31 2.03 5.75 0.72 0.31 0.13 0.009 1367 14 99.67 3.6 23.2
EMMD0113 97.60 metasiltstone 0.21 26.15 0.98 48.95 2.03 3.39 0.02 0.18 0.08 0.56 0.8 <0.002 1704 3 98.03 0.5 4.7EMMD086 105.90 metasiltstone 0.27 44.48 13.9 25.86 3.38 0.57 2 1.46 2.1 0.32 0.38 0.002 5065 23 99.13 0.5 23.7EMMD086 194.9 metasiltstone 0.28 51.07 16.14 6.63 1.48 7.94 3.93 2.93 1.54 0.15 0.19 0.004 2136 24 99.6 0.9 22.5EMMD097 128.5 metasiltstone 0.17 50.5 16.77 13.54 4.3 2.12 5.95 0.79 1.68 0.19 0.06 0.006 738 21 99.76 2.1 19.2EMMD184 125.9 metasiltstone 0.23 42.36 10.27 20.49 0.91 4.71 0.21 2.2 0.94 0.58 5 0.004 21076 17 97.09 2.4 19.5EMMD018 139 metatuff 0.14 55.46 13.27 10.62 3.94 3.9 3.75 1.41 1.35 0.1 0.14 0.005 527 25 99.78 1.5 19EMMD066 53.6 metatuff 0.16 52.23 1.13 31.96 0.42 2.23 0.25 0.13 0.08 0.58 1.19 <0.002 2464 3 97.56 0.4 2.3EMMD075 166 metatuff 0.15 43.26 17.15 21.5 3.7 0.95 2.36 4.77 2.58 0.3 0.17 0.003 7041 30 99 3.7 28.4EMMD076 107 metatuff 0.12 45.57 13.42 11.36 3.65 7.01 5.93 1.23 1.38 0.13 0.58 0.005 1064 22 99.74 4.7 13.4EMMD085 288.75 metatuff 0.32 30.89 12.17 32.31 4.02 3.5 0.4 3.51 1.07 0.37 0.13 0.002 2790 17 99.43 2.1 17.6EMMD067 76 metavolcanic breccia 0.19 32.2 13.58 33.92 3.87 0.79 0.26 1.97 1.89 0.32 1.32 <0.002 13732 18 98.15 1.7 19.6EMMD067 127.1 metavolcanic breccia 0.16 37.61 12.8 33.99 1.62 0.86 0.98 3.16 1.08 0.48 0.48 0.004 17885 15 97.38 2.8 17.6EMMD074 105.5 metavolcanic breccia 0.17 19.62 7.91 60.88 2.3 1.53 0.75 1.64 0.85 0.69 0.12 0.003 807 9 99.66 0.9 20.2EMMD075 39.4 metavolcanic breccia 0.13 32.76 17.1 35.78 2.5 0.53 1.93 3.77 1.47 0.33 0.03 0.005 6846 19 99.08 1 20.1EMMD077 201.5 metavolcanic breccia 0.27 37.49 8.9 34.89 1.4 2.86 0.07 2.9 0.83 0.42 0.03 0.005 >50000 11 93.49 0.6 11.1EMMD077 250.2 metavolcanic breccia 0.14 46.72 12.64 23.17 1.67 3.48 0.32 3.86 1.35 0.24 0.08 0.008 11042 21 98.62 0.9 24.1EMMD085 344.1 metavolcanic breccia 0.25 14.72 3.56 45.65 1.23 8.37 0.02 1.15 0.31 0.63 0.05 0.007 >50000 5 77.08 0.2 7.9EMMD086 48.4 metavolcanic breccia 0.23 42.12 15.5 23.83 3.25 0.78 0.17 3.87 1.43 0.27 0.12 0.002 9506 18 98.41 3.5 16.9EMMD086 125 metavolcanic breccia 0.18 39.38 11.96 31.42 3.7 1.18 0.12 4.16 1.69 0.31 0.3 <0.002 9063 22 98.47 6.6 16.5
EMM022 167.1 psammite 0.22 23.29 9.31 43.74 3.98 7.95 0.14 0.49 0.81 0.63 0.41 0.007 11981 14 96.86 0.5 12.1EMMD013 170.9 psammite 0.15 58.97 13.78 3.31 2.26 6.21 6.98 0.8 0.49 0.15 0.06 0.008 389 10 99.89 0.8 18.5
288
Appendix B: W
hole-Rock Geochem
ical Data
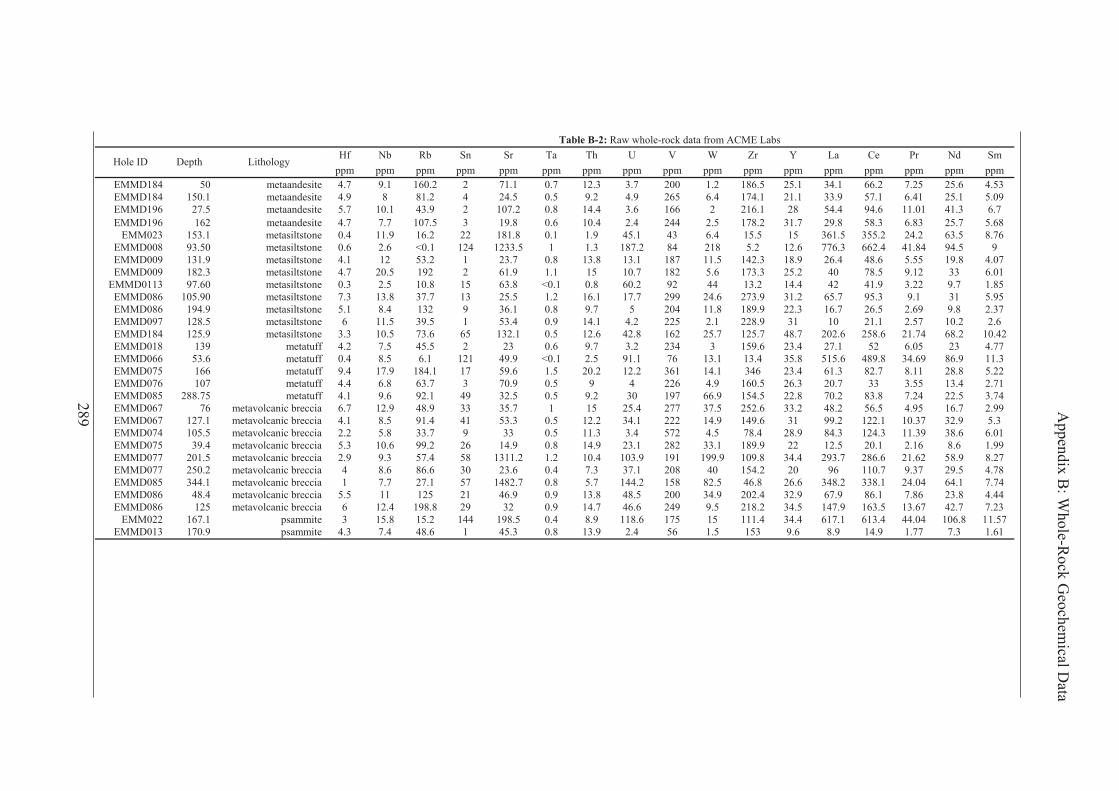
Hole ID Depth Lithology
EMMD184 50 metaandesiteEMMD184 150.1 metaandesiteEMMD196 27.5 metaandesiteEMMD196 162 metaandesite
EMM023 153.1 metasiltstoneEMMD008 93.50 metasiltstoneEMMD009 131.9 metasiltstoneEMMD009 182.3 metasiltstone
EMMD0113 97.60 metasiltstoneEMMD086 105.90 metasiltstoneEMMD086 194.9 metasiltstoneEMMD097 128.5 metasiltstoneEMMD184 125.9 metasiltstoneEMMD018 139 metatuffEMMD066 53.6 metatuffEMMD075 166 metatuffEMMD076 107 metatuffEMMD085 288.75 metatuffEMMD067 76 metavolcanic brecciaEMMD067 127.1 metavolcanic brecciaEMMD074 105.5 metavolcanic brecciaEMMD075 39.4 metavolcanic brecciaEMMD077 201.5 metavolcanic brecciaEMMD077 250.2 metavolcanic brecciaEMMD085 344.1 metavolcanic brecciaEMMD086 48.4 metavolcanic brecciaEMMD086 125 metavolcanic breccia
EMM022 167.1 psammiteEMMD013 170.9 psammite
Hf Nb Rb Sn Sr Ta Th U V W Zr Y La Ce Pr Nd Smppm ppm ppm ppm ppm ppm ppm ppm ppm ppm ppm ppm ppm ppm ppm ppm ppm
Table B-2: Raw whole-rock data from ACME Labs
4.7 9.1 160.2 2 71.1 0.7 12.3 3.7 200 1.2 186.5 25.1 34.1 66.2 7.25 25.6 4.534.9 8 81.2 4 24.5 0.5 9.2 4.9 265 6.4 174.1 21.1 33.9 57.1 6.41 25.1 5.095.7 10.1 43.9 2 107.2 0.8 14.4 3.6 166 2 216.1 28 54.4 94.6 11.01 41.3 6.74.7 7.7 107.5 3 19.8 0.6 10.4 2.4 244 2.5 178.2 31.7 29.8 58.3 6.83 25.7 5.680.4 11.9 16.2 22 181.8 0.1 1.9 45.1 43 6.4 15.5 15 361.5 355.2 24.2 63.5 8.760.6 2.6 <0.1 124 1233.5 1 1.3 187.2 84 218 5.2 12.6 776.3 662.4 41.84 94.5 94.1 12 53.2 1 23.7 0.8 13.8 13.1 187 11.5 142.3 18.9 26.4 48.6 5.55 19.8 4.074.7 20.5 192 2 61.9 1.1 15 10.7 182 5.6 173.3 25.2 40 78.5 9.12 33 6.010.3 2.5 10.8 15 63.8 <0.1 0.8 60.2 92 44 13.2 14.4 42 41.9 3.22 9.7 1.857.3 13.8 37.7 13 25.5 1.2 16.1 17.7 299 24.6 273.9 31.2 65.7 95.3 9.1 31 5.955.1 8.4 132 9 36.1 0.8 9.7 5 204 11.8 189.9 22.3 16.7 26.5 2.69 9.8 2.376 11.5 39.5 1 53.4 0.9 14.1 4.2 225 2.1 228.9 31 10 21.1 2.57 10.2 2.6
3.3 10.5 73.6 65 132.1 0.5 12.6 42.8 162 25.7 125.7 48.7 202.6 258.6 21.74 68.2 10.424.2 7.5 45.5 2 23 0.6 9.7 3.2 234 3 159.6 23.4 27.1 52 6.05 23 4.770.4 8.5 6.1 121 49.9 <0.1 2.5 91.1 76 13.1 13.4 35.8 515.6 489.8 34.69 86.9 11.39.4 17.9 184.1 17 59.6 1.5 20.2 12.2 361 14.1 346 23.4 61.3 82.7 8.11 28.8 5.224.4 6.8 63.7 3 70.9 0.5 9 4 226 4.9 160.5 26.3 20.7 33 3.55 13.4 2.714.1 9.6 92.1 49 32.5 0.5 9.2 30 197 66.9 154.5 22.8 70.2 83.8 7.24 22.5 3.746.7 12.9 48.9 33 35.7 1 15 25.4 277 37.5 252.6 33.2 48.2 56.5 4.95 16.7 2.994.1 8.5 91.4 41 53.3 0.5 12.2 34.1 222 14.9 149.6 31 99.2 122.1 10.37 32.9 5.32.2 5.8 33.7 9 33 0.5 11.3 3.4 572 4.5 78.4 28.9 84.3 124.3 11.39 38.6 6.015.3 10.6 99.2 26 14.9 0.8 14.9 23.1 282 33.1 189.9 22 12.5 20.1 2.16 8.6 1.992.9 9.3 57.4 58 1311.2 1.2 10.4 103.9 191 199.9 109.8 34.4 293.7 286.6 21.62 58.9 8.274 8.6 86.6 30 23.6 0.4 7.3 37.1 208 40 154.2 20 96 110.7 9.37 29.5 4.781 7.7 27.1 57 1482.7 0.8 5.7 144.2 158 82.5 46.8 26.6 348.2 338.1 24.04 64.1 7.74
5.5 11 125 21 46.9 0.9 13.8 48.5 200 34.9 202.4 32.9 67.9 86.1 7.86 23.8 4.446 12.4 198.8 29 32 0.9 14.7 46.6 249 9.5 218.2 34.5 147.9 163.5 13.67 42.7 7.233 15.8 15.2 144 198.5 0.4 8.9 118.6 175 15 111.4 34.4 617.1 613.4 44.04 106.8 11.57
4.3 7.4 48.6 1 45.3 0.8 13.9 2.4 56 1.5 153 9.6 8.9 14.9 1.77 7.3 1.61
289
Appendix B: W
hole-Rock Geochem
ical Data

Hole ID Depth Lithology
EMMD184 50 metaandesiteEMMD184 150.1 metaandesiteEMMD196 27.5 metaandesiteEMMD196 162 metaandesite
EMM023 153.1 metasiltstoneEMMD008 93.50 metasiltstoneEMMD009 131.9 metasiltstoneEMMD009 182.3 metasiltstone
EMMD0113 97.60 metasiltstoneEMMD086 105.90 metasiltstoneEMMD086 194.9 metasiltstoneEMMD097 128.5 metasiltstoneEMMD184 125.9 metasiltstoneEMMD018 139 metatuffEMMD066 53.6 metatuffEMMD075 166 metatuffEMMD076 107 metatuffEMMD085 288.75 metatuffEMMD067 76 metavolcanic brecciaEMMD067 127.1 metavolcanic brecciaEMMD074 105.5 metavolcanic brecciaEMMD075 39.4 metavolcanic brecciaEMMD077 201.5 metavolcanic brecciaEMMD077 250.2 metavolcanic brecciaEMMD085 344.1 metavolcanic brecciaEMMD086 48.4 metavolcanic brecciaEMMD086 125 metavolcanic breccia
EMM022 167.1 psammiteEMMD013 170.9 psammite
Eu Gd Tb Dy Ho Er Tm Yb Lu Ni LOI Total C Total S Mo Cu Pbppm ppm ppm ppm ppm ppm ppm ppm ppm ppm wt% wt% wt% ppm ppm ppm
Table B-2: Raw whole-rock data from ACME Labs
1.39 4.8 0.76 4.47 0.9 2.7 0.39 2.53 0.37 39 7.8 1.37 0.05 0.08 446.36 2.211.44 4.98 0.75 4.01 0.74 2.31 0.32 2.14 0.35 36 3.9 0.69 <0.01 0.16 42.74 1.081.7 6.52 0.96 5.35 1.08 3.06 0.46 3.06 0.45 10 7.6 1.82 <0.01 0.62 9.3 31.5 5.94 1.01 5.78 1.1 3.08 0.44 2.8 0.43 32 6.2 1.36 <0.01 1.02 64.75 1.87
8.87 8.57 0.92 3.94 0.63 1.12 0.15 0.84 0.07 43 4.4 2.98 3.98 109.46 3478.03 26.964.7 10.68 0.82 3.2 0.58 1.37 0.22 1.18 0.14 15 2.7 0.5 7.24 45.32 >10000.00 182.85
0.66 4.13 0.63 3.52 0.68 1.75 0.25 1.55 0.22 76 6.7 0.84 2.44 10.14 65.87 3.630.85 5.34 0.8 4.54 0.86 2.52 0.39 2.45 0.36 42 5.2 1.11 1.07 4.5 329.34 2.61
3 2.78 0.5 3.13 0.56 1.27 0.13 0.78 0.1 44 14.9 4.41 2.45 80.4 >10000.00 48.741.94 6.01 1.05 6.16 1.28 3.71 0.62 3.98 0.6 25 4.7 0.58 0.48 15.13 1018.82 2.120.94 2.89 0.58 3.88 0.86 2.62 0.42 2.77 0.42 <10 7.6 1.75 0.08 0.96 614.51 0.750.6 3.38 0.72 5.15 1.19 3.51 0.5 3.36 0.51 30 3.8 0.42 <0.01 0.72 8.82 1.46
4.32 10.6 1.5 8.43 1.84 4.93 0.7 4.05 0.49 23 9.4 2.09 0.07 3.37 3280.01 5.341.34 4.58 0.79 4.43 0.91 2.72 0.39 2.49 0.39 49 5.8 0.91 0.05 0.46 175.64 1.4112.54 11.82 1.42 6.89 1.16 2.54 0.3 1.71 0.21 19 7.4 1.74 3.9 79.9 >10000.00 66.07
1.8 5.17 0.72 4.1 0.9 3.22 0.57 3.98 0.63 25 2.3 0.1 0.02 1.51 146.95 1.451.01 3.61 0.67 4.14 0.96 2.69 0.41 2.54 0.39 55 9.5 2.36 0.22 1.87 85.68 1.311.81 4.19 0.66 3.97 0.77 2.27 0.34 2.22 0.37 41 11 2.58 2.2 49.34 460.33 3.992.02 3.88 0.71 4.99 1.13 3.73 0.57 3.67 0.54 37 8 1.42 1.12 88.07 806.14 4.332.61 5.76 0.82 4.92 1.06 3.23 0.5 3.19 0.52 32 4.3 0.77 1.84 56.13 3928.8 4.940.9 6.33 0.88 4.76 0.98 2.89 0.41 2.68 0.4 72 3.4 0.04 5.35 1.64 505.74 2.94
1.14 2.7 0.5 3.45 0.74 2.58 0.37 2.53 0.39 43 2.9 0.02 1.13 32.47 57.45 1.967 8.13 1.1 6.21 1.37 4.12 0.65 4.43 0.65 30 3.7 0.08 4.46 100.9 3798.5 18.67
3.01 4.8 0.72 3.92 0.74 2.11 0.29 2.05 0.29 31 5.1 0.72 1.89 29.65 50.77 4.567.92 8.02 0.97 5.22 1.01 3.12 0.43 2.64 0.36 31 1.4 0.39 8.58 157.11 >10000.00 22.372.13 5.28 0.88 5.44 1.08 3.18 0.48 3.19 0.48 59 7.1 0.86 0.67 30.89 3028.61 9.514.15 7.13 1.11 6.28 1.29 3.63 0.55 3.56 0.55 41 4.2 0.35 2.45 83.82 2507.53 7.03
13.07 10.53 1.22 6.88 1.36 3.79 0.57 3.25 0.44 69 6.1 0.88 3.76 343.45 >10000.00 55.960.67 2.01 0.31 1.75 0.34 1.03 0.14 1.05 0.17 24 6.9 1.37 0.09 0.72 38.04 1.55
290
Appendix B: W
hole-Rock Geochem
ical Data
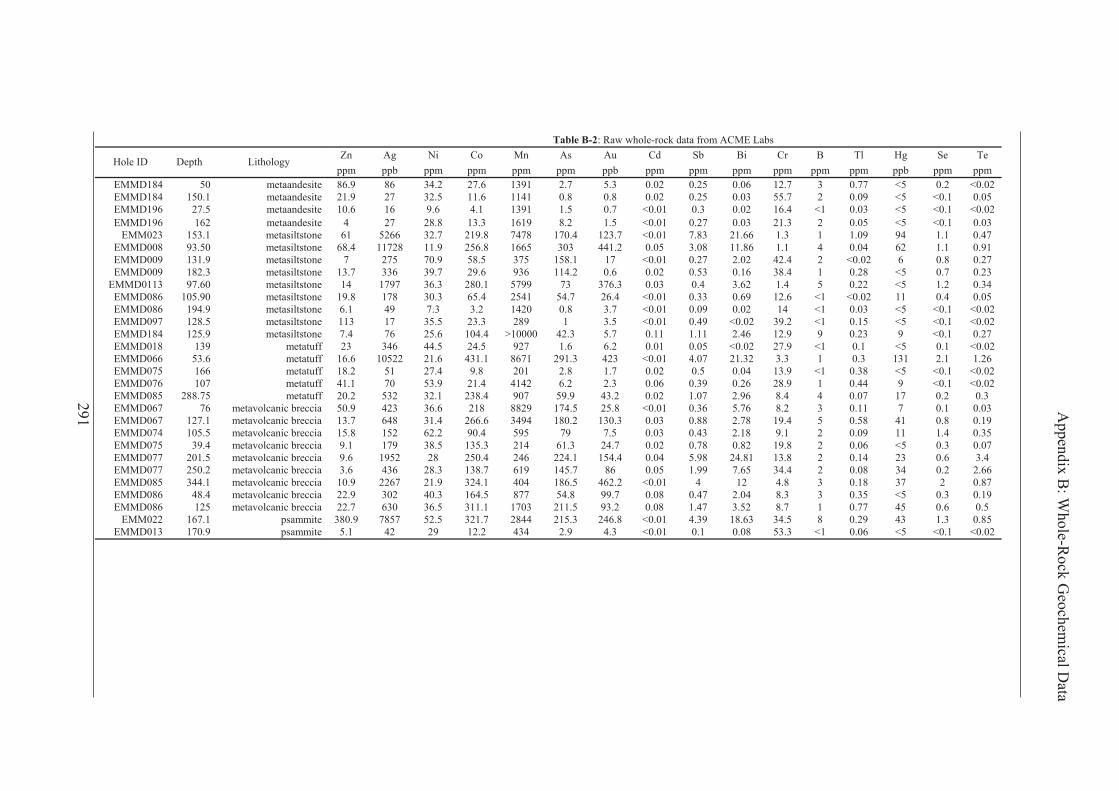
Hole ID Depth Lithology
EMMD184 50 metaandesiteEMMD184 150.1 metaandesiteEMMD196 27.5 metaandesiteEMMD196 162 metaandesite
EMM023 153.1 metasiltstoneEMMD008 93.50 metasiltstoneEMMD009 131.9 metasiltstoneEMMD009 182.3 metasiltstone
EMMD0113 97.60 metasiltstoneEMMD086 105.90 metasiltstoneEMMD086 194.9 metasiltstoneEMMD097 128.5 metasiltstoneEMMD184 125.9 metasiltstoneEMMD018 139 metatuffEMMD066 53.6 metatuffEMMD075 166 metatuffEMMD076 107 metatuffEMMD085 288.75 metatuffEMMD067 76 metavolcanic brecciaEMMD067 127.1 metavolcanic brecciaEMMD074 105.5 metavolcanic brecciaEMMD075 39.4 metavolcanic brecciaEMMD077 201.5 metavolcanic brecciaEMMD077 250.2 metavolcanic brecciaEMMD085 344.1 metavolcanic brecciaEMMD086 48.4 metavolcanic brecciaEMMD086 125 metavolcanic breccia
EMM022 167.1 psammiteEMMD013 170.9 psammite
Zn Ag Ni Co Mn As Au Cd Sb Bi Cr B Tl Hg Se Teppm ppb ppm ppm ppm ppm ppb ppm ppm ppm ppm ppm ppm ppb ppm ppm
Table B-2: Raw whole-rock data from ACME Labs
86.9 86 34.2 27.6 1391 2.7 5.3 0.02 0.25 0.06 12.7 3 0.77 <5 0.2 <0.0221.9 27 32.5 11.6 1141 0.8 0.8 0.02 0.25 0.03 55.7 2 0.09 <5 <0.1 0.0510.6 16 9.6 4.1 1391 1.5 0.7 <0.01 0.3 0.02 16.4 <1 0.03 <5 <0.1 <0.02
4 27 28.8 13.3 1619 8.2 1.5 <0.01 0.27 0.03 21.3 2 0.05 <5 <0.1 0.0361 5266 32.7 219.8 7478 170.4 123.7 <0.01 7.83 21.66 1.3 1 1.09 94 1.1 0.47
68.4 11728 11.9 256.8 1665 303 441.2 0.05 3.08 11.86 1.1 4 0.04 62 1.1 0.917 275 70.9 58.5 375 158.1 17 <0.01 0.27 2.02 42.4 2 <0.02 6 0.8 0.27
13.7 336 39.7 29.6 936 114.2 0.6 0.02 0.53 0.16 38.4 1 0.28 <5 0.7 0.2314 1797 36.3 280.1 5799 73 376.3 0.03 0.4 3.62 1.4 5 0.22 <5 1.2 0.34
19.8 178 30.3 65.4 2541 54.7 26.4 <0.01 0.33 0.69 12.6 <1 <0.02 11 0.4 0.056.1 49 7.3 3.2 1420 0.8 3.7 <0.01 0.09 0.02 14 <1 0.03 <5 <0.1 <0.02113 17 35.5 23.3 289 1 3.5 <0.01 0.49 <0.02 39.2 <1 0.15 <5 <0.1 <0.027.4 76 25.6 104.4 >10000 42.3 5.7 0.11 1.11 2.46 12.9 9 0.23 9 <0.1 0.2723 346 44.5 24.5 927 1.6 6.2 0.01 0.05 <0.02 27.9 <1 0.1 <5 0.1 <0.02
16.6 10522 21.6 431.1 8671 291.3 423 <0.01 4.07 21.32 3.3 1 0.3 131 2.1 1.2618.2 51 27.4 9.8 201 2.8 1.7 0.02 0.5 0.04 13.9 <1 0.38 <5 <0.1 <0.0241.1 70 53.9 21.4 4142 6.2 2.3 0.06 0.39 0.26 28.9 1 0.44 9 <0.1 <0.0220.2 532 32.1 238.4 907 59.9 43.2 0.02 1.07 2.96 8.4 4 0.07 17 0.2 0.350.9 423 36.6 218 8829 174.5 25.8 <0.01 0.36 5.76 8.2 3 0.11 7 0.1 0.0313.7 648 31.4 266.6 3494 180.2 130.3 0.03 0.88 2.78 19.4 5 0.58 41 0.8 0.1915.8 152 62.2 90.4 595 79 7.5 0.03 0.43 2.18 9.1 2 0.09 11 1.4 0.359.1 179 38.5 135.3 214 61.3 24.7 0.02 0.78 0.82 19.8 2 0.06 <5 0.3 0.079.6 1952 28 250.4 246 224.1 154.4 0.04 5.98 24.81 13.8 2 0.14 23 0.6 3.43.6 436 28.3 138.7 619 145.7 86 0.05 1.99 7.65 34.4 2 0.08 34 0.2 2.66
10.9 2267 21.9 324.1 404 186.5 462.2 <0.01 4 12 4.8 3 0.18 37 2 0.8722.9 302 40.3 164.5 877 54.8 99.7 0.08 0.47 2.04 8.3 3 0.35 <5 0.3 0.1922.7 630 36.5 311.1 1703 211.5 93.2 0.08 1.47 3.52 8.7 1 0.77 45 0.6 0.5380.9 7857 52.5 321.7 2844 215.3 246.8 <0.01 4.39 18.63 34.5 8 0.29 43 1.3 0.85
5.1 42 29 12.2 434 2.9 4.3 <0.01 0.1 0.08 53.3 <1 0.06 <5 <0.1 <0.02
291
Appendix B: W
hole-Rock Geochem
ical Data
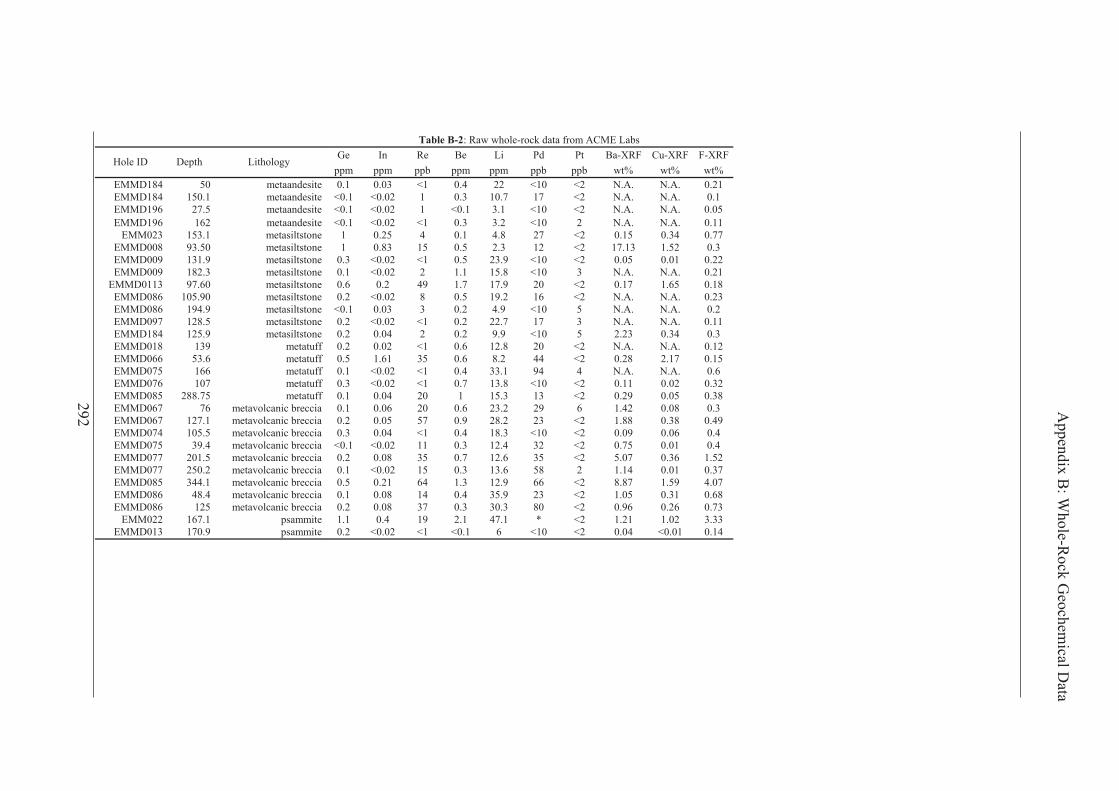
Hole ID Depth Lithology
EMMD184 50 metaandesiteEMMD184 150.1 metaandesiteEMMD196 27.5 metaandesiteEMMD196 162 metaandesite
EMM023 153.1 metasiltstoneEMMD008 93.50 metasiltstoneEMMD009 131.9 metasiltstoneEMMD009 182.3 metasiltstone
EMMD0113 97.60 metasiltstoneEMMD086 105.90 metasiltstoneEMMD086 194.9 metasiltstoneEMMD097 128.5 metasiltstoneEMMD184 125.9 metasiltstoneEMMD018 139 metatuffEMMD066 53.6 metatuffEMMD075 166 metatuffEMMD076 107 metatuffEMMD085 288.75 metatuffEMMD067 76 metavolcanic brecciaEMMD067 127.1 metavolcanic brecciaEMMD074 105.5 metavolcanic brecciaEMMD075 39.4 metavolcanic brecciaEMMD077 201.5 metavolcanic brecciaEMMD077 250.2 metavolcanic brecciaEMMD085 344.1 metavolcanic brecciaEMMD086 48.4 metavolcanic brecciaEMMD086 125 metavolcanic breccia
EMM022 167.1 psammiteEMMD013 170.9 psammite
Ge In Re Be Li Pd Pt Ba-XRF Cu-XRF F-XRFppm ppm ppb ppm ppm ppb ppb wt% wt% wt%
Table B-2: Raw whole-rock data from ACME Labs
0.1 0.03 <1 0.4 22 <10 <2 N.A. N.A. 0.21<0.1 <0.02 1 0.3 10.7 17 <2 N.A. N.A. 0.1<0.1 <0.02 1 <0.1 3.1 <10 <2 N.A. N.A. 0.05<0.1 <0.02 <1 0.3 3.2 <10 2 N.A. N.A. 0.11
1 0.25 4 0.1 4.8 27 <2 0.15 0.34 0.771 0.83 15 0.5 2.3 12 <2 17.13 1.52 0.3
0.3 <0.02 <1 0.5 23.9 <10 <2 0.05 0.01 0.220.1 <0.02 2 1.1 15.8 <10 3 N.A. N.A. 0.210.6 0.2 49 1.7 17.9 20 <2 0.17 1.65 0.180.2 <0.02 8 0.5 19.2 16 <2 N.A. N.A. 0.23
<0.1 0.03 3 0.2 4.9 <10 5 N.A. N.A. 0.20.2 <0.02 <1 0.2 22.7 17 3 N.A. N.A. 0.110.2 0.04 2 0.2 9.9 <10 5 2.23 0.34 0.30.2 0.02 <1 0.6 12.8 20 <2 N.A. N.A. 0.120.5 1.61 35 0.6 8.2 44 <2 0.28 2.17 0.150.1 <0.02 <1 0.4 33.1 94 4 N.A. N.A. 0.60.3 <0.02 <1 0.7 13.8 <10 <2 0.11 0.02 0.320.1 0.04 20 1 15.3 13 <2 0.29 0.05 0.380.1 0.06 20 0.6 23.2 29 6 1.42 0.08 0.30.2 0.05 57 0.9 28.2 23 <2 1.88 0.38 0.490.3 0.04 <1 0.4 18.3 <10 <2 0.09 0.06 0.4
<0.1 <0.02 11 0.3 12.4 32 <2 0.75 0.01 0.40.2 0.08 35 0.7 12.6 35 <2 5.07 0.36 1.520.1 <0.02 15 0.3 13.6 58 2 1.14 0.01 0.370.5 0.21 64 1.3 12.9 66 <2 8.87 1.59 4.070.1 0.08 14 0.4 35.9 23 <2 1.05 0.31 0.680.2 0.08 37 0.3 30.3 80 <2 0.96 0.26 0.731.1 0.4 19 2.1 47.1 * <2 1.21 1.02 3.330.2 <0.02 <1 <0.1 6 <10 <2 0.04 <0.01 0.14
292
Appendix B: W
hole-Rock Geochem
ical Data
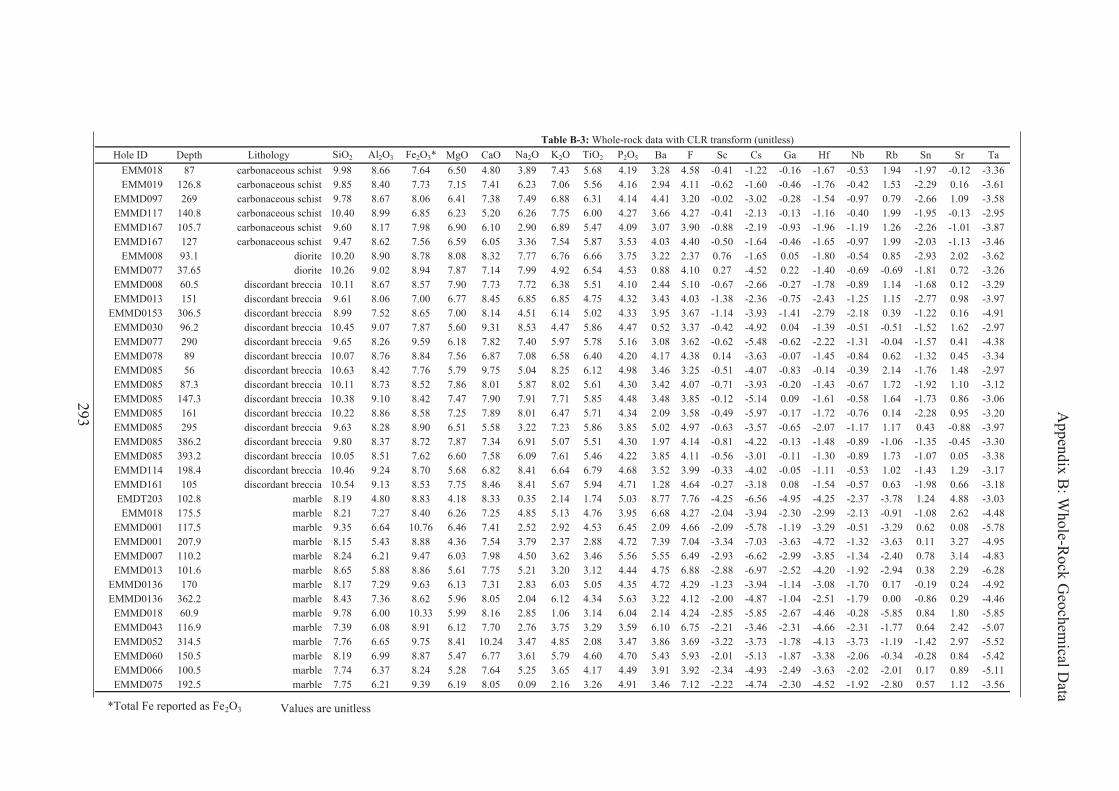
Hole ID Depth Lithology SiO2 Al2O3 Fe2O3* MgO CaO Na2O K2O TiO2 P2O5 Ba F Sc Cs Ga Hf Nb Rb Sn Sr TaEMM018 87 carbonaceous schist 9.98 8.66 7.64 6.50 4.80 3.89 7.43 5.68 4.19 3.28 4.58 -0.41 -1.22 -0.16 -1.67 -0.53 1.94 -1.97 -0.12 -3.36EMM019 126.8 carbonaceous schist 9.85 8.40 7.73 7.15 7.41 6.23 7.06 5.56 4.16 2.94 4.11 -0.62 -1.60 -0.46 -1.76 -0.42 1.53 -2.29 0.16 -3.61
EMMD097 269 carbonaceous schist 9.78 8.67 8.06 6.41 7.38 7.49 6.88 6.31 4.14 4.41 3.20 -0.02 -3.02 -0.28 -1.54 -0.97 0.79 -2.66 1.09 -3.58EMMD117 140.8 carbonaceous schist 10.40 8.99 6.85 6.23 5.20 6.26 7.75 6.00 4.27 3.66 4.27 -0.41 -2.13 -0.13 -1.16 -0.40 1.99 -1.95 -0.13 -2.95EMMD167 105.7 carbonaceous schist 9.60 8.17 7.98 6.90 6.10 2.90 6.89 5.47 4.09 3.07 3.90 -0.88 -2.19 -0.93 -1.96 -1.19 1.26 -2.26 -1.01 -3.87EMMD167 127 carbonaceous schist 9.47 8.62 7.56 6.59 6.05 3.36 7.54 5.87 3.53 4.03 4.40 -0.50 -1.64 -0.46 -1.65 -0.97 1.99 -2.03 -1.13 -3.46
EMM008 93.1 diorite 10.20 8.90 8.78 8.08 8.32 7.77 6.76 6.66 3.75 3.22 2.37 0.76 -1.65 0.05 -1.80 -0.54 0.85 -2.93 2.02 -3.62EMMD077 37.65 diorite 10.26 9.02 8.94 7.87 7.14 7.99 4.92 6.54 4.53 0.88 4.10 0.27 -4.52 0.22 -1.40 -0.69 -0.69 -1.81 0.72 -3.26EMMD008 60.5 discordant breccia 10.11 8.67 8.57 7.90 7.73 7.72 6.38 5.51 4.10 2.44 5.10 -0.67 -2.66 -0.27 -1.78 -0.89 1.14 -1.68 0.12 -3.29EMMD013 151 discordant breccia 9.61 8.06 7.00 6.77 8.45 6.85 6.85 4.75 4.32 3.43 4.03 -1.38 -2.36 -0.75 -2.43 -1.25 1.15 -2.77 0.98 -3.97
EMMD0153 306.5 discordant breccia 8.99 7.52 8.65 7.00 8.14 4.51 6.14 5.02 4.33 3.95 3.67 -1.14 -3.93 -1.41 -2.79 -2.18 0.39 -1.22 0.16 -4.91EMMD030 96.2 discordant breccia 10.45 9.07 7.87 5.60 9.31 8.53 4.47 5.86 4.47 0.52 3.37 -0.42 -4.92 0.04 -1.39 -0.51 -0.51 -1.52 1.62 -2.97EMMD077 290 discordant breccia 9.65 8.26 9.59 6.18 7.82 7.40 5.97 5.78 5.16 3.08 3.62 -0.62 -5.48 -0.62 -2.22 -1.31 -0.04 -1.57 0.41 -4.38EMMD078 89 discordant breccia 10.07 8.76 8.84 7.56 6.87 7.08 6.58 6.40 4.20 4.17 4.38 0.14 -3.63 -0.07 -1.45 -0.84 0.62 -1.32 0.45 -3.34EMMD085 56 discordant breccia 10.63 8.42 7.76 5.79 9.75 5.04 8.25 6.12 4.98 3.46 3.25 -0.51 -4.07 -0.83 -0.14 -0.39 2.14 -1.76 1.48 -2.97EMMD085 87.3 discordant breccia 10.11 8.73 8.52 7.86 8.01 5.87 8.02 5.61 4.30 3.42 4.07 -0.71 -3.93 -0.20 -1.43 -0.67 1.72 -1.92 1.10 -3.12EMMD085 147.3 discordant breccia 10.38 9.10 8.42 7.47 7.90 7.91 7.71 5.85 4.48 3.48 3.85 -0.12 -5.14 0.09 -1.61 -0.58 1.64 -1.73 0.86 -3.06EMMD085 161 discordant breccia 10.22 8.86 8.58 7.25 7.89 8.01 6.47 5.71 4.34 2.09 3.58 -0.49 -5.97 -0.17 -1.72 -0.76 0.14 -2.28 0.95 -3.20EMMD085 295 discordant breccia 9.63 8.28 8.90 6.51 5.58 3.22 7.23 5.86 3.85 5.02 4.97 -0.63 -3.57 -0.65 -2.07 -1.17 1.17 0.43 -0.88 -3.97EMMD085 386.2 discordant breccia 9.80 8.37 8.72 7.87 7.34 6.91 5.07 5.51 4.30 1.97 4.14 -0.81 -4.22 -0.13 -1.48 -0.89 -1.06 -1.35 -0.45 -3.30EMMD085 393.2 discordant breccia 10.05 8.51 7.62 6.60 7.58 6.09 7.61 5.46 4.22 3.85 4.11 -0.56 -3.01 -0.11 -1.30 -0.89 1.73 -1.07 0.05 -3.38EMMD114 198.4 discordant breccia 10.46 9.24 8.70 5.68 6.82 8.41 6.64 6.79 4.68 3.52 3.99 -0.33 -4.02 -0.05 -1.11 -0.53 1.02 -1.43 1.29 -3.17EMMD161 105 discordant breccia 10.54 9.13 8.53 7.75 8.46 8.41 5.67 5.94 4.71 1.28 4.64 -0.27 -3.18 0.08 -1.54 -0.57 0.63 -1.98 0.66 -3.18EMDT203 102.8 marble 8.19 4.80 8.83 4.18 8.33 0.35 2.14 1.74 5.03 8.77 7.76 -4.25 -6.56 -4.95 -4.25 -2.37 -3.78 1.24 4.88 -3.03EMM018 175.5 marble 8.21 7.27 8.40 6.26 7.25 4.85 5.13 4.76 3.95 6.68 4.27 -2.04 -3.94 -2.30 -2.99 -2.13 -0.91 -1.08 2.62 -4.48
EMMD001 117.5 marble 9.35 6.64 10.76 6.46 7.41 2.52 2.92 4.53 6.45 2.09 4.66 -2.09 -5.78 -1.19 -3.29 -0.51 -3.29 0.62 0.08 -5.78EMMD001 207.9 marble 8.15 5.43 8.88 4.36 7.54 3.79 2.37 2.88 4.72 7.39 7.04 -3.34 -7.03 -3.63 -4.72 -1.32 -3.63 0.11 3.27 -4.95EMMD007 110.2 marble 8.24 6.21 9.47 6.03 7.98 4.50 3.62 3.46 5.56 5.55 6.49 -2.93 -6.62 -2.99 -3.85 -1.34 -2.40 0.78 3.14 -4.83EMMD013 101.6 marble 8.65 5.88 8.86 5.61 7.75 5.21 3.20 3.12 4.44 4.75 6.88 -2.88 -6.97 -2.52 -4.20 -1.92 -2.94 0.38 2.29 -6.28
EMMD0136 170 marble 8.17 7.29 9.63 6.13 7.31 2.83 6.03 5.05 4.35 4.72 4.29 -1.23 -3.94 -1.14 -3.08 -1.70 0.17 -0.19 0.24 -4.92EMMD0136 362.2 marble 8.43 7.36 8.62 5.96 8.05 2.04 6.12 4.34 5.63 3.22 4.12 -2.00 -4.87 -1.04 -2.51 -1.79 0.00 -0.86 0.29 -4.46
EMMD018 60.9 marble 9.78 6.00 10.33 5.99 8.16 2.85 1.06 3.14 6.04 2.14 4.24 -2.85 -5.85 -2.67 -4.46 -0.28 -5.85 0.84 1.80 -5.85EMMD043 116.9 marble 7.39 6.08 8.91 6.12 7.70 2.76 3.75 3.29 3.59 6.10 6.75 -2.21 -3.46 -2.31 -4.66 -2.31 -1.77 0.64 2.42 -5.07EMMD052 314.5 marble 7.76 6.65 9.75 8.41 10.24 3.47 4.85 2.08 3.47 3.86 3.69 -3.22 -3.73 -1.78 -4.13 -3.73 -1.19 -1.42 2.97 -5.52EMMD060 150.5 marble 8.19 6.99 8.87 5.47 6.77 3.61 5.79 4.60 4.70 5.43 5.93 -2.01 -5.13 -1.87 -3.38 -2.06 -0.34 -0.28 0.84 -5.42EMMD066 100.5 marble 7.74 6.37 8.24 5.28 7.64 5.25 3.65 4.17 4.49 3.91 3.92 -2.34 -4.93 -2.49 -3.63 -2.02 -2.01 0.17 0.89 -5.11EMMD075 192.5 marble 7.75 6.21 9.39 6.19 8.05 0.09 2.16 3.26 4.91 3.46 7.12 -2.22 -4.74 -2.30 -4.52 -1.92 -2.80 0.57 1.12 -3.56
Table B-3: Whole-rock data with CLR transform (unitless)
*Total Fe reported as Fe2O3 Values are unitless
293 Appendix B: W
hole-Rock Geochem
ical Data
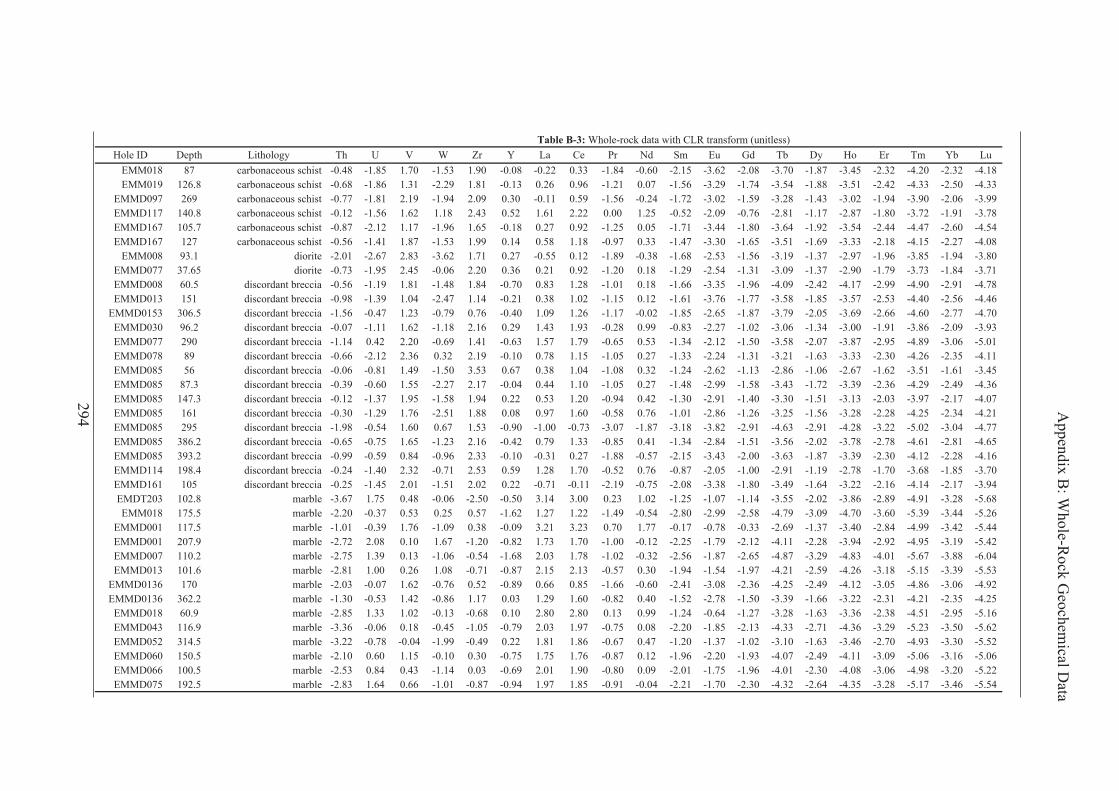
Hole ID Depth LithologyEMM018 87 carbonaceous schistEMM019 126.8 carbonaceous schist
EMMD097 269 carbonaceous schistEMMD117 140.8 carbonaceous schistEMMD167 105.7 carbonaceous schistEMMD167 127 carbonaceous schist
EMM008 93.1 dioriteEMMD077 37.65 dioriteEMMD008 60.5 discordant brecciaEMMD013 151 discordant breccia
EMMD0153 306.5 discordant brecciaEMMD030 96.2 discordant brecciaEMMD077 290 discordant brecciaEMMD078 89 discordant brecciaEMMD085 56 discordant brecciaEMMD085 87.3 discordant brecciaEMMD085 147.3 discordant brecciaEMMD085 161 discordant brecciaEMMD085 295 discordant brecciaEMMD085 386.2 discordant brecciaEMMD085 393.2 discordant brecciaEMMD114 198.4 discordant brecciaEMMD161 105 discordant brecciaEMDT203 102.8 marbleEMM018 175.5 marble
EMMD001 117.5 marbleEMMD001 207.9 marbleEMMD007 110.2 marbleEMMD013 101.6 marble
EMMD0136 170 marbleEMMD0136 362.2 marble
EMMD018 60.9 marbleEMMD043 116.9 marbleEMMD052 314.5 marbleEMMD060 150.5 marbleEMMD066 100.5 marbleEMMD075 192.5 marble
Th U V W Zr Y La Ce Pr Nd Sm Eu Gd Tb Dy Ho Er Tm Yb Lu-0.48 -1.85 1.70 -1.53 1.90 -0.08 -0.22 0.33 -1.84 -0.60 -2.15 -3.62 -2.08 -3.70 -1.87 -3.45 -2.32 -4.20 -2.32 -4.18-0.68 -1.86 1.31 -2.29 1.81 -0.13 0.26 0.96 -1.21 0.07 -1.56 -3.29 -1.74 -3.54 -1.88 -3.51 -2.42 -4.33 -2.50 -4.33-0.77 -1.81 2.19 -1.94 2.09 0.30 -0.11 0.59 -1.56 -0.24 -1.72 -3.02 -1.59 -3.28 -1.43 -3.02 -1.94 -3.90 -2.06 -3.99-0.12 -1.56 1.62 1.18 2.43 0.52 1.61 2.22 0.00 1.25 -0.52 -2.09 -0.76 -2.81 -1.17 -2.87 -1.80 -3.72 -1.91 -3.78-0.87 -2.12 1.17 -1.96 1.65 -0.18 0.27 0.92 -1.25 0.05 -1.71 -3.44 -1.80 -3.64 -1.92 -3.54 -2.44 -4.47 -2.60 -4.54-0.56 -1.41 1.87 -1.53 1.99 0.14 0.58 1.18 -0.97 0.33 -1.47 -3.30 -1.65 -3.51 -1.69 -3.33 -2.18 -4.15 -2.27 -4.08-2.01 -2.67 2.83 -3.62 1.71 0.27 -0.55 0.12 -1.89 -0.38 -1.68 -2.53 -1.56 -3.19 -1.37 -2.97 -1.96 -3.85 -1.94 -3.80-0.73 -1.95 2.45 -0.06 2.20 0.36 0.21 0.92 -1.20 0.18 -1.29 -2.54 -1.31 -3.09 -1.37 -2.90 -1.79 -3.73 -1.84 -3.71-0.56 -1.19 1.81 -1.48 1.84 -0.70 0.83 1.28 -1.01 0.18 -1.66 -3.35 -1.96 -4.09 -2.42 -4.17 -2.99 -4.90 -2.91 -4.78-0.98 -1.39 1.04 -2.47 1.14 -0.21 0.38 1.02 -1.15 0.12 -1.61 -3.76 -1.77 -3.58 -1.85 -3.57 -2.53 -4.40 -2.56 -4.46-1.56 -0.47 1.23 -0.79 0.76 -0.40 1.09 1.26 -1.17 -0.02 -1.85 -2.65 -1.87 -3.79 -2.05 -3.69 -2.66 -4.60 -2.77 -4.70-0.07 -1.11 1.62 -1.18 2.16 0.29 1.43 1.93 -0.28 0.99 -0.83 -2.27 -1.02 -3.06 -1.34 -3.00 -1.91 -3.86 -2.09 -3.93-1.14 0.42 2.20 -0.69 1.41 -0.63 1.57 1.79 -0.65 0.53 -1.34 -2.12 -1.50 -3.58 -2.07 -3.87 -2.95 -4.89 -3.06 -5.01-0.66 -2.12 2.36 0.32 2.19 -0.10 0.78 1.15 -1.05 0.27 -1.33 -2.24 -1.31 -3.21 -1.63 -3.33 -2.30 -4.26 -2.35 -4.11-0.06 -0.81 1.49 -1.50 3.53 0.67 0.38 1.04 -1.08 0.32 -1.24 -2.62 -1.13 -2.86 -1.06 -2.67 -1.62 -3.51 -1.61 -3.45-0.39 -0.60 1.55 -2.27 2.17 -0.04 0.44 1.10 -1.05 0.27 -1.48 -2.99 -1.58 -3.43 -1.72 -3.39 -2.36 -4.29 -2.49 -4.36-0.12 -1.37 1.95 -1.58 1.94 0.22 0.53 1.20 -0.94 0.42 -1.30 -2.91 -1.40 -3.30 -1.51 -3.13 -2.03 -3.97 -2.17 -4.07-0.30 -1.29 1.76 -2.51 1.88 0.08 0.97 1.60 -0.58 0.76 -1.01 -2.86 -1.26 -3.25 -1.56 -3.28 -2.28 -4.25 -2.34 -4.21-1.98 -0.54 1.60 0.67 1.53 -0.90 -1.00 -0.73 -3.07 -1.87 -3.18 -3.82 -2.91 -4.63 -2.91 -4.28 -3.22 -5.02 -3.04 -4.77-0.65 -0.75 1.65 -1.23 2.16 -0.42 0.79 1.33 -0.85 0.41 -1.34 -2.84 -1.51 -3.56 -2.02 -3.78 -2.78 -4.61 -2.81 -4.65-0.99 -0.59 0.84 -0.96 2.33 -0.10 -0.31 0.27 -1.88 -0.57 -2.15 -3.43 -2.00 -3.63 -1.87 -3.39 -2.30 -4.12 -2.28 -4.16-0.24 -1.40 2.32 -0.71 2.53 0.59 1.28 1.70 -0.52 0.76 -0.87 -2.05 -1.00 -2.91 -1.19 -2.78 -1.70 -3.68 -1.85 -3.70-0.25 -1.45 2.01 -1.51 2.02 0.22 -0.71 -0.11 -2.19 -0.75 -2.08 -3.38 -1.80 -3.49 -1.64 -3.22 -2.16 -4.14 -2.17 -3.94-3.67 1.75 0.48 -0.06 -2.50 -0.50 3.14 3.00 0.23 1.02 -1.25 -1.07 -1.14 -3.55 -2.02 -3.86 -2.89 -4.91 -3.28 -5.68-2.20 -0.37 0.53 0.25 0.57 -1.62 1.27 1.22 -1.49 -0.54 -2.80 -2.99 -2.58 -4.79 -3.09 -4.70 -3.60 -5.39 -3.44 -5.26-1.01 -0.39 1.76 -1.09 0.38 -0.09 3.21 3.23 0.70 1.77 -0.17 -0.78 -0.33 -2.69 -1.37 -3.40 -2.84 -4.99 -3.42 -5.44-2.72 2.08 0.10 1.67 -1.20 -0.82 1.73 1.70 -1.00 -0.12 -2.25 -1.79 -2.12 -4.11 -2.28 -3.94 -2.92 -4.95 -3.19 -5.42-2.75 1.39 0.13 -1.06 -0.54 -1.68 2.03 1.78 -1.02 -0.32 -2.56 -1.87 -2.65 -4.87 -3.29 -4.83 -4.01 -5.67 -3.88 -6.04-2.81 1.00 0.26 1.08 -0.71 -0.87 2.15 2.13 -0.57 0.30 -1.94 -1.54 -1.97 -4.21 -2.59 -4.26 -3.18 -5.15 -3.39 -5.53-2.03 -0.07 1.62 -0.76 0.52 -0.89 0.66 0.85 -1.66 -0.60 -2.41 -3.08 -2.36 -4.25 -2.49 -4.12 -3.05 -4.86 -3.06 -4.92-1.30 -0.53 1.42 -0.86 1.17 0.03 1.29 1.60 -0.82 0.40 -1.52 -2.78 -1.50 -3.39 -1.66 -3.22 -2.31 -4.21 -2.35 -4.25-2.85 1.33 1.02 -0.13 -0.68 0.10 2.80 2.80 0.13 0.99 -1.24 -0.64 -1.27 -3.28 -1.63 -3.36 -2.38 -4.51 -2.95 -5.16-3.36 -0.06 0.18 -0.45 -1.05 -0.79 2.03 1.97 -0.75 0.08 -2.20 -1.85 -2.13 -4.33 -2.71 -4.36 -3.29 -5.23 -3.50 -5.62-3.22 -0.78 -0.04 -1.99 -0.49 0.22 1.81 1.86 -0.67 0.47 -1.20 -1.37 -1.02 -3.10 -1.63 -3.46 -2.70 -4.93 -3.30 -5.52-2.10 0.60 1.15 -0.10 0.30 -0.75 1.75 1.76 -0.87 0.12 -1.96 -2.20 -1.93 -4.07 -2.49 -4.11 -3.09 -5.06 -3.16 -5.06-2.53 0.84 0.43 -1.14 0.03 -0.69 2.01 1.90 -0.80 0.09 -2.01 -1.75 -1.96 -4.01 -2.30 -4.08 -3.06 -4.98 -3.20 -5.22-2.83 1.64 0.66 -1.01 -0.87 -0.94 1.97 1.85 -0.91 -0.04 -2.21 -1.70 -2.30 -4.32 -2.64 -4.35 -3.28 -5.17 -3.46 -5.54
Table B-3: Whole-rock data with CLR transform (unitless)
294
Appendix B: W
hole-Rock Geochem
ical Data

Hole ID Depth LithologyEMM018 87 carbonaceous schistEMM019 126.8 carbonaceous schist
EMMD097 269 carbonaceous schistEMMD117 140.8 carbonaceous schistEMMD167 105.7 carbonaceous schistEMMD167 127 carbonaceous schist
EMM008 93.1 dioriteEMMD077 37.65 dioriteEMMD008 60.5 discordant brecciaEMMD013 151 discordant breccia
EMMD0153 306.5 discordant brecciaEMMD030 96.2 discordant brecciaEMMD077 290 discordant brecciaEMMD078 89 discordant brecciaEMMD085 56 discordant brecciaEMMD085 87.3 discordant brecciaEMMD085 147.3 discordant brecciaEMMD085 161 discordant brecciaEMMD085 295 discordant brecciaEMMD085 386.2 discordant brecciaEMMD085 393.2 discordant brecciaEMMD114 198.4 discordant brecciaEMMD161 105 discordant brecciaEMDT203 102.8 marbleEMM018 175.5 marble
EMMD001 117.5 marbleEMMD001 207.9 marbleEMMD007 110.2 marbleEMMD013 101.6 marble
EMMD0136 170 marbleEMMD0136 362.2 marble
EMMD018 60.9 marbleEMMD043 116.9 marbleEMMD052 314.5 marbleEMMD060 150.5 marbleEMMD066 100.5 marbleEMMD075 192.5 marble
Total C Total S Mo Cu Pb Zn Ag Ni Co Mn As Au Sb Bi Cr Tl Be Li6.08 6.25 -1.88 0.64 -0.13 2.45 -4.23 -0.12 -1.06 0.97 -0.08 -17.28 -2.62 -4.18 -1.95 -4.56 -4.27 -0.606.51 6.11 -3.11 0.57 -0.77 0.95 -5.48 -0.32 -1.11 3.75 -1.95 -17.11 -4.50 -4.36 -0.68 -4.02 -4.30 -0.866.33 2.35 -3.19 1.91 -2.34 -0.30 -5.43 -0.23 -0.80 4.19 -0.21 -16.29 -3.39 -6.57 0.01 -5.25 -4.27 -1.856.22 0.87 -2.47 -0.35 -2.24 -1.42 -5.76 -1.32 -2.09 2.08 -0.89 -19.16 -4.94 -6.26 -1.14 -6.04 -3.56 -1.855.43 6.89 -2.86 1.20 -0.88 2.08 -3.32 0.57 -0.88 3.24 0.52 -16.44 -2.30 -2.59 -0.80 -4.52 -4.34 -0.606.21 6.66 -1.17 2.57 -1.52 -1.69 -3.12 -0.03 -1.45 2.84 -0.55 -19.76 -3.68 -2.99 -2.30 -5.41 -4.00 -1.784.38 3.06 -3.57 1.02 -1.90 0.53 -5.52 0.40 -0.01 3.81 -2.19 -14.68 -4.36 -6.44 1.38 -7.54 -4.54 -0.735.57 4.26 -3.71 1.41 -3.09 -0.34 -6.52 0.29 0.25 3.43 -2.07 -16.95 -5.57 -6.13 0.36 -7.51 -3.42 -0.136.22 4.80 -2.74 0.67 -2.71 0.51 -5.75 0.41 0.27 3.21 -1.78 -16.48 -5.03 -4.41 0.71 -6.06 -3.98 0.156.92 5.27 -1.58 2.48 -2.21 -1.50 -4.90 0.05 -0.21 3.74 0.58 -14.49 -4.98 -3.91 0.11 -5.07 -3.82 -1.256.92 6.17 0.64 2.94 -2.09 -1.14 -5.04 -0.55 1.28 4.56 0.26 -14.48 -4.05 -3.13 -1.24 -4.79 -5.32 -1.087.73 4.29 -4.23 2.30 -2.16 -3.53 -6.19 -0.20 -0.26 4.37 -2.03 -16.03 -5.84 -5.28 0.45 -7.22 -4.92 -2.626.46 5.28 0.18 3.30 -2.65 -1.82 -5.45 -0.22 0.08 4.10 -1.32 -14.45 -4.69 -3.76 -0.75 -7.79 -5.48 -2.125.02 3.10 -3.89 1.88 -2.93 0.36 -6.85 0.73 -0.44 3.47 -1.78 -19.23 -4.22 -7.03 0.73 -7.72 -3.63 -0.078.21 1.45 -4.07 -0.57 -2.79 -1.72 -6.73 -0.26 -1.58 5.20 -1.39 -18.58 -5.68 -5.68 -0.14 -7.06 -5.45 -1.766.48 3.79 -4.16 0.01 -2.70 -0.38 -6.56 0.36 -0.21 3.91 -0.24 -17.34 -6.01 -6.01 0.41 -7.62 -2.92 0.816.38 2.47 -4.39 -1.22 -3.53 -0.62 -6.41 0.74 -0.64 3.82 -1.84 -16.55 -5.24 -6.75 0.60 -7.44 -2.74 -0.016.33 4.46 -1.43 -1.14 -3.32 -0.82 -6.89 0.50 0.21 3.65 -0.86 -14.36 -5.10 -5.79 1.01 -7.58 -3.67 -0.764.36 7.46 0.08 2.17 -1.27 -1.16 -3.11 0.16 2.44 2.12 1.27 -12.63 -2.77 -1.74 -0.90 -5.36 -4.15 -0.625.76 6.23 -2.17 -0.85 -2.72 0.00 -5.35 0.50 0.73 3.55 -0.26 -14.67 -5.71 -3.22 0.23 -7.90 -3.30 0.316.07 4.59 0.13 0.52 -2.49 -1.06 -5.76 -0.80 0.10 3.29 -1.06 -15.18 -4.74 -3.91 -0.87 -6.08 -3.78 -0.814.93 1.10 -3.06 -0.22 -2.35 -1.35 -7.16 -0.80 -1.62 2.79 -2.81 -16.22 -4.42 -6.72 0.00 -7.42 -3.32 -2.556.92 1.24 -2.75 0.50 -2.29 -0.30 -5.42 0.47 -0.52 3.79 -1.88 -14.84 -5.48 -5.89 1.03 -5.67 -3.87 -0.024.57 7.73 1.97 6.21 0.28 -2.23 -1.74 -0.81 1.61 2.11 1.59 -11.36 -1.88 -0.20 -3.38 -7.07 -5.17 -2.536.29 6.93 -0.15 2.57 -0.89 -0.73 -2.56 -1.12 1.47 4.89 1.42 -12.99 -2.96 -0.40 -1.14 -3.86 -4.12 -1.445.16 3.21 0.72 2.08 -1.55 0.39 -3.53 -1.08 -1.30 2.97 0.41 -13.60 -1.36 -3.36 -2.09 -7.39 -4.39 -0.922.97 7.27 2.00 6.19 0.92 -0.16 -0.61 -0.96 2.13 1.51 2.04 -10.43 -0.85 0.13 -3.44 -6.84 -4.95 -2.706.61 7.17 0.88 5.42 0.58 -0.14 -2.49 -1.43 1.79 5.27 2.23 -11.98 -1.89 -1.12 -3.22 -5.05 -3.53 -3.455.93 6.57 0.83 5.31 0.47 1.39 -2.11 -1.46 1.38 4.52 1.80 -12.00 -2.26 -0.34 -2.84 -6.18 -4.33 -4.205.99 6.80 0.05 4.51 -1.44 -1.22 -4.14 -0.13 1.95 4.15 1.18 -12.63 -3.18 -2.40 -1.61 -5.23 -4.23 -1.456.41 7.13 -1.01 3.41 -2.30 -1.55 -4.60 0.34 1.91 4.18 1.70 -12.87 -4.58 -3.06 -3.16 -6.76 -5.15 -1.887.19 1.75 -0.71 3.53 0.46 1.15 -3.28 -1.37 1.11 4.87 0.93 -11.64 -1.67 -1.91 -1.76 -7.46 -3.21 -1.606.08 6.62 0.30 4.78 -0.76 0.78 -1.62 -1.37 1.42 5.11 -0.20 -12.60 -2.51 -1.17 -2.14 -4.08 -4.15 -0.798.97 6.68 -1.10 4.01 -0.16 0.96 -4.25 0.13 0.70 6.91 -0.06 -13.85 -3.07 -2.67 -3.03 -6.44 -3.73 -1.393.89 7.29 0.70 4.62 -0.81 -1.51 -3.92 -0.72 2.06 2.02 1.71 -12.50 -2.92 -1.72 -2.08 -6.04 -4.32 -1.186.08 6.49 0.98 5.40 -0.13 -0.73 -2.45 -0.61 1.96 3.79 1.37 -11.87 -2.88 -1.31 -2.09 -5.22 -4.64 -0.845.59 7.08 1.73 6.15 0.03 -0.68 -2.37 -0.67 2.18 4.37 1.84 -10.98 -2.58 -0.99 -2.83 -5.87 -3.83 -0.92
Table B-3: Whole-rock data with CLR transform (unitless)
295
Appendix B: W
hole-Rock Geochem
ical Data

Hole ID Depth Lithology SiO2 Al2O3 Fe2O3* MgO CaO Na2O K2O TiO2 P2O5 Ba F Sc Cs Ga Hf Nb Rb Sn Sr TaTable B-3: Whole-rock data with CLR transform (unitless)
EMMD075 205.3 marble 6.59 5.41 8.66 5.35 7.78 3.47 3.83 3.04 4.61 7.28 6.92 -3.17 -4.27 -3.21 -4.38 -1.77 -2.28 0.63 2.74 -3.87EMMD077 174 marble 6.97 6.01 9.47 5.65 6.28 2.59 4.01 3.60 5.12 4.06 4.71 -3.00 -6.40 -2.18 -4.20 -1.59 -1.91 0.51 -0.28 -5.30EMMD077 225.4 marble 7.26 6.23 9.21 5.32 7.63 3.89 4.33 3.50 4.28 7.47 6.67 -1.86 -6.93 -2.04 -4.16 -2.37 -1.20 0.74 3.23 -5.14EMMD085 231.7 marble 10.31 8.80 7.71 7.25 8.92 7.26 7.95 5.69 4.28 3.56 3.59 -0.32 -4.42 -0.21 -1.53 -0.60 1.78 -2.12 1.15 -3.32EMMD085 310.5 marble 7.37 6.23 9.05 5.16 7.28 1.21 4.99 3.77 4.78 7.35 6.58 -2.70 -6.39 -2.44 -3.91 -1.69 -0.96 0.24 3.18 -4.78EMMD097 226.15 marble 7.87 7.37 8.38 6.29 7.05 3.35 5.85 4.95 3.76 6.27 5.11 -1.57 -2.55 -1.67 -2.98 -2.17 0.47 -0.23 1.61 -4.70EMMD136 361.85 marble 9.80 8.30 8.27 6.30 7.57 3.60 7.24 4.78 4.20 4.22 4.60 -1.01 -3.63 -0.34 -1.58 -0.92 1.09 -0.23 -0.40 -3.92EMMD182 239.75 marble 8.25 6.86 8.64 7.17 8.00 2.48 5.73 4.52 5.18 3.74 4.16 -2.31 -3.58 -1.81 -3.38 -2.17 0.07 -1.02 0.15 -5.12
EMM017 154.3 metaandesite 10.20 8.92 8.60 7.42 6.65 7.64 6.68 6.64 4.46 4.96 3.76 0.22 -2.45 -0.04 -1.32 -0.75 0.90 -2.35 0.93 -3.14EMM018 133 metaandesite 9.79 8.75 9.03 7.67 7.32 4.31 6.72 6.47 4.19 5.09 3.81 0.03 -2.50 -0.15 -1.45 -0.45 0.84 -2.50 0.47 -3.41EMM019 338 metaandesite 10.38 9.10 8.77 6.92 8.29 7.95 7.00 6.82 4.53 5.08 3.91 0.52 -2.78 0.19 -1.19 0.00 0.92 -1.17 1.35 -3.00EMM022 74.6 metaandesite 10.66 9.22 8.70 6.65 6.62 8.12 7.16 6.97 4.86 4.28 4.55 0.30 -2.29 0.27 -0.95 -0.38 1.59 -1.59 0.67 -2.91
EMMD002 120.5 metaandesite 9.29 8.12 8.73 6.84 6.15 3.38 6.85 6.26 4.23 4.78 4.86 -0.53 -2.38 -0.66 -1.66 -1.02 1.44 -0.94 -0.42 -3.53EMMD008 126 metaandesite 9.66 8.39 8.20 7.09 6.67 7.41 6.39 6.06 3.79 2.89 4.55 -0.34 -2.24 -0.58 -1.70 -0.33 0.94 -1.57 0.49 -3.63EMMD018 101 metaandesite 9.84 8.60 8.38 7.22 6.96 7.68 6.77 6.25 4.12 3.02 4.75 -0.10 -2.22 -0.37 -1.60 -0.24 1.48 -1.94 0.68 -3.55EMMD041 154.75 metaandesite 10.14 8.90 9.33 7.59 6.12 8.05 6.13 6.27 3.74 1.48 3.96 -0.11 -2.69 -0.06 -1.70 -1.56 0.72 -1.85 -0.14 -3.86EMMD042 171.2 metaandesite 9.99 8.70 8.59 7.09 7.38 7.77 6.50 6.40 4.09 3.47 4.16 0.06 -1.55 -0.26 -1.61 -0.71 1.33 -2.46 1.09 -3.67EMMD043 169.9 metaandesite 10.13 9.12 8.33 6.67 8.23 7.81 7.34 6.51 4.29 4.79 4.22 0.14 -2.61 0.07 -1.59 -0.54 1.71 -1.85 0.78 -3.46EMMD064 150 metaandesite 10.00 8.87 8.23 7.21 7.14 7.85 6.69 6.38 3.72 3.25 3.90 -0.25 -1.97 -0.09 -1.47 -0.90 1.30 -2.50 1.16 -3.42EMMD066 40 metaandesite 9.88 8.92 8.75 7.05 5.01 7.54 6.81 6.48 4.37 6.09 4.90 -0.28 -2.76 -0.20 -1.45 -0.79 0.92 -0.74 0.45 -3.33EMMD066 123.6 metaandesite 9.83 8.50 8.40 6.53 6.99 7.46 6.36 6.59 4.45 4.18 4.00 -0.12 -3.04 -0.26 -1.32 -0.71 0.47 -1.99 1.34 -3.19EMMD066 176 metaandesite 10.08 8.87 8.51 6.65 7.93 6.99 7.44 6.53 4.20 5.45 4.33 0.25 -2.78 0.00 -1.42 -0.85 1.68 -1.66 0.38 -3.40EMMD067 187 metaandesite 9.97 8.85 8.55 6.81 7.08 7.60 6.94 6.74 4.69 4.48 4.21 0.01 -3.08 0.00 -1.07 -0.55 1.35 -0.97 0.11 -3.08EMMD074 195 metaandesite 10.76 9.25 7.30 5.90 8.03 5.86 9.03 5.31 3.96 4.91 3.11 -1.90 -3.80 -0.51 -0.49 -0.18 2.39 -1.90 1.26 -2.95EMMD075 116.2 metaandesite 9.28 8.27 8.73 6.22 4.95 3.49 6.60 6.40 4.32 4.84 4.29 -0.31 -3.28 -0.54 -1.57 -0.97 0.68 -2.07 -0.24 -3.50EMMD077 81.7 metaandesite 9.27 8.25 8.75 6.70 6.83 5.42 7.17 5.94 3.72 5.21 5.06 -0.33 -2.92 -0.62 -2.03 -1.45 1.35 -0.66 -0.21 -3.88EMMD077 162.4 metaandesite 9.88 8.95 10.11 7.34 5.72 7.67 6.98 6.80 4.66 5.10 4.99 0.30 -3.53 0.08 -1.26 -0.69 0.89 -0.75 0.42 -3.34EMMD085 366.8 metaandesite 9.34 7.77 8.35 5.93 6.86 2.62 6.65 4.84 5.21 4.52 4.42 -1.83 -4.98 -1.27 -2.49 -1.27 0.39 -0.31 -0.45 -4.13EMMD086 167.9 metaandesite 8.64 8.19 8.84 6.82 6.10 3.72 7.00 6.29 4.23 6.59 5.53 -0.62 -2.08 -0.49 -1.61 -1.03 1.35 0.44 0.48 -3.47EMMD097 74.14 metaandesite 9.77 8.08 9.41 7.07 7.29 3.32 1.38 5.25 4.51 1.57 3.57 -1.03 -4.84 -1.12 -2.40 -1.75 -4.43 0.07 0.84 -4.43EMMD097 174.1 metaandesite 10.12 8.86 8.10 6.85 7.21 7.86 6.24 6.58 4.68 3.73 3.41 0.16 -3.24 -0.03 -1.32 -0.68 0.47 -1.75 0.94 -3.24EMMD114 71 metaandesite 10.18 9.00 7.67 6.14 7.28 8.14 6.28 6.55 4.50 3.66 4.34 -0.54 -3.79 -0.28 -1.31 -0.70 0.61 -1.71 1.23 -3.10EMMD118 143.8 metaandesite 10.25 8.99 8.87 7.55 6.74 7.41 6.23 6.51 3.84 4.69 3.84 0.17 -3.32 0.29 -1.56 -0.96 0.43 -1.87 0.01 -3.66EMMD119 174.9 metaandesite 10.35 8.64 8.47 7.82 8.40 3.81 8.01 5.52 4.13 3.68 4.13 -0.67 -4.08 -0.07 -1.44 -0.73 1.59 -1.77 0.94 -2.98EMMD126 104 metaandesite 10.13 8.95 8.71 7.51 7.80 7.78 5.81 6.59 4.33 2.43 3.82 0.10 -3.09 -0.04 -1.28 -0.70 0.09 -2.29 1.53 -3.21EMMD129 155 metaandesite 10.18 8.93 8.10 6.79 7.36 7.86 6.49 6.52 4.99 3.48 3.83 -0.19 -2.90 -0.36 -1.40 -0.81 0.84 -1.98 1.04 -3.31EMMD136 71.9 metaandesite 9.88 8.74 7.74 6.37 7.42 7.66 6.60 6.28 4.68 3.65 4.05 -0.44 -2.86 -0.27 -1.59 -0.98 0.95 -2.23 1.23 -3.55
296
Appendix B: W
hole-Rock Geochem
ical Data

Hole ID Depth LithologyEMMD075 205.3 marbleEMMD077 174 marbleEMMD077 225.4 marbleEMMD085 231.7 marbleEMMD085 310.5 marbleEMMD097 226.15 marbleEMMD136 361.85 marbleEMMD182 239.75 marble
EMM017 154.3 metaandesiteEMM018 133 metaandesiteEMM019 338 metaandesiteEMM022 74.6 metaandesite
EMMD002 120.5 metaandesiteEMMD008 126 metaandesiteEMMD018 101 metaandesiteEMMD041 154.75 metaandesiteEMMD042 171.2 metaandesiteEMMD043 169.9 metaandesiteEMMD064 150 metaandesiteEMMD066 40 metaandesiteEMMD066 123.6 metaandesiteEMMD066 176 metaandesiteEMMD067 187 metaandesiteEMMD074 195 metaandesiteEMMD075 116.2 metaandesiteEMMD077 81.7 metaandesiteEMMD077 162.4 metaandesiteEMMD085 366.8 metaandesiteEMMD086 167.9 metaandesiteEMMD097 74.14 metaandesiteEMMD097 174.1 metaandesiteEMMD114 71 metaandesiteEMMD118 143.8 metaandesiteEMMD119 174.9 metaandesiteEMMD126 104 metaandesiteEMMD129 155 metaandesiteEMMD136 71.9 metaandesite
Th U V W Zr Y La Ce Pr Nd Sm Eu Gd Tb Dy Ho Er Tm Yb LuTable B-3: Whole-rock data with CLR transform (unitless)
-2.99 1.23 0.25 1.36 -1.25 -1.03 2.54 2.42 -0.37 0.46 -1.93 -1.32 -1.87 -4.21 -2.55 -4.20 -3.18 -5.05 -3.27 -5.38-2.43 1.73 1.10 -0.82 -0.58 -0.39 2.67 2.73 0.25 1.33 -0.68 -1.30 -0.75 -3.10 -1.70 -3.64 -2.85 -4.92 -3.18 -5.37-2.81 0.26 1.09 1.82 -0.80 -0.91 1.49 1.41 -1.23 -0.33 -2.36 -2.14 -2.27 -4.31 -2.59 -4.09 -3.01 -5.14 -3.17 -5.11-0.24 -1.20 1.71 -1.93 2.06 0.48 0.34 1.00 -1.18 0.12 -1.44 -3.03 -1.39 -3.12 -1.31 -2.93 -1.85 -3.68 -1.88 -3.83-2.40 1.42 1.20 -0.33 -0.39 -0.79 1.62 1.60 -1.09 -0.18 -2.19 -1.99 -2.19 -4.12 -2.38 -3.91 -3.01 -4.93 -3.15 -5.20-2.00 -0.53 0.95 0.24 0.59 -1.22 1.64 1.55 -1.10 -0.18 -2.33 -2.32 -2.32 -4.53 -2.83 -4.40 -3.30 -5.19 -3.25 -5.17-1.30 -0.14 0.38 0.02 2.18 -0.42 0.32 0.65 -1.68 -0.53 -2.17 -3.27 -2.14 -3.99 -2.24 -3.82 -2.64 -4.43 -2.38 -4.00-1.43 -0.67 1.19 -1.17 0.36 -0.22 1.24 1.46 -0.96 0.21 -1.73 -2.88 -1.72 -3.61 -1.91 -3.45 -2.46 -4.39 -2.57 -4.49-0.47 -1.79 2.58 -2.12 2.34 0.44 0.31 0.96 -1.13 0.20 -1.37 -2.85 -1.27 -3.07 -1.29 -2.91 -1.80 -3.75 -1.93 -3.84-0.63 -1.71 2.32 -0.05 2.15 0.08 0.44 1.00 -1.16 0.20 -1.41 -2.92 -1.58 -3.37 -1.58 -3.06 -1.96 -3.82 -1.96 -3.84-0.52 -1.13 2.55 -1.21 2.38 0.27 -1.04 -0.54 -2.69 -1.34 -2.57 -4.05 -2.16 -3.62 -1.59 -3.02 -1.86 -3.67 -1.78 -3.70-0.16 -1.31 2.55 -1.56 2.64 0.61 -1.90 -1.21 -3.20 -1.59 -2.62 -3.90 -1.94 -3.24 -1.20 -2.63 -1.53 -3.45 -1.62 -3.54-1.04 -0.93 1.91 -0.33 1.94 -0.15 -0.14 0.13 -2.23 -0.97 -2.55 -3.56 -2.36 -3.96 -2.03 -3.38 -2.20 -4.03 -2.17 -4.13-0.98 -2.42 1.89 -1.13 1.85 0.06 1.60 1.87 -0.53 0.65 -0.96 -1.84 -0.91 -2.67 -1.09 -3.09 -2.36 -4.39 -2.53 -4.28-0.86 -2.13 2.17 -1.41 2.01 0.20 0.76 1.24 -0.96 0.31 -1.19 -2.47 -1.26 -3.11 -1.44 -3.10 -2.02 -3.92 -2.01 -3.94-0.99 -1.95 2.16 -2.61 1.86 -0.25 0.56 1.06 -1.18 0.12 -1.60 -3.43 -1.69 -3.68 -2.00 -3.62 -2.58 -4.51 -2.56 -4.38-0.83 -2.03 2.32 -2.32 2.00 0.10 0.15 0.76 -1.42 -0.05 -1.58 -3.00 -1.63 -3.41 -1.66 -3.24 -2.17 -4.10 -2.20 -4.15-1.02 -1.34 2.39 -0.93 1.99 0.22 -1.02 -0.33 -2.43 -0.95 -2.16 -3.28 -1.88 -3.35 -1.48 -3.00 -1.92 -3.84 -1.98 -3.87-0.57 -1.88 2.00 -2.09 2.14 0.10 0.34 0.90 -1.23 0.07 -1.53 -2.83 -1.53 -3.33 -1.53 -3.13 -2.14 -4.06 -2.18 -4.04-0.52 0.22 1.98 0.04 2.17 -0.12 -0.23 0.09 -2.29 -1.10 -2.53 -3.54 -2.34 -3.94 -1.96 -3.45 -2.29 -4.15 -2.24 -4.07-0.50 -1.65 2.25 -1.60 2.30 0.30 0.44 1.10 -1.02 0.31 -1.25 -2.78 -1.31 -3.07 -1.34 -2.92 -1.87 -3.75 -1.87 -3.79-0.72 -1.88 2.41 -1.03 2.14 0.12 0.45 1.00 -1.20 0.13 -1.49 -2.85 -1.51 -3.39 -1.62 -3.22 -2.08 -3.94 -2.04 -3.87-0.31 -1.08 2.41 -1.00 2.49 0.22 0.55 1.04 -1.17 0.11 -1.47 -2.71 -1.47 -3.33 -1.55 -3.12 -1.91 -3.77 -1.88 -3.730.25 -0.42 -1.21 -0.60 3.27 0.32 -0.31 0.26 -1.95 -0.54 -2.03 -3.48 -1.86 -3.46 -1.56 -2.98 -1.82 -3.61 -1.63 -3.46-0.81 -1.04 2.08 -0.05 2.06 0.13 0.17 0.70 -1.47 -0.12 -1.66 -2.84 -1.58 -3.37 -1.59 -3.17 -2.08 -3.98 -2.12 -4.02-1.22 -1.15 1.89 -1.42 1.54 -0.46 1.46 1.73 -0.62 0.57 -1.18 -2.18 -1.33 -3.45 -1.96 -3.82 -2.73 -4.58 -2.63 -4.48-0.54 -0.81 3.02 0.65 2.37 -0.25 -1.13 -0.98 -3.26 -1.92 -3.20 -3.51 -2.59 -4.14 -2.12 -3.55 -2.27 -4.18 -2.12 -3.94-1.15 0.37 0.68 -0.03 1.13 -0.34 0.72 1.03 -1.38 -0.19 -2.00 -3.29 -2.00 -3.86 -2.08 -3.68 -2.56 -4.45 -2.54 -4.39-0.92 -0.91 1.99 0.07 1.98 -0.61 1.13 1.09 -1.55 -0.57 -2.50 -3.01 -2.32 -4.25 -2.42 -3.83 -2.53 -4.25 -2.32 -4.11-1.47 -0.16 1.40 0.60 1.15 -0.79 0.98 1.16 -1.51 -0.51 -2.43 -2.77 -2.44 -4.34 -2.58 -4.10 -2.97 -4.89 -3.02 -4.79-0.51 -1.66 2.44 -1.43 2.29 0.23 0.37 1.00 -1.12 0.24 -1.32 -2.81 -1.34 -3.23 -1.50 -3.09 -1.98 -3.85 -1.98 -3.85-0.43 -1.67 2.00 -0.97 2.30 0.07 1.60 2.08 -0.22 0.99 -0.74 -1.81 -0.97 -3.00 -1.48 -3.23 -2.16 -4.04 -2.09 -3.97-0.67 -1.40 2.61 -0.48 2.11 -0.07 -0.20 0.27 -1.98 -0.68 -2.21 -3.48 -2.05 -3.72 -1.83 -3.34 -2.17 -4.04 -2.24 -4.02-0.54 -1.59 1.52 -1.92 2.18 -0.01 0.64 1.31 -0.89 0.38 -1.35 -2.92 -1.50 -3.37 -1.70 -3.38 -2.41 -4.22 -2.45 -4.34-0.48 -1.71 2.39 -1.89 2.37 0.47 0.43 1.06 -1.09 0.28 -1.26 -2.64 -1.25 -3.04 -1.29 -2.87 -1.86 -3.70 -1.85 -3.72-0.48 -1.75 2.02 -2.39 2.24 0.20 0.71 1.28 -0.97 0.32 -1.35 -2.56 -1.39 -3.31 -1.51 -3.09 -1.99 -3.86 -1.93 -3.78-0.70 -1.76 1.86 -1.66 2.04 0.04 1.27 1.68 -0.61 0.60 -1.06 -2.08 -1.18 -3.17 -1.56 -3.25 -2.24 -4.15 -2.22 -4.02
297
Appendix B: W
hole-Rock Geochem
ical Data

Hole ID Depth LithologyEMMD075 205.3 marbleEMMD077 174 marbleEMMD077 225.4 marbleEMMD085 231.7 marbleEMMD085 310.5 marbleEMMD097 226.15 marbleEMMD136 361.85 marbleEMMD182 239.75 marble
EMM017 154.3 metaandesiteEMM018 133 metaandesiteEMM019 338 metaandesiteEMM022 74.6 metaandesite
EMMD002 120.5 metaandesiteEMMD008 126 metaandesiteEMMD018 101 metaandesiteEMMD041 154.75 metaandesiteEMMD042 171.2 metaandesiteEMMD043 169.9 metaandesiteEMMD064 150 metaandesiteEMMD066 40 metaandesiteEMMD066 123.6 metaandesiteEMMD066 176 metaandesiteEMMD067 187 metaandesiteEMMD074 195 metaandesiteEMMD075 116.2 metaandesiteEMMD077 81.7 metaandesiteEMMD077 162.4 metaandesiteEMMD085 366.8 metaandesiteEMMD086 167.9 metaandesiteEMMD097 74.14 metaandesiteEMMD097 174.1 metaandesiteEMMD114 71 metaandesiteEMMD118 143.8 metaandesiteEMMD119 174.9 metaandesiteEMMD126 104 metaandesiteEMMD129 155 metaandesiteEMMD136 71.9 metaandesite
Total C Total S Mo Cu Pb Zn Ag Ni Co Mn As Au Sb Bi Cr Tl Be LiTable B-3: Whole-rock data with CLR transform (unitless)
5.51 6.70 1.31 5.64 -0.28 -1.86 -2.13 -1.46 1.21 4.80 1.03 -12.12 -2.79 -0.54 -3.28 -7.27 -4.63 -2.863.73 6.88 2.09 5.68 0.28 -1.89 -2.70 -0.30 2.00 1.59 1.33 -12.81 -2.31 -1.52 -2.87 -5.33 -4.45 -1.655.19 6.83 0.67 5.10 -0.50 -0.55 -1.75 -1.27 1.07 3.20 0.64 -12.33 -1.99 -1.26 -3.02 -6.35 -3.94 -1.627.41 2.49 -5.47 -0.73 -3.29 -1.00 -6.58 0.90 0.45 4.56 -2.40 -15.43 -6.03 -7.41 1.00 -7.41 -3.50 0.024.01 7.06 1.54 6.08 -0.73 -1.89 -2.66 -0.92 1.75 1.87 2.17 -11.51 -2.78 -2.09 -2.61 -5.70 -3.91 -1.565.93 5.17 1.11 3.00 -1.76 0.10 -3.50 -1.06 0.07 4.31 -0.46 -14.29 -2.96 -2.41 -0.36 -4.26 -4.70 -0.686.05 7.13 -2.61 0.05 -1.23 -1.50 -4.50 -0.83 1.84 3.24 1.02 -13.13 -3.19 -2.24 -3.31 -6.22 -5.71 -1.186.98 6.88 -0.25 4.18 -1.70 -0.88 -4.53 -0.12 1.69 4.57 0.71 -12.88 -3.29 -2.48 -2.27 -5.26 -6.22 -1.465.12 0.87 -3.79 0.25 -2.40 1.16 -6.86 0.45 -0.35 2.65 -3.26 -19.16 -4.03 -7.64 0.32 -4.43 -3.96 -0.135.84 2.11 -3.46 0.55 -2.43 1.57 -6.57 0.17 -0.97 3.95 -2.36 -17.70 -4.06 -7.79 0.08 -6.41 -3.88 0.176.83 1.13 -5.31 -0.80 -1.48 0.70 -6.35 0.49 -0.71 4.57 -2.68 -18.90 -3.15 -6.69 0.53 -5.59 -4.39 -0.494.86 2.61 -2.18 -0.12 -1.56 -0.26 -5.79 0.06 -1.21 2.56 -2.10 -16.41 -4.41 -7.30 0.49 -6.60 -3.61 -0.764.36 4.53 0.40 3.69 -2.96 0.28 -4.92 -0.26 0.11 2.91 -0.79 -14.07 -4.92 -4.76 -1.35 -4.73 -4.40 -0.725.07 2.69 -3.42 0.90 -2.48 1.02 -6.40 0.43 -0.94 2.65 -2.36 -18.25 -4.76 -7.43 0.48 -4.00 -2.99 -1.135.44 2.38 -2.21 -0.90 -2.77 -0.55 -6.57 0.57 -0.73 2.91 -2.22 -16.67 -5.44 -7.93 0.68 -3.83 -3.83 -0.964.70 6.09 -2.93 2.82 -2.60 -0.25 -6.05 0.70 1.22 2.82 0.06 -15.89 -4.72 -3.92 -2.25 -5.16 -3.30 -0.576.33 0.75 -2.97 0.25 -2.27 0.62 -6.38 0.53 -0.67 4.28 -2.69 -16.57 -4.67 -6.38 0.39 -3.87 -4.07 -0.526.79 3.04 -2.18 -0.92 -2.72 -0.76 -6.72 -0.53 -0.88 4.63 -1.73 -17.28 -4.56 -5.76 -0.12 -5.76 -3.64 -0.795.56 2.11 -4.71 1.84 -1.67 0.63 -6.49 0.16 -0.09 3.55 -2.13 -16.31 -4.71 -6.70 -0.45 -4.46 -3.89 -0.793.86 2.47 -2.22 1.87 -2.26 0.49 -6.08 0.25 -0.50 2.97 -1.72 -16.17 -4.05 -6.22 -0.51 -5.44 -4.15 0.075.51 1.92 -2.50 1.21 -2.13 0.13 -6.64 -0.08 -1.49 3.12 -2.01 -16.93 -3.27 -7.98 -0.78 -4.94 -4.29 -1.306.80 3.35 -3.42 3.16 -2.82 -1.54 -5.68 -0.43 -2.40 4.72 -6.04 -15.80 -4.65 -7.65 -0.49 -5.86 -3.56 -2.306.05 2.53 -1.97 0.99 -2.55 -1.07 -7.51 0.16 -1.31 3.97 -3.53 -16.72 -5.29 -7.78 -0.44 -6.68 -4.38 -1.436.56 5.38 -2.02 0.24 -1.95 -0.53 -5.76 -2.06 0.17 4.02 -1.31 -15.67 -5.12 -4.56 -2.12 -7.20 -4.90 -1.725.84 3.23 -1.73 1.94 -2.73 -0.41 -5.87 -0.20 0.63 4.61 -0.76 -15.55 -3.40 -5.20 -1.14 -5.65 -3.79 -0.625.38 4.66 -1.38 -0.15 -3.26 -0.50 -6.63 0.01 -0.32 3.51 -0.65 -16.56 -4.12 -5.62 -0.58 -4.60 -4.02 -0.722.46 2.87 0.03 0.25 -2.09 -0.67 -5.32 0.98 -1.29 2.73 -1.70 -15.69 -3.68 -4.67 0.44 -5.83 -4.44 -0.255.35 7.70 -1.43 3.09 -1.12 -1.22 -3.81 -0.26 1.87 2.85 1.22 -12.90 -3.86 -1.85 -2.78 -6.59 -4.69 -1.774.23 3.37 -0.17 3.09 -3.04 -0.46 -5.03 -1.03 -2.31 2.56 -2.47 -15.02 -3.42 -5.59 -1.59 -4.37 -3.98 0.176.32 2.99 -1.31 4.60 2.12 3.67 -3.68 -0.53 0.98 3.42 1.55 -12.60 -2.94 -2.19 -0.91 -6.73 -3.23 -0.195.62 2.56 -4.06 1.70 -2.63 0.14 -7.00 -0.06 -0.35 2.97 -1.51 -16.26 -4.53 -7.05 0.34 -7.05 -4.06 -0.645.62 2.20 -3.40 0.51 -1.97 -0.98 -6.96 -0.29 -0.98 3.12 -2.84 -16.00 -4.76 -6.32 -0.36 -7.01 -4.30 -1.695.17 3.72 -2.90 0.07 -2.97 0.53 -5.43 0.94 -0.06 3.58 -1.26 -13.68 -5.78 -5.78 0.41 -7.57 -3.66 -0.186.84 4.95 -4.11 -0.88 -3.32 -0.75 -6.60 0.41 -0.18 4.18 -0.01 -16.35 -5.68 -5.87 0.62 -7.48 -3.23 0.256.42 0.93 -2.33 -1.73 -2.95 0.73 -7.25 0.90 -0.32 4.46 -2.65 -19.10 -4.60 -7.59 0.97 -5.51 -3.90 0.235.76 3.31 -3.90 3.26 -2.68 -0.69 -5.91 0.12 -0.67 3.57 -3.31 -15.67 -5.61 -6.30 -0.46 -6.99 -4.69 -1.005.79 2.37 -2.00 2.20 -1.05 -0.14 -6.74 -0.20 -0.91 3.33 -2.41 -16.88 -5.16 -6.32 -0.87 -5.74 -4.94 -1.49
298 Appendix B: W
hole-Rock Geochem
ical Data
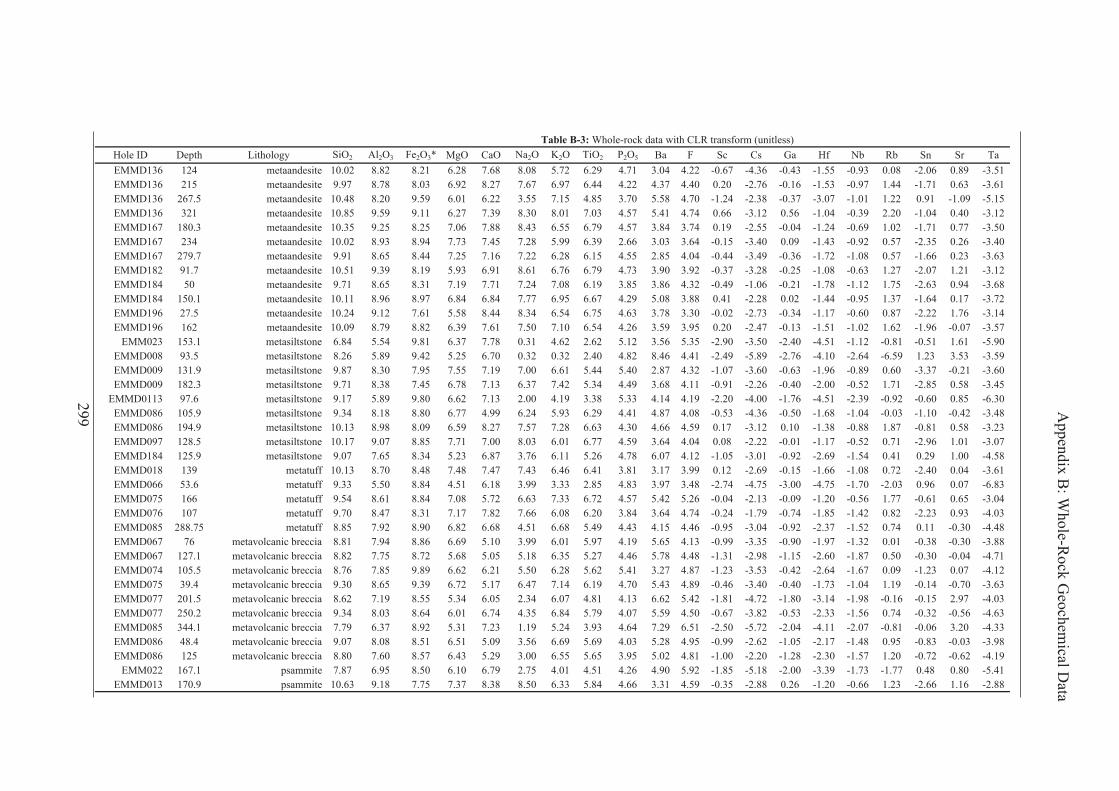
Hole ID Depth Lithology SiO2 Al2O3 Fe2O3* MgO CaO Na2O K2O TiO2 P2O5 Ba F Sc Cs Ga Hf Nb Rb Sn Sr TaTable B-3: Whole-rock data with CLR transform (unitless)
EMMD136 124 metaandesite 10.02 8.82 8.21 6.28 7.68 8.08 5.72 6.29 4.71 3.04 4.22 -0.67 -4.36 -0.43 -1.55 -0.93 0.08 -2.06 0.89 -3.51EMMD136 215 metaandesite 9.97 8.78 8.03 6.92 8.27 7.67 6.97 6.44 4.22 4.37 4.40 0.20 -2.76 -0.16 -1.53 -0.97 1.44 -1.71 0.63 -3.61EMMD136 267.5 metaandesite 10.48 8.20 9.59 6.01 6.22 3.55 7.15 4.85 3.70 5.58 4.70 -1.24 -2.38 -0.37 -3.07 -1.01 1.22 0.91 -1.09 -5.15EMMD136 321 metaandesite 10.85 9.59 9.11 6.27 7.39 8.30 8.01 7.03 4.57 5.41 4.74 0.66 -3.12 0.56 -1.04 -0.39 2.20 -1.04 0.40 -3.12EMMD167 180.3 metaandesite 10.35 9.25 8.25 7.06 7.88 8.43 6.55 6.79 4.57 3.84 3.74 0.19 -2.55 -0.04 -1.24 -0.69 1.02 -1.71 0.77 -3.50EMMD167 234 metaandesite 10.02 8.93 8.94 7.73 7.45 7.28 5.99 6.39 2.66 3.03 3.64 -0.15 -3.40 0.09 -1.43 -0.92 0.57 -2.35 0.26 -3.40EMMD167 279.7 metaandesite 9.91 8.65 8.44 7.25 7.16 7.22 6.28 6.15 4.55 2.85 4.04 -0.44 -3.49 -0.36 -1.72 -1.08 0.57 -1.66 0.23 -3.63EMMD182 91.7 metaandesite 10.51 9.39 8.19 5.93 6.91 8.61 6.76 6.79 4.73 3.90 3.92 -0.37 -3.28 -0.25 -1.08 -0.63 1.27 -2.07 1.21 -3.12EMMD184 50 metaandesite 9.71 8.65 8.31 7.19 7.71 7.24 7.08 6.19 3.85 3.86 4.32 -0.49 -1.06 -0.21 -1.78 -1.12 1.75 -2.63 0.94 -3.68EMMD184 150.1 metaandesite 10.11 8.96 8.97 6.84 6.84 7.77 6.95 6.67 4.29 5.08 3.88 0.41 -2.28 0.02 -1.44 -0.95 1.37 -1.64 0.17 -3.72EMMD196 27.5 metaandesite 10.24 9.12 7.61 5.58 8.44 8.34 6.54 6.75 4.63 3.78 3.30 -0.02 -2.73 -0.34 -1.17 -0.60 0.87 -2.22 1.76 -3.14EMMD196 162 metaandesite 10.09 8.79 8.82 6.39 7.61 7.50 7.10 6.54 4.26 3.59 3.95 0.20 -2.47 -0.13 -1.51 -1.02 1.62 -1.96 -0.07 -3.57
EMM023 153.1 metasiltstone 6.84 5.54 9.81 6.37 7.78 0.31 4.62 2.62 5.12 3.56 5.35 -2.90 -3.50 -2.40 -4.51 -1.12 -0.81 -0.51 1.61 -5.90EMMD008 93.5 metasiltstone 8.26 5.89 9.42 5.25 6.70 0.32 0.32 2.40 4.82 8.46 4.41 -2.49 -5.89 -2.76 -4.10 -2.64 -6.59 1.23 3.53 -3.59EMMD009 131.9 metasiltstone 9.87 8.30 7.95 7.55 7.19 7.00 6.61 5.44 5.40 2.87 4.32 -1.07 -3.60 -0.63 -1.96 -0.89 0.60 -3.37 -0.21 -3.60EMMD009 182.3 metasiltstone 9.71 8.38 7.45 6.78 7.13 6.37 7.42 5.34 4.49 3.68 4.11 -0.91 -2.26 -0.40 -2.00 -0.52 1.71 -2.85 0.58 -3.45
EMMD0113 97.6 metasiltstone 9.17 5.89 9.80 6.62 7.13 2.00 4.19 3.38 5.33 4.14 4.19 -2.20 -4.00 -1.76 -4.51 -2.39 -0.92 -0.60 0.85 -6.30EMMD086 105.9 metasiltstone 9.34 8.18 8.80 6.77 4.99 6.24 5.93 6.29 4.41 4.87 4.08 -0.53 -4.36 -0.50 -1.68 -1.04 -0.03 -1.10 -0.42 -3.48EMMD086 194.9 metasiltstone 10.13 8.98 8.09 6.59 8.27 7.57 7.28 6.63 4.30 4.66 4.59 0.17 -3.12 0.10 -1.38 -0.88 1.87 -0.81 0.58 -3.23EMMD097 128.5 metasiltstone 10.17 9.07 8.85 7.71 7.00 8.03 6.01 6.77 4.59 3.64 4.04 0.08 -2.22 -0.01 -1.17 -0.52 0.71 -2.96 1.01 -3.07EMMD184 125.9 metasiltstone 9.07 7.65 8.34 5.23 6.87 3.76 6.11 5.26 4.78 6.07 4.12 -1.05 -3.01 -0.92 -2.69 -1.54 0.41 0.29 1.00 -4.58EMMD018 139 metatuff 10.13 8.70 8.48 7.48 7.47 7.43 6.46 6.41 3.81 3.17 3.99 0.12 -2.69 -0.15 -1.66 -1.08 0.72 -2.40 0.04 -3.61EMMD066 53.6 metatuff 9.33 5.50 8.84 4.51 6.18 3.99 3.33 2.85 4.83 3.97 3.48 -2.74 -4.75 -3.00 -4.75 -1.70 -2.03 0.96 0.07 -6.83EMMD075 166 metatuff 9.54 8.61 8.84 7.08 5.72 6.63 7.33 6.72 4.57 5.42 5.26 -0.04 -2.13 -0.09 -1.20 -0.56 1.77 -0.61 0.65 -3.04EMMD076 107 metatuff 9.70 8.47 8.31 7.17 7.82 7.66 6.08 6.20 3.84 3.64 4.74 -0.24 -1.79 -0.74 -1.85 -1.42 0.82 -2.23 0.93 -4.03EMMD085 288.75 metatuff 8.85 7.92 8.90 6.82 6.68 4.51 6.68 5.49 4.43 4.15 4.46 -0.95 -3.04 -0.92 -2.37 -1.52 0.74 0.11 -0.30 -4.48EMMD067 76 metavolcanic breccia 8.81 7.94 8.86 6.69 5.10 3.99 6.01 5.97 4.19 5.65 4.13 -0.99 -3.35 -0.90 -1.97 -1.32 0.01 -0.38 -0.30 -3.88EMMD067 127.1 metavolcanic breccia 8.82 7.75 8.72 5.68 5.05 5.18 6.35 5.27 4.46 5.78 4.48 -1.31 -2.98 -1.15 -2.60 -1.87 0.50 -0.30 -0.04 -4.71EMMD074 105.5 metavolcanic breccia 8.76 7.85 9.89 6.62 6.21 5.50 6.28 5.62 5.41 3.27 4.87 -1.23 -3.53 -0.42 -2.64 -1.67 0.09 -1.23 0.07 -4.12EMMD075 39.4 metavolcanic breccia 9.30 8.65 9.39 6.72 5.17 6.47 7.14 6.19 4.70 5.43 4.89 -0.46 -3.40 -0.40 -1.73 -1.04 1.19 -0.14 -0.70 -3.63EMMD077 201.5 metavolcanic breccia 8.62 7.19 8.55 5.34 6.05 2.34 6.07 4.81 4.13 6.62 5.42 -1.81 -4.72 -1.80 -3.14 -1.98 -0.16 -0.15 2.97 -4.03EMMD077 250.2 metavolcanic breccia 9.34 8.03 8.64 6.01 6.74 4.35 6.84 5.79 4.07 5.59 4.50 -0.67 -3.82 -0.53 -2.33 -1.56 0.74 -0.32 -0.56 -4.63EMMD085 344.1 metavolcanic breccia 7.79 6.37 8.92 5.31 7.23 1.19 5.24 3.93 4.64 7.29 6.51 -2.50 -5.72 -2.04 -4.11 -2.07 -0.81 -0.06 3.20 -4.33EMMD086 48.4 metavolcanic breccia 9.07 8.08 8.51 6.51 5.09 3.56 6.69 5.69 4.03 5.28 4.95 -0.99 -2.62 -1.05 -2.17 -1.48 0.95 -0.83 -0.03 -3.98EMMD086 125 metavolcanic breccia 8.80 7.60 8.57 6.43 5.29 3.00 6.55 5.65 3.95 5.02 4.81 -1.00 -2.20 -1.28 -2.30 -1.57 1.20 -0.72 -0.62 -4.19
EMM022 167.1 psammite 7.87 6.95 8.50 6.10 6.79 2.75 4.01 4.51 4.26 4.90 5.92 -1.85 -5.18 -2.00 -3.39 -1.73 -1.77 0.48 0.80 -5.41EMMD013 170.9 psammite 10.63 9.18 7.75 7.37 8.38 8.50 6.33 5.84 4.66 3.31 4.59 -0.35 -2.88 0.26 -1.20 -0.66 1.23 -2.66 1.16 -2.88
299 Appendix B: W
hole-Rock Geochem
ical Data
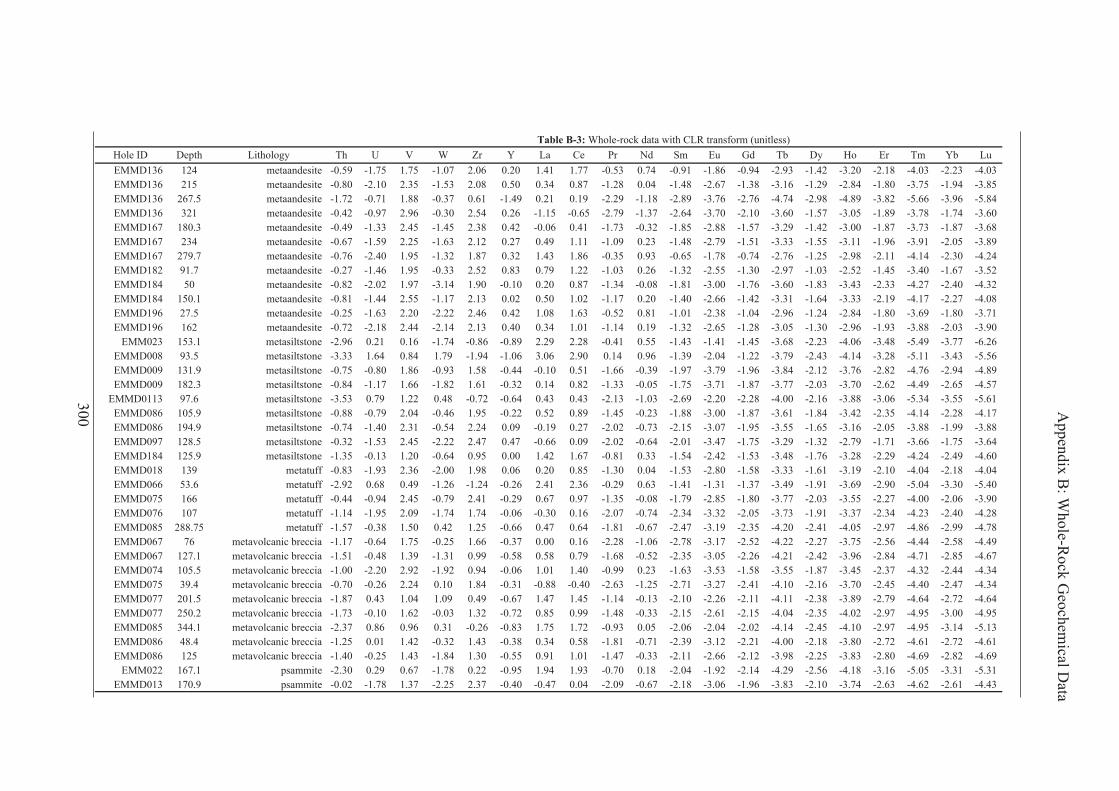
Hole ID Depth LithologyEMMD136 124 metaandesiteEMMD136 215 metaandesiteEMMD136 267.5 metaandesiteEMMD136 321 metaandesiteEMMD167 180.3 metaandesiteEMMD167 234 metaandesiteEMMD167 279.7 metaandesiteEMMD182 91.7 metaandesiteEMMD184 50 metaandesiteEMMD184 150.1 metaandesiteEMMD196 27.5 metaandesiteEMMD196 162 metaandesite
EMM023 153.1 metasiltstoneEMMD008 93.5 metasiltstoneEMMD009 131.9 metasiltstoneEMMD009 182.3 metasiltstone
EMMD0113 97.6 metasiltstoneEMMD086 105.9 metasiltstoneEMMD086 194.9 metasiltstoneEMMD097 128.5 metasiltstoneEMMD184 125.9 metasiltstoneEMMD018 139 metatuffEMMD066 53.6 metatuffEMMD075 166 metatuffEMMD076 107 metatuffEMMD085 288.75 metatuffEMMD067 76 metavolcanic brecciaEMMD067 127.1 metavolcanic brecciaEMMD074 105.5 metavolcanic brecciaEMMD075 39.4 metavolcanic brecciaEMMD077 201.5 metavolcanic brecciaEMMD077 250.2 metavolcanic brecciaEMMD085 344.1 metavolcanic brecciaEMMD086 48.4 metavolcanic brecciaEMMD086 125 metavolcanic breccia
EMM022 167.1 psammiteEMMD013 170.9 psammite
Th U V W Zr Y La Ce Pr Nd Sm Eu Gd Tb Dy Ho Er Tm Yb LuTable B-3: Whole-rock data with CLR transform (unitless)
-0.59 -1.75 1.75 -1.07 2.06 0.20 1.41 1.77 -0.53 0.74 -0.91 -1.86 -0.94 -2.93 -1.42 -3.20 -2.18 -4.03 -2.23 -4.03-0.80 -2.10 2.35 -1.53 2.08 0.50 0.34 0.87 -1.28 0.04 -1.48 -2.67 -1.38 -3.16 -1.29 -2.84 -1.80 -3.75 -1.94 -3.85-1.72 -0.71 1.88 -0.37 0.61 -1.49 0.21 0.19 -2.29 -1.18 -2.89 -3.76 -2.76 -4.74 -2.98 -4.89 -3.82 -5.66 -3.96 -5.84-0.42 -0.97 2.96 -0.30 2.54 0.26 -1.15 -0.65 -2.79 -1.37 -2.64 -3.70 -2.10 -3.60 -1.57 -3.05 -1.89 -3.78 -1.74 -3.60-0.49 -1.33 2.45 -1.45 2.38 0.42 -0.06 0.41 -1.73 -0.32 -1.85 -2.88 -1.57 -3.29 -1.42 -3.00 -1.87 -3.73 -1.87 -3.68-0.67 -1.59 2.25 -1.63 2.12 0.27 0.49 1.11 -1.09 0.23 -1.48 -2.79 -1.51 -3.33 -1.55 -3.11 -1.96 -3.91 -2.05 -3.89-0.76 -2.40 1.95 -1.32 1.87 0.32 1.43 1.86 -0.35 0.93 -0.65 -1.78 -0.74 -2.76 -1.25 -2.98 -2.11 -4.14 -2.30 -4.24-0.27 -1.46 1.95 -0.33 2.52 0.83 0.79 1.22 -1.03 0.26 -1.32 -2.55 -1.30 -2.97 -1.03 -2.52 -1.45 -3.40 -1.67 -3.52-0.82 -2.02 1.97 -3.14 1.90 -0.10 0.20 0.87 -1.34 -0.08 -1.81 -3.00 -1.76 -3.60 -1.83 -3.43 -2.33 -4.27 -2.40 -4.32-0.81 -1.44 2.55 -1.17 2.13 0.02 0.50 1.02 -1.17 0.20 -1.40 -2.66 -1.42 -3.31 -1.64 -3.33 -2.19 -4.17 -2.27 -4.08-0.25 -1.63 2.20 -2.22 2.46 0.42 1.08 1.63 -0.52 0.81 -1.01 -2.38 -1.04 -2.96 -1.24 -2.84 -1.80 -3.69 -1.80 -3.71-0.72 -2.18 2.44 -2.14 2.13 0.40 0.34 1.01 -1.14 0.19 -1.32 -2.65 -1.28 -3.05 -1.30 -2.96 -1.93 -3.88 -2.03 -3.90-2.96 0.21 0.16 -1.74 -0.86 -0.89 2.29 2.28 -0.41 0.55 -1.43 -1.41 -1.45 -3.68 -2.23 -4.06 -3.48 -5.49 -3.77 -6.26-3.33 1.64 0.84 1.79 -1.94 -1.06 3.06 2.90 0.14 0.96 -1.39 -2.04 -1.22 -3.79 -2.43 -4.14 -3.28 -5.11 -3.43 -5.56-0.75 -0.80 1.86 -0.93 1.58 -0.44 -0.10 0.51 -1.66 -0.39 -1.97 -3.79 -1.96 -3.84 -2.12 -3.76 -2.82 -4.76 -2.94 -4.89-0.84 -1.17 1.66 -1.82 1.61 -0.32 0.14 0.82 -1.33 -0.05 -1.75 -3.71 -1.87 -3.77 -2.03 -3.70 -2.62 -4.49 -2.65 -4.57-3.53 0.79 1.22 0.48 -0.72 -0.64 0.43 0.43 -2.13 -1.03 -2.69 -2.20 -2.28 -4.00 -2.16 -3.88 -3.06 -5.34 -3.55 -5.61-0.88 -0.79 2.04 -0.46 1.95 -0.22 0.52 0.89 -1.45 -0.23 -1.88 -3.00 -1.87 -3.61 -1.84 -3.42 -2.35 -4.14 -2.28 -4.17-0.74 -1.40 2.31 -0.54 2.24 0.09 -0.19 0.27 -2.02 -0.73 -2.15 -3.07 -1.95 -3.55 -1.65 -3.16 -2.05 -3.88 -1.99 -3.88-0.32 -1.53 2.45 -2.22 2.47 0.47 -0.66 0.09 -2.02 -0.64 -2.01 -3.47 -1.75 -3.29 -1.32 -2.79 -1.71 -3.66 -1.75 -3.64-1.35 -0.13 1.20 -0.64 0.95 0.00 1.42 1.67 -0.81 0.33 -1.54 -2.42 -1.53 -3.48 -1.76 -3.28 -2.29 -4.24 -2.49 -4.60-0.83 -1.93 2.36 -2.00 1.98 0.06 0.20 0.85 -1.30 0.04 -1.53 -2.80 -1.58 -3.33 -1.61 -3.19 -2.10 -4.04 -2.18 -4.04-2.92 0.68 0.49 -1.26 -1.24 -0.26 2.41 2.36 -0.29 0.63 -1.41 -1.31 -1.37 -3.49 -1.91 -3.69 -2.90 -5.04 -3.30 -5.40-0.44 -0.94 2.45 -0.79 2.41 -0.29 0.67 0.97 -1.35 -0.08 -1.79 -2.85 -1.80 -3.77 -2.03 -3.55 -2.27 -4.00 -2.06 -3.90-1.14 -1.95 2.09 -1.74 1.74 -0.06 -0.30 0.16 -2.07 -0.74 -2.34 -3.32 -2.05 -3.73 -1.91 -3.37 -2.34 -4.23 -2.40 -4.28-1.57 -0.38 1.50 0.42 1.25 -0.66 0.47 0.64 -1.81 -0.67 -2.47 -3.19 -2.35 -4.20 -2.41 -4.05 -2.97 -4.86 -2.99 -4.78-1.17 -0.64 1.75 -0.25 1.66 -0.37 0.00 0.16 -2.28 -1.06 -2.78 -3.17 -2.52 -4.22 -2.27 -3.75 -2.56 -4.44 -2.58 -4.49-1.51 -0.48 1.39 -1.31 0.99 -0.58 0.58 0.79 -1.68 -0.52 -2.35 -3.05 -2.26 -4.21 -2.42 -3.96 -2.84 -4.71 -2.85 -4.67-1.00 -2.20 2.92 -1.92 0.94 -0.06 1.01 1.40 -0.99 0.23 -1.63 -3.53 -1.58 -3.55 -1.87 -3.45 -2.37 -4.32 -2.44 -4.34-0.70 -0.26 2.24 0.10 1.84 -0.31 -0.88 -0.40 -2.63 -1.25 -2.71 -3.27 -2.41 -4.10 -2.16 -3.70 -2.45 -4.40 -2.47 -4.34-1.87 0.43 1.04 1.09 0.49 -0.67 1.47 1.45 -1.14 -0.13 -2.10 -2.26 -2.11 -4.11 -2.38 -3.89 -2.79 -4.64 -2.72 -4.64-1.73 -0.10 1.62 -0.03 1.32 -0.72 0.85 0.99 -1.48 -0.33 -2.15 -2.61 -2.15 -4.04 -2.35 -4.02 -2.97 -4.95 -3.00 -4.95-2.37 0.86 0.96 0.31 -0.26 -0.83 1.75 1.72 -0.93 0.05 -2.06 -2.04 -2.02 -4.14 -2.45 -4.10 -2.97 -4.95 -3.14 -5.13-1.25 0.01 1.42 -0.32 1.43 -0.38 0.34 0.58 -1.81 -0.71 -2.39 -3.12 -2.21 -4.00 -2.18 -3.80 -2.72 -4.61 -2.72 -4.61-1.40 -0.25 1.43 -1.84 1.30 -0.55 0.91 1.01 -1.47 -0.33 -2.11 -2.66 -2.12 -3.98 -2.25 -3.83 -2.80 -4.69 -2.82 -4.69-2.30 0.29 0.67 -1.78 0.22 -0.95 1.94 1.93 -0.70 0.18 -2.04 -1.92 -2.14 -4.29 -2.56 -4.18 -3.16 -5.05 -3.31 -5.31-0.02 -1.78 1.37 -2.25 2.37 -0.40 -0.47 0.04 -2.09 -0.67 -2.18 -3.06 -1.96 -3.83 -2.10 -3.74 -2.63 -4.62 -2.61 -4.43
300 Appendix B: W
hole-Rock Geochem
ical Data
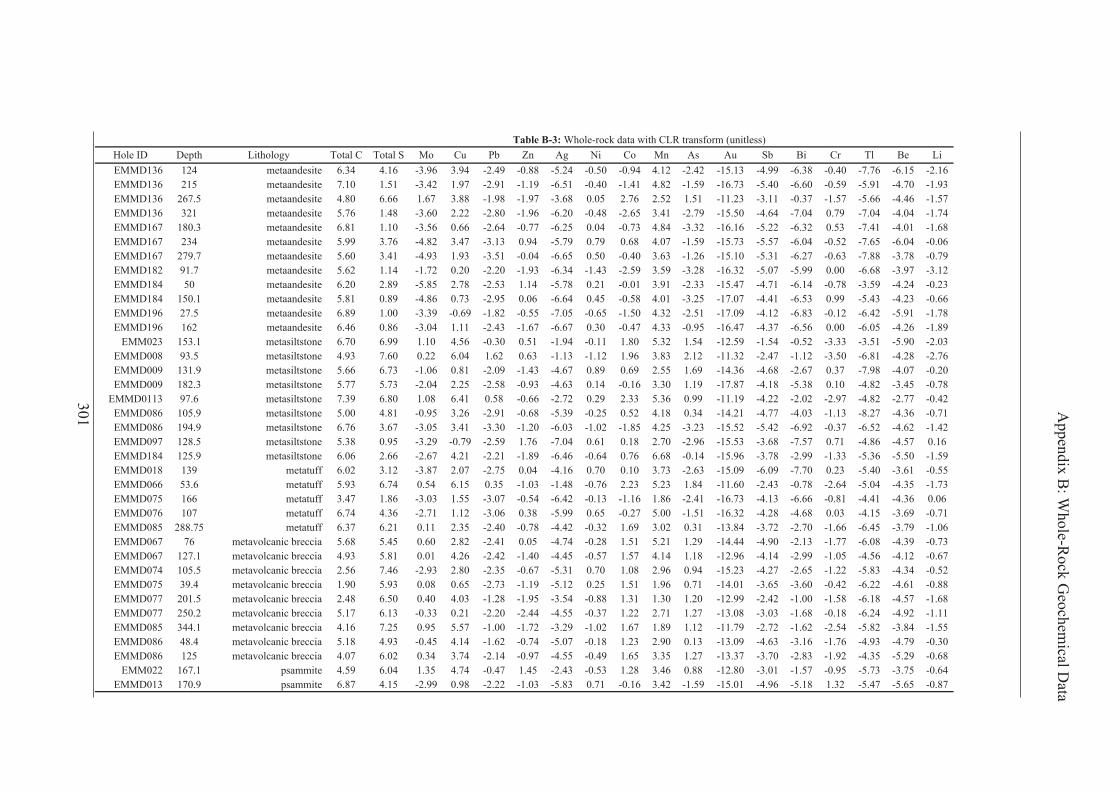
Hole ID Depth LithologyEMMD136 124 metaandesiteEMMD136 215 metaandesiteEMMD136 267.5 metaandesiteEMMD136 321 metaandesiteEMMD167 180.3 metaandesiteEMMD167 234 metaandesiteEMMD167 279.7 metaandesiteEMMD182 91.7 metaandesiteEMMD184 50 metaandesiteEMMD184 150.1 metaandesiteEMMD196 27.5 metaandesiteEMMD196 162 metaandesite
EMM023 153.1 metasiltstoneEMMD008 93.5 metasiltstoneEMMD009 131.9 metasiltstoneEMMD009 182.3 metasiltstone
EMMD0113 97.6 metasiltstoneEMMD086 105.9 metasiltstoneEMMD086 194.9 metasiltstoneEMMD097 128.5 metasiltstoneEMMD184 125.9 metasiltstoneEMMD018 139 metatuffEMMD066 53.6 metatuffEMMD075 166 metatuffEMMD076 107 metatuffEMMD085 288.75 metatuffEMMD067 76 metavolcanic brecciaEMMD067 127.1 metavolcanic brecciaEMMD074 105.5 metavolcanic brecciaEMMD075 39.4 metavolcanic brecciaEMMD077 201.5 metavolcanic brecciaEMMD077 250.2 metavolcanic brecciaEMMD085 344.1 metavolcanic brecciaEMMD086 48.4 metavolcanic brecciaEMMD086 125 metavolcanic breccia
EMM022 167.1 psammiteEMMD013 170.9 psammite
Total C Total S Mo Cu Pb Zn Ag Ni Co Mn As Au Sb Bi Cr Tl Be LiTable B-3: Whole-rock data with CLR transform (unitless)
6.34 4.16 -3.96 3.94 -2.49 -0.88 -5.24 -0.50 -0.94 4.12 -2.42 -15.13 -4.99 -6.38 -0.40 -7.76 -6.15 -2.167.10 1.51 -3.42 1.97 -2.91 -1.19 -6.51 -0.40 -1.41 4.82 -1.59 -16.73 -5.40 -6.60 -0.59 -5.91 -4.70 -1.934.80 6.66 1.67 3.88 -1.98 -1.97 -3.68 0.05 2.76 2.52 1.51 -11.23 -3.11 -0.37 -1.57 -5.66 -4.46 -1.575.76 1.48 -3.60 2.22 -2.80 -1.96 -6.20 -0.48 -2.65 3.41 -2.79 -15.50 -4.64 -7.04 0.79 -7.04 -4.04 -1.746.81 1.10 -3.56 0.66 -2.64 -0.77 -6.25 0.04 -0.73 4.84 -3.32 -16.16 -5.22 -6.32 0.53 -7.41 -4.01 -1.685.99 3.76 -4.82 3.47 -3.13 0.94 -5.79 0.79 0.68 4.07 -1.59 -15.73 -5.57 -6.04 -0.52 -7.65 -6.04 -0.065.60 3.41 -4.93 1.93 -3.51 -0.04 -6.65 0.50 -0.40 3.63 -1.26 -15.10 -5.31 -6.27 -0.63 -7.88 -3.78 -0.795.62 1.14 -1.72 0.20 -2.20 -1.93 -6.34 -1.43 -2.59 3.59 -3.28 -16.32 -5.07 -5.99 0.00 -6.68 -3.97 -3.126.20 2.89 -5.85 2.78 -2.53 1.14 -5.78 0.21 -0.01 3.91 -2.33 -15.47 -4.71 -6.14 -0.78 -3.59 -4.24 -0.235.81 0.89 -4.86 0.73 -2.95 0.06 -6.64 0.45 -0.58 4.01 -3.25 -17.07 -4.41 -6.53 0.99 -5.43 -4.23 -0.666.89 1.00 -3.39 -0.69 -1.82 -0.55 -7.05 -0.65 -1.50 4.32 -2.51 -17.09 -4.12 -6.83 -0.12 -6.42 -5.91 -1.786.46 0.86 -3.04 1.11 -2.43 -1.67 -6.67 0.30 -0.47 4.33 -0.95 -16.47 -4.37 -6.56 0.00 -6.05 -4.26 -1.896.70 6.99 1.10 4.56 -0.30 0.51 -1.94 -0.11 1.80 5.32 1.54 -12.59 -1.54 -0.52 -3.33 -3.51 -5.90 -2.034.93 7.60 0.22 6.04 1.62 0.63 -1.13 -1.12 1.96 3.83 2.12 -11.32 -2.47 -1.12 -3.50 -6.81 -4.28 -2.765.66 6.73 -1.06 0.81 -2.09 -1.43 -4.67 0.89 0.69 2.55 1.69 -14.36 -4.68 -2.67 0.37 -7.98 -4.07 -0.205.77 5.73 -2.04 2.25 -2.58 -0.93 -4.63 0.14 -0.16 3.30 1.19 -17.87 -4.18 -5.38 0.10 -4.82 -3.45 -0.787.39 6.80 1.08 6.41 0.58 -0.66 -2.72 0.29 2.33 5.36 0.99 -11.19 -4.22 -2.02 -2.97 -4.82 -2.77 -0.425.00 4.81 -0.95 3.26 -2.91 -0.68 -5.39 -0.25 0.52 4.18 0.34 -14.21 -4.77 -4.03 -1.13 -8.27 -4.36 -0.716.76 3.67 -3.05 3.41 -3.30 -1.20 -6.03 -1.02 -1.85 4.25 -3.23 -15.52 -5.42 -6.92 -0.37 -6.52 -4.62 -1.425.38 0.95 -3.29 -0.79 -2.59 1.76 -7.04 0.61 0.18 2.70 -2.96 -15.53 -3.68 -7.57 0.71 -4.86 -4.57 0.166.06 2.66 -2.67 4.21 -2.21 -1.89 -6.46 -0.64 0.76 6.68 -0.14 -15.96 -3.78 -2.99 -1.33 -5.36 -5.50 -1.596.02 3.12 -3.87 2.07 -2.75 0.04 -4.16 0.70 0.10 3.73 -2.63 -15.09 -6.09 -7.70 0.23 -5.40 -3.61 -0.555.93 6.74 0.54 6.15 0.35 -1.03 -1.48 -0.76 2.23 5.23 1.84 -11.60 -2.43 -0.78 -2.64 -5.04 -4.35 -1.733.47 1.86 -3.03 1.55 -3.07 -0.54 -6.42 -0.13 -1.16 1.86 -2.41 -16.73 -4.13 -6.66 -0.81 -4.41 -4.36 0.066.74 4.36 -2.71 1.12 -3.06 0.38 -5.99 0.65 -0.27 5.00 -1.51 -16.32 -4.28 -4.68 0.03 -4.15 -3.69 -0.716.37 6.21 0.11 2.35 -2.40 -0.78 -4.42 -0.32 1.69 3.02 0.31 -13.84 -3.72 -2.70 -1.66 -6.45 -3.79 -1.065.68 5.45 0.60 2.82 -2.41 0.05 -4.74 -0.28 1.51 5.21 1.29 -14.44 -4.90 -2.13 -1.77 -6.08 -4.39 -0.734.93 5.81 0.01 4.26 -2.42 -1.40 -4.45 -0.57 1.57 4.14 1.18 -12.96 -4.14 -2.99 -1.05 -4.56 -4.12 -0.672.56 7.46 -2.93 2.80 -2.35 -0.67 -5.31 0.70 1.08 2.96 0.94 -15.23 -4.27 -2.65 -1.22 -5.83 -4.34 -0.521.90 5.93 0.08 0.65 -2.73 -1.19 -5.12 0.25 1.51 1.96 0.71 -14.01 -3.65 -3.60 -0.42 -6.22 -4.61 -0.882.48 6.50 0.40 4.03 -1.28 -1.95 -3.54 -0.88 1.31 1.30 1.20 -12.99 -2.42 -1.00 -1.58 -6.18 -4.57 -1.685.17 6.13 -0.33 0.21 -2.20 -2.44 -4.55 -0.37 1.22 2.71 1.27 -13.08 -3.03 -1.68 -0.18 -6.24 -4.92 -1.114.16 7.25 0.95 5.57 -1.00 -1.72 -3.29 -1.02 1.67 1.89 1.12 -11.79 -2.72 -1.62 -2.54 -5.82 -3.84 -1.555.18 4.93 -0.45 4.14 -1.62 -0.74 -5.07 -0.18 1.23 2.90 0.13 -13.09 -4.63 -3.16 -1.76 -4.93 -4.79 -0.304.07 6.02 0.34 3.74 -2.14 -0.97 -4.55 -0.49 1.65 3.35 1.27 -13.37 -3.70 -2.83 -1.92 -4.35 -5.29 -0.684.59 6.04 1.35 4.74 -0.47 1.45 -2.43 -0.53 1.28 3.46 0.88 -12.80 -3.01 -1.57 -0.95 -5.73 -3.75 -0.646.87 4.15 -2.99 0.98 -2.22 -1.03 -5.83 0.71 -0.16 3.42 -1.59 -15.01 -4.96 -5.18 1.32 -5.47 -5.65 -0.87
301
Appendix B: W
hole-Rock Geochem
ical Data
Appendix C Microprobe and Mineral Liberation Analysis Data
302

Data Summary The complete tables of WDS analyses of carbonates (Table C-1), feldspars (Table C-2)
and biotites (Table C-3) are shown below. Following this, modal mineralogy tables of
each MLA samples are shown in Table C-4. Grain size estimates are based on MLA
measurements of the long axes of grains. The tables correspond to the pie charts shown
in Chapter 2, but with trace phases included.
303
Appendix C: Microprobe and MLA Data
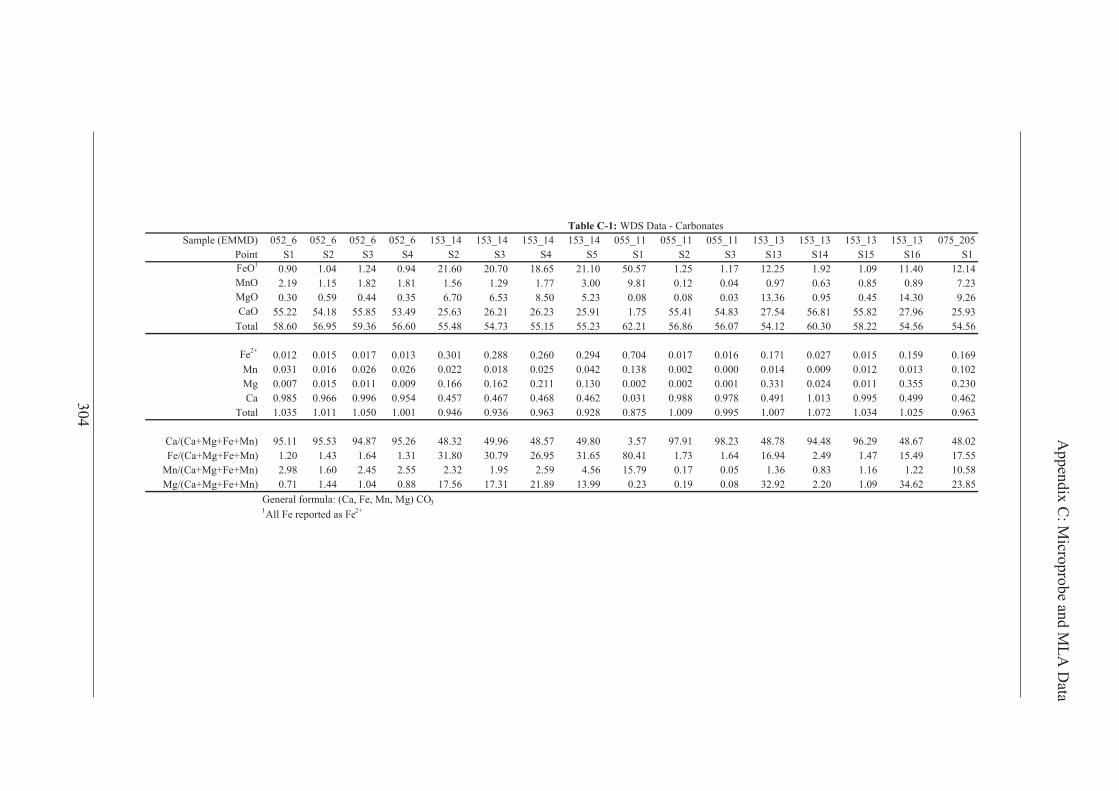
Sample (EMMD) 052_6 052_6 052_6 052_6 153_14 153_14 153_14 153_14 055_11 055_11 055_11 153_13 153_13 153_13 153_13 075_205Point S1 S2 S3 S4 S2 S3 S4 S5 S1 S2 S3 S13 S14 S15 S16 S1 FeO1 0.90 1.04 1.24 0.94 21.60 20.70 18.65 21.10 50.57 1.25 1.17 12.25 1.92 1.09 11.40 12.14MnO 2.19 1.15 1.82 1.81 1.56 1.29 1.77 3.00 9.81 0.12 0.04 0.97 0.63 0.85 0.89 7.23MgO 0.30 0.59 0.44 0.35 6.70 6.53 8.50 5.23 0.08 0.08 0.03 13.36 0.95 0.45 14.30 9.26CaO 55.22 54.18 55.85 53.49 25.63 26.21 26.23 25.91 1.75 55.41 54.83 27.54 56.81 55.82 27.96 25.93
Total 58.60 56.95 59.36 56.60 55.48 54.73 55.15 55.23 62.21 56.86 56.07 54.12 60.30 58.22 54.56 54.56
Fe2+ 0.012 0.015 0.017 0.013 0.301 0.288 0.260 0.294 0.704 0.017 0.016 0.171 0.027 0.015 0.159 0.169Mn 0.031 0.016 0.026 0.026 0.022 0.018 0.025 0.042 0.138 0.002 0.000 0.014 0.009 0.012 0.013 0.102Mg 0.007 0.015 0.011 0.009 0.166 0.162 0.211 0.130 0.002 0.002 0.001 0.331 0.024 0.011 0.355 0.230Ca 0.985 0.966 0.996 0.954 0.457 0.467 0.468 0.462 0.031 0.988 0.978 0.491 1.013 0.995 0.499 0.462
Total 1.035 1.011 1.050 1.001 0.946 0.936 0.963 0.928 0.875 1.009 0.995 1.007 1.072 1.034 1.025 0.963
Ca/(Ca+Mg+Fe+Mn) 95.11 95.53 94.87 95.26 48.32 49.96 48.57 49.80 3.57 97.91 98.23 48.78 94.48 96.29 48.67 48.02Fe/(Ca+Mg+Fe+Mn) 1.20 1.43 1.64 1.31 31.80 30.79 26.95 31.65 80.41 1.73 1.64 16.94 2.49 1.47 15.49 17.55
Mn/(Ca+Mg+Fe+Mn) 2.98 1.60 2.45 2.55 2.32 1.95 2.59 4.56 15.79 0.17 0.05 1.36 0.83 1.16 1.22 10.58Mg/(Ca+Mg+Fe+Mn) 0.71 1.44 1.04 0.88 17.56 17.31 21.89 13.99 0.23 0.19 0.08 32.92 2.20 1.09 34.62 23.85
General formula: (Ca, Fe, Mn, Mg) CO31All Fe reported as Fe2+
Table C-1: WDS Data - Carbonates
304
Appendix C: M
icroprobe and MLA
Data

Sample (EMMD)PointFeO1
MnOMgOCaO
Total
Fe2+
MnMgCa
Total
Ca/(Ca+Mg+Fe+Mn)Fe/(Ca+Mg+Fe+Mn)
Mn/(Ca+Mg+Fe+Mn)Mg/(Ca+Mg+Fe+Mn)
075_205 075_205 075_227 075_227 075_227 075_227 153_7 153_7 153_7 153_7S2 S3 S3 S4 S5 S6 S7 S8 S9 S10
11.39 11.41 10.27 9.98 14.94 12.64 46.10 45.81 42.42 45.059.89 11.65 0.78 1.70 2.23 1.04 15.27 15.05 16.10 16.318.38 6.96 14.67 8.83 11.34 13.42 0.24 0.21 0.17 0.20
26.09 26.34 27.02 17.50 26.99 27.84 1.53 1.54 2.49 1.8355.74 56.36 52.74 38.01 55.51 54.94 63.14 62.61 61.18 63.39
0.159 0.159 0.143 0.139 0.208 0.176 0.642 0.638 0.590 0.6270.139 0.164 0.011 0.024 0.031 0.015 0.215 0.212 0.227 0.2300.208 0.173 0.364 0.219 0.281 0.333 0.006 0.005 0.004 0.0050.465 0.470 0.482 0.312 0.481 0.496 0.027 0.028 0.044 0.0330.971 0.965 1.000 0.694 1.002 1.020 0.890 0.882 0.866 0.895
47.92 48.66 48.20 44.96 48.03 48.68 3.07 3.12 5.12 3.6616.33 16.45 14.29 20.03 20.75 17.25 72.08 72.25 68.17 70.0814.36 17.01 1.10 3.46 3.14 1.44 24.18 24.05 26.21 25.7021.40 17.88 36.41 31.55 28.07 32.63 0.68 0.58 0.49 0.56
Table C-1: WDS Data - Carbonates
305
Appendix C: M
icroprobe and MLA
Data

Sample No. 001_5 001_5 153_7 153_7 153_7 153_1 153_1 153_1 146_215 146_215 008_1 008_1 008_1 007_3 001_1 001_1 001_1Point No. S1 S5 S1 S4B S6 S8 S9 S10 S2 S4 S1 S9 10 S2 S2 S3 S4
SiO2 68.47 70.86 64.48 65.43 66.32 70.25 69.97 68.73 68.12 68.38 67.79 65.36 67.79 67.79 67.79 64.53 64.81TiO2 0.05 0.01 0.00 0.01 0.00 0.03 0.00 0.04 0.06 0.00 0.00 0.00 0.00 0.01 0.00 0.01 0.02
Al2O3 18.34 18.78 17.24 17.30 17.17 18.42 18.33 18.55 18.95 18.62 19.36 17.36 19.47 19.72 18.87 17.15 17.52FeO1 0.60 0.17 0.87 0.64 0.81 0.21 0.15 0.15 0.41 0.05 0.06 0.26 0.31 0.45 0.06 0.02 0.06MnO 0.00 0.00 0.09 0.10 0.07 0.01 0.00 0.03 0.02 0.00 0.00 0.00 0.02 0.00 0.00 0 0MgO 0.00 0.02 0.00 0.00 0.01 0.00 0.00 0.00 0.00 0.00 0.00 0.00 0.00 0.00 0.01 0.01 0CaO 0.06 0.04 0.00 0.04 0.00 0.05 0.02 0.07 1.01 0.49 0.74 0.00 0.01 0.04 0.02 0 0.04
Na2O 12.05 11.78 0.09 0.11 0.26 12.01 12.34 12.24 11.53 11.97 10.86 0.20 11.32 10.86 12.39 0.4 0.43K2O 0.04 0.02 17.13 16.36 15.62 0.05 0.01 0.00 0.08 0.09 0.12 16.51 0.04 0.03 0.07 16.84 16.09
Total 99.62 101.69 99.9 99.98 100.27 101.02 100.82 99.81 100.18 99.61 98.93 99.69 98.95 98.9 99.21 98.96 98.96
Si 3.01 3.04 3.01 3.03 3.05 3.04 3.03 3.01 2.99 3.01 2.99 3.03 2.99 2.99 2.99 3.03 3.02Ti 0.00 0.00 0.00 0.00 0.00 0.00 0.00 0.00 0.00 0.00 0.00 0.00 0.00 0.00 0.00 0 0Al 0.95 0.95 0.95 0.94 0.93 0.94 0.94 0.96 0.98 0.97 1.01 0.95 1.01 1.03 0.98 0.95 0.96
Fe2+ 0.02 0.01 0.03 0.02 0.03 0.01 0.01 0.01 0.01 0.00 0.00 0.01 0.01 0.02 0.00 0 0Mn 0.00 0.00 0.00 0.00 0.00 0.00 0.00 0.00 0.00 0.00 0.00 0.00 0.00 0.00 0.00 0 0Mg 0.00 0.00 0.00 0.00 0.00 0.00 0.00 0.00 0.00 0.00 0.00 0.00 0.00 0.00 0.00 0 0Ca 0.00 0.00 0.00 0.00 0.00 0.00 0.00 0.00 0.05 0.02 0.03 0.00 0.00 0.00 0.00 0 0Na 1.03 0.98 0.01 0.01 0.02 1.01 1.04 1.04 0.98 1.02 0.93 0.02 0.97 0.93 1.06 0.04 0.04K 0.00 0.00 1.02 0.97 0.92 0.00 0.00 0.00 0.00 0.00 0.01 0.98 0.00 0.00 0.00 1.01 0.96
Total 5.02 4.98 5.03 4.98 4.95 5 5.02 5.03 5.01 5.02 4.97 4.99 4.99 4.96 5.05 5.02 4.99
Ca+Na+K+other-1 0.06 0.01 0.07 0.01 0.03 0.02 0.04 0.05 0.05 0.05 0.03 0.01 0.02 0.05 0.07 0.05 04-(Si+Al) 0.03 0.01 0.04 0.02 0.02 0.02 0.03 0.03 0.03 0.03 0.00 0.02 0.00 0.01 0.02 0.02 0.01
Al-(2Ca+K+Na) -0.08 -0.04 -0.08 -0.04 -0.01 -0.08 -0.10 -0.09 -0.10 -0.11 0.00 -0.05 0.04 0.09 -0.08 -0.1 -0.04Or 0.21 0.12 95.74 96.03 94.02 0.25 0.08 0.02 0.44 0.46 0.70 97.23 0.20 0.19 0.37 96.4 95.71Ab 97.42 98.92 0.74 0.95 2.39 98.75 99.31 99.06 93.52 97.12 95.46 1.76 98.53 97.88 99.28 3.47 3.85An 2.37 0.95 3.53 3.02 3.59 1 0.61 0.92 6.04 2.42 3.83 1.01 1.27 1.92 0.36 0.13 0.43
Table C-2: WDS Data - Feldspars
Cations on the basis of 8 O
1All Fe reported as Fe2+General formula: (K, Na, Ca) (Al, Si)4O8
306
Appendix C: M
icroprobe and MLA
Data
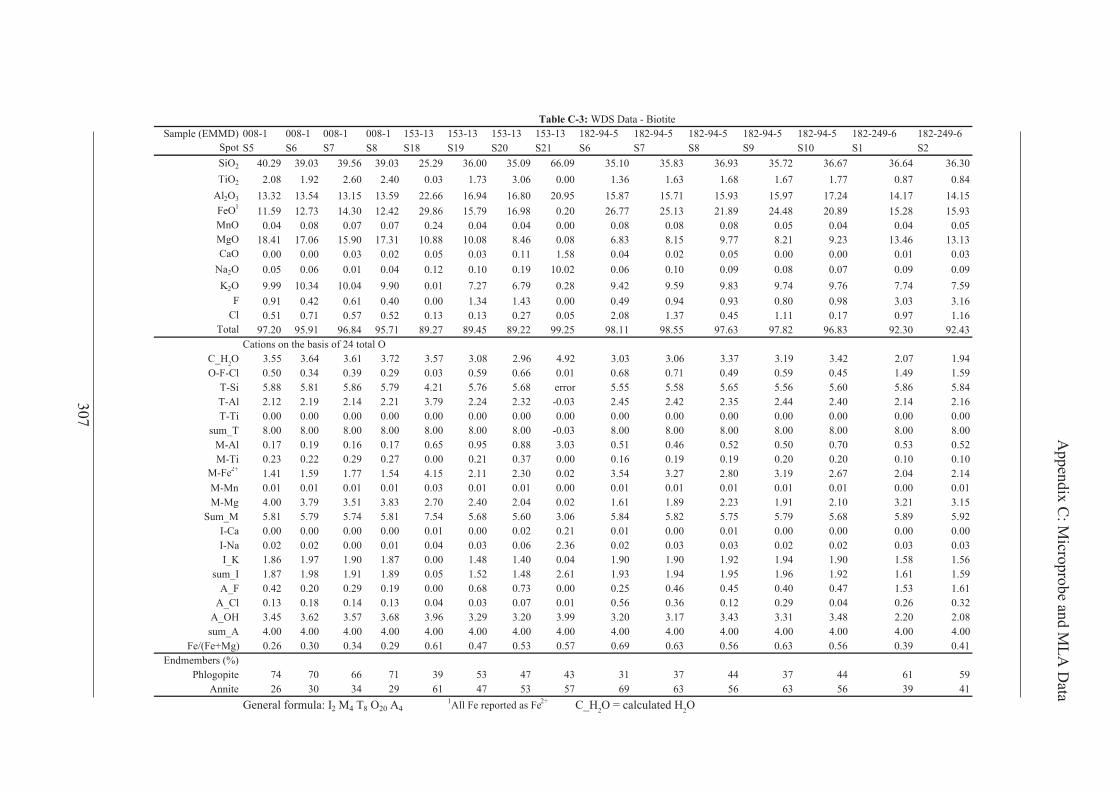
Sample (EMMD) 008-1 008-1 008-1 008-1 153-13 153-13 153-13 153-13 182-94-5 182-94-5 182-94-5 182-94-5 182-94-5 182-249-6 182-249-6Spot S5 S6 S7 S8 S18 S19 S20 S21 S6 S7 S8 S9 S10 S1 S2 SiO2 40.29 39.03 39.56 39.03 25.29 36.00 35.09 66.09 35.10 35.83 36.93 35.72 36.67 36.64 36.30TiO2 2.08 1.92 2.60 2.40 0.03 1.73 3.06 0.00 1.36 1.63 1.68 1.67 1.77 0.87 0.84
Al2O3 13.32 13.54 13.15 13.59 22.66 16.94 16.80 20.95 15.87 15.71 15.93 15.97 17.24 14.17 14.15FeO1 11.59 12.73 14.30 12.42 29.86 15.79 16.98 0.20 26.77 25.13 21.89 24.48 20.89 15.28 15.93MnO 0.04 0.08 0.07 0.07 0.24 0.04 0.04 0.00 0.08 0.08 0.08 0.05 0.04 0.04 0.05MgO 18.41 17.06 15.90 17.31 10.88 10.08 8.46 0.08 6.83 8.15 9.77 8.21 9.23 13.46 13.13CaO 0.00 0.00 0.03 0.02 0.05 0.03 0.11 1.58 0.04 0.02 0.05 0.00 0.00 0.01 0.03
Na2O 0.05 0.06 0.01 0.04 0.12 0.10 0.19 10.02 0.06 0.10 0.09 0.08 0.07 0.09 0.09K2O 9.99 10.34 10.04 9.90 0.01 7.27 6.79 0.28 9.42 9.59 9.83 9.74 9.76 7.74 7.59
F 0.91 0.42 0.61 0.40 0.00 1.34 1.43 0.00 0.49 0.94 0.93 0.80 0.98 3.03 3.16Cl 0.51 0.71 0.57 0.52 0.13 0.13 0.27 0.05 2.08 1.37 0.45 1.11 0.17 0.97 1.16
Total 97.20 95.91 96.84 95.71 89.27 89.45 89.22 99.25 98.11 98.55 97.63 97.82 96.83 92.30 92.43Cations on the basis of 24 total O
C_H2O 3.55 3.64 3.61 3.72 3.57 3.08 2.96 4.92 3.03 3.06 3.37 3.19 3.42 2.07 1.94O-F-Cl 0.50 0.34 0.39 0.29 0.03 0.59 0.66 0.01 0.68 0.71 0.49 0.59 0.45 1.49 1.59
T-Si 5.88 5.81 5.86 5.79 4.21 5.76 5.68 error 5.55 5.58 5.65 5.56 5.60 5.86 5.84T-Al 2.12 2.19 2.14 2.21 3.79 2.24 2.32 -0.03 2.45 2.42 2.35 2.44 2.40 2.14 2.16T-Ti 0.00 0.00 0.00 0.00 0.00 0.00 0.00 0.00 0.00 0.00 0.00 0.00 0.00 0.00 0.00
sum_T 8.00 8.00 8.00 8.00 8.00 8.00 8.00 -0.03 8.00 8.00 8.00 8.00 8.00 8.00 8.00M-Al 0.17 0.19 0.16 0.17 0.65 0.95 0.88 3.03 0.51 0.46 0.52 0.50 0.70 0.53 0.52M-Ti 0.23 0.22 0.29 0.27 0.00 0.21 0.37 0.00 0.16 0.19 0.19 0.20 0.20 0.10 0.10
M-Fe2+ 1.41 1.59 1.77 1.54 4.15 2.11 2.30 0.02 3.54 3.27 2.80 3.19 2.67 2.04 2.14M-Mn 0.01 0.01 0.01 0.01 0.03 0.01 0.01 0.00 0.01 0.01 0.01 0.01 0.01 0.00 0.01M-Mg 4.00 3.79 3.51 3.83 2.70 2.40 2.04 0.02 1.61 1.89 2.23 1.91 2.10 3.21 3.15
Sum_M 5.81 5.79 5.74 5.81 7.54 5.68 5.60 3.06 5.84 5.82 5.75 5.79 5.68 5.89 5.92I-Ca 0.00 0.00 0.00 0.00 0.01 0.00 0.02 0.21 0.01 0.00 0.01 0.00 0.00 0.00 0.00I-Na 0.02 0.02 0.00 0.01 0.04 0.03 0.06 2.36 0.02 0.03 0.03 0.02 0.02 0.03 0.03I_K 1.86 1.97 1.90 1.87 0.00 1.48 1.40 0.04 1.90 1.90 1.92 1.94 1.90 1.58 1.56
sum_I 1.87 1.98 1.91 1.89 0.05 1.52 1.48 2.61 1.93 1.94 1.95 1.96 1.92 1.61 1.59A_F 0.42 0.20 0.29 0.19 0.00 0.68 0.73 0.00 0.25 0.46 0.45 0.40 0.47 1.53 1.61
A_Cl 0.13 0.18 0.14 0.13 0.04 0.03 0.07 0.01 0.56 0.36 0.12 0.29 0.04 0.26 0.32A_OH 3.45 3.62 3.57 3.68 3.96 3.29 3.20 3.99 3.20 3.17 3.43 3.31 3.48 2.20 2.08sum_A 4.00 4.00 4.00 4.00 4.00 4.00 4.00 4.00 4.00 4.00 4.00 4.00 4.00 4.00 4.00
Fe/(Fe+Mg) 0.26 0.30 0.34 0.29 0.61 0.47 0.53 0.57 0.69 0.63 0.56 0.63 0.56 0.39 0.41Endmembers (%)
Phlogopite 74 70 66 71 39 53 47 43 31 37 44 37 44 61 59Annite 26 30 34 29 61 47 53 57 69 63 56 63 56 39 41
Table C-3: WDS Data - Biotite
1All Fe reported as Fe2+General formula: I2 M4 T8 O20 A4 C_H2O = calculated H2O
307
Appendix C: M
icroprobe and MLA
Data
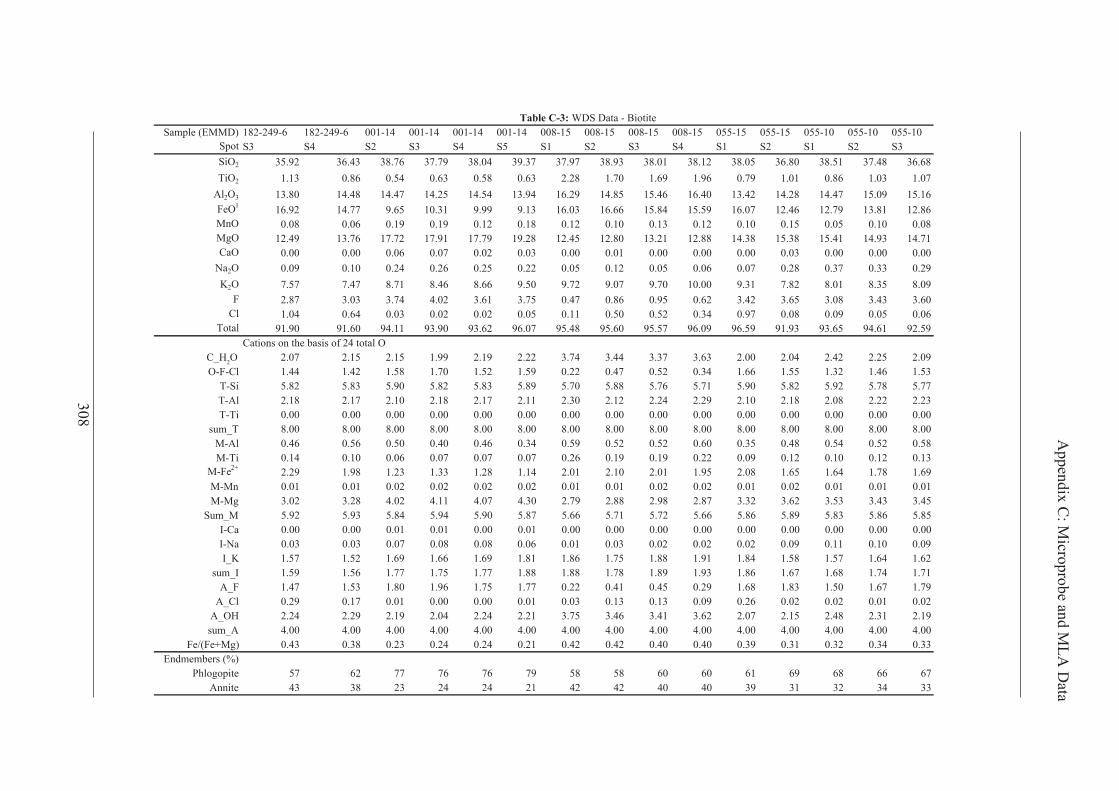
Sample (EMMD)SpotSiO2
TiO2
Al2O3
FeO1
MnOMgOCaO
Na2OK2O
FCl
Total
C_H2OO-F-Cl
T-SiT-AlT-Ti
sum_TM-AlM-Ti
M-Fe2+
M-MnM-Mg
Sum_MI-CaI-NaI_K
sum_IA_F
A_ClA_OHsum_A
Fe/(Fe+Mg)Endmembers (%)
PhlogopiteAnnite
182-249-6 182-249-6 001-14 001-14 001-14 001-14 008-15 008-15 008-15 008-15 055-15 055-15 055-10 055-10 055-10S3 S4 S2 S3 S4 S5 S1 S2 S3 S4 S1 S2 S1 S2 S3
35.92 36.43 38.76 37.79 38.04 39.37 37.97 38.93 38.01 38.12 38.05 36.80 38.51 37.48 36.681.13 0.86 0.54 0.63 0.58 0.63 2.28 1.70 1.69 1.96 0.79 1.01 0.86 1.03 1.07
13.80 14.48 14.47 14.25 14.54 13.94 16.29 14.85 15.46 16.40 13.42 14.28 14.47 15.09 15.1616.92 14.77 9.65 10.31 9.99 9.13 16.03 16.66 15.84 15.59 16.07 12.46 12.79 13.81 12.86
0.08 0.06 0.19 0.19 0.12 0.18 0.12 0.10 0.13 0.12 0.10 0.15 0.05 0.10 0.0812.49 13.76 17.72 17.91 17.79 19.28 12.45 12.80 13.21 12.88 14.38 15.38 15.41 14.93 14.71
0.00 0.00 0.06 0.07 0.02 0.03 0.00 0.01 0.00 0.00 0.00 0.03 0.00 0.00 0.000.09 0.10 0.24 0.26 0.25 0.22 0.05 0.12 0.05 0.06 0.07 0.28 0.37 0.33 0.297.57 7.47 8.71 8.46 8.66 9.50 9.72 9.07 9.70 10.00 9.31 7.82 8.01 8.35 8.092.87 3.03 3.74 4.02 3.61 3.75 0.47 0.86 0.95 0.62 3.42 3.65 3.08 3.43 3.601.04 0.64 0.03 0.02 0.02 0.05 0.11 0.50 0.52 0.34 0.97 0.08 0.09 0.05 0.06
91.90 91.60 94.11 93.90 93.62 96.07 95.48 95.60 95.57 96.09 96.59 91.93 93.65 94.61 92.59Cations on the basis of 24 total O
2.07 2.15 2.15 1.99 2.19 2.22 3.74 3.44 3.37 3.63 2.00 2.04 2.42 2.25 2.091.44 1.42 1.58 1.70 1.52 1.59 0.22 0.47 0.52 0.34 1.66 1.55 1.32 1.46 1.535.82 5.83 5.90 5.82 5.83 5.89 5.70 5.88 5.76 5.71 5.90 5.82 5.92 5.78 5.772.18 2.17 2.10 2.18 2.17 2.11 2.30 2.12 2.24 2.29 2.10 2.18 2.08 2.22 2.230.00 0.00 0.00 0.00 0.00 0.00 0.00 0.00 0.00 0.00 0.00 0.00 0.00 0.00 0.008.00 8.00 8.00 8.00 8.00 8.00 8.00 8.00 8.00 8.00 8.00 8.00 8.00 8.00 8.000.46 0.56 0.50 0.40 0.46 0.34 0.59 0.52 0.52 0.60 0.35 0.48 0.54 0.52 0.580.14 0.10 0.06 0.07 0.07 0.07 0.26 0.19 0.19 0.22 0.09 0.12 0.10 0.12 0.132.29 1.98 1.23 1.33 1.28 1.14 2.01 2.10 2.01 1.95 2.08 1.65 1.64 1.78 1.690.01 0.01 0.02 0.02 0.02 0.02 0.01 0.01 0.02 0.02 0.01 0.02 0.01 0.01 0.013.02 3.28 4.02 4.11 4.07 4.30 2.79 2.88 2.98 2.87 3.32 3.62 3.53 3.43 3.455.92 5.93 5.84 5.94 5.90 5.87 5.66 5.71 5.72 5.66 5.86 5.89 5.83 5.86 5.850.00 0.00 0.01 0.01 0.00 0.01 0.00 0.00 0.00 0.00 0.00 0.00 0.00 0.00 0.000.03 0.03 0.07 0.08 0.08 0.06 0.01 0.03 0.02 0.02 0.02 0.09 0.11 0.10 0.091.57 1.52 1.69 1.66 1.69 1.81 1.86 1.75 1.88 1.91 1.84 1.58 1.57 1.64 1.621.59 1.56 1.77 1.75 1.77 1.88 1.88 1.78 1.89 1.93 1.86 1.67 1.68 1.74 1.711.47 1.53 1.80 1.96 1.75 1.77 0.22 0.41 0.45 0.29 1.68 1.83 1.50 1.67 1.790.29 0.17 0.01 0.00 0.00 0.01 0.03 0.13 0.13 0.09 0.26 0.02 0.02 0.01 0.022.24 2.29 2.19 2.04 2.24 2.21 3.75 3.46 3.41 3.62 2.07 2.15 2.48 2.31 2.194.00 4.00 4.00 4.00 4.00 4.00 4.00 4.00 4.00 4.00 4.00 4.00 4.00 4.00 4.000.43 0.38 0.23 0.24 0.24 0.21 0.42 0.42 0.40 0.40 0.39 0.31 0.32 0.34 0.33
57 62 77 76 76 79 58 58 60 60 61 69 68 66 6743 38 23 24 24 21 42 42 40 40 39 31 32 34 33
Table C-3: WDS Data - Biotite
308
Appendix C: M
icroprobe and MLA
Data

Mineral Wt.% Area % Area (μ2) Grain Count Mean Grain Size Max Grain SizeMagnetite 30.31 22.61 1009212 3113 14.0 512.9
Siderite-Mn-Ca 28.37 27.52 1228333 3838 20.1 300.0Quartz 8.94 13.08 583818 1133 26.3 489.4
Fluorite 7.94 9.74 434850 2932 13.6 167.8Siderite-Mn-Mg 5.58 5.41 241474 5135 7.3 66.9
Chalcopyrite 4.49 4.11 183442 382 22.8 312.3Pyrite 2.84 2.18 97264 735 9.8 148.7
Calcite-Fe 2.78 3.94 175690 5886 5.4 42.5Chlorite 2.36 3.08 137334 4287 5.5 121.6
Orthoclase 1.68 2.52 112396 595 16.4 136.7Apatite 1.22 1.47 65454 545 11.1 66.0
Dolomite-Fe-Mn 1.19 1.61 71697 3567 4.0 35.5Biotite-Ti-Cl 0.80 0.99 44024 1769 4.8 31.7Muscovite-Ti 0.43 0.58 25803 671 6.0 61.8
Monazite 0.32 0.24 10715 24 24.9 89.2Muscovite 0.18 0.24 10858 306 5.7 25.2
Paracelsian 0.17 0.19 8484 172 7.4 49.0Calcite 0.13 0.19 8354 559 3.2 10.6
Bastnasite-(La) 0.08 0.06 2803 9 22.2 69.1Ilmenite-Mn 0.05 0.04 1964 72 4.5 21.8
Brannerite 0.04 0.03 1272 35 6.3 15.6Rutile-alt-Fe 0.03 0.03 1370 45 5.0 19.7
Rutile 0.03 0.02 1067 23 6.8 22.0Molybdenite 0.02 0.01 656 20 5.7 15.8
Albite 0.01 0.01 656 42 3.5 8.7Roentgenite-Synchysite 0.01 0.01 339 25 3.5 8.7
Scheelite 0.01 0.00 179 16 2.4 4.4Unknown 0.00 0.07 3320 25 - -No_XRay 0.00 0.01 625 75 - -
Total 100.00 100.00 4463513 36039 9.9 512.9
Mineral Wt% Area% Area (μ2) Grain Count Mean Grain Size Max Grain SizeDolomite-Fe-Mn 22.42 26.07 1317131 3945 11.5 712.6
Pyrite 16.77 11.09 560347 50 125.6 719.5Magnetite 16.62 10.70 540284 130 57.1 563.5
Quartz 10.90 13.76 695176 661 34.9 370.1Calcite 9.46 11.57 584544 2177 15.4 285.2
Chlorite 9.43 10.60 535422 1747 19.0 343.2Biotite-Ti-Cl 4.56 4.87 246235 4984 5.9 265.3
Albite 4.42 5.59 282326 1136 10.7 386.5Apatite 2.28 2.37 119647 76 24.2 390.4
Muscovite-Ti 0.93 1.10 55339 1033 7.8 108.9Scheelite 0.80 0.44 22359 1431 3.7 19.8
Muscovite 0.35 0.41 20934 875 4.7 33.5Ilmenite-Mn 0.33 0.23 11618 97 11.4 76.4
Roentgenite-Synchysite 0.16 0.14 6874 87 10.0 61.8Orthoclase 0.12 0.15 7698 353 4.7 82.7Paracelsian 0.11 0.11 5451 245 4.7 27.3Calcite-Fe 0.09 0.11 5451 338 3.1 47.0
Rutile-alt-Fe 0.08 0.06 3152 60 7.7 42.0Chalcopyrite 0.08 0.06 3071 42 10.3 53.3
Siderite-Mn-Ca 0.05 0.04 1934 88 4.7 23.1Biotite-Ba 0.04 0.04 2253 128 3.6 62.8
Barite 0.01 0.00 251 4 10.5 14.5Unknown 0.00 0.47 23618 214 - -
Total 100.00 100.00 5051328 19915 17.8 719.5
Table C-4: Modal Mineralogy of MLA SamplesEMMD153-7 (76.55m)
EMMD153-13 (311.7m)
309
Appendix C: Microprobe and MLA Data
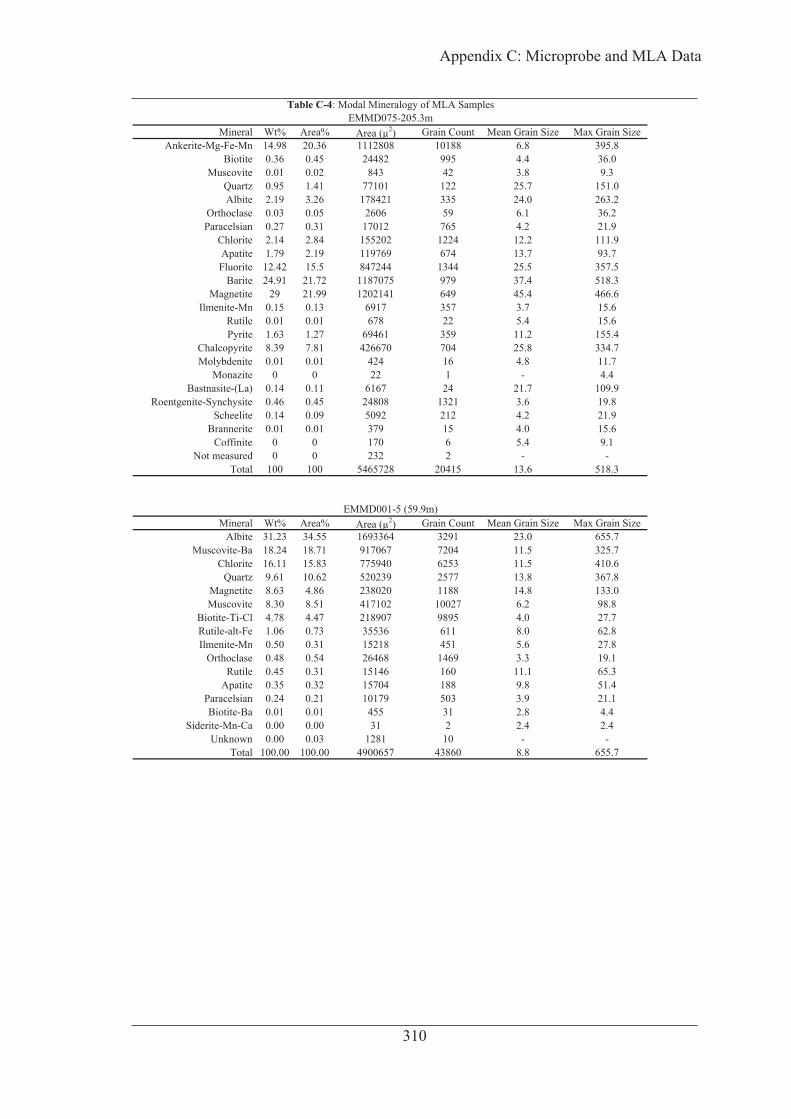
Mineral Wt% Area% Area (μ2) Grain Count Mean Grain Size Max Grain SizeAnkerite-Mg-Fe-Mn 14.98 20.36 1112808 10188 6.8 395.8
Biotite 0.36 0.45 24482 995 4.4 36.0Muscovite 0.01 0.02 843 42 3.8 9.3
Quartz 0.95 1.41 77101 122 25.7 151.0Albite 2.19 3.26 178421 335 24.0 263.2
Orthoclase 0.03 0.05 2606 59 6.1 36.2Paracelsian 0.27 0.31 17012 765 4.2 21.9
Chlorite 2.14 2.84 155202 1224 12.2 111.9Apatite 1.79 2.19 119769 674 13.7 93.7Fluorite 12.42 15.5 847244 1344 25.5 357.5
Barite 24.91 21.72 1187075 979 37.4 518.3Magnetite 29 21.99 1202141 649 45.4 466.6
Ilmenite-Mn 0.15 0.13 6917 357 3.7 15.6Rutile 0.01 0.01 678 22 5.4 15.6Pyrite 1.63 1.27 69461 359 11.2 155.4
Chalcopyrite 8.39 7.81 426670 704 25.8 334.7Molybdenite 0.01 0.01 424 16 4.8 11.7
Monazite 0 0 22 1 - 4.4Bastnasite-(La) 0.14 0.11 6167 24 21.7 109.9
Roentgenite-Synchysite 0.46 0.45 24808 1321 3.6 19.8Scheelite 0.14 0.09 5092 212 4.2 21.9
Brannerite 0.01 0.01 379 15 4.0 15.6Coffinite 0 0 170 6 5.4 9.1
Not measured 0 0 232 2 - -Total 100 100 5465728 20415 13.6 518.3
Mineral Wt% Area% Area (μ2) Grain Count Mean Grain Size Max Grain SizeAlbite 31.23 34.55 1693364 3291 23.0 655.7
Muscovite-Ba 18.24 18.71 917067 7204 11.5 325.7Chlorite 16.11 15.83 775940 6253 11.5 410.6
Quartz 9.61 10.62 520239 2577 13.8 367.8Magnetite 8.63 4.86 238020 1188 14.8 133.0Muscovite 8.30 8.51 417102 10027 6.2 98.8
Biotite-Ti-Cl 4.78 4.47 218907 9895 4.0 27.7Rutile-alt-Fe 1.06 0.73 35536 611 8.0 62.8Ilmenite-Mn 0.50 0.31 15218 451 5.6 27.8
Orthoclase 0.48 0.54 26468 1469 3.3 19.1Rutile 0.45 0.31 15146 160 11.1 65.3
Apatite 0.35 0.32 15704 188 9.8 51.4Paracelsian 0.24 0.21 10179 503 3.9 21.1Biotite-Ba 0.01 0.01 455 31 2.8 4.4
Siderite-Mn-Ca 0.00 0.00 31 2 2.4 2.4Unknown 0.00 0.03 1281 10 - -
Total 100.00 100.00 4900657 43860 8.8 655.7
EMMD075-205.3m
EMMD001-5 (59.9m)
310
Appendix C: Microprobe and MLA Data
Table C-4: Modal Mineralogy of MLA Samples

Mineral Wt% Area% Area (μ2) Grain Count Mean Grain Size Max Grain SizeMagnetite 33.97 24.68 1328502 1763 30.5 223.1
Chlorite 19.22 24.38 1312570 3154 18.9 829.1Fluorite 15.07 18.02 970074 1673 22.3 455.1
Chalcopyrite 11.38 10.14 545743 367 43.5 546.5Siderite-Mn-Mg 4.09 3.86 207808 3306 8.5 208.0
Quartz 3.80 5.41 291327 152 46.3 465.2Apatite 2.55 2.99 160718 491 18.1 185.5
Pyrite 1.89 1.41 76039 297 12.2 149.8Calcite-Fe 1.79 2.47 132706 5421 4.5 53.1
Barite 1.62 1.36 73036 202 23.9 596.8Biotite-Ba 1.55 1.88 100932 356 16.8 359.7
Biotite-Ti-Cl 0.77 0.92 49768 2092 4.2 41.2Dolomite-Fe-Mn 0.62 0.82 44051 2018 4.0 42.3
Siderite-Mn-Ca 0.52 0.49 26593 1224 3.9 25.0Roentgenite-Synchysite 0.32 0.30 16329 75 16.4 72.5
Rutile 0.22 0.20 10626 103 9.9 61.3Rutile-alt-Fe 0.16 0.14 7765 265 4.8 29.9
Coffinite 0.12 0.09 4695 61 10.4 38.4Calcite 0.10 0.14 7792 269 4.8 23.2Albite 0.06 0.08 4414 266 3.5 19.7
Molybdenite 0.05 0.04 1897 33 8.9 40.6Muscovite-Ba 0.05 0.06 3409 57 8.4 45.8
Muscovite 0.02 0.03 1522 30 6.8 32.7Ilmenite-Mn 0.02 0.02 826 46 3.1 12.8Paracelsian 0.01 0.01 696 23 5.1 25.0Brannerite 0.01 0.01 361 13 5.2 9.8Unknown 0.00 0.04 2325 14 - -
Total 100.00 100.00 5382718 23781 13.3 829.1
Mineral Wt% Area% Area (μ2) Grain Count Mean Grain Size Max Grain SizeBiotite-Ti-Cl 41.74 39.69 2129307 5767 8.7 1320.8Muscovite-Ti 18.68 19.49 1045498 12097 9.0 705.8
Dolomite-Fe-Mn 12.24 12.66 678949 1592 17.4 463.5Muscovite 10.04 10.48 562098 8561 7.7 200.2
Albite 8.84 9.94 533551 1189 19.2 660.8Chlorite 4.54 4.54 243442 1243 14.8 492.0
Ilmenite-Mn 2.37 1.49 79766 337 19.1 98.6Orthoclase 0.57 0.66 35505 745 6.8 64.7
Calcite 0.36 0.39 21091 187 9.2 186.7Rutile-alt-Fe 0.26 0.18 9858 246 6.1 42.8
Quartz 0.25 0.28 14963 86 14.4 106.0Apatite 0.07 0.07 3579 17 17.3 95.2
Paracelsian 0.02 0.02 928 50 3.5 9.4Rutile 0.01 0.01 357 7 7.2 13.2
Unknown 0.00 0.11 5730 45 - -Total 100.00 100.00 5365050 32187 11.5 1320.8
EMMD055-14 (155.35m)
EMMD182-94.5m
311
Appendix C: Microprobe and MLA Data
Table C-4: Modal Mineralogy of MLA Samples

Mineral Wt% Area% Area (μ2) Grain Count Mean Grain Size Max Grain SizeAlbite 55.88 61.16 3310354 672 35.4 1364.1
Chlorite 15.04 14.62 791568 3003 15.8 488.3Magnetite 10.50 5.85 316402 469 29.7 143.4
Calcite 9.99 10.57 572251 705 32.6 328.4Muscovite-Ba 1.74 1.77 95635 3070 4.7 56.0
Quartz 1.46 1.60 86460 513 12.0 139.6Biotite-Ti-Cl 1.30 1.20 64936 3441 3.7 26.8Rutile-alt-Fe 1.12 0.76 40900 751 7.1 104.5
Rutile 0.75 0.51 27369 269 11.2 80.8Muscovite 0.53 0.54 29168 975 4.7 38.7
Dolomite-Fe-Mn 0.52 0.53 28548 1459 3.8 26.1Ilmenite-Mn 0.47 0.28 15392 385 6.2 65.1
Apatite 0.33 0.30 16128 71 19.3 72.8Paracelsian 0.33 0.28 15280 752 3.8 26.1Orthoclase 0.02 0.02 1330 69 3.3 10.6Calcite-Fe 0.01 0.01 424 26 3.4 4.4
Siderite-Mn-Ca 0.01 0.00 201 14 - -Total 100.00 100.00 5412591 16658 12.3 1364.1
Mineral Wt% Area% Area (μ2) Grain Count Mean Grain Size Max Grain SizeMuscovite-Sericite 51.37 50.05 2712889 6852 12.8 1368.6
Quartz 39.60 41.52 2250701 7776 12.2 1330.6Biotite 4.07 3.61 195643 6018 5.4 61.1
Dolomite-Fe-Mn 2.56 2.48 134219 1314 10.1 110.4Chlorite 1.73 1.61 87401 871 10.3 139.4Apatite 0.27 0.23 12478 126 11.1 90.6
Paracelsian 0.27 0.22 11844 500 4.1 19.0Rutile 0.06 0.04 2280 40 7.1 31.4
Rutile-alt-Fe 0.04 0.03 1473 63 4.1 18.5Albite 0.02 0.02 1200 8 21.8 38.7
Titanite 0.02 0.01 652 31 3.9 11.4Calcite 0.00 0.00 45 2 3.3 4.3
Coffinite 0.00 0.00 13 1 - 2.4Unknown 0.00 0.18 9497 81 - -
Total 100.00 100.00 5420333 23683 8.8 1368.6
Mineral Wt% Area% Area (μ2) Grain Count Mean Grain Size Max Grain SizeMuscovite-Sericite 45.05 47.33 2586493 1007 16.2 1368.9
Actinolite 23.32 22.77 1244528 2962 11.7 923.5Biotite 17.01 16.29 890032 15727 6.7 327.8
Clinozoisite-Pumpellyite 5.55 4.92 268964 1570 11.7 251.4Chlorite 5.32 5.36 292706 4101 7.8 217.4Titanite 2.78 2.37 129720 283 13.4 426.3Calcite 0.35 0.38 20698 263 9.7 66.9Apatite 0.18 0.17 9037 4 49.5 136.0Albite 0.16 0.18 9666 124 7.7 85.6
Magnetite 0.12 0.07 3780 43 10.9 53.2Quartz 0.07 0.08 4168 80 6.9 30.1
Dolomite-Fe-Mn 0.06 0.07 3677 139 4.1 17.4Rutile-alt-Fe 0.01 0.01 375 10 6.3 22.2
Total 100.00 100.00 5464933 26339 12.5 1368.9
EMMD146-215m
EMMD167-105m
EMMD085-112m
312
Appendix C: Microprobe and MLA Data
Table C-4: Modal Mineralogy of MLA Samples

Mineral Wt% Area% Area (μ2) Grain Count Mean Grain Size Max Grain SizeMagnetite 18.66 12.46 855317 1384 25.4 412.8
Barite 15.76 12.10 830291 1281 27.8 374.4Quartz 15.43 20.21 1387190 906 38.4 595.8
Muscovite-Sericite 11.04 13.44 922556 5164 12.6 237.7Calcite 9.35 11.87 814421 4370 10.7 536.3
Fluorite 8.80 9.67 663539 1449 19.6 593.6Chalcopyrite 8.20 6.71 460836 604 29.7 302.1
Biotite 4.21 4.67 320423 7621 6.5 103.6Pyrite 3.28 2.25 154564 418 18.1 180.7
Chlorite 2.68 3.12 214332 4124 7.3 123.1Apatite 1.54 1.67 114289 142 28.5 204.3
Dolomite-Fe-Mn 0.28 0.34 23175 599 6.4 33.7Albite 0.20 0.26 17699 993 3.5 13.1
Siderite-Mn 0.14 0.12 8060 372 3.9 14.5Paracelsian 0.10 0.10 6868 370 3.5 14.8
Roentgenite-Synchysite 0.09 0.08 5391 160 4.6 52.2Titanite 0.07 0.07 4882 249 3.7 20.5
Rutile-alt-Fe 0.05 0.04 2646 77 5.5 19.8Ilmenite-Mn 0.04 0.03 2031 75 4.9 30.3
Rutile 0.03 0.02 1589 43 6.3 17.3Molybdenite 0.02 0.01 884 9 11.3 42.4
Brannerite 0.02 0.01 772 19 6.0 23.5Coffinite 0.01 0.00 281 7 6.7 14.3
Unknown 0.00 0.74 51004 472 - -Total 100.00 100.00 6863271 30914 12.7 595.8
Mineral Wt% Area% Area (μ2) Grain Count Mean Grain Size Max Grain SizeAlbite 72.35 74.77 4038508 392 32.9 1368.6
Dolomite-Fe-Mn 12.14 11.53 623018 188 40.4 639.6Muscovite-Sericite 5.54 5.31 286784 7898 5.5 53.1
Chlorite 4.79 4.40 237538 1299 15.6 214.9Ilmenite-Mn 2.22 1.28 69104 577 13.2 55.5
Biotite 1.17 1.02 55002 2395 4.3 31.2Calcite 0.93 0.93 50250 385 11.3 325.5
Paracelsian 0.24 0.19 10532 491 3.8 17.4Apatite 0.22 0.19 10219 89 11.4 41.7
Rutile-alt-Fe 0.16 0.11 5676 184 5.6 29.9Quartz 0.15 0.15 8323 199 5.3 61.7
Titanite 0.06 0.05 2588 126 3.7 12.1Rutile 0.01 0.01 361 13 4.2 16.3
Unknown 0.00 0.06 3316 32 - -Total 100.00 100.00 5401367 14272 12.1 1368.6
EMMD085-310.5m
EMMD167-180m
313
Appendix C: Microprobe and MLA Data
Table C-4: Modal Mineralogy of MLA Samples

Appendix D Monazite U-Pb LA-ICP-MS Data
314
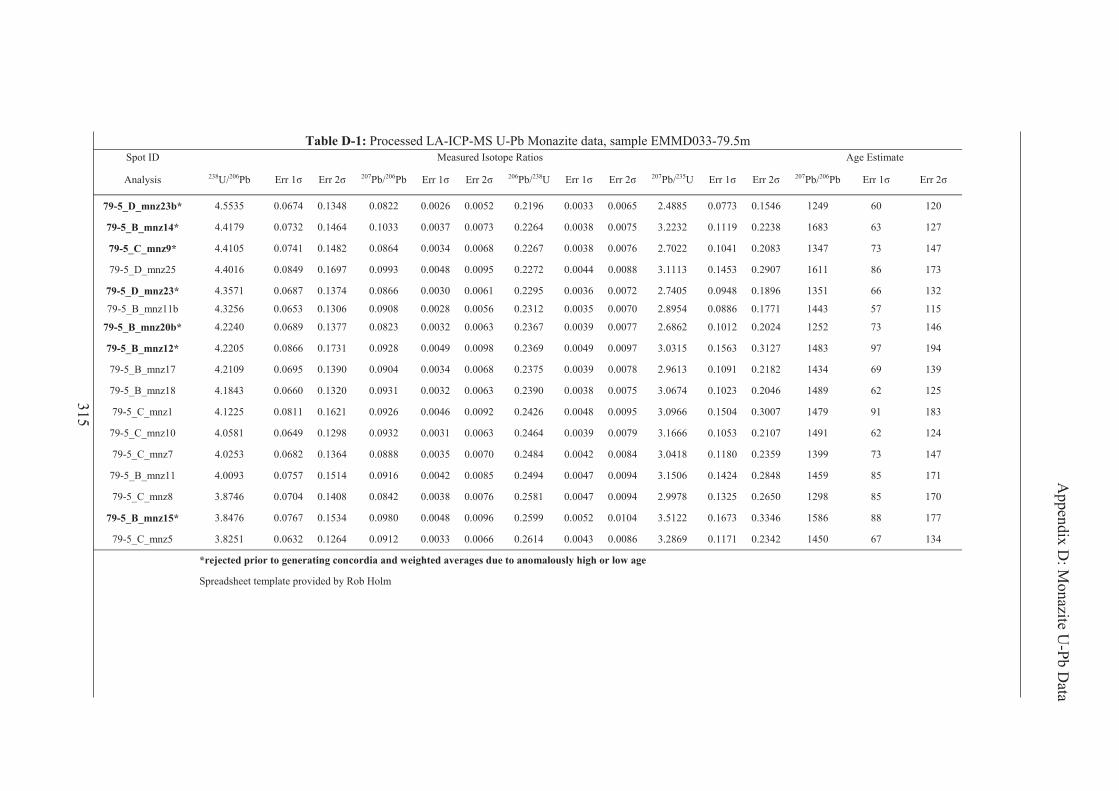
Table D-1: Processed LA-ICP-MS U-Pb Monazite data, sample EMMD033-79.5m etamitsE egA soitaR epotosI derusaeM DI topS
Analysis 238U/206Pb Err Err 207Pb/206Pb Err Err 206Pb/238U Err 1 Err 2 207Pb/235U Err 1 Err 2 207Pb/206Pb Err Err
79-5_D_mnz23b* 4.5535 0.0674 0.1348 0.0822 0.0026 0.0052 0.2196 0.0033 0.0065 2.4885 0.0773 0.1546 1249 60 120
79-5_B_mnz14* 4.4179 0.0732 0.1464 0.1033 0.0037 0.0073 0.2264 0.0038 0.0075 3.2232 0.1119 0.2238 1683 63 127
79-5_C_mnz9* 4.4105 0.0741 0.1482 0.0864 0.0034 0.0068 0.2267 0.0038 0.0076 2.7022 0.1041 0.2083 1347 73 147
79-5_D_mnz25 4.4016 0.0849 0.1697 0.0993 0.0048 0.0095 0.2272 0.0044 0.0088 3.1113 0.1453 0.2907 1611 86 173
79-5_D_mnz23* 4.3571 0.0687 0.1374 0.0866 0.0030 0.0061 0.2295 0.0036 0.0072 2.7405 0.0948 0.1896 1351 66 132
79-5_B_mnz11b 4.3256 0.0653 0.1306 0.0908 0.0028 0.0056 0.2312 0.0035 0.0070 2.8954 0.0886 0.1771 1443 57 115
79-5_B_mnz20b* 4.2240 0.0689 0.1377 0.0823 0.0032 0.0063 0.2367 0.0039 0.0077 2.6862 0.1012 0.2024 1252 73 146
79-5_B_mnz12* 4.2205 0.0866 0.1731 0.0928 0.0049 0.0098 0.2369 0.0049 0.0097 3.0315 0.1563 0.3127 1483 97 194
79-5_B_mnz17 4.2109 0.0695 0.1390 0.0904 0.0034 0.0068 0.2375 0.0039 0.0078 2.9613 0.1091 0.2182 1434 69 139
79-5_B_mnz18 4.1843 0.0660 0.1320 0.0931 0.0032 0.0063 0.2390 0.0038 0.0075 3.0674 0.1023 0.2046 1489 62 125
79-5_C_mnz1 4.1225 0.0811 0.1621 0.0926 0.0046 0.0092 0.2426 0.0048 0.0095 3.0966 0.1504 0.3007 1479 91 183
79-5_C_mnz10 4.0581 0.0649 0.1298 0.0932 0.0031 0.0063 0.2464 0.0039 0.0079 3.1666 0.1053 0.2107 1491 62 124
79-5_C_mnz7 4.0253 0.0682 0.1364 0.0888 0.0035 0.0070 0.2484 0.0042 0.0084 3.0418 0.1180 0.2359 1399 73 147
79-5_B_mnz11 4.0093 0.0757 0.1514 0.0916 0.0042 0.0085 0.2494 0.0047 0.0094 3.1506 0.1424 0.2848 1459 85 171
79-5_C_mnz8 3.8746 0.0704 0.1408 0.0842 0.0038 0.0076 0.2581 0.0047 0.0094 2.9978 0.1325 0.2650 1298 85 170
79-5_B_mnz15* 3.8476 0.0767 0.1534 0.0980 0.0048 0.0096 0.2599 0.0052 0.0104 3.5122 0.1673 0.3346 1586 88 177
79-5_C_mnz5 3.8251 0.0632 0.1264 0.0912 0.0033 0.0066 0.2614 0.0043 0.0086 3.2869 0.1171 0.2342 1450 67 134
*rejected prior to generating concordia and weighted averages due to anomalously high or low age
Spreadsheet template provided by Rob Holm
315
Appendix D
: Monazite U
-Pb Data
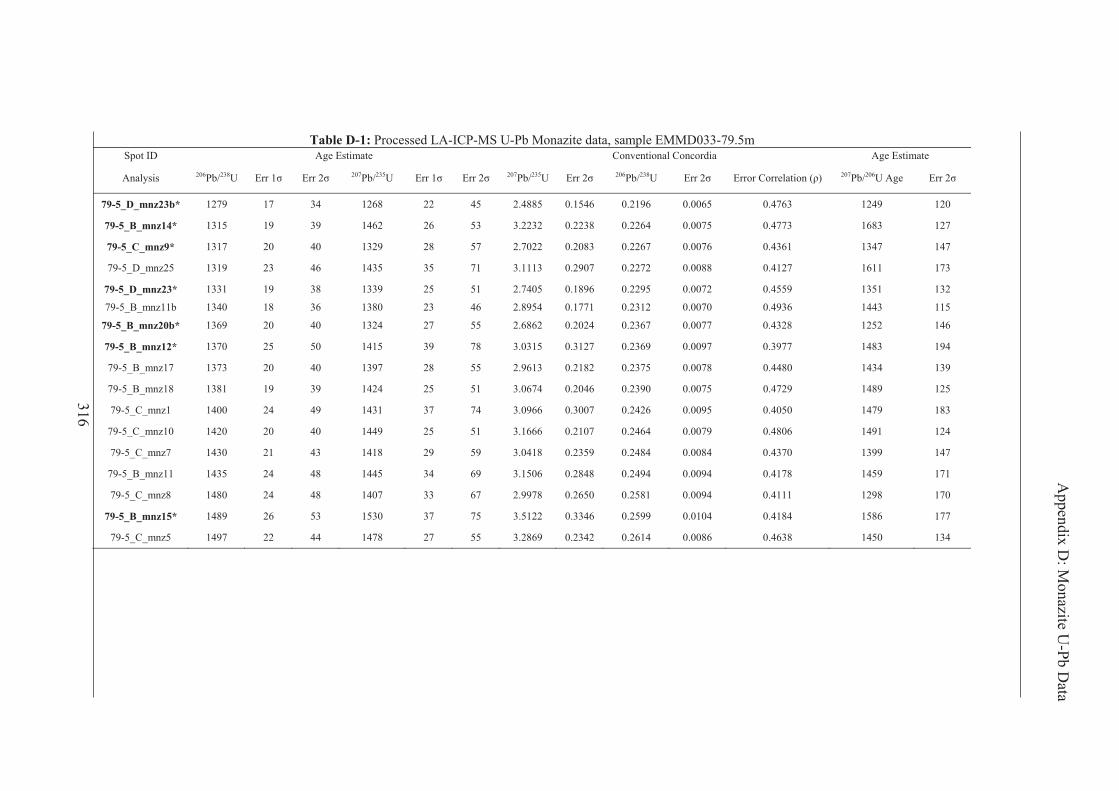
Table D-1: Processed LA-ICP-MS U-Pb Monazite data, sample EMMD033-79.5m etamitsE egA aidrocnoC lanoitnevnoC etamitsE egA DI topS
Analysis 206Pb/238U Err 1 Err 2 207Pb/235U Err 1 Err 2 207Pb/235U Err 2 206Pb/238U Err Error Correlation ( ) 207Pb/206U Age Err
79-5_D_mnz23b* 1279 17 34 1268 22 45 2.4885 0.1546 0.2196 0.0065 0.4763 1249 120
79-5_B_mnz14* 1315 19 39 1462 26 53 3.2232 0.2238 0.2264 0.0075 0.4773 1683 127
79-5_C_mnz9* 1317 20 40 1329 28 57 2.7022 0.2083 0.2267 0.0076 0.4361 1347 147
79-5_D_mnz25 1319 23 46 1435 35 71 3.1113 0.2907 0.2272 0.0088 0.4127 1611 173
79-5_D_mnz23* 1331 19 38 1339 25 51 2.7405 0.1896 0.2295 0.0072 0.4559 1351 132
79-5_B_mnz11b 1340 18 36 1380 23 46 2.8954 0.1771 0.2312 0.0070 0.4936 1443 115
79-5_B_mnz20b* 1369 20 40 1324 27 55 2.6862 0.2024 0.2367 0.0077 0.4328 1252 146
79-5_B_mnz12* 1370 25 50 1415 39 78 3.0315 0.3127 0.2369 0.0097 0.3977 1483 194
79-5_B_mnz17 1373 20 40 1397 28 55 2.9613 0.2182 0.2375 0.0078 0.4480 1434 139
79-5_B_mnz18 1381 19 39 1424 25 51 3.0674 0.2046 0.2390 0.0075 0.4729 1489 125
79-5_C_mnz1 1400 24 49 1431 37 74 3.0966 0.3007 0.2426 0.0095 0.4050 1479 183
79-5_C_mnz10 1420 20 40 1449 25 51 3.1666 0.2107 0.2464 0.0079 0.4806 1491 124
79-5_C_mnz7 1430 21 43 1418 29 59 3.0418 0.2359 0.2484 0.0084 0.4370 1399 147
79-5_B_mnz11 1435 24 48 1445 34 69 3.1506 0.2848 0.2494 0.0094 0.4178 1459 171
79-5_C_mnz8 1480 24 48 1407 33 67 2.9978 0.2650 0.2581 0.0094 0.4111 1298 170
79-5_B_mnz15* 1489 26 53 1530 37 75 3.5122 0.3346 0.2599 0.0104 0.4184 1586 177
79-5_C_mnz5 1497 22 44 1478 27 55 3.2869 0.2342 0.2614 0.0086 0.4638 1450 134
316
Appendix D
: Monazite U
-Pb Data
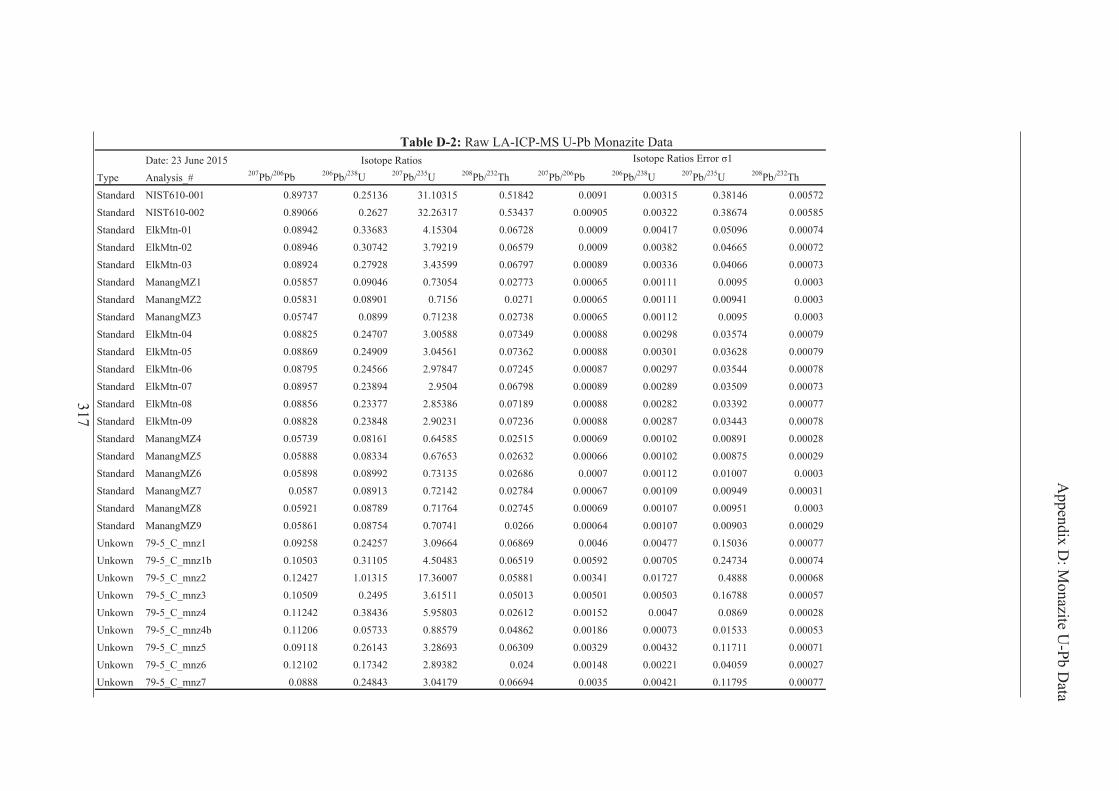
Date: 23 June 2015Type Analysis_# 207Pb/206Pb 206Pb/238U 207Pb/235U 208Pb/232Th 207Pb/206Pb 206Pb/238U 207Pb/235U 208Pb/232Th
Standard NIST610-001 0.89737 0.25136 31.10315 0.51842 0.0091 0.00315 0.38146 0.00572Standard NIST610-002 0.89066 0.2627 32.26317 0.53437 0.00905 0.00322 0.38674 0.00585Standard ElkMtn-01 0.08942 0.33683 4.15304 0.06728 0.0009 0.00417 0.05096 0.00074Standard ElkMtn-02 0.08946 0.30742 3.79219 0.06579 0.0009 0.00382 0.04665 0.00072Standard ElkMtn-03 0.08924 0.27928 3.43599 0.06797 0.00089 0.00336 0.04066 0.00073Standard ManangMZ1 0.05857 0.09046 0.73054 0.02773 0.00065 0.00111 0.0095 0.0003Standard ManangMZ2 0.05831 0.08901 0.7156 0.0271 0.00065 0.00111 0.00941 0.0003Standard ManangMZ3 0.05747 0.0899 0.71238 0.02738 0.00065 0.00112 0.0095 0.0003Standard ElkMtn-04 0.08825 0.24707 3.00588 0.07349 0.00088 0.00298 0.03574 0.00079Standard ElkMtn-05 0.08869 0.24909 3.04561 0.07362 0.00088 0.00301 0.03628 0.00079Standard ElkMtn-06 0.08795 0.24566 2.97847 0.07245 0.00087 0.00297 0.03544 0.00078Standard ElkMtn-07 0.08957 0.23894 2.9504 0.06798 0.00089 0.00289 0.03509 0.00073Standard ElkMtn-08 0.08856 0.23377 2.85386 0.07189 0.00088 0.00282 0.03392 0.00077Standard ElkMtn-09 0.08828 0.23848 2.90231 0.07236 0.00088 0.00287 0.03443 0.00078Standard ManangMZ4 0.05739 0.08161 0.64585 0.02515 0.00069 0.00102 0.00891 0.00028Standard ManangMZ5 0.05888 0.08334 0.67653 0.02632 0.00066 0.00102 0.00875 0.00029Standard ManangMZ6 0.05898 0.08992 0.73135 0.02686 0.0007 0.00112 0.01007 0.0003Standard ManangMZ7 0.0587 0.08913 0.72142 0.02784 0.00067 0.00109 0.00949 0.00031Standard ManangMZ8 0.05921 0.08789 0.71764 0.02745 0.00069 0.00107 0.00951 0.0003Standard ManangMZ9 0.05861 0.08754 0.70741 0.0266 0.00064 0.00107 0.00903 0.00029Unkown 79-5_C_mnz1 0.09258 0.24257 3.09664 0.06869 0.0046 0.00477 0.15036 0.00077Unkown 79-5_C_mnz1b 0.10503 0.31105 4.50483 0.06519 0.00592 0.00705 0.24734 0.00074Unkown 79-5_C_mnz2 0.12427 1.01315 17.36007 0.05881 0.00341 0.01727 0.4888 0.00068Unkown 79-5_C_mnz3 0.10509 0.2495 3.61511 0.05013 0.00501 0.00503 0.16788 0.00057Unkown 79-5_C_mnz4 0.11242 0.38436 5.95803 0.02612 0.00152 0.0047 0.0869 0.00028Unkown 79-5_C_mnz4b 0.11206 0.05733 0.88579 0.04862 0.00186 0.00073 0.01533 0.00053Unkown 79-5_C_mnz5 0.09118 0.26143 3.28693 0.06309 0.00329 0.00432 0.11711 0.00071Unkown 79-5_C_mnz6 0.12102 0.17342 2.89382 0.024 0.00148 0.00221 0.04059 0.00027Unkown 79-5_C_mnz7 0.0888 0.24843 3.04179 0.06694 0.0035 0.00421 0.11795 0.00077
Isotope RatiosTable D-2: Raw LA-ICP-MS U-Pb Monazite Data
317
Appendix D
: Monazite U
-Pb Data
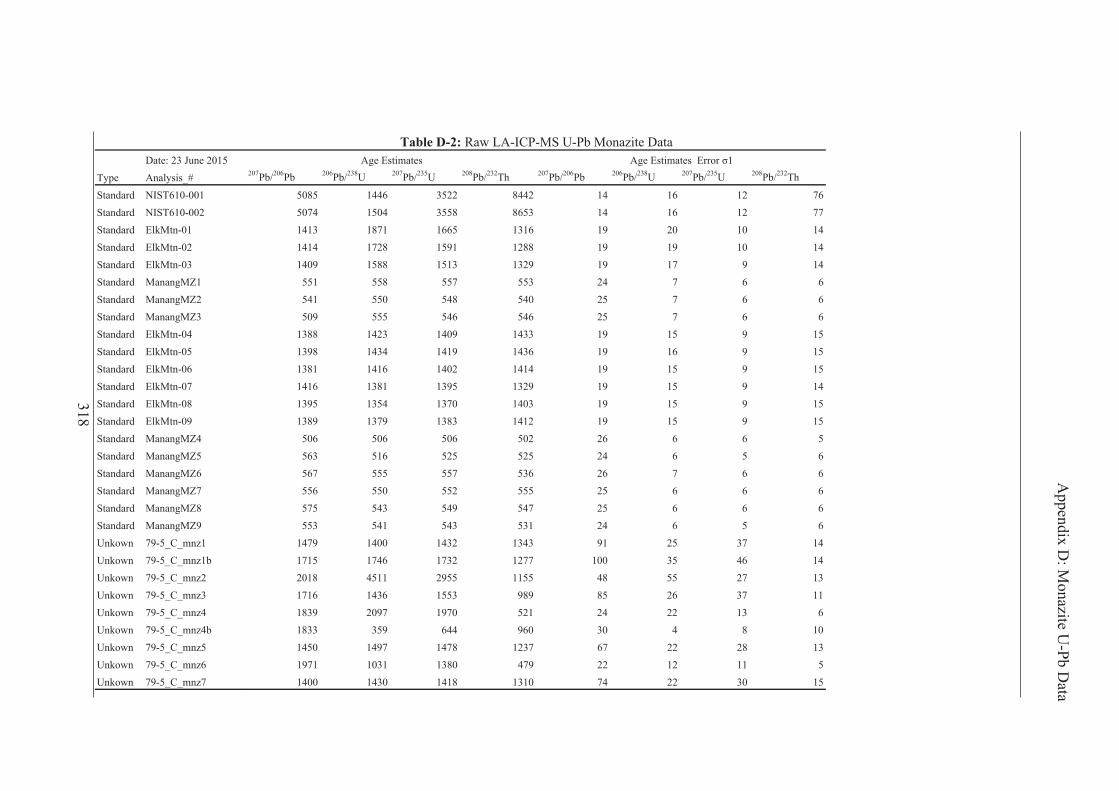
Date: 23 June 2015Type Analysis_#Standard NIST610-001Standard NIST610-002Standard ElkMtn-01Standard ElkMtn-02Standard ElkMtn-03Standard ManangMZ1Standard ManangMZ2Standard ManangMZ3Standard ElkMtn-04Standard ElkMtn-05Standard ElkMtn-06Standard ElkMtn-07Standard ElkMtn-08Standard ElkMtn-09Standard ManangMZ4Standard ManangMZ5Standard ManangMZ6Standard ManangMZ7Standard ManangMZ8Standard ManangMZ9Unkown 79-5_C_mnz1Unkown 79-5_C_mnz1bUnkown 79-5_C_mnz2Unkown 79-5_C_mnz3Unkown 79-5_C_mnz4Unkown 79-5_C_mnz4bUnkown 79-5_C_mnz5Unkown 79-5_C_mnz6Unkown 79-5_C_mnz7
207Pb/206Pb 206Pb/238U 207Pb/235U 208Pb/232Th 207Pb/206Pb 206Pb/238U 207Pb/235U 208Pb/232Th
5085 1446 3522 8442 14 16 12 765074 1504 3558 8653 14 16 12 771413 1871 1665 1316 19 20 10 141414 1728 1591 1288 19 19 10 141409 1588 1513 1329 19 17 9 14
551 558 557 553 24 7 6 6541 550 548 540 25 7 6 6509 555 546 546 25 7 6 6
1388 1423 1409 1433 19 15 9 151398 1434 1419 1436 19 16 9 151381 1416 1402 1414 19 15 9 151416 1381 1395 1329 19 15 9 141395 1354 1370 1403 19 15 9 151389 1379 1383 1412 19 15 9 15
506 506 506 502 26 6 6 5563 516 525 525 24 6 5 6567 555 557 536 26 7 6 6556 550 552 555 25 6 6 6575 543 549 547 25 6 6 6553 541 543 531 24 6 5 6
1479 1400 1432 1343 91 25 37 141715 1746 1732 1277 100 35 46 142018 4511 2955 1155 48 55 27 131716 1436 1553 989 85 26 37 111839 2097 1970 521 24 22 13 61833 359 644 960 30 4 8 101450 1497 1478 1237 67 22 28 131971 1031 1380 479 22 12 11 51400 1430 1418 1310 74 22 30 15
Table D-2: Raw LA-ICP-MS U-Pb Monazite DataAge Estimates
318
Appendix D
: Monazite U
-Pb Data
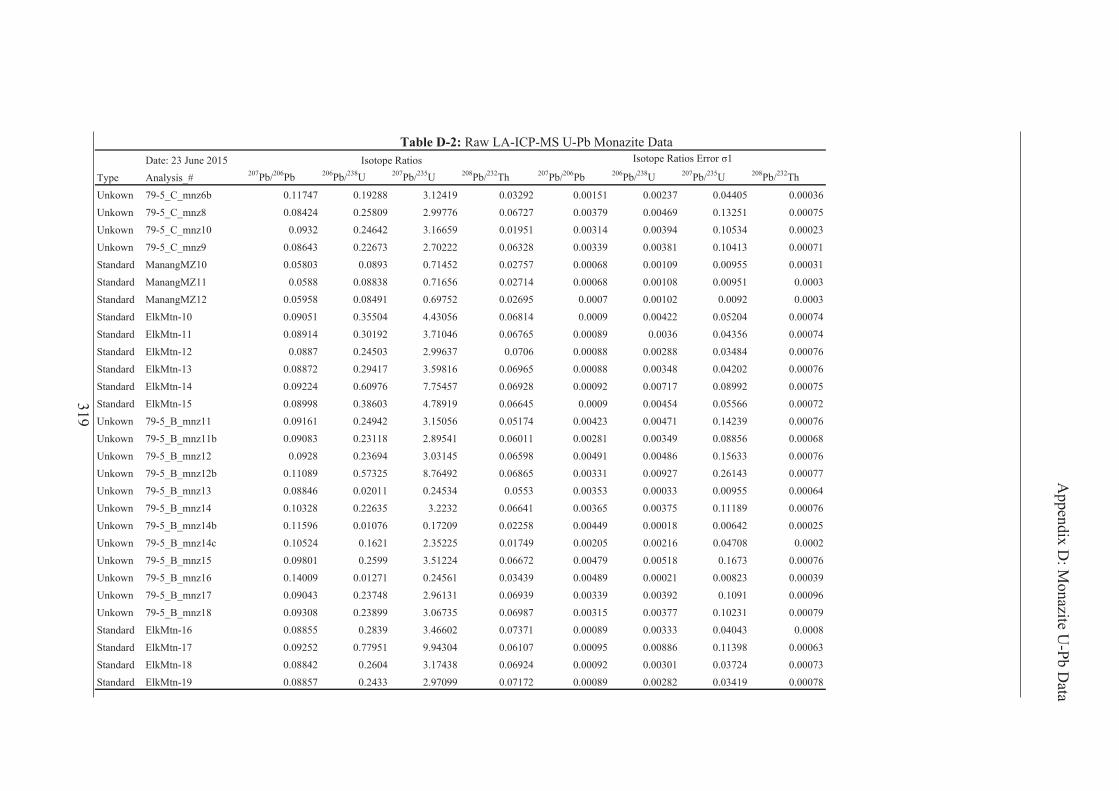
Date: 23 June 2015Type Analysis_# 207Pb/206Pb 206Pb/238U 207Pb/235U 208Pb/232Th 207Pb/206Pb 206Pb/238U 207Pb/235U 208Pb/232Th
Isotope RatiosTable D-2: Raw LA-ICP-MS U-Pb Monazite Data
Unkown 79-5_C_mnz6b 0.11747 0.19288 3.12419 0.03292 0.00151 0.00237 0.04405 0.00036Unkown 79-5_C_mnz8 0.08424 0.25809 2.99776 0.06727 0.00379 0.00469 0.13251 0.00075Unkown 79-5_C_mnz10 0.0932 0.24642 3.16659 0.01951 0.00314 0.00394 0.10534 0.00023Unkown 79-5_C_mnz9 0.08643 0.22673 2.70222 0.06328 0.00339 0.00381 0.10413 0.00071Standard ManangMZ10 0.05803 0.0893 0.71452 0.02757 0.00068 0.00109 0.00955 0.00031Standard ManangMZ11 0.0588 0.08838 0.71656 0.02714 0.00068 0.00108 0.00951 0.0003Standard ManangMZ12 0.05958 0.08491 0.69752 0.02695 0.0007 0.00102 0.0092 0.0003Standard ElkMtn-10 0.09051 0.35504 4.43056 0.06814 0.0009 0.00422 0.05204 0.00074Standard ElkMtn-11 0.08914 0.30192 3.71046 0.06765 0.00089 0.0036 0.04356 0.00074Standard ElkMtn-12 0.0887 0.24503 2.99637 0.0706 0.00088 0.00288 0.03484 0.00076Standard ElkMtn-13 0.08872 0.29417 3.59816 0.06965 0.00088 0.00348 0.04202 0.00076Standard ElkMtn-14 0.09224 0.60976 7.75457 0.06928 0.00092 0.00717 0.08992 0.00075Standard ElkMtn-15 0.08998 0.38603 4.78919 0.06645 0.0009 0.00454 0.05566 0.00072Unkown 79-5_B_mnz11 0.09161 0.24942 3.15056 0.05174 0.00423 0.00471 0.14239 0.00076Unkown 79-5_B_mnz11b 0.09083 0.23118 2.89541 0.06011 0.00281 0.00349 0.08856 0.00068Unkown 79-5_B_mnz12 0.0928 0.23694 3.03145 0.06598 0.00491 0.00486 0.15633 0.00076Unkown 79-5_B_mnz12b 0.11089 0.57325 8.76492 0.06865 0.00331 0.00927 0.26143 0.00077Unkown 79-5_B_mnz13 0.08846 0.02011 0.24534 0.0553 0.00353 0.00033 0.00955 0.00064Unkown 79-5_B_mnz14 0.10328 0.22635 3.2232 0.06641 0.00365 0.00375 0.11189 0.00076Unkown 79-5_B_mnz14b 0.11596 0.01076 0.17209 0.02258 0.00449 0.00018 0.00642 0.00025Unkown 79-5_B_mnz14c 0.10524 0.1621 2.35225 0.01749 0.00205 0.00216 0.04708 0.0002Unkown 79-5_B_mnz15 0.09801 0.2599 3.51224 0.06672 0.00479 0.00518 0.1673 0.00076Unkown 79-5_B_mnz16 0.14009 0.01271 0.24561 0.03439 0.00489 0.00021 0.00823 0.00039Unkown 79-5_B_mnz17 0.09043 0.23748 2.96131 0.06939 0.00339 0.00392 0.1091 0.00096Unkown 79-5_B_mnz18 0.09308 0.23899 3.06735 0.06987 0.00315 0.00377 0.10231 0.00079Standard ElkMtn-16 0.08855 0.2839 3.46602 0.07371 0.00089 0.00333 0.04043 0.0008Standard ElkMtn-17 0.09252 0.77951 9.94304 0.06107 0.00095 0.00886 0.11398 0.00063Standard ElkMtn-18 0.08842 0.2604 3.17438 0.06924 0.00092 0.00301 0.03724 0.00073Standard ElkMtn-19 0.08857 0.2433 2.97099 0.07172 0.00089 0.00282 0.03419 0.00078
319
Appendix D
: Monazite U
-Pb Data
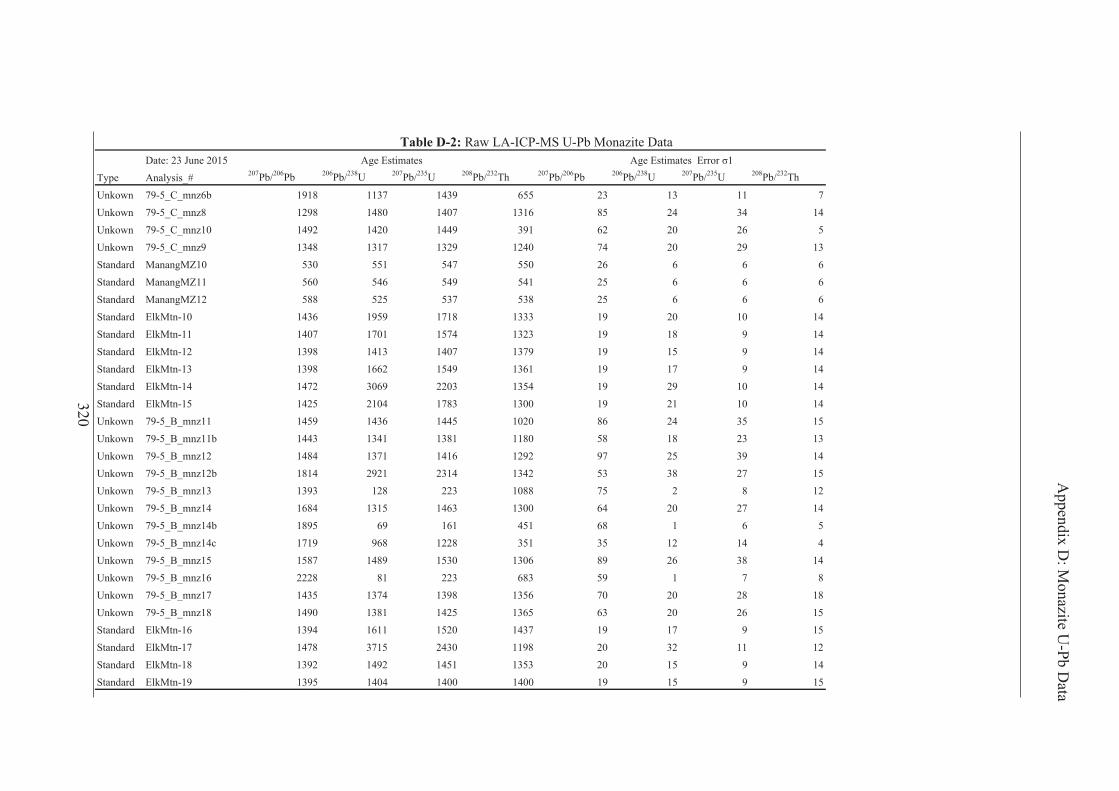
Date: 23 June 2015Type Analysis_#Unkown 79-5_C_mnz6bUnkown 79-5_C_mnz8Unkown 79-5_C_mnz10Unkown 79-5_C_mnz9Standard ManangMZ10Standard ManangMZ11Standard ManangMZ12Standard ElkMtn-10Standard ElkMtn-11Standard ElkMtn-12Standard ElkMtn-13Standard ElkMtn-14Standard ElkMtn-15Unkown 79-5_B_mnz11Unkown 79-5_B_mnz11bUnkown 79-5_B_mnz12Unkown 79-5_B_mnz12bUnkown 79-5_B_mnz13Unkown 79-5_B_mnz14Unkown 79-5_B_mnz14bUnkown 79-5_B_mnz14cUnkown 79-5_B_mnz15Unkown 79-5_B_mnz16Unkown 79-5_B_mnz17Unkown 79-5_B_mnz18Standard ElkMtn-16Standard ElkMtn-17Standard ElkMtn-18Standard ElkMtn-19
207Pb/206Pb 206Pb/238U 207Pb/235U 208Pb/232Th 207Pb/206Pb 206Pb/238U 207Pb/235U 208Pb/232Th
Table D-2: Raw LA-ICP-MS U-Pb Monazite DataAge Estimates
1918 1137 1439 655 23 13 11 71298 1480 1407 1316 85 24 34 141492 1420 1449 391 62 20 26 51348 1317 1329 1240 74 20 29 13
530 551 547 550 26 6 6 6560 546 549 541 25 6 6 6588 525 537 538 25 6 6 6
1436 1959 1718 1333 19 20 10 141407 1701 1574 1323 19 18 9 141398 1413 1407 1379 19 15 9 141398 1662 1549 1361 19 17 9 141472 3069 2203 1354 19 29 10 141425 2104 1783 1300 19 21 10 141459 1436 1445 1020 86 24 35 151443 1341 1381 1180 58 18 23 131484 1371 1416 1292 97 25 39 141814 2921 2314 1342 53 38 27 151393 128 223 1088 75 2 8 121684 1315 1463 1300 64 20 27 141895 69 161 451 68 1 6 51719 968 1228 351 35 12 14 41587 1489 1530 1306 89 26 38 142228 81 223 683 59 1 7 81435 1374 1398 1356 70 20 28 181490 1381 1425 1365 63 20 26 151394 1611 1520 1437 19 17 9 151478 3715 2430 1198 20 32 11 121392 1492 1451 1353 20 15 9 141395 1404 1400 1400 19 15 9 15
320
Appendix D
: Monazite U
-Pb Data

Date: 23 June 2015Type Analysis_# 207Pb/206Pb 206Pb/238U 207Pb/235U 208Pb/232Th 207Pb/206Pb 206Pb/238U 207Pb/235U 208Pb/232Th
Isotope RatiosTable D-2: Raw LA-ICP-MS U-Pb Monazite Data
Standard ElkMtn-20 0.08968 0.27946 3.45551 0.07016 0.00092 0.00323 0.04013 0.00075Standard ElkMtn-21 0.12477 3.60174 61.96347 0.07005 0.00129 0.04234 0.73564 0.00076Standard ManangMZ13 0.05826 0.08954 0.71935 0.02752 0.00064 0.00105 0.00895 0.0003Standard ManangMZ14 0.05891 0.08701 0.70673 0.02717 0.00068 0.00103 0.00911 0.0003Standard ManangMZ15 0.05892 0.08558 0.69527 0.02687 0.00068 0.00102 0.00902 0.0003Unkown 79-5_B_mnz20 0.0989 0.25424 3.46689 0.06271 0.00401 0.00445 0.13761 0.00073Unkown 79-5_B_mnz20b 0.08229 0.23674 2.68624 0.06166 0.00315 0.00386 0.1012 0.00071Unkown 79-5_B_mnz19 0.12338 0.6608 11.24054 0.07349 0.00478 0.01291 0.43069 0.00084Unkown 79-5_B_mnz22 0.08135 0.18567 2.0823 0.02185 0.0051 0.00401 0.12714 0.00027Unkown 79-5_B_mnz22b 0.09412 0.19882 2.57992 0.03918 0.0041 0.00356 0.10956 0.00046Unkown 79-5_D_mnz23 0.08661 0.22951 2.74053 0.06576 0.00304 0.00362 0.09481 0.00077Unkown 79-5_D_mnz23b 0.08218 0.21961 2.48847 0.06105 0.00258 0.00325 0.07732 0.0007Unkown 79-5_D_mnz24 0.54398 -1.07872 -80.87154 0.08476 0.24783 1.33594 102.07291 0.02406Unkown 79-5_D_mnz25 0.09933 0.22719 3.11133 0.06649 0.00477 0.00438 0.14533 0.00077Standard ElkMtn-22 0.09228 0.64215 8.17134 0.06221 0.00093 0.00737 0.09308 0.00068Standard ElkMtn-23 0.08839 0.239 2.9129 0.07168 0.00089 0.00274 0.03324 0.00078Standard ElkMtn-24 0.08812 0.25458 3.09304 0.07252 0.00092 0.00294 0.0364 0.00078Standard ManangMZ16 0.05867 0.08722 0.70556 0.02746 0.00068 0.00103 0.00906 0.00031
321
Appendix D
: Monazite U
-Pb Data
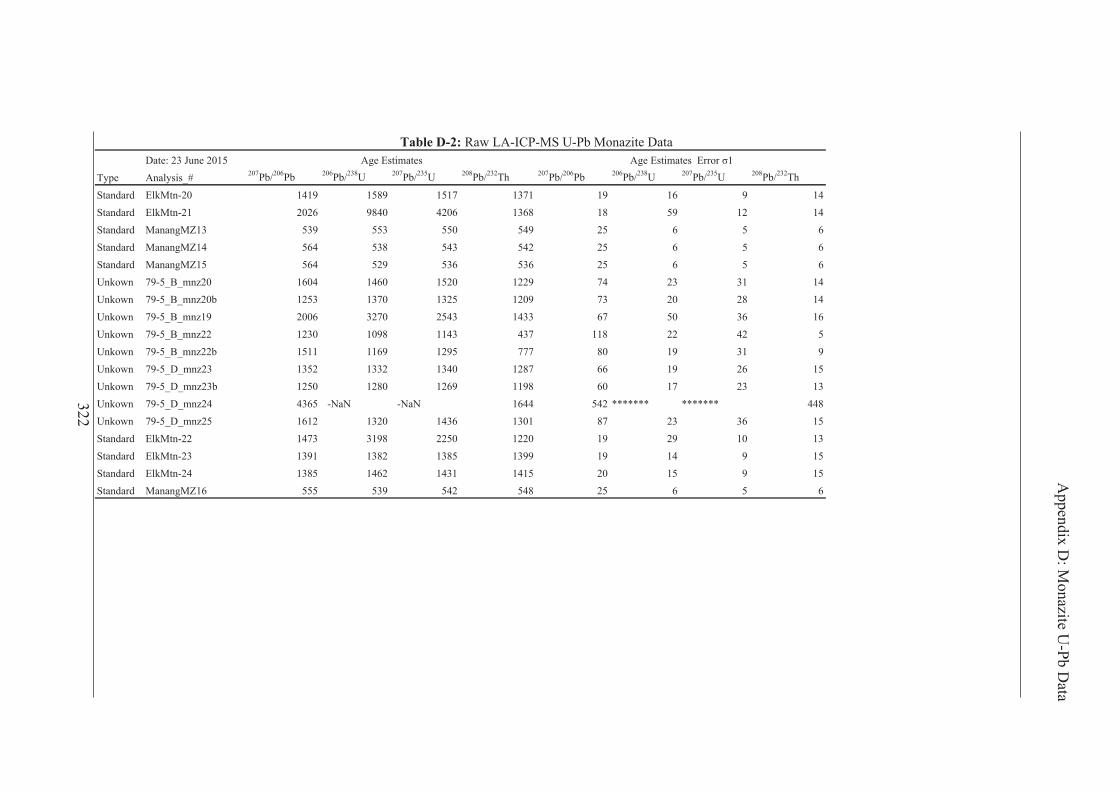
Date: 23 June 2015Type Analysis_#Standard ElkMtn-20Standard ElkMtn-21Standard ManangMZ13Standard ManangMZ14Standard ManangMZ15Unkown 79-5_B_mnz20Unkown 79-5_B_mnz20bUnkown 79-5_B_mnz19Unkown 79-5_B_mnz22Unkown 79-5_B_mnz22bUnkown 79-5_D_mnz23Unkown 79-5_D_mnz23bUnkown 79-5_D_mnz24Unkown 79-5_D_mnz25Standard ElkMtn-22Standard ElkMtn-23Standard ElkMtn-24Standard ManangMZ16
207Pb/206Pb 206Pb/238U 207Pb/235U 208Pb/232Th 207Pb/206Pb 206Pb/238U 207Pb/235U 208Pb/232Th
Table D-2: Raw LA-ICP-MS U-Pb Monazite DataAge Estimates
1419 1589 1517 1371 19 16 9 142026 9840 4206 1368 18 59 12 14
539 553 550 549 25 6 5 6564 538 543 542 25 6 5 6564 529 536 536 25 6 5 6
1604 1460 1520 1229 74 23 31 141253 1370 1325 1209 73 20 28 142006 3270 2543 1433 67 50 36 161230 1098 1143 437 118 22 42 51511 1169 1295 777 80 19 31 91352 1332 1340 1287 66 19 26 151250 1280 1269 1198 60 17 23 134365 -NaN -NaN 1644 542 ******* ******* 4481612 1320 1436 1301 87 23 36 151473 3198 2250 1220 19 29 10 131391 1382 1385 1399 19 14 9 151385 1462 1431 1415 20 15 9 15
555 539 542 548 25 6 5 6
322
Appendix D
: Monazite U
-Pb Data
Appendix E Leapfrog Modeling Database
323
Data Summary The geological and geochemical models developed in Leapfrog and discussed in
Chapter 3 can be accessed digitally in the disc accompanying this volume. The Leapfrog
modeling methodology is outlined below. The base lithology, alteration and structure
codes used to log the diamond drill holes and build the geology database are shown in
Table E-1. Drill core structural measurements are shown in Table E-2. All drill core
measurements were made using a goniometer on oriented core. Dip and dip direction
were calculated using GeoCalculator (developed by R. Holcombe). Following the
structural data is a geologic map of the E1 North open pit, and then logs of the 23
physically-logged diamond holes. Lastly, summary statistics (Table E-3) and probability
plots of elements modeled in Chapter 3 are shown. To model the E1 Group geology,
the base rock type codes were grouped into simplified stratigraphic units. The base
codes are classified solely on the rock type, and not on stratigraphic level; thus, many of
the codes are included in multiple units. The groupings can be viewed visually in
Leapfrog. The log database is available as a CSV file on the disc.
File names:
Appendix_E_logs_DIGITAL.csv
Appendix_E_probability_plots_DIGITAL.pdf
E1_Group_Geological_Model.lfview
Leapfrog Geological and Geochemical Modeling Methodology Modeling Faults and Geological Boundary Surfaces An idealized workflow for creating a geological model in Leapfrog Geo can be
summarized as follows. First, the X, Y, and Z extents of model must be defined. Next,
3-D surfaces must be generated for every geological contact in the model, and these
surfaces comprise the Surface Chronology. Thirdly, if faults are present, the model must
be subdomained into faulted blocks in order to model offset. Each fault block inherits
the same surface chronology surfaces, and their parameters, from the parent model, but
is treated as structurally independent from the other fault blocks. Finally, if necessary,
the surfaces in each fault block are individually adjusted to reflect structural trends
324
Appendix E: Leapfrog Modeling Database
within that fault block. With the exception of surfaces forming a stratigraphic sequence,
each geological boundary is modeled independently of other boundaries, which may
result in intersecting surfaces. Once the modeled surfaces are activated and the user has
specified their timing relationships, volumes between each surface are automatically
generated and the cross-cutting relationships are honored.
Multiple types of surfaces may be modeled in Leapfrog, depending on the abstract
nature of the contact being modeled, and include Intrusion, Deposit, Erosion, and
Stratigraphic Sequence. For example, consider two conformable sedimentary (or
volcanic) lithologies, A and B (A being older), which are intruded by granite. The
contact surface between A and B can be modeled as a deposit by specifying B as the
‘primary’ lithology (deposited on top of A) and modeling all contacts with A that are
below B. Such contacts are transformed into points which then define a surface.
Intervals of A are ‘avoided’ by the software, which prevents the surface from crossing
through the interval. Other contacts between lithology B and the younger granite are
ignored, which permits the surface to intersect granite intervals. To model the granite
intrusion, Leapfrog interpolates positive numerical values (increasing inward) for the
interior of the intrusion, and negative values (becoming more negative outward) for the
exterior. An intrusive contact surface is generated where the numerical values converge
to zero. Interpolation of intrusions is similar to numerical (grade) interpolation (see next
section) and can be adjusted with the same parameters (e.g. range). Both intrusive and
deposit surfaces can be manually adjusted with polyline digitization if the initial
modeled surface is not geologically reasonable. The A-B contact will intersect the
intrusion surface, but the volume of the intrusion which overlaps with the volumes of
lithologies A and B will be subtracted from the A and B volumes for the final model
output. In the case of unconformable contacts, an ‘Erosion’ surface can be modeled in a
similar manner to a depositional surface. However, lithologies older than the primary
lithology will be truncated at the unconformity surface when the output volumes are
generated. Systems characterized by continuous or partially-continuous layering can be
modeled as a Stratigraphic Sequence. The surfaces of each stratigraphic unit are
modeled in similar manner to Deposit surfaces, but the software maintains parallel
topology between the surfaces and does not allow them to intersect. The Stratigraphic
Sequence surface type is thus well-suited to folded systems if continuity is reasonable.
As is the case for this study, lithologies can be grouped to reduce complexity. Fault
325
Appendix E: Leapfrog Modeling Database
offset can be modeled by applying fault block boundary filters to surfaces such that they
are not affected by data outside the fault block.
Modeling grade distribution Leapfrog Geo utilizes Fast Radial Basis Functions (RBF) to interpolate numerical data
for implicit modeling of element grade shells (Cowan et al., 2003). Stewart et al. (2014)
have demonstrated that, although less statistically robust, Fast-RBF can produce
comparable results to ordinary and dual kriging, but in far less computational time. Such
speed enables further refinement of the model in reasonable timeframes (hours or days).
The aim of this study was to gain insight into the structural geometry and alteration
patterns of the E1 Group by modeling the spatial distribution of various elements in the
hydrothermal system. The shells presented in this study were not used for resource
estimation.
To interpolate using Fast-RBF, the user must specify the model drift (linear or
constant), RBF interpolation type (linear or spheroidal), and trend (isotropic or
anisotropic). The detailed nature of these parameters is discussed in Stewart et al.
(2014). For most ore deposits, a spheroidal RBF is much more geologically realistic
than a linear RBF, and as such a spheroidal model was used for all interpolants in this
study, including the initial model. Once the interpolation has been computed, grade
shells are generated as isosurfaces of user-specified value. Depending on the nature of
ore deposit (i.e. timing relative to faulting), interpolated grade shells can be modeled
either independently of or dependent on the geological model volumes and fault blocks.
If modeled dependently, the interpolant is subdomained into each geological volume or
fault block, allowing parameters to be individually specified in within each subdomain.
References
Cowan, E., Beatson, R., Ross, H., Fright, W., McLennan, T., Evans, T. and Titley, M., (2003). Practical implicit geological modelling: in: Fifth International Mining Geology Conference Proceedings, Bendigo, VIC, Australia, Nov 17-19 2003, p.89–99. https://www.ausimm.com.au/publications/publication.aspx?ID=188.
Stewart, M., de Lacey, J., Hodkiewicz, P.F. and Lane, R., (2014). Grade Estimation from Radial Basis Functions – How Does it Compare with Conventional Geostatistical Estimation?: in Ninth International Mining Geology Conference. Adelaide, Australia, p.129–139.
326
Appendix E: Leapfrog Modeling Database

Table E-1: Leapfrog Modeling Codes Lith Code Description HBREC discordant breccia; polymict, red-altered, unfoliated clasts PVOLC porphyritic cohesive meta-andesite CPVOLC coarse porphyritic cohesive meta-andesite (phenocrysts >1.5cm) SCPVOLC heavily altered and sheared?/ brecciated CPVOLC MVOLC massive cohesive meta-andesite QVOLC massive meta-andesite? With wavy quartz veins AVOLC amygdaloidal cohesive meta-andesite
BVOLC volcanic flow-top breccia/autobreccia??; defining characteristic is a "psuedo-breccia"-like appearance main difference between this and "BTUFF" - BTUFF has clear "islands" of material, representing clasts
PMSILT porphyroblastic calcareous siliclastic rock (needle-like porphyroblasts) DIOR diorite MDOL metadolerite PSAM psammite UBREC silicified metavolcanic breccia?; unfoliated, variable alteration; red-carb-dark; subangular; UNKN indeteriminant from core photos VEIN major carbonate vein SVEIN major silicate vein (feldspar or quartz) VBREC calcite infill breccia/vein CBREC carbonate-mtx subanular breccia (type interval 362-363m EMMD052) FBREC suspected fault breccia AMPH amphibolite (type interval in EMMD174) SVOLC sheared metavolcaniclastic rocks (defined by lenticular fabrics/banding, especially if amygdales present); marble may be intercalated CBVOLC relatively less-sheared or intact metavolcanic rocks with large-scale (> drill core width) "clasts" or "islands forming a clast-supported breccia-like texture SBVOLC same as BVOLC, but in cases where shearing is less than "SVOLC" and breccia-like texture is still visible USED undifferentiated coarse-grained metasediments/volcaniclastics (defined by regular to sub-regular layering) SHEAR undifferentiated sheared metasediments/volcanics (used where no clasts visible, layering is discontinuous and protolith cannot be surmised) MARB undifferentiated marble; used if it has continuous layering and is whitish (indicating high carbonate content) PMARB porphyroblastic marble; used if porphyroblasts are visible MSILT undifferentiated fine-grained metasediments; dark brown; continuous layering BSHAL carbonaceous schist; dark grey - black; highly-deformed and interlaminated w/ qtz-py-rich layers BTUFF refers to the metavolcanic breccia/conglomeratic unit in E1 South and Central sandwhiched between marble/seds; also present at E1 North DAVOLC heavily altered/deformed amygdaloidal metavolcanic basal unit below main marble horizon SAVOLC heavily sheared amygdaloidal? Meta-andesite; highly altered; type section EMMD032 and EMMD029 DSED heavily deformed layered metasediment; possibly some kind of breccia? Zones variably oriented; localized unit - marker bed?
327 Appendix E: Leapfrog M
odeling Database

Table E-1: Leapfrog Modeling Codes Alteration (not modelled in text due to paucity of data)
detanimod - K ro aC-aN dermag magnetite-dominated
detanimod-ediflus-gam eroredore sulf-mag overprinting substantial red alteration redint intense widespread red alteration carb intense carbonate veining weath weathered zone redsil siliceous red-gray alteration magred red alteration overprinted by magnetite+sulfide magapa magnetite-pyrite-apatite fspr slightly pink-red fpsr, but not fully hematite-stained
Faults/weathering minor core breakage and minor weathering high more core breakage and high weathering, but intact intense core mostly disentigrated extreme core mostly altered to clay complete complete clay alteration and disentigration
Veins low <5% area moderate 5-10% area high 10-20% very high >20
328 Appendix E: Leapfrog M
odeling Database
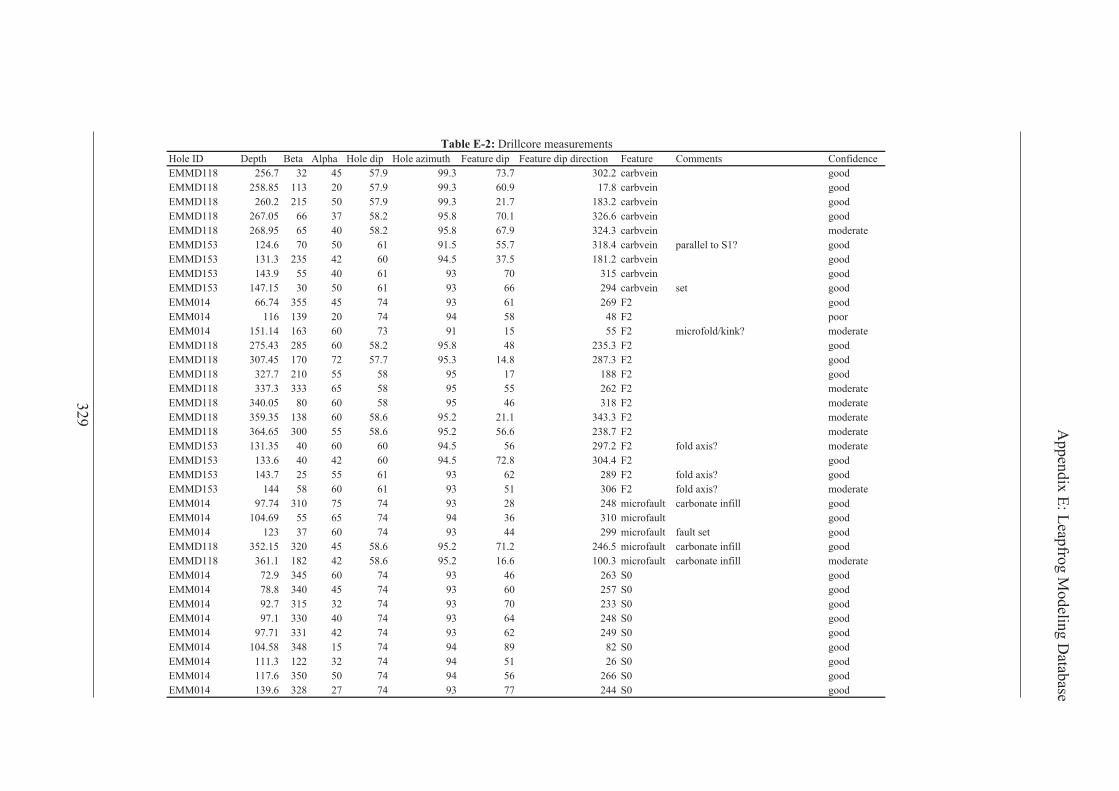
Hole ID Depth Beta Alpha Hole dip Hole azimuth Feature dip Feature dip direction Feature Comments Confidencedoognievbrac2.2037.373.999.7554237.652811DMMEdoognievbrac8.719.063.999.750231158.852811DMMEdoognievbrac2.3817.123.999.75055122.062811DMMEdoognievbrac6.6231.078.592.85736650.762811DMME
etaredomnievbrac3.4239.768.592.85045659.862811DMMEEMMD153 124.6 70 50 61 91.5 55.7 318.4 carbvein parallel to S1? good
doognievbrac2.1815.735.4906245323.131351DMMEdoognievbrac51307391604559.341351DMMEdoogtesnievbrac492663916050351.741351DMMEdoog2F9621639475455347.66410MMEroop2F8485494702931611410MME
EMM014 151.14 163 60 73 91 15 55 F2 microfold/kink? moderatedoog2F3.532848.592.850658234.572811DMMEdoog2F3.7828.413.597.752707154.703811DMMEdoog2F881715985550127.723811DMME
etaredom2F262555985563333.733811DMMEetaredom2F813645985060850.043811DMMEetaredom2F3.3431.122.596.850683153.953811DMMEetaredom2F7.8326.652.596.855500356.463811DMMEetaredom?sixa dlof2F2.792655.4906060453.131351DMME
doog2F4.4038.275.490624046.331351DMMEdoog?sixa dlof2F98226391655527.341351DMME
etaredom?sixa dlof2F6031539160685441351DMMEEMM014 97.74 310 75 74 93 28 248 microfault carbonate infill good
doogtluaforcim013634947565596.401410MMEdoogtes tluaftluaforcim9924439470673321410MME
EMMD118 352.15 320 45 58.6 95.2 71.2 246.5 microfault carbonate infill goodEMMD118 361.1 182 42 58.6 95.2 16.6 100.3 microfault carbonate infill moderate
doog0S362643947065439.27410MMEdoog0S752063947540438.87410MMEdoog0S332073947235137.29410MMEdoog0S842463947040331.79410MMEdoog0S9422639472413317.79410MMEdoog0S289849475184385.401410MMEdoog0S62154947232213.111410MMEdoog0S662654947050536.711410MMEdoog0S442773947728236.931410MME
Table E-2: Drillcore measurements
329 Appendix E: Leapfrog M
odeling Database
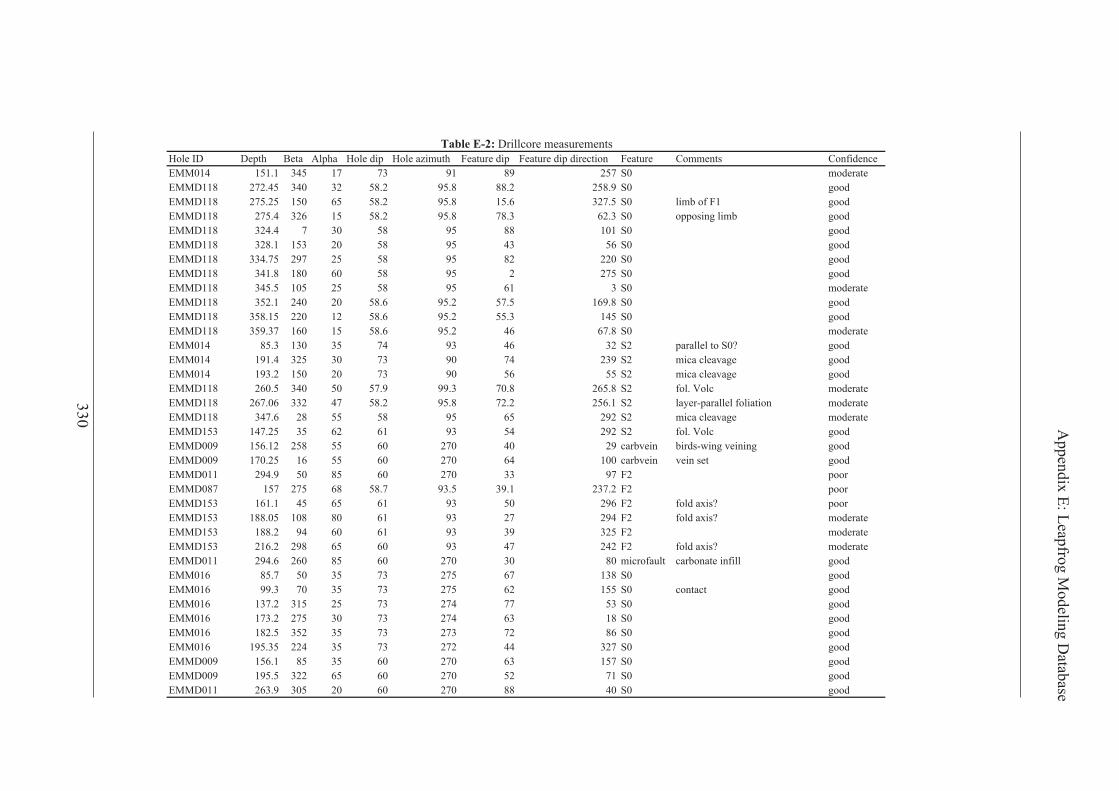
Hole ID Depth Beta Alpha Hole dip Hole azimuth Feature dip Feature dip direction Feature Comments ConfidenceTable E-2: Drillcore measurements
etaredom0S752981937715431.151410MMEdoog0S9.8522.888.592.852304354.272811DMMEdoog1F fo bmil0S5.7236.518.592.855605152.572811DMME
EMMD118 275.4 326 15 58.2 95.8 78.3 62.3 S0 opposing limb gooddoog0S1018859850374.423811DMMEdoog0S65345985023511.823811DMMEdoog0S0222859855279257.433811DMMEdoog0S57225985060818.143811DMME
etaredom0S3165985525015.543811DMMEdoog0S8.9615.752.596.85020421.253811DMMEdoog0S5413.552.596.852102251.853811DMME
etaredom0S8.76642.596.855106173.953811DMMEEMM014 85.3 130 35 74 93 46 32 S2 parallel to S0? goodEMM014 191.4 325 30 73 90 74 239 S2 mica cleavage goodEMM014 193.2 150 20 73 90 56 55 S2 mica cleavage good
etaredomcloV .lof2S8.5628.073.999.75050435.062811DMMEEMMD118 267.06 332 47 58.2 95.8 72.2 256.1 S2 layer-parallel foliation moderateEMMD118 347.6 28 55 58 95 65 292 S2 mica cleavage moderate
doogcloV .lof2S292453916265352.741351DMMEEMMD009 156.12 258 55 60 270 40 29 carbvein birds-wing veining good
doogtes nievnievbrac0014607206556152.071900DMMEroop2F79330720658059.492110DMMEroop2F2.7321.935.397.8586572751780DMMEroop?sixa dlof2F69205391656541.161351DMME
etaredom?sixa dlof2F4927239160880150.881351DMMEetaredom2F52393391606492.881351DMMEetaredom?sixa dlof2F242743906568922.612351DMME
EMMD011 294.6 260 85 60 270 30 80 microfault carbonate infill gooddoog0S831765723753057.58610MMEdoogtcatnoc0S551265723753073.99610MMEdoog0S357747237525132.731610MMEdoog0S813647237035722.371610MMEdoog0S682737237532535.281610MMEdoog0S72344272375342253.591610MMEdoog0S751360720653581.651900DMMEdoog0S172507206562235.591900DMMEdoog0S048807206025039.362110DMME
330 Appendix E: Leapfrog M
odeling Database
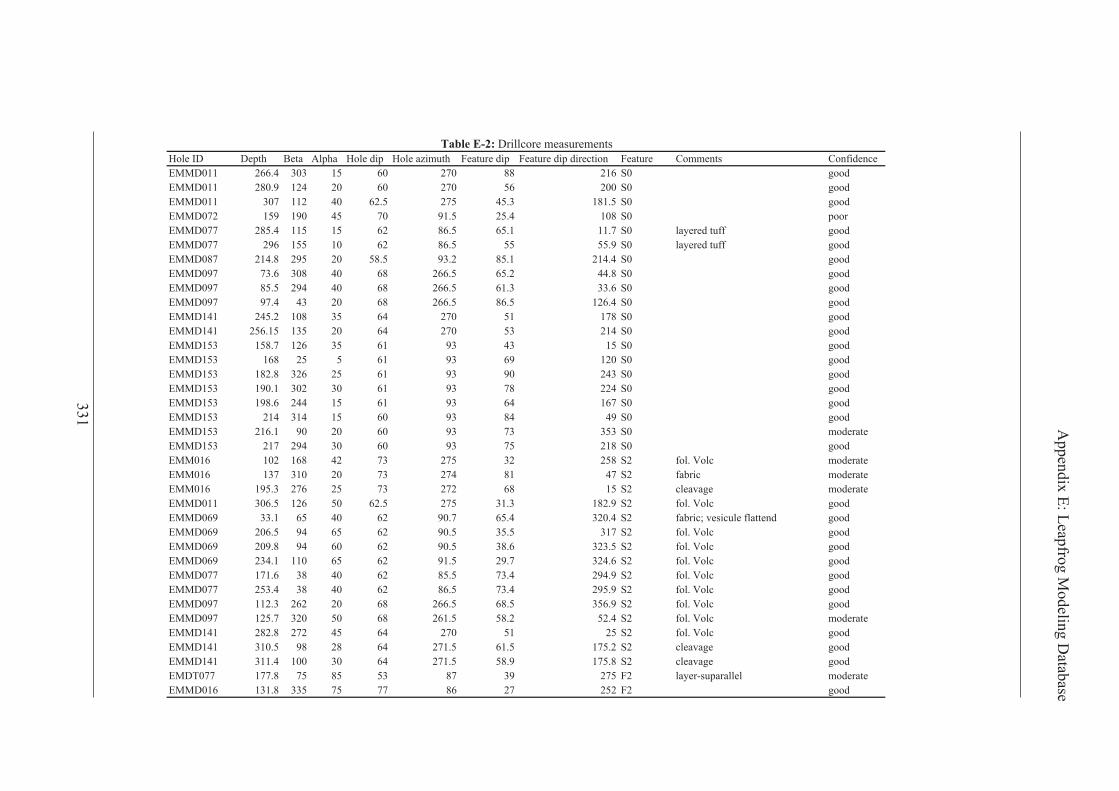
Hole ID Depth Beta Alpha Hole dip Hole azimuth Feature dip Feature dip direction Feature Comments ConfidenceTable E-2: Drillcore measurements
doog0S6128807206513034.662110DMMEdoog0S0026507206024219.082110DMMEdoog0S5.1813.545725.2604211703110DMMEroop0S8014.525.190754091951270DMME
EMMD077 285.4 115 15 62 86.5 65.1 11.7 S0 layered tuff goodEMMD077 296 155 10 62 86.5 55 55.9 S0 layered tuff good
doog0S4.4121.582.395.85025928.412780DMMEdoog0S8.442.565.66286048036.37790DMMEdoog0S6.333.165.66286044925.58790DMMEdoog0S4.6215.685.6628602344.79790DMMEdoog0S8711507246538012.542141DMMEdoog0S41235072460253151.652141DMMEdoog0S51343916536217.851351DMMEdoog0S021963916552861351DMMEdoog0S342093916526238.281351DMMEdoog0S422873916032031.091351DMMEdoog0S761463916514426.891351DMMEdoog0S9448390651413412351DMME
etaredom0S35337390602091.612351DMMEdoog0S81257390603492712351DMME
etaredomcloV .lof2S852235723724861201610MMEetaredomcirbaf2S74184723702013731610MMEetaredomegavaelc2S518627237526723.591610MME
doogcloV .lof2S9.2813.135725.26056215.603110DMMEEMMD069 33.1 65 40 62 90.7 65.4 320.4 S2 fabric; vesicule flattend good
doogcloV .lof2S7135.535.092656495.602960DMMEdoogcloV .lof2S5.3236.835.092606498.902960DMMEdoogcloV .lof2S6.4237.925.1926560111.432960DMMEdoogcloV .lof2S9.4924.375.582604836.171770DMMEdoogcloV .lof2S9.5924.375.682604834.352770DMMEdoogcloV .lof2S9.6535.865.66286022623.211790DMME
etaredomcloV .lof2S4.252.855.16286050237.521790DMMEdoogcloV .lof2S521507246542728.282141DMMEdoogegavaelc2S2.5715.165.1724682895.013141DMMEdoogegavaelc2S8.5719.855.17246030014.113141DMME
EMDT077 177.8 75 85 53 87 39 275 F2 layer-suparallel moderatedoog2F252726877575338.131610DMME
331 Appendix E: Leapfrog M
odeling Database

Hole ID Depth Beta Alpha Hole dip Hole azimuth Feature dip Feature dip direction Feature Comments ConfidenceTable E-2: Drillcore measurements
doog2F332426877570032.331610DMMEEMMD040 39 100 80 75 174 16 31 F2 parallel to S0? poor
dooggnireyal0S242767835558137.771770TDMEEMM014 148.6 340 30 73 91 76 253 S0 x-beds; younging? good
doog0S6911607206718115.842110DMMEdoog0S313821256038332.891020DMMEdoog0S4151471575850183040DMMEdoog0S1.9324.055.66247527516.831650DMMEdoog0S3520300906372.322160DMME
EMDT077 165.2 170 52 53 87 6 2 shearing dextral shear indicator goodEMDT077 175.9 330 35 53 87 88 243 S2 parallel to S0? good
doogcloV .lof2S5.2626.083.0995040531.131330DMMEEMMD074 115.1 42 45 60 94.5 69.5 304.8 shearing fol. Volc (sheared) moderateEMMD074 115.3 355 55 60 94.5 64.9 271.3 shearing fol. Volc (sheared) poor
doogcloV .lof2S4.4527.775.4906044336.531470DMMEdoogcloV .lof2S7.9528.385.490653243041470DMME
EMMD074 176 359 42 60 94.5 77.9 273.7 shearing shear zone (bottom to left) poorEMM008 56.6 309 50 62 265 61 50 shearing sheared boudin poor
etaredom?utis ni0S65788621672423621800MMEetaredom?utis ni0S922786226030925.341800MMEetaredomstnemides0S4435696226515428.951800MME
EMM008 166.1 292 20 62 269 82 27 S0 cross-bedded gooddoog0S626796226528828.661800MMEdoog0S81770722602082781800MMEdoog0S033807226024925.991800MMEdoog0S82373722672482642800MMEdoog0S527637226038724.252800MME
etaredomthgir ot pugniraehs7422457226220617.792800MMEroopthgir ot pugniraehs8712477226541114.803800MME
etaredom2F011537722608844.713800MMEroop2F241657722605667.713800MMEdoog2F231277722604548.713800MMEdoog0S241267722654265.913800MME
EMM008 320.3 278 25 62 277 72 26 contact discordant red breccia goodEMM008 322.6 32 50 62 277 65 119 shearing shear fabric in red rock goodEMM008 323.4 106 75 62 277 28 130 shearing vein? Up to right moderateEMM008 324.5 61 87 62 277 30 102 S0 comp. layering moderate
332 Appendix E: Leapfrog M
odeling Database
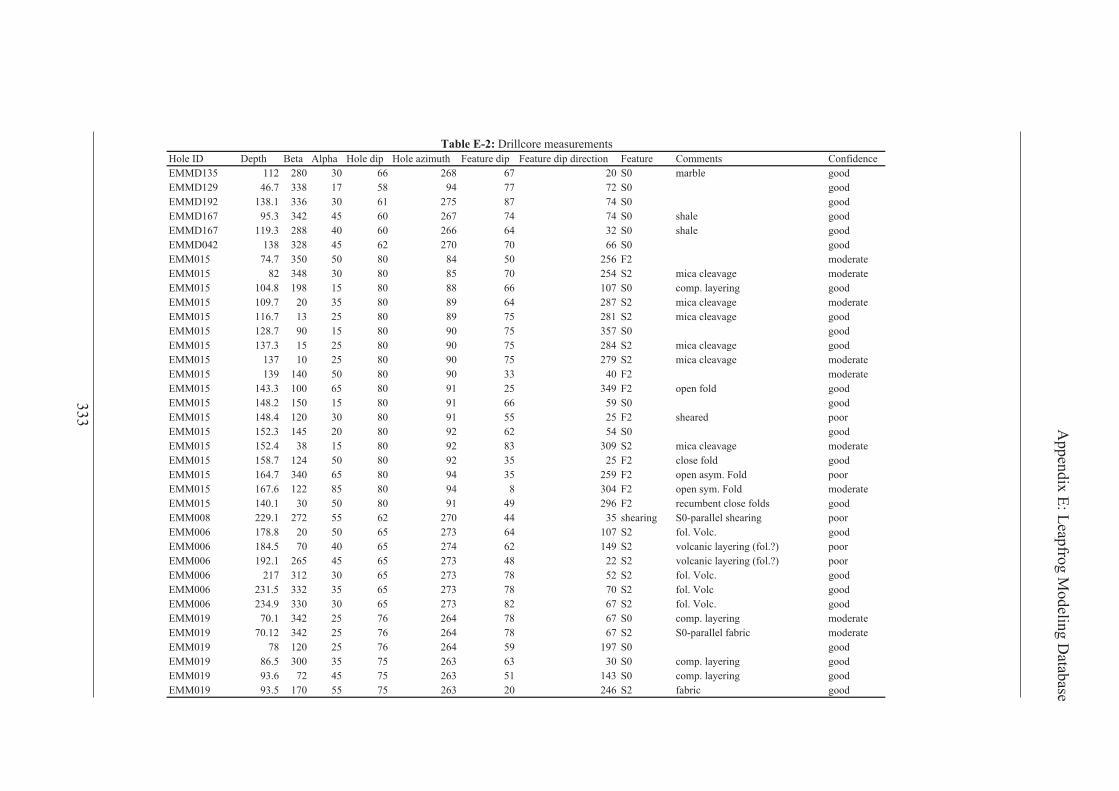
Hole ID Depth Beta Alpha Hole dip Hole azimuth Feature dip Feature dip direction Feature Comments ConfidenceTable E-2: Drillcore measurements
doogelbram0S02768626603082211531DMMEdoog0S27774985718337.64921DMMEdoog0S477857216036331.831291DMMEdoogelahs0S474776206542433.59761DMMEdoogelahs0S234666206048823.911761DMMEdoog0S66070722654823831240DMME
etaredom2F652054808050537.47510MMEEMM015 82 348 30 80 85 70 254 S2 mica cleavage moderateEMM015 104.8 198 15 80 88 66 107 S0 comp. layering goodEMM015 109.7 20 35 80 89 64 287 S2 mica cleavage moderateEMM015 116.7 13 25 80 89 75 281 S2 mica cleavage good
doog0S75357090851097.821510MMEEMM015 137.3 15 25 80 90 75 284 S2 mica cleavage goodEMM015 137 10 25 80 90 75 279 S2 mica cleavage moderate
etaredom2F0433090805041931510MMEdoogdlof nepo2F943521908560013.341510MMEdoog0S95661908510512.841510MMEroopderaehs2F52551908030214.841510MMEdoog0S45262908025413.251510MME
EMM015 152.4 38 15 80 92 83 309 S2 mica cleavage moderatedoogdlof esolc2F52532908054217.851510MME
EMM015 164.7 340 65 80 94 35 259 F2 open asym. Fold poorEMM015 167.6 122 85 80 94 8 304 F2 open sym. Fold moderateEMM015 140.1 30 50 80 91 49 296 F2 recumbent close folds goodEMM008 229.1 272 55 62 270 44 35 shearing S0-parallel shearing poor
doog.cloV .lof2S701463725605028.871600MMEEMM006 184.5 70 40 65 274 62 149 S2 volcanic layering (fol.?) poorEMM006 192.1 265 45 65 273 48 22 S2 volcanic layering (fol.?) poor
doog.cloV .lof2S25873725603213712600MMEdoogcloV .lof2S078737256532335.132600MMEdoog.cloV .lof2S762837256030339.432600MME
EMM019 70.1 342 25 76 264 78 67 S0 comp. layering moderateEMM019 70.12 342 25 76 264 78 67 S2 S0-parallel fabric moderate
doog0S79195462675202187910MMEEMM019 86.5 300 35 75 263 63 30 S0 comp. layering goodEMM019 93.6 72 45 75 263 51 143 S0 comp. layering good
doogcirbaf2S6420236257550715.39910MME
333 Appendix E: Leapfrog M
odeling Database

Hole ID Depth Beta Alpha Hole dip Hole azimuth Feature dip Feature dip direction Feature Comments ConfidenceTable E-2: Drillcore measurements
EMM019 138.3 338 40 75 260 64 61 S2 S0-parallel fabric poorEMM019 143 258 85 75 259 15 59 S2 fabric/microfolds moderateEMM019 136.6 350 40 75 260 65 72 shearing fabric of deformed qtz sulf-carb poorEMM019 159.4 350 32 75 259 73 70 shearing S0-parallel shearing goodEMM019 170 98 27 75 257 62 167 shearing S0-parallel shearing good
doogcirbaf2S578775257728534.171910MMEEMM019 178.7 200 55 75 257 21 289 F2 asym. Fold hinges poorEMM019 179.5 242 50 75 257 35 338 shearing sheared boudin good
etaredom0S215465257050824.581910MMEEMM019 185.8 252 85 75 256 14 56 S2 oblique to S0 moderateEMM019 173.5 280 55 75 257 40 16 F2 Z-fold hinges poorEMMD087 105.6 340 50 59 94 70 260 S2 fol. Volcanics goodEMMD087 202.5 270 15 59 93 77 191 shearing So? Shearing good
doogsknik2S6322639950540325.202780DMME
334 Appendix E: Leapfrog M
odeling Database

noitaretlAepyt kcoRhtpeD Structures stnemmoCsnieVserutxeT
0
100
200
Hole ID: EMMD001 Site: E1N Total Depth: 280m E/N (m): 477571/ 7739614 A/I(°): 090 / -60
flattened / foliated aymgdules
marble?
amygdaloidal & porphyritic m
eta-andesite
discordant breccia
intensespeculariteat contact
pervasive foliation of amygdules
localizedMinorab, calK-spr
intense mag,minor py-ccp
cal,dol, qtz veins and am
ygdule infill; minor ab
py infill of amyg. increases
slight increase in ab(-hem)
alteration and veining
marble? Intense py, some ccp strongly weathered
porphyriticm
eta-andesite
trachytic,glom
erophyric,som
e amygdules
metavolcanic breccia
strongly alteredlam
inated rock(m
arble)
medium
-crystalline
flattened/foliated clasts
strong foliation,som
e shearing
slight decrease in veining
Bar veincontent higher
Intense Mag, bar, fluoccp, cal, py, ab
blebby abSOH: 41.8m
2 - 40mmclasts; subrounded
Cont. next page
laminated
laminated
335
10 m
Appendix E: Leapfrog Modeling Database

noitaretlAepyt kcoRhtpeD Structures stnemmoCsnieVserutxeT
Hole ID: EMMD001 (cont.)
200
300
EOH: 280m
volcanic breccia
volcanic breccia
porphyriticm
eta-andesite
strongly alteredlaminated rock(marble)
medium
-crystalline
strong foliation,som
e shearingpervasive foliation of am
ygdules
trachytic,glom
erophyric,som
e amygdules
moderate ab(-hem
), k-sparIntense M
ag, bar, fluoccp, cal, py, ab
moderate
K-spar, ab,cal, qtz
moderate cal, bar, fluo
ccp
gradational contact
2 - 40mmclasts; subrounded
Key (all logs)
Porphyriticmeta-andesite
Mass. to amygdaloidalmeta-andesite
Marble
Metavolcanicbreccia
Cover
Metatuff
Discordantbreccia
Carbonaceousschist
Carbonaceousmetasiltstone
Metadolerite
Diorite
Note: rock types not in order
Mineralised zone
Major carb ± ccp ± py ± bar ± fluo vein
336
Mineral abbreviations: E/N, easting/northing; A/I, azimuth/inclination (design); dol, dolomite; sid, siderite; cal, calcite; carb, carbonate; mag, magnetite; chlo, chlorite;fluo, fluorite; ccp, chalcopyrite; py, pyrite; bar, barite; qtz, quartz; K-spr, K-feldspar; ab, albite; bt, biotite; ser, sericite; hem, hematite.
10 m
Appendix E: Leapfrog Modeling Database
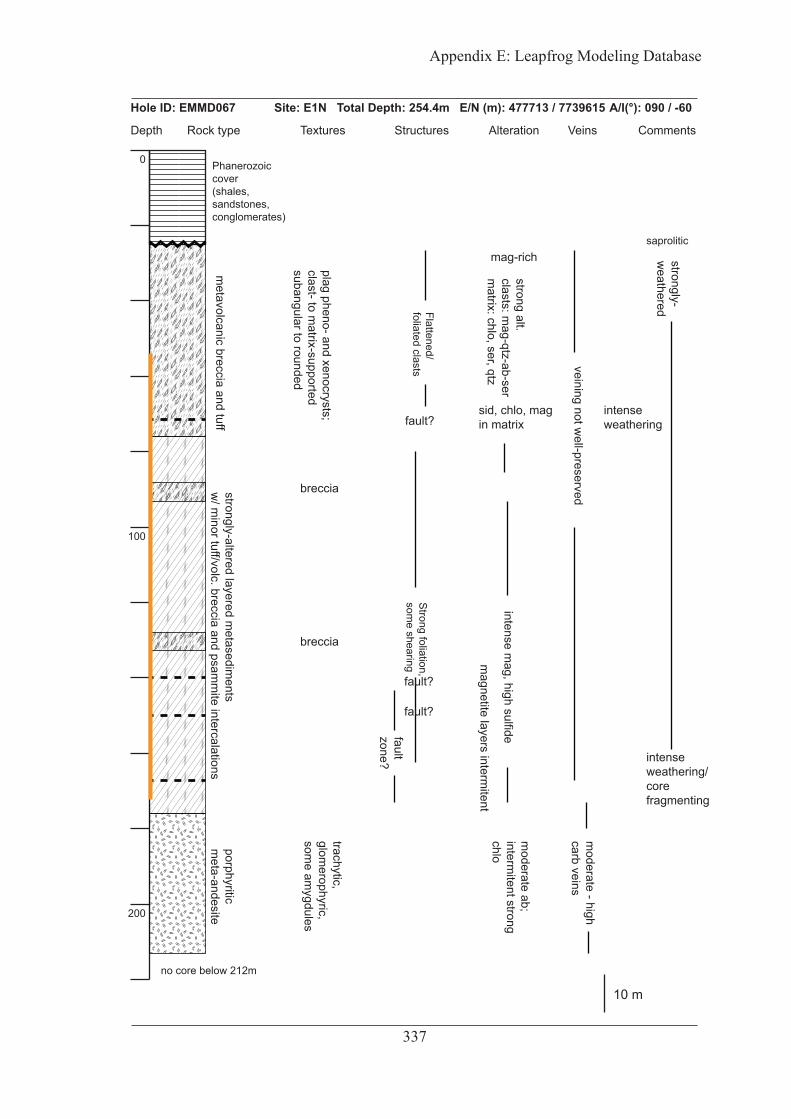
noitaretlAepyt kcoRhtpeD Structures stnemmoCsnieVserutxeT
0
100
200
Hole ID: EMMD067 Site: E1N Total Depth: 254.4m E/N (m): 477713 / 7739615 A/I(°): 090 / -60
Phanerozoiccover(shales, sandstones, conglomerates)
metavolcanic breccia and tuff
strongly-altered layered metasedim
ents w
/ minor tuff/volc. breccia and psam
mite intercalations
porphyriticm
eta-andesite
plag pheno- and xenocrysts;clast- to m
atrix-supportedsubangular to rounded
Flattened/foliated clasts
mag-rich strongly-w
eathered
strong alt.clasts: m
ag-qtz-ab-serm
atrix: chlo, ser, qtz
Strong foliation,som
e shearing
saprolitic
sid, chlo, magin matrixfault?
intenseweathering
veining not well-preserved
intense mag, high sulfide
breccia
breccia
fault?
fault?
intenseweathering/core fragmenting
faultzone?
magnetite layers interm
itent
moderate ab;
intermitent strong
chlo
trachytic,glom
erophyric,som
e amygdules
moderate - high
carb veins
no core below 212m
337
10 m
Appendix E: Leapfrog Modeling Database
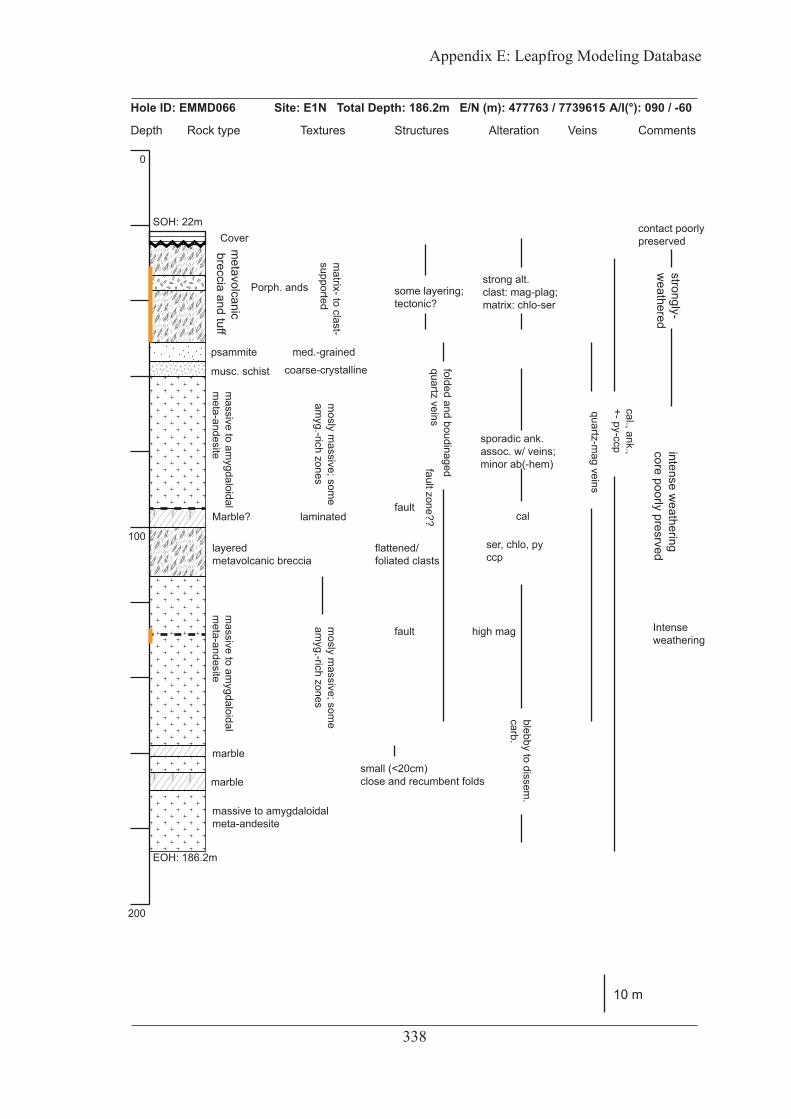
noitaretlAepyt kcoRhtpeD Structures stnemmoCsnieVserutxeT
0
100
200
Hole ID: EMMD066 Site: E1N Total Depth: 186.2m E/N (m): 477763 / 7739615 A/I(°): 090 / -60
Porph. ands
Covermetavolcanic
breccia and tuff
psammite
musc. schist coarse-crystallinemed.-grained
matrix- to clast-
supported
massive to am
ygdaloidal m
eta-andesitem
assive to amygdaloidal
meta-andesite
massive to amygdaloidal meta-andesite
Marble?
marble
marble
layeredmetavolcanic breccia
mosly m
assive; some
amyg.-rich zones
mosly m
assive; some
amyg.-rich zones
strongly-w
eathered
SOH: 22m
EOH: 186.2m
some layering;tectonic?
intense weathering
core poorly presrved
fault zone??
strong alt.clast: mag-plag;matrix: chlo-ser
sporadic ank. assoc. w/ veins;minor ab(-hem)
cal., ank.,+- py-ccp
quartz-mag veins
folded and boudinagedquartz veins
ser, chlo, pyccp
cal
blebby to dissem.
carb.
laminatedfault
Intenseweathering
fault high mag
flattened/foliated clasts
small (<20cm)close and recumbent folds
contact poorly preserved
338
10 m
Appendix E: Leapfrog Modeling Database

noitaretlAepyt kcoRhtpeD Structures stnemmoCsnieVserutxeT
Hole ID: EMMD086 Site: E1N Total Depth: 201m E/N: 477643m / 7739615m A/I(°): 090 / -60
0
100
200 EOH: 201m
SOH: 23m
massive
meta-andesite
massive to amygdaloidal meta-andesite
massive
meta-andesite
metatuff
metatuff
layeredm
etavolcanic breccialayeredm
etavolcanic breccia
Porph. meta-andesite
banded
plag-phyric clasts
stsa
lc d
enett
alfst
salc
den
ettalf
carb veins & veinlets; deform
ed qtz veins (0.5-2cm w
idth)
highly-weathered
heavily fragmented
& weathered
mag, chlo; carb?
chlo, minor m
ag & carbchlor, ser; m
inor mag
fault zone?heavily fragmented& weathered
not strongly minz.
intense mag-py-ccp minz. extends <2m into andesite
less-altered; chlo, blebby carb
amygdaloidal
evis
sam
yltso
mse
ludg
yma
ron
im ;
evis
sam
yltso
m
339
10 m
Appendix E: Leapfrog Modeling Database

noitaretlAepyt kcoRhtpeD Structures stnemmoCsnieVserutxeT
Hole ID: EMMD075 Site: E1N Total Depth: 231m E/N: 477603m / 7739615m A/I(°): 090 / -60
0
100
200
psammiteintercalatedw/ metatuff?
meta-ands.intercalated w/ metatuff& psammite
massive m
eta-andesite
marble intercalated w/ psammite
metavolcanic breccia
metavolcanic breccia
metavolcanic
breccia
metavolcanic brec.
amygdaloidalmeta-andesite
metavolcanic breccia
autobrec.?
autobrec.?amygdaloidal
amygdaloidal
meta-andesite
flattened clasts
flattened clasts
flattened clasts
flattened clasts
flattened clasts
flattened clasts
mtx. rich in chlo-qtz;qtz-mag-rich ‘clasts’
mag-qtz infill
of amygdules & veinlets
strong al. clasts: qtz-sermtx: mag-chlo,dissem. - wispy
qtz-ser-mag-py-ccp-chlo-Fe-carb
qtz-ser haloeson m
ag veinlets
highly - weathered & fragm
entedw
eathered & fragmented
very fine-grained; chlo, ser
wispy mag-chlo-bt
intense mass. mag; dissem py-ccp
carb-richintense laminated mag-bar-fluo-
sulfides-dol(-Fe)
chlo, ab
abund. carb veins
ore-
zone
moderate carb veining
SOH: 23m
EOH: 231m
10 m
340
Appendix E: Leapfrog Modeling Database

noitaretlAepyt kcoRhtpeD Structures stnemmoCsnieVserutxeT
Hole ID: EMMD077 Site: E1N Total Depth: 315m E/N: 477560m / 7739615m A/I(°): 090 / -60
0
100
200
Cont. next page
SOH: 20m
discordant breccia
cover
Sheared contact strong carb
~8m dioriteclast
dominantly m
tx. supported
meta-andesite
massive
amygdaloidal
massive
amygdaloidal
meta-andesite
metatuff &volcanic breccia
marble
intercalatedw
/ metatuff
laminated
w/ sporadic clasts
metadolerite dike
highly-weathered& fragmented
extent of sign. weathering
mtx: chlo-bt-carb-hem
-kspr-ab-qtzred alt. & carb rim
s on some clasts
sporadic patches of intense red or carbalteration; very intense alteration
fault zone
carb. veins abundantm
ostly <1cm
red alt. in mtx
chlo, ab?(fine-grained)mass. py assoc. w/ carb veinsser haloes around some veins
mag-rich clastsser-mag-py-ccp mtx
wispy mag-sulfalt. near contact
sporadic patchesof mass. py
mass. to blebby sulf-mag-serassoc. w/ veins
carbonate veins<1cm
to >10cm
small (<2 cm)bar-carb-fluo-sulfveins; cutting ab veins
laminated/
foliated
flattened clasts
clastsintact, no foliation
intense laminated mag-ab-bar-fluo-ccp-py-carb
341
10 m
Appendix E: Leapfrog Modeling Database

noitaretlAepyt kcoRhtpeD Structures stnemmoCsnieVserutxeT
Hole ID: EMMD077 (cont.)
200
300
EOH: 315n
intense laminated mag-ab-bar-fluo-ccp-py-carb
small (<2 cm)bar-carb-fluo-sulfveins; cutting ab veins
sporadic amygdaloidalclaststhroughout
intense to mod. m
ag-ccpy-py(decreases dow
nhole)
carb veins dominant
laminated;clasts are foliated
marble
metavolcanicbreccia
metavolcanic breccia
mainly chlo-ser
carb alt.
342
10 m
Appendix E: Leapfrog Modeling Database

noitaretlAepyt kcoRhtpeD Structures stnemmoCsnieVserutxeT
Hole ID: EMMD146 Site: E1N Total Depth: 223m E/N: 477758m / 7739612m A/I(°): vertical
0
100
200
re-brecciatedm
etavolcanic breccia; intercalated w
/ marble
clast-supported;some laminae / layering visiblemany clasts areamygdaloidal
partially - re-brecciated?
sid-chlo alt. and infll betw
een many clasts
clasts mag-chlo
altered;m
tx.: mag-chlo, carb
wispy & lam
inatedm
ag-py-ccp
late carb has re-brecciatedthe volcanic breccia?
mass. - amyg.meta-andesite
siliceous marble w
/ minor
meta-andesite intercalations
laminated tobedded
1 - >10m scaleopen to close folds& some boudins
dissem. to laminated sid-dol-mag-py-ccp
mainly m
assive meta-andesite
amygdaloidal
abundant carb veins;locally carb-infilled breccia
chlo, ser. some blebby - dissem
carb, assoc. w/ veins
mag-py-ccp
chlo-sercarb
abundant carb veins;locally carb-infilled breccia
SOH: 22m
EOH: 223m
343
10 m
Appendix E: Leapfrog Modeling Database

Depth Rock type AlterationStructuresTextures Veins Comments
Hole ID: EMMD182 Site: E1N Total Depth: 289m E/N (m): 477934 / 7739626 A/I(°): 270 / -60
0
100
200
Cont. next page
cover
coarsely porphyritic and amygdaloidal m
eta-andesite
glomeroporphyritic; plag phenocrysts 0.5 - 2cm
length;also sporadically am
ygdaloidal
fault orfracture zone
highly weathered& fragmented
localized patches of intense chlorite-bt-ser assoc. w/ carb and qtz veins, som
e are haloes;localized patches of red (albite-hem
?) alteration indicated by red plag phenocrystsdissem
carb; very minor m
ag and sulfides, dssem, assoc. w
/ carb veins
localized, intensered alt
irregular qtz & carb +-py-ccp-mag veins (up 5 cm
) & amygdule infill;
ab-hem veins (< ~2cm
); carb is latebiotite veins w
/ carb overprint
minor chlo-ser; ser alt of phenocrystsmoderate carb
abundantcarb veinlets(0.5cm
)
SOH: 29.5m
10 m
344
Appendix E: Leapfrog Modeling Database
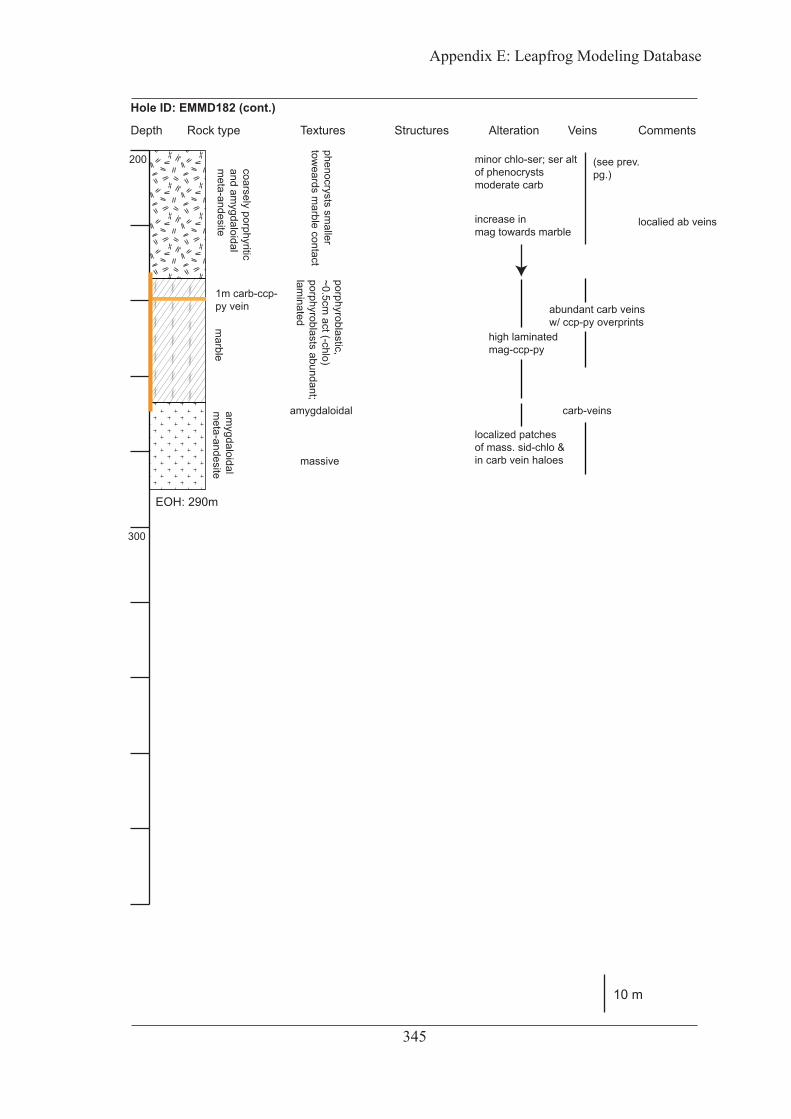
noitaretlAepyt kcoRhtpeD Structures stnemmoCsnieVserutxeT
Hole ID: EMMD182 (cont.)
200
300
marble
amygdaloidal
meta-andesite
coarsely porphyritic and am
ygdaloidal m
eta-andesite
porphyroblastic,~0.5cm
act (-chlo)porphyroblasts abundant;lam
inated
amygdaloidal
massive
localied ab veins
phenocrysts smaller
toweards m
arble contact
1m carb-ccp-py vein abundant carb veins
w/ ccp-py overprintshigh laminatedmag-ccp-py
increase inmag towards marble
(see prev.pg.)
minor chlo-ser; ser alt of phenocrystsmoderate carb
carb-veins
localized patchesof mass. sid-chlo &in carb vein haloes
EOH: 290m
10 m
345
Appendix E: Leapfrog Modeling Database
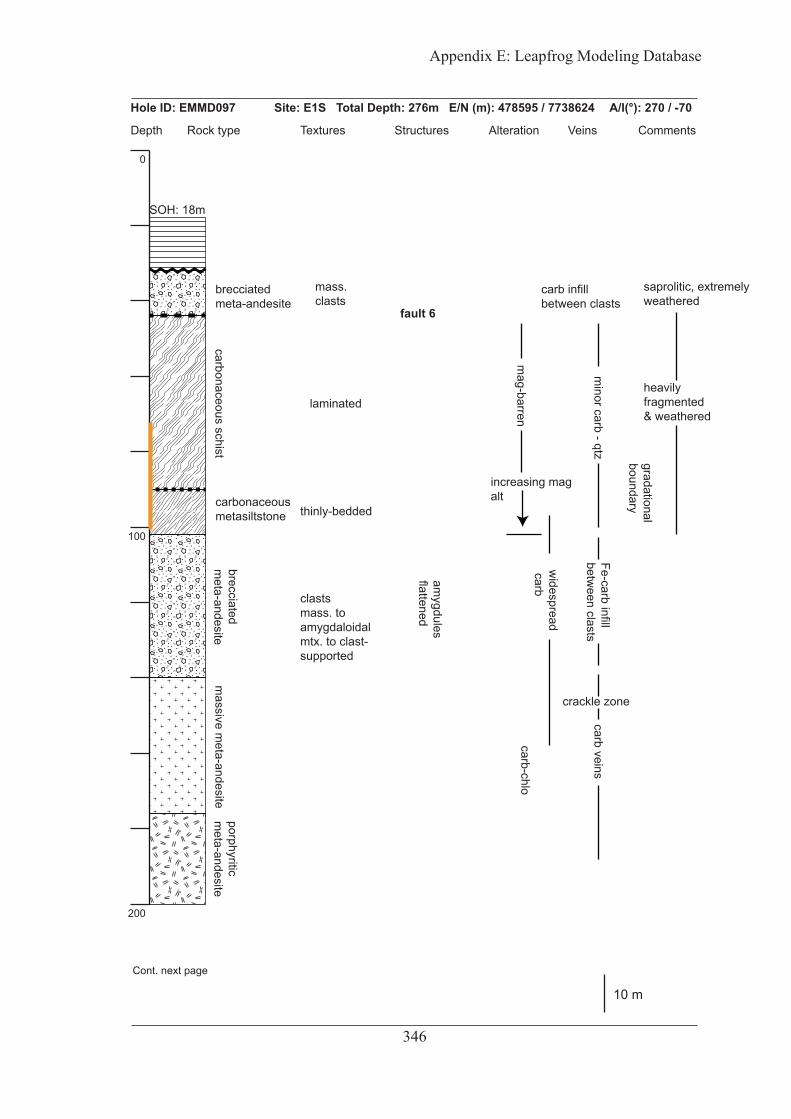
noitaretlAepyt kcoRhtpeD Structures stnemmoCsnieVserutxeT
0
100
200
Cont. next page
Hole ID: EMMD097 Site: E1S Total Depth: 276m E/N (m): 478595 / 7738624 A/I(°): 270 / -70
saprolitic, extremelyweathered
brecciatedmeta-andesite
carbonaceous schist
carbonaceous metasiltstone
gradationalboundary
brecciatedm
eta-andesite
fault 6
massive m
eta-andesiteporphyriticm
eta-andesite
carb infill between clasts
mass.clasts
laminated
thinly-bedded
heavilyfragmented& weathered
mag-barren
minor carb - qtz
increasing magalt
clastsmass. toamygdaloidalmtx. to clast-supported
Fe-carb infill betw
een clasts
widespread
carb
amygdules
flattened
crackle zone
carb veins
carb-chlo
SOH: 18m
10 m
346
Appendix E: Leapfrog Modeling Database

noitaretlAepyt kcoRhtpeD Structures stnemmoCsnieVserutxeT
Hole ID: EMMD097 (cont.)
200
300257
258
259
porphy.meta-ands.
metatuffw/ minor marble
marble
porphy.meta-ands.
marble
porphy.meta-ands.
some volc.brec.
intense lam.mag-py-ccp;interlayered w/red alt. (qtz? ab?)
high sid
carb-fluo-bar-sulf
shearedqtz-rich lyr
boundinaged qtz-rich layers
conglomeritic
fine-gr. red (silica?) altnear contact
abundant carbno mag(abrupt at contact)
carb-poor
deformed marble;open to close, asymmetric folds <1m wavelengthlots of microfaults (<2cm length)
intense lam.mag-ccp-py
intense lam.mag-ccp-pyred (ab?) alt
lam. to mass. mag
dol
pervasive red alt
mag-out cal
sid
abundantcarb veins
high mag
porphyriticmeta-andesite
Detail log of marble / meta-andesite contact 257 - 259m
EOH: 273m
10 m
347
Appendix E: Leapfrog Modeling Database

noitaretlAepyt kcoRhtpeD Structures stnemmoCsnieVserutxeT
0
100
200
Hole ID: EMMD013 Site: E1E Total Depth: 172m E/N (m): 478400 / 7739626 A/I(°): vertical
saprolite;protolith uncertain
calcereousmetasiltstoneintercalated w/marble
closeasymmfolds <1m wavelengthsome <5 cm
very plastically-deformed
discordant breccia
porphyriticmeta-andesite
lam.sed clast~7m
chlored-altphenocryts
heavilyw
eathered
abund. carbabund. redalt.
fine-gr. some
porphyroblasticlayers intense lam
. to dissem.
mag-bar-fluo-
ccp-py-Fe-carbab (red alt)porphryoblastsalt. to m
ag-py-ccp
abundant small (<1cm
)layer-parallelbar-fluo-ccp veins
bar-fluo out??
highly weatheredfault zone??
mtx.supported
clasts: ab-kspr-hemmtx: bio-chlo-carbcarb-rims on clasts
breccia notfoliated
SOH: 31.9
10 m
348
Appendix E: Leapfrog Modeling Database
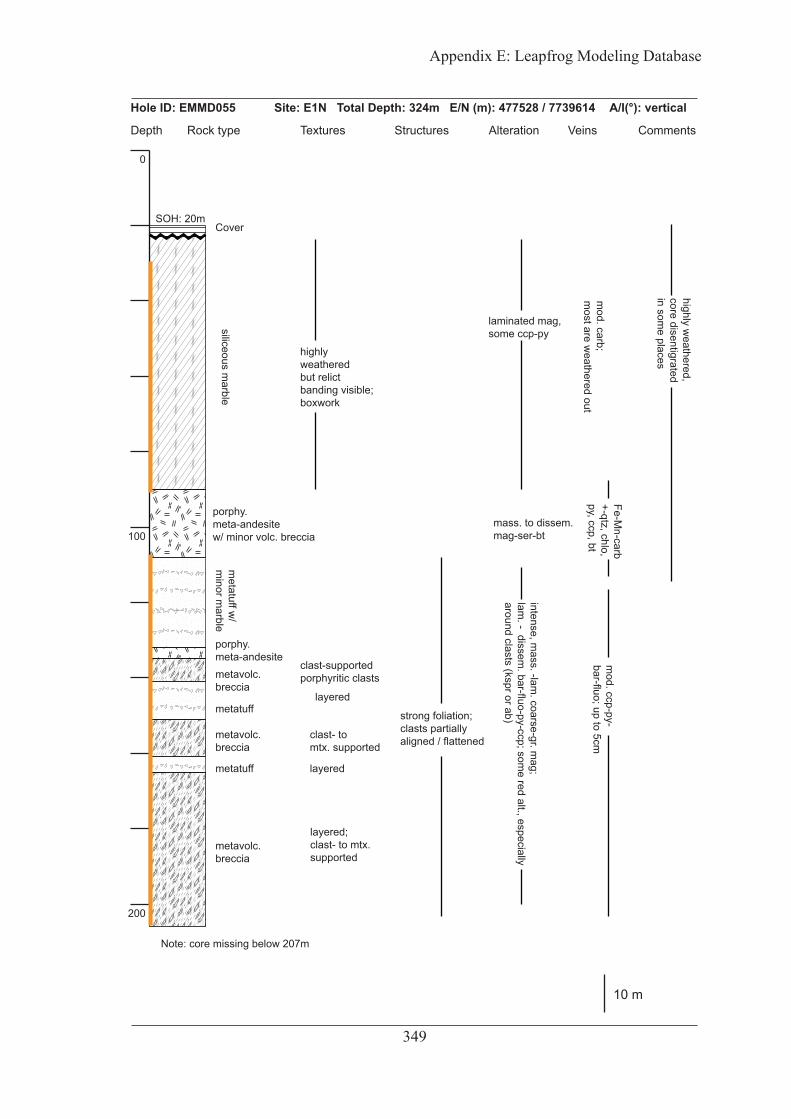
noitaretlAepyt kcoRhtpeD Structures stnemmoCsnieVserutxeT
0
100
200
Hole ID: EMMD055 Site: E1N Total Depth: 324m E/N (m): 477528 / 7739614 A/I(°): vertical
Note: core missing below 207m
SOH: 20m
siliceous marble
Cover
porphy.meta-andesitew/ minor volc. breccia
metatuff w
/ m
inor marble
porphy.meta-andesitemetavolc.breccia
metatuff
metavolc.breccia
metatuff
metavolc.breccia
clast-supportedporphyritic clasts
layered
clast- to mtx. supported
layered;clast- to mtx.supported
layered
highlyweatheredbut relictbanding visible;boxwork
laminated mag,some ccp-py
mod. carb;
most are w
eathered out
mass. to dissem.mag-ser-bt
Fe-Mn-carb
+-qtz, chlo, py, ccp, bt
intense, mass. -lam
. coarse-gr. mag;
lam. - dissem
. bar-fluo-py-ccp; some red alt., especially
around clasts (kspr or ab)strong foliation;clasts partially aligned / flattened
mod. ccp-py-
bar-fluo; up to 5cm
highly weathered,
core disentigratedin som
e places
10 m
349
Appendix E: Leapfrog Modeling Database
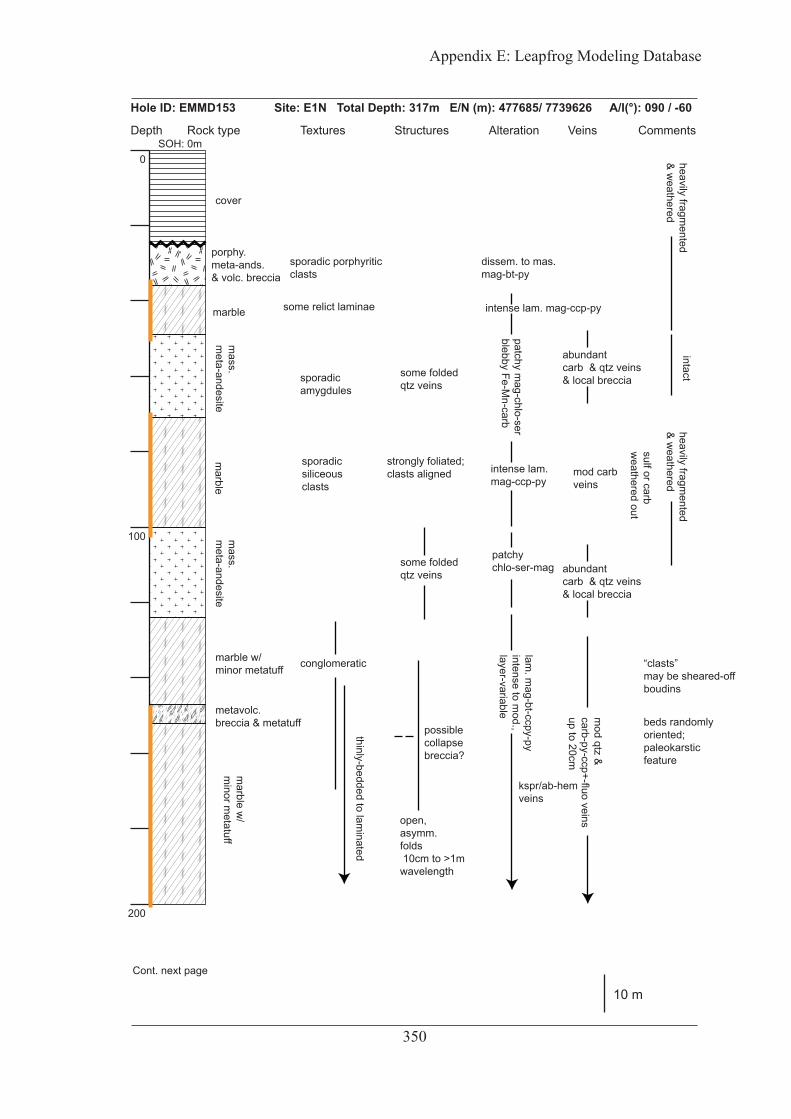
noitaretlAepyt kcoRhtpeD Structures stnemmoCsnieVserutxeT
0
100
200
Hole ID: EMMD153 Site: E1N Total Depth: 317m E/N (m): 477685/ 7739626 A/I(°): 090 / -60
cover
SOH: 0m
porphy.meta-ands.& volc. breccia
marble
mass.
meta-andesite
marble
mass.
meta-andesite
metavolc.breccia & metatuff
marble w/minor metatuff
marble w
/m
inor metatuff
sporadicamygdules
some relict laminae
some foldedqtz veins
some foldedqtz veins
abundantcarb & qtz veins& local breccia
sporadic porphyriticclasts
conglomeratic “clasts”may be sheared-off boudins
thinly-bedded to laminated
heavily fragmented
& weathered
heavily fragmented
& weathered
intact
abundantcarb & qtz veins& local breccia
sulf or carbw
eathered out
mod carb veins
mod qtz &
carb-py-ccp+-fluo veinsup to 20cm
strongly foliated;clasts aligned
sporadic siliceousclasts
possible collapse breccia?
beds randomly oriented;paleokarsticfeature
open, asymm.folds 10cm to >1m wavelength
kspr/ab-hem veins
intense lam. mag-ccp-py
dissem. to mas.mag-bt-py
patchy mag-chlo-ser
blebby Fe-Mn-carb
intense lam.mag-ccp-py
patchychlo-ser-mag
lam. m
ag-bt-ccpy-pyintense to m
od.,layer-variable
10 m
Cont. next page
350
Appendix E: Leapfrog Modeling Database

noitaretlAepyt kcoRhtpeD Structures stnemmoCsnieVserutxeT
Hole ID: EMMD153 (cont.)
200
300
siliceous marble w
/m
inor metatuff
porphyroblastic(actinolite)
thinly-bedded to laminated
~1m carb-ccp-py vein
~1m carb-ccp-py vein
open, asymm.folds 10cm to >1m wavelength
mod. - high
carb+-qtz+-ccp-py-fluoveinscarb+-bt veinsKspr or ab veins
lam. m
ag-bt-ccpy-pyintense to m
od.,layer-variable
magless abundant;py-bt-chlo-ccp-ap
coarse-gr.mag
mag-rich lyrs
alt. w/ qtz-ab-(hem
)-lyrs
EOH: 317m
abund.carb-fluo ccp veins
10 m
351
Appendix E: Leapfrog Modeling Database

noitaretlAepyt kcoRhtpeD Structures stnemmoCsnieVserutxeT
Hole ID: EMMD142 Site: E1N Total Depth: 316m E/N (m): 477832 / 7739573 A/I(°): 270 / -60
0
100
200
Cont. next page
SOH: 15m
porphyriticm
eta-andesite
marble
marble
amygdaloidal
meta-andesite
highly-weathered
laminated
mtx. supportedbreccia
thinly-beddedto lam
inated5-10m
amyg.-rich intervals
alternating w/ m
ass. intervals; pseudobrec. causedby carb alt
intense mag-ccp?-py
moderate
lam. to dissem
mag-ccp-py-ser
sulfmostly weathered out
minor ccp-py-carb
veins (<1cm)
abundant carb veins (up to >10cm)
& local brec.; minor ab-kspr veins (<3cm
)
chlo-ser;abundant carb - dissem
. &in vein haloes
Shear D highly-weathered
10 m
352
Appendix E: Leapfrog Modeling Database
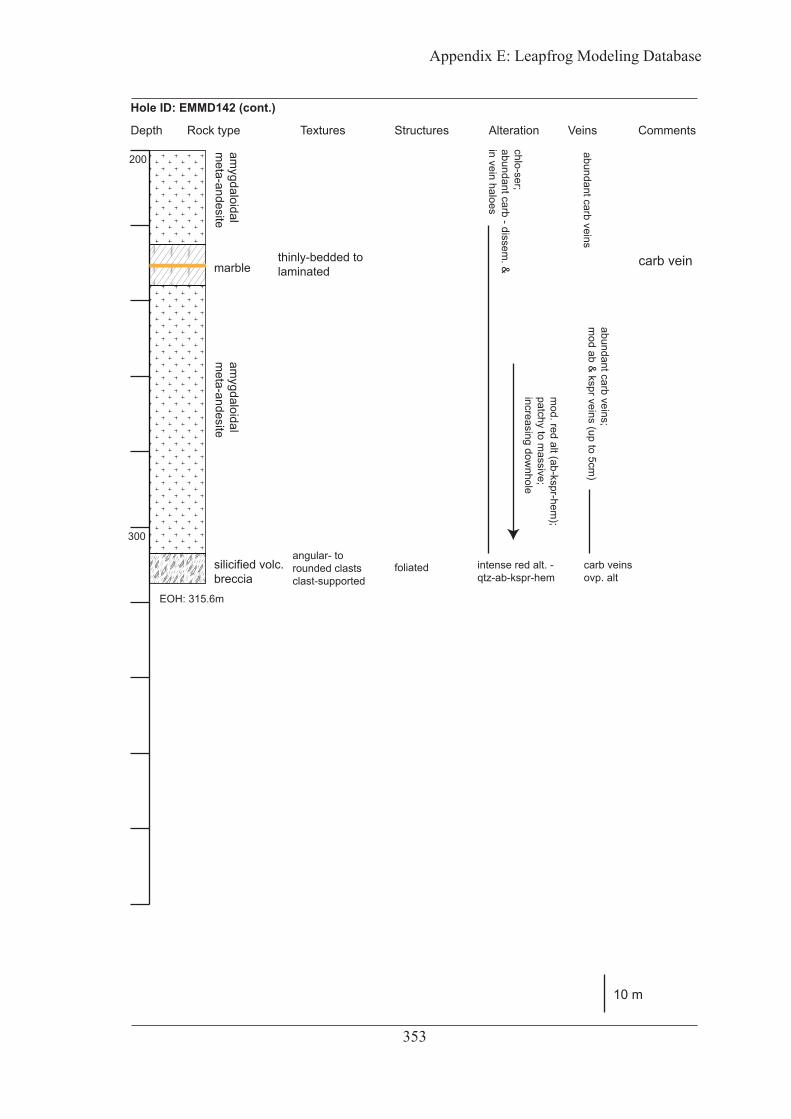
noitaretlAepyt kcoRhtpeD Structures stnemmoCsnieVserutxeT
Hole ID: EMMD142 (cont.)
200
300
amygdaloidal
meta-andesite
marble
silicified volc.breccia
amygdaloidal
meta-andesite
thinly-bedded tolaminated
angular- to rounded clastsclast-supported
foliated
mod. red alt (ab-kspr-hem
);patchy to m
assive;increasing dow
nhole
intense red alt. - qtz-ab-kspr-hem
abundant carb veins;m
od ab & kspr veins (up to 5cm)
abundant carb veins
chlo-ser;abundant carb - dissem
. &in vein haloes
carb veinsovp. alt
EOH: 315.6m
10 m
carb vein
353
Appendix E: Leapfrog Modeling Database
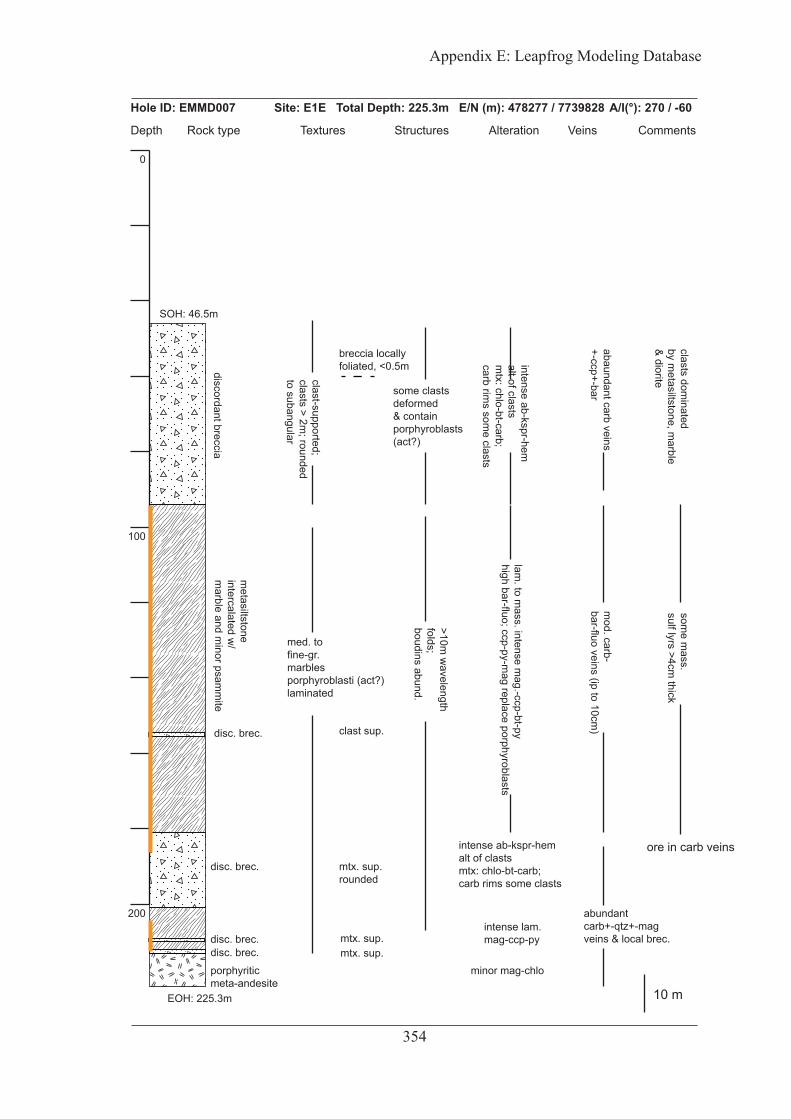
noitaretlAepyt kcoRhtpeD Structures stnemmoCsnieVserutxeT
Hole ID: EMMD007 Site: E1E Total Depth: 225.3m E/N (m): 478277 / 7739828 A/I(°): 270 / -60
0
100
200
SOH: 46.5m
discordant breccia
disc. brec.
disc. brec.disc. brec.porphyriticmeta-andesite
metasiltstone
intercalated w/
marble and m
inor psamm
ite
disc. brec.
med. tofine-gr.marblesporphyroblasti (act?)laminated
clast-supported; clasts > 2m
; roundedto subangular
clast sup.
mtx. sup.rounded
mtx. sup.mtx. sup.
>10m w
avelengthfolds;boudins abund.
some clastsdeformed& containporphyroblasts(act?)
clasts dominated
by metasiltstone, m
arble& diorite
lam. to m
ass. intense mag.-ccp-bt-py
high bar-fluo; ccp-py-mag replace porphyroblasts
intense ab-kspr-hemalt of clastsm
tx: chlo-bt-carb;carb rim
s some clasts
intense ab-kspr-hemalt of clastsmtx: chlo-bt-carb;carb rims some clasts
minor mag-chlo
intense lam.mag-ccp-py
mod. carb-
bar-fluo veins (ip to 10cm)
abundantcarb+-qtz+-mag veins & local brec.
abaundant carb veins+-ccp+-bar
breccia locally foliated, <0.5m
some m
ass.sulf lyrs >4cm
thick
EOH: 225.3m
ore in carb veins
10 m
354
Appendix E: Leapfrog Modeling Database
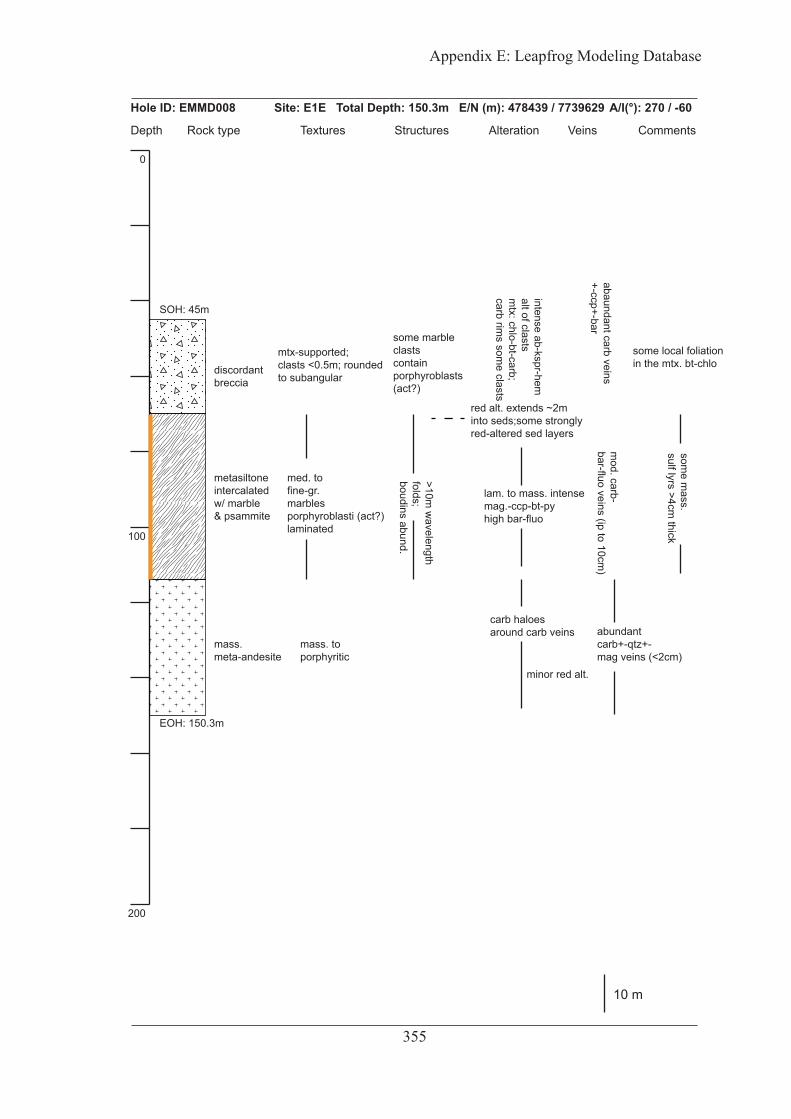
noitaretlAepyt kcoRhtpeD Structures stnemmoCsnieVserutxeT
Hole ID: EMMD008 Site: E1E Total Depth: 150.3m E/N (m): 478439 / 7739629 A/I(°): 270 / -60
0
100
200
SOH: 45m
metasiltoneintercalatedw/ marble& psammite
mass.meta-andesite
discordantbreccia
mtx-supported; clasts <0.5m; roundedto subangular
some marble clastscontainporphyroblasts(act?)
intense ab-kspr-hemalt of clastsm
tx: chlo-bt-carb;carb rim
s some clasts
abaundant carb veins+-ccp+-bar
some local foliation in the mtx. bt-chlo
lam. to mass. intense mag.-ccp-bt-pyhigh bar-fluo
>10m w
avelengthfolds;boudins abund.
mod. carb-
bar-fluo veins (ip to 10cm)
med. tofine-gr.marblesporphyroblasti (act?)laminated
mass. toporphyritic
minor red alt.
red alt. extends ~2m into seds;some strongly red-altered sed layers
abundantcarb+-qtz+-mag veins (<2cm)
carb haloesaround carb veins
EOH: 150.3m
some m
ass.sulf lyrs >4cm
thick
10 m
355
Appendix E: Leapfrog Modeling Database

noitaretlAepyt kcoRhtpeD Structures stnemmoCsnieVserutxeT
Hole ID: EMM018 Site: E1S Total Depth: 210.3m E/N (m): 478633 / 7738626 A/I(°): 090 / -60
0
100
200
cover
carbonaceousschist
carbonaceous m
etasiltstonem
ass.m
eta-andesite
marble
metavolc.breccia
marble
finely porphy.meta-andesite
very fine-gr.laminated
highly-weathered
& fragmented
intensely-weathered
small (<10cm
) asymm
.& recum
bent folds;foliation axial-planar
alternating qtz-carb-py-rich lyrs (infill?);mag absent
fine-gr.laminated intense mag-ccp-py
intense carb veins & brecciation
high mag-py-ccp
low-mag-sulf;high carb
intense mag-ccp-py-barfluo
chlo-ser-carb
small-scale(<5cm)aysmm.folds;microfaults
minor carb-bar-fluo
-ccp-py veins (<4cm
)
abund.carb+-qtz veins
SOH: 12m
EOH: 210.3m
10 m
356
Appendix E: Leapfrog Modeling Database

noitaretlAepyt kcoRhtpeD Structures stnemmoCsnieVserutxeT
Hole ID: EMMD052 Site: E1S Total Depth: 375.6m E/N (m): 478597 / 7738625 A/I(°): vertical
0
100
200
Fault 6
carbonaceousmetasiltstone
mass. meta-andesite
carbonaceousm
etasiltstonecarbonaceousschist
mass.
meta-andesite
highly-weathered
very fine-gr.laminated
small (<10cm
) asymm
.& recum
bent folds;foliation axial-planar
alternating py-qtz-rich and poor lyrs (infill?);mag absentbllebby po
fine-gr.laminated
intense lam. mag-ccp-py-bt-chlo
strongly weathered;Fe-oxides, some mag-py-ccplaminated
intense carb brecciation of ands. at contact
abundant carb+-qtz veins& local brec.
autobrec.?
SOH: 27m
10 m
gradational
357
Appendix E: Leapfrog Modeling Database

noitaretlAepyt kcoRhtpeD Structures stnemmoCsnieVserutxeT
Hole ID: EMMD052 (cont.)
200
300
porphyriticm
eta-andesite
marble
marble
marble
metavolc. brec.
porphyriticmeta-andesite
porphyriticmeta-andesite
amygdaloidal
meta-andesite
intense lam. mag-ccp-py-barfluo
small-scale(<5cm)aysmm.folds;microfaults
minor carb-bar-fluo
-ccp-py veins (<4cm
); minor
abund. carb
abundant carb+-qtz veins
marble
mod patchy chlo-serblebby carb;carb haloes
blebby carb &haloeschlo-ser
conglomerate lyr?patchy red (silica?)alteration
abundant carb+-qtz veins
10 m
358
Appendix E: Leapfrog Modeling Database

noitaretlAepyt kcoRhtpeD Structures stnemmoCsnieVserutxeT
Hole ID: EMMD049 Site: E1S Total Depth: 283.8m E/N (m): 478623 / 7738625 A/I(°): 200 / -80
0
100
200
core missingbelow 142m
SOH: 29m
carbonaceous schist
carbonaceous schist
carbonaceous m
etasiltstone
carbonaceous metasiltstone
Fault 6
alternatingpy?-qtz-rich layersmag-barren
boxworks;sulf weathered
highly-weathered
intense lam mag-ccp-py
alternatingpy-qtz-rich layersmag-barren
small (<10cm
) asymm
.& recum
bent folds;foliation axial-planar
intense lam mag-ccp-py
fine-gr.
very fine-gr.
fine-gr.
very fine-gr.
10 m
359
Appendix E: Leapfrog Modeling Database
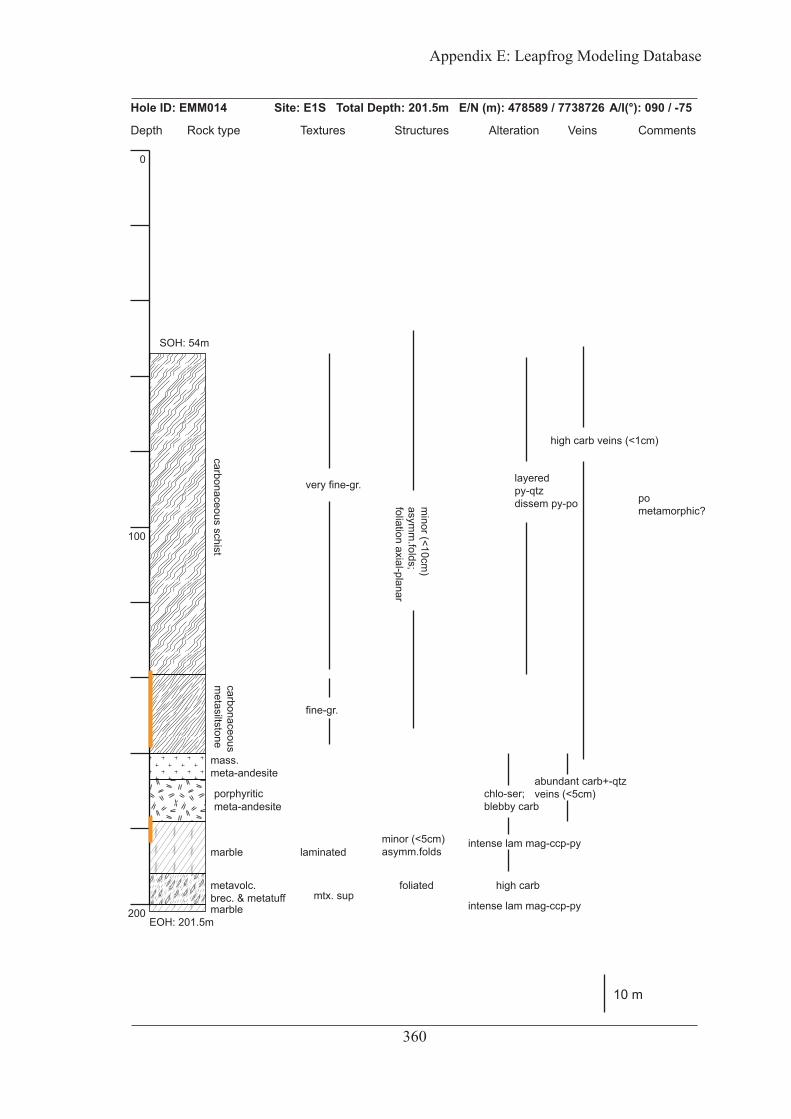
noitaretlAepyt kcoRhtpeD Structures stnemmoCsnieVserutxeT
Hole ID: EMM014 Site: E1S Total Depth: 201.5m E/N (m): 478589 / 7738726 A/I(°): 090 / -75
0
100
200
SOH: 54m
EOH: 201.5m
carbonaceous schistcarbonaceousm
etasiltstone
mass.meta-andesite
porphyriticmeta-andesite
marble
metavolc.brec. & metatuffmarble
fine-gr.
very fine-gr. layeredpy-qtzdissem py-pominor (<10cm
) asym
m.folds;
foliation axial-planar
abundant carb+-qtzveins (<5cm)
minor (<5cm) asymm.folds
foliated
intense lam mag-ccp-py
high carb veins (<1cm)
chlo-ser;blebby carb
intense lam mag-ccp-py
laminated
mtx. suphigh carb
pometamorphic?
10 m
360
Appendix E: Leapfrog Modeling Database
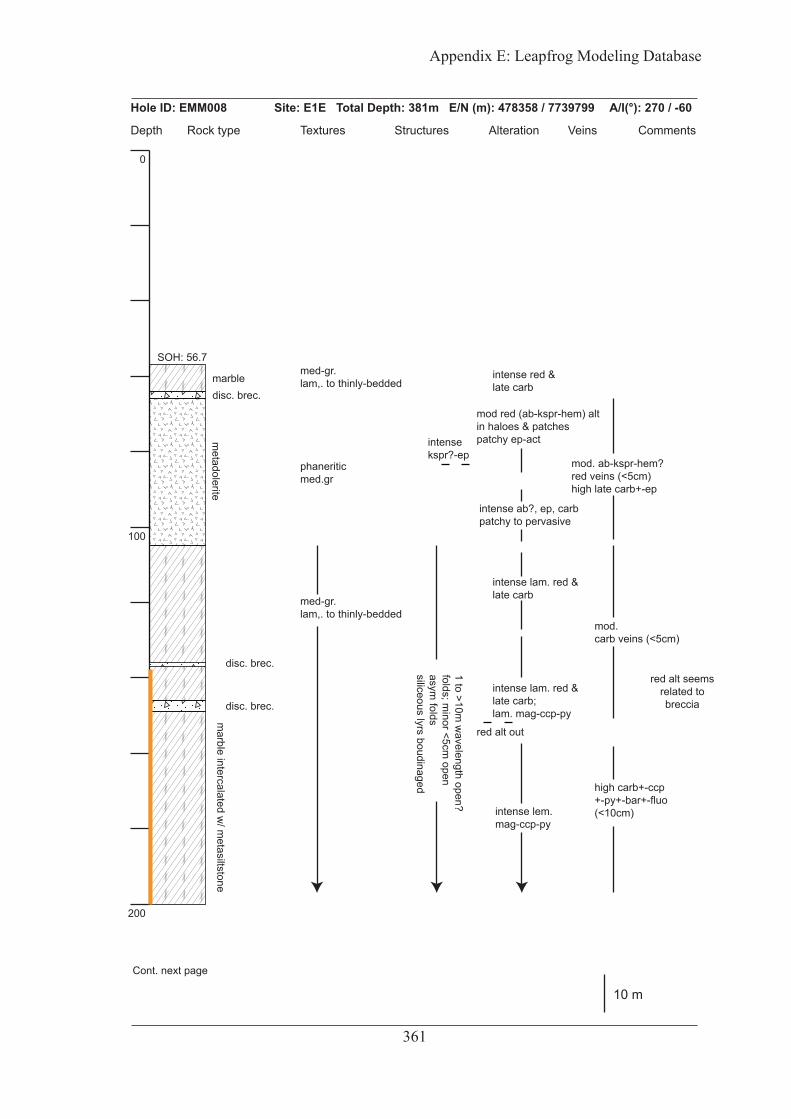
noitaretlAepyt kcoRhtpeD Structures stnemmoCsnieVserutxeT
Hole ID: EMM008 Site: E1E Total Depth: 381m E/N (m): 478358 / 7739799 A/I(°): 270 / -60
0
100
200
Cont. next page
SOH: 56.7
marbledisc. brec.
metadolerite
disc. brec.
disc. brec.
marble intercalated w
/ metasiltstone
phaneriticmed.gr
med-gr.lam,. to thinly-bedded
intense red &late carb
mod red (ab-kspr-hem) altin haloes & patchespatchy ep-actintense
kspr?-ep
intense ab?, ep, carbpatchy to pervasive
intense lam. red &late carb
intense lam. red &late carb;lam. mag-ccp-py
intense lem.mag-ccp-py
1 to >10m w
avelength open?folds; m
inor <5cm open
asym folds
siliceous lyrs boudinagedmed-gr.lam,. to thinly-bedded
red alt out
mod. ab-kspr-hem?red veins (<5cm)high late carb+-ep
high carb+-ccp+-py+-bar+-fluo(<10cm)
mod.carb veins (<5cm)
red alt seemsrelated tobreccia
10 m
361
Appendix E: Leapfrog Modeling Database

noitaretlAepyt kcoRhtpeD Structures stnemmoCsnieVserutxeT
Hole ID: EMM008 (cont.)
200
300
400
EOH: 381.3m
disc. brec.
disc. brec.
marble intercalated w
/ metasiltstone
intense, mass. red
intense lem.mag-ccp-py
intense, mass. red (ab-kspr-hem?)
intense lem.mag-ccp-py
1 to >10m w
avelength open?folds; m
inor <5cm open
asym folds
siliceous lyrs boudinaged
med-gr.lam,. to thinly-bedded
mod. carb+-ccp+-py+-bar+-fluo(<10cm)
minor carbveins (<1cm)
10 m
362
Appendix E: Leapfrog Modeling Database

noitaretlAepyt kcoRhtpeD Structures stnemmoCsnieVserutxeT
Hole ID: EMMD174 Site: E1E Total Depth: 209.4m E/N (m): 478725 / 7739175 A/I(°): vertical
0
100
200
SOH: 30mcover
mass. m
eta-andesite intercalated\ w
/ minor volc. brec.
marble intercalated w
/ minor am
phibolite
psammite& marble
amphibolite
amphibolite
laminated to thickly-bedded
minor dissem
.m
ag-py-ccp
relatively unalteredhighly-w
eathered
patchy red
patchy red
foliatedbrec.
EOH: 209.4
amphibolite
massive
brec.
pink carb
white carb
intense red (ab-kspr?)t alt
mod. carb veins throughout (<5cm
)
minor carbbt. - rich lyrs
strongly foliated
10 m
363
Appendix E: Leapfrog Modeling Database
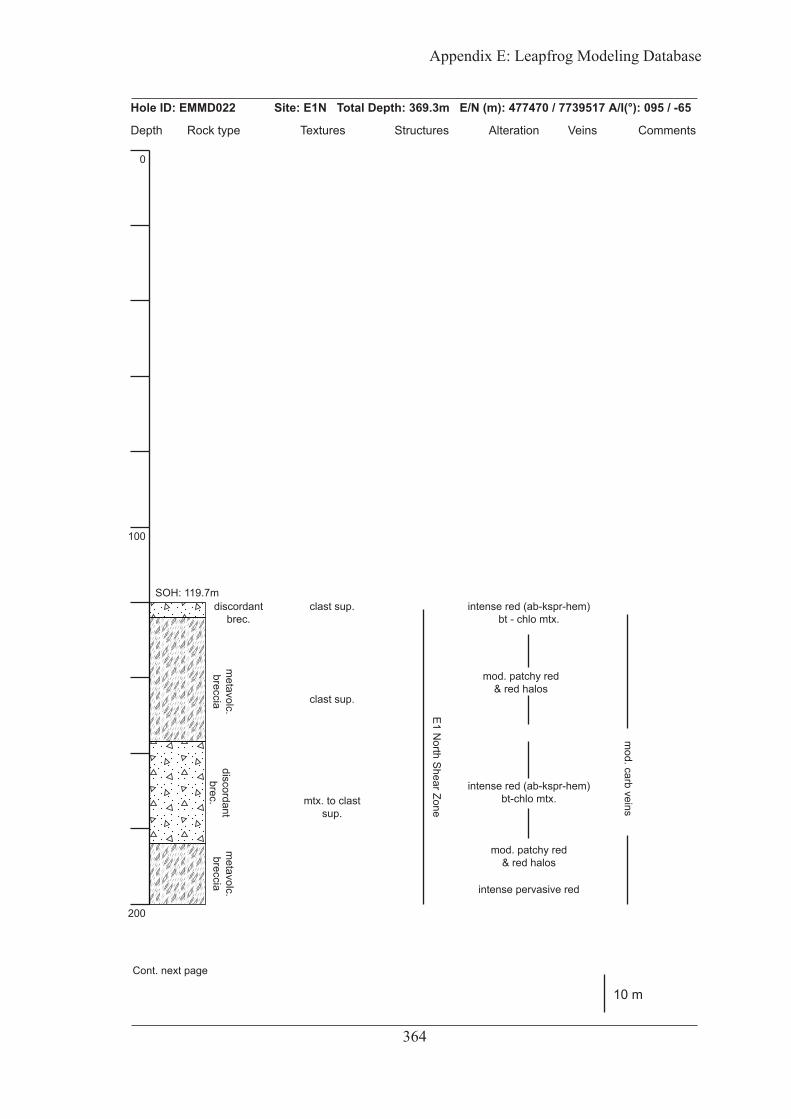
noitaretlAepyt kcoRhtpeD Structures stnemmoCsnieVserutxeT
Hole ID: EMMD022 Site: E1N Total Depth: 369.3m E/N (m): 477470 / 7739517 A/I(°): 095 / -65
0
100
200
Cont. next page
SOH: 119.7mdiscordant
brec.
discordantbrec.
metavolc.
brecciam
etavolc.breccia
clast sup. intense red (ab-kspr-hem)bt - chlo mtx.
mod. patchy red& red halos
intense red (ab-kspr-hem)bt-chlo mtx.
mod. patchy red& red halos
intense pervasive red
mtx. to clastsup.
E1 North Shear Zone
clast sup.
mod. carb veins
10 m
364
Appendix E: Leapfrog Modeling Database
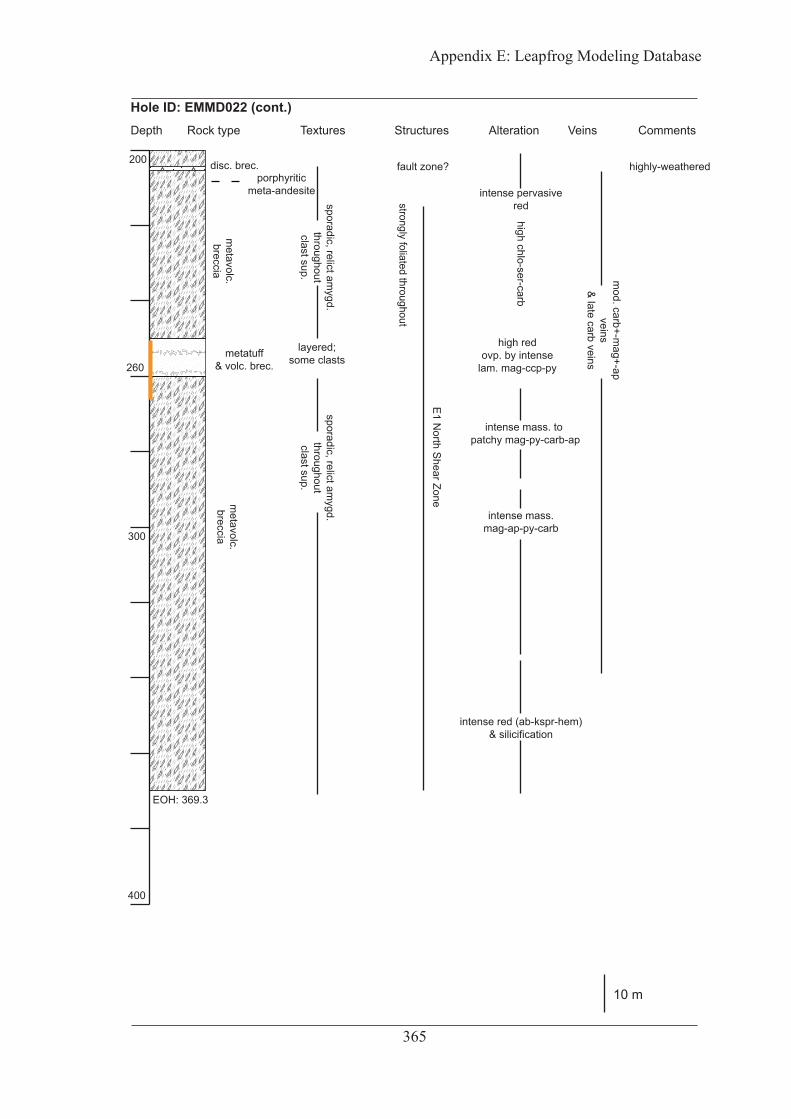
noitaretlAepyt kcoRhtpeD Structures stnemmoCsnieVserutxeT
Hole ID: EMMD022 (cont.)
200
300
400
260
EOH: 369.3
disc. brec.
metavolc.
brecciam
etavolc.breccia
metatuff& volc. brec.
derehtaew-ylhgih?enoz tluafporphyritic
meta-andesite intense pervasivered
high chlo-ser-carb
high redovp. by intense
lam. mag-ccp-py
intense mass.mag-ap-py-carb
intense mass. to patchy mag-py-carb-ap
intense red (ab-kspr-hem)& silicification
mod. carb+-m
ag+-apveins
& late carb veins
sporadic, relict amygd.
throughoutclast sup.
layered;some clasts
sporadic, relict amygd.
throughoutclast sup.
E1 North Shear Zone
strongly foliated throughout
10 m
365
Appendix E: Leapfrog Modeling Database
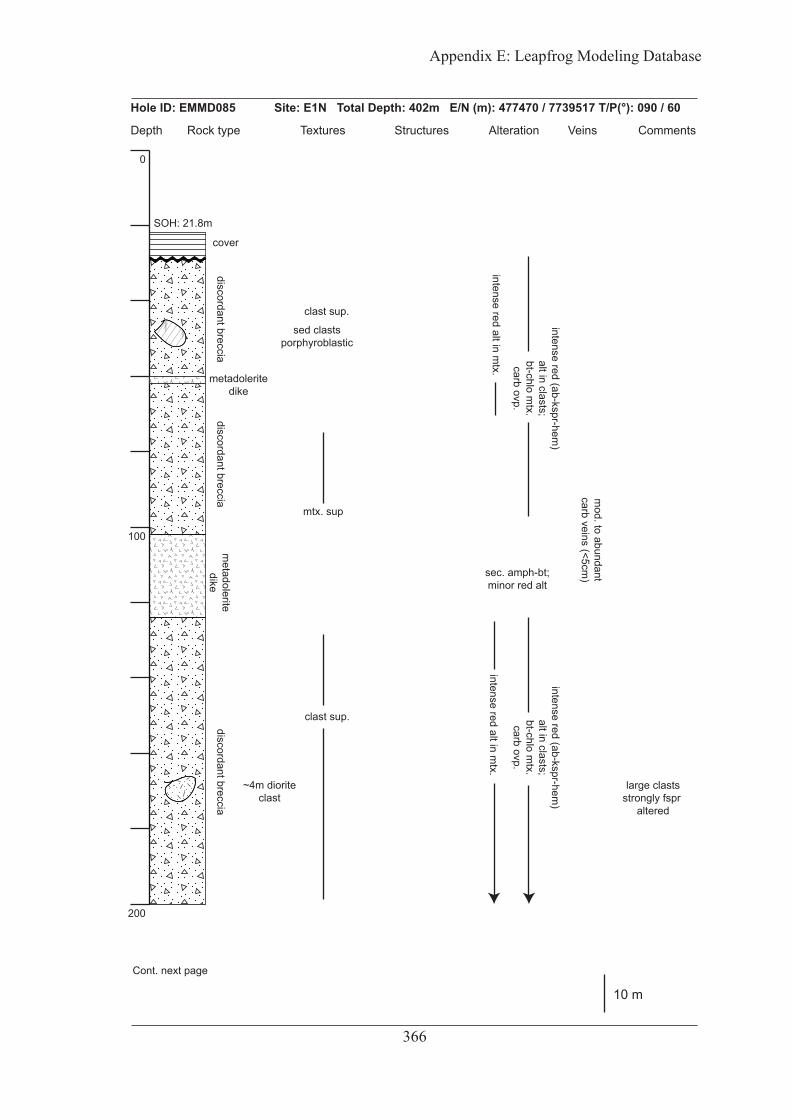
noitaretlAepyt kcoRhtpeD Structures stnemmoCsnieVserutxeT
Hole ID: EMMD085 Site: E1N Total Depth: 402m E/N (m): 477470 / 7739517 T/P(°): 090 / 60
0
100
200
Cont. next page
SOH: 21.8m
cover
aicc
erb t
nadr
ocsi
dai
ccer
b tna
droc
sid
aicc
erb t
nadr
ocsi
d
metadoleritedike
metadolerite
dike
~4m dioriteclast
intense red (ab-kspr-hem)
alt in clasts;bt-chlo m
tx.carb ovp.
intense red alt in mtx.
large clastsstrongly fspr
altered
clast sup.
mtx. sup
clast sup.
intense red alt in mtx.
sec. amph-bt;minor red alt
sed clastsporphyroblastic
intense red (ab-kspr-hem)
alt in clasts;bt-chlo m
tx.carb ovp.
mod. to abundant
carb veins (<5cm)
10 m
366
Appendix E: Leapfrog Modeling Database

noitaretlAepyt kcoRhtpeD Structures stnemmoCgninieVserutxeT
Hole ID: EMMD085 (cont.)
200
300
400
discordant brecciadiscordant breccia
~4m metased.clast
~3m dioriteclast
disc. brec.
metavolc.brec.
~10m metased.clast
Fault 1zone
highly-weatherd
large clastsstrongly fspr
altered
mtx. sup
clast sup.
intense layeredm
ag-bar-fluo-ccp-py-btovp. red (ab) alt
strongly foliated
mostly lam
inatedsporadic clasts
intense mag-ccp-pyin mtx., and clasts
intense red (ab-kspr-hem)alt in clasts;bt-chlo mtx.
intense red altin mtx.
intense red (ab-kspr-hem)
alt in clasts;bt-chlo m
tx.carb ovp.
clast. sup
metatuff& volc.brec.
metatuff& volc.brec.
metavolc.brec.
strongly foliatedfoliated
mostly lam
inatedsporadic clasts
E1 North Shear Zone
minor to m
od.carb+-fluo+-bar-ccp-py
<10cmm
od. to abundantcarb veins (<5cm
)
EOH: 402m
10 m
367
Appendix E: Leapfrog Modeling Database

noitaretlAepyt kcoRhtpeD Structures stnemmoCsnieVserutxeT
Hole ID: EMMD074 Site: E1N Total Depth: 202.6m E/N (m): 477563 / 7739425 T/P(°): 090 / 60
0
100
200
SOH: 19.1m
EOH: 202.6m
.cer
b .cl
ovat
em
.cer
b .cl
ovat
em
metatuff
highly-weathered
clast supported;som
e amygdaloidal clasts up to 0.5m
clast supported;som
e amygdaloidal clasts up to 0.5m
layered;sporadic clasts
intense patchy tom
ass. mag-carb-py-ap
intense mag-py-carb;
mostly in m
tx.
intense patchy tomass. mag-carb-py-ap
intense pervasivered
strongly foliatedsom
e clasts rotated?
high carb+-mag+-ap
veins &crackle brecciationhigh. carb+-m
ag+-apveins &crackle brecciation
10 m
368
Appendix E: Leapfrog Modeling Database

m0520
36
70
60 64
60
57??
55
6370
74
?
?
FaultsLithologyBreccia
Meta-andesite porphyryPorphyritic - amygdaloidal meta-andesite & andesitic metabasaltMarble & psammite
Observed
Inferred
AlterationStrong albite/K-feldspar + quartz
Strong magnetite ± pyrite ± apatite
Abundant carbonate veining
Station
Geological Map of the E1 North Open Pit, April 2013
Note: This map was compiled during multiple half-day incursionsbetween March 2013 and April 2014
Strike and dip
369
Appendix E: Leapfrog Modeling Database
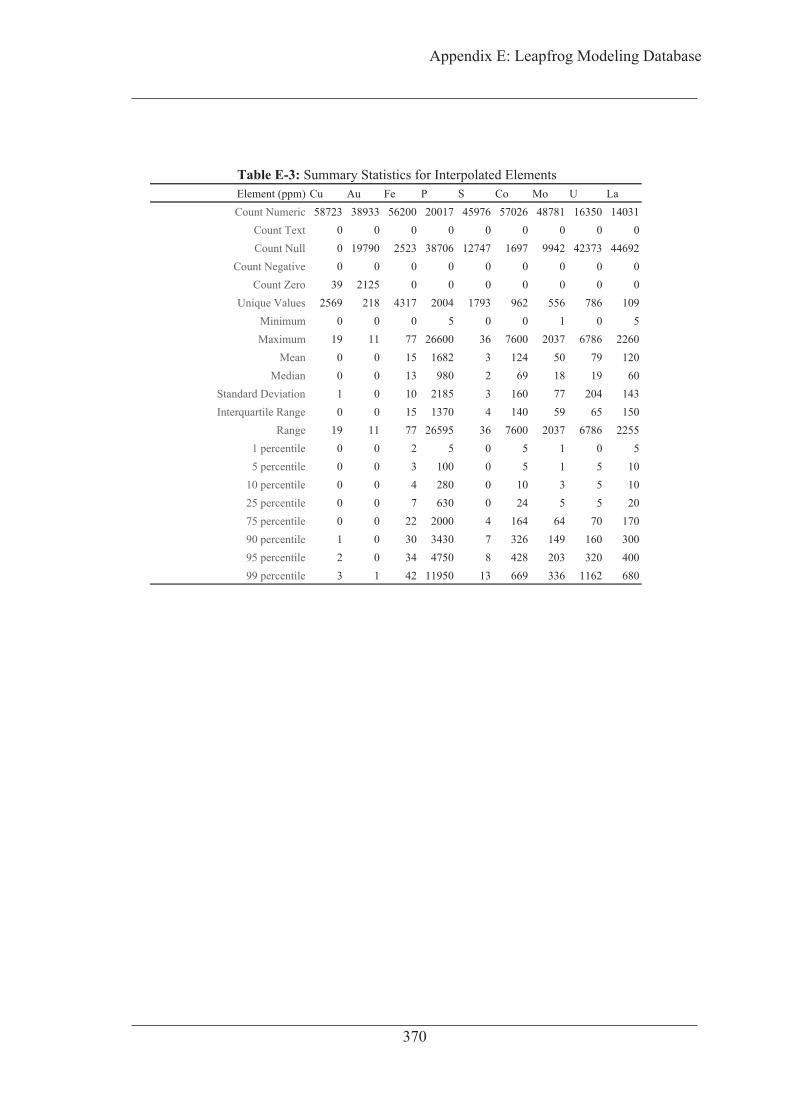
Element (ppm) Cu Au Fe P S Co Mo U La Count Numeric 58723 38933 56200 20017 45976 57026 48781 16350 14031
Count Text 0 0 0 0 0 0 0 0 0 Count Null 0 19790 2523 38706 12747 1697 9942 42373 44692
Count Negative 0 0 0 0 0 0 0 0 0 Count Zero 39 2125 0 0 0 0 0 0 0
Unique Values 2569 218 4317 2004 1793 962 556 786 109 Minimum 0 0 0 5 0 0 1 0 5 Maximum 19 11 77 26600 36 7600 2037 6786 2260
Mean 0 0 15 1682 3 124 50 79 120 Median 0 0 13 980 2 69 18 19 60
Standard Deviation 1 0 10 2185 3 160 77 204 143 Interquartile Range 0 0 15 1370 4 140 59 65 150
Range 19 11 77 26595 36 7600 2037 6786 2255 1 percentile 0 0 2 5 0 5 1 0 5 5 percentile 0 0 3 100 0 5 1 5 10
10 percentile 0 0 4 280 0 10 3 5 10 25 percentile 0 0 7 630 0 24 5 5 20 75 percentile 0 0 22 2000 4 164 64 70 170 90 percentile 1 0 30 3430 7 326 149 160 300 95 percentile 2 0 34 4750 8 428 203 320 400 99 percentile 3 1 42 11950 13 669 336 1162 680
Table E-3: Summary Statistics for Interpolated Elements
370
Appendix E: Leapfrog Modeling Database
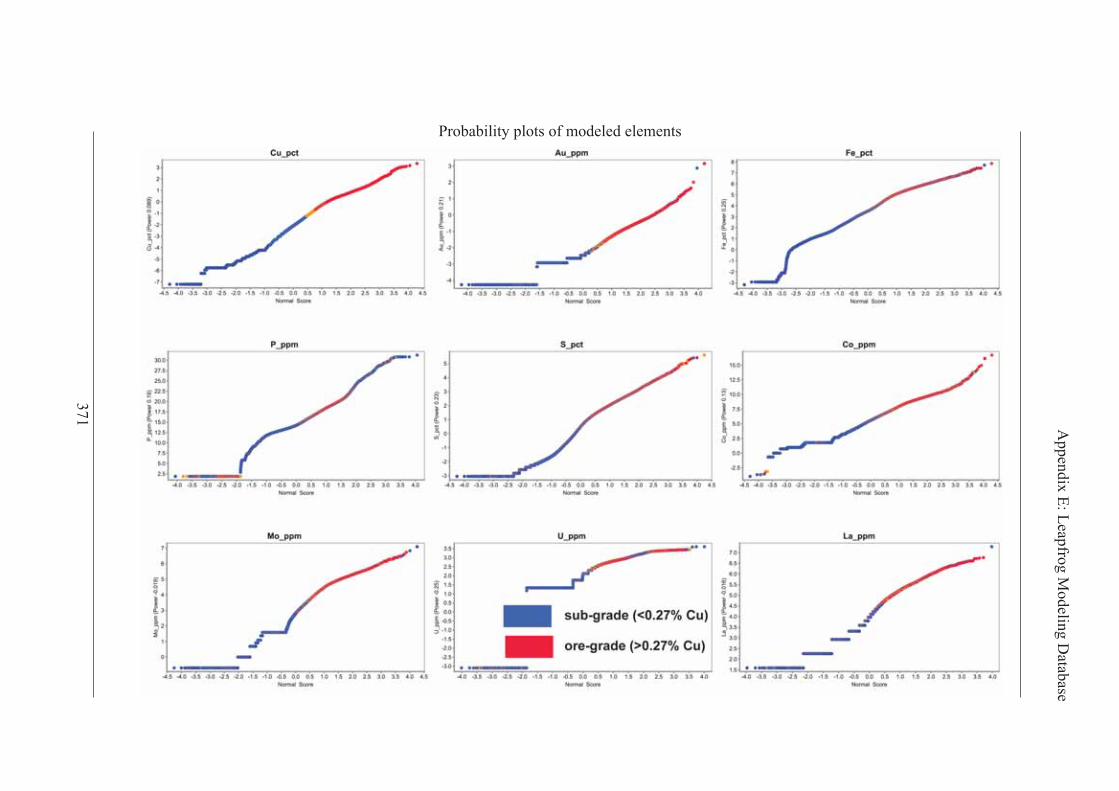
Probability plots of modeled elements
371 Appendix E: Leapfrog M
odeling Database
Appendix F Fluid Inclusion Data
372

Appendix F: Fluid Inclusion D
ata
373
Trapping Pressure (bar)
315° C
C101 L+V H2O-NaCl 0.95 -2.4 - 7 60 40 I leaked after? 4.0 - - -C102 L+V H2O-NaCl 0.95 -4.1 - 4 20 10 I - 6.6 - - -C103 L+V H2O-NaCl 0.95 -2.5 - 4 60 30 I - 4.2 - - -C105 L+V H2O-NaCl 0.95 -3.0 - 8 30 30 I leaked? 5.0 - - -C106 L+V H2O-NaCl 0.95 -2.8 - 4 20 15 I - 4.6 - - -C107 L+V H2O-NaCl 0.95 -2.2 - 7 40 25 I - 3.7 - - -C108 L+V H2O-NaCl 0.95 -4.7 - 3 15 10 I - 7.4 - - -C109 L+V H2O-NaCl 0.9 -0.8 - 10 50 15 I leaked? 1.4 - - -C110 L+V H2O-NaCl 0.9 -0.5 - 4 40 30 I - 0.9 - - -
C201 L+V H2O-NaCl 0.95 -6.0 220 4 40 20 I - 9.2 - - -C203 L+V H2O-NaCl 0.95 -9.0 - 3 5 10 I - 12.8 - - -C205 L+V H2O-NaCl 0.95 -8.0 217 1.5 15 15 I - 11.7 - - -C206 L+V H2O-NaCl 0.95 -5.0 217 2 30 10 I - 7.9 - - -C211 L+V H2O-NaCl 0.9 -4.0 - 10 50 20 I leaked after 6.4 - - -C212 L+V H2O-NaCl 0.95 0.0 - 5 30 20 I leaked after 0.0 - - -C210 L+V H2O-NaCl 0.95 -2.0 - 3 15 15 I leaked after 3.4 - - -C207 L+V H2O-NaCl 0.95 -5.1 219 2 40 10 I - 8.0 - - -C208 L+V H2O-NaCl 0.9 - 221 5 30 15 I - - - - -C214 L+V H2O-NaCl 0.9 -0.1 - 8 40 30 I leaked after 0.2 - - -C218 L+V H2O-NaCl 0.9 -3.5 - 9 50 18 I leaked after 5.7 - - -C219 L+V H2O-NaCl 0.9 -3.7 - 5 15 10 I - 6.0 - - -C202 L+V H2O-NaCl 0.95 -4.9 220 5 60 10 I - 7.7 - - -C209 L+V H2O-NaCl 0.95 -4.9 232 4 30 10 I - 7.7 - - -C225 L+V H2O-NaCl 0.95 -10.0 - 1 15 15 I - 13.9 - - -
C2Th01 L+V H2O-NaCl 0.95 - 210 3 20 10 I - - - - -C2Th02 L+V H2O-NaCl 0.9 - 209 4 15 4 I - - - - -C2Th03 L+V H2O-NaCl 0.9 -2.1 180 3 30 20 I - 3.5 0.92 16.6 2300C2Th04 L+V H2O-NaCl 0.95 -3.0 209 2 15 10 I - 5.0 - - -C2Th05 L+V H2O-NaCl 0.95 - 247 2 10 10 I - - - - -C2Th06 L+V H2O-NaCl 0.95 -5.0 148 1 10 6 I - 7.9 0.98 19.4 3300
Table F-1: Stage 3 Barite FIA 2A Fluid inclusion Data; Sample EMMD055-239.4mThl-v
(°C)
Bubble diameter
(mm)
Inclusion length (mm)
Inclusion width (mm)
FI Number Phase System Liquid
Phase %
Final melting
(ice)
Salinity (wt % NaCl)
bulk
(g/cm3)dP/dT
(bar/°C)Inclusion
shape Comments
Chip 1
Chip 2
L, liquid; V, vapour; I, irregular
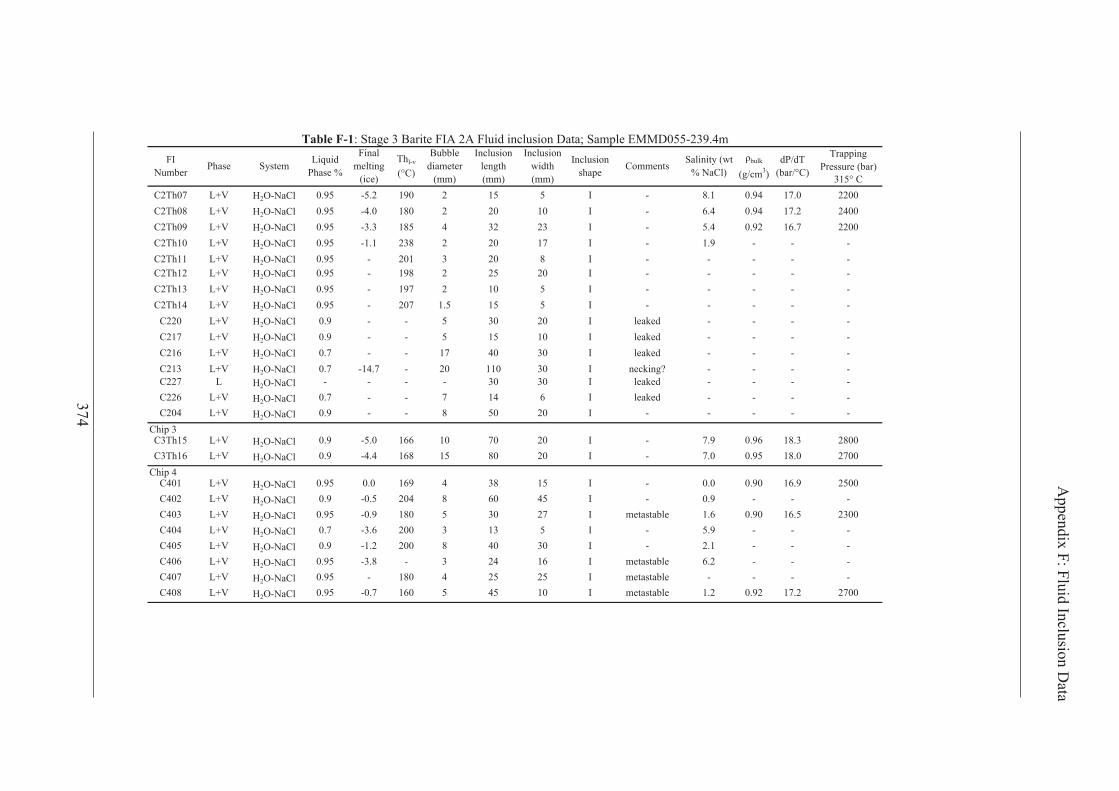
Appendix F: Fluid Inclusion D
ata
374
Trapping Pressure (bar)
315° C
Table F-1: Stage 3 Barite FIA 2A Fluid inclusion Data; Sample EMMD055-239.4mThl-v
(°C)
Bubble diameter
(mm)
Inclusion length (mm)
Inclusion width (mm)
FI Number Phase System Liquid
Phase %
Final melting
(ice)
Salinity (wt % NaCl)
bulk
(g/cm3)dP/dT
(bar/°C)Inclusion
shape Comments
C2Th07 L+V H2O-NaCl 0.95 -5.2 190 2 15 5 I - 8.1 0.94 17.0 2200C2Th08 L+V H2O-NaCl 0.95 -4.0 180 2 20 10 I - 6.4 0.94 17.2 2400C2Th09 L+V H2O-NaCl 0.95 -3.3 185 4 32 23 I - 5.4 0.92 16.7 2200C2Th10 L+V H2O-NaCl 0.95 -1.1 238 2 20 17 I - 1.9 - - -C2Th11 L+V H2O-NaCl 0.95 - 201 3 20 8 I - - - - -C2Th12 L+V H2O-NaCl 0.95 - 198 2 25 20 I - - - - -C2Th13 L+V H2O-NaCl 0.95 - 197 2 10 5 I - - - - -C2Th14 L+V H2O-NaCl 0.95 - 207 1.5 15 5 I - - - - -
C220 L+V H2O-NaCl 0.9 - - 5 30 20 I leaked - - - -C217 L+V H2O-NaCl 0.9 - - 5 15 10 I leaked - - - -C216 L+V H2O-NaCl 0.7 - - 17 40 30 I leaked - - - -C213 L+V H2O-NaCl 0.7 -14.7 - 20 110 30 I necking? - - - -C227 L H2O-NaCl - - - - 30 30 I leaked - - - -C226 L+V H2O-NaCl 0.7 - - 7 14 6 I leaked - - - -C204 L+V H2O-NaCl 0.9 - - 8 50 20 I - - - - -
C3Th15 L+V H2O-NaCl 0.9 -5.0 166 10 70 20 I - 7.9 0.96 18.3 2800C3Th16 L+V H2O-NaCl 0.9 -4.4 168 15 80 20 I - 7.0 0.95 18.0 2700
C401 L+V H2O-NaCl 0.95 0.0 169 4 38 15 I - 0.0 0.90 16.9 2500C402 L+V H2O-NaCl 0.9 -0.5 204 8 60 45 I - 0.9 - - -C403 L+V H2O-NaCl 0.95 -0.9 180 5 30 27 I metastable 1.6 0.90 16.5 2300C404 L+V H2O-NaCl 0.7 -3.6 200 3 13 5 I - 5.9 - - -C405 L+V H2O-NaCl 0.9 -1.2 200 8 40 30 I - 2.1 - - -C406 L+V H2O-NaCl 0.95 -3.8 - 3 24 16 I metastable 6.2 - - -C407 L+V H2O-NaCl 0.95 - 180 4 25 25 I metastable - - - -C408 L+V H2O-NaCl 0.95 -0.7 160 5 45 10 I metastable 1.2 0.92 17.2 2700
Chip 3
Chip 4

Appendix F: Fluid Inclusion D
ata
375
HH, hydrohalite; L, liquid; V, vapour; I, irregular; IC, irregular circle; C, circular; CI, curved irregular; CR, curved rectangular;R, rectangular; T, triangular; H, hexagonal; L (shape column), L-shaped
FI Number Min /FIA Origin Phases System Liquid
Phase %
Tm - eutectic (°C±10)
Tm - HH (°C ± 5)
Tm - Ice (°C ±1)
Bubble diameter
(mm)
Inclusion length (mm)
Inclusion width (mm)
Inclusion shape
Inclusion area (mm2)
Wt % NaCl
Wt % CaCl2
Comments
C2SF01 L+V H2O-CaCl2-NaCl 95 - -33 -19.0 2 15 10 CR 75 4.4 16.0C2SF02 L+V H2O-CaCl2-NaCl 95 - -33 -19.0 2 15 12 T 90 4.4 16.0C2SF03 L+V H2O-CaCl2-NaCl 95 - -36 -12.5 3 22 15 CI 165 2.6 13.6 refilledC2SF05 L+V H2O-CaCl2-NaCl 95 -60 -32 -14.9 3 40 20 CI 400 4.3 13.6C2SF06 L+V H2O-CaCl2-NaCl 95 -63 -30 -11.5 3 30 20 CR 300 4.7 10.7C2SF07 L+V H2O-CaCl2-NaCl 95 -59.5 -32 -9.1 2 15 15 CR 113 3.2 10.0C2SF08 L+V H2O-CaCl2-NaCl 95 - -32 -10.5 6 40 20 CR 400 3.5 11.0C2SF09 L+V H2O-CaCl2-NaCl 95 - -30 -15.0 3 15 10 CR 75 5.5 12.5
C1SF10 L+V H2O-CaCl2-NaCl 90 - - - 5 20 15 T 150 - - leakedC1SF11 L+V H2O-CaCl2-NaCl 95 - -34 -16.9 2 25 18 CI 225 3.7 15.4C1SF12 L+V H2O-CaCl2-NaCl 95 - -33 -13.0 2 25 5 CI 63 3.6 13.0C1SF13 L+V H2O-CaCl2-NaCl 95 - -33 -19.0 2 10 8 C 40 4.4 16.0C1SF14 L+V H2O-CaCl2-NaCl 95 - -29 -17.0 2 15 8 R 60 6.6 12.7C1SF15 L+V H2O-CaCl2-NaCl 95 - -29 -14.0 3 18 9 I 81 5.9 11.4
C1A1002 L+V H2O-CaCl2-NaCl 95 -49 - -19.0 3 27 19 I 513 - - leakedC1A1003 L+V H2O-CaCl2-NaCl 90 -49 -33 -19.1 3 20 17 C 534 4.4 16.0C1A1004 L+V H2O-CaCl2-NaCl 95 -49 -32 -19.2 2 20 8 IR 160 4.9 15.6C1A1005 L+V H2O-CaCl2-NaCl 90 - -32 -21.0 3 15 13 T 98 5.2 16.3C1A1006 L+V H2O-CaCl2-NaCl 95 - -31 -20.8 2 15 14 I 210 5.8 15.7C1A1007 L+V H2O-CaCl2-NaCl 95 -48 -31 -20.8 2 13 10 H - 5.8 15.7C1A1008 L H2O-CaCl2-NaCl 100 - -31 -20.6 - 11 11 C 190 5.8 15.6C1A1009 L H2O-CaCl2-NaCl 100 - -36 -20.3 - 12 12 C 226 3.3 17.7C1A1010 L+V H2O-CaCl2-NaCl 95 - -35 -20.3 2 18 7 CR 126 3.7 17.4C1A1011 L+V H2O-CaCl2-NaCl 95 - - -20.3 2 15 10 I 150 - -C1A1012 L+V H2O-CaCl2-NaCl 95 - -29 -19.7 2 10 10 IR 100 7.2 13.8C1A1013 L H2O-CaCl2-NaCl 100 - - -21.3 - 15 10 I 150 - -C1A1014 L+V H2O-CaCl2-NaCl 95 - -35 -21.3 2 12 9 I 108 3.8 17.8C1A1015 L+V H2O-CaCl2-NaCl 95 - -30 -20.0 2 10 9 I 90 6.4 14.7C1A1016 L+V H2O-CaCl2-NaCl 95 - -33 -19.1 2 10 7 C 110 4.4 16.0C1A1017 L+V H2O-CaCl2-NaCl 95 - -29 -20.2 1 9 7 CR 63 7.3 14.0C1A1018 L+V H2O-CaCl2-NaCl 95 - - -14.2 2 8 7 C 88 - -
Tabe F-2: Late Stage 3 FIA 2B and 2D Data
EMMD077-239.4mChip 2
Chip 1
E1S: EMM019-310.9m
Barite/FIA 2B S
Barite/FIA 2B S
Chip 1
Barite/FIA 2B S
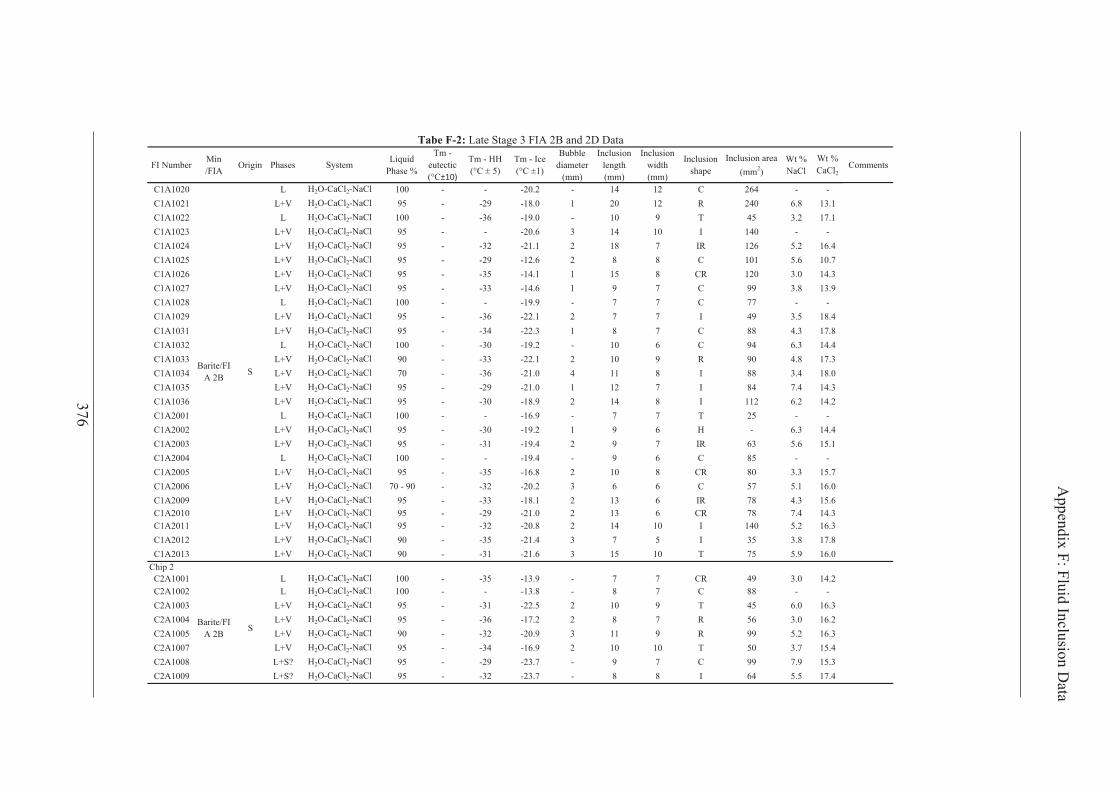
Appendix F: Fluid Inclusion D
ata
376
FI Number Min /FIA Origin Phases System Liquid
Phase %
Tm - eutectic (°C±10)
Tm - HH (°C ± 5)
Tm - Ice (°C ±1)
Bubble diameter
(mm)
Inclusion length (mm)
Inclusion width (mm)
Inclusion shape
Inclusion area (mm2)
Wt % NaCl
Wt % CaCl2
Comments
Tabe F-2: Late Stage 3 FIA 2B and 2D Data
C1A1020 L H2O-CaCl2-NaCl 100 - - -20.2 - 14 12 C 264 - -C1A1021 L+V H2O-CaCl2-NaCl 95 - -29 -18.0 1 20 12 R 240 6.8 13.1C1A1022 L H2O-CaCl2-NaCl 100 - -36 -19.0 - 10 9 T 45 3.2 17.1C1A1023 L+V H2O-CaCl2-NaCl 95 - - -20.6 3 14 10 I 140 - -C1A1024 L+V H2O-CaCl2-NaCl 95 - -32 -21.1 2 18 7 IR 126 5.2 16.4C1A1025 L+V H2O-CaCl2-NaCl 95 - -29 -12.6 2 8 8 C 101 5.6 10.7C1A1026 L+V H2O-CaCl2-NaCl 95 - -35 -14.1 1 15 8 CR 120 3.0 14.3C1A1027 L+V H2O-CaCl2-NaCl 95 - -33 -14.6 1 9 7 C 99 3.8 13.9C1A1028 L H2O-CaCl2-NaCl 100 - - -19.9 - 7 7 C 77 - -C1A1029 L+V H2O-CaCl2-NaCl 95 - -36 -22.1 2 7 7 I 49 3.5 18.4C1A1031 L+V H2O-CaCl2-NaCl 95 - -34 -22.3 1 8 7 C 88 4.3 17.8C1A1032 L H2O-CaCl2-NaCl 100 - -30 -19.2 - 10 6 C 94 6.3 14.4C1A1033 L+V H2O-CaCl2-NaCl 90 - -33 -22.1 2 10 9 R 90 4.8 17.3C1A1034 L+V H2O-CaCl2-NaCl 70 - -36 -21.0 4 11 8 I 88 3.4 18.0C1A1035 L+V H2O-CaCl2-NaCl 95 - -29 -21.0 1 12 7 I 84 7.4 14.3C1A1036 L+V H2O-CaCl2-NaCl 95 - -30 -18.9 2 14 8 I 112 6.2 14.2C1A2001 L H2O-CaCl2-NaCl 100 - - -16.9 - 7 7 T 25 - -C1A2002 L+V H2O-CaCl2-NaCl 95 - -30 -19.2 1 9 6 H - 6.3 14.4C1A2003 L+V H2O-CaCl2-NaCl 95 - -31 -19.4 2 9 7 IR 63 5.6 15.1C1A2004 L H2O-CaCl2-NaCl 100 - - -19.4 - 9 6 C 85 - -C1A2005 L+V H2O-CaCl2-NaCl 95 - -35 -16.8 2 10 8 CR 80 3.3 15.7C1A2006 L+V H2O-CaCl2-NaCl 70 - 90 - -32 -20.2 3 6 6 C 57 5.1 16.0C1A2009 L+V H2O-CaCl2-NaCl 95 - -33 -18.1 2 13 6 IR 78 4.3 15.6C1A2010 L+V H2O-CaCl2-NaCl 95 - -29 -21.0 2 13 6 CR 78 7.4 14.3C1A2011 L+V H2O-CaCl2-NaCl 95 - -32 -20.8 2 14 10 I 140 5.2 16.3C1A2012 L+V H2O-CaCl2-NaCl 90 - -35 -21.4 3 7 5 I 35 3.8 17.8C1A2013 L+V H2O-CaCl2-NaCl 90 - -31 -21.6 3 15 10 T 75 5.9 16.0
C2A1001 L H2O-CaCl2-NaCl 100 - -35 -13.9 - 7 7 CR 49 3.0 14.2C2A1002 L H2O-CaCl2-NaCl 100 - - -13.8 - 8 7 C 88 - -C2A1003 L+V H2O-CaCl2-NaCl 95 - -31 -22.5 2 10 9 T 45 6.0 16.3C2A1004 L+V H2O-CaCl2-NaCl 95 - -36 -17.2 2 8 7 R 56 3.0 16.2C2A1005 L+V H2O-CaCl2-NaCl 90 - -32 -20.9 3 11 9 R 99 5.2 16.3C2A1007 L+V H2O-CaCl2-NaCl 95 - -34 -16.9 2 10 10 T 50 3.7 15.4C2A1008 L+S? H2O-CaCl2-NaCl 95 - -29 -23.7 - 9 7 C 99 7.9 15.3C2A1009 L+S? H2O-CaCl2-NaCl 95 - -32 -23.7 - 8 8 I 64 5.5 17.4
Chip 2
Barite/FIA 2B S
SBarite/FIA 2B

Appendix F: Fluid Inclusion D
ata
377
FI Number Min /FIA Origin Phases System Liquid
Phase %
Tm - eutectic (°C±10)
Tm - HH (°C ± 5)
Tm - Ice (°C ±1)
Bubble diameter
(mm)
Inclusion length (mm)
Inclusion width (mm)
Inclusion shape
Inclusion area (mm2)
Wt % NaCl
Wt % CaCl2
Comments
Tabe F-2: Late Stage 3 FIA 2B and 2D Data
C2A1010 L+V H2O-CaCl2-NaCl 95 - -33 -23.7 2 8 8 C 101 4.9 17.9C2A1011 L+S? H2O-CaCl2-NaCl 95 - -29 -22.7 - 7 5 I 35 7.8 14.9C2A1013 L+S? H2O-CaCl2-NaCl 95 - -30 -22.7 - 15 11 T 83 6.8 15.7C2A1014 L+V H2O-CaCl2-NaCl 95 - -30 -21.8 1 9 8 C 113 6.7 15.4C2A1015 L+S? H2O-CaCl2-NaCl 95 - -31 -23.4 - 12 10 R 120 6.2 16.7C2A1016 L+V+S H2O-CaCl2-NaCl 95 - -34 -23.4 1 11 7 I 77 4.4 18.3C2A1017 L+S? H2O-CaCl2-NaCl 95 - -29 -23.8 - 12 12 CR 144 8.0 15.3
C2A1001 L+V H2O-CaCl2-NaCl 90 - -34 -18.8 2 13 11 C 225 3.9 16.3 metastableC2A1002 L H2O-CaCl2-NaCl 100 - -33 -13.1 - 8 7 H - 3.6 13.0C2A1003 L H2O-CaCl2-NaCl 100 - -35 -14.8 - 17 10 I 170 3.1 14.7C2A1004 L+V H2O-CaCl2-NaCl 95 - -29 -13.0 2 20 7 IR 140 5.7 10.9C2A1005 L H2O-CaCl2-NaCl 100 - - -14.7 - 17 8 I 136 - -C2A1006 L H2O-CaCl2-NaCl 100 - - -14.1 - 12 9 H - - -C2A1011 L+V H2O-CaCl2-NaCl 90 - -29 -17.1 2 12 8 C 151 6.6 12.8C2A1012 L H2O-CaCl2-NaCl 100 - -36 -17.0 - 12 7 CR 84 3.0 16.1C2A1013 L H2O-CaCl2-NaCl 100 - - -16.2 - 9 6 I 54 - -C2A1014 L H2O-CaCl2-NaCl 100 - - -16.2 - 9 6 CR 54 - -C2A1015 L H2O-CaCl2-NaCl 100 - -29 -10.5 - 9 8 C 113 5.0 9.5C2A1016 L H2O-CaCl2-NaCl 100 - -35 -13.6 - 20 10 IR 200 3.0 14.0C2A1017 L H2O-CaCl2-NaCl 100 - -33 -12.7 - 20 12 C 377 3.5 12.8C2A1018 L+V H2O-CaCl2-NaCl 95 - - -21.7 2 15 12 C 283 - -C2A1019 L H2O-CaCl2-NaCl 100 - -29 -12.8 - 25 10 I 250 5.6 10.8C2A1020 L H2O-CaCl2-NaCl 100 - -30 -13.8 - 18 11 IR 198 5.2 12.0C2A1021 L+V H2O-CaCl2-NaCl 95 - - - 6 13 7 I 91 - - leakedC2A1022 L+V H2O-CaCl2-NaCl 95 - - -13.9 1 12 8 H - - -C2A1023 L+V H2O-CaCl2-NaCl 95 - -31 -15.3 3 9 6 T 27 4.9 13.3C2A1024 L H2O-CaCl2-NaCl 100 - - -13.0 - 12 9 I 108 - -C2A1025 L+V H2O-CaCl2-NaCl 95 - -35 -13.1 2 10 9 I 90 2.9 13.7C2A1026 L H2O-CaCl2-NaCl 100 - -30 -17.0 - 10 7 C 110 5.9 13.4C2A1027 L H2O-CaCl2-NaCl 100 - -31 -15.0 - 10 6 CR 60 4.9 13.1C2A1028 L+V H2O-CaCl2-NaCl 95 - -34 -12.6 1 9 5 IR 45 3.1 13.1
Calcite/FIA 2D P
E1S: EMM019-311.1mChip 2
Barite/FIA 2B S

Appendix G Stable Isotope Raw Data
378
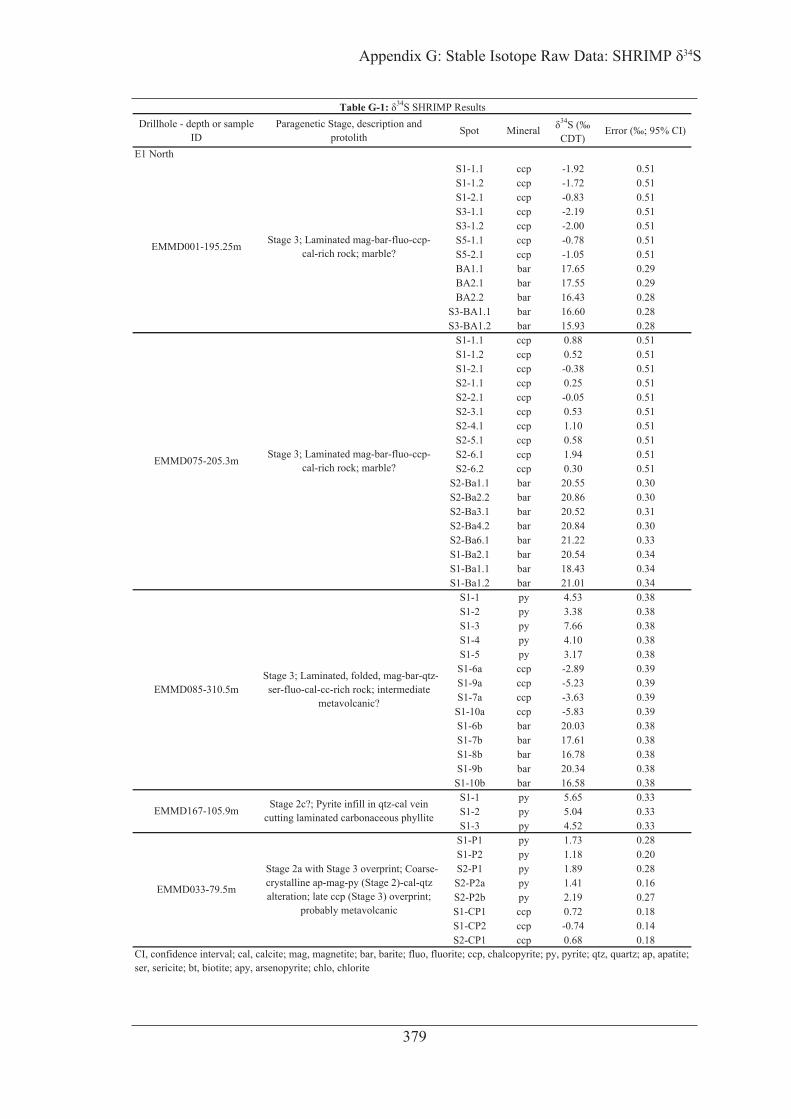
Drillhole - depth or sample ID
Paragenetic Stage, description and protolith Spot Mineral
34S (‰ CDT)
Error (‰; 95% CI)
S1-1.1 ccp -1.92 0.51S1-1.2 ccp -1.72 0.51S1-2.1 ccp -0.83 0.51S3-1.1 ccp -2.19 0.51S3-1.2 ccp -2.00 0.51S5-1.1 ccp -0.78 0.51S5-2.1 ccp -1.05 0.51BA1.1 bar 17.65 0.29BA2.1 bar 17.55 0.29BA2.2 bar 16.43 0.28
S3-BA1.1 bar 16.60 0.28S3-BA1.2 bar 15.93 0.28
S1-1.1 ccp 0.88 0.51S1-1.2 ccp 0.52 0.51S1-2.1 ccp -0.38 0.51S2-1.1 ccp 0.25 0.51S2-2.1 ccp -0.05 0.51S2-3.1 ccp 0.53 0.51S2-4.1 ccp 1.10 0.51S2-5.1 ccp 0.58 0.51S2-6.1 ccp 1.94 0.51S2-6.2 ccp 0.30 0.51
S2-Ba1.1 bar 20.55 0.30S2-Ba2.2 bar 20.86 0.30S2-Ba3.1 bar 20.52 0.31S2-Ba4.2 bar 20.84 0.30S2-Ba6.1 bar 21.22 0.33S1-Ba2.1 bar 20.54 0.34S1-Ba1.1 bar 18.43 0.34S1-Ba1.2 bar 21.01 0.34
S1-1 py 4.53 0.38S1-2 py 3.38 0.38S1-3 py 7.66 0.38S1-4 py 4.10 0.38S1-5 py 3.17 0.38S1-6a ccp -2.89 0.39S1-9a ccp -5.23 0.39S1-7a ccp -3.63 0.39S1-10a ccp -5.83 0.39S1-6b bar 20.03 0.38S1-7b bar 17.61 0.38S1-8b bar 16.78 0.38S1-9b bar 20.34 0.38S1-10b bar 16.58 0.38
S1-1 py 5.65 0.33S1-2 py 5.04 0.33S1-3 py 4.52 0.33
S1-P1 py 1.73 0.28S1-P2 py 1.18 0.20S2-P1 py 1.89 0.28S2-P2a py 1.41 0.16S2-P2b py 2.19 0.27S1-CP1 ccp 0.72 0.18S1-CP2 ccp -0.74 0.14S2-CP1 ccp 0.68 0.18
E1 North
Table G-1: 34S SHRIMP Results
EMMD001-195.25m Stage 3; Laminated mag-bar-fluo-ccp-cal-rich rock; marble?
EMMD075-205.3m Stage 3; Laminated mag-bar-fluo-ccp-cal-rich rock; marble?
EMMD085-310.5m
Stage 2a with Stage 3 overprint; Coarse-crystalline ap-mag-py (Stage 2)-cal-qtz alteration; late ccp (Stage 3) overprint;
probably metavolcanic
EMMD033-79.5m
Stage 3; Laminated, folded, mag-bar-qtz-ser-fluo-cal-cc-rich rock; intermediate
metavolcanic?
EMMD167-105.9m Stage 2c?; Pyrite infill in qtz-cal vein cutting laminated carbonaceous phyllite
CI, confidence interval; cal, calcite; mag, magnetite; bar, barite; fluo, fluorite; ccp, chalcopyrite; py, pyrite; qtz, quartz; ap, apatite; ser, sericite; bt, biotite; apy, arsenopyrite; chlo, chlorite
379
34S
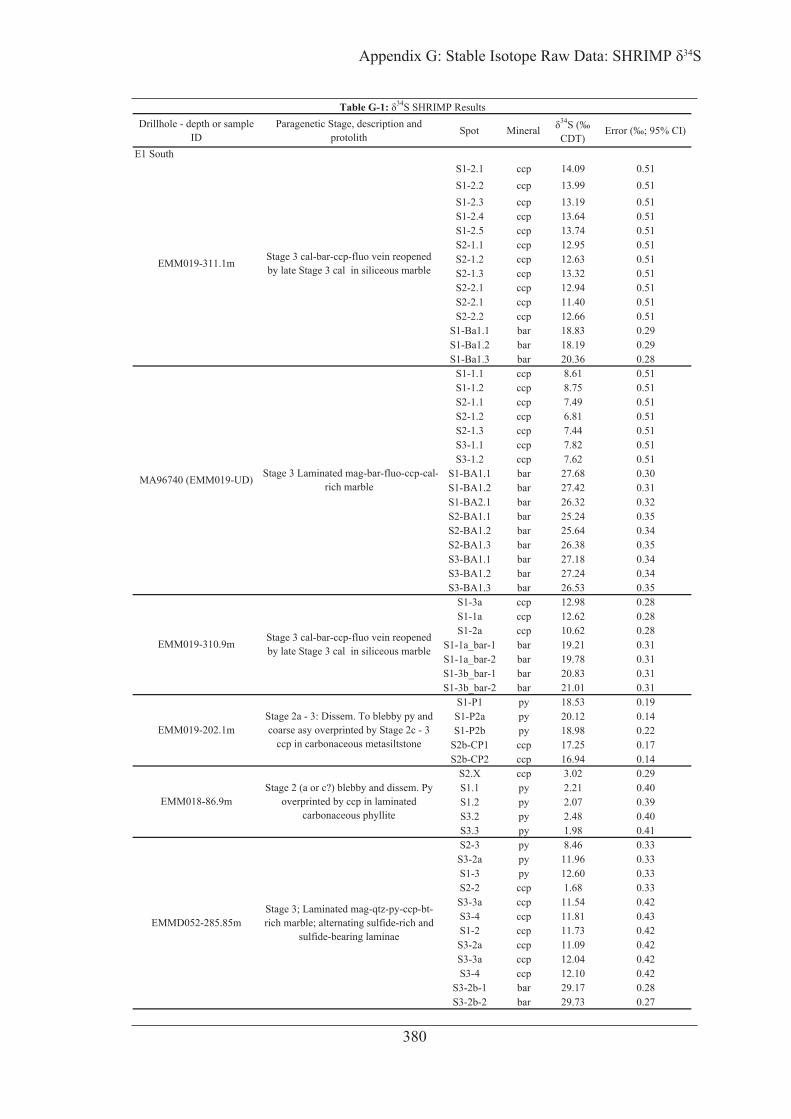
Drillhole - depth or sample ID
Paragenetic Stage, description and protolith Spot Mineral
34S (‰ CDT)
Error (‰; 95% CI)
Table G-1: 34S SHRIMP Results
S1-2.1 ccp 14.09 0.51S1-2.2 ccp 13.99 0.51S1-2.3 ccp 13.19 0.51S1-2.4 ccp 13.64 0.51S1-2.5 ccp 13.74 0.51S2-1.1 ccp 12.95 0.51S2-1.2 ccp 12.63 0.51S2-1.3 ccp 13.32 0.51S2-2.1 ccp 12.94 0.51S2-2.1 ccp 11.40 0.51S2-2.2 ccp 12.66 0.51
S1-Ba1.1 bar 18.83 0.29S1-Ba1.2 bar 18.19 0.29S1-Ba1.3 bar 20.36 0.28
S1-1.1 ccp 8.61 0.51S1-1.2 ccp 8.75 0.51S2-1.1 ccp 7.49 0.51S2-1.2 ccp 6.81 0.51S2-1.3 ccp 7.44 0.51S3-1.1 ccp 7.82 0.51S3-1.2 ccp 7.62 0.51
S1-BA1.1 bar 27.68 0.30S1-BA1.2 bar 27.42 0.31S1-BA2.1 bar 26.32 0.32S2-BA1.1 bar 25.24 0.35S2-BA1.2 bar 25.64 0.34S2-BA1.3 bar 26.38 0.35S3-BA1.1 bar 27.18 0.34S3-BA1.2 bar 27.24 0.34S3-BA1.3 bar 26.53 0.35
S1-3a ccp 12.98 0.28S1-1a ccp 12.62 0.28S1-2a ccp 10.62 0.28
S1-1a_bar-1 bar 19.21 0.31S1-1a_bar-2 bar 19.78 0.31S1-3b_bar-1 bar 20.83 0.31S1-3b_bar-2 bar 21.01 0.31
S1-P1 py 18.53 0.19S1-P2a py 20.12 0.14S1-P2b py 18.98 0.22
S2b-CP1 ccp 17.25 0.17S2b-CP2 ccp 16.94 0.14
S2.X ccp 3.02 0.29S1.1 py 2.21 0.40S1.2 py 2.07 0.39S3.2 py 2.48 0.40S3.3 py 1.98 0.41S2-3 py 8.46 0.33S3-2a py 11.96 0.33S1-3 py 12.60 0.33S2-2 ccp 1.68 0.33S3-3a ccp 11.54 0.42S3-4 ccp 11.81 0.43S1-2 ccp 11.73 0.42S3-2a ccp 11.09 0.42S3-3a ccp 12.04 0.42S3-4 ccp 12.10 0.42
S3-2b-1 bar 29.17 0.28S3-2b-2 bar 29.73 0.27
E1 South
EMM018-86.9mStage 2 (a or c?) blebby and dissem. Py
overprinted by ccp in laminated carbonaceous phyllite
EMMD052-285.85mStage 3; Laminated mag-qtz-py-ccp-bt-rich marble; alternating sulfide-rich and
sulfide-bearing laminae
EMM019-311.1m Stage 3 cal-bar-ccp-fluo vein reopened by late Stage 3 cal in siliceous marble
Stage 3 Laminated mag-bar-fluo-ccp-cal-rich marble
EMM019-310.9m Stage 3 cal-bar-ccp-fluo vein reopened by late Stage 3 cal in siliceous marble
EMM019-202.1mStage 2a - 3: Dissem. To blebby py and coarse asy overprinted by Stage 2c - 3
ccp in carbonaceous metasiltstone
MA96740 (EMM019-UD)
380
34S

Drillhole - depth or sample ID
Paragenetic Stage, description and protolith Spot Mineral
34S (‰ CDT)
Error (‰; 95% CI)
Table G-1: 34S SHRIMP Results
S1-1 ccp 14.72 0.39S1-4 ccp 14.57 0.39
S1-2.1 py 18.46 0.38S1-3 py 18.27 0.38S2-1 py 17.63 0.38S2-2 py 17.58 0.38
S2-3.1 py 18.01 0.381.1 bar 9.78 0.391.2 bar 9.88 0.391.3 bar 9.59 0.391.1 bar 6.85 0.391.2 bar 5.28 0.381.3 bar 4.53 0.38
S1-1 py 13.38 0.39S1-2 py 15.62 0.38
S1-3 ccp 12.46 0.30
S1-4 ccp 15.01 0.41S1-1 ccp 16.91 0.44S1-2 py 20.35 0.33S1-3 py 18.92 0.33S2-2 py 14.65 0.33S2-1 py 14.65 0.33
S1-P1 py 0.53 0.18S1-P2 py 2.72 0.13
S2-CP1 ccp 4.29 0.47S2-CP2 ccp 3.72 0.47S1-P3a py 8.16 2.83S1-P4a py 2.78 0.11S1-P4b py 0.56 0.64
S1-3 ccp 0.47 0.26S1-4 ccp 0.90 0.26S1-1 py 1.62 0.38S1-2 py 1.52 0.38
E1 East
E8
EMMD007-146.15mBt-mag-rich porphyoblastic marble?
Actinolite p.blasts replaced by Stage 2 (a or c?): py-mag-and Stage 2c - 3 ccp
EMMD007-112m Stage 3 bar-cal-rich vein cutting metasiltstone
EMMD226-130.4mStage 2 py-mag-altered amygdaloidal
meta-andesite-basalt; Stage 3 ccp overprint
Stage 3 bar-cal-rich vein cutting metasiltstone
EMMD008-108.1mBt-mag-rich porphyoblastic marble?
Actinolite p.blasts replaced by Stage 2 (a or c?): py-mag-and Stage 2c - 3 ccp
EMMD008-114.15mStage 2a qtz vein re-opened by Stage 3
bar-cal-py-ccp vein cutting massive magnetite-altered metasediment
EMMD174-117.7m Lightly-altered py-mag-ccp-bearing amphibolite; Stage unconstrained
EMMD007-211m
EMMD174-92.3m Lightly-altered py-mag-bearing bt-rich Corella marble; Stage unconstrained
381
34S
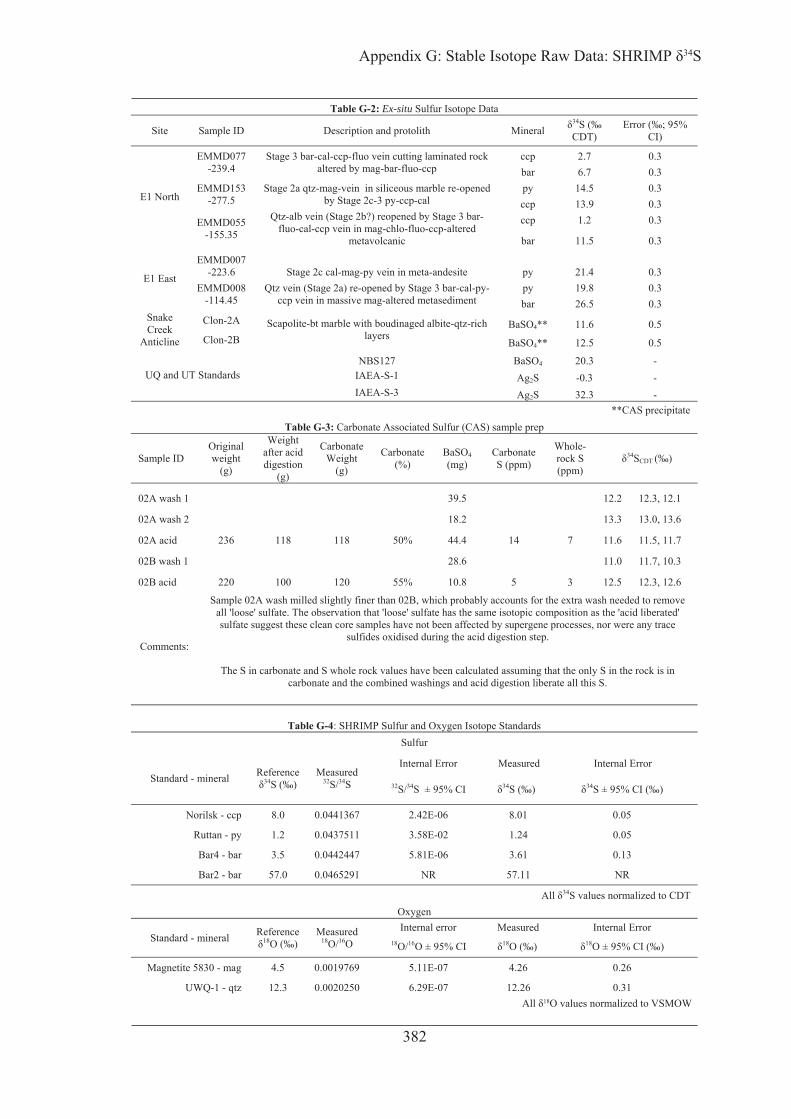
Table G-2: Ex-situ Sulfur Isotope Data
Site Sample ID Description and protolith Mineral 34S (‰ CDT)
Error (‰; 95% CI)
E1 North
EMMD077-239.4
Stage 3 bar-cal-ccp-fluo vein cutting laminated rock altered by mag-bar-fluo-ccp
ccp 2.7 0.3 bar 6.7 0.3
EMMD153-277.5
Stage 2a qtz-mag-vein in siliceous marble re-opened by Stage 2c-3 py-ccp-cal
py 14.5 0.3 ccp 13.9 0.3
EMMD055-155.35
Qtz-alb vein (Stage 2b?) reopened by Stage 3 bar-fluo-cal-ccp vein in mag-chlo-fluo-ccp-altered
metavolcanic
ccp 1.2 0.3
bar 11.5 0.3
E1 East
EMMD007-223.6 Stage 2c cal-mag-py vein in meta-andesite py 21.4 0.3
EMMD008-114.45
Qtz vein (Stage 2a) re-opened by Stage 3 bar-cal-py-ccp vein in massive mag-altered metasediment
py 19.8 0.3 bar 26.5 0.3
Snake Creek
Anticline
Clon-2A Scapolite-bt marble with boudinaged albite-qtz-rich layers
BaSO4** 11.6 0.5 Clon-2B BaSO4** 12.5 0.5
UQ and UT Standards OSaB 721SBN 4 20.3 -
IAEA-S-1 Ag2S -0.3 - IAEA-S-3 Ag2S 32.3 -
**CAS precipitate Table G-3: Carbonate Associated Sulfur (CAS) sample prep
Sample ID Original weight
(g)
Weight after acid digestion
(g)
Carbonate Weight
(g)
Carbonate (%)
BaSO4 (mg)
Carbonate S (ppm)
Whole-rock S (ppm)
34SCDT (‰)
1.21 ,3.21 2.21 5.93 1 hsaw A20
6.31 ,0.31 3.31 2.81 2 hsaw A20
02A acid 236 118 118 50% 44.4 14 7 11.6 11.5, 11.7
3.01 ,7.11 0.11 6.82 1 hsaw B20
02B acid 220 100 120 55% 10.8 5 3 12.5 12.3, 12.6
Comments:
Sample 02A wash milled slightly finer than 02B, which probably accounts for the extra wash needed to remove all 'loose' sulfate. The observation that 'loose' sulfate has the same isotopic composition as the 'acid liberated' sulfate suggest these clean core samples have not been affected by supergene processes, nor were any trace
sulfides oxidised during the acid digestion step.
The S in carbonate and S whole rock values have been calculated assuming that the only S in the rock is in carbonate and the combined washings and acid digestion liberate all this S.
Table G-4: SHRIMP Sulfur and Oxygen Isotope Standards
Sulfur
Standard - mineral Reference 34S (‰)
Measured 32S/34S
Internal Error Measured Internal Error
32S/34S ± 95% CI 34S (‰) 34S ± 95% CI (‰)
Norilsk - ccp 8.0 0.0441367 2.42E-06 8.01 0.05
Ruttan - py 1.2 0.0437511 3.58E-02 1.24 0.05
Bar4 - bar 3.5 0.0442447 5.81E-06 3.61 0.13
Bar2 - bar 57.0 0.0465291 NR 57.11 NR
34S values normalized to CDT Oxygen
Standard - mineral Reference 18O (‰)
Measured 18O/16O
Internal error Measured Internal Error 18O/16O ± 95% CI 18O (‰) 18O ± 95% CI (‰)
Magnetite 5830 - mag 4.5 0.0019769 5.11E-07 4.26 0.26
UWQ-1 - qtz 12.3 0.0020250 6.29E-07 12.26 0.31
18O values normalized to VSMOW
382
34S
Appendix H Copyright statements
383