Embed Size (px)
Citation preview
Fizykochemiczne Problemy Mineralurgii, 32 (1998), 7–30
H. KUCHA*, I. R. PLIMER**, E. F. STUMPFL***
GEOCHEMISTRY AND MINERALOGY OF GOLD AND PGE’S IN MESOTHERMAL AND EPITHERMAL DEPOSITS AND
THEIR BEARING ON THE METAL RECOVERY
In mesothermal-epithermal (below 250 °C) noble metal deposits mineralogy and geochemistry of Au, Pd and Pt are complex. The metals form substitutions in arsenides, antimonides, sulphides, organic matter, arsenates and oxysulphides. In some deposits the metals form their own oxysulphides, organometallic compounds, silicates, tellurides, selenides, sulphides, arsenides and arsenates. Such complex mineralogy and geochemistry of noble metals involving direct chemical bonding to the host lattice causes difficulties in the metal recovery. A treatment of such ores requires prior geochemical and mineralogical study to design optimal technology of the ore treatment.
INTRODUCTION
Ores of metallic gold are still the main type of Au ores treated today. They contain gold in concentration ranging from about 1 to a few dozen ppm. The main mineralogical type of gold in these deposits is metallic gold, and therefore the gold can be easily recovered either by gravity separation or by cyanization.
During past two decades industry started to turn an increasing attention to mesothermal and epithermal deposits, where gold mineralogy and geochemistry are very complex. They include such minerals like Au-tellurides: petzite Ag3AuTe2, calaverite AuTe2, krennerite AuTe2, montbrayite (Au, Sb)2Te3; sulphides: uytenbogaardite Ag3AuS2; selenides; fischesseerite Ag3AuSe2; bismuthides: maldonite Au2Bi; and thiosulphates (Au, Cu)S2O3. Extraction of gold from the above discussed minerals by cyanization is not possible. The minerals have to be first converted by oxidation (rosting, chemical oxidation, bacterial oxidation) into oxide forms, which involves braking of the Au-Te, Au-S, Au-Se chemical bonding (Yvonne et al., 1991). Only after braking the chemical bond gold becomes susceptible to cyanide leaching. However, an identification of gold chemical bonding must be done prior to the
______ *Institute of Geology and Mineral Deposits, 30-059 Krakow, ave Mickiewicza 30, Poland.
**School of Earth Sciences, University of Melbourne, Parkville, 3052 Vic., Australia. ***Institute of Mineralogy and Petrology, Mining University Leoben, A-8700 Leoben, Austria.
H. KUCHA et al. 8
oxidation, otherwise wrong method of oxidation may produce a new, unleachable complex (Wagner et al., 1988). Mössbauer spectroscopy indicates that in gold silver chalcogenides Ag3AuX2, where X = S, Se, Te, gold valency is +1 (Wagner et al., 1988, 1989).
In the recent times there is also an increasing treatment of ores with an “invisible” gold. In such ores gold occurs in the structure of the common minerals as discrete inclusions smaller than about 100nm, and therefore not detectable by optical and scanning electron microscopy. Minerals acting as hosts are most frequently arsenopyrite and pyrite, although invisible gold occurs also in pyrrhotite, chalcopyrite, bornite, galena and tetrahedrite. Mössbauer study shows gold to be chemically bound to the lattice of arsenopyrite or pyrite (Wagner et al., 1988, 1989). A High Resolution Transmission Electron Microscopy (HRTM) indicates that visible particles of gold are absent in host grains containing even up to 2000 ppm of Au (Cabri et al., 1989). However, many ores contain both the chemically bound gold and discrete particles of gold with size less than 100nm as well (Marion et al., 1991). The content of chemically bound gold in pyrite may reach 4000–5000 ppm (Marion et al., 1991) in Au rich zones. Discrete particles of native gold show valency 0, typical for metallic gold, and chemically bound Au shows valency +1.
The aim of this paper is to present mineralogy and geochemistry of gold associated with organic matter (Kupferschiefer, Maldon), oxysulphides (Mitterberg, Veitsch, Comet Mine, Barberton), sulphides (Kupferschiefer, Barberton, Mitterberg) and silicates (Maldon, Barramiya, Barberton), as well as platinum group element minerals related to the organic matter and redox interface in Kupferschiefer.
DEPOSITS STUDIED
The Barberton Mine is located in Transvaal, South Africa, in the Archean rocks comprising the Zwartkopie and Sheba Formations of the Onverwacht and Fig Tree Groups, respectively (Schouwstra, de Villiers, 1988). The locus for gold mineralization of the Main Reef Complex at Barberton is a major anticlinal structure (Birthday No. 2 Anticline), which consists of green quartz-carbonate schists and banded cherts (Zwartkopie Formation) with overlying shales and graywackes (Sheba Formation). The highest-grade gold mineralization occurs in fractures in sheared and brecciated rocks of the Sheba Formation and is associated with quartz-carbonate veins and disseminated sulphides. Gold occurs in association with sulphides – mainly as inclusions in pyrite and arsenopyrite. Pyrite is ubiquitous whereas arsenopyrite occurs in restricted areas of the fracture zones (Schouwstra, de Villiers, 1988). High gold grades correlate better with quantity of arsenopyrite than with quantity of pyrite. Associated minerals are gersdorffite, pyrrhotite, sphalerite, chalcopyrite, tetrahedrite, rutile, Fe-oxysulphides, anhydrite, chlorite, and graphite (Kucha et al., 1994). Arsenopyrite-pyrite-pyrrhotite geothermometry indicates a temperature range of 350–400 °C (Schou-wstra, de Villiers, 1988).
Geochemistry and mineralogy of gold 9
The Barramiya gold prospect is located in the southern part of the Eastern Desert, Egypt. The oldest rocks of the late Proterozoic age comprise graphite, actinolite, tremolite and chlorite schists. They are intruded by ultramafic rocks converted to serpentinite and talc carbonate rocks (El Shazly, 1977). Younger intrusions cmprise two sets of granite and tonallite intrusions. Post granitic dykes include felsites, dacites as well as quartz veins with sulphides, gold and chlorites. The gold content in quartz veins varies between traces and 18, most often between 5 and 18ppm. Gold is accompanied by: pyrite, gersdorffite, ankerite, siderite and As-bearing chlorite.
The Comet Mine, New South Wales, Australia, is one of slate belt-type gold deposits in the Armidale area of the New England Fold Belt hosted by Paleozoic carbonaceous metasediments (Plimer, 1982). The mine is located on the largest of the three parallel quartz pyritic veins that are hosted by the Permo-carboniferous Rockvale Adamellite, an S-type adamellite that forms a part of the Hillgrove suite of granitic rocks in the New England Fold Belt (Shaw & Flood, 1981). The veins which are enclosed by a narrow quartz–sericite–pyrite–chlorite alteration assemblage, comprise quartz, pyrite, arsenopyrite, chalcopyrite, pyrrhotite, magnetite, haematite, Bi tellurides, gold and thiosulphates. Fluid inclusions temperatures reveal two thermal maxima at 290 and 400 °C and the 34S values of sulphides group around 0 (Kucha et al., 1994).
The Kupferschiefer Cu–Ag deposits are located in the South-Western Poland. Mining operations at four mines „Lubin”, „Polkowice”, „Rudna” and „Sieroszowice” produce per annum about 400,000 t Cu, 12,000 t Pb, 1,000 t Ag, 300 t Ni, 600 kg Au and 150 kg of Pt + Pd. Quantities of V, Mo and Co in the ore are similar to those of silver but none of these metals is recovered. Economic grade Cu-ore is present in white sandstone – ca. 50% of the Cu reserves, in black shale – ca. 20%, and in dark dolomite – ca. 30%. The average thickness of the mineralized horizon is about 4 m. The lateral zoning patterns are oriented radially outwards from Rote Föule in the following order: hematite – chalcocite – bornite – chalcopyrite – galena – sphalerite – pyrite (Rydzewski, 1976). The vertical zonation from the bottom upwards is: barren hematite–dispersed pyrite with minor chalcopyrite–copper sulphides–galena –sphalerite–pyrite. There are four types of epigenetic hematite in the ore zone (Kucha, 1995), each associated with different metals. Cu-, Pb-, Zn-, and pyrite-horizons may partly overlap but usually they are developed as clear units independent from changes in lithology (Kucha, 1990). The mineralization is discordant to time lines. The distribution of noble metals is controlled by the redox interface (Kucha, 1981, 1990; Kucha et al., 1993). The highest noble metals contents are observed at the redox interface, especially when the interface runs between black shale resting directly on the red sandstone, and/or when the interface is crossing stratigraphic boundaries of the black shale (Piestrzynski, Wodzicki, 1996). The first type of occurrence is observed in the Lubin West Mine, Polkowice East Mine and less in the Polkowice Central Mine, the second type of occurrence is seen mainly in the Polkowice West Mine (Piestrzynski, Wodzicki, 1996) as well as in the Sieroszowice Mine (Kucha et al., 1993). On the reduced side of the redox boundary, 3 to 300 mm thick, there are:
H. KUCHA et al. 10
electrum (Ag-rich gold), Pd arsenides, Ni–Co arsenides, Bi sulphides, native Bi, uraninite, brannerite, thucholite, Au–Pd–Pt-bearing thucholite, and covellite but the Cu content does not exceed 0.2–0.8 wt. % (Kucha 1982). The redox interface may be marked by two phase gold, where silver rich gold containing about 60 wt. % of Au is embedded in gold of high fineness containing 92–97 wt. % of Au (Kucha, Pochec, 1983). On the oxidized side of the redox boundary which may be up to 50–60 cm thick the main mineral is haematite accompanied by gold of high fineness, platinian gold contains up to 1.60 wt. % of Pt, PdBi sobolevskite, Ag6Au4Pb2, native Pb, PbSe clausthalite, metallic palladium, relicts of metal-bearing organic matter replaced by black calcite (Kucha, 1981), and palladium arsenates. Characteristically only traces of Cu are observed on the reduced side of the redox interface. Larger quantities of copper appear 1.0–1.5 m. above the redox interface (Kucha, 1981, 1982). The temperature of the deposit formation was around 100 °C, as indicated by thermal stability of sulphide assemblages (Kucha, 1990).
Maldon, Victoria, Australia, hosts a number of auriferous quartz reefs which occur in argillaceous and arenaceous hornfelses, a variety of schists, and nodular schists (Moon, 1897) of early Ordovician age adjacent to the late Devonian Harcourt Granodiorite (Morgan & Woodland, 1990). Contact metamorphism converted the original sediments, which consisted mainly of greywackes and less frequently shales, predominantly into hornfelses composed of varying proportions of quartz, biotite, cordierite and andalusite. The sediments have been tightly folded along parallel axes approximately 230 m apart with extention at 345° (Ramsay & Willman, 1988; Morgan & Woodland, 1990). Mineralized faults are often sub-parallel to bedding. The quartz reefs are generally concordant with surrounding sediments, but in places they cross fold axes and sediment bedding and then they attain an increased thickness. The reefs predate at least the final stage of the granodiorite emplacement (Ramsay & Willman, 1988). The reefs and veins are composed of massive, milky quartz with a sulphide content of about 1% (Morgan & Woodland, 1990). Clean quartz contains little gold but dark patches in quartz are rich in gold (Moon, 1897). The sulphide assemblage includes (in decreasing abundance): pyrite, arsenopyrite, sphalerite, löllingite (FeAs2), chalcopyrite, galena, pyrrhotite, marcasite, gold, maldonite, native Bi and Sb, stibnite, oxysulphides of Fe, Cu and Pb, ullmanite and Pb (Sb, Bi)S4. Gold is also accompanied by organic matter, As–chlorite and siderite. The oxide assemblage includes: rutile, ilmenite and magnetite.
The Mitterberg deposit is located in the Greywacke Zone close to the Calcareous Alps, Austria. It is composed of five major veins cross-cutting the Paleozoic strata of the Northern Greywacke Zone. The largest orebody is represented by the main vein (Hauptgang) extending W–E over a total distance of 11 km with thickness from 0.2 to 4 m, and 460 to 520 m of mineable vertical extent. The Hauptgang cuts through the Grey Formation (Silurian, Devonian) and the Violet Formation (Rotliegendes). The three veins of the Southern Orefield cut trough the phyllites of the Grey Series. The main ore mineral at Mitterberg is chalcopyrite. Sb-fahlore (tetrahedrite) occurred
Geochemistry and mineralogy of gold 11
mainly at the upper sections of the veins. In some sectors of the veins larger amounts of arsenopyrite, gersdorffite, safflorite–löllingite–rammelsbergite, pyrite, and cubanite occur. The gangue minerals are carbonates, quartz and minor muscovite. Gold occurs as both visible and invisible mainly in tetrahedrite and less often in pyrite, gersdorffite, cubanite and chalcopyrite (Bernhard, 1966). Mineral separates show gold contents (ppm): tetrahedrite 18.7–52.5 (Kucha et al., 1997), and chalcopyrite from traces up to 1.5 (Bernhard, 1966). Mining at Mitterberg ceased in 1976. Ore reserves left underground amount up to 10.5 mio t with an average Cu grade of 1.5 wt. %.
MATERIALS AND METHODS
Samples were cut and polished in a careful way to avoid destruction of fragile micro-inclusions in gold (Kucha et al., 1994). Samples were ground dry on abrasive paper using progressively decreasing grain size until final grinding on paper with abrasive grains of 1µm. Final polishing was completed with 1 µm diamond polishing spray. The chemical composition of minerals and the valencies of S, Fe, As and Au were determined with a Cameca SX50 microprobe with a stabilized electron beam at the School of Earth Sciences, University of Melbourne, Australia, at the Institute of Mineralogy and Petrology, Mining University Leoben, Austria with an ARL SEMQ microprobe, and with Camebax microprobe at the Institute of Material Sciences, University of Mining and Metallurgy, Krakow, Poland. All used microprobes possessed stabilized electron beam. The beam stabilization permitted a much higher resolution and accuracy of valency determination than is possible using probes without such a facility (Kucha et al., 1989; Kucha et al., 1994). The technique of valency determination relied on general principles developed previously for iron and sulphur (Kucha et al., 1989).
Mineral compositions were determined at 20 kV using the following spectral lines and synthetic standards: F Kα (CaF2), Cl Kα (NaCl), Na Kα, Al Kα, Si Kα (NaAlSi3O8), Mg Kα (Mg2SiO4), K Kα (KAlSi3O8), Ca Kα (CaCO3), Ti Kα, Mn Kα, Fe Kα and S Kα (FeS2), Co Kα, Fe Kα and As Lα, Kα (FeAsS), Zn Kα, Ni Kα and Sb Lα (NiSbS), Ag Lα and Au Mα (Au–Ag alloy), Pb Mα (PbS), Hg Mα (HgS), and Bi Mα. Oxygen and carbon were calculated by difference, but their content has also been checked at 10 kV using haematite and graphite as standards. The carbon content was measured on uncoated sample where a conductivity path was provided by a thin, self adhesive copper foil attached to the sample surface.
Sulphur valencies were measured with a PET crystal by determination of S Kα and S Kβ shifts and S Kβ/S Kα intensity ratios (Kucha et al., 1989), iron valencies were measured with a LiF crystal by determination of the Fe Kβ shift, arsenic valency was determined by measurement of As Kβ shift with a LiF crystal and As Lβ/As Lα ratios with a PET crystal. Gold valency was determined by measurement of the Au
H. KUCHA et al. 12
M β/Au Mα intensity ratios using the following standards: pure Au (valency 0) and AuTe2 (valency +1), gold cyanide AuCN adsorbed on activated carbon (valency +1), and gold bromideide (AuBr3) adsorbed on activated carbon (valency about +3).
Infrared absorption spectra were performed in reflected light mode using a microscope supplied with a Fourier infrared system with spot size varying from 7 to 10 µm at the Institute of Forensic Research, Krakow, Poland.
PAY METALS ASSOCIATED WITH ORGANIC MATTER
The first occurrence of noble metals associated with organic matter was found in Kupferschiefer, Poland (Kucha, 1973, 1974, 1975, 1993). Pay metals occur also within reduction haloes in the Permian Sandstones of the Northern Switzerland (Hofmann, 1986). They were also found later in black shales in Canada, USA, and in metal-rich black shales of China (Parnell, 1988). An association of gold with organic matter in Witwatersrand gold and uranium deposits in known for a long time (Schidlowski, 1968). Recent studies indicate their presence also in uranium deposits related to organic matter. It appears that connection of pay metals with organic matter is frequent enough to be interested in this phenomenon also from a practical point of view. The problem will be demonstrated on examples from the Kupferschiefer, Poland, and Maldon, Australia.
Noble metals associated with clay-organic matrix of the Kupferschiefer
Extractable bitumens usually constitute no more than 1–2% of the total organic matter of the shale. Most of the organic matter is insoluble kerogen tightly intermixed with clay minerals forming a clay-organic matrix of the shale. Such a matrix may contain significant amounts of metals (Table 1).
Kerogen obtained after extraction of soluble bitumens and removal of carbonates by HCl, and of clay minerals by HF was studied by infrared spectroscopy. It is composed mainly of hydrocarbons with conjugated benzene rings. Some CO, OH, CH2 and CH3 groups are also present. They form short additives to aromatic rings and/or may be incorporated in insoluble resins.
Titanium is a common minor element in Kupferschiefer, and occurs in concentrations from 0.04 to 1.00 wt. %. The Ti budget is controlled by detrital TiO2, and substitutions in the illite lattice. In the matrix of noble metal-bearing shale (Table 1) the Ti content varies from 0.008 to 4.61 wt. %, and usually is substituted in clay minerals but sometimes it is connected with brannerite (U, Ca, TR) (Ti, Fe)2O6 as indicated by an increased content of U.
The Fe content in black shale varies between 0.22 and 3.29 wt. % (Table 1). The distribution of Fe in the clay-organic matrix is controlled by minute inclusions of
Geochemistry and mineralogy of gold 13
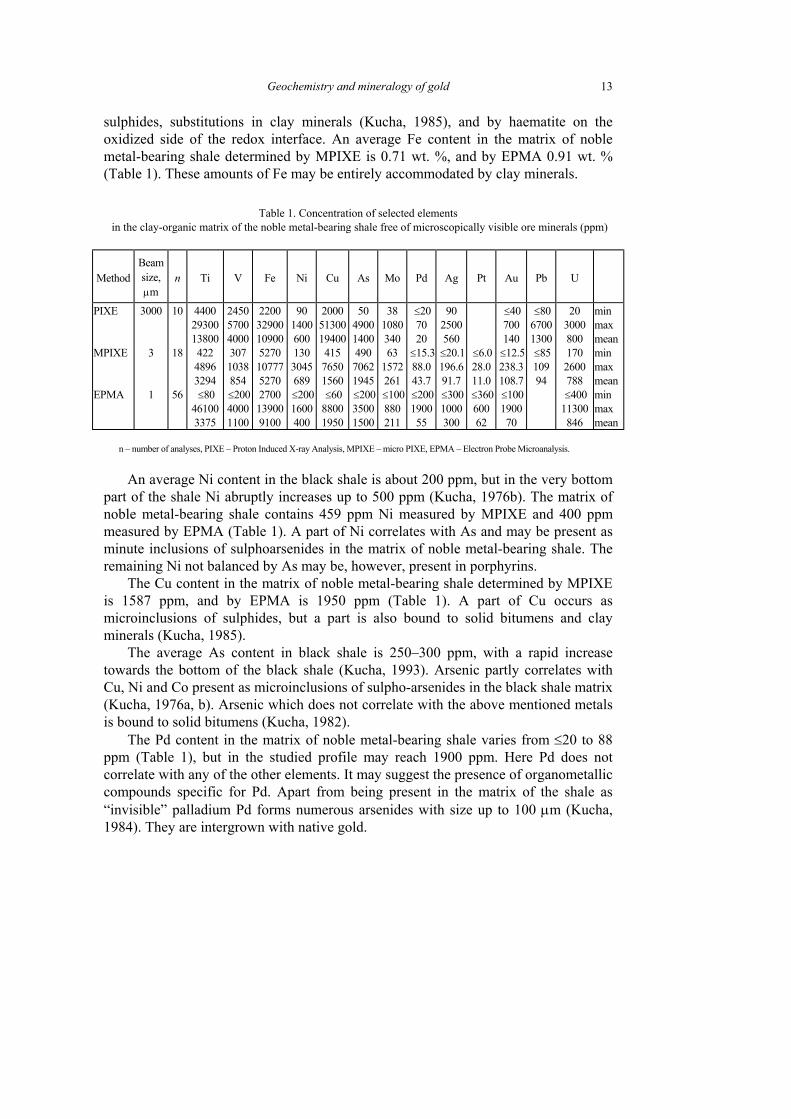
sulphides, substitutions in clay minerals (Kucha, 1985), and by haematite on the oxidized side of the redox interface. An average Fe content in the matrix of noble metal-bearing shale determined by MPIXE is 0.71 wt. %, and by EPMA 0.91 wt. % (Table 1). These amounts of Fe may be entirely accommodated by clay minerals.
Table 1. Concentration of selected elements in the clay-organic matrix of the noble metal-bearing shale free of microscopically visible ore minerals (ppm)
Method Beam size, µm
n Ti V Fe Ni Cu As Mo Pd Ag Pt Au Pb U
PIXE 3000 10 4400 29300 13800
2450 5700 4000
2200 32900 10900
90 1400 600
2000 51300 19400
50 4900 1400
38 1080 340
≤20 70 20
90 2500 560
≤40 700 140
≤80 6700 1300
20 3000 800
min max mean
MPIXE 3 18 422 4896 3294
307 1038 854
5270 10777 5270
130 3045 689
415 7650 1560
490 7062 1945
63 1572 261
≤15.3 88.0 43.7
≤20.1 196.6 91.7
≤6.0 28.0 11.0
≤12.5 238.3 108.7
≤85 109 94
170 2600 788
min max mean
EPMA 1 56 ≤80 46100 3375
≤200 4000 1100
2700 13900 9100
≤200 1600 400
≤60 8800 1950
≤200 3500 1500
≤100 880 211
≤200 1900 55
≤300 1000 300
≤360 600 62
≤100 1900 70
≤400 11300 846
min max mean
n – number of analyses, PIXE – Proton Induced X-ray Analysis, MPIXE – micro PIXE, EPMA – Electron Probe Microanalysis.
An average Ni content in the black shale is about 200 ppm, but in the very bottom part of the shale Ni abruptly increases up to 500 ppm (Kucha, 1976b). The matrix of noble metal-bearing shale contains 459 ppm Ni measured by MPIXE and 400 ppm measured by EPMA (Table 1). A part of Ni correlates with As and may be present as minute inclusions of sulphoarsenides in the matrix of noble metal-bearing shale. The remaining Ni not balanced by As may be, however, present in porphyrins.
The Cu content in the matrix of noble metal-bearing shale determined by MPIXE is 1587 ppm, and by EPMA is 1950 ppm (Table 1). A part of Cu occurs as microinclusions of sulphides, but a part is also bound to solid bitumens and clay minerals (Kucha, 1985).
The average As content in black shale is 250–300 ppm, with a rapid increase towards the bottom of the black shale (Kucha, 1993). Arsenic partly correlates with Cu, Ni and Co present as microinclusions of sulpho-arsenides in the black shale matrix (Kucha, 1976a, b). Arsenic which does not correlate with the above mentioned metals is bound to solid bitumens (Kucha, 1982).
The Pd content in the matrix of noble metal-bearing shale varies from ≤20 to 88 ppm (Table 1), but in the studied profile may reach 1900 ppm. Here Pd does not correlate with any of the other elements. It may suggest the presence of organometallic compounds specific for Pd. Apart from being present in the matrix of the shale as “invisible” palladium Pd forms numerous arsenides with size up to 100 µm (Kucha, 1984). They are intergrown with native gold.
H. KUCHA et al. 14
The Pt content measured by MPIXE in the matrix of noble metal-bearing shale reaches occasionally 28 ppm (Table 1), but in more numerous EPMA analyses values as high as 600 ppm were found. Pt does not correlate significantly with any of the other elements. Platinum so far has been detected only in the clay-organic matrix of the shale, in thucholite, and as 1.6 wt. % admixture in platinian gold.
Gold is present in four points out of 28. Only at the point no 6 gold correlates with silver. This suggests the presence of microinclusion of Ag-rich gold. Such an interpretation is suggested by the chemical composition of electrum from Kupferschiefer which contains 55–63 wt. % of Au and 37–45 wt. % of Ag. In the remaining three points no silver was found. This may suggest that these Au peaks are connected with Ag-free solid bitumens containing organically-bound gold. Au Mβ/AuMα emission efficiency ratio suggests that gold at point % 5A has valency +1. Apart of organometallic compouds gold forms numerous native inclusions with size reaching up to 300 µm (Kucha, 1982, 1984).
The average U content in the mineralised area of Lubin is 61.5 ppm (Piestrzynski, 1990). The average U content in the matrix of noble metal-bearing shale determined by MPIXE is 495 ppm, and by EPMA is 846 ppm (Table 1). The main uranium carrier is thucholite, forming grains up to 4 mm in size in the shale. Minor uranium carriers are phosphates, and brannerite.
The above described relationships are characteristic for the matrix of noble metal-bearing shale on the reduced side of the redox interface. The presented results indicate that a significant part of Au, Pt, and Pd present in the matrix of noble metal-bearing shale may be chemically bound to organic matter.
Noble metals associated with organic matter (kerogen–thucholite) in Kupferschiefer
The organic matter constituting clay-organic matrix of Kupferschiefer is soluble in chloroform only in amounts of 1–2%, but may reach 19% in samples rich in alginite. The soluble organic matter is enriched in several metals: V, Fe, Co, Ni, Cu, As and Mo (Kucha, 1993). Vanadium and nickel are present as vanadyl ethioporphyrins (Kucha et al., 1983), and Ni porphyrins (Sawlowicz, 1985). Also some Fe and Mg are connected with pyrrole rings. Despite a high Cu content in some organic extracts no specific copper organic compounds have been found yet.
Thucholite is defined as a bitumen polymerized by radiolytic action of uranium and thorium (Schidlowski, 1968). In the Zechstein copper deposits thucholite is present in areas of γ-anomalies (Kucha et al., 1993) in black shale as rounded nodules, boundary dolomite, and in the top few cm of white sandstones as fillings, veinlets and cements of detrital grains. Within γ-anomalies, the thickness of the black shale is reduced, the Cu content is usually below 1 wt. % and the shale rests directly on the red sandstone free of copper mineralization (Piestrzynski, 1988). The last feature, i.e. a direct contact of red sandstone and black shale is the most important single factor
Geochemistry and mineralogy of gold 15
controlling a lateral distribution of γ-anomalies and an increased content of the pay metals as well (Kucha et al., 1993). This is connected with redox interface which may cross stratigraphic boundaries and shift also above the shale bringing with itself a few cm to 50 cm thick pay metal horizon.
Thucholite grains in black shale are up to 4 mm in size. The shale around thucholite is exhibits disturbed lamination, providing evidence for the epigenetic growth of the thucholite with the matrix of the shale. Thucholite is composed of two optically distinct components: isotropic (A) and strongly anisotropic (B). Component A has reflectance in oil from 1.75 to 2.50%, with most measured values grouped around lower figure. The reflectance values are roughly parallel to the uranium content, i.e. the higher the U content the higher reflectance observed. The component A is richer in heavy metals than anisotropic component B. TEM study shows that thucholite A is not crystalline.
Component B is strongly anisotropic in reflected light and has reflectance close to graphite. Electron diffraction reveals three types of small scale ordering (domains) in anisotropic thucholite B: i) with typical graphite cell parameters a0 = 0.246, and c0 = 0.672nm, ii) with Van der Waals thickness of the benzene ring a0 = 0.246, and c0 = 0.740nm, and iii) with a grater thickness of the ring where CH3, CO, or OH groups are attached to conjugated benzene rings (Kucha, 1982, Kucha and Wieczorek, 1988). The discussed domains in thucholite are usually smaller than 100nm and therefore they are not detectable by standard X-ray diffraction techniques.
Thucholite contains ubiquitous inclusions of Cu–Bi sulphides, PdAs2, and native gold present at the boundary between isotropic component A and B. It seems that graphitization of thucholite A caused destruction of organometallic complexes and subsequent exsolution of noble metal minerals at the boundary of thucholite A and B. Similar mineral assemblage appears at the edge of thucholite. The contact of thucholite and replacive calcite may be regarded as micro-redox interface demonstrating that on such boundary there is an efficient accumulation of pay metals minerals.
Geochemistry of thucholite was studied with EPMA, PIXE, MPIXE, SXRFA, and TEM (Table 2). Several grains were studied including one with a profile traversing across the whole grain.
Uranium
Thucholite free of microscopically visible UO2 grains have U contents ranging from ≤35 to 162400 ppm (Table 2). Optical and Transmission Electron Microscopy (TEM) shows that budget of uranium in thucholite is controlled by three major phases:
• Uraninite. Hipidiomorphic uraninite has size up to 25 µm. TEM diffraction gives unit cell size a0 = 0.542 (0.004nm close to Th-free uraninite. Uraninite forms also submicroscopic inclusions in the thucholite matrix. Such inclusions have sharp contacts to the enclosing organic matrix and sizes ranging from 0.04 to 0.02 µm.
H. KUCHA et al. 16
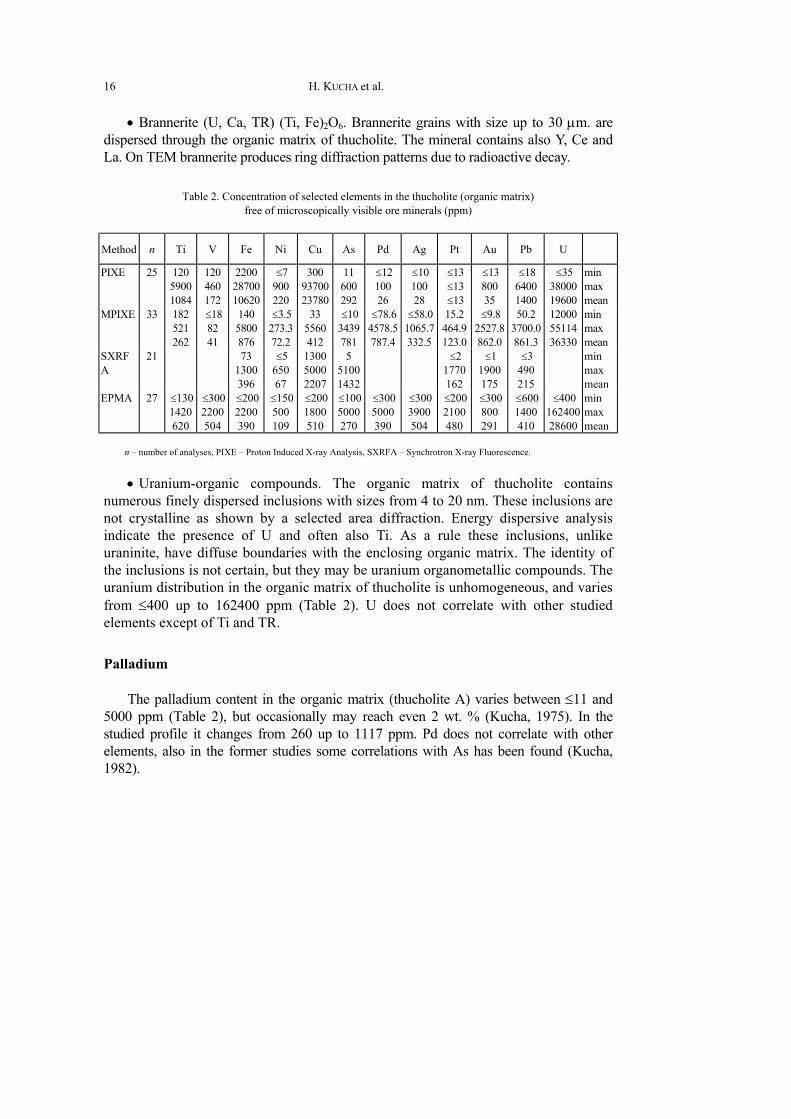
• Brannerite (U, Ca, TR) (Ti, Fe)2O6. Brannerite grains with size up to 30 µm. are dispersed through the organic matrix of thucholite. The mineral contains also Y, Ce and La. On TEM brannerite produces ring diffraction patterns due to radioactive decay.
Table 2. Concentration of selected elements in the thucholite (organic matrix) free of microscopically visible ore minerals (ppm)
Method n Ti V Fe Ni Cu As Pd Ag Pt Au Pb U
PIXE 25 120 5900 1084
120 460 172
2200 28700 10620
≤7 900 220
300 93700 23780
11 600 292
≤12 100 26
≤10 100 28
≤13 ≤13 ≤13
≤13 800 35
≤18 6400 1400
≤35 38000 19600
min max mean
MPIXE 33 182 521 262
≤18 82 41
140 5800 876
≤3.5 273.3 72.2
33 5560 412
≤10 3439 781
≤78.6 4578.5 787.4
≤58.0 1065.7 332.5
15.2 464.9 123.0
≤9.8 2527.8 862.0
50.2 3700.0 861.3
12000 55114 36330
min max mean
SXRFA
21 73 1300 396
≤5 650 67
1300 5000 2207
5 5100 1432
≤2 1770 162
≤1 1900 175
≤3 490 215
min max mean
EPMA 27 ≤130 1420 620
≤300 2200 504
≤200 2200 390
≤150 500 109
≤200 1800 510
≤100 5000 270
≤300 5000 390
≤300 3900 504
≤200 2100 480
≤300 800 291
≤600 1400 410
≤400 162400 28600
min max mean
n – number of analyses, PIXE – Proton Induced X-ray Analysis, SXRFA – Synchrotron X-ray Fluorescence.
• Uranium-organic compounds. The organic matrix of thucholite contains numerous finely dispersed inclusions with sizes from 4 to 20 nm. These inclusions are not crystalline as shown by a selected area diffraction. Energy dispersive analysis indicate the presence of U and often also Ti. As a rule these inclusions, unlike uraninite, have diffuse boundaries with the enclosing organic matrix. The identity of the inclusions is not certain, but they may be uranium organometallic compounds. The uranium distribution in the organic matrix of thucholite is unhomogeneous, and varies from ≤400 up to 162400 ppm (Table 2). U does not correlate with other studied elements except of Ti and TR.
Palladium
The palladium content in the organic matrix (thucholite A) varies between ≤11 and 5000 ppm (Table 2), but occasionally may reach even 2 wt. % (Kucha, 1975). In the studied profile it changes from 260 up to 1117 ppm. Pd does not correlate with other elements, also in the former studies some correlations with As has been found (Kucha, 1982).
Geochemistry and mineralogy of gold 17
Platinum
The Pt content in the matrix of thucholite varies from ≤2 to 2100 ppm (Table 2). In the studied profile set across thucholite grain Pt reaches 800 ppm. Occasionally the Pt content in the organic matrix at the edge of thucholite grains replaced by calcite may reach 1.06 wt. % (Kucha, 1975, 1981, 1982). Pt is antipathetic to U, but in general is sympathetic with Ni. This suggests that Pt, like Ni, is partly connected with the pyrrole ring. This idea is further supported by the presence of inclusions in the organic matrix of thucholite containing some Pt and Ni. Such inclusions have size about 20 nm, and diffuse boundaries to the enclosing organic matrix. During replacement of thucholite by calcite (oxidation) platinum is depleted in the rim of thucholite down to 0.54 wt. % from 1.06 wt. % in the center (Kucha, 1982).
Gold
The Au content in the organic matrix varies from ≤1 to 1900 ppm (Table 2), but occasionally may reach 6800 ppm (Kucha, 1982). Au is antipathetic to U. Gold forms both visible and submicroscopic inclusions in the organic matrix of thucholite. The size of invisible gold inclusions is about 40 nm. The energy dispersive analysis indicates that such inclusions in the organic matrix contain Au but are Ag-free. A lack of silver and non-crystalline nature of such inclusions may indicate that these are in fact organometallic compounds of gold. This may be further supported by observation that metallic gold occurring in Kupferschiefer contains 36–45 wt. % of Ag. The Au Mβ/Au Mα emission efficiency ratio suggests that gold at point 18 shows valency +1, which speaks in favour of organically bound gold. Apart of organometallic compouds in the organic matrix gold forms numerous native inclusions with size reaching up to 50 µm (Kucha, 1982, 1984).
Other elements
Thucholite contains also (ppm): Pb ≤3–6400 which is probably entirely radiogenic, Y 50–560, Ce 35–380, La 25–120, as well as some K, Rb, Cl, Br, Sn, P, Ca, Bi, Sr, W, Ir and I.
Redox interface as a control of a distribution of pay metals in Kupferschiefer
By definition a redox interface is a plane (or a thin horizon) developed between: 1) reduced and oxidized rocks, or between 2) reduced and oxidized fluids. The redox horizon has thickness from a few cm up to 1–1.5 m. The reduced part of the horizon has different pay metal mineralogy, thickness, and pay metal contents than the oxidized portion.
H. KUCHA et al. 18
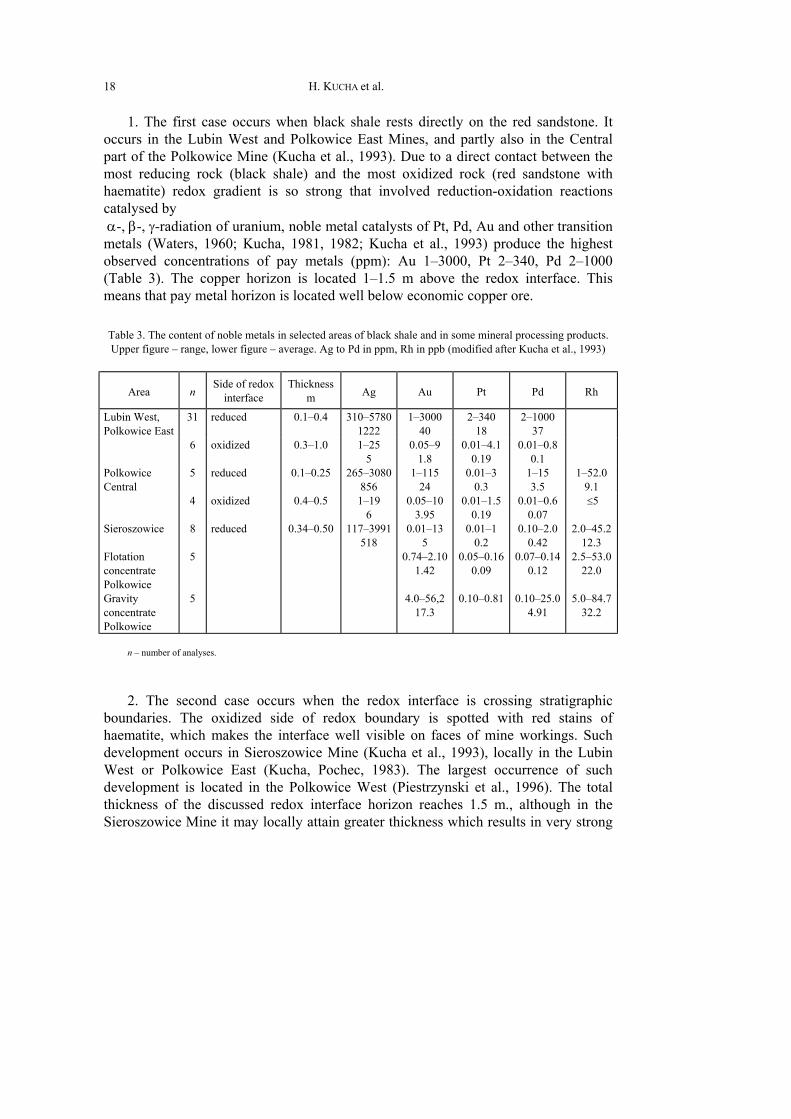
1. The first case occurs when black shale rests directly on the red sandstone. It occurs in the Lubin West and Polkowice East Mines, and partly also in the Central part of the Polkowice Mine (Kucha et al., 1993). Due to a direct contact between the most reducing rock (black shale) and the most oxidized rock (red sandstone with haematite) redox gradient is so strong that involved reduction-oxidation reactions catalysed by α-, β-, γ-radiation of uranium, noble metal catalysts of Pt, Pd, Au and other transition metals (Waters, 1960; Kucha, 1981, 1982; Kucha et al., 1993) produce the highest observed concentrations of pay metals (ppm): Au 1–3000, Pt 2–340, Pd 2–1000 (Table 3). The copper horizon is located 1–1.5 m above the redox interface. This means that pay metal horizon is located well below economic copper ore.
Table 3. The content of noble metals in selected areas of black shale and in some mineral processing products. Upper figure – range, lower figure – average. Ag to Pd in ppm, Rh in ppb (modified after Kucha et al., 1993)
Area n Side of redox
interface Thickness
m Ag Au Pt Pd Rh
Lubin West, Polkowice East
31 reduced 0.1–0.4 310–5780 1222
1–3000 40
2–340 18
2–1000 37
6 oxidized 0.3–1.0 1–25 5
0.05–9 1.8
0.01–4.1 0.19
0.01–0.8 0.1
Polkowice Central
5 reduced 0.1–0.25 265–3080 856
1–115 24
0.01–3 0.3
1–15 3.5
1–52.0 9.1
4 oxidized 0.4–0.5 1–19 6
0.05–10 3.95
0.01–1.5 0.19
0.01–0.6 0.07
≤5
Sieroszowice 8 reduced 0.34–0.50 117–3991 518
0.01–13 5
0.01–1 0.2
0.10–2.0 0.42
2.0–45.2 12.3
Flotation concentrate Polkowice
5 0.74–2.10 1.42
0.05–0.16 0.09
0.07–0.14 0.12
2.5–53.0 22.0
Gravity concentrate Polkowice
5 4.0–56,2 17.3
0.10–0.81 0.10–25.0 4.91
5.0–84.7 32.2
n – number of analyses.
2. The second case occurs when the redox interface is crossing stratigraphic
boundaries. The oxidized side of redox boundary is spotted with red stains of haematite, which makes the interface well visible on faces of mine workings. Such development occurs in Sieroszowice Mine (Kucha et al., 1993), locally in the Lubin West or Polkowice East (Kucha, Pochec, 1983). The largest occurrence of such development is located in the Polkowice West (Piestrzynski et al., 1996). The total thickness of the discussed redox interface horizon reaches 1.5 m., although in the Sieroszowice Mine it may locally attain greater thickness which results in very strong
Geochemistry and mineralogy of gold 19
dilution of pay metals content. The interface is usually marked by an increased uranium content on the reduced side.
Mineralogical, geochemical and textural signature of the oxidized and reduced sides of the redox boundary is different:
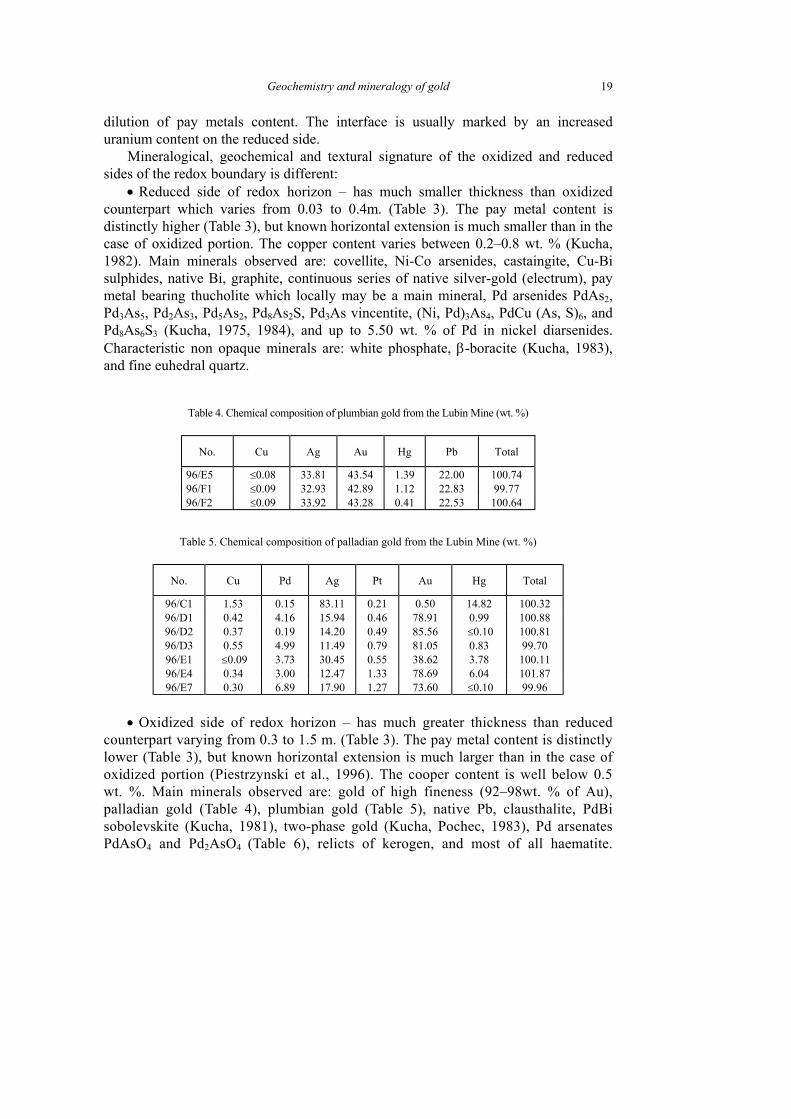
• Reduced side of redox horizon – has much smaller thickness than oxidized counterpart which varies from 0.03 to 0.4m. (Table 3). The pay metal content is distinctly higher (Table 3), but known horizontal extension is much smaller than in the case of oxidized portion. The copper content varies between 0.2–0.8 wt. % (Kucha, 1982). Main minerals observed are: covellite, Ni-Co arsenides, castaingite, Cu-Bi sulphides, native Bi, graphite, continuous series of native silver-gold (electrum), pay metal bearing thucholite which locally may be a main mineral, Pd arsenides PdAs2, Pd3As5, Pd2As3, Pd5As2, Pd8As2S, Pd3As vincentite, (Ni, Pd)3As4, PdCu (As, S)6, and Pd8As6S3 (Kucha, 1975, 1984), and up to 5.50 wt. % of Pd in nickel diarsenides. Characteristic non opaque minerals are: white phosphate, β-boracite (Kucha, 1983), and fine euhedral quartz.
Table 4. Chemical composition of plumbian gold from the Lubin Mine (wt. %)
No. Cu Ag Au Hg Pb Total
96/E5 ≤0.08 33.81 43.54 1.39 22.00 100.74 96/F1 ≤0.09 32.93 42.89 1.12 22.83 99.77 96/F2 ≤0.09 33.92 43.28 0.41 22.53 100.64
Table 5. Chemical composition of palladian gold from the Lubin Mine (wt. %)
No. Cu Pd Ag Pt Au Hg Total
96/C1 1.53 0.15 83.11 0.21 0.50 14.82 100.32 96/D1 0.42 4.16 15.94 0.46 78.91 0.99 100.88 96/D2 0.37 0.19 14.20 0.49 85.56 ≤0.10 100.81 96/D3 0.55 4.99 11.49 0.79 81.05 0.83 99.70 96/E1 ≤0.09 3.73 30.45 0.55 38.62 3.78 100.11 96/E4 0.34 3.00 12.47 1.33 78.69 6.04 101.87 96/E7 0.30 6.89 17.90 1.27 73.60 ≤0.10 99.96
• Oxidized side of redox horizon – has much greater thickness than reduced
counterpart varying from 0.3 to 1.5 m. (Table 3). The pay metal content is distinctly lower (Table 3), but known horizontal extension is much larger than in the case of oxidized portion (Piestrzynski et al., 1996). The cooper content is well below 0.5 wt. %. Main minerals observed are: gold of high fineness (92–98wt. % of Au), palladian gold (Table 4), plumbian gold (Table 5), native Pb, clausthalite, PdBi sobolevskite (Kucha, 1981), two-phase gold (Kucha, Pochec, 1983), Pd arsenates PdAsO4 and Pd2AsO4 (Table 6), relicts of kerogen, and most of all haematite.
H. KUCHA et al. 20
Locally trace amounts of covellite and chalcopyrite are observed. One of characteristic minerals are also gypsum with red internal reflections and strontianite SrSO4.
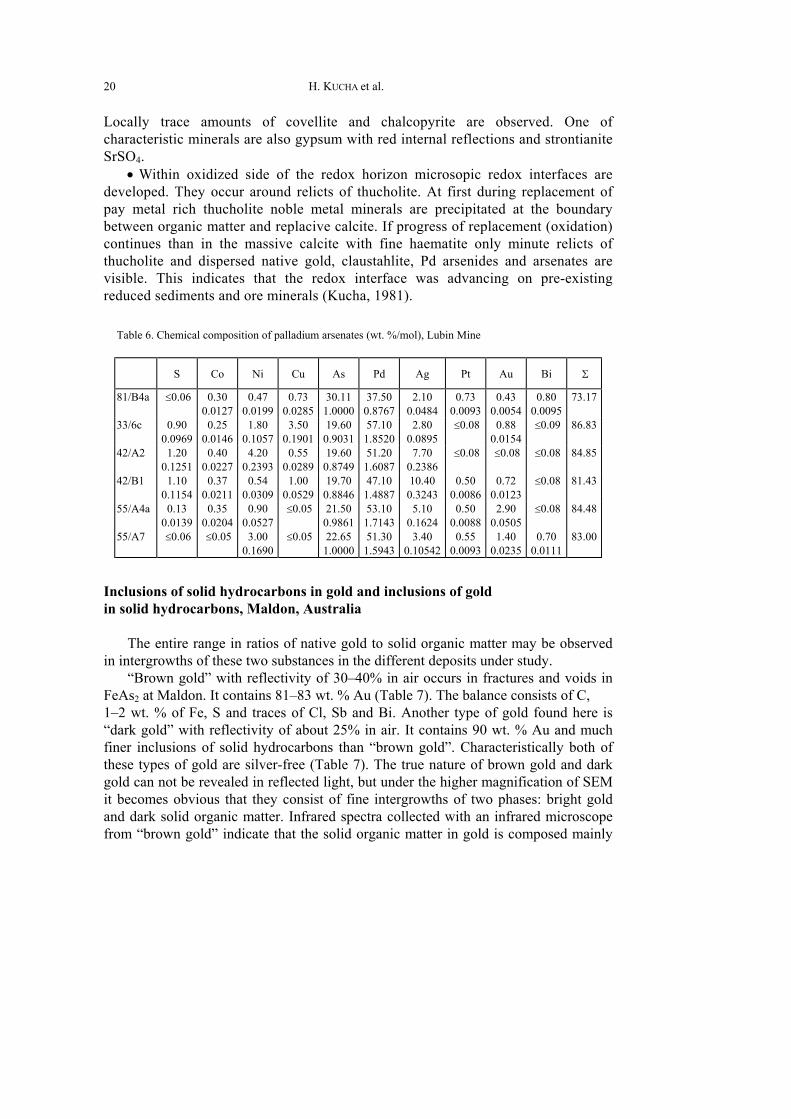
• Within oxidized side of the redox horizon microsopic redox interfaces are developed. They occur around relicts of thucholite. At first during replacement of pay metal rich thucholite noble metal minerals are precipitated at the boundary between organic matter and replacive calcite. If progress of replacement (oxidation) continues than in the massive calcite with fine haematite only minute relicts of thucholite and dispersed native gold, claustahlite, Pd arsenides and arsenates are visible. This indicates that the redox interface was advancing on pre-existing reduced sediments and ore minerals (Kucha, 1981).
Table 6. Chemical composition of palladium arsenates (wt. %/mol), Lubin Mine
S Co Ni Cu As Pd Ag Pt Au Bi Σ
81/B4a ≤0.06 0.30 0.0127
0.47 0.0199
0.73 0.0285
30.11 1.0000
37.50 0.8767
2.10 0.0484
0.73 0.0093
0.43 0.0054
0.80 0.0095
73.17
33/6c 0.90 0.0969
0.25 0.0146
1.80 0.1057
3.50 0.1901
19.60 0.9031
57.10 1.8520
2.80 0.0895
≤0.08 0.88 0.0154
≤0.09 86.83
42/A2 1.20 0.1251
0.40 0.0227
4.20 0.2393
0.55 0.0289
19.60 0.8749
51.20 1.6087
7.70 0.2386
≤0.08 ≤0.08 ≤0.08 84.85
42/B1 1.10 0.1154
0.37 0.0211
0.54 0.0309
1.00 0.0529
19.70 0.8846
47.10 1.4887
10.40 0.3243
0.50 0.0086
0.72 0.0123
≤0.08 81.43
55/A4a 0.13 0.0139
0.35 0.0204
0.90 0.0527
≤0.05 21.50 0.9861
53.10 1.7143
5.10 0.1624
0.50 0.0088
2.90 0.0505
≤0.08 84.48
55/A7 ≤0.06 ≤0.05 3.00 0.1690
≤0.05 22.65 1.0000
51.30 1.5943
3.40 0.10542
0.55 0.0093
1.40 0.0235
0.70 0.0111
83.00
Inclusions of solid hydrocarbons in gold and inclusions of gold in solid hydrocarbons, Maldon, Australia
The entire range in ratios of native gold to solid organic matter may be observed in intergrowths of these two substances in the different deposits under study.
“Brown gold” with reflectivity of 30–40% in air occurs in fractures and voids in FeAs2 at Maldon. It contains 81–83 wt. % Au (Table 7). The balance consists of C, 1–2 wt. % of Fe, S and traces of Cl, Sb and Bi. Another type of gold found here is “dark gold” with reflectivity of about 25% in air. It contains 90 wt. % Au and much finer inclusions of solid hydrocarbons than “brown gold”. Characteristically both of these types of gold are silver-free (Table 7). The true nature of brown gold and dark gold can not be revealed in reflected light, but under the higher magnification of SEM it becomes obvious that they consist of fine intergrowths of two phases: bright gold and dark solid organic matter. Infrared spectra collected with an infrared microscope from “brown gold” indicate that the solid organic matter in gold is composed mainly
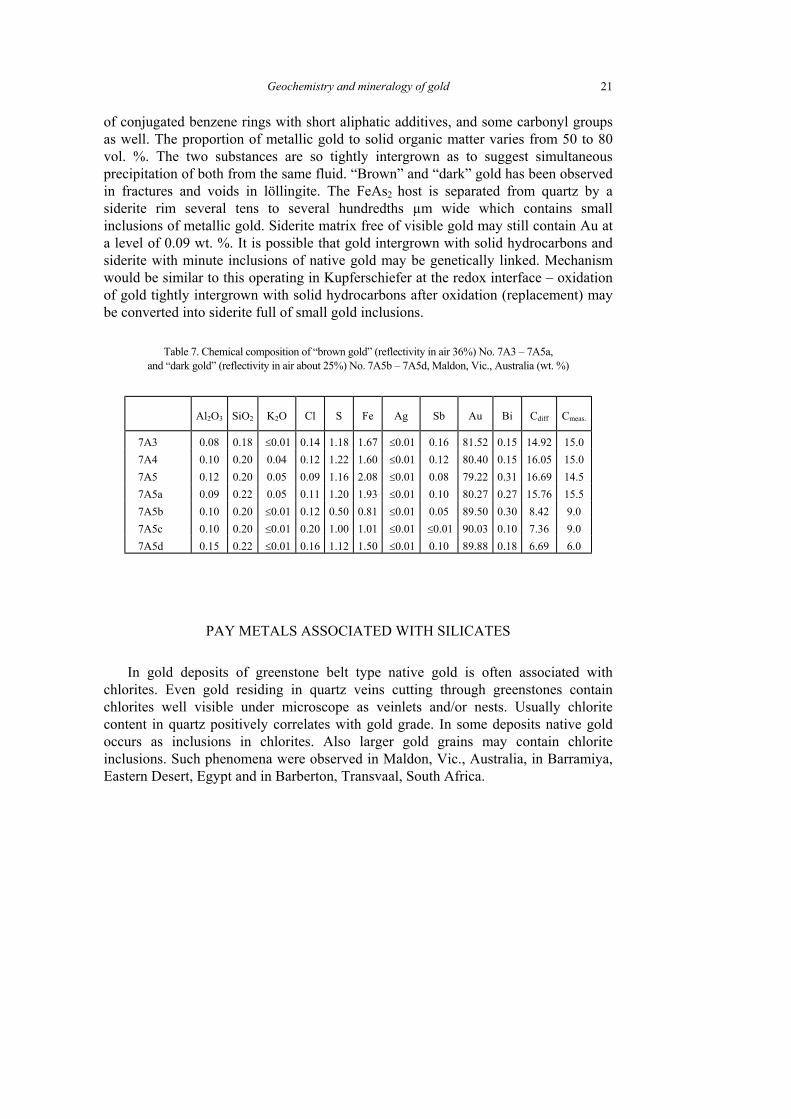
Geochemistry and mineralogy of gold 21
of conjugated benzene rings with short aliphatic additives, and some carbonyl groups as well. The proportion of metallic gold to solid organic matter varies from 50 to 80 vol. %. The two substances are so tightly intergrown as to suggest simultaneous precipitation of both from the same fluid. “Brown” and “dark” gold has been observed in fractures and voids in löllingite. The FeAs2 host is separated from quartz by a siderite rim several tens to several hundredths µm wide which contains small inclusions of metallic gold. Siderite matrix free of visible gold may still contain Au at a level of 0.09 wt. %. It is possible that gold intergrown with solid hydrocarbons and siderite with minute inclusions of native gold may be genetically linked. Mechanism would be similar to this operating in Kupferschiefer at the redox interface – oxidation of gold tightly intergrown with solid hydrocarbons after oxidation (replacement) may be converted into siderite full of small gold inclusions.
Table 7. Chemical composition of “brown gold” (reflectivity in air 36%) No. 7A3 – 7A5a, and “dark gold” (reflectivity in air about 25%) No. 7A5b – 7A5d, Maldon, Vic., Australia (wt. %)
Al2O3 SiO2 K2O Cl S Fe Ag Sb Au Bi Cdiff Cmeas.
7A3 0.08 0.18 ≤0.01 0.14 1.18 1.67 ≤0.01 0.16 81.52 0.15 14.92 15.0 7A4 0.10 0.20 0.04 0.12 1.22 1.60 ≤0.01 0.12 80.40 0.15 16.05 15.0 7A5 0.12 0.20 0.05 0.09 1.16 2.08 ≤0.01 0.08 79.22 0.31 16.69 14.5 7A5a 0.09 0.22 0.05 0.11 1.20 1.93 ≤0.01 0.10 80.27 0.27 15.76 15.5 7A5b 0.10 0.20 ≤0.01 0.12 0.50 0.81 ≤0.01 0.05 89.50 0.30 8.42 9.0 7A5c 0.10 0.20 ≤0.01 0.20 1.00 1.01 ≤0.01 ≤0.01 90.03 0.10 7.36 9.0 7A5d 0.15 0.22 ≤0.01 0.16 1.12 1.50 ≤0.01 0.10 89.88 0.18 6.69 6.0
PAY METALS ASSOCIATED WITH SILICATES
In gold deposits of greenstone belt type native gold is often associated with chlorites. Even gold residing in quartz veins cutting through greenstones contain chlorites well visible under microscope as veinlets and/or nests. Usually chlorite content in quartz positively correlates with gold grade. In some deposits native gold occurs as inclusions in chlorites. Also larger gold grains may contain chlorite inclusions. Such phenomena were observed in Maldon, Vic., Australia, in Barramiya, Eastern Desert, Egypt and in Barberton, Transvaal, South Africa.
H. KUCHA et al. 22
Inclusions of As-chlorites in gold and inclusions of gold in chlorites, Maldon, Australia
Clean quartz veins at Maldon contain little gold (Moon, 1987). Most gold occurs in dark patches, nests, veins and veinlets composed mainly of chlorites, with smaller amounts of biotite and muscovite, which cut through quartz veins. Under the microscope chlorites are also visible as nests and veinlets cutting through earlier ore minerals. Chlorites are finely intergrown with gold, and form myrmekitic intergrowths with metallic gold. On the other hand, chlorite nests and veins in quartz contain fine inclusions of native gold and larger grains of FeAs2. Secondary, later chlorite veins are free of visible gold.
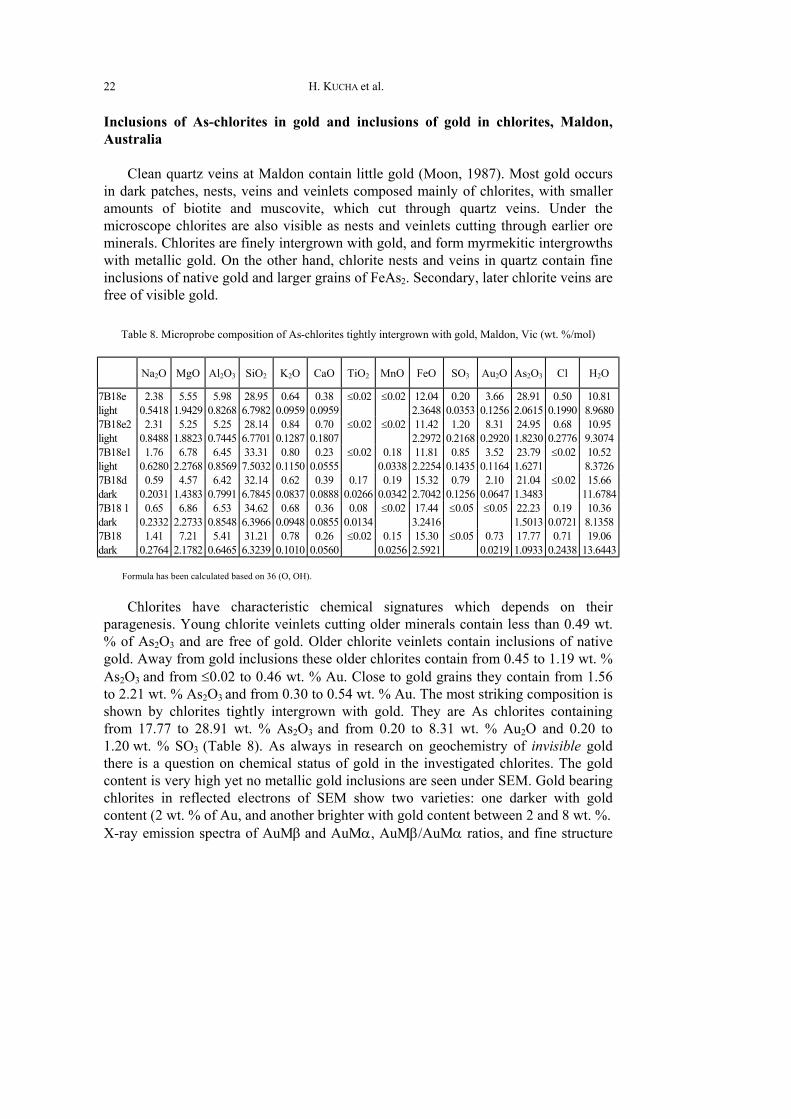
Table 8. Microprobe composition of As-chlorites tightly intergrown with gold, Maldon, Vic (wt. %/mol)
Na2O MgO Al2O3 SiO2 K2O CaO TiO2 MnO FeO SO3 Au2O As2O3 Cl H2O
7B18e light
2.38 0.5418
5.55 1.9429
5.98 0.8268
28.95 6.7982
0.64 0.0959
0.38 0.0959
≤0.02 ≤0.02 12.04 2.3648
0.20 0.0353
3.66 0.1256
28.91 2.0615
0.50 0.1990
10.81 8.9680
7B18e2 light
2.31 0.8488
5.25 1.8823
5.25 0.7445
28.14 6.7701
0.84 0.1287
0.70 0.1807
≤0.02 ≤0.02 11.42 2.2972
1.20 0.2168
8.31 0.2920
24.95 1.8230
0.68 0.2776
10.95 9.3074
7B18e1 light
1.76 0.6280
6.78 2.2768
6.45 0.8569
33.31 7.5032
0.80 0.1150
0.23 0.0555
≤0.02 0.18 0.0338
11.81 2.2254
0.85 0.1435
3.52 0.1164
23.79 1.6271
≤0.02 10.52 8.3726
7B18d dark
0.59 0.2031
4.57 1.4383
6.42 0.7991
32.14 6.7845
0.62 0.0837
0.39 0.0888
0.17 0.0266
0.19 0.0342
15.32 2.7042
0.79 0.1256
2.10 0.0647
21.04 1.3483
≤0.02 15.66 11.6784
7B18 1 dark
0.65 0.2332
6.86 2.2733
6.53 0.8548
34.62 6.3966
0.68 0.0948
0.36 0.0855
0.08 0.0134
≤0.02 17.44 3.2416
≤0.05 ≤0.05 22.23 1.5013
0.19 0.0721
10.36 8.1358
7B18 dark
1.41 0.2764
7.21 2.1782
5.41 0.6465
31.21 6.3239
0.78 0.1010
0.26 0.0560
≤0.02 0.15 0.0256
15.30 2.5921
≤0.05 0.73 0.0219
17.77 1.0933
0.71 0.2438
19.06 13.6443
Formula has been calculated based on 36 (O, OH).
Chlorites have characteristic chemical signatures which depends on their paragenesis. Young chlorite veinlets cutting older minerals contain less than 0.49 wt. % of As2O3 and are free of gold. Older chlorite veinlets contain inclusions of native gold. Away from gold inclusions these older chlorites contain from 0.45 to 1.19 wt. % As2O3 and from ≤0.02 to 0.46 wt. % Au. Close to gold grains they contain from 1.56 to 2.21 wt. % As2O3 and from 0.30 to 0.54 wt. % Au. The most striking composition is shown by chlorites tightly intergrown with gold. They are As chlorites containing from 17.77 to 28.91 wt. % As2O3 and from 0.20 to 8.31 wt. % Au2O and 0.20 to 1.20 wt. % SO3 (Table 8). As always in research on geochemistry of invisible gold there is a question on chemical status of gold in the investigated chlorites. The gold content is very high yet no metallic gold inclusions are seen under SEM. Gold bearing chlorites in reflected electrons of SEM show two varieties: one darker with gold content (2 wt. % of Au, and another brighter with gold content between 2 and 8 wt. %. X-ray emission spectra of AuMβ and AuMα, AuMβ/AuMα ratios, and fine structure
Geochemistry and mineralogy of gold 23
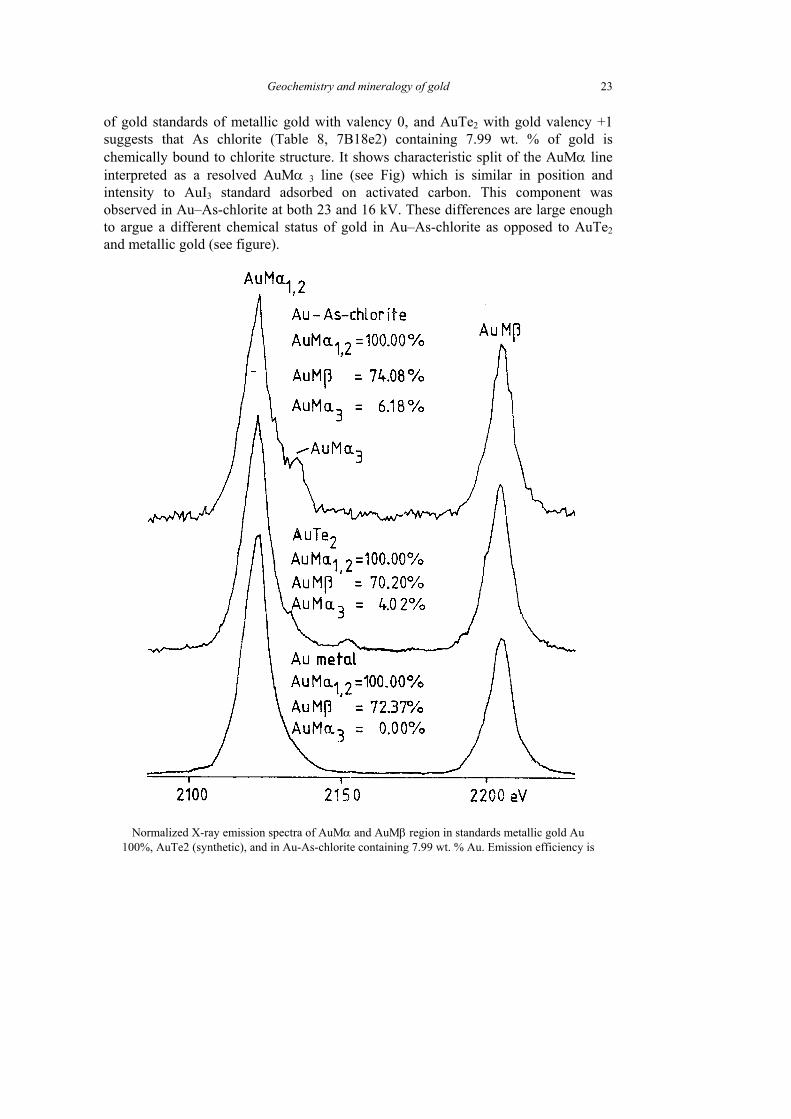
of gold standards of metallic gold with valency 0, and AuTe2 with gold valency +1 suggests that As chlorite (Table 8, 7B18e2) containing 7.99 wt. % of gold is chemically bound to chlorite structure. It shows characteristic split of the AuMα line interpreted as a resolved AuMα 3 line (see Fig) which is similar in position and intensity to AuI3 standard adsorbed on activated carbon. This component was observed in Au–As-chlorite at both 23 and 16 kV. These differences are large enough to argue a different chemical status of gold in Au–As-chlorite as opposed to AuTe2 and metallic gold (see figure).
Normalized X-ray emission spectra of AuMα and AuMβ region in standards metallic gold Au
100%, AuTe2 (synthetic), and in Au-As-chlorite containing 7.99 wt. % Au. Emission efficiency is
H. KUCHA et al. 24
normalized to AuM (1,2 taken as 100%. Au-As-chlorite shows a distinct AuM (3 component barely visible in AuTe2 (Au valency +1), and absent in metallic gold (Au valency 0)
Arsenic valency, as determined in the above chlorites by microprobe, is about +3.5 and gold valency varies around +3. Although these measurements should be regarded as preliminary, they suggest that gold present in chlorites is bound chemically to their structure. This may open a new chapter in gold mobility research. As-chlorites which contain above 2 wt. % Au appear distinctly brighter under SEM than As-chlorites containing less than 2 wt. % Au. The two types of As-chlorites sometimes form intergrowths with clearly visible boundaries marking the contact between the two minerals. Gold intergrown with As-chlorites is of high fineness and contains only 0.09–0.28 wt. % Ag and 0.10–0.16 wt. % Fe. The gold forms so tight myrmekitic intergrowths with As-chlorites that rapid, simultaneous precipitation from the same parent fluid is indicated.
Chlorite veinlets in gold bearing quartz veins at Barramiya contain small inclusions of metallic gold. They are As-bearing chlorites with As2O3 varying between 2.00 and 3.39 wt. % and gold content changing between ≤0.05 and 1.21 wt. %. Under reflected light microscope these chlorites are texturally similar to these observed at Maldon, and may be of similar origin. Chlorite inclusions intergrown with native gold in pyrite from Barberton, South Africa contain up to 2.89 wt. % of As2O3 and up to 0.41 wt. % of Au.
Gold associated with oxysulphides and occurrence of Au-oxysulphides
Oxysulphides were reported from the Lubin deposit, Poland (Kucha, 1990). Some of them contain detectable gold content. Oxysulphides associated with gold are present at Barberton and Pilgrim’s Rest, South Africa, Comet Mine, NSW, Australia (Kucha et al., 1994) as well as in Maldon, Vic., Australia. They were reported from Veitsch, Austria, where they contain 0.12–0.21 wt % of Au (Kucha et al., 1995). So far significance of these compounds in gold metallogeny escaped attention of students of gold mineralogy and mineral processing.
Au–Cu oxysulphides from Mitterberg, Austria
Sb-fahlore in Mitterberg is a major gold carrier. This has been overlooked in the past, and subsequently fahlore has never been considered as the most attractive target during mining and mineral dressing procedures.
Five types of gold can be distinguished in the Sb-fahlore: 1. Gold (primary?) present in massive, unfractured fahlore. This gold usually
forms grains only a few µm in size, rarely up to 20 µm. It is composed of (average, wt. %): Ag 25.18, Au 67.39 and Hg 7.05.
Geochemistry and mineralogy of gold 25
2. Native gold and electrum present in microfractures in fahlore together with pyrite, gersdorffite, chalcopyrite, cubanite and quartz. The chemical composition of gold depends on the paragenesis. Gold of the highest fineness appears together with Cu–As-bearing fractured pyrite replacing tetrahedrite. Gold associated with quartz is rich in silver.
3. Ag2Au3Hg present in microfractured fahlore with or without chalcopyrite II and/or gersdorffite.
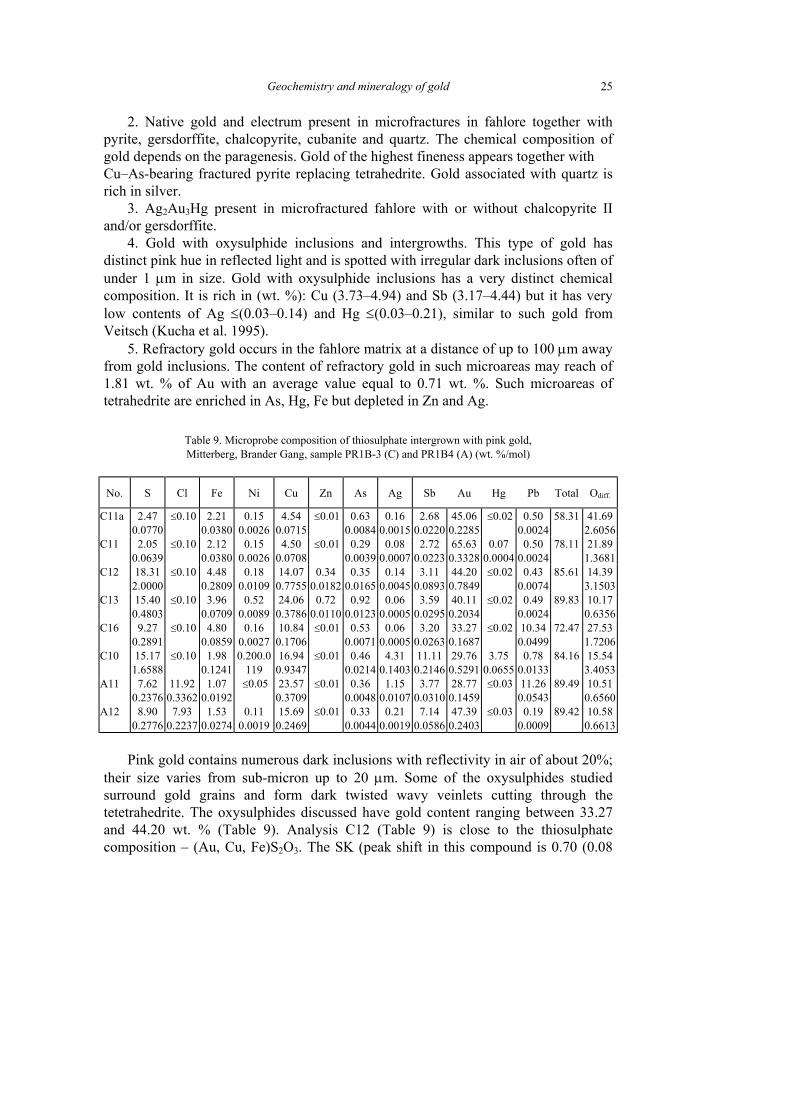
4. Gold with oxysulphide inclusions and intergrowths. This type of gold has distinct pink hue in reflected light and is spotted with irregular dark inclusions often of under 1 µm in size. Gold with oxysulphide inclusions has a very distinct chemical composition. It is rich in (wt. %): Cu (3.73–4.94) and Sb (3.17–4.44) but it has very low contents of Ag ≤(0.03–0.14) and Hg ≤(0.03–0.21), similar to such gold from Veitsch (Kucha et al. 1995).
5. Refractory gold occurs in the fahlore matrix at a distance of up to 100 µm away from gold inclusions. The content of refractory gold in such microareas may reach of 1.81 wt. % of Au with an average value equal to 0.71 wt. %. Such microareas of tetrahedrite are enriched in As, Hg, Fe but depleted in Zn and Ag.
Table 9. Microprobe composition of thiosulphate intergrown with pink gold, Mitterberg, Brander Gang, sample PR1B-3 (C) and PR1B4 (A) (wt. %/mol)
No. S Cl Fe Ni Cu Zn As Ag Sb Au Hg Pb Total Odiff.
C11a 2.47 0.0770
≤0.10 2.21 0.0380
0.15 0.0026
4.54 0.0715
≤0.01 0.63 0.0084
0.16 0.0015
2.68 0.0220
45.06 0.2285
≤0.02 0.50 0.0024
58.31 41.69 2.6056
C11 2.05 0.0639
≤0.10 2.12 0.0380
0.15 0.0026
4.50 0.0708
≤0.01 0.29 0.0039
0.08 0.0007
2.72 0.0223
65.63 0.3328
0.07 0.0004
0.50 0.0024
78.11 21.89 1.3681
C12 18.31 2.0000
≤0.10 4.48 0.2809
0.18 0.0109
14.07 0.7755
0.34 0.0182
0.35 0.0165
0.14 0.0045
3.11 0.0893
44.20 0.7849
≤0.02 0.43 0.0074
85.61 14.39 3.1503
C13 15.40 0.4803
≤0.10 3.96 0.0709
0.52 0.0089
24.06 0.3786
0.72 0.0110
0.92 0.0123
0.06 0.0005
3.59 0.0295
40.11 0.2034
≤0.02 0.49 0.0024
89.83 10.17 0.6356
C16 9.27 0.2891
≤0.10 4.80 0.0859
0.16 0.0027
10.84 0.1706
≤0.01 0.53 0.0071
0.06 0.0005
3.20 0.0263
33.27 0.1687
≤0.02 10.34 0.0499
72.47 27.53 1.7206
C10 15.17 1.6588
≤0.10 1.98 0.1241
0.200.0119
16.94 0.9347
≤0.01 0.46 0.0214
4.31 0.1403
11.11 0.2146
29.76 0.5291
3.75 0.0655
0.78 0.0133
84.16 15.54 3.4053
A11 7.62 0.2376
11.92 0.3362
1.07 0.0192
≤0.05 23.57 0.3709
≤0.01 0.36 0.0048
1.15 0.0107
3.77 0.0310
28.77 0.1459
≤0.03 11.26 0.0543
89.49 10.51 0.6560
A12 8.90 0.2776
7.93 0.2237
1.53 0.0274
0.11 0.0019
15.69 0.2469
≤0.01 0.33 0.0044
0.21 0.0019
7.14 0.0586
47.39 0.2403
≤0.03 0.19 0.0009
89.42 10.58 0.6613
Pink gold contains numerous dark inclusions with reflectivity in air of about 20%;
their size varies from sub-micron up to 20 µm. Some of the oxysulphides studied surround gold grains and form dark twisted wavy veinlets cutting through the tetetrahedrite. The oxysulphides discussed have gold content ranging between 33.27 and 44.20 wt. % (Table 9). Analysis C12 (Table 9) is close to the thiosulphate composition – (Au, Cu, Fe)S2O3. The SK (peak shift in this compound is 0.70 (0.08
H. KUCHA et al. 26
eV close to the peak position in the standard thiosulphate. Another inclusion (Table 9, C13) shows composition close to (Cu, Au)S2O3 and the SKβ peak shift equal to 0.61 (0.09 eV. The Au valency measured by microprobe in the thiosulphates discussed is close to +1. Both compounds studied show a double SKβ peak and S6+ satellites similar to those seen in the thiosulphate standard. Therefore taking into account the chemical composition of the oxysulphides considered (Table 9) and results of the X-ray spectroscopic studies these compounds may be tentatively identified as Au–Cu- and Cu–Au-thiosulphates. Not all inclusions in gold (Table 9) show such clear stoichiometry. Because of their small size and exsolutions of nanoinclusions of metallic gold many of them represent a physical mixture of oxysulphides and metallic gold (Table 9, C11, C11a). Non-stoichiometric analyses with significant oxygen content may suggest that the process of decomposition of Au–Cu–Fe oxysulphides continued after precipitation producing a complex nano-mixture of solid native metals, sulphides, oxysulphides and oxides. The tetrahedrite matrix directly surrounding the gold with oxysulphide inclusions is enriched in As, Fe, Hg and distinctly depleted in Zn, Ag and Sb. This may suggest that the first three elements moved from the fluid phase to the solid by ion exchange, and simultaneously the second three elements moved from the solid to a liquid phase.
Oxysulphides of iron and gold from the Comet Mine, NSW, Australia
Native gold at the mine occurs in two distinct pargeneses: • gold with quartz and Bi-tellurides. Gold forms inclusions in the quartz matrix
with or without Bi tellurides. • gold with pyrite, thiosulphates, sulphates and haematite. Gold occurs as
intergrowths with sulphates, haematite and pyrite with thiosulphate relics. Often gold is present at grain boundaries between haematite and sulphate and as inclusions in Fe thioulphates, suggesting the involvement of thiosulphate in the transport and/or redistribution of Au within the orebody. Sulphates have an increased content of Pb, Cu, Zn, Al and Si (Kucha et al., 1994).
Thiosulphates are ubiquitously associate with gold at the Comet Mine, forming irregular aggregates up to 1 mm in size, being partly replaced by sulphates and haematie and also forming relicts in pyrite. Two different types of pyrite are recognized. The first is euhedral and takes a clean polish, whereas the second contains numerous dark, cloudy inclusions of thiosulphates and was probably formed by the replacement of an Fe thiosulphate precursor. Microprobe analyses reveal that S, Fe and O are main components of oxysulphides studied. Main trace elements are Cu, As, Ag and Pb ranging from ≤0.05 to 0.85 wt. % (Kucha et al., 1994). Sometimes gold is present above detection limit as well. The SKβ emission spectra show S6+ and S4+ satellites and a double SKβ peak top indicating the presence of thiosulphates and sulphites (Kucha et al., 1994). Gold is so tightly and finely intergrown with oxysulphides that this texture will affect gold recovery.
Geochemistry and mineralogy of gold 27
GOLD IN SULPHIDES
Gold is present as an admixture in sulphide minerals from Lubin (Kucha, 1975, 1984). It also occurs as an admixture together with Pd and Pt in arsenides at this location (Kucha, 1984). Gold in sulphides is also found at Maldon, Bendigo, Australia, at Veitsch (Kucha et al., 1995, 1997 a, b) as well as at Mitterberg, Austria. Preliminary microprobe measurements of gold valencies in sulphides suggests that below certain concentration characteristic for each mineral gold occurs as Au +1, and above saturation limit in a given lattice it occurs as metallic submicroscopic inclusions as Au 0. In deposits of gold bearing arsenopyrite, and/or pyrite invisible gold of both types i.e. chemically bound to the lattice and minute inclusions of metallic particles may control most of gold budget. This has strong influence on choice of metal recovery technology.
DISCUSSION
Chemical status of gold in deposits discussed differs from case to case. This indicates that each of them has to be treated as an individual case to choose a proper gold and/or PGM recovery. In recent times mesothermal and epithermal deposits are becoming more and more important gold producers. Therefore advanced mineralogical and geochemical studies are getting increasingly important. They include gold valences measurements, identification of chemical status of „invisible” gold, as well as textures and microtextures of gold and gold-bearing minerals.
One of principal associations discussed in this note are associations of pay metals with organic matter. It seems to be important in the Kupferschiefer. Most of gold and PGE’s associated with hydrocarbons occurs on the reduced side of the redox interface where they form thin but higher grade accumulations, but with limited lateral extension. On the oxidized side of the interface pay metals occur mainly as native metals and palladium arsenates where they form thicker but lower grade accumulations and are laterally extensive. A rough estimation of reserves on both sides of the redox interface suggests that on reduced side it may about 20–25% of reserves, and on the oxidized side remaining 75–80%. In case of mining both types will be mined together and extracted ore will have a mixed nature. Therefore, the ore processing will have to cope simultaneously with organically fixed pay metals, with pay metal minerals such as native metals, arsenides and arsenates, as well as pay metals substituted in arsenide and sulphide carriers.
Close intergrowths of native Au and Au–As-chlorites at Maldon, Australia, Barramiya, Egypt, and Barberton, Transvaal, South Africa present a new challenge for mineral processing. Properties of gold silicates are virtually unknown, also quantitative partition of gold between native gold and various mineral carriers present a challenge for mineralogical and geochemical study.
H. KUCHA et al. 28
Gold thiosulphates occurring at Mitterberg, Austria open a new field of study on gold mineralogy and geochemistry. These compounds are leachable by acidic water and could be recovered by heap or bacterial leaching. This would have an extra bonus because this treatment will also recover gold substituted in sulphides, which contain up to 1.8 wt. % of Au (Kucha et al., 1977a, b).
Well conducted research on mineralogy and geochemistry of pay metals in mesothermal-epithermal deposits shall be conducted with care starting from sample preparation to avoid destruction of fragile oxysulphide minerals. Main methods of research should include high quality reflected light microscopy, EPMA, SEM, HRTM as well as microbeam techniques with very high detection limits such as SXRFA and MPIXE.
REFERENCES
BERNHARD J., 1966, Die Mitterberger Kupferkieslagerstätte Erzführung und Tektonik, Jb. Geol. B. A., 109, 20–89.
CABRI L. J., CHRYSSOULIS S. L., DE VILLIERS J. P. R., LAFLAMME J. H. G., BUSECK P. R., 1989, The nature of invisible gold in arsenopyrite, Can. Mineral., 27, 353–362.
COOK N. J., CHRYSSOULIS S. L., 1990, Concentration of „invisible gold” in the common sulphides, Canadian Min., 28, 1–16.
EL SHAZLY E. M., 1977, The geology of the Egyptian region, 379–444. [In:] A. The, W. Kanes, F. Stehli, (Eds.) The ocean basins and margins, London, Plenum Press.
HOFMANN B., 1986, Small-scale multi-element accumulations in Permian red-beds of Northern Switzerland, Neues Jb. Mineral. Mh., 8, 367–375.
KUCHA H., 1973, Organic gold compounds in Cu-bearing shale from the Fore-Sudetic, Rudy Metale, 6, 302–303 (in Polish).
KUCHA H., 1974, Native gold in the copper deposits from the Fore-Sudetic Monocline, Rudy Metale, 4, 174–175 (in Polish).
KUCHA H., 1975, Preliminary report on the occurrence of palladium minerals in the Zechstein rocks of the Fore-Sudetic Monocline, Min. Pol., 6, 87–93.
KUCHA H., 1976a, Platinum, palladium, mercury and gold in Zechstein sediments of the Fore-Sudetic Monocline, Rudy Metale, 21, 24–26 (in Polish).
KUCHA H., 1976b, Organic matter, Au, Ni i Co in Zechstein sediments of the Fore-Sudetic Monocline, Ann. Soc. Geol. Pol., 47, 369–417 (in Polish).
KUCHA H., 1981, Precious metal alloys and organic matter in the Zechstein copper deposits, Poland. Tschermak’s Min. Pet. Mitt., 28, 1616.
KUCHA H., 1982, Platinum metals in the Zechstein copper deposits, Poland. Econ. Geol., 77, 1578–1591.
KUCHA H., 1983, Precious metal bearing shale from Zechstein copper deposits, Lower Silesia, Poland. Trans Instn. Min. Metall. (Sect. B: Appl. Earth Sci.), 92, 72–79.
KUCHA H., 1984, Palladium minerals in the Zechstein copper deposits in Poland, Chemie Erde, 43, 27–43.
KUCHA H., 1985, Feldspar, clay, organic and carbonate receptors of heavy metals in the Zechstein deposits (Kupferschiefer-type), Poland, Trans. Instn Min. Metall. (Sect. B: Appl. Earth Sci.), 94, 133–146.
KUCHA H., 1990, Geochemistry of the Kupferschiefer, Poland, Geol. Rundschau, 79, 387–399.
Geochemistry and mineralogy of gold 29
KUCHA H., 1993, Noble metals associated with organic matter, Kupferschiefer, Poland, 153–170. [In:] J. Parnell, H. Kucha, P. Landais (Eds.) Bitumens in ore deposits, Spec. publ. SGA, 9, 520, Springer 1993.
KUCHA H., 1995, Redefinition of Rote Fäule, Kupferschiefer, Poland, 953–956. [In:] J. Pasava, B. Kribek, K. Zak (Eds,) Mineral deposits: from their origin to their environmental impacts, Proc.Third Bienn. SGA Meeting, Prague, 28–30 Aug.1995, 1018, Balkema, Rotterdam 1995.
KUCHA H., POCHEC J., 1983, Organogenic ankeritic limestone with glauconite and native Au, Pt, Pd and Pb alloys in the region of Lubin (Western Poland), Ann. Soc. Geol. Pol., 53, 169–176.
KUCHA H., PROCHASKA W., STUMPFL E.F., 1995, Deposition and transport of gold by thiosulphates, Veitsch, Austria. Min. Mag., 59, 253–258.
KUCHA H., PROCHASKA W., STUMPFL E. F., 1997b, Tetrahedrite, a novel gold trap and its meaning for gold metallogeny in the Austrian Alps, 229–232. [In:] Heiki Papunen (Ed.) Mineral Deposits: Research and Exploration, Where do they meet? Proc.IV Bien. SGA Meeting, Turku, Finland, 11–13 August, 1977, Balkema, Rotterdam, 1977, 980.
KUCHA H., PRZYBY£OWICZ W., LANKOSZ M., LANGEVELDE VAN F., TRAXEL K., 1993, EPMA, micro-PIXE, synchrotron microprobe and TEM study of visible and invisible accumulations of Au and PGE in black shale and organic matrix, Kupferschiefer, Poland, Min. Mag., 57, 103–112.
KUCHA H., STUMPFL E. F., PLIMER I. R., K CK R., 1994, Gold-pyrite association-result of oxysulphide and polysulphide transport of gold? Trans. Instn Min. Metall. (Sect. B: Appl. Earth Sci.), 103, 197–205.
KUCHA H., STUMPFL E. F., PROCHASKA W., 1997a, Au-oxysulphide inclusions in gold and their meaning for gold transport and deposition, Mitterberg, Austria, 225–228. [In:] Heiki Papunen (Ed.) Mineral Deposits: Research and Exploration, Where do they meet? Proc. IV Bien. SGA Meeting, Turku, Finland/11–13 August, 1977, Balkema, Rotterdam, 1977, 980.
KUCHA H., WIECZOREK A., 1988, Graphite in Kupferschiefer (Poland) and its genetic meaning, Min. Deposita, 23, 174–178.
KUCHA H., WOUTERS R., ARKENS O., 1989, Determination of sulphur and iron valence by microprobe, Scanning Microscopy, 3, No. l, 89–97.
KUCHA H., MAYER W., PIESTRZYNSKI A., 1983, Vanadium in the copper ore deposits on the Fore-Sudetic Monocline (Poland), Min. Pol., 14, 35–43.
MARION P., HOLLIGER P., BOIRON M. C., CATHELINEAU M., THE, F. E., 1991, New improvements in the characterization of refractory gold in pyrites: An electron microprobe, Mössbauer spectrometry and ion microprobe study, 389–395. [In:] E. A. Ladeira (Ed.) The economics, geology, geochemistry and genesis of gold deposits, Proc. Symp. Brazil Gold’91, Bello Horizonte, 13–17 May, 1991, Balkema/Rotterdam/Brookfield/1991.
MOON, R. A., 1897, Report on the Maldon Gold-Field, Dep. of Mines, Spec. Reports, R. S. Brain, Govt. Printer, Melbourne 1897, 25.
MORGAN B. D., WOODLAND J. G., 1990, Union Hill gold deposit, Maldon, 1279–1280. [In:] F. E. Hughes (Ed.) Geology of the mineral deposits of Australia and Papua New Guinea, The Australian Institute of Mining and Metallurgy, Melbourne.
PARNELL J., 1988, Metal enrichments in solid bitumens: a review, Mineral. Deposita, 23, 191–199. PIESTRZYNSKI A., 1988, Uranium and thorium in the Lubin polymetallic ore deposits, Fore-Sudetic
Monocline, SW Poland, Mineral. Pol., 20, 41–57. PIESTRZYNSKI A., 1990, Uranium and thorium in the Kupferschiefer formation, Lower Silesia, Poland.
Mineralium Deposita, 25, 146–151. PIESTRZYNSKI A., WODZICKI A., BANASZAK A., 1996, Gold in the copper deposits of the Fore-
Sudetic Monocline (SW Poland), Przegl. Geol., 44, No. 11, 1098–1102. PLIMER I. R., 1982, The Hillgrove antimony deposit, 277–284. [In:] P. G. Flood and B. Runnegar (Eds.)
New England Geology, Department of Geology, University of New England).
H. KUCHA et al. 30
RAMSAY W. R. H., WILLMAN C. E., 1988, Gold, 454–481. [In:] J. Douglas and J. A. Fergusson (Eds.) Geology of Victoria.
RYDZEWSKI A., 1976, The origin of the Zechstein polymetallic mineralization, Przegl. Geol., No. 4, 176–181 (in Polish).
SAWLOWICZ Z., 1985, Significance of metaloporphyrins for the metal accumulation in the copper-bearing shales from the Zechstein copper deposits, Poland. Mineral. Pol., 16, 35–42.
SCHIDLOWSKI M., 1968, Critical remarks on a postulated genetic relationship between Precambrian thucholite and boghead coal, 579–592. [In:] Schenk, P. A. Havenaar, J. (Eds.) Advances in organic geochemistry, Pergamon, Oxford.
SCHOUWSTRA R. P., DE VILLIERS J. P. R., 1988, Gold mineralization and associated wallrock alteration in the Main Reef Complex at Sheba Mine, South Africa, Trans. Instn Min. Metall. (Sect. B: Appl. Earth Sci.), 97, 158–170.
SHAW S. E., FLOOD R. H., 1981, The New England Batholith, Eastern Australia: geochemical variations in time and space, J. Geophys. Res., 86, No. B11, 10530–10544.
WAGNER F. E., MARION P., REGNARD J. R., 1988, 197Au Mössbauer study of gold ores, mattes, roaster products and gold minerals, Hyperfine Interactions, 41, 851–854.
WAGNER F. E., THE, P. M., MARION P., 1989, A 197Au and 57Fe Mössbauer study of the roasting of refractory gold ores, Hyperfine Interactions, 46, 681–688.
WATERS W. A., 1960, Mechanisms of oxidation of organic compounds, London, Methuen & Wiley, 170. YVONNE J., MARION P., MICHOT L., VILLIERAS F., THE F. E., FRIEDL J., 1991, Development of
mineralogy applications in mineral processing, Eur. J. Mineral., 3, 667–676.
Kucha H., Plimer I. R., Stumpfl E. F., Geochemia i mineralogia złota i metali szlachetnych w złożach mezotermalnych i epitermalnych i ich znaczenie w procesie odzysku metalu. Fizykochemiczne Problemy Mineralurgii, 32, 7–30 (w jęz. angielskim)
W mezotermalnych i epitermalnych złożach metali szlachetnych mineralogia i geochemia Au, Pd i Pt jest złożona. Wymienione metale tworzą domieszki izomorficzne w arsenkach Ni–Co (Lubin, Maldon), antymonkach (Maldon), siarczkach (Veitsch, Mitterberg, Lubin, Maldon, Barberton), materii organicznej (Lubin, Maldon). W niektórych złożach wymienione metale tworzą własne oksysiarczki Au2S2O3 (Veitsch, Mitterberg), związki organometaliczne (Lubin, Maldon), krzemiany (Maldon, Barramiya, Barberton), tellurki, selenki, siarczki, arsenki (Lubin) i arseniany Pd2AsO4 (Lubin). Obecność złota chemicznie związanego z siecią minerałów goszczących potwierdzona została obecnością Au +1 i Au +3. Tak złożona mineralogia i geochemia metali szlachetnych tworzących bezpośrednie wiązania chemiczne z siecią goszczącą powoduje trudności z odzyskiwaniem metali szlachetnych z rudy. Przeróbka takich rud wymaga najbardziej nowoczesnych badań geochemicznych i mineralogicznych w celu dobrania właściwych metod przeróbki. W przeciwnym razie straty w odzyskiwaniu metali szlachetnych mogą sięgać nawet do 50%.