Embed Size (px)
Citation preview
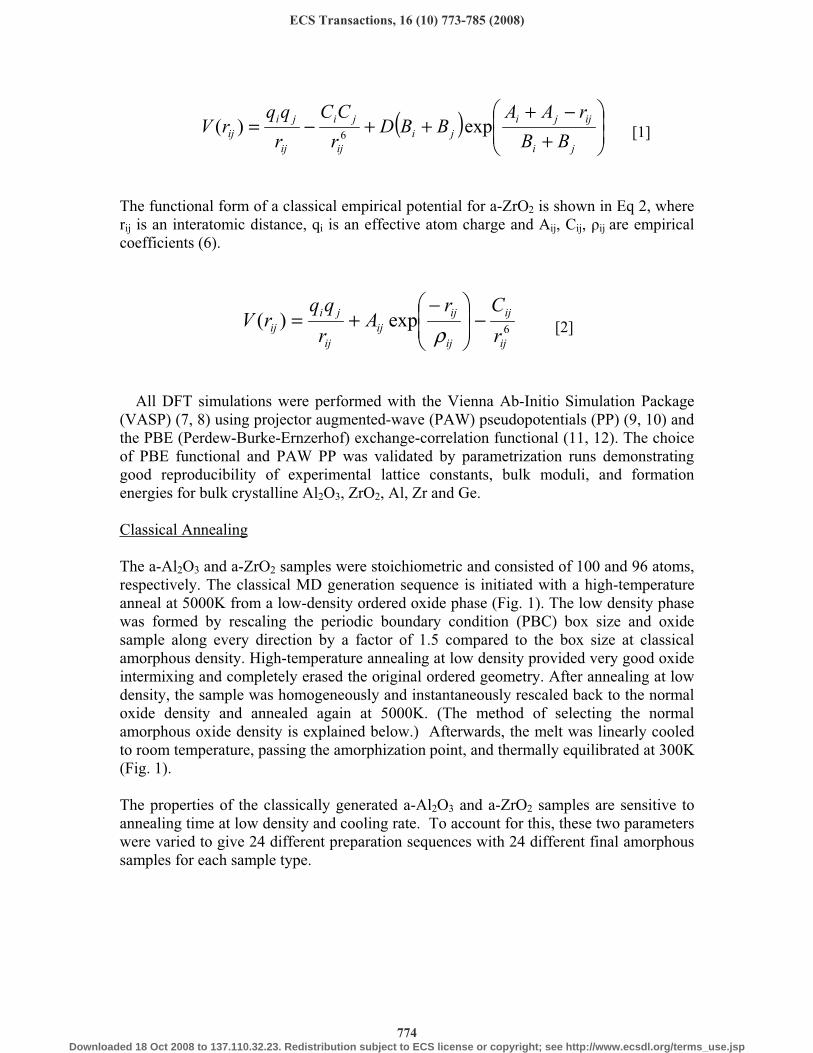
Generation of Realistic Amorphous Al2O3 And ZrO2 Samples By Hybrid
Classical and First-Principle Molecular Dynamics Simulations
Evgueni A Chagarov, Andrew C Kummel
Department of Chemistry and Biochemistry, University of California, San Diego, La Jolla, California 92093
Realistic amorphous samples of a-Al2O3 and a-ZrO2 were generated by a hybrid classical and density functional theory (DFT) “melt and quench” molecular dynamics approach. The
generated samples demonstrated good correlation with reference experimental and simulated properties.
Introduction.
The rapid scaling of complementary metal oxide semiconductor (CMOS) technology requires substituting the traditional gate oxide, SiO2, with high- dielectrics, which can maintain the same capacitance with much lower leakage current. Amorphous aluminum and zirconium oxides (a-Al2O3 and a-ZrO2) are leading candidates for such high- gate oxide materials on Ge. Ge is one of a few semiconductors that offer significantly higher hole mobility than silicon and is being extensively investigated for p-channel high-k MOSFETs. (1-3).
Amorphous oxide-semiconductor interfaces are expected to be superior to crystalline oxide-semiconductor interfaces due to the lack of lattice mismatch at amorphous oxide-semiconductor interfaces that can induce a high density of interface defects. Despite their chemical composition similarity to crystalline phases, amorphous Al2O3 and ZrO2
demonstrate quite different microstructures, coordination distributions, and atomistic chemical environments.
Generation of amorphous Al2O3 and ZrO2 samples.
Classical Potentials
Amorphous a-Al2O3 and a-ZrO2 samples were generated by applying a hybrid “melt and quench” technique that employed classical molecular dynamics (MD) annealing followed
by density functional theory (DFT) annealing of the classical amorphous sample. Classical MD simulations were performed by a Large-Scale Atomic/Molecular Massively
Parallel Simulator (LAMMPS) (4), expanded by well-tested empirical potentials for Al2O3 (5) and ZrO2 (6). The functional form of classical empirical potential for a-Al2O3 is shown in Eq 1, where rij is an interatomic distance, qi is an effective atom charge and Ai,
Bi, Ci, D are empirical coefficients (5).
ECS Transactions, 16 (10) 773-785 (2008)10.1149/1.2986837 © The Electrochemical Society
773Downloaded 18 Oct 2008 to 137.110.32.23. Redistribution subject to ECS license or copyright; see http://www.ecsdl.org/terms_use.jsp
( )+
−+++−=
ji
ijjiji
ij
ji
ij
jiij BB
rAABBD
r
CC
r
qqrV exp)(
6 [1]
The functional form of a classical empirical potential for a-ZrO2 is shown in Eq 2, where rij is an interatomic distance, qi is an effective atom charge and Aij, Cij, ij are empirical coefficients (6).
6exp)(
ij
ij
ij
ijij
ij
jiij r
CrA
r
qqrV −
−+=
ρ [2]
All DFT simulations were performed with the Vienna Ab-Initio Simulation Package (VASP) (7, 8) using projector augmented-wave (PAW) pseudopotentials (PP) (9, 10) and the PBE (Perdew-Burke-Ernzerhof) exchange-correlation functional (11, 12). The choice of PBE functional and PAW PP was validated by parametrization runs demonstrating good reproducibility of experimental lattice constants, bulk moduli, and formation energies for bulk crystalline Al2O3, ZrO2, Al, Zr and Ge.
Classical Annealing
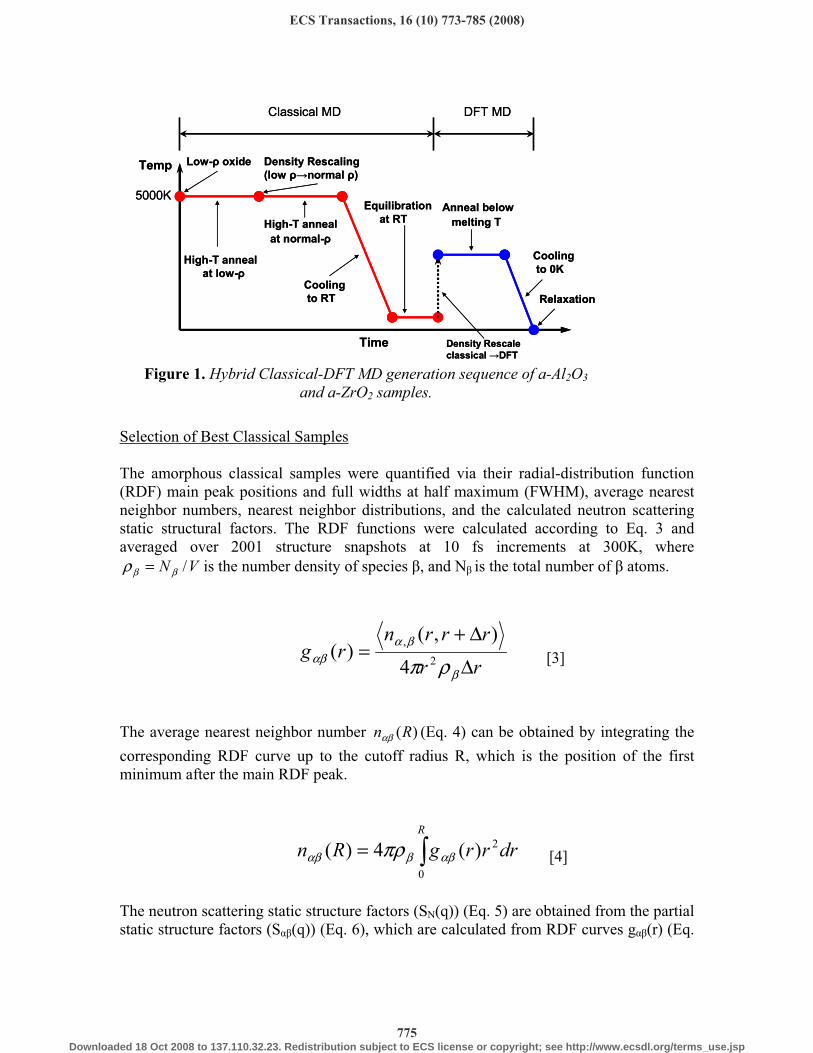
The a-Al2O3 and a-ZrO2 samples were stoichiometric and consisted of 100 and 96 atoms, respectively. The classical MD generation sequence is initiated with a high-temperature anneal at 5000K from a low-density ordered oxide phase (Fig. 1). The low density phase was formed by rescaling the periodic boundary condition (PBC) box size and oxide sample along every direction by a factor of 1.5 compared to the box size at classical amorphous density. High-temperature annealing at low density provided very good oxide intermixing and completely erased the original ordered geometry. After annealing at low density, the sample was homogeneously and instantaneously rescaled back to the normal oxide density and annealed again at 5000K. (The method of selecting the normal amorphous oxide density is explained below.) Afterwards, the melt was linearly cooled to room temperature, passing the amorphization point, and thermally equilibrated at 300K (Fig. 1).
The properties of the classically generated a-Al2O3 and a-ZrO2 samples are sensitive to annealing time at low density and cooling rate. To account for this, these two parameters were varied to give 24 different preparation sequences with 24 different final amorphous samples for each sample type.
ECS Transactions, 16 (10) 773-785 (2008)
774Downloaded 18 Oct 2008 to 137.110.32.23. Redistribution subject to ECS license or copyright; see http://www.ecsdl.org/terms_use.jsp
Selection of Best Classical Samples
The amorphous classical samples were quantified via their radial-distribution function (RDF) main peak positions and full widths at half maximum (FWHM), average nearest neighbor numbers, nearest neighbor distributions, and the calculated neutron scattering static structural factors. The RDF functions were calculated according to Eq. 3 and averaged over 2001 structure snapshots at 10 fs increments at 300K, where
VN /ββρ = is the number density of species , and N is the total number of atoms.
rr
rrrnrg
∆
∆+=
β
βααβ ρπ 2
,
4
),()( [3]
The average nearest neighbor number )(Rnαβ (Eq. 4) can be obtained by integrating the
corresponding RDF curve up to the cutoff radius R, which is the position of the first minimum after the main RDF peak.
=R
drrrgRn0
2)(4)( αββαβ πρ [4]
The neutron scattering static structure factors (SN(q)) (Eq. 5) are obtained from the partial static structure factors (S (q)) (Eq. 6), which are calculated from RDF curves g (r) (Eq.
Temp
5000K
Time
Low- oxide Density Rescaling
(low normal )
High-T anneal
at low-
High-T anneal
at normal-
Cooling
to RT
Equilibration
at RT
Cooling
to 0K
Relaxation
Anneal below
melting T
Density Rescale
classical DFT
Classical MD DFT MD
Temp
5000K
Time
Low- oxide Density Rescaling
(low normal )
High-T anneal
at low-
High-T anneal
at normal-
Cooling
to RT
Equilibration
at RT
Cooling
to 0K
Relaxation
Anneal below
melting T
Density Rescale
classical DFT
Classical MD DFT MD
Figure 1. Hybrid Classical-DFT MD generation sequence of a-Al2O3
and a-ZrO2 samples.
ECS Transactions, 16 (10) 773-785 (2008)
775Downloaded 18 Oct 2008 to 137.110.32.23. Redistribution subject to ECS license or copyright; see http://www.ecsdl.org/terms_use.jsp
3), where b is the coherent neutron scattering length of species (bAl=0.3449x10⁻⁴ Å, bO=0.5805 x 10⁻⁴ Å) (13) and c ( )=N ( )/N is the concentration of ( ) species.
[ ]2
2/12/1 )()()(
)(
+−=
ααα
αββααβαββαβα δ
cb
ccqSccbb
qS N [5]
[ ]−+=R
drRr
Rr
qr
qrrgrccqS
0
22/1
/
)/sin()sin(1)()(4)(
πππρδ αββααβαβ [6]
Since the available experimental information on the a-Al2O3 and a-ZrO2 microstructures is limited, both experimental and selected simulation data (14-19) were used as reference properties. For a–Al2O3, the classically simulated and well-tested amorphous sample was used as the reference state for the classical MD stage (13), while for a-ZrO2, a DFT generated sample (15-17) was used as the reference state, resulting in the introduction of a small variation in the sample selection procedure.
Of the 24 classical a-Al2O3 samples, the most realistic sample, as quantified by radial-distribution function (RDF) main peak positions and full widths at half maximum (FWHM), average nearest neighbor numbers, nearest neighbor distributions, and the calculated neutron scattering static structural factor, was the sample that had been classically prepared by annealing at 5000K for 350 ps at low (~0.9 g/cm3) density,
instantaneously rescaled with the PBC box to the normal density of 3.20 g/cm3 (see comment below) and annealed for 400 ps, linearly cooled to RT for 100 ps and thermally equilibrated at RT for 100 ps (Fig.1). During Al2O3 high-T (5000K) annealing at low density, the final average atom displacement was 7.6 Å or ~70 % of the smallest PBC lattice vector (11.0 Å). During the subsequent normal density high-T Al2O3 annealing, the average atom displacement was 5.1 Å or ~65% of the smallest lattice vector (7.8 Å). The
Table I. RDF peak maxima and average nearest neighbor numbers for our classical MD a-Al2O3 sample vs. reference classical MD sample (13) and experimental data (14).
Our Sample Simulations (13) Experiment (14) RDF n RDF n RDF n
Al-O 1.77 4.23 1.76 4.25 1.8 4.1 O-O 2.82 10.66 2.75 9.47 2.8 8.5 Al-Al 3.07 6.98 3.12 8.26 3.2 6.0
ECS Transactions, 16 (10) 773-785 (2008)
776Downloaded 18 Oct 2008 to 137.110.32.23. Redistribution subject to ECS license or copyright; see http://www.ecsdl.org/terms_use.jsp
total velocity integration over time indicated an absence of oxide correlated macroscopic motion through PBC boundaries. The high values of average atomic displacement during high-T annealing phases are consistent with a high degree of melt intermixing. Note, these values may be a slight underestimate of the real atom displacements since some atoms pass the whole PBC box.
Amorphous Al2O3 can be stable over a wide range of densities. Experimental measurements report stable amorphous Al2O3 structures within a 3.05-3.40 g/cm3 density
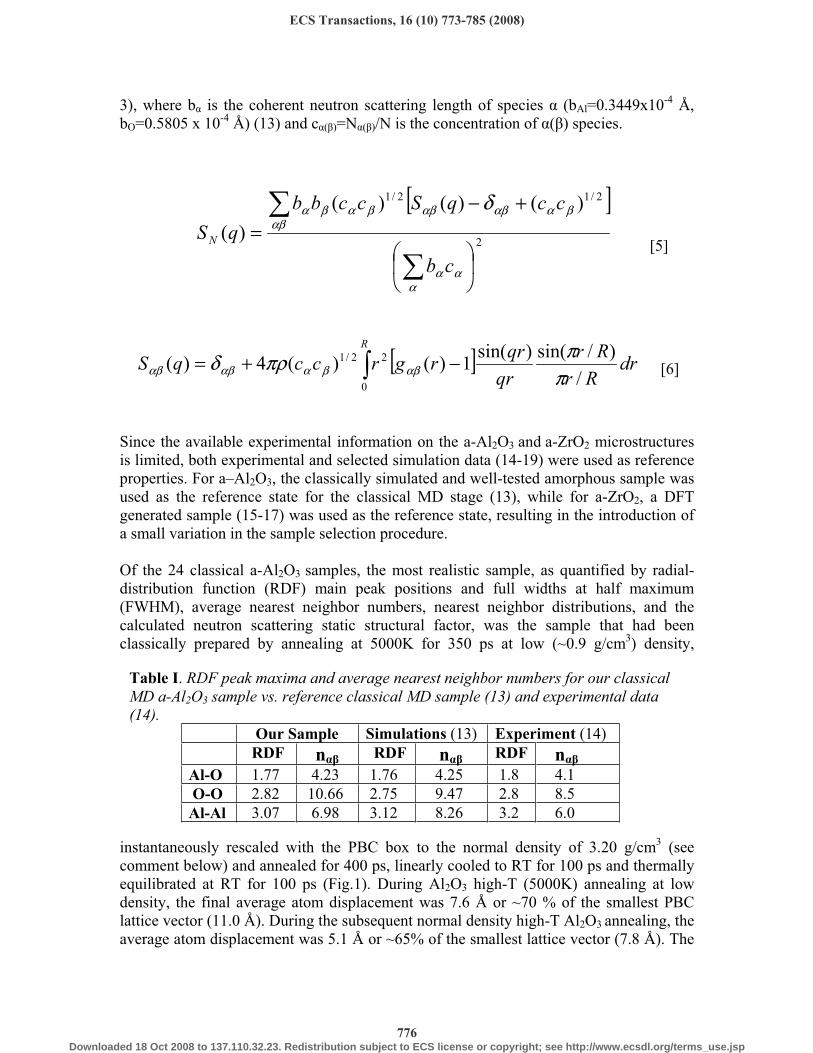
range (20, 21), while classical and DFT computer simulations demonstrate successful generation at 3.0-3.3 g/cm3 (13, 22, 23). The classical density of the a-Al2O3 sample in this study was chosen to be consistent with previous classical simulations of a-Al2O3 that correlated well with experimental properties (13, 14). The selected a-Al2O3 classical sample is in good agreement with MD simulated nearest neighbor distributions, RDF main peak positions (Fig. 2, Table I, II) and neutron scattering static structure factor
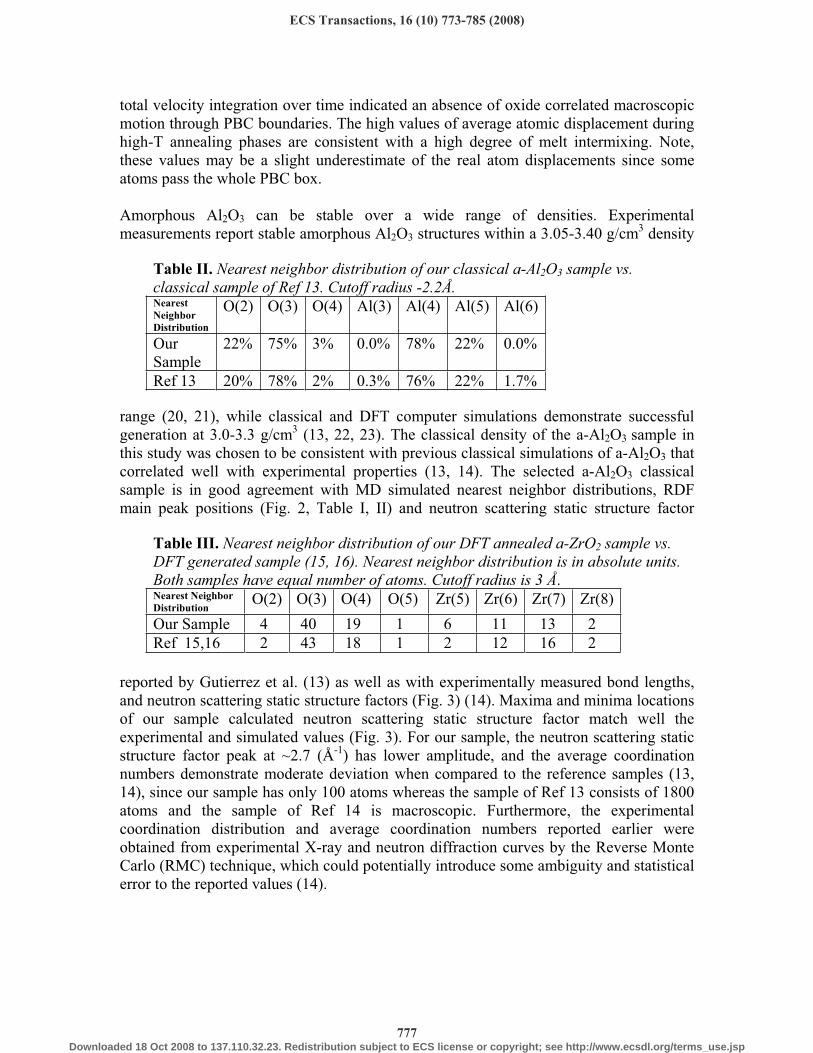
reported by Gutierrez et al. (13) as well as with experimentally measured bond lengths, and neutron scattering static structure factors (Fig. 3) (14). Maxima and minima locations of our sample calculated neutron scattering static structure factor match well the experimental and simulated values (Fig. 3). For our sample, the neutron scattering static structure factor peak at ~2.7 (Å-1) has lower amplitude, and the average coordination numbers demonstrate moderate deviation when compared to the reference samples (13, 14), since our sample has only 100 atoms whereas the sample of Ref 13 consists of 1800 atoms and the sample of Ref 14 is macroscopic. Furthermore, the experimental coordination distribution and average coordination numbers reported earlier were obtained from experimental X-ray and neutron diffraction curves by the Reverse Monte Carlo (RMC) technique, which could potentially introduce some ambiguity and statistical error to the reported values (14).
Table II. Nearest neighbor distribution of our classical a-Al2O3 sample vs. classical sample of Ref 13. Cutoff radius -2.2Å. Nearest
Neighbor
Distribution
O(2) O(3) O(4) Al(3) Al(4) Al(5) Al(6)
OurSample
22% 75% 3% 0.0% 78% 22% 0.0%
Ref 13 20% 78% 2% 0.3% 76% 22% 1.7%
Table III. Nearest neighbor distribution of our DFT annealed a-ZrO2 sample vs. DFT generated sample (15, 16). Nearest neighbor distribution is in absolute units. Both samples have equal number of atoms. Cutoff radius is 3 Å.Nearest Neighbor
DistributionO(2) O(3) O(4) O(5) Zr(5) Zr(6) Zr(7) Zr(8)
Our Sample 4 40 19 1 6 11 13 2 Ref 15,16 2 43 18 1 2 12 16 2
ECS Transactions, 16 (10) 773-785 (2008)
777Downloaded 18 Oct 2008 to 137.110.32.23. Redistribution subject to ECS license or copyright; see http://www.ecsdl.org/terms_use.jsp
6
a-Al2O3 Rescaling and DFT Annealing
To match the DFT amorphous density, the most realistic classical a-Al2O3 sample was homogenously rescaled from the classical (3.20 g/cm3) to the DFT density (3.26 g/cm3) resulting in a sample size of ~ 11.6 x 11.6 x 7.8 Å. The rescaled sample was then DFT annealed at 1500K for 1000 fs with 1.0 fs timesteps, cooled to 0K for 200 fs, and
Figure 2. RDF curves for the a-Al2O3 sample generated by classical MD.
P. Lamparter, et al,
Physica B 234(1997)
405.
G. Gutierrez, et al,
Phys Rev B, 65 (2002),
104202.
Our a-Al2O3 sample
and calculated curve.
P. Lamparter, et al,
Physica B 234(1997)
405.
G. Gutierrez, et al,
Phys Rev B, 65 (2002),
104202.
Our a-Al2O3 sample
and calculated curve.
Our a-Al2O3 sample
and calculated curve.
Our a-Al2O3 sample
and calculated curve.
Figure 3. Calculated neutron scattering static structure factor of our classical a-Al2O3 sample vs the reference classical MD and experimental data (13, 14).
ECS Transactions, 16 (10) 773-785 (2008)
778Downloaded 18 Oct 2008 to 137.110.32.23. Redistribution subject to ECS license or copyright; see http://www.ecsdl.org/terms_use.jsp

relaxed at fixed volume to a value below the specified 0.01 eV/Å force tolerance level (Figs. 1, 4). The stress tensor components of the DFT annealed amorphous sample were analyzed to verify the absence of any significant internal hydrostatic pressure. The goal of DFT annealing is to provide adjustment to the more accurate DFT force field without complete melting the initial rescaled classical sample used as a first approximation. Since the DFT annealing was performed at constant volume at the amorphous density (which is considerably lower than the crystalline density) and for a limited time (~1 ps), recrystallization processes were prevented as verified by the final RDF curves being consistent with an amorphous state. To determine the ratio of classical and DFT density, a separate classical a-Al2O3 sample was DFT annealed using the same procedure and then relaxed at variable volume. The electronic structure analysis of the DFT annealed and relaxed a-Al2O3 bulk sample indicates a bandgap of 3.80 eV that is free from any defect states, agreeing well with a previously reported DFT bandgap of 3.77 eV (22). Due to the wider coordination distribution in amorphous samples compared with crystalline ones, our amorphous sample bandgap is lower than the DFT-calculated crystalline Al2O3
bandgap (~6.0 eV) (22, 24).
Figure 4. The generation of a-Al2O3 sample. a) initial system at low density, b) low-density system after 5000K annealing just before rescaling, c) system just after rescaling to normal classical amorphous density, d) after annealing at 5000K, normal density, e) after cooling to RT, f) after equilibration at RT, g) after DFT annealing at 1500K, h) after DFT cooling
to 0K, i) after DFT relaxation. Stages a)-f) correspond to classical MD. Stages g)-i) correspond to DFT MD. Al-dark blue, O-red.
ECS Transactions, 16 (10) 773-785 (2008)
779Downloaded 18 Oct 2008 to 137.110.32.23. Redistribution subject to ECS license or copyright; see http://www.ecsdl.org/terms_use.jsp
a-ZrO2 Rescaling and DFT Annealing
The classical models of a-ZrO2 oxide were prepared in a batch of 24 different samples with a density of 4.71 g/cm3. This model follows the same general procedure used for the a-Al2O3 system but with different annealing/cooling times (Fig. 1). The classical amorphous density was calculated from the DFT amorphous density (see comment below) and classical-to-DFT density correction ratio. Since the amount of experimental microstructure data on a-ZrO2 is limited and often varies with the sample preparation technique, both published DFT simulations as well as experimental measurements as reference sample properties were employed (15-19, 25, 26). The most realistic classical a-ZrO2 sample was generated by annealing at 5000K at low density (~1.4 g/cm3) for 500 ps, instantaneously rescaling the PBC box to the normal classical density of 4.71 g/cm3,and then annealing for 500 ps, linearly cooling to RT for 100 ps and thermally equilibrating at RT for 100 ps. During ZrO2 high-T (5000K) annealing at low density, the final average atom displacement was 7.9 Å or ~53 % of the smallest PBC lattice vector. At the normal density high-T ZrO2 annealing, the average atom displacement was 5.46 Å or ~54% of the smallest lattice vector. The high values of average atomic displacement during high-T annealing phases are consistent with a high degree of the melt intermixing. Note, these values may be a slight underestimate of the real atom displacement since some atoms pass the whole PBC box.
ECS Transactions, 16 (10) 773-785 (2008)
780Downloaded 18 Oct 2008 to 137.110.32.23. Redistribution subject to ECS license or copyright; see http://www.ecsdl.org/terms_use.jsp
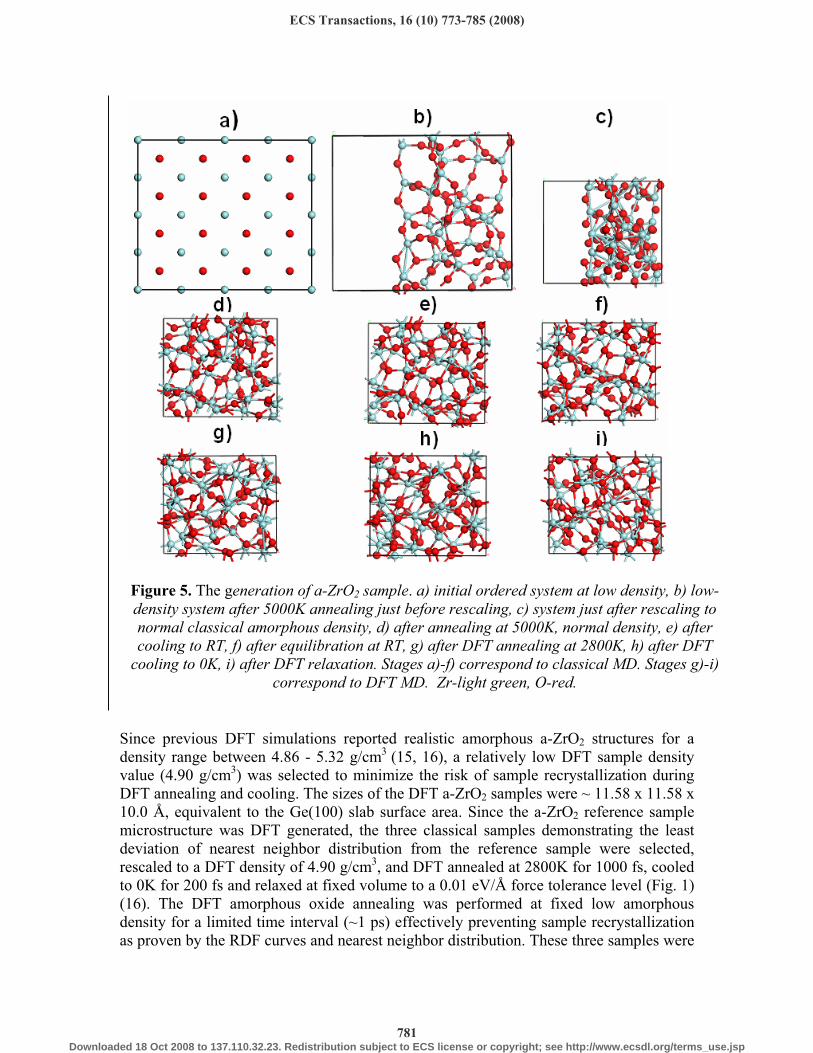
Since previous DFT simulations reported realistic amorphous a-ZrO2 structures for a density range between 4.86 - 5.32 g/cm3 (15, 16), a relatively low DFT sample density value (4.90 g/cm3) was selected to minimize the risk of sample recrystallization during DFT annealing and cooling. The sizes of the DFT a-ZrO2 samples were ~ 11.58 x 11.58 x 10.0 Å, equivalent to the Ge(100) slab surface area. Since the a-ZrO2 reference sample microstructure was DFT generated, the three classical samples demonstrating the least deviation of nearest neighbor distribution from the reference sample were selected, rescaled to a DFT density of 4.90 g/cm3, and DFT annealed at 2800K for 1000 fs, cooled to 0K for 200 fs and relaxed at fixed volume to a 0.01 eV/Å force tolerance level (Fig. 1) (16). The DFT amorphous oxide annealing was performed at fixed low amorphous density for a limited time interval (~1 ps) effectively preventing sample recrystallization as proven by the RDF curves and nearest neighbor distribution. These three samples were
Figure 5. The generation of a-ZrO2 sample. a) initial ordered system at low density, b) low-density system after 5000K annealing just before rescaling, c) system just after rescaling to normal classical amorphous density, d) after annealing at 5000K, normal density, e) after cooling to RT, f) after equilibration at RT, g) after DFT annealing at 2800K, h) after DFT
cooling to 0K, i) after DFT relaxation. Stages a)-f) correspond to classical MD. Stages g)-i) correspond to DFT MD. Zr-light green, O-red.
ECS Transactions, 16 (10) 773-785 (2008)
781Downloaded 18 Oct 2008 to 137.110.32.23. Redistribution subject to ECS license or copyright; see http://www.ecsdl.org/terms_use.jsp
analyzed to determine their final nearest neighbor distributions; the closest match to the reference sample was selected and thoroughly tested (Fig. 5, Table III). In addition to the good agreement between the nearest neighbor distributions of the selected sample and the reference one (16) (Table III), the selected sample also has a good correlation of its RDFs with those of the reference sample. The Zr-O RDF main peak is located at 2.1 Å with a Zr-O length distribution primarily in the 2.0-2.3 Å interval versus previously reported intervals of 2.04-2.25 Å (15-17). The Zr-Zr and O-O RDF main peaks are located at 3.5 Å and 2.8 Å respectively. The stress tensor components of the selected DFT annealed a-ZrO2 amorphous sample were analyzed to verify the absence of significant internal hydrostatic pressure.
The DOS and bandgap analysis is an important test since it can screen out defective samples with states in the bandgap. The selected a-ZrO2 sample has a clear bandgap of ~2.7 eV free from defect states in comparison with previously reported amorphous ~3.2 eV (DFT, =5.32 g/cm3), ~3.4 eV (DFT, =4.86 g/cm3) and experimental 4.7 eV (16-19) values. This discrepancy with experiment is mainly due to the standard DFT band gap underestimation caused by an inadequate description of the DFT exchange interaction. The DFT sample in ref 17 with the ~3.2 eV bandgap was prepared at a different density (5.32 g/cm3 vs our 4.90 g/cm3), using a different generation technique (ART vs our DFT MD), and with a different code (LCAO code (SIESTA) vs a plane-wave code (VASP)). The DFT sample in Ref 16 with a bandgap of ~3.4 eV was generated by DFT MD at a timescale that was ~55 times shorter than our combined Classical-DFT timescale of 1201 ps and had a cooling rate ~10 times steeper than in our runs. The significantly longer timescale and lower cooling rate used in our runs lead to better intermixing and more extensive amorphization. Since passage from the crystalline to amorphous phase typically decreases the bandgap, the smaller value of our sample bandgap can be attributed to the much longer run timescale and lower cooling rate (22).
The described a-Al2O3 and a-ZrO2 samples were prepared to match Ge(100)(2x1) supercell surface pattern to satisfy periodic boundary conditions, but similar slab could be prepared to match Si, GaAs(100), InP, or InAs. The described method is flexible and robust enough to generate realistic amorphous systems of strictly predetermined planar sizes in ground-state. The correct choice of final amorphous density and classical-to-DFT density rescaling ratio are important keys for that.
ECS Transactions, 16 (10) 773-785 (2008)
782Downloaded 18 Oct 2008 to 137.110.32.23. Redistribution subject to ECS license or copyright; see http://www.ecsdl.org/terms_use.jsp
Comparative Analysis of Alternative Amorphous Sample Generation Sequences.
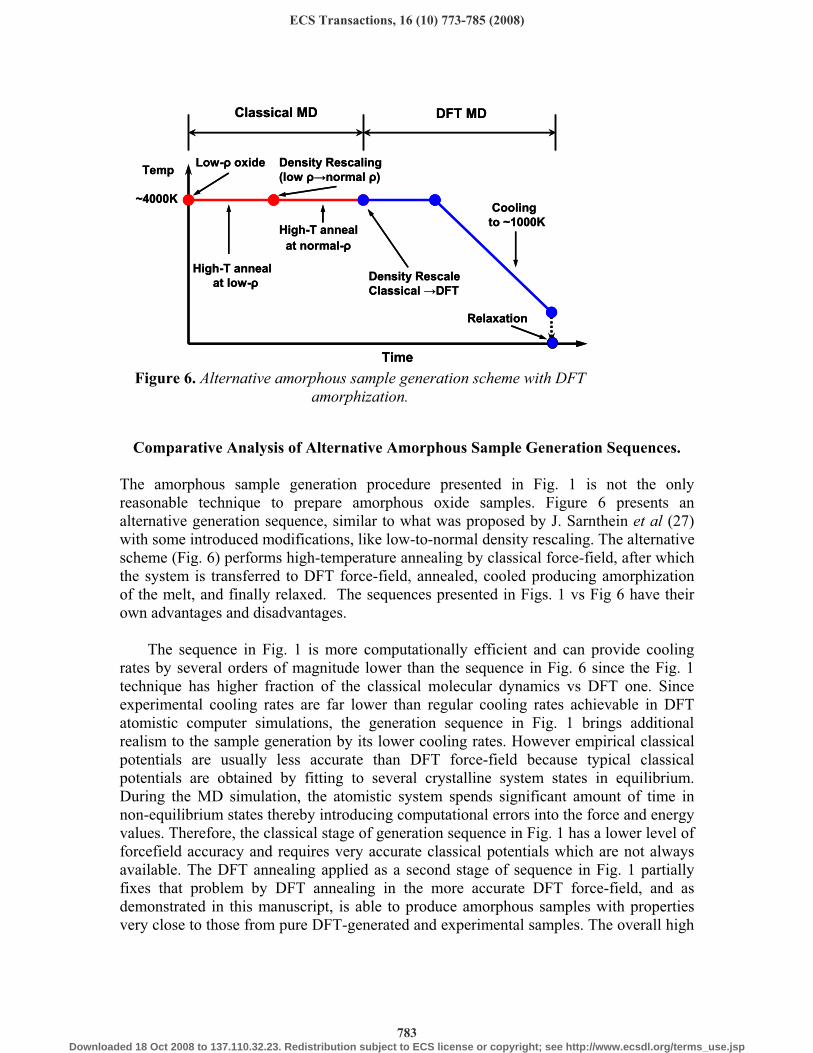
The amorphous sample generation procedure presented in Fig. 1 is not the only reasonable technique to prepare amorphous oxide samples. Figure 6 presents an alternative generation sequence, similar to what was proposed by J. Sarnthein et al (27) with some introduced modifications, like low-to-normal density rescaling. The alternative scheme (Fig. 6) performs high-temperature annealing by classical force-field, after which the system is transferred to DFT force-field, annealed, cooled producing amorphization of the melt, and finally relaxed. The sequences presented in Figs. 1 vs Fig 6 have their own advantages and disadvantages.
The sequence in Fig. 1 is more computationally efficient and can provide cooling rates by several orders of magnitude lower than the sequence in Fig. 6 since the Fig. 1 technique has higher fraction of the classical molecular dynamics vs DFT one. Since experimental cooling rates are far lower than regular cooling rates achievable in DFT atomistic computer simulations, the generation sequence in Fig. 1 brings additional realism to the sample generation by its lower cooling rates. However empirical classical potentials are usually less accurate than DFT force-field because typical classical potentials are obtained by fitting to several crystalline system states in equilibrium. During the MD simulation, the atomistic system spends significant amount of time in non-equilibrium states thereby introducing computational errors into the force and energy values. Therefore, the classical stage of generation sequence in Fig. 1 has a lower level of forcefield accuracy and requires very accurate classical potentials which are not always available. The DFT annealing applied as a second stage of sequence in Fig. 1 partially fixes that problem by DFT annealing in the more accurate DFT force-field, and as demonstrated in this manuscript, is able to produce amorphous samples with properties very close to those from pure DFT-generated and experimental samples. The overall high
Time
Low- oxide Density Rescaling
(low normal )
High-T anneal
at low-
High-T anneal
at normal-
Cooling
to ~1000K
Density Rescale
Classical DFT
Classical MD DFT MD
Relaxation
Temp
~4000K
Time
Low- oxide Density Rescaling
(low normal )
High-T anneal
at low-
High-T anneal
at normal-
Cooling
to ~1000K
Density Rescale
Classical DFT
Classical MD DFT MD
Relaxation
Temp
~4000K
Figure 6. Alternative amorphous sample generation scheme with DFT amorphization.
ECS Transactions, 16 (10) 773-785 (2008)
783Downloaded 18 Oct 2008 to 137.110.32.23. Redistribution subject to ECS license or copyright; see http://www.ecsdl.org/terms_use.jsp
computational efficiency of the sequence in Fig. 1 allows performing multiple runs within reasonable amount of time to get large number of samples for further selection.
The generation sequence presented in Fig. 6 has its own set of advantages and disadvantages. For this type of sequence, the amorphization is controlled by the more accurate DFT force-field. However, the high-computational cost of DFT runs requires the use of a high cooling rate, which might have a negative effect on the sample realism. Since high-temperature annealing, cooling and final relaxation are performed by DFT force-field, this generation sequence does not require as accurate classical potentials as the method employed in Fig 1. As an example, Broqvist et al. successfully employed scheme similar to sequence in Fig. 6 to generate a-HfO2 samples using a classical potential for ZrO2 (28). Among disadvantages of the scheme in Fig. 6 is a high computational cost, which limits achievable simulation timescale as well as the number of prepared samples; having few prepared sample restricts subsequent selection of the most realistic one.
The two amorphous sample generation sequences presented in Figs. 1, 6 do not embrace all possible amorphous sample generation solutions and have potential for various modifications depending on particular simulation goals. For modern computational facilities, there is no universal scheme of amorphous sample generation and there is no universal recipe for their choosing. In each particular case, the design of amorphous sample generation procedure is dictated by particular system properties, required accuracy and affordable computational efficiency.
Acknowledgements.
We would like to thank Ngoc Tran for useful discussions, Intel and MARCO for provided support.
References
1. G. Nicholas, T.J. Grasby, DJEF Lgoni, C.S. Beer, J. Parsons, M Meuris, M.M. Heyns, IEEE ELECTRON DEVICE LETTERS 28, 825 (2007). 2. S. Takagi S, T. Tezuka, T. Irisawa, S. Nakaharai, T. Numata, K. Usuda, N. Sugiyama, M. Shichijo, R. Nakane, S. Sugahara, SOLID-STATE ELECTRONICS 51, 526 (2007). 3. K. Saraswat K, CO Chui, T. Krishnamohan, D. Kim, A. Nayfeh, A. Pethe, MATERIALS SCIENCE AND ENGINEERING B-SOLID STATE MATERIALS FOR ADVANCED TECHNOLOGY 135, 242 (2006) 4. S. J. Plimpton, J. Comput. Phys. 117, 1 (1995); http://lammps.sandia.gov/index.html 5. M. Matsui, Miner. Mag. 58A, 571 (1994).6. P. Schelling, S. Phillpot, and D. Wolf, J. Am. Ceram. Soc., 84, 1609 (2001). 7. G. Kresse and J. Furthmüller.Comput. Mat. Sci., 6, 15 (1996).8. G. Kresse and J. Furthmüller. Phys. Rev. B, 54, 11169 (1996). 9. P.E. Blöchl, Phys. Rev. B 50, 17953 (1994).10. G. Kresse, and J. Joubert, Phys. Rev. B 59, 1758 (1999).
ECS Transactions, 16 (10) 773-785 (2008)
784Downloaded 18 Oct 2008 to 137.110.32.23. Redistribution subject to ECS license or copyright; see http://www.ecsdl.org/terms_use.jsp

11. J. P. Perdew, K. Burke, and M. Ernzerhof. Phys. Rev. Lett., 77, 3865 (1996). 12. J. P. Perdew, K. Burke, and M. Ernzerhof. Phys. Rev. Lett., 78, 1396 (1997). 13. G. Gutierrez, B. Johansson, Phys Rev B, 65, 104202 (2002). 14. P. Lamparter, R. Kniep, Physica B 234, 405 (1997).15. X. Zhao, D. Ceresoli, D. Vanderbilt, Phys Rev B 71, 085107 (2005). 16. D. Vanderbilt, X. Zhao, D. Ceresoli, Thin Solid Films 486, 125 (2005).17. D. Ceresoli and D. Vanderbilt, Phys Rev B 74, 125108 (2006).18. V. Gritsenko, D. Gritsenko, S. Shaimeev, V. Aliev, K. Nasyrov, S. Erenburg, V. Tapilin, H. Wong, M.C. Poon, J.H. Lee, J.W. Lee, C.W. Kim, Microelectr. Engin. 81
524 (2005).19. A.V. Shaposhnikov, D.V. Gritsenko, I.P. Petrenko, O.P. Pchelyakov, V.A. Gritsenko, S.B. Erenburg, N.V. Bausk, A.M. Badalyan, Yu. V. Shubin, T.P. Smirnova, H. Wong, and C.W. Kim. J. of Exp. and Theor. Phys. 102, 799 (2006). 20. S.-M Lee, D.G. Cahili, and T.H. Allen, Phys. Rev. B 52, 253 (1995). 21. Y. Oka, T. Takahashi, K. Okada, and S. Iwai, J. Non-Cryst. Solids 30, 349 (1979). 22. H. Momida, T. Hamada, and Y. Takagi, Phys Rev B 73, 054108 (2006). 23. S.P. Adiga, P. Zapol, and L.A. Curtiss, Phys Rev B 74, 064204 (2006). 24. A. Demkov, L. R. C. Fonseca, E. Verret, J. Tomfohr, and O. F. Sankey, Phys Rev B
71, 195306 (2005).25. L. Koltunsli, and R.A.B. Devine, Appl Phys. Lett 79, 320 (2001). 26. J. Zhu and Z.G. Liu, Appl. Phys. A: Mater. Sci. Process. 78, 741 (2004).27. J. Sarnthein, A. Pasquarello, and R. Car, Phys Rev Lett., 74, 4682 (1995). 28. P. Broqvist and A. Pasquarello, Microelectr. Engin. 84, 2022 (2007).
ECS Transactions, 16 (10) 773-785 (2008)
785Downloaded 18 Oct 2008 to 137.110.32.23. Redistribution subject to ECS license or copyright; see http://www.ecsdl.org/terms_use.jsp