Embed Size (px)
Citation preview
Linköping University | Department of Management and Engineering
Master’s thesis, 30 credits| Master’s programme
Spring/ autumn 2021| ISRN- LIU-IEI-TEK-A--21/04234—SE
Generating Product-Service Design Improvements from a Climate Impact and Energy Use Perspective Using Life Cycle Assessment The Case of Vertical Access Equipment
Max Bäck
Vishnu Teja Tirumalasetty
Examiner: Tomohiko Sakao
Supervisor: Annelie Carlsson
Supervisor: Abhijna Neramballi
Linköping University
SE-581 83 Linköping, Sweden
+46 013 28 10 00, www.liu.se

I | P a g e
Glossary Life Cycle Assessment (LCA): “LCA is a technique compiling an inventory of relevant inputs and
outputs of a product system; evaluating the potential environmental impacts associated with
those inputs and outputs; and interpreting the results of the inventory and impact phases in
relation to the objective of the study” (ISO 14040, 2006).
Circular Economy (CE): Is an economic or industrial system which is restorative by its design
(EMF, 2010). Circular economy aims to change the common end-of-life concept with a shift
towards renewable energy, elimination of toxic substances which might impair reuse (EMF,
2010). Furthermore, circular economy intends to eliminate waste through superior design of
materials, business models, and products (EMF, 2010).
Building Maintenance Unit (BMU): is a mechanical device commonly found on the roof of a
building with a maneuverable cradle suspended with cables from the main body. The main
purpose of a BMU is to systematically move the cradle over a building’s façade carrying workers
and tools to inspect maintain and clean said façade.
Product Service System (PSS): is defined by Mont (2002) as “a marketable set of products and
services capable of jointly fulfilling a user's need. The product/service ratio in this set can vary,
either in terms of function fulfilment or economic value”. As such PSS can be categorized into
three overarching types, product-oriented which maintains focus on the product and is similar to
a traditional sale, use-oriented which focuses on the availability of the product for use by the
customer, and result-oriented which focuses on the end result and the provider retains
ownership of the offering and operates it throughout its use phase (Tukker, 2004; Meier, et al.,
2010). The more servitized and results oriented a PSS becomes, it is also more likely to be
accompanied with circular economy benefits (Matschewsky, 2019a).
Vertical Access Equipment (VAE): is highly engineered and complex machinery that move
technicians, equipment, and other site-specific materials to a desired height.

II | P a g e
Abbreviations BMU: Building Maintenance Unit
CBA: Cost Benefit Analysis
CE: Circular Economy
EIA: Environmental Impact Assessment
ELCC: Environmental Life Cycle Costs
EU: European Union
ISO: International Organization of Standardization
MCDA: Multi Criteria Decision Analysis
MFA and SFA: Material Flow Analysis and Substance Flow Analysis
LCA: Life Cycle Assessment
LCC: Life Cycle Costs
PSS: Product Service System
SIA: Strategic Impact Assessment
VAE: Vertical Access Equipment

III | P a g e
Abstract Climate change is connected to several negative effects on local environments around the globe
such as, longer, and more intense droughts, less freshwater supplies, ocean warming, sea level
rise, polar ice melting, more intense storms, and rainfall (NASA, 2021). These problems are
mainly due to the increasing amount of carbon dioxide in the atmosphere as well as other
greenhouse gases (GHG) which cause a similar or stronger climate change effect (WWF, 2021).
Practically all climate researchers agree that climate change is caused by human activities (WWF,
2021), as such human activities will have to change to reduce their climate impact. One possible
approach to achieve sustainable products is the concept of a circular economy (CE). The
proponents of a circular economy describe it as an economic or industrial system which is
restorative by its design (EMF, 2010). Currently there is a substantial body of knowledge on how
LCA can be used to guide product design in a sustainable direction. However, as of yet there are
limited academic research focused on how environmental assessment can impact the design of
Vertical Access Equipment (VAE) and of similar products. This thesis aims to support the VAE
sector’s transition towards a CE.
The objective of this study was to understand and provide improvement suggestions for the
environmental performance and energy use of VAE. This Involved a case study where a LCA was
conducted to establish a baseline of four VAE products, a construction hoist, a service lift, an
industrial elevator, and a BMU. The results of the initial LCA varied greatly depending on the
different products and their use case. Guided by the LCA results, semi-structured workshops
were held to find feasible improvement suggestions whose impacts were investigated using LCA
once more. Feasible and substantial improvements focusing on the products high impact areas
were found for all products. For the construction hoist improvements regarding eliminating
waste in the lifting work was most impactful, whilst the service lift required optimizing of
maintenance and use of sensors to reduce the maintenance time. For the industrial elevator and
the BMU, measures which focused on reducing virgin material extraction showed most promise,
such as lifespan extension, remanufacturing, and use of recycled materials.

IV | P a g e
Acknowledgements The authors of this thesis would like to express their sincerest gratitude to the people who have
made this thesis possible with their invaluable feedback and supervision.
Thank you, Professor Tomohiko Sakao and our two supervisors Annelie Carlson and Abhijna
Neramballi. Without your assistance this thesis would not have happened, and your guidance
was crucial in shaping our work.
We also want to thank our opponents Ambra Giulianelli and Mukessh Vasudevan Sulochana for
their constructive feedback of our work, their input has been valuable.
Furthermore, we extend our gratitude to the case company representatives and engineers
which provided invaluable inputs regarding data collection, technical insights, and industry
knowledge. This thesis would not have been possible without you.
Linköping, October 2021
Max Bäck and Vishnu Teja Tirumalasetty

V | P a g e
Table of Contents Glossary ............................................................................................................................................ I
Abbreviations .................................................................................................................................. II
Abstract .......................................................................................................................................... III
Acknowledgements ........................................................................................................................ IV
Table of Contents ............................................................................................................................ V
List of figures ................................................................................................................................ VIII
List of Tables ................................................................................................................................ VIII
1. Introduction ............................................................................................................................. 1
1.1. Background ........................................................................................................................... 1
1.2. Objective .............................................................................................................................. 2
1.3. Research Questions .............................................................................................................. 2
1.4. Limitations and Scope .......................................................................................................... 3
1.5. Report Overview .................................................................................................................. 4
2. Theoretical Framework ............................................................................................................... 5
2.1. Environmental Assessment Tools ........................................................................................ 5
2.1.1. Procedural ..................................................................................................................... 5
2.1.2. Analytical ....................................................................................................................... 7
2.1.3. Selection Criteria for the Most Suitable Tool .............................................................. 10
2.2. Description of the Suitable Tool: Life Cycle Assessment ................................................... 12
2.2.1. LCA background ........................................................................................................... 12
2.2.2. LCA Goal and Scope ..................................................................................................... 14
2.2.3. Inventory Analysis........................................................................................................ 15
2.2.4. Life Cycle Impact Assessment ...................................................................................... 16
2.2.5. Interpretation .............................................................................................................. 16
2.2.6. Advantages and Disadvantages of LCA ........................................................................ 18
2.3. Environmentally Sustainable Life Cycle Design .................................................................. 19
2.3.1. PSS (Product service systems) ..................................................................................... 19
2.3.2. Applications and Barriers to Product Service Design/PSS ........................................... 21
3. Research Methodology ............................................................................................................. 23
3.1. Research Methods.............................................................................................................. 23
VI | P a g e
3.1.1. Literature Review ........................................................................................................ 23
3.1.2. Case Study ................................................................................................................... 23
3.2. Data Collection and Processing Methods .......................................................................... 24
3.2.1. LCA ............................................................................................................................... 24
3.2.2. Data Acquisition Interviews ......................................................................................... 24
3.2.3. Semi Structured Workshops ........................................................................................ 25
3.3. Research Quality Appraisal ................................................................................................ 26
3.3.1. Internal Validity ........................................................................................................... 26
3.3.2. External Validity ........................................................................................................... 26
3.4. Research Process ................................................................................................................ 26
3.4.1. Phase 1 – Life Cycle Assessment ................................................................................. 26
3.4.2. Phase 2 – Finding and Evaluating Improvement Suggestions ..................................... 29
4. Case Study - Results and Analysis ............................................................................................. 30
4.1. Phase 1: LCA ....................................................................................................................... 30
4.1.1. Raw Material Extraction .............................................................................................. 31
4.1.2. Transport ..................................................................................................................... 32
4.1.3. Manufacturing ............................................................................................................. 32
4.1.4. Installation ................................................................................................................... 32
4.1.5. Use Phase..................................................................................................................... 32
4.1.6. Maintenance ................................................................................................................ 33
4.1.7. End of Life .................................................................................................................... 33
4.2. Phase 1: LCA Results ........................................................................................................... 33
4.2.1. Construction Hoist ....................................................................................................... 34
4.2.2. Industrial elevator ....................................................................................................... 37
4.2.3. BMU ............................................................................................................................. 39
4.2.4. Wind Tower Service Lift ............................................................................................... 42
4.3. Phase 2: Finding and Evaluating Improvement Suggestions ............................................. 44
4.3.1. Construction Hoist and Industrial Elevator- Life Cycle Improvement Suggestions ..... 45
4.3.2. BMU - Life Cycle Improvement Suggestions ............................................................... 48
4.3.3. Wind Tower Service Lift - Life Cycle Improvement Suggestions ................................. 50
5. Discussions and Conclusion ...................................................................................................... 52

VII | P a g e
5.1. Answers to the research questions .................................................................................... 52
5.2. Discussion ........................................................................................................................... 53
5.2.1. Life Cycle Assessment .................................................................................................. 53
5.2.2. Life Cycle and PSS Design ............................................................................................ 54
5.3. Concluding Remarks ........................................................................................................... 56
6. Bibliography .............................................................................................................................. 57
7. Appendices ................................................................................................................................ 68
7.1. Appendix A – Strengths and Weaknesses of considered assessment tools ...................... 68
7.2. Appendix B – Summery of Semi Structured Workshops .................................................... 69
7.3. Appendix C – Functional Unit Results ................................................................................ 73

VIII | P a g e
List of figures Figure 1: Categorization of Environmental Tools, adapted from (Andersson, et al., 2016) ........................................... 5 Figure 2: Life Cycle costing model with types of cost and scope of assessment, as adapted from (Roh, et al., 2018) .. 9 Figure 3: Evaluation of assessment tools based the different elements, adapted from (Ness, et al., 2007) ............... 11 Figure 4: Life cycle stages of a product in an LCA, adapted from (SAIC, 2006) ............................................................ 13 Figure 5: Life cycle Assessment framework, adapted from (Muralikrishna & Manickam, 2017) ................................ 14 Figure 6: Construction hoist, total kg CO2-eqv, 25 years, USA. .................................................................................... 34 Figure 7: Construction hoist, total kWh, 25 years, USA. .............................................................................................. 36 Figure 8: Industrial elevator, total kg CO2-eqv, 25 years, USA. .................................................................................... 37 Figure 9: Industrial elevator, Total kWh, 25 years, Sweden ........................................................................................ 38 Figure 10: BMU, total kg CO2-eqv, 25 years, Hong Kong. ........................................................................................... 39 Figure 11: BMU, total kWh, 25-year, Hong Kong. ....................................................................................................... 41 Figure 12: Wind Turbine Service lift, total kg CO2-eqv, 20 years, Spain. ...................................................................... 42 Figure 13: Wind turbine Service lift, Total kWh, 20 years, Spain. ................................................................................ 43
List of Tables Table 1: Scoring matrix for assessment tools .............................................................................................................. 11 Table 2: Meetings attendees from both the company and the university, as well as the duration of each meeting. . 25 Table 3: Workshop attendees from both the company and the university, as well as the duration of each workshop.
..................................................................................................................................................................................... 25 Table 4: Shows a summarized view of the improvement suggestions found feasible for the Construction hoist in the
phase two construction and industrial workshop, and their potential effects on the product's total kg CO2-eqv and
total energy use. .......................................................................................................................................................... 45 Table 5: Shows a summarized view of the improvement suggestions found feasible for the industrial elevator in the
phase two construction and industrial workshop, and their potential effects on the product's total kg CO2-eqv and
total energy use. .......................................................................................................................................................... 46 Table 6: Shows a summarized view of the improvement suggestions found feasible in the phase two BMU
workshop, and their potential effects on the product's total kg CO2-eqv and total energy use. ................................. 48 Table 7: Shows a summarized view of the improvement suggestions found feasible in the phase two wind tower
service lift workshop, and their potential effects on the product's total kg CO2-eqv and total energy use. ................ 50 Table 8: Displays the results per Functional unit of the different products in g CO2-eqv. ............................................ 73 Table 9: Displays the results per functional unit of the different products in Wh ....................................................... 74

1 | P a g e
1. Introduction
1.1. Background Climate change is connected to several negative effects on local environments around the globe,
such as longer and more intense droughts, less freshwater supplies, ocean warming, sea level
rise, polar ice melting, more intense storms, and rainfall (NASA, 2021). These problems are
mainly due to the increasing amount of carbon dioxide in the atmosphere as well as other gases
which cause a similar or stronger climate change effect (WWF, 2021). Practically all climate
researchers agree that climate change is caused by human activities (WWF, 2021).
Current pledges from policy makers around the globe are insufficient to reach net zero carbon
related emissions by 2050, even if they are fully reached (IEA, 2021a). Thus, more efforts are
needed to reduce the human impact on the planet. However, in the European union (EU) the
effects of global climate change are of concern both in the public and political spheres, and the
urge to act has taken hold in the EU nations (EU, 2018). EU national parliaments recognize the
impact of climate change and are looking to create policies to facilitate climate neutral services
and products (EU, 2021). The European union has set a goal of net zero total of greenhouse gas
emissions by the year 2050 (EU, 2021), and this requires the contribution of all sectors in society
to help commit to this cause. These efforts by the EU are made to limit the negative effects of
climate change by staying within the safe operating space of the earth. The safe operating space
can also be referred to as a planetary boundary. There are nine planetary boundaries proposed
by Steffen et al (2015) and these are determined by how much the earths systems can deal with
naturally without reaching major change or tipping point. Companies are more frequently
mentioning the planetary boundaries in their sustainability reports, which indicates a change of
focus away from incremental improvements to true sustainability within the planetary boundary
(Ryberg, et al., 2018).
According to Kara Kosta (2016) the industrial sector in the EU is responsible for approximately
50% of the total contribution of the EU greenhouse gas emission. Due to the EU 2050 carbon
neutrality targets (EU, 2021), established companies from the industrial sector will have to
reform their business activities to be more compliant towards the goal of achieving net zero
emissions 2050 (Commission, 2021). Businesses should understand that to achieve such a target
they must carefully assess the total impact of their products. This assessment must be holistic
and encompass the entire lifecycle of a product.
One possible approach to achieve sustainable products is the concept of a circular economy (CE).
The proponents of a circular economy describe it as an economic or industrial system which is
restorative by its design (EMF, 2010). Circular economy aims to change the common end-of-life
concept with a shift towards renewable energy, elimination of toxic substances which might
impair reuse (EMF, 2010). Furthermore, circular economy intends to eliminate waste through
superior design of materials, business models, and products (EMF, 2010). The concept of circular
economy can of course be implemented in a variety of ways to impact products. Some examples

2 | P a g e
could be, making tech gadgets easier to repair, making high end durable machinery available to
more people via leasing contracts, smart material selection and product design to name a few
(EMF, 2010).
In the context of circular economy product service systems (PSS) are considered crucial to
implement circular decisions making strategies on a companywide level (Witjes & Lozano, 2016;
Murray, et al., 2017). A PSS is a concept which aims to achieve environmental sustainability via
an integration of products and services in a common scope for planning, development, and
delivery, where the producer takes ownership from creation to end of life (Müller, et al., 2009).
The contribution of PSS in a circularity context strongly stems from the producer’s ownership and
responsibility of the product/service throughout its entire lifespan and the changes this brings to
the business incentives (Reim, et al., 2015; Tukker, 2004).
Currently there is a substantial body of knowledge on how environmental assessment can be
used to guide product design in a sustainable direction. However, as of yet there are limited
academic research focused on how environmental assessment can impact the design of Vertical
Access Equipment (VAE) and of similar products. This thesis aims to support the VAE sector’s
transition towards a CE.
1.2. Objective
The objective of this study is to understand and provide improvement suggestions for the
environmental performance and energy consumption patterns of VAE. This will involve assessing
the environmental impact of products over their complete life cycle. The objective will be
reached by investigating four VAE products and improvement suggestions will be constructed
based on the results.
The main target group of this thesis is the general scientific/academic community as well as
representatives in the VAE industry. This thesis will mainly contribute to verify how
environmental assessment can be used to influence product design, what limitations there are
to the method and how the results can lead to concrete product and service design improvement
suggestions of VAE.
1.3. Research Questions Research Question 1: What influences the climate impact and energy use of products in the
vertical access equipment sector?
Research Question 2: How can product service design be used to address the effect on global
warming impact and energy use of products in the vertical access equipment sector?

3 | P a g e
1.4. Limitations and Scope The aim has been to gather as much site-specific data as possible, however, much of the data
which is required to perform a comprehensive environmental assessment was not readily
available. Therefore, the environmental assessment relied to some extent on averages and
estimates to produce a feasible environmental profile of the four products. This applies to data
collected regarding all phases of the product’s life cycle, raw material composition, transport
routes, manufacturing, use phase, maintenance, and end of life.
There were also limits to the extent the periphery was investigated since the focus was on the
products themselves and not beyond them. This means that some of the products' supportive
structures or changes that need to be made in a structure or building to accommodate the
product have not been taken into consideration. For example, fixtures in a wind tower to
accommodate a service lift, or additional concrete and metal fixtures on a skyscraper to
accommodate a BMU.
The main factor which influenced the accuracy when finding and estimating improvement
suggestions is how accurate an image the environmental assessment provided, and the extent of
which feasibility was investigated. Only technical feasibility was ascertained whilst economic
feasibility and the like was left to future studies or the case company.

4 | P a g e
1.5. Report Overview The report starts with an introduction which contains a background to the subject. Here reasons
for which the study has been conducted and the problems the study aims to solve are made
clear. Aspects regarding climate and products are shortly described. The purpose as well as the
research questions are also be presented which forms the basis of the report.
In the following section, theoretical framework, relevant background knowledge and theory
which a reader could need to fully grasp the report is presented. Relevant theory on different
types of assessment tools, such as life cycle design, product as a service, remanufacturing,
material selection and predictive maintenance are presented.
In the third chapter, research methodology, the aim was to describe which methods were used
and how they were used to answer the research questions. This includes how data collection
and data processing were managed, the general research process, interviews, workshops and
more.
In the fourth section how the case study was conducted is presented. This includes the life cycle
assessment, the workshop outcomes, and finally an estimation of the improvement suggestions
impact on the life cycle.
Lastly, the conclusions are used as a base to discuss the report’s results and objective in the
context of earlier works in the field. Topics include the influence of LCA on thesis, which product
service designs improvements were deemed feasible by the company, and how the study could
be improved along with recommendations for future studies.

5 | P a g e
2. Theoretical Framework
2.1. Environmental Assessment Tools It is important to understand which tools can satisfy the goal and scope of the study. Several
established and recognized tools already exist, such as Life cycle assessment (LCA), Life cycle
costing (LCC), Environmental impact assessment (EIA), and Material flow analysis (MFA). The
objective here is to understand how these tools can contribute to achieving the goal of this study.
First the tools are segregated into two categories, Procedural and Analytical, inspired by
(Andersson, et al., 2016) and can be seen in Figure 1. Tools were then analyzed and ranked based
on how well they fulfill the objective of this study.
Figure 1: Categorization of Environmental Tools, adapted from (Andersson, et al., 2016)
2.1.1. Procedural
Tools under this type of categorization define the procedure involved when performing an
assessment, rather than just being a regular description of quantitative or qualitative steps
involved in the assessment (Andersson, et al., 2016). Under this category the system tools are
meant to provide a sense of guidance to carefully assess a defined procedural work (Ness, et al.,
2007). The tools often focus on addressing the economic, social, and environmental aspects.
They are usually implemented under the conditions where there is a requirement of change in
policy or implementation of a project (Ness, et al., 2007). It is also important to involve various
stake holders in decision making and to guide improvement suggestions (Andersson, et al.,
2016).

6 | P a g e
Environmental Impact Assessment (EIA)
EIA is a procedure where the potential environmental impacts, health issues, and social issues
are identified and used to determine the development of the product or a project. This procedure
can assess the consequences of development and enables accountable decision making where
the negative impacts on the environment can be reduced significantly. EIA can analyze the
impacts in different life cycle stages of a product or projects and different socio-economic
aspects. The result of EIA can be used to understand effects on the environment such as global
warming impact, ozone depletion, acidification, eutrophication and more. However, EIA is closer
to a procedure than a tool, where LCA can be an integral part of the procedure (Tukker, 2000).
LCA can provide further amplification to a regular framework of environmental evaluation
(Tukker, 2000). EIA is often applied at the project level, and it only considers certain
environmental issues. EIA is carried out in several steps, starting with a project overview,
acquiring necessary data, and generating an environmental baseline. The EIA is concluded by
decision making based on the data gathered and established baseline. However, the major
differentiating factor with this procedure is the implementation can vary based on the region.
The directive for EIA in the EU can differ from directives in other countries, hence this can affect
the generalization of this tool (Andersson, et al., 2016).
Strategic Impact Assessment (SIA)
Strategic Impact Assessment can be defined as a method to achieve a wider picture during
environmental assessment especially considering socio-economic and environmental aspects
(Srinivas, 2015; Andersson, et al., 2016). This tool is remarkably similar compared to the EIA;
however, EIA is usually applied at project level and is focused on considering specific impact
groups. SIA is instead usually applied at the strategic level and focuses on a wider picture of the
aforementioned aspects. The strategic level can be seen as the decision stage of a project which
handles Policy, Planning or Program levels (PPP) (Srinivas, 2015). SIA can aid in early detection of
environmental issues in a project and is carried out in several key steps. Such as project overview,
scope development, impact assessment, guidelines creation, comparison and evaluation of
alternate policy or planning, decision making process, review of the implemented plan. SIA has
some downside attached to it, especially its lack of structure, formal guidelines, data, and can
suffer from poor coordination between involved stakeholders (Wu & Ma, 2019; Srinivas, 2015).
Multi-Criteria Decision Analysis (MCDA)
Multi Criteria Decision Analysis (MCDA) is a decision-making tool based on multiple attributes or
criteria (Jahan, et al., 2016). This method is used to generate a matrix with various criteria against
the available options in a study or a project, to highlight options which are suitable or not
suitable. MCDA enables a way to observe monetary and non-monetary problems in a structured
manner and fragmenting them into manageable pieces (Dodgson, et al., 2009). Focused decisions
are then made for each piece and then merged to create a coherent picture to the decision
makers (Dodgson, et al., 2009). This tool is only used to aid in the thought process and decision
making but not to be used as a decision (Dodgson, et al., 2009). Steps involved in applying MCDA
are mentioned below based on Dodgson et al (2009) and Andersson et al (2016):

7 | P a g e
I. Establish a context for decision making
o Define the aim of the MCDA
o Identify stakeholder and other necessary decision makers
II. Identify the options to be evaluated
III. Model objectives and relevant criteria
o Define a criterion which will be used to assess each option
o Rank the criteria based on the importance of the objectives (for example, high-
level or low-level objective
IV. Scoring
o Consequence description of each option
o Assign score based on the description
V. Weighting
o Define weightage according to their importance in decision making
VI. Aggregated value analysis
o Calculation of the overall weighted scores
o Determine the overall value
VII. Interpretation and sensitivity analysis
o Various criteria are compared to each other
o List out pros and cons of different options
2.1.2. Analytical
Tools of the analytical category focus on quantifying impacts. Often being standardized, these
tools have a defined structure and systemic methodologies which can be executed. An example
is ISO 14044 standard for Life Cycle Assessment. These tools only enact a numerical estimation
of impacts and in doing so they can enable a comparative analysis of options. The tools are
divided by their ability to address environmental aspects, or both environmental and economic
aspects.
Environmental Focus
Life Cycle Assessment (LCA)
“LCA is a technique compiling an inventory of relevant inputs and outputs of a product system;
evaluating the potential environmental impacts associated with those inputs and outputs; and
interpreting the results of the inventory and impact phases in relation to the objective of the
study” (ISO 14040, 2006)
The International Standards Organization (ISO) has defined general standards for LCA. An integral
part of a LCA study is to define the goal and scope, as this defines the intended path of the study.
This consists of collecting information on different life phases of the product, which can be a
time-consuming process depending on the scale of the study. Information regarding the entire

8 | P a g e
life cycle of the product must be acquired including but not limited to, raw material data,
component transportation data, manufacturing aspects, use phase data, end of life treatment
etc. (ILCD Handbook, 2010). This is done to assess how much energy, emissions, or other relevant
inputs and outputs are required to create the product (ILCD Handbook, 2010). LCA can be
beneficial in industrial applications, since via LCA one can identify where in the products life cycle
emissions occur, or how energy use is allocated. This knowledge can the be used to find
improvements in desired areas.
Material and Substance Flow Analysis
Material Flow Analysis (MFA) and Substance Flow Analysis (SFA) are methods based on the
principles of mass balance. MFA is used for quantitative analysis of material flow (Stanisavljevi &
Brunner, 2014). SFA is instead used for quantitative analysis of the economic and environmental
aspects of a system, while prioritizing the goals of “resource conservation” and “environmental
protection” (Stanisavljevi & Brunner, 2014; Yuan, et al., 2009). Both MFA and SFA can be
performed in these basic steps stated below (Andersson, et al., 2016):
• Defining the objective while selecting indicators used for monitory purposes.
• Defining the goal and scope, system boundaries and other aspects.
• Recognition of the material and substance flow relevant to the defined system.
• Mass balance calculations.
• Interpretation of results and drawing conclusions.
MFA and SFA can be integrated with other assessment methods to further enhance the tools’
ability to analyze systems regarding their sustainability and direct and indirect system flows
(Huang, et al., 2012).
Environmental Focus and Economic Focus
Cost Benefit Analysis (CBA)
Cost Benefit Analysis (CBA) is the analysis of the socio-economic costs related to or involved in a
project or study (Koopmans & Mouter, 2020). According to Pearce et al (2006) CBA focus on the
relationship between the societal benefits and cost, where societal benefits help create an
increased sense of human well-being and cost is focused on decreasing human well-being. Pearce
et al (2006) suggests that societal benefits should be more focused upon human well-being rather
than monetary costs. This tool can be used when integrated with other tools such as LCA, MCDA
etc. by bringing the cost benefit aspect into other tools (Andersson, et al., 2016).

9 | P a g e
Life Cycle Costing (LCC)
There are several types of LCC’s which are focused on economic evaluation. These can be
categorized as conventional, environmental, and societal types of costing. The categorization
depends on the type of cost and the scope of their assessment as seen in Figure 2. As Roh et al
(2018) describes, the types of cost can be private and externalities. Externalities can be defined
as costs that are not incurred by the manufacturer or the primary producer. However, these costs
can be internalized through regulations; for example, the air pollution cost is not incurred by the
producer of a car or the user. Subsequently, the scope can range from people, planet, and
prosperity.
Figure 2: Life Cycle costing model with types of cost and scope of assessment, as adapted from (Roh, et al., 2018)
The Conventional LCC, where all the costs associated with the life cycle of the product are
considered to be directly incurred by one actor, the manufacturer, or the consumer (Gluch &
Baumann, 2004). In conventional LCC, costs which are internal are considered in the assessment
and can sometimes exclude end of life or user phase-oriented costs (Gluch & Baumann, 2004);
for example, air pollution cost as mentioned previously. Environmental LCC (ELCC), usually
considers complete life cycle costs associated with the product, involves more than one actor,
and does not exclude end of life aspects (Gluch & Baumann, 2004). ELCC can consider, if not all,
at least one of the external costs in addition to the costs which are assessed by the conventional
LCC (Roh, et al., 2018). LCC can often be used in combination with LCA as they can share the same
definition to system boundaries and functional unit. This however does not mean that LCC and
LCA are completely compatible in their natural form, certain aspects such as flows and activities,
are different from one another and they need to be tailored accordingly for the tools to combine
(Andersson, et al., 2016). According to Hunkeler et al (2008) there could be a risk of increased
externalities and environmental impacts upon integrating these two tools in their natural form.
In Societal LCC, all the costs which are associated within the life cycle of the product that can be
incurred by society in the present or future are considered (Hunkeler, et al., 2008). This will

10 | P a g e
include all aspects of environmental LCC and any related additional costs from external sources
(Swarr, et al., 2011).
2.1.3. Selection Criteria for the Most Suitable Tool
It is important to select a particular tool which can satisfy the requirement to conduct a study or
project. For this study it was necessary that the tools address the environmental assessment
aspects in a life cycle perspective. Ness et al (2007) shows that to observe if the tools fulfil the
objective, one can categorize them on four essential elements, as stated below:
• Environmental Sustainability: this element defines the tools capability to integrate nature
aspects.
• Social Sustainability: this element defines the tools capability to integrate societal
aspects.
• Spatial Aspects: this element define the capabilities of the tools function at different
scales or spatial levels. Some tools can address impacts either on global, regional, or local
level, and sometimes even capable of operating on multiple levels.
• Temporal Aspects: this element defines the time related perspective of the tools.
Identifying if the tool has short-term or long-term visions. It can often be seen in a way if
the tool is being used to address historical issues or can help addressing aspects in the
future.
This method presented by Ness et al (2007) was used to categorize and rank the best available
tool to be used in this study. There are instances where the tools chosen for the comparative
analysis could also be used when integrated with another standardized tool. However, this
integration was seen as a ground for further research on whether such integrated tools can be
used or not, hence it was determined to select a tool in their intended form.
First, the selected tools were analyzed from the strength and weakness perspectives, as shown
in Appendix A. This enables identifying how suitable a tool is for a study and what shortcomings
they hold. Second, the tools were assigned a score, as shown in Error! Reference source not
found.. This analysis also provided a base for further evaluation of tools based on the method
presented by Ness et al (2007). This data is presented graphically using a radar chart, shown in
Figure 3.
The strengths and weaknesses of the tool were established based on the several literature
reviews conducted and analysis of the case studies, as seen in Appendix A. Each tool was graded
on a scale of 1 to 5, based on three aspects defined by Ness et al (2007) which were based on the
ability of the tool to address, environmental sustainability, social sustainability, temporal, and
spatial aspects, as shown in Error! Reference source not found.. For the scale, the score “1” was
described as least fulfilling and “5” was described as most fulfilling to the stated elements. A
grading chart was developed to present a visual representation of which tool is best suited for
11 | P a g e
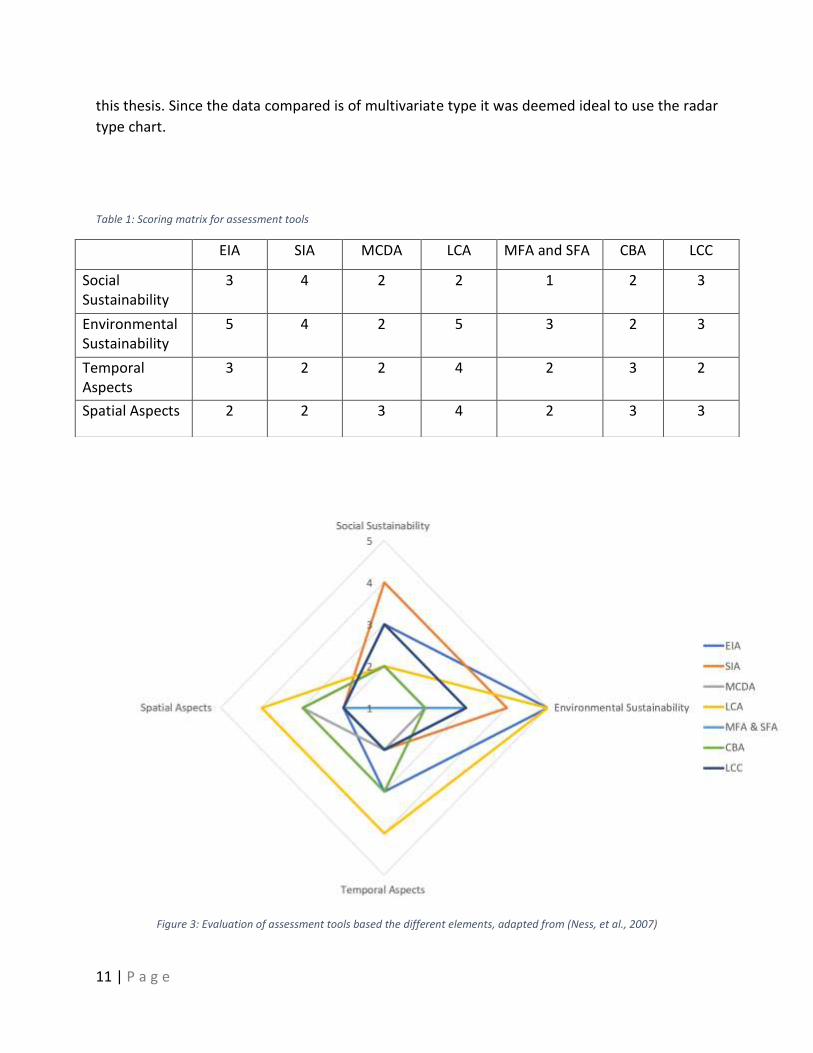
this thesis. Since the data compared is of multivariate type it was deemed ideal to use the radar
type chart.
Table 1: Scoring matrix for assessment tools
Figure 3: Evaluation of assessment tools based the different elements, adapted from (Ness, et al., 2007)
EIA SIA MCDA LCA MFA and SFA CBA LCC
Social Sustainability
3 4 2 2 1 2 3
Environmental Sustainability
5 4 2 5 3 2 3
Temporal Aspects
3 2 2 4 2 3 2
Spatial Aspects 2 2 3 4 2 3 3
12 | P a g e
From this analysis of strengths and weaknesses, scoring and categorization of the tools, it is
observed that Life Cycle Assessment is the most favorable method to address the requirements
of this study. LCA can fall short when addressing the societal aspects, however, societal aspects
are not part of this study. EIA is comparable and similar in performing the assessment, however,
it lacks in spatial aspects. Application of EIA is also very limited and has tendencies to not be
generalizable which was essential if the results of this thesis were to be used across the VAE
manufacturing sector. It should be noted that integration of multiple tools is possible. For
example, LCC can be combined with LCA to address the lack of social sustainability aspects.
2.2. Description of the Suitable Tool: Life Cycle Assessment
2.2.1. LCA background
Since the rise of consumerism there has always been a constant comparison between two distinct
products which serve the same purpose and in the late 1900’s the debate expanded to include
environmental performance (Hauschild, et al., 2017). It was recognized that products not only
have an impact on the environment during its use phase or the end-of-life phase but also during
other life cycle phases (Guinée, et al., 2011).
The first recorded use of the concept Life Cycle Assessment (LCA) was done at Coca Cola in 1969,
where it was used to assess the environmental impact of different types of packaging (Hauschild,
et al., 2017; Guinée, et al., 2011). However, most of these results were used on an internal basis
and were not made public (Hauschild, et al., 2017). In 1974 the United States Environmental
Protection Agency (EPA) had a vision of implementing LCA to a wider use but mostly to regulate
the packaging industry (Hauschild, et al., 2017). However, LCA did not receive widespread
adoption since it seemed impractical to the business community. In the early 1980s LCA was then
taken with great interest by the European countries where LCA was widely studied and
ambitioned to be used for many distinct products (Hauschild, et al., 2017).

13 | P a g e
Figure 4: Life cycle stages of a product in an LCA, adapted from (SAIC, 2006)
Since the adoption in European countries, where it was initially termed as Ecobalance, it was
understood that properly implemented LCA can diagnose various phases of a product effectively
and the results can be used to improve environmental performance of the product (SAIC, 2006;
Guinée, et al., 2011). Recognizing this, the International Organization of Standardization (ISO) set
certain definitions and standards in conducting an LCA (Hauschild, et al., 2017). The ISO14044
standard defines the management of environmental aspects, while addressing both technical and
conceptual frameworks of the LCA (ISO 14044:2006).
In Figure 5, it can be observed that there is a systematic and a very structured approach to
performing an LCA. This framework is structured after the goal and scope definition, inventory
analysis, impact assessment, interpretation, and direct applications where the results can be
applied to a product or certain process. These elements of the life cycle assessment framework
are explained in the further sections of the report.

14 | P a g e
Figure 5: Life cycle Assessment framework, adapted from (Muralikrishna & Manickam, 2017)
2.2.2. LCA Goal and Scope
First one must define the goal and scope of the study. This is the stage where the direction of the
study is formed. The goal of an LCA can be seen as a tool which provides a perspective of what it
is aiming to accomplish or simply as problem definition. Whilst the scope of an LCA can be
described in terms of system function and the reference flows over a life span of the product
(Bjorke, 2011). These flows describe the activities present in product system along with the
relationships or the interactions between them (Muralikrishna & Manickam, 2017). Reference
flow specifically describes the quantification of the product and the corresponding parts, where
they are necessary for specific product system to deliver (Chau, et al., 2014; Weidema, et al.,
2004). To set a suitable goal of an LCA one must consider several factors such as who is the target
audience and how the LCA addresses their environmental goals often referred to as the problem
definition. The problem definition is bound to have an impact when one aims to quantify the use
of resources and the environmental impact of the service or product. The study scope instead
seeks to set a definition for the product or service, this majorly involves defining the system
boundaries, caliber of the system used, definition of the functional unit (SAIC, 2006).
System Function and Functional Unit
System function and functional unit are very integral in concluding an LCA. System function
defines the intended function of the product system. While Functional unit according to ISO
14040:2006 is described as “quantified performance of product system for use as a reference
unit” (Cluzel, et al., 2013). This means that the functional unit must include the use aspects of
the product; for example, m2 of facade area maintained can be used as a functional unit for a
building maintenance unit (BMU). An ideal functional unit should be able to define the
15 | P a g e
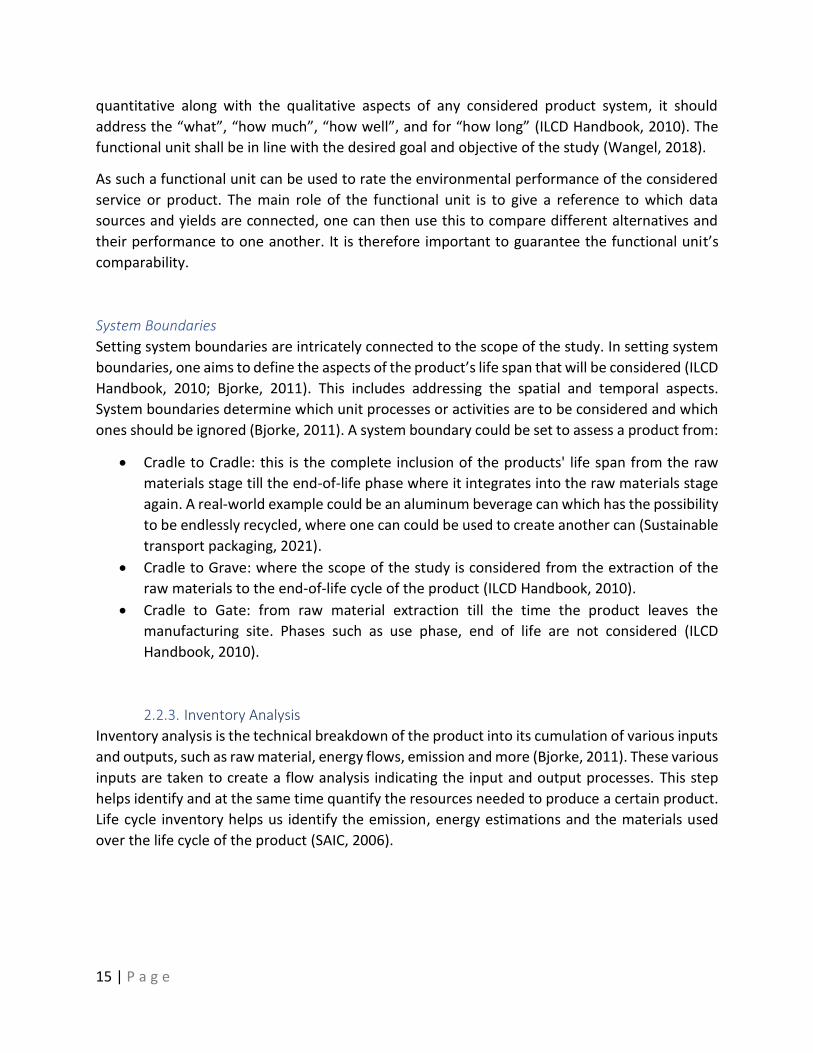
quantitative along with the qualitative aspects of any considered product system, it should
address the “what”, “how much”, “how well”, and for “how long” (ILCD Handbook, 2010). The
functional unit shall be in line with the desired goal and objective of the study (Wangel, 2018).
As such a functional unit can be used to rate the environmental performance of the considered
service or product. The main role of the functional unit is to give a reference to which data
sources and yields are connected, one can then use this to compare different alternatives and
their performance to one another. It is therefore important to guarantee the functional unit’s
comparability.
System Boundaries
Setting system boundaries are intricately connected to the scope of the study. In setting system
boundaries, one aims to define the aspects of the product’s life span that will be considered (ILCD
Handbook, 2010; Bjorke, 2011). This includes addressing the spatial and temporal aspects.
System boundaries determine which unit processes or activities are to be considered and which
ones should be ignored (Bjorke, 2011). A system boundary could be set to assess a product from:
• Cradle to Cradle: this is the complete inclusion of the products' life span from the raw
materials stage till the end-of-life phase where it integrates into the raw materials stage
again. A real-world example could be an aluminum beverage can which has the possibility
to be endlessly recycled, where one can could be used to create another can (Sustainable
transport packaging, 2021).
• Cradle to Grave: where the scope of the study is considered from the extraction of the
raw materials to the end-of-life cycle of the product (ILCD Handbook, 2010).
• Cradle to Gate: from raw material extraction till the time the product leaves the
manufacturing site. Phases such as use phase, end of life are not considered (ILCD
Handbook, 2010).
2.2.3. Inventory Analysis
Inventory analysis is the technical breakdown of the product into its cumulation of various inputs
and outputs, such as raw material, energy flows, emission and more (Bjorke, 2011). These various
inputs are taken to create a flow analysis indicating the input and output processes. This step
helps identify and at the same time quantify the resources needed to produce a certain product.
Life cycle inventory helps us identify the emission, energy estimations and the materials used
over the life cycle of the product (SAIC, 2006).

16 | P a g e
2.2.4. Life Cycle Impact Assessment
Life Cycle Impact assessment is aimed at understanding and evaluating the magnitude and
significance of the potential environmental impacts of a product system (European Comission-
Joint reserach center, 2010). Life cycle impact assessment gives information of effects on the
environment, such as global warming impact, acidification, ozone depletion, eutrophication and
more. According to SAIC (2006) LCIA should address ecological and human impacts along with
resource depletion. Impact assessment can according to Nieuwlaar (2004) and SAIC (2006) be
separated into these following impact categories:
• Classification: the data acquired in the life cycle inventory stage is classified in the
presumed impact type category (for example: classifying NO2 under emission to global
warming) • Characterization: measuring how contribution to the environmental impact category is
made using a unit of measurement (for example: visualizing how different elements such
as NO2, CO2 or others can contribute to global warming)
• Normalization: presenting a comparison model for the potential impacts categories. This
is done by converting impact indicator values into a common unitless expression by
selecting a specific reference value. The reference value where one example can be
considered as, overall emission or resource usage for a specific area on a which can be a
global, regional or a global scale.
• Grouping: the indicators are categorized according to certain aspects (for example,
categorization according to global, regional, or local scale)
• Weighting: comparison of results of different impact categories and addressing the
importance of these potential impacts
Impact assessment is helpful when creating a comparative basis with numerical interpretation,
this can determine which product, or a process can lead to the contribution to global warming or
any other relevant impact category.
2.2.5. Interpretation
In this final stage of the life cycle assessment the results obtained from the life cycle inventory
and life cycle impact assessment stage are assessed and interpreted in a way that they comply
with the scope and goal of the study. With these interpretations the conclusions can be made to
reduce the impacts. (ILCD Handbook, 2010)
• Elements of study design: The study must be constructed in a way it covers several
parameters, such as the depth and detail, transparency, data sources and other
parameters which are discussed in detail below. Structuring an LCA study can establish a
sense of completeness and a logical way of achieving the goal. These elements are
described below and are inspired by (Bjorke, 2011), which in turn describes LCA study
design adapted from ISO 14044.

17 | P a g e
• Depth and detail: As the title suggests, this is to highlight how deep and detailed the
study should be. One should consider the lifespan, what data should be acquired, and
which ones can be ignored. Furthermore, how detailed data on each phase could also be
addressed.
• Breadth and completeness: Here, the intensity and the area to be covered in the scope
of the study is to be defined, one can decide on which aspects of the study can be
considered or can be ignored completely or partially. It is important to decide the kind
of inventory to be included along with the required indicators for the impact categories,
and the definition of the system boundary.
• Transparency: Who is this study for? How much of the results of the study can be
presented publicly? These are some of the questions related to the transparency of the
study. In some scenarios results interpreted from the study cannot be made public, in
this case one should decide how the data can be interpreted in a more adaptive manner
depending on the degree of transparency.
• Data sources and data quality: Data is an integral part of any study; it is important to
consider the type of sources the data is acquired from. The quality of data can make or
break a study and set the course of the study. Data can be collected from sources which
are dedicated to creating worldwide data inventory sets, data can also be more from
industry-based data or independent national databases. Such data sets can determine if
as study is structured around more generalist ideas or more focus based. Data sources
are important to a study; however, it is also important to assess the data quality. Data
quality can determine the integrity of the study and hence the conclusion related to it.
One should also consider up to what degree of uncertainty is tolerable in the study.
• Site specificity: Site specific information is regarding how specific the data sources must
be. For example, should the data for steel emissions be considered from one factory/
site or can it be acquired from lobby of steel industries who collect data from all the
related steel industries from a specific country?
• Scale: One must also consider if the collected data is from a local, regional, or a global
level. This can decide how study can be applied at different scales, a study built upon
the local level may not be applicable on a more global level as the inputs and various
aspects can differ between these two levels.
18 | P a g e
• Levels of aggregation: Aggregation of data or defined as clustering similar type of data
sets can create a sense of appropriation to the study. For example, should the data sets
be clustered in the form where the functional unit is defined, or can it be aggregated in
way where they are more process specific.
• LCA limitations: Aspects such as environmental relevancy should be considered when
performing the impact assessment, this can be deemed a limitation to the study as LCA
does not address the actual impacts or acknowledge the risks and threshold breaches.
LCA is sought to be an umbrella tool which captures if not all most life cycle aspects
however, it may require the use of other tools to achieve a sense of a complete life cycle
assessment (European Comission-Joint reserach center, 2010).
2.2.6. Advantages and Disadvantages of LCA
There are many advantages that are tied with applying LCA in an organization for a product or a
service. For example, LCA address one of the major problems of the industry when it comes to
sustainable development, and burden shifting. Burden shifting happens when there are
environmental and socioeconomic factors involved which can be relocated (European
Commission, 2021). For example, shifting problems from wealthy countries to other countries or
pushing current generation problems and prolonging it for the future generations (European
Commission, 2021), or shifting emissions between different life cycle stages of a product. Another
benefit of LCA is that it can provide environmental performance information to the customer
with detailed breakdowns which allow more comprehensive evaluation.
However, there are some issues regarding LCA. An example is allocation of inputs and outputs
which can be taxing during LCA, especially with regards to recycling. There are seven common
methods to handle recycling, Cut-off, system expansion, economic allocation, input oriented,
output oriented, value-corrected substitution and multiple recycling method (Ligthart &
Ansems, 2012). Which one to choose is not always clear and the choice will impact the end
results of the study. A common and simple method is the Cut-off method (Ligthart & Ansems,
2012). In cut-off allocation all impact caused directly by the product is allocated to it, this
includes any eventual waste treatment excluding recycling. For the cut-off approach both the
recycled content in the product and the recycling rate at its end of life is important (Ligthart &
Ansems, 2012). This is because the burden of primary material use is solely put on the first time
use of the material, and once it is sent to recycling only the burden of recycling is put on the
following product. The cut-off method thus promotes high use of recycled materials and sending
as much material as possible to recycling at the end of life (Ligthart & Ansems, 2012).
19 | P a g e
2.3. Environmentally Sustainable Life Cycle Design How a company designs both their product, and its surrounding services will impact the product
over its entire life span (Ramani, et al., 2010). LCA can play a significant role to incorporate
sustainability aspects in product development as it has for a long time been widely accepted
among manufacturing industries (Nielsen & Wenzel, 2002; Khan, et al., 2002). Furthermore,
according to Chang et al (2014) LCA can in a modern setting be used with product design to
incorporate sustainability in the design. Especially early design decisions regarding factors such
as material, manufacturing choices, and more have far reaching consequences on a product’s
entire life cycle (Ramani, et al., 2010). LCA has many uses which can benefit product development
and spur innovation, such as establishing a baseline, effective environmental impact assessment,
measuring and evaluating the impact of different options (Khan, et al., 2002). It is important to
have a holistic life cycle perspective when designing a product to make sure critical factors are
not overlooked. Having such a holistic view of the product combined with previous product data
can help product designers to drastically improve the sustainability of their products (Ramani, et
al., 2010). PSS is one way a designer could approach sustainable products. The following
paragraphs describes PSS and some PSS aspects.
2.3.1. PSS (Product service systems)
Product Service System (PSS) is defined by Mont (2002) as “a marketable set of products and
services capable of jointly fulfilling a user's need. The product/service ratio in this set can vary,
either in terms of function fulfilment or economic value”. As such PSS can be divided into three
main categories of PSS, product-oriented which maintains focus on the product and is similar to
a traditional sale, use-oriented which focuses on the availability of the product for use by the
customer, and result-oriented which focuses on the end result and the provider retains
ownership of the offering and operates it throughout its use phase (Tukker, 2004). The more
servitized and result oriented a PSS becomes, it is also more likely to be accompanied with circular
economy benefits (Matschewsky, 2019a; Tukker, 2015). However, a results-oriented PSS is also
one which requires the largest business model change which can be a notable barrier in a
company (Tukker, 2015).
A PSS is useful and seen as fulfilling various aims; for example, it can move responsibility of
maintenance from customer to producer reducing workload for the customer (Matschewsky,
2019a; Mont, 2002). Furthermore, if the payment for the integrated product service offering
(IPSO) is structured in monthly installments the producers receive continual income based on
function and results, rather than one-time sales which can be a competitive advantage
(Matschewsky, 2019a; Mont, 2002). Sakao and Lindahl (2015) findings show that an IPSO has the
potential to outperform a traditional sales model on life cycle cost. This is because an IPSO can
avoid potential sub optimizations and perform cost restructuring in a way that an end consumer
cannot (Sakao & Lindahl, 2015).
Many consider PSS as a means to achieve a circular business model. Previous research has shown
that PSS has a potential to reduce environmental impact when it is compared to the traditional
20 | P a g e
sales of physical products to the customer (Sundin E., 2009; Matschewsky, 2019a). The
contribution of PSS in a circularity context strongly stems from the producer’s ownership and
responsibility of the product/service throughout its entire lifespan and the changes this brings to
the business incentives (Reim, et al., 2015; Tukker, 2004). Well-defined PSS should be able to
coexist with the uncertainty of the product functionality in its use phase, which gives the
manufacturer the ability to create higher value for the customer (Matschewsky, 2019a; Sakao, et
al., 2019).
There are several parts of PSS and how it can be implemented to improve products. Below, some
of the parts which have been notable in this study are described.
Design to Reduce Resource Consumption During the Use Phase
To reduce the impact of a product in the use phase one obvious way to do it could be to increase
the efficiency which engineers have been doing for a long time. However, Shu et al (2017)
describes two main ways to reduce resource consumption during product use phase which is not
directly tied to simple efficiency increases. The first is how a user/customer interacts with the
product through information and feedback (Shu, et al., 2017). This can be done by influencing
factors such as norms, attitudes, knowledge, training, opportunities etc. (Kurisu, 2015). The
second is automatic adjustment of the products systems based on user profiles and anticipated
use (Shu, et al., 2017). This can for example be sensors placed on the product to turn it off in
certain cases, like a car's start-stop function, or a faucet which only turns on when hands are
present.
Predictive Maintenance and Active Monitoring
Predictive maintenance is a term which defines when the need for maintenance is forecasted
using data analytics or data gathering from a functioning product (Omnisci, 2021). This is done
so that the maintenance can be carried out only when there is a clear need or when there is an
anticipation of mechanism or system failure (Omnisci, 2021). Predictive maintenance techniques
can allow for a non-invasive method where the functioning of the product or the system does
not need to be interrupted; for example, drones can be used to inspect windmills while avoiding
the need to shut down if a human were to carry out the inspection (Landpoint, 2018). Active
monitoring with sensors can also be used to aid maintenance but such sensors could also provide
data on the product’s different life cycles. Matschewsky (2019b) postulates that effective data
collection and use from the products lifecycle is a critical aspect in determining the potential
reduction in resource use through PSS when compared to a traditional sales model. Thus,
properly implementing sensors and using the data collected from them is vital for effective PSS.

21 | P a g e
Material Selection
Material selection is part of the product development stage, where it is a key part in establishing
critical aspects of the product such as weight, density, hardness, stress factor, yield strength and
more (Ashby, 2005). In an ideal material selection, there are certain frameworks to be followed
when choosing the most suitable type of material for the product (Ashby, 2005). This can be user
requirements in the form of environmental stress on the materials, objectives, function, and
constraint definition (Ashby, 2005). Subsequently one can rank these materials in reference to
the objective via gathering necessary information on the selected materials, and lastly select the
most suitable material (Ashby, 2005). When applying material selection on the grounds of
environmental performance, material eco selection can be applied. To apply this concept, one
needs to consider the ecological aspects of the conventional material selection process, such as
energy for production, emission factors, life cycle phases, recycling rates, recycled content and
more (Mayyas & Omar, 2020). The environmental performance must then be weighted and
included in the ranking for the material selection process (Mayyas & Omar, 2020).
Remanufacturing
Products which are at the end of their lifetime, which are brought back to the same or close
to factory new conditions in terms of their functionality after being processed, can be described
as remanufactured products (Matsumoto & Ijomah, 2013). Remanufacturing amongst several
methods like refurbishing, recycling, design for durability and more is considered to help achieve
circular economy (CE) (Louise, et al., 2013). Remanufacturing could be done by replacement of
certain components in the product to achieve the as new state or upgrading of functionality to
achieve even better. It is important to note that it is an advantage when a product is designed
with remanufacturing at the end-of-life kept in mind, since it can simplify the remanufacturing of
the product (Barquet, et al., 2013).
2.3.2. Applications and Barriers to Product Service Design/PSS
Modern Application of PSS implementation
There are many examples in literature which describes how PSS can be implemented at a
manufacturing company. Here a case study by Sundin et al (2009) is shortly described since their
case study has a different focus but a similar perspective and goal as this thesis.
Sundin et al (2009) conducted a study based around forklifts, soil compactors and household
appliances with the aim to illuminate how Swedish industry has adapted their products for PSS.
In their study they clarify both what has been done and what can still be further improved for
each product. First the forklifts, this business was associated with both, manufacturing and
remanufacturing forklifts as well as selling and renting them. However, as the interest from
customers to rent remanufactured units was growing and rental higher profit margins, this area
had to be strengthened. In the study Sundin et al (2009) suggested a range of improvements to
the product with regards to ease of maintenance and remanufacturing at their core, and after

22 | P a g e
validation checks with the company many were accepted. The second product investigated was
soil compactors, here the main goal from the company’s perspective was increased lifespan,
increase ease of repair, and lastly ease of remanufacturing. Through analysis of the product
design changes could be made to the hood, the transport device from a hook to a textile strap,
and the air filter. The material changes of the hood led to less visible damages and subsequently
reduced the need for repainting and being much easier to change. The change to a textile strap
led to reduced wear and tear during transport. And the new air filter placement reduced the
amount of particulate matter entering the machine, reducing the frequency at which
maintenance had to be done. Lastly, in the study, Sundin et al (2009) investigated a washing
machine and a refrigerator where they also found design changes to simplify maintenance and
repair. They conclude that PSS imposes new challenges on products and designers compared to
traditionally sold products. PSS can also be implemented without remanufacturing kept in mind
however with an optimized product design greater profits can be made. And lastly that designers
can make a multitude of changes to accommodate PSS. (Sundin, et al., 2009)
Barriers to Implement PSS
A few barriers were already mentioned when describing PSS and some ways of achieving it,
however, PSS implementation can also face other barriers.
Sometimes experienced product designers are not utilizing the full potential of PSS. A common
cause is the silo type structures of an organization, where the departments of the organization
operate independently and do not engage in data or information exchange. This creates an
information gap between the product and its designers (Matschewsky, 2019a). This can be critical
as the design of a product is particularly important to how it is maintained, repaired, and
remanufactured (Sundin, et al., 2009).
On the business model side there are also barriers. First since ownership remains with the
manufacturer of the product it results in capital being tied up for the manufacturer (Reim, et al.,
2015). Second the PSS model brings with it a long-term relationship between the manufacturer
and customer which need to be tailored to each customer’s needs. This usually entail formal
contracts between the two parties (Reim, et al., 2015). This contract must be structured in a way
that the PSS model brings both the manufacturer and the customer advantages compared to a
conventional purchase (Azarenko, et al., 2009; Tukker, 2015). Furthermore, it is also quite
common when providing a PSS alternative that the manufacturer uses standard products in their
PSS offering without adapting them to a PSS model (Sundin & Bras, 2005; Isaksson, et al., 2009).
This can be because transition from traditional sales to a PSS model requires a lot of new
competences and knowledge which might not be available at the company (Isaksson, et al.,
2009). This can be a detriment since fully adapting a product for PSS can increase profits in the
long-term, due to reduced maintenance intervals, ease of conducting maintenance, and
simplified remanufacturing.

23 | P a g e
3. Research Methodology Yin (1984) described in his article to better understand how to conclude a research program,
three condition where defined. First being how relevant are the research question constructed
to the goal that is being achieved. Second, how is it that the investigator can control the
boundaries of the study. Finally, the degree of focus to which the contemporary events are
desired.
3.1. Research Methods
3.1.1. Literature Review
Research is an integral part of any kind of study conducted, it helps in creating a solid foundation
or a basis for the study. Preparatory research can influence certain ideas and a sense of direction
during the period of study, as well as creating a chance for developing or improving an existing
idea. Following the same ideology every study must start with a literature review. A literature
review is a comprehensive summary of relevant research, this could contain published articles,
journals, scientific papers, scholastic books and more. (Coffta, 2020)
The study was structured into two phases; at the beginning of phase one the foundation for the
study was built by reading up to date articles and standards on topics such LCA and sustainability.
Additionally, exposure to LCA and sustainability concepts from the professors at Linköping
university where the study was conducted was an advantage. The ISO 14000 series, which
focuses on environmental management, majorly addresses how and LCA should be conducted
to properly estimate a product or service impact. This was helpful in addressing RQ1, which was
to estimate the climate impacts and energy use of each of the four products, respectively.
Relevant search tools were used such as the University search portals DiVA (for research
publication and relevant publishes theses) and Unisearch, google scholar, ordinary google
search. These search engines were helpful to quickly gain varied perspectives and build a
knowledge base that can help with the foundations of the study. These varied sources of
information also helped to cross reference for crucial or uncertain data and statistical
information to validate information.
3.1.2. Case Study
Yin (1994) expresses that case studies can answer questions such as “how” and “why”, which can
be quintessential in what aspects the case study is aiming to satisfy the overall objective of the
study. Often the data considered in a case study is deemed qualitative in nature, this is where a
“naturalistic inquiry” is made seeking information which provides an in-depth view of the “social
phenomena” in its current natural state of environment (UTA, 2021). In this study a qualitative
approach was taken where it included in depth interview with company engineers with extensive
knowledge of the products, review of documents, and semi structured workshops.

24 | P a g e
There are several benefits to conduct a qualitative type of research study, but also some
limitations which highlight the shortcomings. A benefit of a qualitative case study is that it is
possible to investigate theoretical concepts, since the case study involves reexamining earlier
concepts and interpretations (Yin, 1984). A case study can thus help support or dispute
established knowledge. It can also provide an opportunity to help innovate by enabling change
in the current theoretical assumptions (Queirós, et al., 2017). The limitations of this method are
defined by the lack of ability to establish a reliable cause-effect connection, lack of ability to
generalize from a group of small case studies and to create a case study that can fit to be used
in other subjects (Queirós, et al., 2017).
3.2. Data Collection and Processing Methods
3.2.1. LCA
LCA is a systematic and structured approach to evaluate a product’s environmental performance
over its lifespan. Life Cycle Assessment was used to address both research questions which
required holistic cradle to grave assessment of the products. First LCA was used to establish
baselines for the products. Second LCA was used to evaluate all life cycle changes caused by the
improvement suggestions.
Data was gathered form database available on a software which performs a climate impact and
energy use assessment of a given product. The database could not cover all the points of interest
and was therefore complimented with data from scientific papers, papers from industry
organizations, and related documents from the EU. However, the data from outside the database
were always double checked with various sources so that there is some factor of security and
redundancy in the data collected.
3.2.2. Data Acquisition Interviews
During the study interviews were held as needed with company engineers from all three
divisions of the case company. One division focuses mainly on construction and industrial
applications, the second has a strong focus on BMUs, and the third focuses on wind tower access
solutions. The aim of the interviews was to collect specific product information and discover
what data points had to be estimated. In the case of data missing the engineers also helped to
estimate the missing data in an as accurate way as possible. Because of frequent contact and
possibility to ask clarifying questions over E-mail, there was limited or no issues to gather data
from the company for the LCA study.
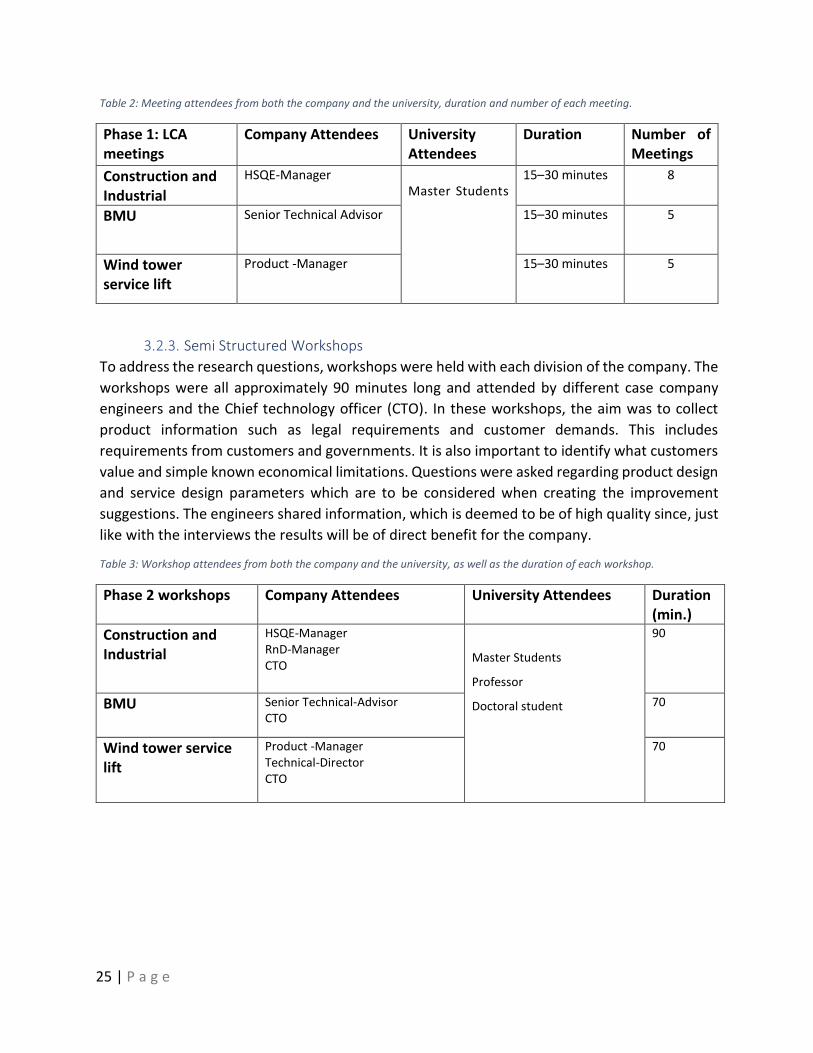
25 | P a g e
Table 2: Meeting attendees from both the company and the university, duration and number of each meeting.
Phase 1: LCA meetings
Company Attendees University Attendees
Duration Number of Meetings
Construction and Industrial
HSQE-Manager Master Students
15–30 minutes 8
BMU Senior Technical Advisor
15–30 minutes 5
Wind tower service lift
Product -Manager
15–30 minutes 5
3.2.3. Semi Structured Workshops
To address the research questions, workshops were held with each division of the company. The
workshops were all approximately 90 minutes long and attended by different case company
engineers and the Chief technology officer (CTO). In these workshops, the aim was to collect
product information such as legal requirements and customer demands. This includes
requirements from customers and governments. It is also important to identify what customers
value and simple known economical limitations. Questions were asked regarding product design
and service design parameters which are to be considered when creating the improvement
suggestions. The engineers shared information, which is deemed to be of high quality since, just
like with the interviews the results will be of direct benefit for the company.
Table 3: Workshop attendees from both the company and the university, as well as the duration of each workshop.
Phase 2 workshops Company Attendees University Attendees Duration (min.)
Construction and Industrial
HSQE-Manager RnD-Manager CTO
Master Students
Professor
Doctoral student
90
BMU Senior Technical-Advisor CTO
70
Wind tower service lift
Product -Manager Technical-Director CTO
70

26 | P a g e
3.3. Research Quality Appraisal Here it is explained how the method and the data chosen can have impacted the validity and the
reliability of the study. Issues regarding differing data sets, recycling data, and the repeatability
of the study.
3.3.1. Internal Validity
The internal validity of this study will be examined based on Flemmer (2020). The author
describes Internal validity as a critical assessment of the issues in the study coming from
weaknesses in the design of the research method and in the data collected. (Flemmer, 2020)
3.3.2. External Validity
The external validity is defined by Flemmer (2020) as the extent to which the study conclusions
can be generalized to a larger group than just the studied subject. Reliability on the other hand
is the repeatability of the research measures, in the context of evaluating the quality of research
(Flemmer, 2020). Thus, the external validity can be judged by how general the conclusions are,
and the quality can be judged by the reliability and repeatability of the study.
3.4. Research Process
3.4.1. Phase 1 – Life Cycle Assessment
In the first phase the aim was to understand the upstream and downstream activities of the case
company and establish an estimate regarding kg CO2-eqv and cumulative energy use. Necessary
data required to perform the LCA was collected with emphasis on a broad perspective on the
four products, rather than an in-depth view. This phase was crucial in establishing an accurate
baseline. This was achieved in several stages such as bill of materials acquisition, data analysis
(SimaPro), defining cut-off limits, data entry, and calculations. The work done in phase one will
make clear which design parameters have a high impact and will be used to guide phase two.
• Collection of company product data: Frequent contact was maintained with case
company engineers who had extensive knowledge of the four products. This allowed for
effective data acquisition regarding raw materials, transport, energy, installation
information, use phase, and spare parts. This data was mostly collected through
interviews and supplementary questions via e-mail.
• Use of SimaPro for climate impact and energy use estimations: To produce relevant
results each of the material and process data gathered from the case company had to be
paired with parameters for climate impact and energy use. SimaPro software was used
for finding factors for the kg CO2-eqv and energy use in kWh. The SimaPro software
calculates the factors from a set of numerous data points from a database that are
webbed together to form a material, process, or activity. In order to calculate the factors,
there are several steps involved:
- Creating a project, where a goal and scope is defined. Under this, selection
of a database is required from available libraries.

27 | P a g e
- Inventory selection, under this there are several selections to be made like
specific processes, product stages, waste types, and parameters. For
example, under processes, a product’s input and outputs across its life
cycle phases can be defined such as materials, energy, transport etc.
- Impact assessment, in this study the method used for CO2-eq was IPCC
2013 GWP 100a V1.03.
- Energy use was estimated using the available life cycle inventory data of
materials and processes from the data base available in the software.
- Calculations, a process tree is created for the product or process under
assessment. All the relevant parameters have to be listed, including inputs
from nature and inputs from the Technosphere (materials, fuels,
electricity, heat etc.). Each of these parameters must be defined in
amount in specific units (kg, tonne-km, allocation %).
- Results, following all the previous steps stated before an analyze function
can be executed. This provides the final estimation of the product’s
climate impact and energy use.
Furthermore, it was important to estimate the climate impact and energy use for the
suppliers of the raw materials of the product. Specifically, the EU average metal working
numbers were needed, this specific data was then acquired via specific database in the
software. All the data gathered in this way was entered into the self-made excel tool for
pairing with the company product data.
• Supplementing unavailable data: All data could not be gathered directly from the
database used in Simapro, and certain processes required extra input from the user of
the software. For the end-of-life phase data regarding disposal such as waste
management, landfill and incineration had to be acquired as this could show a significant
impact in the final estimations. In cases where data from the database was unavailable
supplementary data was collected from official EU data (EuRIC, 2021; EU, 2021; Cepi,
2019; Parliment, 2008; Cordis, 2017; PlasPLUS, 2019; EU, 2021; Passarini, 2018; ECRA,
2015) or data from industry organizations like the European Aluminum Association
(European Aluminium , 2021), The European Steel Association (EUROFER, 2021),
International Zinc Association (IZA, 2021) , or world steel (World Steel Association , 2021).
Relevant data was also gathered from national documents (Eriksson, et al., 2010) and the
international energy agency (IEA, 2021b), as well as cumulative averages over the EU
averages for waste and other initiatives such as Waste Electrical and Electronic Equipment
directive (WEEE) (European Commission, 2012). Finally various papers, reports, and
publications (Grice, et al., 2014; Guo, et al., 2018; Van Genderen, et al., 2016; Grimes, et
al., 2008; Johnsson, et al., 2008; Fraunhofer institute, 2019; Spatari, et al., 2003).

28 | P a g e
• Inclusion of National data for future energy mixes and EU averages wherever missing:
As electricity mixes most likely will be less carbon intense in the future. Data regarding
future carbon free energy targets was also collected from sources such as the EU
(Commission, 2021), national institutions (DBEIS, 2020; Energimyndigheten, 2020; EIA,
2021), newspaper articles (Stanway & Cadell, 2021) , and International Energy Agency
(IEA, 2021a; IEA, 2016).
• Cut-off-limits: Defining the cut off limits is particularly important while performing LCA as
this can shape the results of the study. The cut off limit can help remove certain stages of
the product life cycle which are deemed irrelevant, this could be certain negligible
activities, processes, or inputs. According to ISO 14041 the cut off rule criterion is related
to mass, energy use or environmental relevance. In this thesis two major principles for
investigation were used. First only the product itself was investigated and not potential
supportive elements such as fittings in a wind tower to accommodate the service lift, or
additional concrete used to support the BMU. Second a rule of less than 1% of total
climate impact can be ignored was followed. This meant that whenever the impact was
unknown or uncertain, information on the topic was gathered until it was certain the
impact would be of negligible size, often much less than 1% of total climate impact.
• Data entry/Excel Template: The acquired data from the software was entered into a self-
made Microsoft Excel tool. The data collected was refined, structured, and then entered
in the tool in a systematic manner. The tool involves several different excel sheets where
data input is required. These sheets follow the same life cycle segmentation as the report
with some additional information sheets: general product information, raw materials,
transport, manufacturing, installation, use phase, maintenance, end of life, results, and
data sheet. Most of the data acquired from the software SimaPro was entered into the
data sheet of the excel tool. The data entered was classified into categories such as:
materials, transport, manufacturing, electricity mixes, future national electricity mix
targets, fossil fuels for heating, material landfill and Incineration, and finally the Disposal
information by material.

29 | P a g e
3.4.2. Phase 2 – Finding and Evaluating Improvement Suggestions
During phase two the aim was to develop product or service design improvement suggestions
to reduce climate impact and energy use for the four products. To reach this goal in a structured
manner for each product the following four steps were taken. The steps are inspired by similar
works.
• Step 1: Finding out legal requirements and customer demands. In this step requirements
for the products are identified and analyzed. This includes requirements from customers
and governments. It is also important to identify what customers value and economical
limitations.
• Step 2: Investigating product design and service design parameters. This step is taken to
ensure that product and service design parameters with high impact found in the LCA are
discovered and are considered when creating improvement suggestions.
• Step 3: Generating feasible improvement options based on the previous steps. In this
step clear improvement options for specific products are generated based on the
information gathered from step 1 and 2
• mentioned above
• Step 4: Here the kg CO2-eqv and kWh impact of the changes are investigated, this should
be done with a holistic approach for the full life cycle of the product. The impact of the
changes is investigated via the LCA template which was developed in phase 1.
After assessing each type of process flow of the product, we can suggest which process flow or
action can be altered to improve the kg CO2-eqv and/or energy use. This could be either be a
change of manufacturing processes, evaluating material choices from an environmental
perspective or probable value chain changes.
Steps one and two were completed via workshops held with knowledgeable case company
engineers. The workshops are explained in greater detail in Semi Structured Workshops 3.2.3.

30 | P a g e
4. Case Study - Results and Analysis
4.1. Phase 1: LCA As previously mentioned, the aim of phase 1 is to understand the upstream and downstream
activities of the case company along with determining the climate impact and energy use of the
investigated products. The impact category included are, climate change, expressed kg CO2-eqv,
and cumulative energy use expressed in kWh. The inventory database is key to acquire the data
points, the data bases that were used in this study are Ecoinvent and WEEE LCI database. To
access these databases, the software utilized was “SimaPro”. The IPCC method was used to
convert data to kg CO2-eqv estimations. This method by the Intergovernmental Panel on Climate
Change (IPCC) details climate change factors with a defined time frame (PRé, 2020). In this study
IPCC 2013 GWP 100a V1.03 was used where the timeframe is for 100 years.
This study covers four separate products a construction hoist, an industrial elevator, a building
maintenance unit (BMU), and a wind tower service lift. All of these are VAE however, their form
is greatly different due to the differing purposes of each device. First, the construction hoist is a
rack and pinion solution for construction projects; designed for frequent transport of equipment
and personnel to different levels of a construction site. Second, the industrial elevator is similar
to the construction hoist but its main area of use is industrial areas or offshore marine
environments. The industrial units don’t see as frequent use, and usually does not require as
heavy lifts as such they are smaller than their construction counterpart. Third, the BMU
investigated was a rather large unit, located at the top of a skyscraper. The main purpose of a
BMU is to service the Façade and lengthen the lifespan of a skyscraper, whilst remaining hidden
when not in use to preserve the vision of the architect. As such BMUs are usually custom designed
or adapted for each project to fit the specific building. BMUs also must be safe enough to be able
to cover a large area of the façade. Lastly the wind tower service lift is a relatively small lift made
for the infrequent yet necessary controls of wind towers and their turbines. Because of the
infrequent use and relatively light payload of tools and a few personnel, the design is focused on
safety, ease of access, and low cost, resulting in a lightweight unit.
Most parameters for the different products were set close to the average of each product, as
such the lifespans were set to the average lifespan, and factors which rarely occur were ignored.
The breadth and completeness of the study was limited by ease of access to certain information;
for example, it was difficult to estimate the impact of changes made in structures to
accommodate the products. Because of these difficulties such areas were ignored and only
matters more directly related to each product were investigated.
Quantifiable functional units for each of the products were selected based on the functional
capabilities of each individual product. For the elevators and hoists the considered functional unit
was meter vertically moved ton, since their primary purpose was to transport people or items up
or down. For the wind tower service lift the functional unit was set as access to all wind tower
floors for 1-2 people and the necessary tools as often as required for 20 years, this functional unit
was selected since simple access to the floors was the main customer requirement. Lastly for the
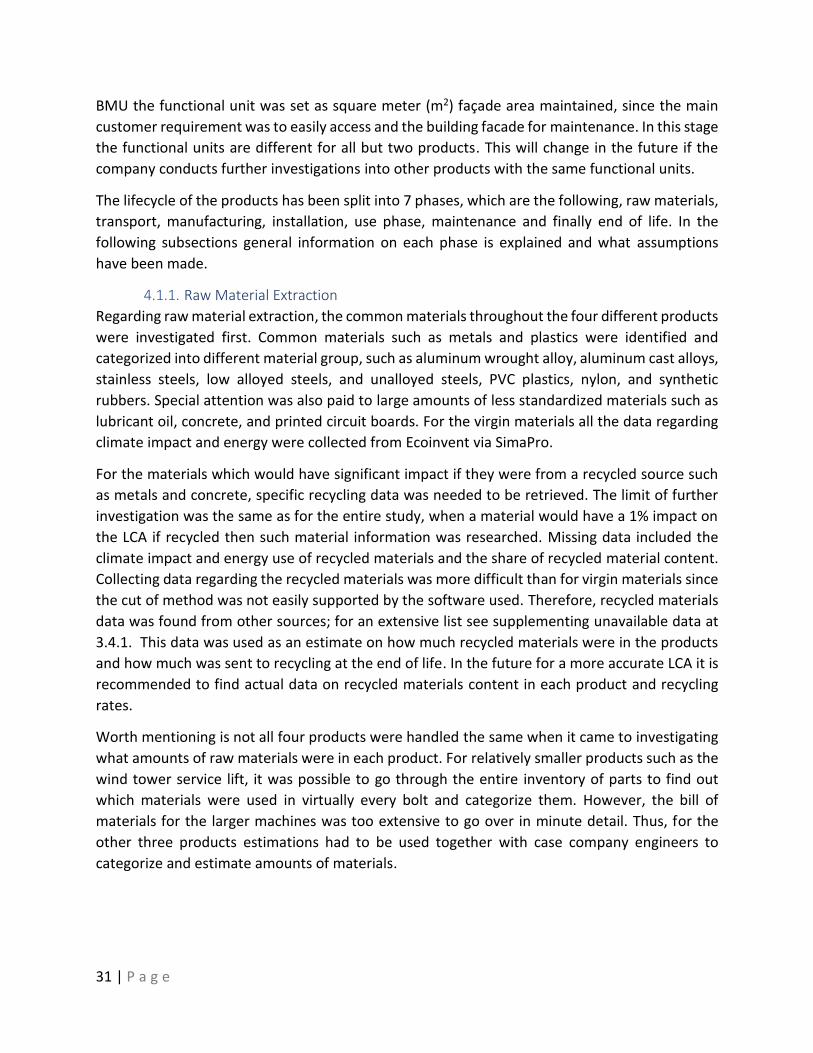
31 | P a g e
BMU the functional unit was set as square meter (m2) façade area maintained, since the main
customer requirement was to easily access and the building facade for maintenance. In this stage
the functional units are different for all but two products. This will change in the future if the
company conducts further investigations into other products with the same functional units.
The lifecycle of the products has been split into 7 phases, which are the following, raw materials,
transport, manufacturing, installation, use phase, maintenance and finally end of life. In the
following subsections general information on each phase is explained and what assumptions
have been made.
4.1.1. Raw Material Extraction
Regarding raw material extraction, the common materials throughout the four different products
were investigated first. Common materials such as metals and plastics were identified and
categorized into different material group, such as aluminum wrought alloy, aluminum cast alloys,
stainless steels, low alloyed steels, and unalloyed steels, PVC plastics, nylon, and synthetic
rubbers. Special attention was also paid to large amounts of less standardized materials such as
lubricant oil, concrete, and printed circuit boards. For the virgin materials all the data regarding
climate impact and energy were collected from Ecoinvent via SimaPro.
For the materials which would have significant impact if they were from a recycled source such
as metals and concrete, specific recycling data was needed to be retrieved. The limit of further
investigation was the same as for the entire study, when a material would have a 1% impact on
the LCA if recycled then such material information was researched. Missing data included the
climate impact and energy use of recycled materials and the share of recycled material content.
Collecting data regarding the recycled materials was more difficult than for virgin materials since
the cut of method was not easily supported by the software used. Therefore, recycled materials
data was found from other sources; for an extensive list see supplementing unavailable data at
3.4.1. This data was used as an estimate on how much recycled materials were in the products
and how much was sent to recycling at the end of life. In the future for a more accurate LCA it is
recommended to find actual data on recycled materials content in each product and recycling
rates.
Worth mentioning is not all four products were handled the same when it came to investigating
what amounts of raw materials were in each product. For relatively smaller products such as the
wind tower service lift, it was possible to go through the entire inventory of parts to find out
which materials were used in virtually every bolt and categorize them. However, the bill of
materials for the larger machines was too extensive to go over in minute detail. Thus, for the
other three products estimations had to be used together with case company engineers to
categorize and estimate amounts of materials.

32 | P a g e
4.1.2. Transport
Transport was a relatively straight forward estimation; climate impact and energy data per tonne-
km in different modes of transport was found via the Ecoinvent database. Then the transport
distances for each product were estimated, both from major suppliers to the
manufacturing/assembly location and to send the final product to the customer location.
4.1.3. Manufacturing
Regarding manufacturing, three things were considered. First, an estimate of all the electricity
used to facilitate manufacturing of the product. This includes all the electricity used on company
premises such as lighting, ventilation, electrical heating, office computers, heavy machinery etc.
This electricity consumption was paired with the national electricity mix data from Ecoinvent or
carbon free energy to estimate climate impact.
Second, if applicable, an estimate of how much fossil fuels were used for heating the premises.
Both the electricity and potential fossil heating where allocated based on total weight of the
product output. An energy and heating per kilogram of product factor could be estimated based
on the output. This estimate was also compared to an estimate based on time spent in
production, both methods produced similar results. The weight estimate chosen since it is easier
to implement in future studies of company products.
Third, an estimate of climate impact and energy use of supplier metal working activities was also
needed. The supplier metalworking estimate is based on EU averages found via SimaPro in the
EcoInvent database and is most likely not exactly representative of the case company’s suppliers,
but it is still likely more accurate than if the supplier metalworking activities were to be ignored.
If this supplier's metalworking activities are a large part of the total climate impact of the product,
it is recommended to find more accurate data on supplier climate impact and energy use.
4.1.4. Installation
The installation process covers activities such as technician travel distance via different modes of
transportation, potential power tool use, and lastly lifting via crane if needed. All activities were
paired with proper national electricity mixes or travel emission data from Ecoinvent.
4.1.5. Use Phase
To estimate the energy consumed during the use phase a simple equation for energy needed for
lifting was used for one lift. Lift equation “work = (mass*gravitational constant* (h1-h2))/time”
this number was subsequently multiplied by a realistic estimate on number of lifts over the
products lifespan with the drive train efficient to estimate electrical kWh use during the use
phase. All the input data such as cradle weight, payload weight, drive system efficiency factor etc
was decided in cooperation with company engineers. In the case of larger more complex
machines other systems such as hydraulics and other motors need to operate the machines were
also estimated with the help of company engineers.
All the electricity consumed in the use phase of the product was paired with the correct country
electricity mixes climate impact. Since this energy use during the use phase is distributed over

33 | P a g e
20-25 years or more, applying today’s climate impact data to future energy use was deemed to
be misrepresenting. Thus, data was collected via the International Energy Agency (IEA, 2021a;
IEA, 2016) and national websites (Commission, 2021; EIA, 2021; Energimyndigheten, 2020; DBEIS,
2020) regarding countries which has set national targets when to decarbonise their energy
systems. The future climate impact was then adjusted assuming said countries would reach their
target linearly. This assumption is not perfect but is better than not adjusting the climate impact;
and advanced future energy system modelling is outside the scope of this study.
4.1.6. Maintenance
Maintenance covers several average estimations over the full lifespan of the product such as
average annual technician travel distance in different modes of transport, average technician
power tool use, average annual spare part transport and average spare parts raw material use,
and supplier manufacturing if needed.
Maintenance also includes the shutdown of the wind turbine for maintenance of the service lift,
which must be done according to law. It was then assumed that the power not produced by the
wind turbine is replaced by the energy mix of the country it is standing in. This assumption is
reasonable since maintenance is planned several months in advance thus it is not possible to
adjust when maintenance is carried out so that it happens in favorable wind conditions. The
climate impact indirectly caused by not producing carbon free energy was adjusted according to
national targets to reach carbon neutral energy systems, just as electricity consumption was in
the use phase.
4.1.7. End of Life
The end-of-life phase handles product disassembly requiring power tool use, possible lowering
the product itself by crane and transport of the product to a recycling center. Once at the
recycling center several assumptions were made concerning what happens to the products. For
each material, a percentage is assumed regarding how much is sent to landfill, how much is
incinerated and how much is recycled. Each of these percentages are based on EU data or
industry branch data on end-of-life product handling (IZA, 2021; EuRIC, 2021; EU, 2021; CRL,
2017; Cordis, 2017; PlasPLUS, 2019; European Commission, 2012; Parliment, 2008).
Potential energy recovery from incineration was not considered due to small amounts of
incinerated materials for all four products.
4.2. Phase 1: LCA Results In this chapter the results of phase 1 are presented via tables and graphs that illustrates how CO2-
eqv emissions and energy use is distributed over separate phases in the product's life cycle.
Furthermore, one can see the results by the different functional units of the four products and
how the case study results of phase 1 were used to guide phase 2 is explained. The more relevant
results for each product will be explained more thoroughly.
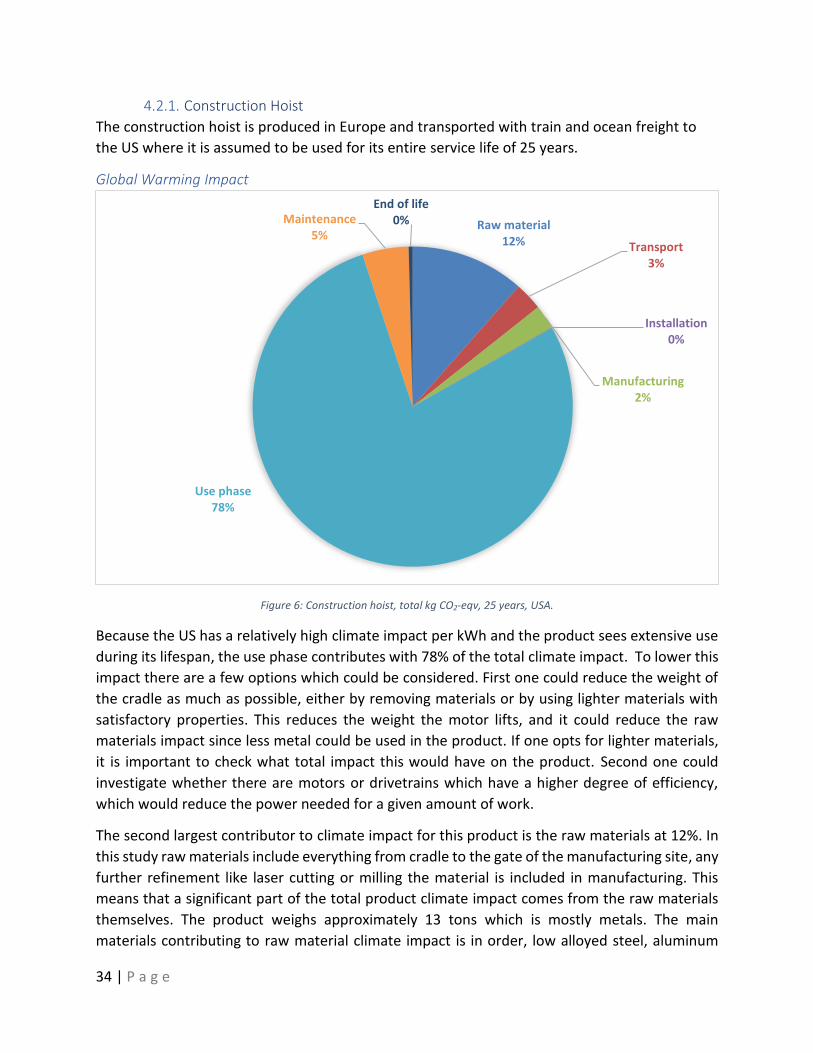
34 | P a g e
4.2.1. Construction Hoist
The construction hoist is produced in Europe and transported with train and ocean freight to
the US where it is assumed to be used for its entire service life of 25 years.
Global Warming Impact
Figure 6: Construction hoist, total kg CO2-eqv, 25 years, USA.
Because the US has a relatively high climate impact per kWh and the product sees extensive use
during its lifespan, the use phase contributes with 78% of the total climate impact. To lower this
impact there are a few options which could be considered. First one could reduce the weight of
the cradle as much as possible, either by removing materials or by using lighter materials with
satisfactory properties. This reduces the weight the motor lifts, and it could reduce the raw
materials impact since less metal could be used in the product. If one opts for lighter materials,
it is important to check what total impact this would have on the product. Second one could
investigate whether there are motors or drivetrains which have a higher degree of efficiency,
which would reduce the power needed for a given amount of work.
The second largest contributor to climate impact for this product is the raw materials at 12%. In
this study raw materials include everything from cradle to the gate of the manufacturing site, any
further refinement like laser cutting or milling the material is included in manufacturing. This
means that a significant part of the total product climate impact comes from the raw materials
themselves. The product weighs approximately 13 tons which is mostly metals. The main
materials contributing to raw material climate impact is in order, low alloyed steel, aluminum
Raw material12% Transport
3%
Manufacturing2%
Installation0%
Use phase78%
Maintenance5%
End of life0%

35 | P a g e
wrought alloy, stainless steel, recycled low alloyed steel, copper, and control unit electronics.
Metal production requires quite a large amount of energy, especially if it comes from primary
sources. Therefore, one way to lower the environmental impact of this product could be to
increase the recycled material content. This is especially impactful for high climate impact metals
such as wrought aluminum alloy. Another way could be to reduce the amount of material used
in the product. If the case company engineers could find ways of reducing the amount of metal
used whilst still retaining the same safety features, it would reduce climate impact and energy
use.
Third largest contributing phase for the construction hoist is maintenance with 5% of total
climate impact. Maintenance climate impact is quite closely split into three relatively evenly
contributing factors, which are spare parts raw material use, transport of said materials and
transport of a technician to site. To lower this, one could investigate lowering the amount of
spare parts by making them more durable, shipping can be altered to favor ocean freight over air
freight, and lastly change technician travel distance.
Of the remaining life cycle phases transport has 3% of total climate impact. Here it could be worth
looking into what type of transport is commonly used. Currently transport is often done via truck
and shipping, but wherever electrified rail is an option prioritizing it would lead to lower climate
impact. The last three phases end of life, manufacturing, and installation all have a 2% or lower
impact, this is due to high recycling rates of metals, carbon free electricity used in manufacturing
and low power draw of tools used during installation and minimal impact of personnel travel.
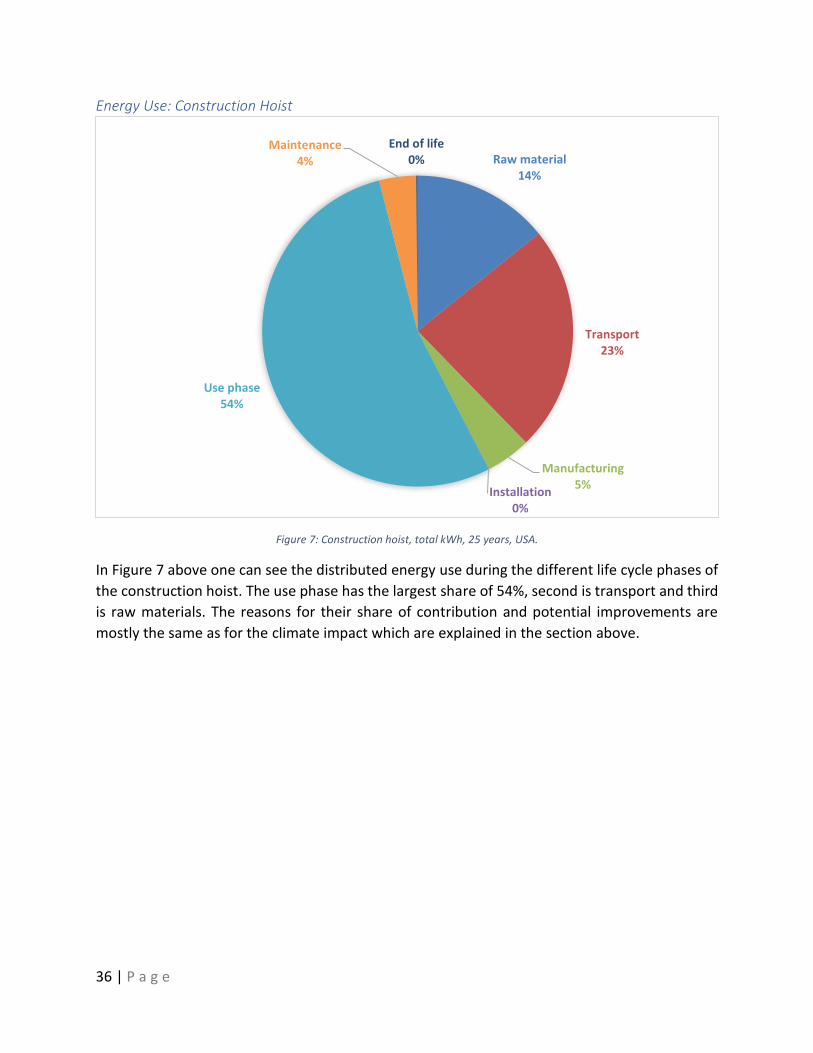
36 | P a g e
Energy Use: Construction Hoist
Figure 7: Construction hoist, total kWh, 25 years, USA.
In Figure 7 above one can see the distributed energy use during the different life cycle phases of
the construction hoist. The use phase has the largest share of 54%, second is transport and third
is raw materials. The reasons for their share of contribution and potential improvements are
mostly the same as for the climate impact which are explained in the section above.
Raw material14%
Transport23%
Manufacturing5%
Installation0%
Use phase54%
Maintenance4%
End of life0%

37 | P a g e
4.2.2. Industrial elevator
The industrial elevator is produced in Europe and transported with train and ocean freight to
the US where it is assumed to be used for its entire service life of 25 years.
Global Warming Impact: Industrial Elevator
Figure 8: Industrial elevator, total kg CO2-eqv, 25 years, USA.
Raw materials represent 42% of the climate impact for the industrial elevator. As with the
construction hoist, the raw material climate impact is mainly due to metal use, which is in
descending order of magnitude, aluminum wrought alloy, low alloyed steel, stainless steel,
copper, and recycled low alloyed steel. This impact could be reduced in a similar manner as
suggested for the construction hoist which is either reducing the amount of different metals in
the product by making smart material reductions. The climate and energy impact can also be
reduced by increasing the amounts of recycled materials in the products.
Maintenance represents 26% and this is split fairly evenly between three parts which are spare
parts raw material use, transport of said materials and transport of a technician to site. To lower
this impact, one could investigate to lower the amount of spare parts by making them more
durable, if possible, shipping can be altered to favor ocean freight over air freight, change in
technician mode of transport to one with a lower climate impact, lastly technician travel distance
by placing their office closer to the installed operating fleet.
In the use phase, 20% share of total kg CO2-eqv would rise if the elevator were used more
frequently than currently assumed. First, to reduce this impact, one could first investigate a
Raw material42%
Transport3%Manufacturing
8%Installation
0%
Use phase20%
Maintenance26%
End of life1%

38 | P a g e
potential cradle weight reduction. This would reduce the weight the motor has to lift, and it
would reduce raw material impact. Second, one could investigate whether there are more
efficient motors or drivetrains which have a higher degree of efficiency which would reduce the
power draw need for a certain amount of lift.
Manufacturing is fourth at 8%, the reason this is higher than the construction hoist is due to more
materials included in the supplier manufacturing estimate. Since the manufacturing impact is not
that large this is not of importance here, however it would be sensible to check this data with
suppliers and if still relevant discuss with them regarding potential improvements.
The remaining three phases are similar to the construction hoist. Transport, end of life, and
installation has 3% or less of the total climate impact. This is due to relatively short transport
distances with trucks and long-distance ocean freight, high recycling rates of metals, and low
power draw of tools used during installation.
Energy Use: Industrial Elevator
Figure 9: Industrial elevator, Total kWh, 25 years, Sweden
Energy use for the industrial elevator has a slightly different distribution than the climate impact,
here raw material and transport becomes more important, the causes and potential
improvements are similar to the climate impact. What differs for the raw materials energy could
be impacted by reducing the number of metals such as wrought aluminum alloy as well as
electronics, both of which require large amounts of energy to produce. Regarding transport one
could change truck transport to more energy efficient rail freight when possible. The remaining
Raw material40%
Transport20%
Manufacturing12%
Installation0%
Use phase11%
Maintenance17%
End of life0%

39 | P a g e
phases either have the same potential improvements as for climate impact or have less than 1%
of total energy use and is therefore not of interest.
4.2.3. BMU
The building maintenance unit is produced in Europe and transported with train and ocean
freight to the US where it is assumed to be used for its entire service life of 25 years.
Global Warming Impact
Figure 10: BMU, total kg CO2-eqv, 25 years, Hong Kong.
First the 29% impact of raw materials is due to the substantial amount of different metals in the
product which weighs approximately 88 tons. In descending order, the metals with the largest
impacts are unalloyed steel, recycled un-alloyed steel, aluminum wrought alloy and copper. For
the BMU the raw materials also heavily impact the subsequent phases such as manufacturing
and transport. Manufacturing is always affected when more material must be processed.
Transport especially increases in the investigated Hong Kong case, when a heavy product must
be transported over long distances. Therefore, to reduce the kg CO2-eqv by reducing the number
of raw materials used in the product since significant reductions here would have a knock-on
effect in other life phases. This could be dealt with by making calculated decisions to remove
unnecessary metals. The climate impact can also be further reduced by increasing the amounts
of recycled materials in the product; however, this would not affect the other life phases.
Raw material29%
Transport18%
Manufacturing24%
Installation0%
Use phase1%
Maintenance25%
End of life3%

40 | P a g e
Second manufacturing with 24% of total climate impact. In this investigation manufacturing
includes both the climate impact of the BMU division and an estimate of how large climate impact
effect the supplier’s metalworking activities cause. Since this division order a lot of the parts from
suppliers for assembly only, the supplier estimate represents almost the full 24% of
manufacturing climate impact. This estimate is based on EU average climate impact for metal
working activities and is not necessarily representative of the BMU divisions suppliers. Even so
this shows that it is needed to thoroughly map supplier climate impact estimates and to work
with suppliers on what can be done to address potentially high climate impact.
Product maintenance with a contribution of 25% to total kg CO2-eqv for the BMU has three parts
causing most of the climate impact. These are in descending order, spare parts transport, spare
part raw materials use, and supplier manufacturing estimate for spare parts. The largest
reduction which can be made at the maintenance section is to change which mode of transport
which is used. Currently it is a mix of air freight carrying approximately 60% of the spare parts to
customers, and ocean freight carrying the remaining 40%. Other improvements which could be
made include, investigating if wearable parts could be made in different more durable materials.
Furthermore, one could investigate if the mechanism where parts wear the quickest could be
replaced with a less strenuous alternative.
Transport representing 18% of the total climate impact is due to the sheer weight of the product
as well as the large distance between the manufacturing site and Hong Kong. Improvements to
be made besides lowering the weight of the product one could also consider what modes of
transport are used. Especially, important in this case is regarding land-based transport, the larger
part which can be done by electrified energy efficient rail rather than truck the better.
The remaining three phases have less than 3% of total emissions and is therefore not of interest.

41 | P a g e
Energy Use
Figure 11: BMU, total kWh, 25-year, Hong Kong.
Regarding the BMU energy use, transport is the largest at 44%, manufacturing second at 25%,
raw material at 15% and maintenance at 12%. A lot of fuel is consumed during the transport of
the product which can be addressed similarly as previously discussed, by lowering the product
weight or choosing energy efficient transport options.
Regarding manufacturing at 30%, since a lot of the metalworking is done outside of the division
most of this energy use originates from the assumption that the suppliers are close to EU metal
working averages. This might be wrong and should be investigated further; if it persists as a
relevant phase, one can work with the supplier to address the issue.
Raw material energy use at 14% is mainly due to the same material mentioned in the climate
impact section. Which is in descending order, un-alloyed steel, recycled un-alloyed steel wrought
aluminum alloy and printed circuit boards. To reduce the energy use of raw material one should
investigate where on the product material reduction is possible and changing energy intensive
materials to less energy intensive materials.
Raw material15%
Transport48%
Manufacturing25%
Installation0%
Use phase0%
Maintenance12%
End of life0%

42 | P a g e
4.2.4. Wind Tower Service Lift
The wind tower service lift is produced in Europe and transported by train to the Spain where is
assumed to be used for its entire service life of 20 years.
Global Warming Impact
Figure 12: Wind Turbine Service lift, total kg CO2-eqv, 20 years, Spain.
The reason the maintenance is such a dominant phase is because, during maintenance of the
service lift the wind turbine must be shutdown. It is illegal to keep the turbine operating during
maintenance. Therefore, it was assumed that whilst the wind turbine is turned off it must be
replaced with Spanish energy mix electricity. This turbine shutdown during lift maintenance has
a major importance throughout the product life cycle. To remedy this one can, investigate if
maintenance can be done faster or less often via some form of remote monitoring or use of smart
sensors to minimize down time. If maintenance can be done in low wind conditions, it would also
be favorable since the wind turbine would not produce much power even if turned on.
Second largest is raw materials, where the main contributors are aluminum wrought alloy and
stainless steel. To potentially lower the climate impact of the raw material one could use a higher
percentage of recycled materials or investigate potential material swaps. For example, it could
be beneficial to replace wrought aluminum alloy with stainless steel which is also a corrosion
resistant metal with a lower carbon intensity. This could increase the weight of the elevator which
Raw material14%
Transport1%
Manufacturing3%
Installation0%
Use phase0%
Maintenance82%
End of life0%

43 | P a g e
would in turn increase energy use during the use phase. However, since the lift is not used very
often and when used it runs on green power produced by the wind tower it could be beneficial
from a climate impact point of view.
Third is manufacturing at 3% of total climate impact, most of which is from the EU metal working
averages gathered from Ecoinvent. This could be investigated whether the suppliers are above
or below the EU average, but it is not as important for this product as for some other products
investigated.
The remaining life phases each have three percent or less of the total climate impact and is thus
not of great interest.
Energy Use
Figure 13: Wind turbine Service lift, Total kWh, 20 years, Spain.
Maintenance has a dominant share of 77% of total energy use the reason is the same as for the
climate impact. The wind turbine needs to be shut down during the maintenance period of the
lift, resulting in lost energy production. The potential solutions to remedy this are the same as in
the CO2-eqv section.
Raw material at 15% is also the same. Most of the energy use comes from primary metal
production such as wrought aluminum alloy, stainless steel, and low alloyed steel. To remedy this
Raw material15%
Transport2%
Manufacturing6%
Installation0%
Use phase0%
Maintenance77%
End of life0%

44 | P a g e
energy use one could investigate reducing the amount of material used or changing to recycled
materials which often consume less energy to produce.
Manufacturing representing 6% of total energy use is mostly due to the supplier’s energy use via
the EU average metal working estimate. It should be investigated whether the suppliers are close
to this estimate. It can be valuable to discuss and work with suppliers regarding different
improvements which could be made.
The remaining phases each have two percent or less of the total climate impact and is thus not
of great interest.
4.3. Phase 2: Finding and Evaluating Improvement Suggestions In this section of the report results of the structured workshops are presented. The workshops
focused on aspects which are specific for each product, such as customer and legal requirements,
what is valued by the customer, and current product and service design parameters. The LCA
results from phase one was used to guide the workshop to relevant areas of discussion. After
each workshop, the most feasible improvements were investigated from a lifecycle perspective
to estimate to what extent kg CO2-eqv and energy use could be reduced. Summaries of each
workshop can be found in Appendix B; this section will focus on the more impactful improvement
suggestions for each product. Note that implementing all suggestions for a product result in
certain overlap and is therefore not equal to the sum of all suggestions. There are multiple
overlaps which occurs; one example is remanufacturing and using recycled materials.
Remanufacturing a unit would require less new material to be purchased. Subsequently since
less new material is purchased the measure to increase recycled materials in the unit instead of
virgin material has a lower impact. Another example is a lifespan extension which can create
multiple overlaps. One is an increased need for spare parts which would increases the impact of
a change to of prioritize ocean freight over air freight for spare parts.

45 | P a g e
4.3.1. Construction Hoist and Industrial Elevator- Life Cycle Improvement Suggestions Table 4: A summarized view of the improvement suggestions found feasible for the Construction hoist in the phase two construction and industrial workshop, and their potential effects on the product's total kg CO2-eqv and total energy use.
Investigated Improvement suggestions
Reduction in kg CO2-eqv Reduction in kWh use
Materials and use phase change: Cradle/base unit weight reduction by 40%
20,0% 14,5%
Maintenance change: Increase Ocean freight spare part delivery to 90%
2,3% 0,5%
Material change: Increase the share of recycled low alloyed steel and wrought aluminum alloy to 100%
4,1% 4,1%
Remanufacturing: 80% of low alloyed steel, 5%
wrought aluminum alloy, and 5% of stainless steel can be reused
4,7% 5,5%
Life span extension: From 25 to 40 years, requires diligent maintenance.
6,5% 16,0%
Implementing all Improvement suggestions:
31,7% 34,4%

46 | P a g e
Table 5: A summarized view of the improvement suggestions found feasible for the industrial elevator in the phase two construction and industrial workshop, and their potential effects on the product's total kg CO2-eqv and total energy use.
Investigated Improvement suggestions
Reduction in kg CO2-eqv Reduction in kWh use
Materials and use phase change: Cradle/base unit weight reduction by 40%
6,3% 5,5%
Maintenance change: Increase Ocean freight spare part delivery to 90%
7,8% 2,7%
Material change: Increase the share of recycled low alloyed steel and wrought aluminum alloy to 100%
15,8% 11,1%
Remanufacturing: 70% of low alloyed steel, 10% of wrought aluminum alloy, and 5% of the stainless steel can be reused
11,8% 9,2%
Life span extension: From 25 to 40 years
20,2% 27,0%
Implementing all Improvement suggestions:
48,0% 43,3%
As seen in Table 4 and Table 5 there are a range of improvements which were deemed feasible
by the engineers which were shared between the construction hoist and with the industrial
elevator. However, the impact the improvement suggestion had of course differed to what
extent can be seen in the respective tables.
First investigated improvement suggestion was a change in materials from steel to wrought
aluminum in the cradle/ base unit of the product. This weight reduction improves the weight of
the payload relative to the cradle and leads to a reduction of wasteful lifting work. Such a change
would be technically challenging but given the workhorse nature of the construction hoist it
would be valuable. The change would not impact the industrial elevator to the same extent since
it is not used as frequently nor lift as heavy loads. Another feasible improvement regarding
materials was increasing the share of recycled low alloyed steel and wrought aluminum alloy to
100%. This change would have a positive effect on both units and be relatively simple to execute;
however, the company must investigate the cost.
Two improvements regarding maintenance were investigated. The first was a change regarding
the transport of spare parts, where ocean freight would have an increased share of 90% and air
freight would be reduced to 10%. There are also logistical challenges to this since more

47 | P a g e
warehouses would have to be used to store spare parts in a global network where they can reach
customers in a timely manner. The second maintenance change was connected to a lifespan
extension, it was estimated that both products could have a 15-year increased lifespan if diligent
maintenance were carried out for the entire extended lifespan. This would, according to case
company engineers, not degrade the efficiency of the products since they are designed to run for
a long time. However, customers would have to be convinced to maintain their product better
than what is currently done. This could be difficult to achieve for the company since the customer
contact currently differs greatly between each customer. Some units are sold with extensive
maintenance contracts however other units are sold with no further contact with the customer.
To reach those customers one would have to convince them of the benefits of extensive
maintenance plans.
The last improvement suggestion investigated was remanufacturing a construction hoist or
industrial elevator. It was estimated by the engineers that depending on the product
approximately 70-80% of low alloyed steel could be reused, 5-10% of wrought aluminum alloy
and 5% of stainless steel. This improvement would require a robust reverse logistical solution
which could bring older units back to the company at the end of their life span. Regarding
remanufacturing the company has some experience with it and issues were brought up during
the workshops. In their case the remanufactured product ended up costing about the same to a
new model, therefore it was difficult to convince customers to purchase them.

48 | P a g e
4.3.2. BMU - Life Cycle Improvement Suggestions Table 6: A summarized view of the improvement suggestions found feasible in the phase two BMU workshop, and their potential effects on the product's total kg CO2-eqv and total energy use.
Investigated Improvement
suggestions
Reduction in kg CO2-eqv Reduction in kWh use
Transport change:
Manufacturing
Counterweight closer to the
end customer.
1,9% 10,6%
Transport change:
Prioritizing rail transport
reducing truck use from
suppliers from 100% to 40%
of deliveries by weight.
5,1% 6,3%
Material selection change:
Increase the share of
recycled materials, un-
alloyed steel from 31% to
100%.
18,3% 10,3%
Material change: Reduce the
amount of un-alloyed steel
by 15%.
10,0% 10,0%
BMU remanufacturing
pessimistic: Assuming 30% of
metals to be reusable.
20,0% -3,3%
BMU remanufacturing
probable: Assuming 70% of
metals to be reusable.
54,9% 39,2%
Implementing all
Improvement suggestions:
Assuming 70% of metals to
be reusable materials.
67,9% 69,0%
As seen in Table 6, Five possible improvement suggestions were investigated for the BMU which
showed between 1,9% to 54,9% reduction in total kg CO2-eqv emissions and between -3,3% to
39,2% reduction in energy use.

49 | P a g e
The most impactful transport improvement was prioritizing train freight over truck. If rail freight
carries a 60% share of the total tonne-km from supplier to factory, total climate impact can be
reduced by 5,5% and total energy use by 6,8%. Second investigated transport change was
manufacturing simple components like concrete blocks closer to the customer, this would reduce
climate impact by 1,9% and energy use by 10,6%. Both these transport improvements should be
implemented; however, the company needs to investigate further to establish which
components can be manufactured closer to the customer's location and which components can
change to rail transport.
Two improvement suggestions regarding material were also investigated. First, increasing the
share of recycled un-alloyed steel from 31% to 100%. This change would reduce total kg CO2-eqv
by 16,9% and total energy use by 10%. Second material change was to reduce the amount of un-
alloyed steel in the product by 15%. This change would reduce the total climate impact by 11,2%
and total energy use by 11,3%. Such a reduction is of course beneficial; however, the engineers
would first have to acquire more accurate use data of the products. If more accurate use data is
obtained one could in a calculated way remove material whilst remaining within the safety
margins.
The last improvement suggestion was remanufacturing of the BMU. Here it was assumed that
the BMU was shipped from the customer back to the BMU division, disassembled restored and
returned to the customer. The most impactful scenario where 70% of metals could be reused
total kg CO2-eqv was reduced by 54,9% and total energy use by 39,2%. This is by far the largest
reduction for this product.
If all changes were implemented both transport changes, both material changes, and
remanufacturing with 70% of metals reusable, then climate impact can be reduced by 67,9% and
energy use by 69%. This is incredibly significant regarding both emission and energy.

50 | P a g e
4.3.3. Wind Tower Service Lift - Life Cycle Improvement Suggestions Table 7: A summarized view of the improvement suggestions found feasible in the phase two wind tower service lift workshop, and their potential effects on the product's total kg CO2-eqv and total energy use.
Investigated Improvement
suggestions
Reduction in kg CO2-eqv Reduction in kWh use
Maintenance change:
Maintenance time reduced
form 2,5h to 2h
15,5% 14,8%
Maintenance change:
Maintenance time reduced
form 2,5h to 1,66h
26 % 24,9%
Maintenance change:
Maintenance time reduced
form 2,5h to 1h
46,5% 44,5%
Lifespan extension: From 20
to 30 years, requiring major
renovation, cables, gearbox
and more replaced. 30%
increased raw material use.
5% 5,5%
Material change: Increase
recycled wrought aluminum
alloy from 12% to 100%
8,2% 5%
Implementing all
Improvement suggestions:
assuming 1h maintenance
time.
57% 53,3%
As seen in Table 7, three distinct improvement suggestions were investigated. The first and most
impactful potential improvement was the reduction of maintenance time. This is because each
time the lift is undergoing maintenance the wind turbine must be turned off for the duration of
the maintenance, approximately two hours and thirty minutes. Via information acquired during
the workshop, three likely scenarios were investigated where maintenance could be reduced.
First via optimized maintenance plans to two hours or even one hour and forty minutes. Further
reduction would require the use of active monitoring and smart sensors and it was estimated by
engineers that through such measures the maintenance time could be reduced to one hour. This
change would have a profound effect. For each half hour maintenance time is reduced total kg

51 | P a g e
CO2-eqv was lowered by approximately 15,5% and the energy use was reduced by 14,8%. Thus,
if the maintenance time is reduced to 1h the total kg CO2-eqv is reduced by 46,5% and total
energy use is reduced by 44,5%.
Second a service life extension from 20 to 30 years was also investigated. It was assumed that
such a service life extension would require an extensive overhaul around the 20 years mark
requiring components such as cables gearboxes and electrical components to be replaced. This
resulted in a 30% increase in the material use. For this comparison it was assumed these parts
would have the same climate impact as today’s material, which is a pessimistic estimation. The
service life extension resulted in a 5,5% reduction of total kg CO2-eqv and 5,9% reduction in total
energy use. The last investigated improvement suggestion was a material selection change,
where the share of recycled wrought aluminum alloy was increased from 12% to 100%. This
change would result in an 8% reduction in total kg CO2-eqv and 4,8% reduction in total energy
use.
If all improvement suggestions are implemented there is little diminishing returns since the three
improvement suggestions have limited overlap. The total kg CO2-eqv would be reduced by 57%
and the total energy use would be reduced by 53,3%. Lowering the maintenance time is of high
economic priority for the company and is likely to be implemented regardless of climate
performance. However, the lifespan extension and the increased use of recycled materials should
be further investigated for economic feasibility and customer interest.
In this case study an PSS barrier, unique for the service lift, was in the lack of contact with the
end consumer. This caused their design focus to be split into two different objectives which do
not necessarily align, the purchase cost and total cost of ownership. The purchase cost had to be
low for the tower builder to buy the lift however the wind park operator wanted maintenance
time and cost to be as low as possible. It would be strongly beneficial if this division could forge
stronger connection with the wind park operators rather than the wind tower manufacturer.

52 | P a g e
5. Discussions and Conclusion
5.1. Answers to the research questions Based on the results obtained from this study the conclusions are framed by answering each of
the research questions. Followed by suggestions for future studies.
RQ1: What influences the climate impact and energy use of the investigated products?
Of the four investigated VAE products, what influenced the climate impact and energy use varied
widely depending on their design, location, frequency of use etc.
• Regarding the construction hoist the use phase of the product was dominant with 78% of
the share of the kg CO2-eqv and 54% of the energy use.
• For the industrial elevator raw materials had the largest impact at 42% share of the kg
CO2-eqv followed by maintenance at 26% and use phase at 20%. The industrial elevator
had similar distribution for energy use with raw materials at 40%, maintenance at 17%
and use phase is replaced by transport at 20%.
• For the BMU the four phases which had major climate impact, raw materials at 29%,
maintenance at 25%, manufacturing at 24%, and transport at 18%. Regarding energy use
of the BMU the distribution looks differently, transport is the largest at 44%,
manufacturing second at 25%, raw material at 15% and maintenance at 12%.
• Lastly for the wind tower service lift maintenance had the lion’s share of climate impact
and energy at 82% and 77% respectively.
It is clear to see that the product design, location, frequency of use etc. can have a great impact
on the total climate impact and energy use. The construction hoist frequent use makes the use
phase dominant. For the wind tower service lift the turbine shutdown requirement during
maintenance has a clear majority in both categories. Whilst for the remaining two products it is
more mixed.
RQ2: How can product service design be used to address the effect on global warming impact
and energy use of the products?
As the cause of climate impact and energy use differs for each product, the most effective design
suggestions also differ.
• Regarding improvement of the construction hoist suggestions aimed towards higher
operating efficiency during lifting work should be prioritized. Potential improvements
include lowering the weight of the cradle compared to the payload, or more efficient
motor or drive train.
• For the industrial elevator suggestions which reduce the impact of the material relative
to the machines use is most important. As such changing the material types to less
impactful ones, remanufacturing or lifespan extension is of highest priority.

53 | P a g e
• For the BMU it’s large use of materials is of most importance. As such large-scale
remanufacturing is the most promising improvement area as this would extend the use
of the materials. Other actions such as reducing the amount of material or changing types
also have an impact.
• Lastly the wind tower service lift. Because the wind turbine needs to shut down during
the maintenance of the lift, measures which reduce the maintenance time is most
important. Optimized maintenance plans, the use of sensor, and active monitoring is of
great importance.
It is very important to investigate each product to construct effective design improvements as
even though their purpose is similar, the products unique circumstances greatly impact their life
cycle. It is clear the product design and service design can greatly influence the climate impact
and energy use over the product's entire life span.
5.2. Discussion
5.2.1. Life Cycle Assessment
The LCA study was conducted in a sequential manner according to life cycles stages of the product
structured with SAIC (2006) as reference. The study method is based around a cradle to grave
LCA with data inputs coming mainly from the company itself, Ecoinvent via SimaPro, research
papers, specific industry organizations and EU papers. The method can be used to estimate a
product's impact and is quite extensive and fit for the purpose of this study. Furthermore, a
template which the case company can use to evaluate other products in the company portfolio
was created in the process of this thesis. Therefore, the method presented is repeatable and can
easily be generalized to a larger group of similar products. However, access to the excel template
and the Ecoinvent Database is a prerequisite for simple replication.
As stated by ISO 14040:2006 in (Cluzel, et al., 2013) the functional unit must quantify the product
system’s performance. In addition, the ILCD Handbook (2010) states that a functional unit should
be able to address the “what”, “how much”, “how well”, and for “how long”. The functional units
selected for this study were all adapted according to these guidelines, and they reflect the
function of these products well. However, if in the future one wishes to investigate more
products, one could need to modify these to include more qualitative aspects better tied to
consumer demands. As these functional units were set by the authors with little input from the
company and potential end users.
The system boundary of this study was from cradle to grave, from the extraction of raw materials
to the end of life as defined by the ILCD Handbook (2010). However, the focus was limited to the
product and ignored certain fixtures built by a third parties, as such certain parts which are
necessary for the products to function have not been considered. This is mostly the case for the
BMU and the wind tower service lift. To make the LCA results more accurate the fixtures need to
be investigated.

54 | P a g e
The quality of an LCA study is deeply connected to the quality of data gathered (ILCD Handbook,
2010). Data gaps leads to assumptions which in turn lead to uncertainty in the results, which
ultimately creates uncertain estimates of the improvement suggestions and their impact. A major
part of the data which was used originates from the Ecoinvent database and the case company.
Specific product data only originates from the divisions of the case company, and data accuracy
is in their interest. Complimentary data was found in research papers, industry organizations or
official EU documents. All the sources of data have been deemed trustworthy and would not
have been selected otherwise. However, there is one potential weakness in the strong reliance
on Ecoinvent. Ecoinvent is a non-profit association created to support the availability of
environmental data. The Ecoinvent association therefore creates and maintains the Ecoinvent
database to aid people and organizations to make truly informed decisions regarding the
Lifecycle impact (EcoInvent, 2021). The simple quantification of climate impact and energy use
was an important factor to establish a baseline in a timely manner. However, most Ecoinvent
data is based on industry averages, either global or regional. This is adequate as long as the
processes materials and suppliers are relatively close to the averages, but if the company uses a
supplier which is far from the average in critical areas it could have a great impact on the results.
For example, the supplier manufacturing estimate was entirely from an outside source and not
tied to the company or supplier data. To conduct a more complete but much more time-
consuming study, accurate data should be gathered from each supplier and process.
Furthermore, chosen non Ecoinvent data sets could have been calculated or estimated in
different ways due to lack of LCA standardization. This is especially the case regarding recycled
materials, which is an overly complex topic in LCA. Many different assumptions can be made
regarding how to allocate climate impact or energy use depending on the type of recycling
system. Therefore, the recycled materials data collected from outside Ecoinvent might be
different from the method Ecoinvent commonly uses to allocate climate impact. Precautions
were taken by checking multiple sources for the recycled materials data, for all cases multiple
sources were found which reported similar numbers.
5.2.2. Life Cycle and PSS Design
This study investigated four products all of which were pieces of VAE from three divisions in the
same conglomerate. The results show that product service design can greatly affect their life
cycle climate impact and energy use. However, what design changes were feasible and what
impact the changes had strongly differs depending on the product. It was also noted that PSS as
a whole was a challenge for the company, and it would require rather substantial changes to its
structure. However, each division expressed clear interest in distinct parts of PSS.
Predictive maintenance and active monitoring were of interest for all the divisions, who wanted
to use the tools to improve their services further. Especially for the BMU and the Wind tower
service lift. For the BMU it could be of great interest to gather real world use data to see if they
can reduce material use by being closer to certain safety standards. This is in line with
55 | P a g e
Matschewsky (2019b) which postulates that effective data collection and use from the products
lifecycle is a critical aspect in determining the potential areas of improvement. Predictive
maintenance and sensors can be used to decrease maintenance times where the product must
otherwise be shut down. This was of critical importance for the wind tower service lift, which was
similarly described by Landpoint (2018). Material selection was also of importance for all
products, in this case mostly surrounding the use of recycled materials or if possible alternate
materials, where in most cases transitioning to recycled metals was most viable. How the
company should go forward and select materials in the future could be as described by Mayyas
and Omar (2020).
Furthermore, remanufacturing was deemed a feasible way to reduce climate impact and energy
use, as it had a positive effect for three of the products and especially for the BMU. However
more steps should be taken to truly make remanufacturing efficient. For example, one of the
divisions had remanufactured units with a similar cost as a new unit. This is an indication of design
which has not been adapted for remanufacturing. To improve the company could implement
more parts of PSS. Improvements to product design should ease remanufacturing, maintenance,
and is very feasible as presented with three examples by Sundin et al (2009). It can also be noted
that the current business model of all the divisions were traditional sales models. This is not
advised since PSS requires clear and structured contracts around the product (Reim, et al., 2015;
Azarenko, et al., 2009; Tukker, 2015). Remanufacturing and its implementation would likely be
made easier by changing the business model and increasing contact between the different
departments such as sales, product design, manufacturing and maintenance as advised by
Matchewsky (2019a). Furthermore, it was noted that some divisions are selling remanufactured
units under a traditional sales model, which Sundin et al (2005) and Isaksson et al (2009) noted
was inefficient and not advised.
Regarding design to reduce resource consumption during the use phase this study found similar
notions like Shu et al (2017) that designing to improve efficiency gains is effective. However for
the specific products investigated lifts, hoists, BMU, and elevators there seemed to be of little
need to influence the behavior of the people using the product like suggested by Shu et al (2017)
and Kurisu (2015). This is because the products are most likely used for the intended purpose to
begin with, vertical transport, and is unlikely to be used in an inefficient manner due to mostly
automatic control of the lift systems.
In this case study an issue and barrier for PSS was found in for the Wind tower service lift. The
division making the lift was often not in direct contact with the end consumer. This caused their
focus to be split on two different objectives which do not necessarily align, purchase cost of the
product and total cost of ownership. The purchase cost had to be low for the tower builder to
buy the lift, however, the wind park operator wanted maintenance time and cost of ownership
to be as low as possible. It would be strongly beneficial if this division could forge a stronger
connection with the wind park operators rather than the wind tower manufacturer for a PSS
point of view.

56 | P a g e
5.3. Concluding Remarks The objective of this study was to understand and provide improvement suggestions for the
environmental performance and energy use of Vertical Access equipment (VAE). This Involved a
case study where a LCA was conducted to establish a baseline for four VAE products, a
construction hoist, a service lift, an industrial elevator, and a BMU. The results of the initial LCA
varied greatly depending on the different products and their use case. For the construction hoist,
the use phase had the greatest impact, and for the service lift it was maintenance. For the
industrial elevator and the BMU materials, manufacturing, transport, and maintenance were
significant.
Guided by the LCA results semi-structured workshops were held to find feasible improvement
suggestions whose impacts were investigated using LCA once more. Feasible and substantial
improvements were found for all products which focused on areas with the highest impact. For
the construction hoist improvements regarding eliminating waste in the lifting work was most
impactful, whilst the service lift required optimizing of maintenance and use of sensors to reduce
the maintenance time. For the industrial elevator and the BMU, measures which focused on
reducing virgin material extraction showed most promise, such as lifespan extension,
remanufacturing, and use of recycled materials.
Due to the many similarities between our case and literature written on the topic of PSS as far
back as 2002, this study can be seen as confirming previous knowledge regarding life cycle and
PSS design. It is highly likely that the results are applicable in more manufacturing companies as
well. However, it is also clear from theory and the results, that one must investigate each
products circumstance separately to make sure one does not miss vital pieces of information
which could influence the life cycle perspective.
This work had its limitations regarding scope especially investigating the feasibility of the
different improvement solutions. This thesis focused on the technical feasibility; however,
economic, and social feasibility were not investigated. During the study it was observed that
many of the environmental assessment tools such as ELCC, MFA or CBA can be integrated with
LCA to investigate economic or social impact. Integration of LCA with other tools should help
address the social and economic limitations of this study and open further grounds of research
in addressing the limitations of LCA. Future studies should aim to assess the economic and social
feasibility of these or similar improvement suggestions.

57 | P a g e
6. Bibliography Andersson, K., Brynolf, S., Lindgren, J. F. & Bien, M. W., 2016. Shipping and the Environment:
Improving Enironmental Performance in Marine transportation. Sweden: Springer. DOI:
10.1007/978-3-662-49045-7.
Ashby, M. F., 2005. Material Selection in Mechanical Design- 3rd edition. ISBN: 9780080468648
ed. s.l.:Butterworth-Heinemann.
Azarenko, A., Roy, R., Shehab, E. & Tiwari, A., 2009. Technical product-service systems: some
implications for the machine tool industry. JOURNAL OF MANUFACTURING TECHNOLOGY
MANAGEMENT, Volume 20, pp. 700-722. DOI: 10.1108/17410380910961064.
Barquet, A. P., Rozenfeld, H. & Forcellini, F. A., 2013. An integrated approach to
remanufacturing: model of a remanufacturing system. [Online]
Available at: https://doi.org/10.1186/2210-4690-3-1
Bjorke, S. a. A. M., 2011. The Greenhouse effect, Climate chaneg and the road to sustainability,
CDS. [Online]
Available at: http://grimstad.hia.no/puls/climatechange/
[Accessed 15 08 2021].
Brundtland, G. H., 1987. Report of the World Comissions on environment and development: Our
Common Future. [Online]
Available at: http://www.un-documents.net/wced-ocf.htm
[Accessed 20 4 2021].
Cepi, 2019. Key Statistics - European pulp & paper industry. [Online]
Available at: https://www.cepi.org/wp-content/uploads/2020/07/Final-Key-Statistics-2019.pdf
[Accessed 11 05 2021].
Chang, D., Lee, C. & Chen, C.-H., 2014. Review of life cycle assessment towards sustainable
product. Journal of Cleaner Production, Volume 83, pp. 48-60. [Online]
Available at: http://dx.doi.org/10.1016/j.jclepro.2014.07.050
Chau, C., Leung, T. & Ng, W., 2014. A review on Life Cycle Assessment, Life Cycle Energy
Assessment and Life Cycle Carbon Emissions Assessment on buildings. Journal of applied energy,
pp. 395-413. [Online]
Available at: https://ideas.repec.org/a/eee/appene/v143y2015icp395-413.html
Ciroth, A. et al., 2008. In: D. Hunkeler, K. Lichtenvort & G. Rebitzer, eds. Environmnetal Life
Cycle Costing. s.I.:CRC press. ISBN 9781420054705. s.l.:s.n.
Cluzel, F., Leroy, Y. & Yannou, B., 2013. Towards a structured functional unit definition
framework to limit LCA results variability, Gothenburg. [Online]
Available at: https://www.researchgate.net/deref/https%3A%2F%2Fhal.archives-

58 | P a g e
ouvertes.fr%2Fhal-00850562
[Accessed 17 06 2021].
Coffta, M., 2020. Literature Review. [Online]
Available at: https://guides.library.bloomu.edu/litreview
Commission, E., 2021. 2050 long-term strategy - Climate Action - European Commission.
[Online]
Available at: https://ec.europa.eu/clima/policies/strategies/2050_en
Cordis, 2017. PCBRec process: Waste Printed Circuit Board (WPCB) Recycling with Molten Salts.
[Online]
Available at: https://cordis.europa.eu/project/id/761495
[Accessed 22 06 2021].
CRL, 2017. PCBRec process: Waste Printed Circuit Board (WPCB) Recycling with Molten Salts.
[Online]
Available at: https://cordis.europa.eu/project/id/761495/reporting
[Accessed 26 9 2021].
DBEIS, 2020. MODELLING 2050: ELECTRICITY SYSTEM ANALYSIS. [Online]
Available at:
https://assets.publishing.service.gov.uk/government/uploads/system/uploads/attachment_dat
a/file/943714/Modelling-2050-Electricity-System-Analysis.pdf
[Accessed 3 7 2021].
Dodgson, et al., 2009. Multi-Criteria Analysis: A Manual, ISBN: 978-1-4098-1023-0. [Online]
Available at: http://eprints.lse.ac.uk/12761/1/Multi-criteria_Analysis.pdf
[Accessed 11 8 2021].
E., 2021. European Steel in Figures. [Online]
Available at: https://www.eurofer.eu/assets/publications/brochures-booklets-and-
factsheets/european-steel-in-figures-2021/European-Steel-in-Figures-2021.pdf
[Accessed 15 06 2021].
E. A., 2021. Greenhouse gas emissions in the Aluminium industry. [Online]
Available at: https://www.european-aluminium.eu/data/environmental-data/greenhouse-gas-
emissions-in-the-aluminium-industry/
[Accessed 10 06 2021].
E. C., 2012. Waste from Electrical and Electronic Equipment (WEEE). [Online]
Available at: https://ec.europa.eu/environment/topics/waste-and-recycling/waste-electrical-
and-electronic-equipment-weee_en
[Accessed 15 06 2021].

59 | P a g e
E. C., 2014. Life-Cycle costing. [Online]
Available at: https://ec.europa.eu/environment/gpp/lcc.htm
[Accessed 11 09 2021].
E. C., 2021. Tool #64. LIfe Cycle Analysis. [Online]
Available at: https://ec.europa.eu/info/sites/default/files/file_import/better-regulation-
toolbox-64_en_0.pdf
[Accessed 19 7 2021].
EcoInvent, 2021. About ecoinvent. [Online]
Available at: https://www.ecoinvent.org/about/about.html
ECRA, 2015. Closing the loop: What type of concrete re-use is the most sustainable option?,
Dusseldorf: ECRA. [Online]
Available at: https://www.theconcreteinitiative.eu/images/Newsroom/Publications/2016-01-
16_ECRA_TechnicalReport_ConcreteReuse.pdf
E. C.-J. r. c., 2010. International Reference Life Cycle Data System (ILCD) handbook: General
guide for life cycle assessment- Detailed guidance. Luxemborg: Publications office of European
Union.. DOI: 10.2788/94987: s.n.
EIA, 2021. EIA projects renewables share of U.S. electricity generation mix will double by 2050.
[Online]
Available at: https://www.eia.gov/todayinenergy/detail.php?id=46676
[Accessed 27 06 2021].
EMF, (. M. F., 2010. Towards the circular economy. [Online]
Available at: https://www.werktrends.nl/app/uploads/2015/06/Rapport_McKinsey-
Towards_A_Circular_Economy.pdf
[Accessed 5 9 2021].
Energimyndigheten, 2020. Sveriges energi- och klimatmål. [Online]
Available at: https://www.energimyndigheten.se/klimat--miljo/sveriges-energi--och-klimatmal/
[Accessed 25 06 2021].
Eriksson, E., Karlsson, P.-E., Hallberg, L. & Jelse, K., 2010. Carbon Footprint of Cartons in Europe -
Carbon Footprint methodology and biogenic carbon sequestration, Gothenburg: IVL Swedish
Environmental Research Institute. [Online]
Available at:
https://www.ivl.se/download/18.343dc99d14e8bb0f58b75c7/1445517446481/B1924.pdf
EU, 2018. 2050 long-term strategy. [Online]
Available at: https://ec.europa.eu/clima/policies/strategies/2050_en
EU, 2021. 2050 long-term strategy. [Online]
Available at: https://ec.europa.eu/clima/policies/strategies/2050_en

60 | P a g e
EU, 2021. Plastic waste and recycling in the EU: facts and figures. [Online]
Available at:
https://www.europarl.europa.eu/news/en/headlines/society/20181212STO21610/plastic-
waste-and-recycling-in-the-eu-facts-and-figures
[Accessed 26 9 2021].
EuRIC, 2021. Metal Recycling Factsheet. [Online]
Available at: https://www.euric-aisbl.eu/position-papers/item/335-euric-unveils-metal-
recycling-brochure
[Accessed 26 9 2021].
Fazekas, D. et al., 2019. Links between production, the environment: Summary report, s.I:
Publications Office of the European Union. DOI: 10.2779/569064, s.l.: s.n.
Flemmer, C., 2020. Validity and Reliability of Life Cycle Assessment: A Case Study. [Online]
Available at: https://doi.org/ 10.29333/ijese/8338
[Accessed 14 07 2021].
Fraunhofer institute, 2019. Use of scrap metal in steel production significantly re-duces CO2
emissions. [Online]
Available at: https://www.imws.fraunhofer.de/en/presse/pressemitteilungen/scrap-metal-
reduces-co2.html
[Accessed 25 06 2021].
Gibbert, M., Ruigrok, W. & Wicki, B., 2008. Strategic Management Journal, Volume 29, p.p.
1465–1474. Available at: https://doi.org/10.1002/smj.722.
Gluch, P. & Baumann, H., 2004. The life cycle costing (LCC) approach: a conceptual discussion of
its usefulness for environmental decision-making. Building and Environment, 39(5), pp. 571-
580.
Golsteijn, L., 2020. Life Cycle Assessment (LCA) explained. [Online]
Available at: https://pre-sustainability.com/articles/life-cycle-assessment-lca-basics/
[Accessed 27 09 2021].
Grice, L. N. et al., 2014. Life Cycle Carbon Footprint of Re-Refined versus Base Oil That Is Not Re-
Refined. American Chemical Society, 02 03, 2(2), pp. 158-168. Available at:
https://doi.org/10.1021/sc400182k.
Grimes, S., Donaldson, J. & Gomez, G. C., 2008. Report on the Environmental Benefits of
Recycling, Brussels: Bureau of International Recycling. Availabe at: https://www.mgg-
recycling.com/wp-content/uploads/2013/06/BIR_CO2_report.pdf.
Guinée, J. B. et al., 2011. Life Cycle Assessment: Past, Present, and Future. Environmental
Science and technology, Issue 45, pp. 90-96. Availabel at:
https://pubs.acs.org/doi/10.1021/es101316v#.

61 | P a g e
Guo, Z., Tu, A., Chen, C. & Lehamn, D. E., 2018. Mechanical properties, durability, and life-cycle
assessment of concrete building blocks incorporating recycled concrete aggregates. Journal of
Cleaner Production, 199(1), pp. 136-149. Availabel at:
https://doi.org/10.1016/j.jclepro.2018.07.069.
Hauschild, M. Z., Rosenbaum, R. K. & Olsen, S. I., 2017. Life Cycle Assessment Theory and
Practice. s.l.:Springer Nature. DOI: 10.1007/978-3-319-56475-3.
Hjalsted, A. W. et al., 2020. Sharing the safe operating space. Exploring ethical allocation
principles to operationalize the planetary boundaries and assess absolute sustainability at
individual and industrial sector levels: Journal of Industrial Ecology.. Available at:
https://doi.org/10.1111/jiec.13050.
Huang, C.-L., Vause, J., Ma, H.-w. & Yu, C.-P., 2012. Using material/substance flow analysis to
support sustainable development assessment: A literature review and outlook. Resources,
Conservation and Recycling, Volume 68, pp. 104-116. Available at:
https://doi.org/10.1016/j.resconrec.2012.08.012..
Hunkeler, D., Lichtenvort, K. & Rebitzer, G., 2008. Environmental Life Cycle Costing. Florida: CRC
press.
I. 1., 2006. s.l.:s.n.
IEA, 2016. Vietnam Renewable Energy Development Strategy 2016-2030 with outlook until 2050
(REDS). [Online]
Available at: https://www.iea.org/policies/6095-vietnam-renewable-energy-development-
strategy-2016-2030-with-outlook-until-2050-reds
[Accessed 25 06 2021].
IEA, 2021a. Net Zero by 2050 A Roadmap for the Global Energy Sector. [Online]
Available at: https://www.iea.org/reports/net-zero-by-2050
[Accessed 26 8 2021].
IEA, 2021b. International Enegry Agency. [Online]
Available at: https://www.iea.org/
[Accessed 15 06 2021].
I. H., 2010. General guide for Life Cycle Assessment- Detialed guidance. In: ILCD Handbook.
s.l.:Institute for Environment and Sustainability. DOI: 10.2788/94987.
Isaksson, O., Larsson, T. C. & Rönnbäck, A. Ö., 2009. Development of product-service systems:
challenges and opportunities for the manufacturing firm. Journal of Engineering Design, 20(4),
pp. 329-348. DOI: 10.1080/09544820903152663.
ISO, 1998. ISO 14041:1998. Enivronmental management - Life cycle management - Goal and
scope definition and iventory analysis.
62 | P a g e
IZA, 2021. About Cycles, Recycling, and Circular Economy. [Online]
Available at: https://sustainability.zinc.org/recycling/
[Accessed 25 9 2021].
Jahan, A., Edwards, K. L. & Bahraminasab, M., 2016. 4 - Multi-criteria decision-making for
materials selection. In: Multi-criteria Decision Analysis for Supporting the Selection of
Engineering Materials in Product Design (Second Edition). s.l.:Butterworth Heinemann, pp. 63-
80. Available at: https://doi.org/10.1016/B978-0-08-100536-1.00004-7.
Johnsson, J., Reck, B., Wang, T. & Graedel, T., 2008. The energy benefit of stainless steel
recycling. Energy Policy, 36(1), pp. 181-192.
Karakosta, C., 2016. The role of industrial emissions within the EU: trends and policy. [Online]
Available at: http://climatepolicyinfohub.eu/role-industrial-emissions-within-eu-trends-and-
policy
Khan, F., Raveender, V. & Husain, T., 2002. Effective environmental management through life
cycle assessment. Journal of Loss Prevention in the Process Industries, 15(6), pp. 455-466.
Available at: https://doi.org/10.1016/S0950-4230(02)00051-7.
Koopmans, C. & Mouter, N., 2020. Cost-benefit Analysis: Standard Transport Appraisal
Methods. DOI: https://doi.org/10.1016/bs.atpp.2020.07.005. In: s.l.:s.n.
Kurisu, K., 2015. Pro-environmental Behaviors. 1 ed. Tokyo: Springer. DOI:
https://doi.org/10.1007/978-4-431-55834-7.
Landpoint, 2018. The Advantages of Using Drones for Wind Turbine Inspection. [Online]
Available at: https://www.landpoint.net/the-advantages-of-using-drones-for-wind-turbine-
inspection/
[Accessed 31 08 2021].
Ligthart, T. N. & Ansems, T. (., 2012. Modelling of Recycling in LCA. In: E. Damanhuri, ed. Post-
Consumer Waste Recycling and Optimal Production. Rijeka: IntechOpen, pp. 187-210. DOI:
10.5772/34054.
Louise, K. L. et al., 2013. Product/Service-Systems for a Circular Economy: The Route to
Decoupling Economic Growth from Resource Consumption? Available at:
https://doi.org/10.1111/jiec.12747, s.l.: s.n.
Matschewsky, J., 2019a. Effective and efficeint design and provision of product-service systems:
Challenges, oppurtunities, and solutions.. s.l.:Linköping university electronic press. DOI:
https://doi.org/10.3384/diss.diva-156261.
Matschewsky, J., 2019b. Unintended Circularity?—Assessing a Product-Service System for its
Potential Contribution to a Circular Economy. Sustainability. MDPI AG. DOI:
https://doi.org/10.3390/su11102725, 11(10).
63 | P a g e
Mayyas, A. T. & Omar, M., 2020. Eco-Material Selection for Lightweight Vehicle Design: Energy
Efficiency and Sustainable Lighting - a Bet for the Future. DOI: 10.5772/intechopen.88372 . In:
s.l.:s.n.
Meier, H., Roy, R. & Seliger, G., 2010. Industrial Product-Service Systems-IPS). CIRP Ann. -
Manuf. Technol, Volume 59, pp. 607-627. Available at:
https://doi.org/10.1016/j.cirp.2010.05.004.
M. & I., 2013. Remanufacturing: Handbook of Sustainable Engineering. Available at:
https://doi.org/10.1007/978-1-4020-8939-8_93. In: s.l.:s.n.
Mont, O., 2002. Clarifying the concept of product–service system. Journal of Cleaner
Production, 10(3), pp. 237-245. Available at: https://doi.org/10.1016/S0959-6526(01)00039-7.
Müller, P., Noara, K., Rainer, S. & Luciënne, B., 2009. PSS Layer Method - Application to Micro
energy systems. In: Introduction to Product/Service-System Design. London: Springer, pp. 3-29.
DOI: 10.1007/978-1-84882-909-1_1.
Muralikrishna, I. V. & Manickam, V., 2017. Life Cycle Assessment. In: Environmental
management. s.l.:Butterworth-Heinemann, pp. 57-75. DOI: 10.1016/B978-0-12-811989-
1.00005-1.
Murray, A., Skene, K. & Haynes, K., 2017. The Circular Economy: An Interdisciplinary Exploration
of the Concept and Application in a Global Context. Journal of Business Ethics, Volume 140, pp.
369-380. Available at: https://doi.org/10.1007/s10551-015-2693-2.
NASA, 2021. The Effects of Climate Change. [Online]
Available at: https://climate.nasa.gov/effects/
[Accessed 26 08 2021].
Ness, B., Piirsalu, E. U., Anderberg, S. & Olsson, L., 2007. Categorising tools for Sustainability
assessment. Ecological Economics, 60(3), pp. 498-508. Available at:
https://doi.org/10.1016/j.ecolecon.2006.07.023.
Nielsen, P. & Wenzel, H., 2002. Integration of environmental aspects in product development: a
stepwise procedure based on quantitative life cycle assessment. Journal of Cleaner Production,
10(3), pp. 247-257. DOI: 10. 247-257. 10.1016/S0959-6526(01)00038-5.
Nieuwlaar, E., 2004. In: Encyclopedia of Enegry. DOI: 10.1016/b0-12-176480-x/00233-3. s.l.:s.n.
Omnisci, 2021. What is Predictive Maintenance? Definition and FAQs | OmniSci. [Online]
Available at: https://www.omnisci.com/technical-glossary/predictive-maintenance
[Accessed 31 08 2021].
Parliment, E., 2008. Directive 2008/98/EC of the European Parliament and of the Council.
[Online]

64 | P a g e
Available at: https://eur-lex.europa.eu/legal-content/EN/TXT/?uri=celex%3A32008L0098
[Accessed 20 06 2021].
Passarini, F. C. L. N. P. a. M. S., 2018. Material flow analysis of aluminium, copper, and iron in
the EU-28, Luxembourg: Publications Office of the European Union. DOI:10.2760/1079.
P. et al., 2006. Cost-benefit analysis and the environment: recent developments. Paris:
Organisation for Economic Co-operation and Development. Available at:
https://doi.org/10.1787/9789264010055-en.
PlasPLUS, 2019. Recycling of high-quality secondary thermoplastics and critical raw materials
coming from mixed WEEE and EoL vehicles. [Online]
Available at: https://webgate.ec.europa.eu/life/publicWebsite/project/details/5105
[Accessed 25 06 2021].
PRé, 2020. SimaPro Database Manual. [Online]
Available at: https://simapro.com/wp-content/uploads/2020/10/DatabaseManualMethods.pdf
[Accessed 2 05 2021].
Queirós, A., Almeida, F. & Faria, D., 2017. Strengths and Limiations of Qualitative and
Quantitative research methods. Eurpoean Journal of Educatioal Studies, 3(9), pp. 369-387.
DOI:10.5281/zenodo.887089.
Ramani, K. et al., 2010. Integrated Sustainable Life Cycle Design: A Review. J. Mech. Des, 132(9),
p. 15. DOI:10.1115/1.4002308.
Rebelo, C. & Guerreiro, J., 2017. Comparative Evaluation of the EIA Systems in Kenya, Tanzania,
Mozambique, South Africa, Angola, and the European Union. Journal of Environmetal
Protection, Volume 8. DOI:10.4236/jep.2017.85040.
Reim, W., Parida, V. & Örtqvist, D., 2015. Product–Service Systems (PSS) business models and
tactics – a systematic literature review. Journal of Cleaner Production, Volume 97, pp. 61-75.
Available at: https://doi.org/10.1016/j.jclepro.2014.07.003.
Roh, S., Tae, S. & Kim, R., 2018. Development of a Streamlined Environmental Life Cycle Costing
Model for Buildings in South Korea, Sustainability. Available at:
https://doi.org/10.3390/su10061733.
Ryberg, M. W. et al., 2018. How to bring absolute sustainability into decision-making: An
industry case study using a Planetary Boundry-based methodology. Science of The Total
Environment, pp. 1406-1416. Available at: https://doi.org/10.1016/j.scitotenv.2018.04.075.
S., 2006. Life Cycle Assessment: Principles and Practice. USEPA. [Online]
Available at: http://people.cs.uchicago.edu/~ftchong/290N-W10/EPAonLCA2006.pdf
[Accessed 9 07 2021].

65 | P a g e
Sakao, T. & Lindahl, M., 2009. Introduction to Product/Service-System Design. London: Springer.
DOI: 10.1007/978-1-84882-909-1.
Sakao, T. & Lindahl, M., 2015. A method to improve integrated product service offerings based
on life cycle costing. CIRP Annals, 64(1), pp. Pages 33-36. Available at:
https://doi.org/10.1016/j.cirp.2015.04.052.
Sakao, T., Wasserbaur, R. & Mathieux, F., 2019. A methodological approach for manufacturers
to enhance value-in-use of service-based offerings considering three dimensions of
sustainability. CIRP annals, p. 68. DOI: 10.1016 / j.cirp.2019.04.084.
S. E., 2009. Life cycle perespectives of products/service-systems: In design theory. Available at:
https://doi.org/10.1007/978-1-84882-909-1_2. s.l.:s.n.
Shu, L. et al., 2017. Design for reduced resource consumption during the use phase of products.
CIRP Annals, Volume 66(Issue 2), pp. Pages 635-658. Available at:
https://doi.org/10.1016/j.cirp.2017.06.001.
Spatari, S. et al., 2003. The contemporary European zinc cycle: 1-year stocks and flows.
Resources, Conservation & Recycling, 39(2), pp. 137-160. DOI: 10.1016/S0921-3449(02)00168-4.
Srinivas, H., 2015. Sustainability concepts: Strategic Impact Assessments. [Online]
Available at: https://www.gdrc.org/sustdev/concepts/21-sia.html
[Accessed 9 09 2021].
Standarization, I. O. f., 2006. ISO 14040:2006 Environmental management- Life cycle
assessment- Principles and fraemwork, s.l.: s.n.
Stanisavljevi , N. & Brunner, P. H., 2014. Combination of material flow analysis and substance
flow analysis: A powerful approach for decision support in waste management. Waste
management & research: The journal for a sustainable circular economy, 32(8), pp. 733-744.
DOI:10.1177/0734242X14543552.
Stanway, D. & Cadell, C., 2021. President Xi says China will start cutting coal consumption from
2026. [Online]
Available at: https://www.reuters.com/world/china/chinas-xi-says-china-will-phase-down-coal-
consumption-over-2026-2030-2021-04-22/
[Accessed 26 06 2021].
Steffen, W. et al., 2015. Planetary boundaries: Guiding human development on a changing
planet. Science, 347(1), p. 1259855. DOI: 10.1126/science.1259855.
S. t. p., 2021. Sustainable transport packaging. [Online]
Available at: https://www.sustainabletransportpackaging.com/blog/recycling-explained-
through-life-recycled-aluminum-soda-can
[Accessed 19 August 2021].
66 | P a g e
Sundin, E. & Bras, B., 2005. Making functional sales environmentally and economically
beneficial through product remanufacturing. Journal of Cleaner Production, 13(9), pp. 913-925.
Available at: https://doi.org/10.1016/j.jclepro.2004.04.006.
Sundin, E., Lindahl, M. & Ijomah, W., 2009. Product design for prodcut/service systems: design
experiences from Swedish industry. Journal of Manufacturing Technology, 20(5), pp. 723-753.
DOI:10.1108/17410380910961073.
Swarr, T. E. et al., 2011. Environmental life-cycle costing: a code of practice. The internatinal
journal of Life Cycle Assessment, pp. 389-397. Available at: https://doi.org/10.1007/s11367-
011-0287-5.
Tukker, A., 2000. Life cycle assessment as a tool in environmental impact assessment.
Environmental Impact Assessment Review, 20(4), pp. 435-456. Available at:
https://doi.org/10.1016/S0195-9255(99)00045-1.
Tukker, A., 2004. Eight types of product–service system: eight ways to sustainability?
Experiences from SusProNet. Bus. Strat. Env, Volume 13, pp. 246-260. Available at:
https://doi.org/10.1002/bse.414.
Tukker, A., 2015. Product services for a resource-efficient and circular economy – a review.
Journal of Cleaner Production, 97(1), pp. 76-91.
UN, 2021. UNFCCC.int. [Online]
Available at: https://unfccc.int/process-and-meetings/the-paris-agreement/the-paris-
agreement
UNEP, 2020. Guidelines for Social Life Cycle Assessment of Products and Organizations 2020, s.l.:
United Nations Environment Programme (UNEP). Available at:
https://www.lifecycleinitiative.org/wp-content/uploads/2021/01/Guidelines-for-Social-Life-
Cycle-Assessment-of-Products-and-Organizations-2020-22.1.21sml.pdf.
UTA, 2021. Quantitative and Qualitative Research. [Online]
Available at: https://libguides.uta.edu/quantitative_and_qualitative_research
[Accessed 05 09 2021].
Van Genderen, E., Wiildnauer, M., Santero, N. & Sidi, N., 2016. A global life cycle assessment for
primary zinc production. The International Journal of Life Cycle Assessment, 21(11), pp. 1580-
1593. DOI: 10.1007/s11367-016-1131-8.
Wangel, A., 2018. Back to basics- the school lunch. The international journal of life cycle
assessment, Issue 23, pp. 683-689. Available at: https://doi.org/10.1007/s11367-016-1110-0.
Weidema, B., Wenzel, H., Petersen, C. & Hansen, K., 2004. The Product, Functional Unit and
Refrence Flows in LCA, s.l.: Danish Ministry of the Environment: Environmental Protection

67 | P a g e
Agency. Available at: https://www2.mst.dk/udgiv/publications/2004/87-7614-233-7/pdf/87-
7614-234-5.pdf.
Witjes, S. & Lozano, R., 2016. Towards a more Circular Economy: Proposing a framework linking
sustainable public procurement and sustainable business models. Resources, Conservation and
Recycling, Volume 112, pp. 37-44. Available at:
https://doi.org/10.1016/j.resconrec.2016.04.015.
W. S. A., 2021. World Steel Assosciation: Facts Sheets. [Online]
Available at: https://www.worldsteel.org/publications/fact-sheets.html
[Accessed 15 06 2021].
Wu, Y. Y. & Ma, H. W., 2019. Challenges for integrating startegic environmental assessment to
enhance environmental thinking: A case study of taiwan energy policy, Sustaainability. Available
at: https://doi.org/10.3390/su11030609.
WWF, 2021. Mänsklig Påverkan. [Online]
Available at: https://www.wwf.se/klimat/mansklig-paverkan/
Yin, R., 1984. Case Study Reserach: Design and Methods. ISBN: 9781-1-4129-6099-1. s.l.:s.n.
Yin, R. K., 1994. Case study research : design and methods (5. ed.). ISBN: 9781452242569.
London: SAGE.
Yuan, Z., Bi, J. & Zhang, L., 2009. Substance Flow Analysis (SFA): A critical review. DOI: 29. 6189-
6198.
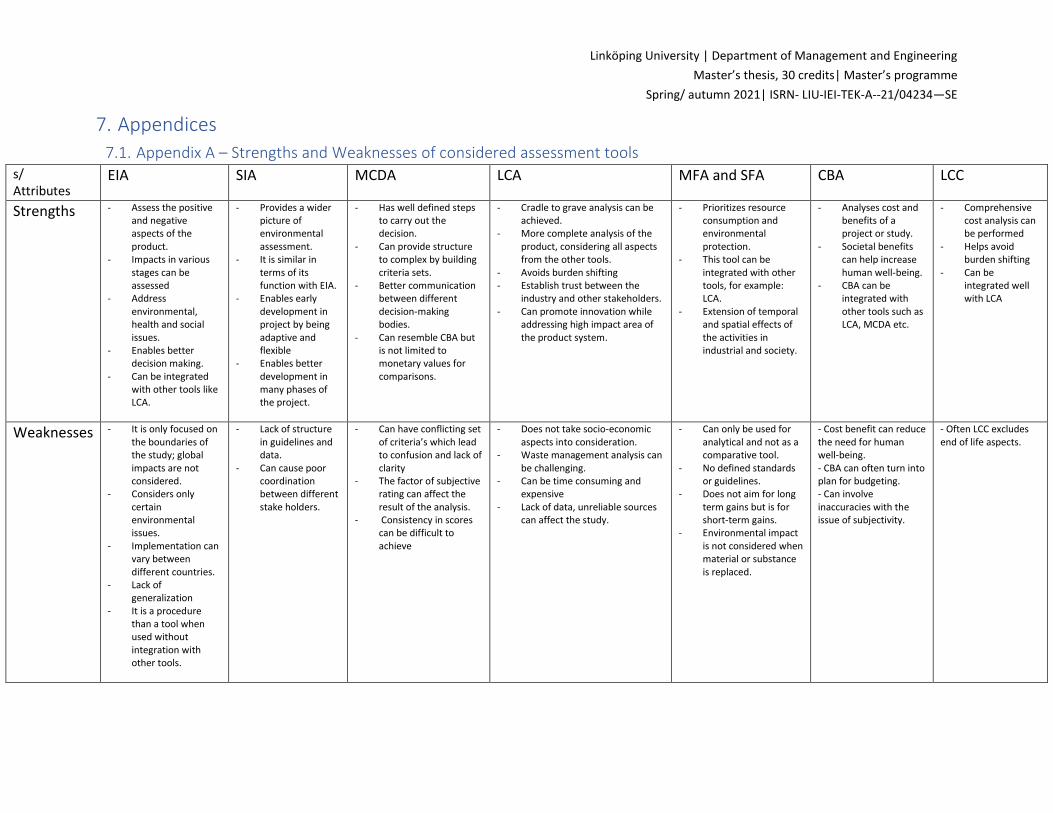
Linköping University | Department of Management and Engineering
Master’s thesis, 30 credits| Master’s programme
Spring/ autumn 2021| ISRN- LIU-IEI-TEK-A--21/04234—SE
7. Appendices
7.1. Appendix A – Strengths and Weaknesses of considered assessment tools s/ Attributes
EIA SIA MCDA LCA MFA and SFA CBA LCC
Strengths - Assess the positive and negative aspects of the product.
- Impacts in various stages can be assessed
- Address environmental, health and social issues.
- Enables better decision making.
- Can be integrated with other tools like LCA.
- Provides a wider picture of environmental assessment.
- It is similar in terms of its function with EIA.
- Enables early development in project by being adaptive and flexible
- Enables better development in many phases of the project.
- Has well defined steps to carry out the decision.
- Can provide structure to complex by building criteria sets.
- Better communication between different decision-making bodies.
- Can resemble CBA but is not limited to monetary values for comparisons.
- Cradle to grave analysis can be achieved.
- More complete analysis of the product, considering all aspects from the other tools.
- Avoids burden shifting - Establish trust between the
industry and other stakeholders. - Can promote innovation while
addressing high impact area of the product system.
- Prioritizes resource consumption and environmental protection.
- This tool can be integrated with other tools, for example: LCA.
- Extension of temporal and spatial effects of the activities in industrial and society.
- Analyses cost and benefits of a project or study.
- Societal benefits can help increase human well-being.
- CBA can be integrated with other tools such as LCA, MCDA etc.
- Comprehensive cost analysis can be performed
- Helps avoid burden shifting
- Can be integrated well with LCA
Weaknesses - It is only focused on the boundaries of the study; global impacts are not considered.
- Considers only certain environmental issues.
- Implementation can vary between different countries.
- Lack of generalization
- It is a procedure than a tool when used without integration with other tools.
- Lack of structure in guidelines and data.
- Can cause poor coordination between different stake holders.
- Can have conflicting set of criteria’s which lead to confusion and lack of clarity
- The factor of subjective rating can affect the result of the analysis.
- Consistency in scores can be difficult to achieve
- Does not take socio-economic aspects into consideration.
- Waste management analysis can be challenging.
- Can be time consuming and expensive
- Lack of data, unreliable sources can affect the study.
- Can only be used for analytical and not as a comparative tool.
- No defined standards or guidelines.
- Does not aim for long term gains but is for short-term gains.
- Environmental impact is not considered when material or substance is replaced.
- Cost benefit can reduce the need for human well-being. - CBA can often turn into plan for budgeting. - Can involve inaccuracies with the issue of subjectivity.
- Often LCC excludes end of life aspects.

Linköping University | Department of Management and Engineering
Master’s thesis, 30 credits| Master’s programme
Spring/ autumn 2021| ISRN- LIU-IEI-TEK-A--21/04234—SE
7.2. Appendix B – Summery of Semi Structured Workshops
Construction & Industrial Workshop summery
The workshop regarding the construction and industrial products were condensed into one due
to the products sharing multiple similarities and design methods since they both stem from the
same division. In the workshop regarding the construction hoist several ideas for improvement
were lifted by the engineers. For example, reducing the weight of the cradle/base unit in relation
to the payload to lower use phase electricity use, changing the habits of spare parts distribution
to minimize use of air freight, life span extension made possible by proper maintenance. These
improvement suggestions will now be expanded upon.
First the reduction of the weight of the cradle/base unit, the engineers estimated that it could be
possible to reduce the weight by 25%. This would lead to an efficiency gain since less material is
being lifted in relation to payload weight. Furthermore, it would also reduce the impact of both
manufacturing and material use since less material is handled.
Second promising improvement possibility was changing the mode of transport for spare parts
use, currently most spare parts are sent via air freight to the US and a smaller fraction is sent via
ship. The engineers thought it would be possible to reach a 90% share of ocean freight by slightly
expanding and better utilizing existing warehouses across the globe.
Thirdly materials were also discussed, here the possibility of changing carbon and energy
intensive materials to alternatives and increasing recycled content was explored. It was possible
to conclude that the materials were already selected due to their inherent properties. However,
increasing the share of recycled material content was a possibility as such, increasing the share
of recycled materials for un-alloyed steel and wrought aluminum alloy to 100% can be
investigated further. Further weight reduction by removing more material from the product was
also shortly discussed, however this is unlikely to be possible to still deliver a product which is
well within the safety margins.
Fourth, remanufacturing possibilities were discussed, and the company already have certain
levels of remanufacturing. However due to lack of demand from the customer side it has not
been done to the extent planned. There are clear opportunities for this however, the business
structure might have to change to include more PSS elements to be viable. It is still of interest to
investigate the potential improvement of a remanufactured unit compared to a normal unit.
Company engineers estimate that if a unit is remanufactured quite a substantial amount of metal
parts can be reused. For the construction hoist, 80% of low alloyed steel, 5% wrought aluminum
alloy, and 5% of stainless steel can most likely be reused. Regarding the industrial elevator 70%
of low alloyed steel, 10% of wrought aluminum alloy, and 5% of the stainless steel can be reused.
Fifth life span extension, for both units if properly maintained in a normal environment for the
products it is possible to keep them operating for another 15 years. This would mean potentially

70 | P a g e
most units could have a lifespan of forty years, this can also be more easily maintained with a
changed business model to cater more towards PSS.
Predictive maintenance was also discussed however there were quite some barriers to this
which comes to environment the product is in. In a normal operating environment, it is already
quite clear when what parts need to be replaced however if the unit is operating close to salt
water or other corrosive environments it would significantly impact the frequency repairs have
to be made. As such predictive maintenance was not of great interest and possible
improvements stemming from it was too difficult to estimate. Sensor implementation was
however still of interest to gain better insights on real world use data of the products, and it is
something the company is working on. However, the potential improvements at this stage were
difficult to estimate.
BMU Workshop Summery
The workshop with the BMU division was beneficial. New ideas surfaced from the engineers and
the feasibility of our own ideas were confirmed or denied.
First, how to handle the large amount of materials used in the BMU was a major topic during the
workshop and several ideas were presented. To address the large amount of material, use in the
BMU one first need to understand why there is a lot of materials. The main the product is
designed this way is to adhere to several safety standards, a few notable standards being the
European DIN EN 1808 – 2015, the US (United States) OSHA 1910-66, the Canadian CSA Z271 and
the Australian AS2550.13. If the BMU division had more knowledge of how the product was going
to be used they could avoid always designing for the worst possible use case, and thus lower
material use. As such remote product monitoring to better understand how the BMU is used
could be of interest. Such data could assist in designing a product which is still within the safety
limits but requires less material. On the topic of material use, recycled materials were also
discussed. This seemed promising but a few issues were brought up, such as price and ensuring
the quality of the recycled material compared to virgin. However, if both price and quality is
adequate utilizing recycled materials was deemed a probable improvement alternative.
Second, spare parts and change of transport habits was discussed. For example, one could
prioritize land transport of heavy components by rail rather than truck. Such a change was
deemed feasible and worth to investigate further. Possibilities regarding the spare parts
shipment was more complex. Currently predominantly air freight is used to ensure speedy
delivery to customers. An improvement could be to use via ocean freight combined with
warehouses around the world or to store some spare parts with the customer. However, it was
deemed as unfeasible due to costs of local warehouses and customers having limited space
dedicated for the BMU. For certain customers, however, it could be of interest, but it is unlikely
to be a general solution. Spare part management from a general maintenance perspective was
also discussed, this was a rather complex situation where maintaining the unit, frequency of

71 | P a g e
inspection and sales of spare parts all play a role. From this perspective the possibility of sensors
keeping track of the condition of certain parts more accurately could be of interest, however it
might require an alteration of the business model.
Lastly remanufacturing was discussed as an alternative to lower climate impact and energy use.
This would normally be when a customer wishes to extend the lifespan of the unit, then the BMU
division would bring it back to the factory, disassemble the BMU, check for worn down parts,
replace the worn-down parts, ship it back to the customer. This can have widely different
outcome depending on how many parts are reusable, with input from the engineers it was
decided to check a pessimistic 30% of parts are reusable and a likely 70%. Such an improvement
was of great interest due to the many older units out in the world which will soon need
replacement.
Wind Tower Service Lift Workshop Summery
The workshop with the wind tower service lift division proved fruitful where all several ideas
were discussed and interesting links with economic profitability were discovered.
First, the major potential for improvements for both environmental and energy performance is
found in the maintenance phase of the service lift. This is because the wind turbine must be shut
down during maintenance preventing the production of carbon free energy. Shutting down the
wind turbine also happens to be one of the major areas contributing to the total cost of
ownership for the service lift owner. Therefore, there are major synergies in reducing the time it
takes to conduct a maintenance check for the total climate impact, total energy use and the cost
of ownership. The plan is to reduce the maintenance time by first optimizing the maintenance
tasks. Second, in the future the wind tower service lift division plans to use sensors, so a worker
does not have to physically investigate certain components. Parts like cables could be
investigated via camera and gear boxes via vibration sensors. It is estimated by service lift
engineers that the time to conduct maintenance can first be reduced via optimization from above
2 hours down to 2 hours, then further reduce it to 1 hour 40 minutes. With full optimization
efforts and smart sensor placement maintenance time could be reduced down to 1h. To reduce
the impact of maintenance even further the potential to carry out inspections at a time of low
wind was discussed. However, due to the fact the maintenance schedules are set months in
advance it is not possible to choose time of day when there is low wind.
Second, a lifetime extension was discussed during the workshop, this solution would require
certain changes in the design which have not yet been fully decided. However, such a change
would likely include a material use increase, or a major maintenance with several parts replaced
around the 20-year mark. The lifespan extension which was decided to investigate was a ten-year
extension with a major maintenance around the 20-year mark.
Some barriers were also brought up, such as a strong focus on not raising the price of the product,
to lower the cost of ownership, and a disconnect between the division and the end user. The
disconnect is there because the manufacturer does not sell to the end customer directly in most

72 | P a g e
markets, instead they are a supplier to wind tower manufacturers. The wind tower
manufacturers are therefore usually not interested in a solution which would increase upfront
cost but have a lower total lifespan cost. Because of this structure it would take some effort to
implement PSS systems or remanufacturing unless the division creates stronger links with the
end customer. Another barrier due to inflated cost was change of materials, for example
changing wrought aluminum alloys to stainless steels was not an option. Recycled wrought
aluminum alloy could be an option if the material cost is similar to the cost of virgin material.

73 | P a g e
7.3. Appendix C – Functional Unit Results The functional unit defines to an extent what is being studied and quantifies the real service
delivered by a product. The functional unit also helps to compare the overall environmental
performance of different product systems. However, one should be aware it is not advised to
compare products with different life spans, and not possible to compare products with a different
functional unit to each other.
The three functional units were chosen because they best fit the true function of each product.
The results of the functional units can be seen in Table 8 and Table 9 which shows the
functional unit with regards to kg CO2-eqv and kWh use, respectively.
The first functional unit which can describe two products is the meter vertically moved ton.
Here the kg CO2-eqv and kWh use was distributed over the amount of kg material moved up or
down throughout the products 25-year life span. Here we can compare the construction hoist
and the industrial elevator with one another. Even though the construction hoist is much larger
than the industrial elevator, it does significantly more lifting work during its lifespan and
therefore has a lower climate impact per meter vertically mover ton.
The second functional unit chosen was for the wind tower service lift, here it did not make
sense to measure it after how much work it did since by its very nature it is used very
infrequently. Therefore, Easy access to wind tower floors for 1-2 people and required tools for
wind turbine maintenance work as often as required for 20 years, was chosen. So far there are
no other products to compare to, however this will change once the case company does a
similar analysis of more of their products.
Lastly the functional unit for BMUs (Building Maintenance Units), square meter of façade area
maintained throughout its lifespan, was chosen. This is a very accurate description of what the
product customer wishes of the products and should serve well as a point of comparisons
between different BMU systems. However, as with the Wind tower service lift there are not any
other BMU systems yet to compare with. This will change once the case company does a similar
analysis of more of their products.
Table 8 shows the kg CO2-eqv results of the four different products regarding their respective
functional units. These functional units can be used for comparison between different products
of the same category and service life. The functional unit can also be used to compare different
versions of the same product. The functional unit results are likely to be beneficial when the
case company wishes to compare different products in the same product category.
Table 8: Displays the results per Functional unit of the different products in g CO2-eqv.
Elevators and hoists
Functional unit
meter vertically moved ton.
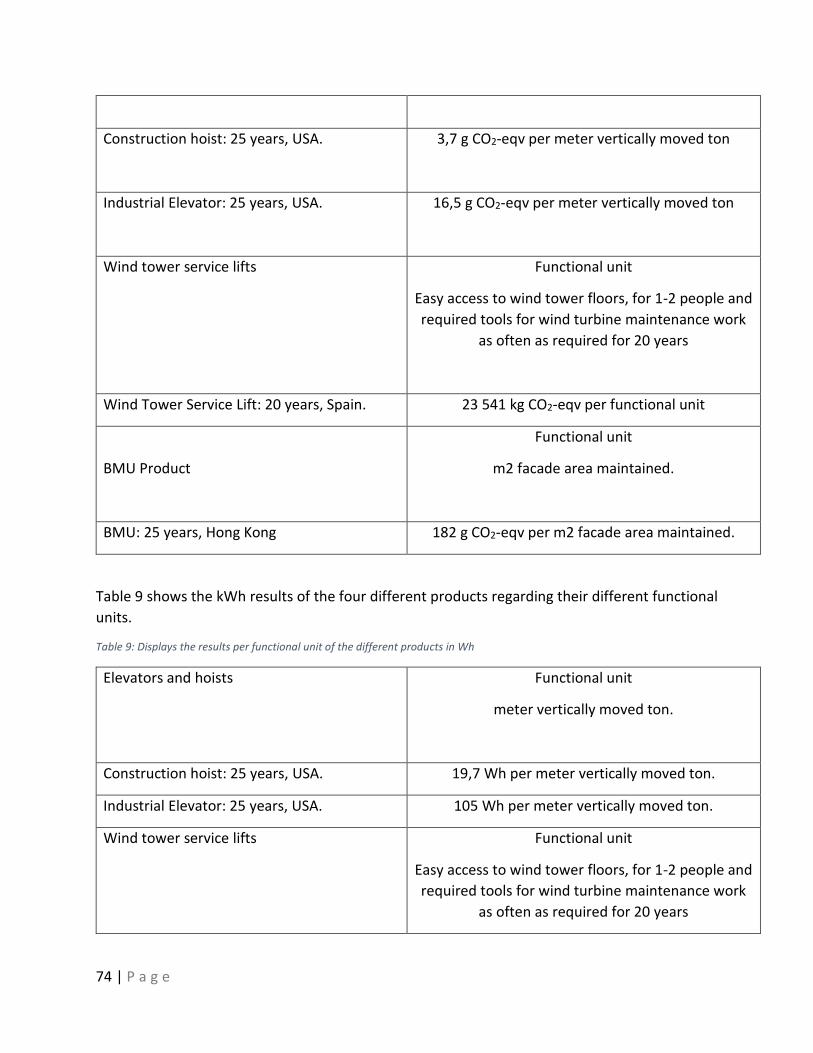
74 | P a g e
Construction hoist: 25 years, USA. 3,7 g CO2-eqv per meter vertically moved ton
Industrial Elevator: 25 years, USA. 16,5 g CO2-eqv per meter vertically moved ton
Wind tower service lifts Functional unit
Easy access to wind tower floors, for 1-2 people and
required tools for wind turbine maintenance work
as often as required for 20 years
Wind Tower Service Lift: 20 years, Spain. 23 541 kg CO2-eqv per functional unit
BMU Product
Functional unit
m2 facade area maintained.
BMU: 25 years, Hong Kong 182 g CO2-eqv per m2 facade area maintained.
Table 9 shows the kWh results of the four different products regarding their different functional
units.
Table 9: Displays the results per functional unit of the different products in Wh
Elevators and hoists
Functional unit
meter vertically moved ton.
Construction hoist: 25 years, USA. 19,7 Wh per meter vertically moved ton.
Industrial Elevator: 25 years, USA. 105 Wh per meter vertically moved ton.
Wind tower service lifts Functional unit
Easy access to wind tower floors, for 1-2 people and
required tools for wind turbine maintenance work
as often as required for 20 years

75 | P a g e
Wind Tower Service Lift: 20 years, Spain. 103 239 kWh per functional unit
BMU Product Functional unit
m2 facade area maintained.
BMU: 25 years, Hong Kong 1472 Wh per m2 facade area maintained