Embed Size (px)
Citation preview
32 Studies in Comparative International Development / Fall 2003
Aaron Schneider is a political scientist at the Institute of Development Studies at the University ofSussex. His research interests include comparative politics, public finance, and methodology. Hiscurrent research projects include studies of federalism, decentralization, party systems, budgeting, andtaxation. He has conducted research in Brazil and India, and plans to apply the measures derived in thisarticle to study the impact of decentralization.
Studies in Comparative International Development, Fall 2003, Vol. 38, No. 3, pp. 32-56.
Decentralization: Conceptualizationand Measurement*
Aaron Schneider
Decentralized government institutions are doing more of the work of government thanever before, but there is little agreement about 1) what decentralization means, or 2) howit should be measured. To overcome this confusion, this article builds on standarddefinitions of decentralization that include three core dimensions: fiscal, administra-tive, and political. The article offers an empirical test of that definition using factoranalysis of data from 1996 for sixty-eight countries. Factor analysis confirms these threecore dimensions and generates a score for each case in each dimension, allowing coun-tries to be measured according to their type and degree of decentralization. In futurework, these scores can be used for hypothesis testing about the causes and effects ofdecentralization on important social outcomes. This exercise demonstrates that concep-tual confusion need not hamper research when empirical tests can help verify concep-tual categories.
Decentralized government institutions are doing more of the work of government than ever before. Recent research has responded to this develop-
ment and deepened our understanding of decentralization and its links to out-comes such as growth, inequality, and political stability. Despite increasedresearch, there remains a great deal of conceptual confusion. Researchers at-tach a startling diversity of definitions and measures to the decentralizationconcept. The availability of cross-national statistical data has only exacerbatedthis proliferation.
Some might consider this proliferation of measures and definitions as nec-essary to account for a wide variety of cases. Alternatively, others might con-sider, as this article does, that the proliferation of meanings and measures erodesprecision and impedes our ability to assess types of decentralization. The prob-
Schneider 33
lem is worsened by the evaluative nature of the decentralization concept, whichleads researchers to conflate decentralization with other concepts, especiallythose that are also imbued with positive value, such as democracy or marketreforms. The result is that there is little agreement about what constitutes anexample of decentralization, what causes decentralization, or what effects it islikely to have.
To overcome this confusion, this article proposes and tests a definition ofdecentralization. Although there is disagreement about the meaning of decen-tralization, most would agree that transferring power and resources to nationalgovernments is not decentralization.1 Nevertheless, all share the assumptionthat decentralization includes the transfer of power and resources away fromthe central government.
This article hypothesizes three core dimensions of the decentralization con-cept: fiscal, administrative, and political.2 Fiscal decentralization refers to howmuch central governments cede fiscal impact to non-central government enti-ties. Administrative decentralization refers to how much autonomy non-cen-tral government entities possess relative to central control. Finally, politicaldecentralization refers to the degree to which central governments allow non-central government entities to undertake the political functions of governance,such as representation.
Decentralized systems are those in which central entities play a lesser role inany or all of these dimensions. In such systems, central governments possess asmaller share of fiscal resources, grant more administrative autonomy, and/orcede a higher degree of responsibility for political functions. Because decen-tralization is a relative concept, each dimension should be measured in termsof the central government proportion of the overall total. It is critical to exam-ine each dimension, identifying the unique characteristics that set it apart fromthe other dimensions, and at the same time, recognizing that the dimensionsmay be tightly interrelated. Understanding the uniqueness of these dimensionsrequires also understanding their interaction.
This article proposes a measurable definition of decentralization and anempirical test of that definition. The test confirms that three core dimensions ofdecentralization are substantively different yet interrelated. The technique usedto undertake this type of hypothesis test is confirmatory factor analysis of datafrom 1996 for sixty-eight countries (see Appendix 1). This technique tests theconceptual validity of the three dimensions, improves the accuracy of mea-sures of each dimension, and studies the empirical relationships among them.Also, factor analysis generates a score for each case on each dimension, al-lowing countries to be measured according to their level of fiscal, administra-tive, and political decentralization. In future work, these scores can be used forhypothesis testing about the causes of different kinds of decentralization andthe effects of degrees of decentralization on important social outcomes.
Contemporary Decentralization
The current fondness for decentralization began during the 1980s.3 Stagnanteconomies and inefficient central bureaucracies led researchers to consider
,
34 Studies in Comparative International Development / Fall 2003
decentralization as a solution to the problems of developing countries, andmultilateral institutions began to include decentralization components in manyof their programs.4 There were domestic pressures for decentralization also, aslocal politicians and civil society actors sought to capture power from centralgovernments, and national leaders granted access to central power and re-sources as a means of obtaining support from local allies or meeting demandsfor democratization. Ideological support came from both the right and the left,though for different reasons—the former to increase efficiency and the latterto effect a different distribution of power. Additionally, freer trade, interna-tional treaties, and loan conditions led central governments to choose, or beforced, to abdicate their traditional roles, and left critical functions to non-central government entities if they were to be performed at all.5
In short, subnational governments are now doing a larger share of the workof government in both developed and developing countries. As more and morecountries move away from centralized government institutions, the concept ofdecentralization is studied in new contexts. Still, though many of these coun-tries share characteristics of decentralization, there are stark differences in thekind and degree of decentralization that has occurred.
Conceptual Confusion in Decentralization Research
To their credit, researchers have tried to be careful about the way they definedecentralization and the contexts in which they study it. Yet grappling with thedifference in kinds and degrees of decentralization has produced a conceptualmuddle. Researchers have multiplied the conceptualizations of decentraliza-tion; associated the various concepts with different meanings; imbued it withpositive normative value; conflated it with other concepts; and ignored its multi-dimensionality. A survey of the voluminous literature on decentralization sug-gests that decentralization has been approached by a variety of intellectualtraditions (Wallis 1991). Cohen and Peterson (1997: especially Annex I) notethat disciplinary differences and even language differences have led to varia-tions in the application of the concept.6 By way of contrast, decentralization’santonym, centralization, has a much more precise and accepted usage, whichis the concentration of power, resources, and authority in a single head orcenter.
Concepts with varied meanings do not necessarily present problems, butthey require great care to avoid generating too many meanings (over-specifi-cation) or too few (under-specification) (Lakoff 1987). Either extreme pro-duces conceptual muddle and causal uncertainty, in particular when researchersdelimit the meanings and indicators to accord with their belief systems orassist in proving hypotheses.7 This is especially problematic when the research-ers’ beliefs lead them to associate the concept with normative values, as in thecase of the generally positive value associated with decentralization.
In many cases the original decentralization concept becomes simply conflatedwith other evaluative concepts. For example, much research has included de-mocracy or market reforms in the definition of decentralization.8 The problem,
Schneider 35
of course, is that the relationship between decentralization and these otherconcepts is a causal hypothesis that must be empirically tested.
In an attempt to avoid confusion, researchers use alternate terms that do notcarry normative implications; for example, multi-level government, de-cen-tered governance, multiple centers of government, dispersed government, etc.However, this strategy does not eliminate the underlying problem, which ishow to define and measure the concept. As a result researchers often end uptalking past one another. For example, using different definitions can intro-duce different measures of decentralization in the same case.9 Researchers canalso create confusion by focusing on different levels of analysis; some studydecentralization by examining local-level institutions while others examinenational averages. Those attempting to draw implications from the research,such as policymakers, cannot help but be confused.
This article suggests that some of the conceptual and causal tangle can beundone by distinguishing among the multiple dimensions of decentralization.If there are multiple dimensions, then decentralization along one dimensioncould be related to one set of causes and effects, and decentralization alonganother dimension could relate to a different or opposite set of causes andeffects. Alternatively, decentralization along one dimension could interact orcombine with decentralization along another dimension (to produce outcomes).Researchers who do not explicitly look at each dimension or haphazardly ag-gregate dimensions will mismeasure the type and degree of decentralizationand draw incorrect inferences about the relationship between decentralizationand other phenomena. To disentangle these relationships it is necessary toconceptualize the dimensions separately and theorize their interactions. To testthe accuracy of the model, the article will develop measures for each dimen-sion and test the measurement model against the actual distribution of cases.Only then can we identify examples of decentralization, more or less, andbegin to undertake causal analysis.10
Conceptualizing and Measuring the Decentralization Concept
The current approach differs from prior approaches by hypothesizing a con-ceptual model for the decentralization concept and then offering an empiricaltest of that model. The most common conceptualizations of decentralization inthe literature have concentrated on those institutions receiving power or re-sources.11 In contrast, this article will measure the dimensions of decentraliza-tion in terms of the degree to which power and resources are taken away fromcentral governments. All forms of decentralization, regardless of the recipient,involve shifting power and resources away from the central government.
This article builds on applications of the decentralization concept in theo-ries of fiscal federalism, public administration, and political science. Each ofthese theories highlights a dimension of decentralization, which are treated asdistinct and separable. In addition, the current approach suggests that empiri-cal tests of cross-national data will both measure decentralization and confirma model of the concept that consists of three distinct dimensions. Before pro-ceeding to the statistical test, it is worthwhile to discuss the conceptual frame-
36 Studies in Comparative International Development / Fall 2003
work that underlies the measurement model and the indicators that will beused.
Fiscal Federalism
Fiscal federalism theories dealing with decentralization focus on maximizingsocial welfare, which is portrayed as a combination of economic stability,allocative efficiency, and distributive equity. The precise combination andimportance attached to each goal depends on the context, but the challenge ofdecentralization is essentially to locate resources at the level of governmentthat optimizes social welfare (Musgrave 1958: 132-33, 175-178).
It is important to determine the degree to which each level of governmenthas fiscal impact (Oates 1972: 17). To what degree do the resources handledby each level of government have an impact on these outcomes? If resourceshave been ceded to subnational units, then central governments have, to onedegree or another, less fiscal impact. One of the ways in which fiscal impact isevident is in looking at collateral for credit. Governments that handle largeamounts of resources, whether those resources are tied to expenditures or not,are able to draw on credit resources.
Expenditures and revenues form the two main components of fiscal activ-ity.12 Central to any system of public finance, they comprise the total amountof money that governments put into or take out of an economy as well aswhere governments put the money and where they take it from. The currentstudy hypothesizes that the best indicator for the level of fiscal centralizationor decentralization is the share of subnational expenditures and revenues.
The choice of focusing on fiscal instruments rather than regulatory or finan-cial policies is partly methodological and partly substantive. Governments usevarious instruments to influence the amount and distribution of wealth in soci-ety. Because regulatory instruments are built into the formal and informal in-stitutions that govern civil society and private sector, they are extremely complexand context-specific. Financial instruments are similarly difficult to measurewith statistics, and their impact on distribution is not as direct as fiscal policy.Fiscal policy offers the best window into levels of fiscal decentralization. De-centralization of regulatory or financial mechanisms will thus have to be takenup in individual country studies.
Despite being easier to measure, fiscal instruments still present some meth-odological difficulties. Though the IMF has attempted to standardize its defini-tion of decentralization, it remains extremely difficult to attain accuratemeasurement using self-reported statistics.13 What is measured as a local ex-penditure or revenue in one context may be scored as a nationally controlledresource in another.
Nevertheless, there are several advantages to focusing on revenues and ex-penditures. First, revenues and expenditures offer the best measures availablewithout detailed study of each country. Second, by using both expendituresand revenues, we tap into the main aspects of fiscal decentralization. The keyattribute of fiscal decentralization is the fiscal impact of subnational govern-ments relative to the overall impact of government. This article hypothesizes
Schneider 37
that subnational expenditures and revenues as a percentage of total expendi-tures and revenues provide useful measures of this concept. These indicatorsare related but not exactly the same, as empirical testing will show. Expendi-tures focus on the amount of government activity that governments undertake,and revenues focus on the quantity of resources that pass through them.
Expenditures constitute all cash outlays by a given level of government.They can be examined as a whole, over time, in terms of revenues, as a per-centage of GDP, in distinct subsections, in subsections as a percentage of someother variable, in constant values, in current values, or as appears here, as apercentage of all government outlays. Each treatment offers a slightly differ-ent perspective on spending policy, but viewing subnational expenditures as apercentage of total expenditures is the most appropriate way to gauge fiscaldecentralization.14 There are some drawbacks to presenting expenditures as apercentage of total expenditures, as this measurement misses those expendi-tures that do not appear as cash outlays, such as credit guarantees, nor does itdistinguish expenditures decided locally. Still, viewing subnational expendi-tures as a percentage of total expenditure focuses on fiscal impact exercisedby lower governments as opposed to that exercised by central governments. Alarger proportion of the expenditures spent by lower level governments indi-cates that fiscal impact has shifted away from the central government.
The revenue side of fiscal decentralization is composed of all cash inflowsto subnational governments, including taxes, loans, and grants. As in the caseof expenditures, these can be examined in a number of ways and with respectto other variables, and each treatment offers a different view of revenue policy.As with expenditures, the indicator chosen is subnational revenue as a per-centage of total government revenue, which focuses on the fiscal revenues inthe hands of subnational governments as opposed to those revenues in thehands of the center.15 A larger proportion of revenues collected by subnationalgovernments indicates that fiscal impact has shifted away from the centralgovernment.
Intentionally, this conceptualization has focused on the degree of central-ization/decentralization of fiscal impact and does not evaluate the autonomypossessed by local units. Autonomy is the focus of the next category, adminis-trative decentralization, which draws on theories of public administration.
Public Administration
Public administration theories dealing with decentralization broadly focus onhow modern bureaucracies are achieved, which have been defined as effi-cient, effective, and rational (Weber 1968: esp. 926-39, 956-89). There is sig-nificant debate about whether these attributes operate in tandem or if there aretrade-offs. The combination likely depends on individual cases. Administra-tive arguments focus on the administrative effects of granting local jurisdic-tions autonomy from central control. This autonomy is constituted by generalpolicymaking authority and personnel control, as well as control over publicfinances (Rondinelli 1984).
The amount of administrative decentralization ranges in a continuum across
38 Studies in Comparative International Development / Fall 2003
systems, from those characterized by a low degree of autonomy, to those witha high degree of autonomy. Previous literature has categorized administrativedecentralization generally using three terms, most commonly labeled“deconcentration,” “delegation,” and “devolution” (see Rondinelli 1990).16
The current approach to decentralization views these categories as nothingmore than points along a continuum of administrative autonomy.Deconcentration involves the least amount of autonomy, delegation slightlymore, and devolution the most. The following section discusses the categoriesused in the literature and makes the case for treating them within the con-tinuum of administrative autonomy.
“Deconcentration” refers to a central government that disperses responsi-bility for a policy to its field offices. This transfer changes the spatial andgeographical distribution of authority, but does not significantly change theautonomy of the entity that receives the authority. Under deconcentration ar-rangements, the central government retains authority over the field office, andexercises that authority through the hierarchical channels of the central gov-ernment bureaucracy. Deconcentration allows only moderately more autonomythan centralized systems.
By contrast, “delegation” transfers policy responsibility to local govern-ments or semiautonomous organizations that are not controlled by the centralgovernment but remain accountable to it. The main difference betweendeconcentration and delegation is that the central government exercises itscontrol through a contractual relation that enforces accountability of local gov-ernment. This represents a slightly higher level of administrative autonomy forlocal entities than under deconcentration.
Finally, under “devolution,” the central government allows quasi-autono-mous local units of government to exercise power and control over the trans-ferred policy. Compared to the other two types of administrative decentralization,devolution provides the greatest degree of autonomy for the local unit. Thelocal unit is only accountable to the central government insofar as the centralgovernment can impose its will by threatening to withhold resources or re-sponsibility from the local unit.
What discriminates among these categories of administrative decentraliza-tion is the relationship between the central government and the entity thatreceives power and resources. Deconcentration involves a bureaucratic, hier-archical relationship; delegation involves a contractual relationship; and devo-lution involves an arm’s-length relationship. The differences in kind amongthese relationships—between hierarchy, contract, or arm’s length—constitutea syndrome of factors. The best way to summarize that syndrome is in payingattention to the degree of autonomy granted by the central government. Sucha simplification perhaps misses some of the conceptual richness of the differ-ent relationships, but is sufficient for measuring the continuum of administra-tive autonomy.17
One way to measure levels of local administrative autonomy is by examin-ing the control exercised over local revenue. The percentage of local revenuesfrom taxes provides an indicator of the degree of subnational control overresources. Taxes are different from the total amount of resources, which is
Schneider 39
more a measure of wealth rather than control. As mentioned before, subnationalrevenues are a combination of taxes, transfers, grants, and loans. Taxes offerthe greatest degree of autonomy, grants, and loans offer somewhat less, anddiscretionary transfers probably the least. Transfers, even supposedly auto-matic ones, can be withheld, and grants and loans generally arrive with condi-tions or with expenditures earmarked.18
A second measure of subnational autonomy is the percentage of total grantsand revenues not accounted for by transfers. This could conceivably includetaxes, loans, fees, sales of assets, or informal contributions. There are somedrawbacks to excluding all transfers, which do not distinguish for examplebetween transfers over which lower levels of government have total control,such as block grants, and transfers that are tied to central government priori-ties, such as earmarked transfers, or transfers that require certain behaviors bysubnational governments, such as matching or fiscal balance. Still, the treat-ment of all revenues aside from transfers gives an indication of the degree towhich subnational governments raise their own funds through taxes, loans,fees, or sales of assets.
It is worth noting that this measure leaves out the political criterion associ-ated with the devolution category of administrative decentralization. Undermost definitions, devolution requires recipients of decentralization be demo-cratically elected local bodies. Such a definition includes patterns of represen-tation in the administrative dimension, which is meant to refer to degrees ofautonomy. Representation deserves attention in its own right, however, as thecore characteristic of the next dimension, political decentralization.
Political Decentralization
Political science theories dealing with decentralization focus on mobilization,organization, articulation, participation, contestation, and aggregation of in-terests. All political systems perform these processes, and the way in whichthey occur depends on individual contexts. Decentralized political systemsare those in which political actors and issues are significant at the local leveland are at least partially independent from those at the national level (Fox andAranda 1996).
The best way to summarize these functions might be in terms of representa-tion, which refers to the way political institutions “map the multiplicity of citi-zen interests onto policy decisions” (Litvack et al. 2000: 6). To have an impacton policy, interests in society must be mobilized, organized, and articulatedthrough institutions that carry interests to the state (Berger 1983). Some sys-tems of representation operate through civil society institutions, such as NGOs,social movements, or interest organizations. Other systems of representation,such as political parties, aim to bring interests directly into the official politicalapparatus through elections. Finally, some systems of representation bring in-terests into direct negotiation with the state bureaucracy, as in corporatist bar-gaining.19 All systems of representation are bound by institutions of the stateitself, which sets the rules for representation and thus shapes what issues getpoliticized and how. Under politically decentralized systems citizens define
40 Studies in Comparative International Development / Fall 2003
interests and form identities on the basis of local concerns, and organizationssuch as parties and social movements operate locally and compete over localissues and in local elections.
In this article elections are held to be the most obvious indicator of repre-sentation occurring at different levels. During the electoral process, the elec-torate votes, the votes are aggregated, and politicians take power. Local electionsindicate that some portion of representative activity is being undertaken at thelocal level, forcing parties to organize for local contests. Candidates must com-pete and make appeals to citizens in local jurisdictions. Citizens may organizeand participate through non-electoral channels, but these are harder to charac-terize, and probably do not have as direct an impact on representation. Ofcourse, the importance of local elections in the larger national picture canvary, but local elections at least increase the likelihood that some politicalfunctions will be decentralized.20 The existence of elections at the municipallevel or the state/provincial level is hypothesized here as an indicator of politi-cal decentralization.
Though there are other political functions, electoral components are themost valid indicators of political decentralization as they tap into fundamentalaspects of political authority. Elections address the issue of representation,which is the primary way interests gain access to legislative and executivepower.
Interrelations Among the Dimensions
The preceding discussion of approaches to decentralization outlines three di-mensions for analysis: fiscal decentralization, administrative decentralization,and political decentralization. What has not yet been discussed, but remainspertinent, is the degree to which these dimensions are interrelated. This inter-relationship can contribute to conceptual confusion, as decentralization alongone dimension may influence or cross over into decentralization along an-other dimension. Without accounting for this interrelationship, measures willover- or underestimate the amount of decentralization.
First let us consider the range of possible ways that dimensions could inter-act. One possible pattern is that increasing decentralization in one dimensionleads to an increase in decentralization in another dimension. A second patternis that increasing decentralization in one dimension leads to a decrease in de-centralization in another dimension. Three dimensions produce six differentcombinations.21
Without speculating too much, it makes sense to describe how a few ofthese interactions might operate. For example, fiscal decentralization mightgenerate greater administrative decentralization if local units used increasedresources to assert administrative autonomy from the center.22 Alternatively,fiscal decentralization might lead to less administrative decentralization if cen-tral governments systematically counteracted the release of resources with anincrease in bureaucratic or regulatory controls. Similar scenarios could be de-scribed for the relationships between each dimension.
Even if one accepts the argument that there are three unique and interrelated
Schneider 41
dimensions to decentralization, empirical measurement and confirmation re-mains a difficult task. There are three questions to answer:
• First, to what degree can decentralization be understood in terms of fiscal decentrali-zation, administrative decentralization, and political decentralization? In other words,do we really need all three dimensions, or alternatively, might there be others?
• Second, to what degree and in what ways are these dimensions related to one an-other?
• Third, is the measurement of decentralization dimensions sophisticated enough toproduce a meaningful scale? Can we design a measure that validly and accuratelyallows us to order countries in terms of their relative amounts of decentralization?
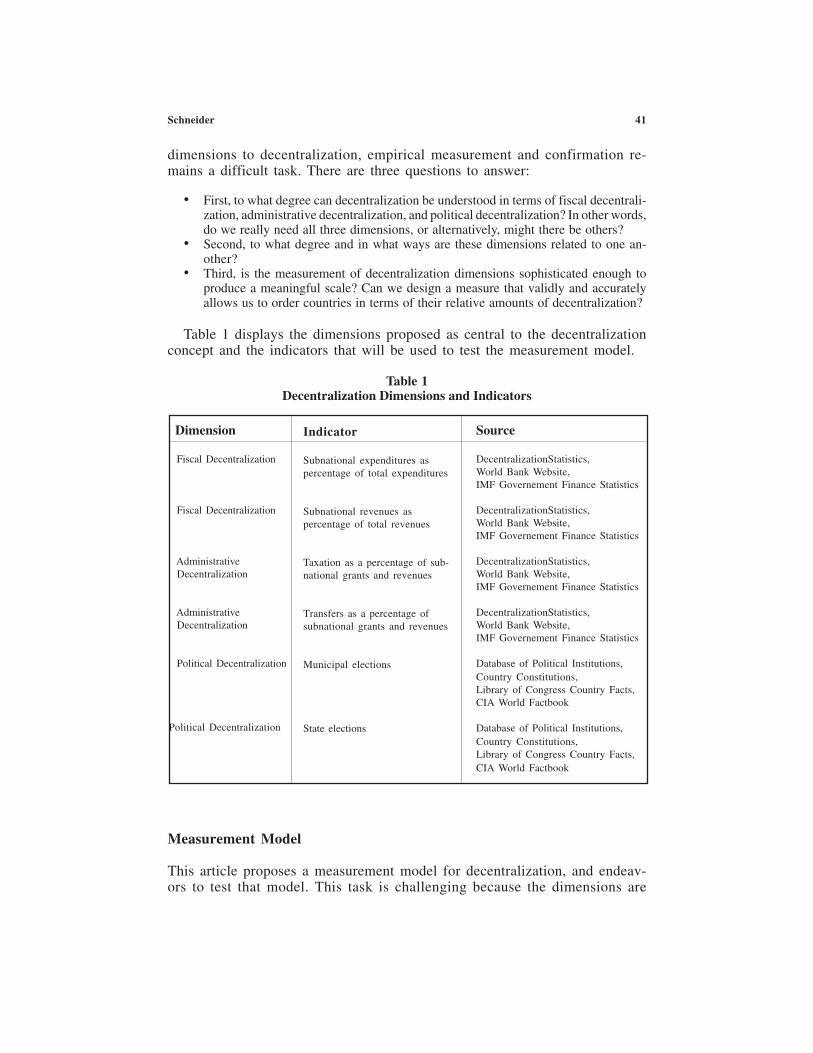
Table 1 displays the dimensions proposed as central to the decentralizationconcept and the indicators that will be used to test the measurement model.
Measurement Model
This article proposes a measurement model for decentralization, and endeav-ors to test that model. This task is challenging because the dimensions are
Table 1Decentralization Dimensions and Indicators
Dimension
Fiscal Decentralization
Fiscal Decentralization
Administrative Decentralization
Administrative Decentralization
Political Decentralization
Political Decentralization
Indicator
Subnational expenditures aspercentage of total expenditures
Subnational revenues aspercentage of total revenues
Taxation as a percentage of sub-national grants and revenues
Transfers as a percentage ofsubnational grants and revenues
Municipal elections
State elections
Source
DecentralizationStatistics,World Bank Website,IMF Governement Finance Statistics
DecentralizationStatistics,World Bank Website,IMF Governement Finance Statistics
DecentralizationStatistics,World Bank Website,IMF Governement Finance Statistics
DecentralizationStatistics,World Bank Website,IMF Governement Finance Statistics
Database of Political Institutions,Country Constitutions,Library of Congress Country Facts,CIA World Factbook
Database of Political Institutions,Country Constitutions,Library of Congress Country Facts,CIA World Factbook
42 Studies in Comparative International Development / Fall 2003
difficult to measure, and any metric for one dimension is likely to simulta-neously pick up elements of the others. In part, this is because there are causalrelationships among the dimensions (political decentralization may contributeto fiscal decentralization, etc.), but also because any quantitative measure islikely to be somewhat imprecise. No single indicator can capture the decen-tralization concept fully, and no simple combination of indicators, such as anaverage or an index, can capture the multidimensionality of the concept. Whatis to be done?
The model proposed here conceptualizes decentralization as three distinctbut interrelated dimensions that can be measured using the six indicators de-scribed above. Factor analytic techniques applied to the indicators can calcu-late the unique and interrelated characteristics of the different dimensions ofdecentralization and test whether the model is accurate. This technique of pro-posing and testing a measurement model using factor analysis is known asconfirmatory factor analysis, and it rests on the intuition that underlying con-cepts, such as the dimensions of decentralization, are manifest in empiricallyobserved indicators.23
The specific hypotheses to be tested are 1) that decentralization consists ofthree abstract dimensions; and 2) each of the six indicators is closely related toone of the three dimensions. If the most statistically accurate grouping dividesthe indicators into three clusters according to shared characteristics, this analy-sis confirms that there are three underlying dimensions, as opposed to two orfour (or some other number).24 The largest factor coefficients should relateindicators to the dimension they are hypothesized to measure. For example,the largest factor coefficient of subnational percentage of expenditures shouldbe the coefficient related to the fiscal decentralization dimension.
Each indicator will be related, at least slightly, to each dimension. Partly,this is because the measures are imperfect indicators of each dimension. Inaddition, the coefficients reflect the fact that the dimensions are related to eachother. For example, politically decentralized systems might find local politicalweight used to allocate more resources to lower levels of government. As aresult, part of the subnational revenues indicator should not be attributed tofiscal decentralization but reflects characteristics derived from the politicaldecentralization dimension.
Factor analysis uses this information to improve measurement in ways thatsimple aggregation or indexes cannot. This analysis separates the impact ofeach dimension and calculates its size in the factor coefficients. We can usethese relationships to calculate case scores on each dimension. The factor co-efficient measures the intensity of the relationship between each variable andeach dimension and can be multiplied by each case score for each variable.The sum of the coefficients times the case scores gives a factor score for eachcase in each dimension. In other words, the analysis produces a measure offiscal decentralization, administrative decentralization, and political decentrali-zation in each case. In fact, this measure is superior to other methods of mea-surement that do not take as many indicators into account and/or that do notattempt to separate the unique and shared characteristics of each indicator.25
,
Schneider 43
Cases and Data
This article applied confirmatory factor analysis to decentralization data col-lected from sixty-eight countries in 1996. The data included fiscal indicatorsfrom IMF Government Finance Statistics, obtained from the World Bank websiteon decentralization, and filled in missing values with data from the 2001 IMFhardcopy publication where available. Other data were collected in the Data-base of Political Indicators collected by researchers at the World Bank and theGovernment of Switzerland. Missing political data was obtained from countryconstitutions, Library of Congress Country Facts, and the CIA Factbook.26
In cases in which there was no fiscal data available from 1996 but data fromother years in the 1990s were available, linear trends obtained through regres-sion analysis of available data filled the 1996 data. As most fiscal indicatorsare variables that change incrementally over time, if at all (expenditures, rev-enues, etc.), this practice was not likely to change the results. Interpolating thedata across years provided more cases for analysis, though the results wereunchanged by using data from a single year alone.
Special care was also taken in relation to indicators that were related tovariables that might confound the analysis, such as the type of regime. Thiswas particularly the case for the political decentralization indicators that fo-cused on elections and electoral rules. Some non-democracies held electionsand data was therefore available for the political decentralization indicators.Nevertheless, some might argue that the representation that occurs in non-democracies, however decentralized, is substantively different than that oc-curring in democracies. A local election in which the national government isauthoritarian or in which only one party competes can hardly be called com-petitive, and probably does a poor job of decentralizing political functions. Toaddress this issue, the analysis also examined only democratic cases, and nosignificant changes in results occurred.27
Factor Analysis
Confirmatory factor analysis was used to test the hypothesis that three dimen-sions of decentralization (fiscal, administrative, and political) underlay mea-surable indicators. The six indicators were: 1) subnational expenditures as apercentage of expenditures; 2) subnational revenues as a percentage of totalrevenue items; 3) the relative importance of tax as a percentage of subnationalrevenues; 4) the relative importance of transfers as a percentage of subnationalrevenues; 5) the existence of municipal elections; and 6) the existence of stateor provincial elections. The hypothesis was that the first two indicators mea-sured mostly fiscal decentralization; the third and fourth indicators measuredadministrative decentralization; and the last two indicators measured politicaldecentralization.28
The number of cases with data available on all indicators was sixty-eight.Among these cases, the mean percentage of subnational expenditures as apercentage of total expenditures was 22.27 and the mean percentage ofsubnational revenues was 17.24. The mean percentage of subnational rev-
44 Studies in Comparative International Development / Fall 2003
Scree Plot
Component Number 6 5 4 3 2 1
Eigenvalue
3.0
2.5
2.0
1.5
1.0
.5 0.0
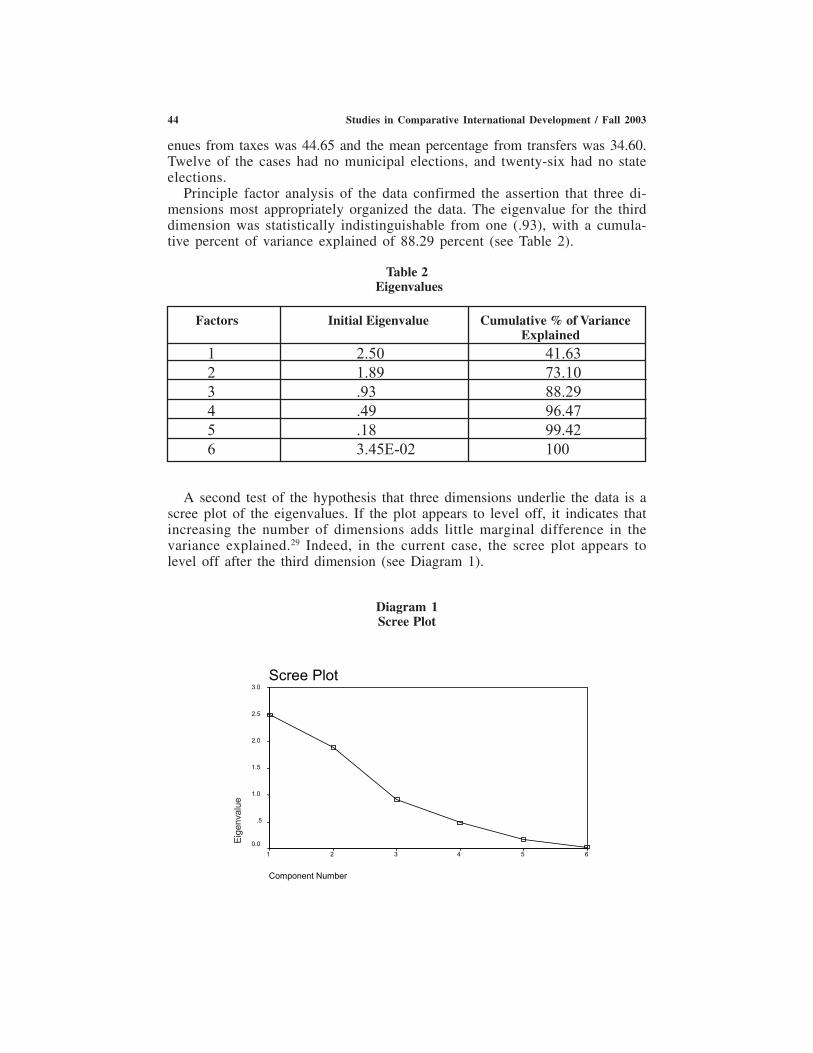
enues from taxes was 44.65 and the mean percentage from transfers was 34.60.Twelve of the cases had no municipal elections, and twenty-six had no stateelections.
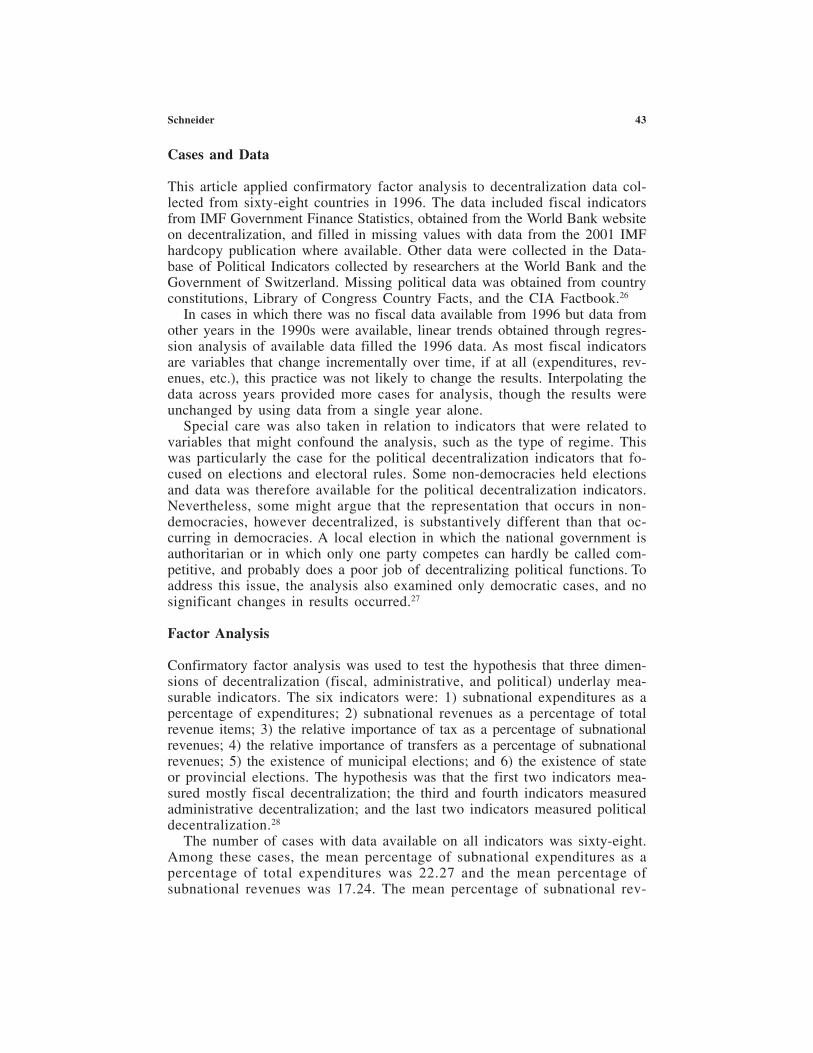
Principle factor analysis of the data confirmed the assertion that three di-mensions most appropriately organized the data. The eigenvalue for the thirddimension was statistically indistinguishable from one (.93), with a cumula-tive percent of variance explained of 88.29 percent (see Table 2).
Table 2 Eigenvalues
Factors Initial Eigenvalue Cumulative % of VarianceExplained
1 2.50 41.63 2 1.89 73.10 3 .93 88.29 4 .49 96.47 5 .18 99.42 6 3.45E-02 100
A second test of the hypothesis that three dimensions underlie the data is ascree plot of the eigenvalues. If the plot appears to level off, it indicates thatincreasing the number of dimensions adds little marginal difference in thevariance explained.29 Indeed, in the current case, the scree plot appears tolevel off after the third dimension (see Diagram 1).
Diagram 1Scree Plot
Eige
nval
ue
Schneider 45
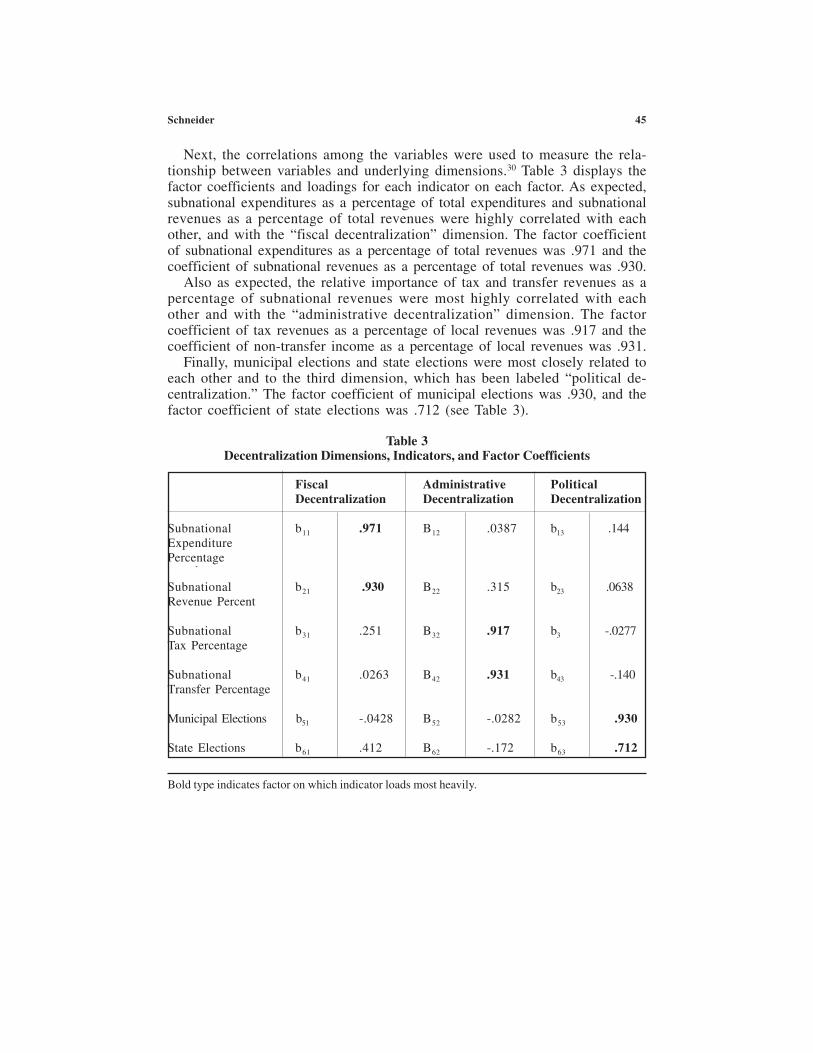
Next, the correlations among the variables were used to measure the rela-tionship between variables and underlying dimensions.30 Table 3 displays thefactor coefficients and loadings for each indicator on each factor. As expected,subnational expenditures as a percentage of total expenditures and subnationalrevenues as a percentage of total revenues were highly correlated with eachother, and with the “fiscal decentralization” dimension. The factor coefficientof subnational expenditures as a percentage of total revenues was .971 and thecoefficient of subnational revenues as a percentage of total revenues was .930.
Also as expected, the relative importance of tax and transfer revenues as apercentage of subnational revenues were most highly correlated with eachother and with the “administrative decentralization” dimension. The factorcoefficient of tax revenues as a percentage of local revenues was .917 and thecoefficient of non-transfer income as a percentage of local revenues was .931.
Finally, municipal elections and state elections were most closely related toeach other and to the third dimension, which has been labeled “political de-centralization.” The factor coefficient of municipal elections was .930, and thefactor coefficient of state elections was .712 (see Table 3).
Table 3Decentralization Dimensions, Indicators, and Factor Coefficients
ˆ
ˆFiscal Administrative PoliticalDecentralization Decentralization Decentralization
Subnational b11 .971 B12 .0387 b13 .144ExpenditurePercentage
Subnational b21 .930 B22 .315 b23 .0638Revenue Percent
Subnational b31 .251 B32 .917 b3 -.0277Tax Percentage
Subnational b41 .0263 B42 .931 b43 -.140Transfer Percentage
Municipal Elections b51 -.0428 B52 -.0282 b53 .930
State Elections b61 .412 B62 -.172 b63 .712
Bold type indicates factor on which indicator loads most heavily.
46 Studies in Comparative International Development / Fall 2003
Factor analysis also allows us to determine the degree to which the dimen-sions are related to one another. Given the nature of the decentralization con-cept, in which one kind of decentralization is expected to influence other kinds,correlation among the dimensions was expected. Nevertheless, the factor analy-sis showed that the correlation between the dimensions was relatively smalland statistically insignificant. Between fiscal decentralization and administra-tive decentralization, the correlation coefficient was -.13. Between administra-tive decentralization and political decentralization the correlation coefficientwas .11, and between fiscal decentralization and political decentralization thecorrelation coefficient was zero. None of the coefficients were statistically sig-nificant. Though this result was somewhat surprising, it supported the assump-tion that the dimensions could be analyzed as though they were orthogonal.
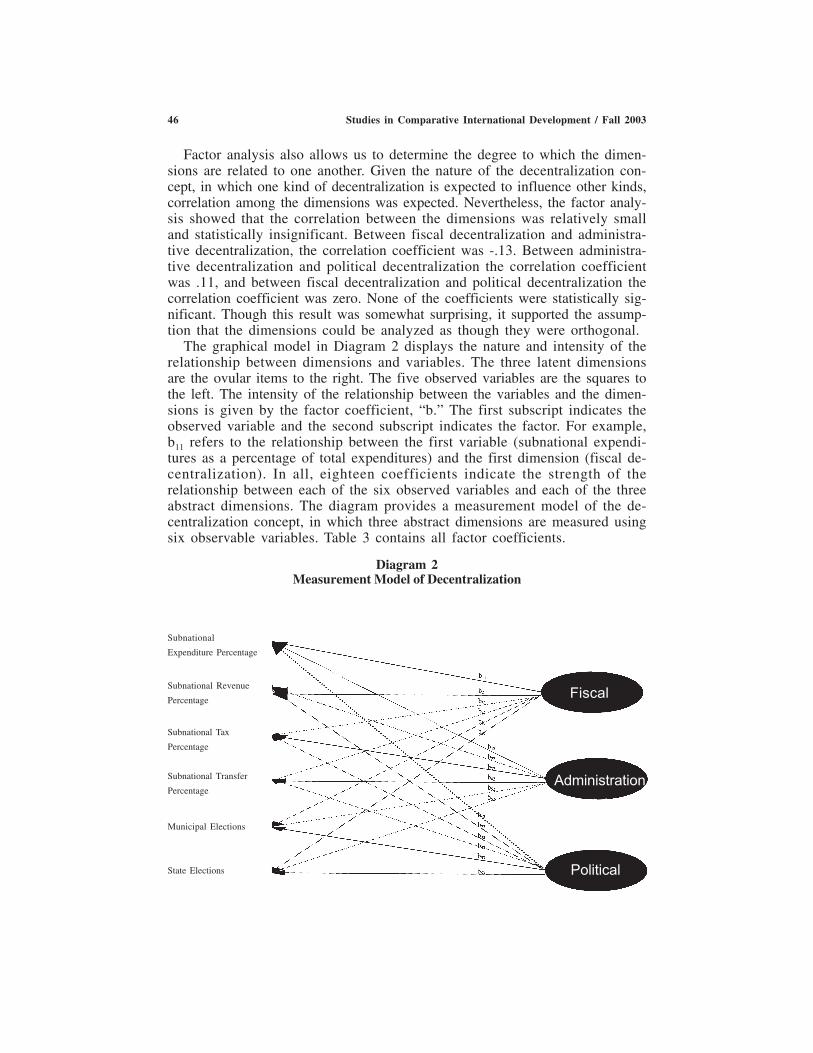
The graphical model in Diagram 2 displays the nature and intensity of therelationship between dimensions and variables. The three latent dimensionsare the ovular items to the right. The five observed variables are the squares tothe left. The intensity of the relationship between the variables and the dimen-sions is given by the factor coefficient, “b.” The first subscript indicates theobserved variable and the second subscript indicates the factor. For example,b11 refers to the relationship between the first variable (subnational expendi-tures as a percentage of total expenditures) and the first dimension (fiscal de-centralization). In all, eighteen coefficients indicate the strength of therelationship between each of the six observed variables and each of the threeabstract dimensions. The diagram provides a measurement model of the de-centralization concept, in which three abstract dimensions are measured usingsix observable variables. Table 3 contains all factor coefficients.
Diagram 2Measurement Model of Decentralization
,
Fiscal
Administration
Political
Subnational
Expenditure Percentage
Subnational Revenue
Percentage
Subnational Tax
Percentage
Subnational Transfer
Percentage
Municipal Elections
State Elections
Schneider 47
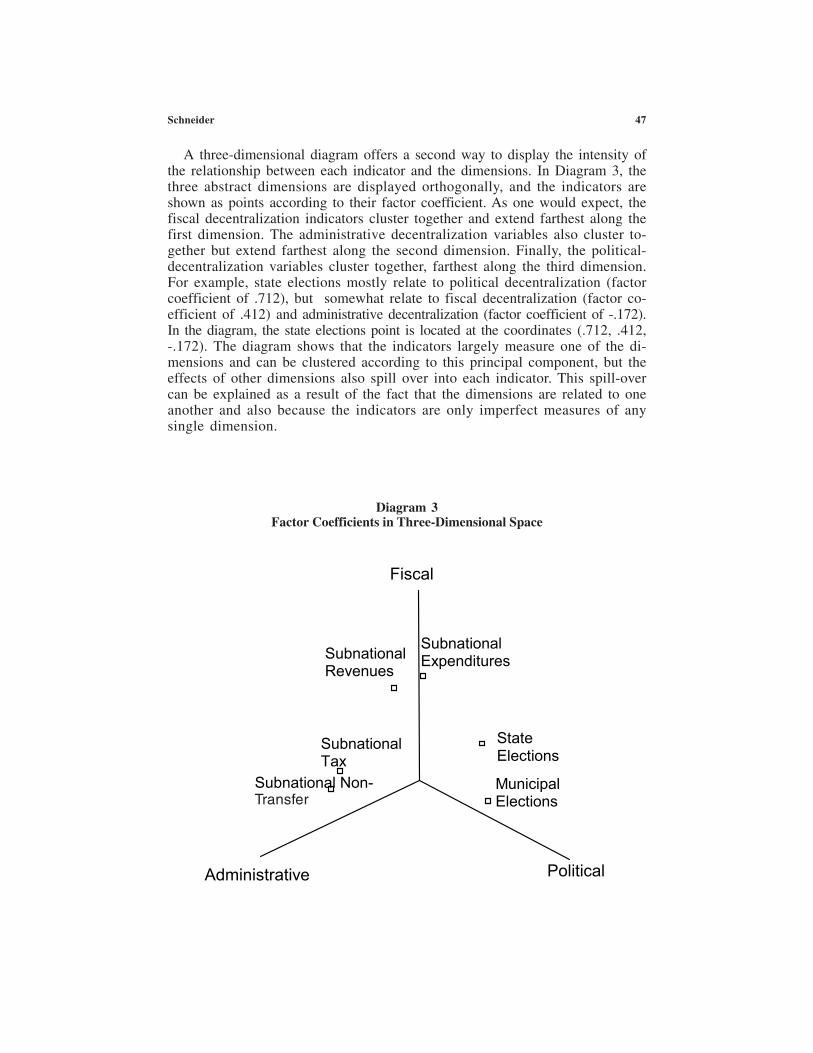
A three-dimensional diagram offers a second way to display the intensity ofthe relationship between each indicator and the dimensions. In Diagram 3, thethree abstract dimensions are displayed orthogonally, and the indicators areshown as points according to their factor coefficient. As one would expect, thefiscal decentralization indicators cluster together and extend farthest along thefirst dimension. The administrative decentralization variables also cluster to-gether but extend farthest along the second dimension. Finally, the political-decentralization variables cluster together, farthest along the third dimension.For example, state elections mostly relate to political decentralization (factorcoefficient of .712), but somewhat relate to fiscal decentralization (factor co-efficient of .412) and administrative decentralization (factor coefficient of -.172).In the diagram, the state elections point is located at the coordinates (.712, .412,-.172). The diagram shows that the indicators largely measure one of the di-mensions and can be clustered according to this principal component, but theeffects of other dimensions also spill over into each indicator. This spill-overcan be explained as a result of the fact that the dimensions are related to oneanother and also because the indicators are only imperfect measures of anysingle dimension.
Political
Fiscal
Administrative
Subnational Non-Transfer
State Elections
Municipal Elections
Subnational Expenditures
Subnational Tax
Subnational Revenues
Diagram 3Factor Coefficients in Three-Dimensional Space
Transfer
48 Studies in Comparative International Development / Fall 2003
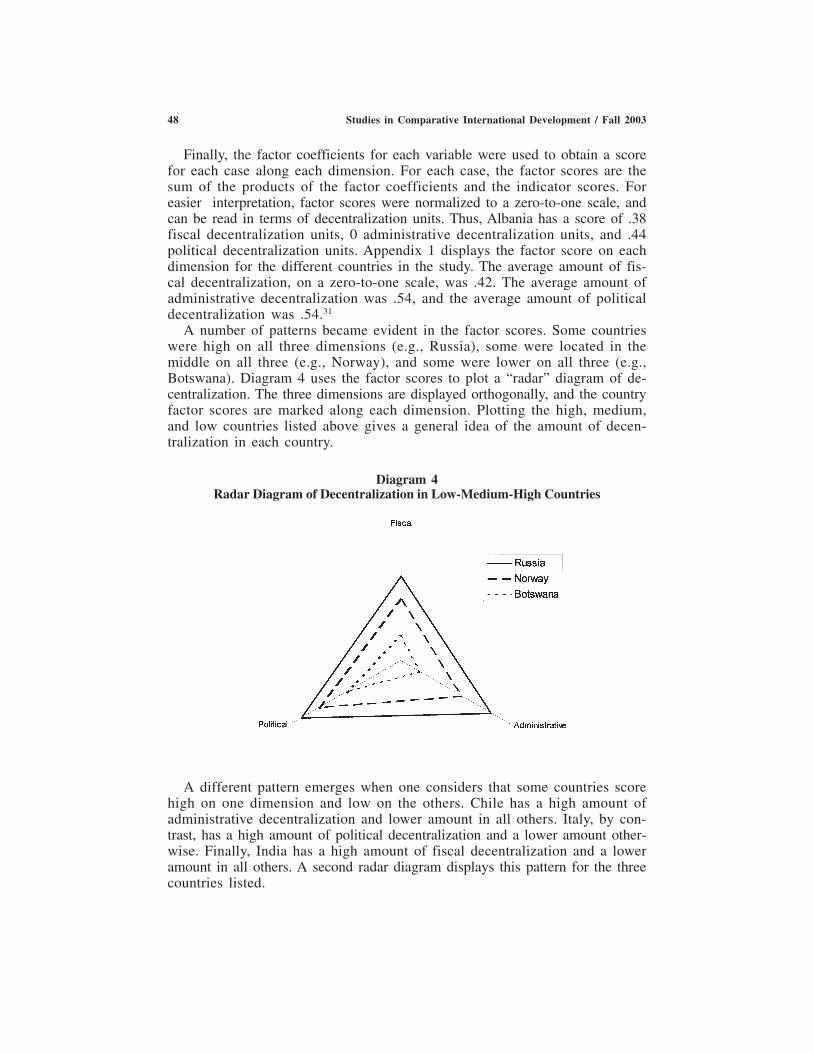
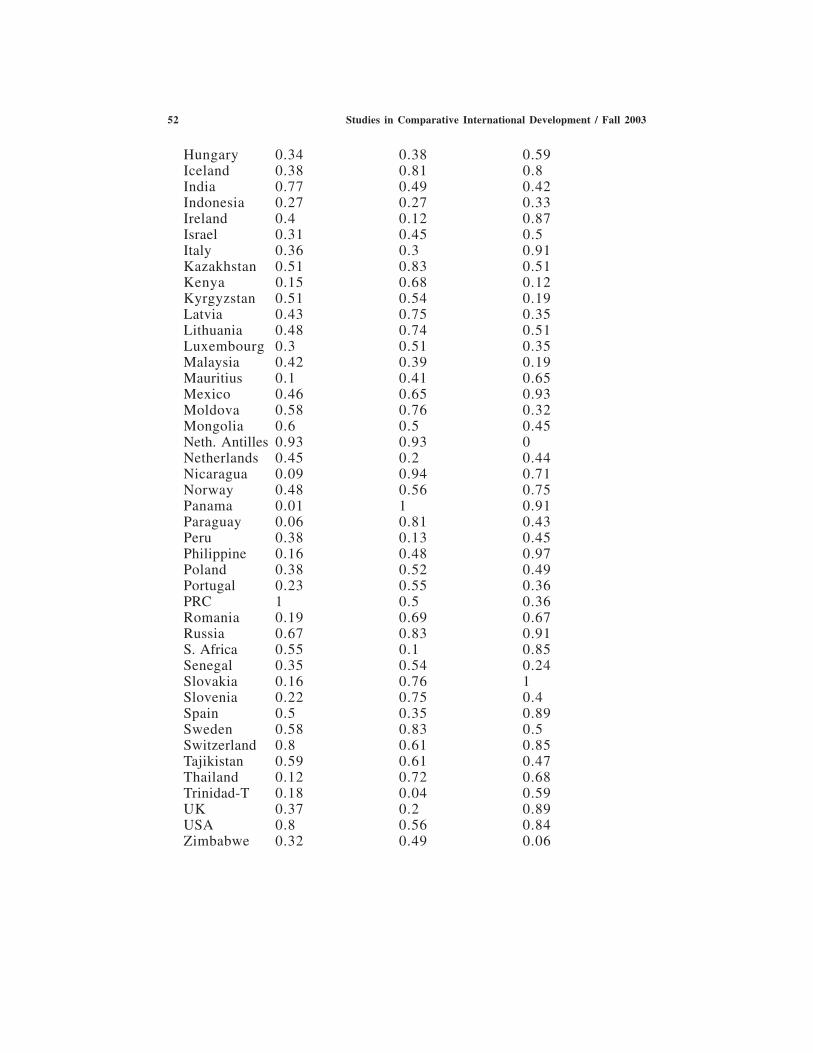
Finally, the factor coefficients for each variable were used to obtain a scorefor each case along each dimension. For each case, the factor scores are thesum of the products of the factor coefficients and the indicator scores. Foreasier interpretation, factor scores were normalized to a zero-to-one scale, andcan be read in terms of decentralization units. Thus, Albania has a score of .38fiscal decentralization units, 0 administrative decentralization units, and .44political decentralization units. Appendix 1 displays the factor score on eachdimension for the different countries in the study. The average amount of fis-cal decentralization, on a zero-to-one scale, was .42. The average amount ofadministrative decentralization was .54, and the average amount of politicaldecentralization was .54.31
A number of patterns became evident in the factor scores. Some countrieswere high on all three dimensions (e.g., Russia), some were located in themiddle on all three (e.g., Norway), and some were lower on all three (e.g.,Botswana). Diagram 4 uses the factor scores to plot a “radar” diagram of de-centralization. The three dimensions are displayed orthogonally, and the countryfactor scores are marked along each dimension. Plotting the high, medium,and low countries listed above gives a general idea of the amount of decen-tralization in each country.
Diagram 4Radar Diagram of Decentralization in Low-Medium-High Countries
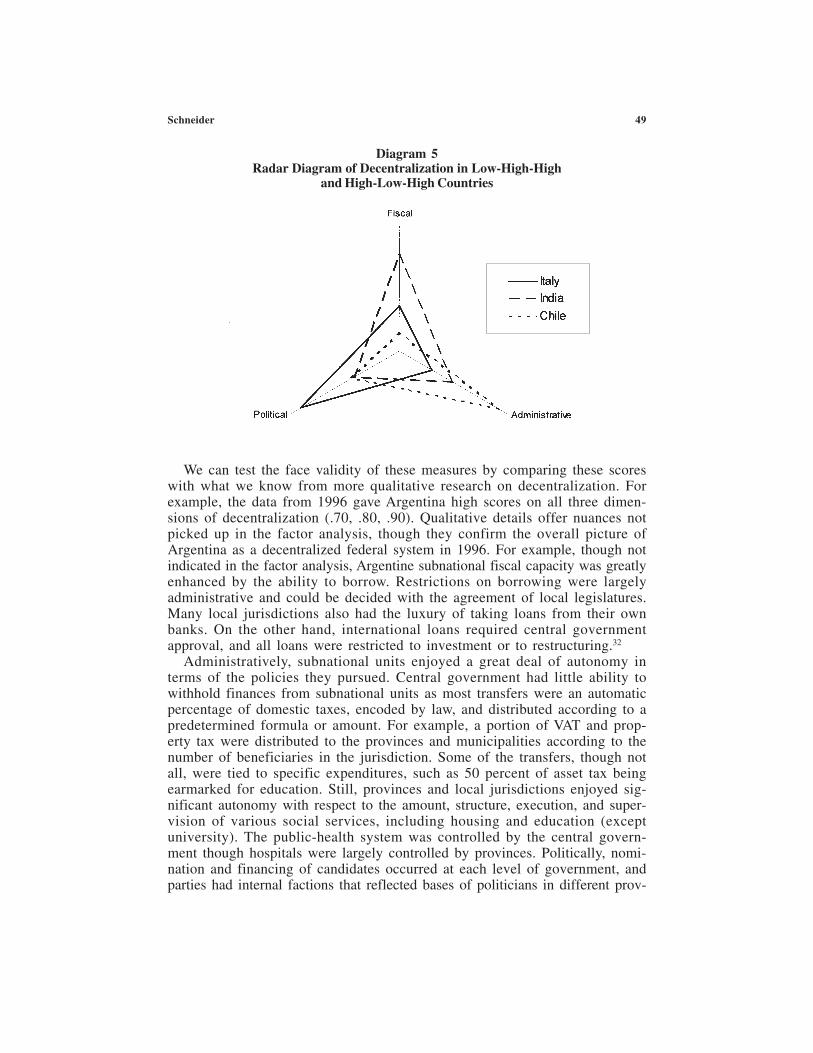
A different pattern emerges when one considers that some countries scorehigh on one dimension and low on the others. Chile has a high amount ofadministrative decentralization and lower amount in all others. Italy, by con-trast, has a high amount of political decentralization and a lower amount other-wise. Finally, India has a high amount of fiscal decentralization and a loweramount in all others. A second radar diagram displays this pattern for the threecountries listed.
Schneider 49
We can test the face validity of these measures by comparing these scoreswith what we know from more qualitative research on decentralization. Forexample, the data from 1996 gave Argentina high scores on all three dimen-sions of decentralization (.70, .80, .90). Qualitative details offer nuances notpicked up in the factor analysis, though they confirm the overall picture ofArgentina as a decentralized federal system in 1996. For example, though notindicated in the factor analysis, Argentine subnational fiscal capacity was greatlyenhanced by the ability to borrow. Restrictions on borrowing were largelyadministrative and could be decided with the agreement of local legislatures.Many local jurisdictions also had the luxury of taking loans from their ownbanks. On the other hand, international loans required central governmentapproval, and all loans were restricted to investment or to restructuring.32
Administratively, subnational units enjoyed a great deal of autonomy interms of the policies they pursued. Central government had little ability towithhold finances from subnational units as most transfers were an automaticpercentage of domestic taxes, encoded by law, and distributed according to apredetermined formula or amount. For example, a portion of VAT and prop-erty tax were distributed to the provinces and municipalities according to thenumber of beneficiaries in the jurisdiction. Some of the transfers, though notall, were tied to specific expenditures, such as 50 percent of asset tax beingearmarked for education. Still, provinces and local jurisdictions enjoyed sig-nificant autonomy with respect to the amount, structure, execution, and super-vision of various social services, including housing and education (exceptuniversity). The public-health system was controlled by the central govern-ment though hospitals were largely controlled by provinces. Politically, nomi-nation and financing of candidates occurred at each level of government, andparties had internal factions that reflected bases of politicians in different prov-
Diagram 5Radar Diagram of Decentralization in Low-High-High
and High-Low-High Countries
50 Studies in Comparative International Development / Fall 2003
inces. On the other hand, a relatively dominant president and party leaderadded a degree of political centralization not reflected in the factor analysis.Overall, the qualitative information on Argentina confirms what the factor analy-sis uncovered.
Did any countries score unexpectedly in the factor analysis? NetherlandsAntilles is unusual , as it scored very high on fiscal decentralization, very highon administrative decentralization, and the lowest on political decentralization(.93, .93, 0). It is possible for a country to decentralize fiscally and administra-tively while retaining political functions at the center; still, this case demandscloser examination. One explanation could be the small size of the Nether-lands Antilles; decentralized political functions may simply not register withthe indicators used. Indeed, the country is a strange one to characterize. It is afederation of five islands that are part of the Dutch Kingdom but autonomousin their internal affairs. The Dutch government manages defense and foreignaffairs while the queen of the Netherlands remains the chief of state. She ap-points a governor general who is the chief executive, and a parliament withtwenty-two members selects a prime minister who carries out executive re-sponsibilities. Each island has its own legislature, though the central govern-ment can overrule any council decision that it deems against the public interest.The odd scoring produced in the factor analysis may be attributable to the factthat the indicators used for political decentralization did not detect the unusualconfiguration of the individual island legislatures. The fiscal and administra-tive indicators, by contrast, did detect this particular structure. Fortunately,excluding Netherlands Antilles from the sample did not significantly changethe ratio order of the other countries.33
Conclusions and Avenues for Future Research
The last two diagrams suggest an interesting direction for future research. Ifcountries vary in their degree of decentralization, and if the amount of decen-tralization varies across dimensions within individual cases, then the unique,and sometimes independent causal importance of different kinds of decen-tralization can be measured and tested with new accuracy. Key research ques-tions in the study of decentralization come into view. What causes countries todecentralize, and what causes them to decentralize along one dimension andnot another? Further, what impact does decentralization have on importantsocial outcomes such as participation, accountability, and redistribution? Whatare the impacts of different kinds of decentralization on these outcomes?
This article proposed a measurement model of decentralization based onthree dimensions of decentralization. It tested and confirmed the model usingdata on six indicators collected from sixty-eight countries. The end result ofthis exercise is an improved measurement of decentralization that allows ques-tions to be asked in a more rigorous analytic fashion. The article invites re-searchers to use the factor score dataset to test their own hypotheses aboutdecentralization.
The article reminds us that systematic measurement of complex conceptsrequires great care. Increasingly, statistical indicators have become available,
Schneider 51
but conceptual confusion clouds our understanding of how to use them. As aresult, a multitude of hypotheses can emerge, and a multitude of definitionscan be applied. To give order to our concepts, this article advances an explic-itly empirical approach that uses conceptual categories to meaningfully orga-nize observations. An empirical approach may not work for all concepts,especially those that defy neat categories and measurable indicators. In addi-tion, techniques that depend on measuring variations, such as factor analysis,will work imperfectly if the real-world distribution of cases does not reflect thefull range of a given concept. Still, where possible, empirical verification ofsocial-science categories is extremely important. A mutually understood set ofconcepts can allow researchers to either agree or disagree in a productive fash-ion, and provide more consistent advice to policymakers.
Appendix 1
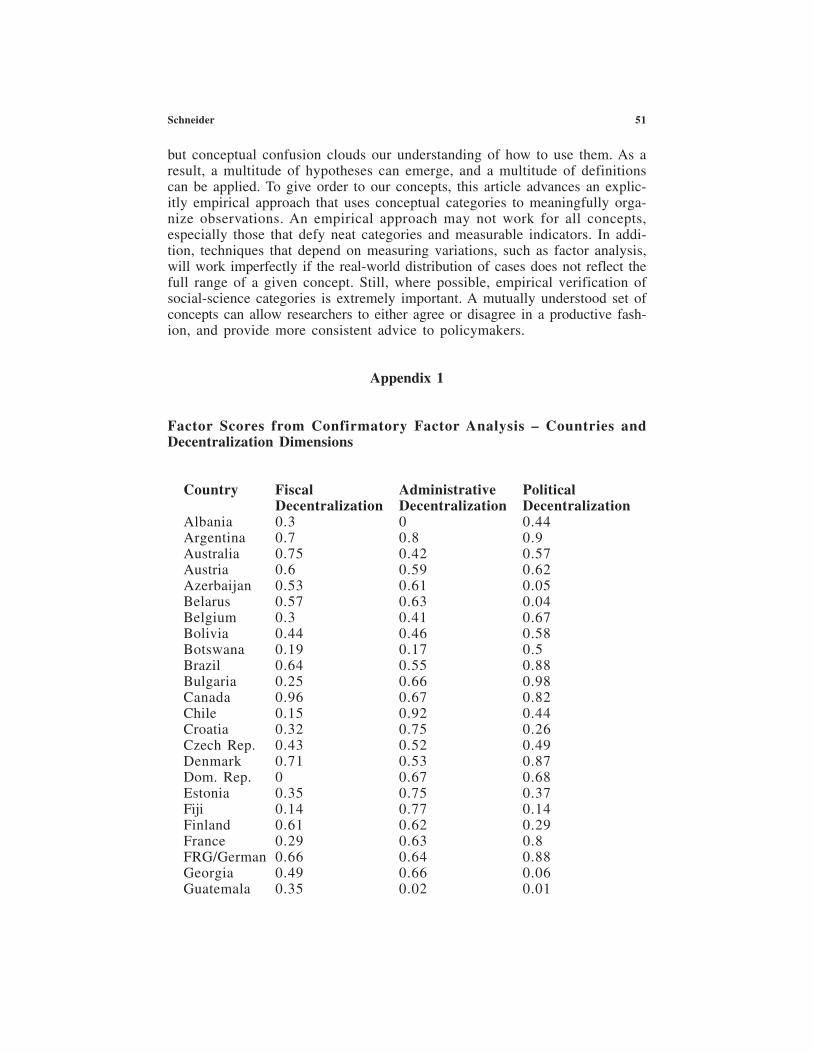
Factor Scores from Confirmatory Factor Analysis – Countries andDecentralization Dimensions
Country Fiscal Administrative PoliticalDecentralization Decentralization Decentralization
Albania 0.3 0 0.44Argentina 0.7 0.8 0.9Australia 0.75 0.42 0.57Austria 0.6 0.59 0.62Azerbaijan 0.53 0.61 0.05Belarus 0.57 0.63 0.04Belgium 0.3 0.41 0.67Bolivia 0.44 0.46 0.58Botswana 0.19 0.17 0.5Brazil 0.64 0.55 0.88Bulgaria 0.25 0.66 0.98Canada 0.96 0.67 0.82Chile 0.15 0.92 0.44Croatia 0.32 0.75 0.26Czech Rep. 0.43 0.52 0.49Denmark 0.71 0.53 0.87Dom. Rep. 0 0.67 0.68Estonia 0.35 0.75 0.37Fiji 0.14 0.77 0.14Finland 0.61 0.62 0.29France 0.29 0.63 0.8FRG/German 0.66 0.64 0.88Georgia 0.49 0.66 0.06Guatemala 0.35 0.02 0.01
52 Studies in Comparative International Development / Fall 2003
Hungary 0.34 0.38 0.59Iceland 0.38 0.81 0.8India 0.77 0.49 0.42Indonesia 0.27 0.27 0.33Ireland 0.4 0.12 0.87Israel 0.31 0.45 0.5Italy 0.36 0.3 0.91Kazakhstan 0.51 0.83 0.51Kenya 0.15 0.68 0.12Kyrgyzstan 0.51 0.54 0.19Latvia 0.43 0.75 0.35Lithuania 0.48 0.74 0.51Luxembourg 0.3 0.51 0.35Malaysia 0.42 0.39 0.19Mauritius 0.1 0.41 0.65Mexico 0.46 0.65 0.93Moldova 0.58 0.76 0.32Mongolia 0.6 0.5 0.45Neth. Antilles 0.93 0.93 0Netherlands 0.45 0.2 0.44Nicaragua 0.09 0.94 0.71Norway 0.48 0.56 0.75Panama 0.01 1 0.91Paraguay 0.06 0.81 0.43Peru 0.38 0.13 0.45Philippine 0.16 0.48 0.97Poland 0.38 0.52 0.49Portugal 0.23 0.55 0.36PRC 1 0.5 0.36Romania 0.19 0.69 0.67Russia 0.67 0.83 0.91S. Africa 0.55 0.1 0.85Senegal 0.35 0.54 0.24Slovakia 0.16 0.76 1Slovenia 0.22 0.75 0.4Spain 0.5 0.35 0.89Sweden 0.58 0.83 0.5Switzerland 0.8 0.61 0.85Tajikistan 0.59 0.61 0.47Thailand 0.12 0.72 0.68Trinidad-T 0.18 0.04 0.59UK 0.37 0.2 0.89USA 0.8 0.56 0.84Zimbabwe 0.32 0.49 0.06
Schneider 53
Notes
* Tel: +44 (0)1273 678270; fax: +44 (0)1273 621202; email: [email protected]. For valuablecomments and suggestions, the author would like to thank Mick Moore, Arnab Acharya, MarcusKurtz, Benjamin Goldfrank, and anonymous reviewers from Studies in Comparative InternationalDevelopment. Financial support was provided by the Department for International Development.All errors or omissions are the author’s own.
1. Most attempts to provide definitions of the decentralization concept involve adding adjectives tothe concept to delimit its dimensions. For example, see administrative decentralization (Rondinelliet al. 1984); fiscal decentralization (Bird 1993; Cheema and Rondinelli 1983); and democraticdecentralization (Manor 1999). Leonard and Marshall (1982: 19-24) provide a categorization basedon whether power or resources are decentralized and to whom.
2. This distinction is not new; the World Bank, among many others, makes exactly this division of thedecentralization concept on its webpage <http://www1.worldbank.org/publicsector/decentraliza-tion/>.
3. Such enthusiasm is not without precedent; the prior apex of enthusiasm for decentralization was asa strategy to prolong colonial rule in much of Africa (Samoff 1990: 513).
4. In the 1950s and 1960s, centralization was promoted to deal with escalating demands and massmobilization unleashed by decolonization and modernization (Huntington 1968). Over a four -yearperiod in the 1990s, by contrast, 12 percent of all completed World Bank projects contained adecentralization component (Litvack 1998: 1).
5. See Snyder (1999) for an example of reregulation by lower levels when central governmentsshrank.
6. Cohen and Peterson (1997) note differences among geographers, political scientists, economists,lawyers, and public administration professionals, among others. They also note differences amongEnglish-, French-, and Spanish-speaking researchers.
7. See Collier and Adcock (1999) for a discussion of validity.8. Fukasaku and Hausmann (1998) connect decentralization, democratization, and market reforms.9. Yilmaz and Ebel (2002) discuss competing measures of decentralization in a single case.10. For a preliminary application of these measures of decentralization in causal analysis, see Schneider
(2003).11. Thus, democratic devolution identifies the category of cases in which decentralization occurs to
elected local authorities (Crook and Manor 1998). Privatization defines the category of cases inwhich decentralization occurs to organizations outside the government sector (Rondinelli et al.1989). The non-governmental sector has been further disaggregated into private sector organiza-tions that are for-profit versus non-governmental, voluntary associations (Leonard and Marshall1982).
12. Others focus on the transfers between levels of government (Nice and Frederickson 1987; Ahmad1996).
13. See Government Finance Statistics Handbook (IMF 2000). Also, see Byskov (2001) for a discus-sion of the reliability and validity of the data.
14. The results of the factor analysis are robust to different measures. For example, subnationalexpenditures and revenues as a percentage of GDP also load heavily on a single dimension.
15. Some might support subtracting transfers from the total revenues or subtracting earmarked expen-ditures from total expenditures. Doing so would mix the issue of impact, which underlies fiscaldecentralization, with autonomy, which underlies administrative decentralization.
16. It should be noted that some applications of the categories differentiate a syndrome of characteris-tics, not just autonomy (Rondinelli 1990).
17. Simplifying the syndrome of characteristics into the single dimension of autonomy becomes morecomplicated when we consider other aspects of decentralization at the same time. For example, thelevel of autonomy becomes unclear when we compare a local government with significant re-sources (fiscal decentralization) and deconcentrated authority (administrative centralization) to alocal authority with few resources (fiscal centralization) but devolved authority (administrativedecentralization). Correct measurement of autonomy requires taking into account the interrelation-ship of the dimensions.
54 Studies in Comparative International Development / Fall 2003
18. The kind of revenue is at best only a rough indicator of the amount of administrative control.Grants and loans can arrive either with conditions or without them. Though unconditional loans orgrants (block grants) suggest local control, the fact that the center can withhold them implies somelimitation of local autonomy. Own-taxes are probably the most controllable form of local revenue,though even in these revenues, the center can exert some authority by earmarking tax streams tocertain expenditures.
19. See Schmitter (1971; 1974).20. Federalism literature highlights the relationship between decentralization, parties, and elections
(Grodzins 1960).21. For example, changes in fiscal decentralization can be either positively or negatively related to
changes in administrative decentralization and/or political decentralization. Of course, the interac-tion could be more complex: e.g., decentralization along two dimensions could augment or offsetdecentralization along the third. These possibilities are more difficult to test statistically and havetherefore been left out of the current exercise.
22. In Brazil, decentralized fiscal resources meant that local governments were implementing tasksconstitutionally attributed to the central level (Afonso 1996).
23. For a more thorough discussion of factor analytic techniques, see Kim and Mueller (1978); Long(1983); or Bollen (1989). For an application, see Brady (1990).
24. Kim and Mueller discuss the use of confirmatory factor analysis techniques at length (1978: 32-37).
25. The equation for each observed variable is given by: Xi = ΣjibijFj + diUi The observed variable is“X”; “F” is a common factor shared by two or more variables; and “U” is a factor unique to a givenvariable. The correlation between the observed variable and the shared factor is “b”, and “d” is thecorrelation between the unique factor and the observed variable. The subscript i indicates theobserved variable and the subscript j indicates the common factor.
26. Websites listed in the bibliography.27. Using an indicator of democracy from the Polity IV database, eleven non-democratic cases were
excluded from the analysis. The results were robust to excluding non-democracies.28. The importance of transfers was reversed to keep the signs positive.29. “Scree” is the geological term for the debris that collects below the rocky part of a slope.30. The solution was rotated to obtain orthogonal factors using a varimax rotation option.31. The factor scores provide an interval measure of the dimensions. The difference between a country
that scores .1 and another that scores .2 is the same magnitude as the difference between countriesthat score .6 and .7. On the other hand, this cannot be interpreted as a ratio scale. Zero indicates thata country was simply the least decentralized among the sample; it does not mean that localjurisdictions had no resources, autonomy, or political functions.
32. <http://www1.worldbank.org/publicsector/decentralization/dataondecen.htm> accessed June, 2002.33. Only a few countries changed position, and even they merely swapped places with a neighbor on
the scales of the different dimensions.
References
Afonso, Jose Roberto Rodrigues. 1996. “Descentralizar e Depois Estabilizar: A Complexa ExperienciaBrasileira.” Revista do BNDES 3, 5: 31-62.
Ahmad, Ehtisham. 1996. Financing Decentralized Expenditures: An International Comparison ofGrants. Cheltenham, UK: Edward Elgar.
Berger, Suzanne. 1983. Organizing Interests in Western Europe: Pluralism, Corporatism, and theTransformation of Politics. New York: Cambridge University Press.
Bird, R.M. 1993. “Threading the Fiscal Labyrinth: Some Issues in Fiscal Decentralization.” NationalTax Journal 46 (June).
Bollen, Kenneth A. 1989. Structural Equation Models with Latent Variables. New York: John Wiley.Brady, Henry. 1990. “Traits versus Issues: Factor versus Ideal Point Analysis of Candidate Thermom-
eter Readings.” Political Analysis 2: 97-129.Byskov, Steen. 2001. Measuring the Levels of Decentralization: The Strengths and Weaknesses of the
Government Finance Statistics World Bank, 2001 [cited 5/27/2002]. http://www1.worldbank.org/publicsector/decentralization/decent.doc.
Schneider 55
Cheema, G. Shabbir and Dennis A. Rondinelli. 1983. “Implementing Decentralization Policies: AnIntroduction.” Eds. G.S. Cheema and D.A. Rondinelli. Beverly Hills: Sage Publications.
CIA World Factbook <http://www.cia.gov/cia/publications/factbook/indexgeo.html>________. 1997. Administrative Decentralization: A New Framework for Improved Governance, Ac-
countability, and Performance. Cambridge, MA: Harvard Institute for International Development.Collier, David and Robert Adcock. 1999. “Democracy and Dichotomies: A Pragmatic Approach to
Choices about Concepts.” Annual Review of Political Science 2: 537-563.Crook, Richard C. and James Manor. 1998. Democracy and Decentralization in South Asia and West
Africa: Participation, Accountability, and Performance. Cambridge: Cambridge University Press.Database of Political Institutions <http://paradocs.pols.columbia.edu/datavine/
BrowseFrameSet.jsp?dsetID=100>Fox, Jonathan and Josefina Aranda. 1996. “Decentralization and Rural Development in Mexico: Com-
munity Participation in Oaxaca’s Municipal Funds Program.” Monograph Series 42. San Diego:Center for U.S.-Mexico Studies, University of California at San Diego.
Fukasaku, K. and Ricardo Hausmann. 1998. Democracy, Decentralization, and Deficits in Latin America.Washington, D.C.: The Inter-American Development Bank.
Grodzins, Morton. 1960. “American Political Parties and the American Political System.” WesternPolitical Quarterly XIII 4: 974-98.
Huntington, Samuel P. 1968. Political Order in Changing Societies. New Haven: Yale University Press.International Monetary Fund (IMF). 2000. Government Finance Statistics Handbook. Washington,
D.C.: IMF.Kim, Jae-On and Charles W. Mueller. 1978. Introduction to Factor Analysis: What It Is and How To Do
It. Vol. 13, Quantitative Applications in the Social Sciences. Beverly Hills: Sage Publications.Lakoff, George. 1987. Women, Fire, and Dangerous Things: What Categories Reveal About the Mind.
Chicago: Chicago University Press.Leonard, David K. and Dale Rogers Marshall. 1982. “Institutions of Rural Development for the Poor:
Decentralization and Organizational Linkages.” Research Series. Berkeley: Institute for Interna-tional Studies, University of California, Berkeley.
Library of Congress Country Studies <http://lcweb2.loc.gov/frd/cs/cshome.html#toc>Litvack, Jennie, Junaid Ahmad, and Richard Bird. 2000. Rethinking Decentralization at the World Bank.
Washington, D.C.: The World Bank.Litvack, Jennie. 1998. Rethinking Decentralization in Developing Countries. Washington, D.C.: The
World Bank.Long, J. Scott. 1983. “Confirmatory Factor Analysis: A Preface to LISREL.” Sage Monographs. Los
Angeles: Sage Publications.Manor, James. 1999. The Political Economy of Democratic Decentralization. Washington, D.C.: World
Bank Group.Musgrave, Richard A. 1958. “Multi-Level Finance.” Ed. R. A. Musgrave. New York: McGraw-Hill.National Constitutions website <http://confinder.richmond.edu/>Nice, David C., and Patricia Fredericksen. 1995. Politics of Intergovernmental Relations. New York:
Thomas Learning.Oates, Wallace. 1972. Fiscal Federalism. New York: Harcourt Brace Jovanovich.Polity IV Dataset <http://www.bsos.umd.edu/cidcm/inscr/polity/>Rondinelli, Dennis A., James S. McCullough, and Ronald W. Johnson. 1989. “Analyzing Decentraliza-
tion Policies in Developing Countries: A Political-Economy Approach.” Development and Change20, 1: 57-87.
Rondinelli, Dennis, John R. Nellis, and G. Shabbir Cheema. 1984. Decentralization in DevelopingCountries: A Review of Recent Experience. Washington, D.C.: World Bank.
Rondinelli, Dennis. 1990. “Decentralization, Territorial Power, and the State: A Critical Response.”Development and Change 21, 3: 491-500.
Samoff, Joel. 1990. “Decentralization: The Politics of Intervention.” Development and Change XXI, 3.Schmitter, Philippe C. 1971. Interest Conflict and Political Change in Brazil. Stanford: Stanford Uni-
versity Press.________. 1974. “Still the Century of Corporatism?” Review of Politics 36, 1 (January): 85-131.Schneider, Aaron. 2003. “Who Gets What from Whom? The Impact of Decentralization on Tax Capacity
and Pro-Poor Spending.” IDS Working Paper 179, Brighton: IDS.
56 Studies in Comparative International Development / Fall 2003
Snyder, Richard. 1999. “After Neoliberalism: The Politics of Reregulation in Mexico.” World Politics.52, 2: 173-204.
Wallis, Malcolm. 1991. “Local Government and Development: A Guide to the Literature.” Environment& Urbanization III, 1: 121-9.
Weber, Max. 1968. Bureaucracy. Berkeley: University of California Press.World Bank Group Decentralization NET website <http://www1.worldbank.org/publicsector/decen-
tralization/dataondecen.htm>Yilmaz, Serdar and Robert D. Ebel. 2002. On the Measurement and Impact of Fiscal Decentralization.
Washington, D.C.: World Bank.