Embed Size (px)
Citation preview

Generalisation of Hydrography Networks for a
Vario-scale Basemap
MSc Geomatics Graduation Plan
IJsbrand GroeneveldEmail: [email protected]
Student number: 4412877
supervised byProf.dr.ir. P.J.M. van Oosterom - Professor GIS Technology
dr.ir. B.M. Meijers - Researcher GIS Technologying. R. Suba - PhD Candidate GIS Technology

bug
1 Introduction
Maps are being created since the ancient Babylonian and Chinese times. The created maps are represen-tations of the world around us and are used as essential tools by humans to help them e.g. to navigate.Maps exist in many different formats and scales ranging from large scales (very detailed) to small scalesdepending on the intended usage of the map. When cartographers make maps they have to decide whichfeatures appear on the map as an abstraction of a part of the world. The abstraction of a part of the worldrequires exaggeration of important and removal of features regarded as unimportant, see Figures 1 and 2.This process in called generalization and involves simplification, smoothing and pruning. Simplification isthe reduction of features in the map. Smoothing is applied to simplify the boundaries between features.Pruning is the selection of the features that are regarded as important for the intended use of the map.
Figure 1: TOP25raster of Delft Figure 2: TOP50raster of Delft
Nowadays cartographers use large scale datasets and generalization tools to create digital maps for differentsmaller scales e.g. 1:10k, 1:25k, 1:50k etc. These digital maps are mostly stored in a multi-scale database,where each map is used for a specific scale interval. The drawback of this approach is that redundantdata is stored and that only a fixed number of map scales are available. There is however an alternativeto these discrete/fixed map scales, van Oosterom and Meijers (2013) introduced the concept of smoothtopological Generalized Area Partitioning (tGAP) which is based on the concept of a tGAP data structurewhich is presented as a vario-scale data structure by van Oosterom (2005). The tGAP structure startswith a topological clean planar partition at the largest available scale. The least important object/feature isselected and either merged with the most compatible neighbour or splitted and divided among the neighbours(importance of the neighbours and length of their shared boundary can be taken into account). This processis repeated until one single object remains.At the moment, the vario-scale solution can deal with area features and road networks which are addedby Suba et al. (2016), this means that there is no special treatment for e.g. hydrography networks, utilitynetworks and rail networks. As hydrography features are important for navigability on a basemap it is neededto investigate the special treatment of hydrography networks in the vario-scale solution while maintainingthe hydrography network structure.
The MSc graduation research will contribute to the ongoing research on vario-scale and be part of theproject: Vario-scale representation of Shenzhen maps (Shenzhen Reseach Center of Digital City Enineerig,
2

2016). This project aims to apply the vario-scale techniques to the geographic data of Shenzhen, China.The research will be used for the first R&D component of the project which aims at extending the earlierprototype (Suba et al., 2016) with improved functionality.
3

2 Research Questions
Research on the vario-scale concept has already been done for a few years by the GIS Technology group atTU Delft. Publications, software and a demo version can be found at http://varioscale.bk.tudelft.nl.This MSc Geomatics Thesis research will contribute to this research with the following research question:
To what extent can hydrography networks be better incorporated in the vario-scale conceptfor creating a basemap while maintaining the network structure?
The goal of this research is to study the possibilities to incorporate hydrography networks in the vario-scaleconcept to be used for creating a vario-scale basemap while maintaining the hydrography network structure.To achieve this goal the following sub-questions are relevant:
1. Which aspects of a hydrography network need to be taken into account? How to create a hydrog-raphy network based on hydrography input data and other data like e.g. road networks which crosshydrography features or roads running parallel to hydrography features?
2. Hydrography features are often natural phenomena and therefore could require different simplifica-tion methods as opposed to man-made features. Which simplification method(s) can be used forhydrography networks and which method(s) is/are most appropriate?
3. How to implement the generalization method for hydrography networks in the vario-scale data struc-ture?
4. Water flows normally from higher to lower elevations except in some man-made networks, how toinclude this information in the hydrography network? Are additional data like e.g. elevation needed?
5. When to collapse hydrography network parts; e.g. from rivers represented by areas to rivers repre-sented by lines and lakes represented by areas to lakes represented by nodes? Collapse using triangu-lation/voronoi, medials axis or straight skeleton?
6. What is the quality of the generalization result including the hydrographic networks? How to assessthe generalization result of hydrographic networks in the vario-scale approach?
2.1 Scope of the research
The items in the following list define the scope of this research, what will be done and delivered:• The focus is on hydrography network structures for a vario-scale basemap and how they can be better
included in the vario-scale concept while maintaining the hydrography network structure. Elevationdata/height values will be the main driver for the generalization process. Elevation determines theflow direction which is used to determine the important parts of the hydrography network.
• The whole research will be carried out with 2D vector data only for all the features in the map and aDEM for the elevation.
• The main deliverable will be a report (MSc Thesis) describing the generalization of hydrographynetworks for a vario-scale basemap. The code developed for the prototype to do this generalizationwill be made available under an open source license.
• The generalization method will be tested with real world hydrography sample data and elevation datawhen needed.
• If the current tGAP data structure is not ready for the special treatment of hydrography networks,the structure will be enriched to be able to deal the special treatment of hydrography networks.
It is also important to note what is not in the scope of this research:• 3D data and the generalization of 3D data.• Processing of large datasets• Labels are important for map readability but will not be addressed.• Other networks like e.g. utility networks and rail networks will not be addressed, however could
partially be dealt with in the same way.• The temporal aspect will not be addressed as the research does focus on a vario-scale basemap.
4

3 Related Work
Hydrography features as network objects are one of the most important objects for many map types. Theyhelp map users with orientation and recognition of real-world objects, besides this they improve the overalllegibility of the maps. Two main representations of hydrography features exists: linear and area. In thepast different methods have been described for the generalization of networks represented by linear and areafeatures.McAllister and Snoeyink (2000) describe the use of the medial axis of a polygon (described by the leftand right banks) to automatically generate river centerlines and to derive river attributes. They also didexperiments to approximate the medial axis by a Voronoi diagram and computed the approximation througha robust implementation of the Voronoi diagram. The result is an approximation of the medial axis of theriver network which can be used for further analysis.Gold and Snoeyink (2001) adjusted the crust algorithm of Amenta et al. (1998) to extract the skeleton fromunlabelled vertices. They found that by applying the algorithm as a local test on the Voronoi diagram thecrust and the skeleton can be found.Haunert and Sester (2007) describe a generalization method based on straight skeletons to obtain thecenterlines of the considered features. The construction of the straight skeleton is based on the stepwiseshrinking process of the polygon which can be performed by simultaneous parallel offsets of the polygonedges until the skeleton remains. They also describe how this method can be used to partially collapse afeature while preserving the topological relationship e.g. the connection between a river and a lake.Strahler (1952) developed a method to classify the branches of a river network through using a counterwhich increases when two branches with the same number meet when two branches with different numbersmeet the section will get the same number as the highest of the two branches, see Figure 3. This methodis known as Strahler order and is widely used as enrichment method for river networks. The Horton ordercan be constructed after Strahler order is known. For the Horton order, the highest order N corresponds tothe main stream, the N-1 order to the second most important stream, and so on (Horton, 1945).
Figure 3: Strahler stream order (Wikimedia Commons, 2011)
Sandro et al. (2011) describes a method that uses the Strahler order, the width of the rivers, the flow direc-tion, the longest distance in the network, the length of the river, the number of branches upstream and thedensity of the network for the generalization of river networks. They describe a method to calculate the flowdirection of the rivers based on the z-coordinate which is extracted from a Digital Elevation Model (DEM).Regnauld and Mackaness (2006) describe a method to automatically create a topologically connected hy-drography network from hydrography features ’broken’ into parts by features such as e.g. bridges. They joinhydrography features based on rules of continuity, proximity and the flow direction. For the construction ofthe flow direction they used an underlying DEM.Ai et al. (2006) consider the order (Strahler and Horton), the length, the distribution pattern and otherparameters such as distribution density and distance between proximity channels. They come to the con-clusion that the for generalization needed geometric parameters are easy to compute, while the geographicparameter (consisting of watershed information) is usually difficult to compute because it requires a complexmodel to get useful information for the generalization process.
5

Van Altena and Stoter (2016) studied if the automatic generalization of man-made water networks can beimproved by prunning based on the landscape. They showed that it is possible to improve the generalizationof man-made hydrography networks after taking into account the landscape type.For the generalization of Dutch municipal data (1:1K) to a 1:10k map Van Altena et al. (2014) describewhich steps need to be carried out to automatically generalize hydrography features.Hydrography network generalization has mainly been used to generalize a map from a fixed large scale toanother fixed smaller target scale. Ai et al. (2017) however follows the idea of vario-scale but in a differentway than the approach of van Oosterom (2005). They build a matrix model to store the Level of Details(LoDs) from multiple generalizations in a hybrid hierarchical structure which allows vario-scale representa-tions of hydrography networks over a wide range of scales. In the matrix structure generalization processesof hydrography features accompanied with the geometric smoothing of the hydrography features are hier-achically constructed as the row and columns which include an explicit scale range (Ai et al., 2017). Thismeans that the generalization and smoothing are done seperately, while in the vario-scale approach basedon the tGAP both operations are combined.Suba et al. (2016) described a method to introduce line features in the vario-scale solution and applied itto road networks. In this method the advanced treatment for e.g. hydrography networks, utility networksand rails networks could be included however it might be the case that additional knowledge or a differenttreatment is needed for these networks during the generalization process (Suba et al., 2016). A differencewith road networks is that water in the hydrography networks is always flowing towards lower elevationse.g. a river flowing from the mountains to the sea. The direction of the water flow needs to be incorporatedin the generalization process if the hydrography network structure needs to be preserved. Other differencesare the shapes of the features in the hydrography networks, they are natural phenomena while roads areman-made features which tend to be more straight while hydrography features are following the path ofleast resistance. Besides this there can be area’s like lakes in a river network, which is not the case forroad networks. This also makes that there are different topological relationships between the hydrographyfeatures which need to be preserved in the generalization process.Meijers et al. (2016) describe a algorithm called SplitArea which can be used to compute linear represen-tations and at the same time split the old area of the feature and assign it in a ’fair’ way to neighboursbased on the compatability of these neighbours. This algorithm can be used to change the representation ofhydrography area features (e.g. wide rivers at large scale map) into hydrography line features (for smallerscale maps).
6

4 Methodology
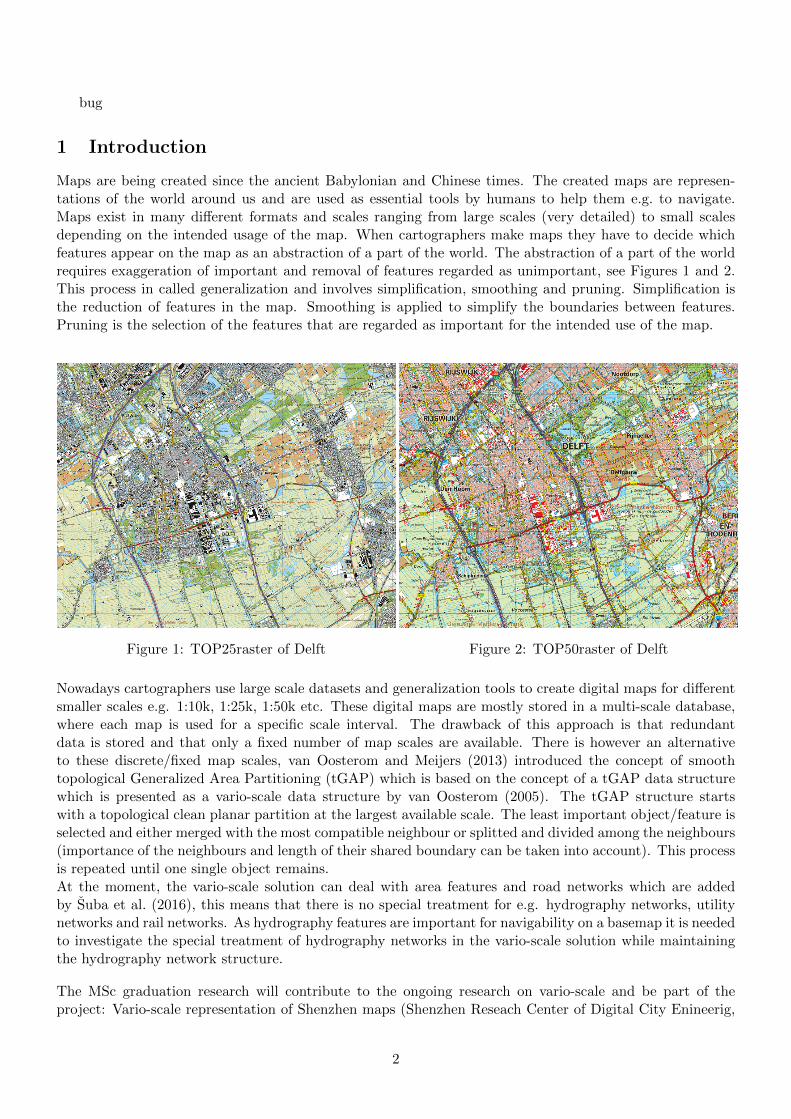
The workflow shown in Figure 4 is used for finding the answers to the sub research questions which in turnwill be used to answer the main research question.
Figure 4: Workflow for creating a generalisation of river networks in the vario-scale solution
4.1 Hydrography Networks
The goal of studying the literature on hydrography networks is to understand what are the characteristicand important aspects of these networks. It will also make clear which additional data or knowledge isneeded for constructing these networks based on hydrography input data. This knowledge will be used laterwhen implementing the better incorporation of hydrography networks in the vario-scale concept.
4.2 Generalization Methods
A literature research is done to search for operations which can be used for the generalization of hydrographyfeatures. As hydrography features are often natural phenomena they could need a different method comparedto man-made features.
4.3 Vario-Scale
Get a deep understanding of the vario-scale solution is important in order to be able develop a betterincorporation of hydrography networks and features. The project in Shenzhen, China is used to get this deepunderstanding of the vario-scale approach and how the generalization is coded in the vario-scale SoftwareDevelopment Kit (SDK). The SDK contains a working prototype and code snippets for new or not yet usedfunctionalities.
4.4 Hydrography in Vario-Scale
After the above mentioned steps are carried out the process of developing a simplification method forhydrography features and networks can be started. , all connected hydrography features need to be foundand stored. For the connected hydrography features the Strahler order will be computed and stored as anattribute of the hydrography features. In order to be able to compute the Strahler order the outlet point,which is lowest point, of the connected hydrography features needs to be known. This information will bederived from a DEM.Second, now that the importance (stored in the Strahler order) of the hydrography features is known asimplification method for the hydrography features can be developed which is able to store the networkstructure throughout the simplification process. As a starting point the generalization method for roadnetworks developed by Suba et al. (2016) is used and adjusted to hydrography networks. The result is a
7

mix of the topology needed for the planar partition and the topology for the hydrography network. Thenext steps will be to develop additional treatment for all cases that are not yet covered in the process, e.g. ariver flowing beneath a bridge. For this an iterative software development process as described by TutorialsPoint (2017) is used. Throughout the development process more and more cases will be encountered whichare not covered yet in the developed simplification method for hydrography features and networks. Afterdiscovering these cases with testing, additional research will be done how to treat these cases and developand implement a solution for them. This means that every iteration in the development process produces amethod which is complete and has more capabilities than the previous. The process will stop when all casesare treated or when one rare cases are encountered that appear only once in a large dataset.
4.5 Testing
New developments will be tested on a small topographic sample dataset. This sample dataset can be realworld data or some representative real world data created for testing purposes. If the developed simplificationmethod work well on the sample dataset the method will be tested on a large(r) real world dataset. If newcases appear which are not treated correctly the method will be developed further to deal also with thesecases.
4.6 Quality of the vario-scale basemap
The quality of resulting vario-scale basemap will be compared to the Dutch topographic basemap createdwith a conventional generalization method. The first method used for assessment will be visual inspectionof the resulting vario-scale basemap and its conventional counterpart. A web-based SSC viewer will be usedfor the inspection of the vario-scale basemap. Do the results look the same, or is the vario-scale basemapbetter at certain points or worse? The second method used for assessment will involve the gathering ofstatistics on the amount of features in the map and statistics on the amount of edges and vertices describingthe features.
8

5 Time Planning
5.1 Activities
The planning for the different activities which needs to be performed in order to reach the objective can befound in Figure 5.
Figure 5: GANTT Chart for the planning of the MSc Geomatics Research and Thesis
The planned dates/periods for the different P moments according to the Graduation Calender are shown inTable 1. The exact dates of the different P moments will be decided/determined during this and the comingacademic year.
Table 1: Dates for the different P moments
Event Date
P1 09:00-10:30 24-04-2017P2 13:45-14:30 30-06-2017 @ BK-IZ XP3 Between P2 and P4P4 In Period from 04-12-2017 till 15-12-2017P5 In Period from 24-01-2018 till 02-02-2018
5.2 Meetings
When needed weekly meetings will be held with the main mentor Prof.dr.ir P.J.M. van Oosterom either inDelft or via Skype when in Shenzhen, China. Additional guidance and feedback will be provided by thesecond mentor dr.ir. B.M. Meijers. The third mentor ing. R. Suba, will provide additional guidance andfeedback and will be the daily supervisor when in Shenzhen, China. After the project in Shenzhen, Chinathe additional guidance and feedback will be via Skype and/or email. The co-reader has yet to be decided
9

6 Tools and Data
This section describes briefly the tools/software and the data sets that will be used for the MSc graduationresearch.
6.1 Tools
To develop a generalization method of hydrography networks for a vario-scale basemap several tools willbe required. The data set(s) first have to made suitable for tGAP, FME is used to create from a topologyclean planar partition the required tables with nodes, edges and faces. The resulting tables will be storedin a spatial database (PostgreSQL + PostGIS). A development environment is created with Eclipse andextended with PyDev and TortoiseHg. The vario-scale SDK is used as the starting point and imported inEclipse. Some of the modules of the vario-scale SDK need to be compiled, Microsoft Visual C++ CompilerPackage for Python 2.7 is used for that. The extension of the vario-scale SDK that deals with hydrographynetworks will be written in Python 2.7. QGIS is used for visualization of the (intermediate) results.
6.2 Data
The data sets to be used for the research have yet to be downloaded, but there should be different types ofwell connected hydrography be available like rivers, streams, lakes, etc. For the determination of the flowdirection in the hydrography network a DEM is needed.
6.2.1 Shenzhen, China Topographic Data
The provided small sample of topographic data shows that the data is not a clean planar partition. The roadand hydrography features come from a different year than the other topographic features. Besides this thereare small gaps and slivers and many CAD-like drawings in the data. Hydrography data has been providedfor the whole Shenzhen region however all other topographic data of the same region is not provided andwill not be provided due to restrictions from the Chinese government. During the second visit to Shenzhen,China it became clear that this data set is not good enough for this research.
6.2.2 Open Street Map Data
The Open Street Map (OSM) data of the Shenzhen region will be downloaded and explored to see if thisdataset could be an alternative for the Shenzhen, China topographic data. After visual inspection of thedata it appears that this data set is no alternative.
6.2.3 Dutch Topographic Data
The data sets that will be used for this research are TOP10NL vector data produced and distributed by theDutch Kadaster, see https://www.kadaster.nl/-/top10nl for information and download link.The features in the data set have an attribute which shows if the feature is on top of or below anotherfeature. This information will be used in this research to detect e.g. hydrography features beneath a bridge.In most dataset there will be a piece of hydrography missing because only the top layer information is stored.The data model of TOP10NL makes that all hydrography features are nicely connected which saves a lot ofwork in constructing the hydrography network.The provided DEMs by the Dutch Kadaster are available in different pixel sizes and types, namely a DigitalTerrain Model (DTM) or a Digital Surface Model (DSM).The small sample dataset will be taken from the province of Limburg. This because this province of theNetherlands has the most elevation differences, which make the process of creating the hydrography networkin the beginning more easy. In a later stage data from a different part of the Netherlands or another countrywill also be used to improve the generalization method and for testing purposes.
10

References
Ai, T., Huang, L., Yan, X., and van Oosterom, P. (2017). A matrix-based structure for vario-scale vectorrepresentation over wide range of map scales: the case of river network data. International Journal ofGeographical Information Science.
Ai, T., Liu, Y., and Chen, J. (2006). The Hierarchical Watershed Partitioning and Data Simplification ofRiver Network, pages 617–632. Springer Berlin Heidelberg, Berlin, Heidelberg.
Amenta, N., Bern, M., and Eppstein, D. (1998). The crust and the -skeleton: Combinatorial curve recon-struction. Graphical Models and Image Processing, 60(2):125–135.
Gold, C. and Snoeyink, J. (2001). A one-step crust and skeleton extraction algorithm. Algorithmica,30(2):144–163.
Haunert, J.-H. and Sester, M. (2007). Area collapse and road centerlines based on straight skeletons.GeoInformatica, 12:169–191.
Horton, R. E. (1945). Erosional development of streams and their drainage basins; hydrophysical approachto quantitative morphology. Geological Society of America Bulletin, 56(3).
McAllister, M. and Snoeyink, J. (2000). Medial axis generalization of river networks. Cartography andGeographic Information Science, 27(2):129–138.
Meijers, M., Savino, S., and van Oosterom, P. (2016). Splitarea: an algorithm for weighted splitting offaces in the context of a planar partition. International Journal of Geographic Information Science,30(8):1522–1551.
Regnauld, N. and Mackaness, W. A. (2006). Creating a hydrographic network from its cartographic rep-resentation: a case study using ordnance survey MasterMap data. International Journal of GeographicalInformation Science, 20(6):611–631.
Sandro, S., Massimo, R., Fabio, C., Giovanni, L., and Marco, R. (2011). Model generalization of thehydrography network in the CARGEN project. In Lecture Notes in Geoinformation and Cartography,pages 439–457. Springer Berlin Heidelberg.
Shenzhen Reseach Center of Digital City Enineerig (2016). Vario-scale representation of shenzhen maps.Open Project Contract.
Strahler, A. N. (1952). Hypsometric (Area-Altitude) Analysis of Erosional Topography. Geological Societyof America Bulletin, 63(11):1117.
Tutorials Point (2017). Software development life cycle. http://www.tutorialspoint.com/software_
engineering/software_development_life_cycle.htm. Last accessed on June 17, 2017.
van Altena, V., Bakermans, J., Lentjes, P., Nijhuis, R., Post, M., Reuvers, M., and Stoter, J. (2014).Generalisation of a 1:10k map from municipal data. In Burghardt, D., Duchesse, C., and Mackaness, W.,editors, Proceedings of the 17th ICA Workshop on Generalisation and Multiple Representation, pages 1–9.
van Altena, V. and Stoter, J. (2016). Context-aware thinning of artificial water networks for map general-ization. GI Forum, 1:12–29.
van Oosterom, P. (2005). Variable-scale topological data structures suitable for progressive data transfer:The GAP-face tree and GAP-edge forest. Cartography and Geographic Information Science, 32(4):331–346.
van Oosterom, P. and Meijers, M. (2013). Vario-scale data structures supporting smooth zoom and progres-sive transfer of 2d and 3d data. International Journal of Geographical Information Science, 28(3):455–478.
Suba, R., Meijers, M., and van Oosterom, P. (2016). Continuous road network generalization throughoutall scales. ISPRS International Journal of Geo-Information, 5(8):145.
11

Wikimedia Commons (2011). Flussordnung (strahler). https://commons.wikimedia.org/wiki/File:
Flussordnung_(Strahler).svg. Last accessed on May 04, 2017.
12