Embed Size (px)
Citation preview

第一篇
—1—
综 合 GENERAL SURVEY

—2—
综 合 GENERAL SURVEY

1 - 1 行政区划( 2010 年底)ADMINISTRATIVE DIVISION( END OF 2010)
单位 : 个 ( unit)
市、区名称 Region
街道办事处Subdistrict Offices
小计Sub-total
社区居委会CommunityResidents’Committees
镇 Town
小计 Sub-total
村民委员会
Villagers’Committees
全 市 W hole Municipality 101 1 235 77 5 449
市 区 Urban Area 74 995
市南区 Shinan District 14 78
市北区 Shibei District 16 109
四方区 Sifang District 15 92
李沧区 Licang District 11 125
黄岛区 Huangdao District 6 204
崂山区 Laoshan District 4 146
城阳区 Chengyang District 8 241 1
胶州市 Jiaozhou 7 61 11 811
即墨市 Jimo 5 35 18 1 028
平度市 Pingdu 4 58 26 1 783
胶南市 Jiaonan 6 55 11 965
莱西市 Laixi 5 31 11 861
—3—
综 合 GENERAL SURVEY
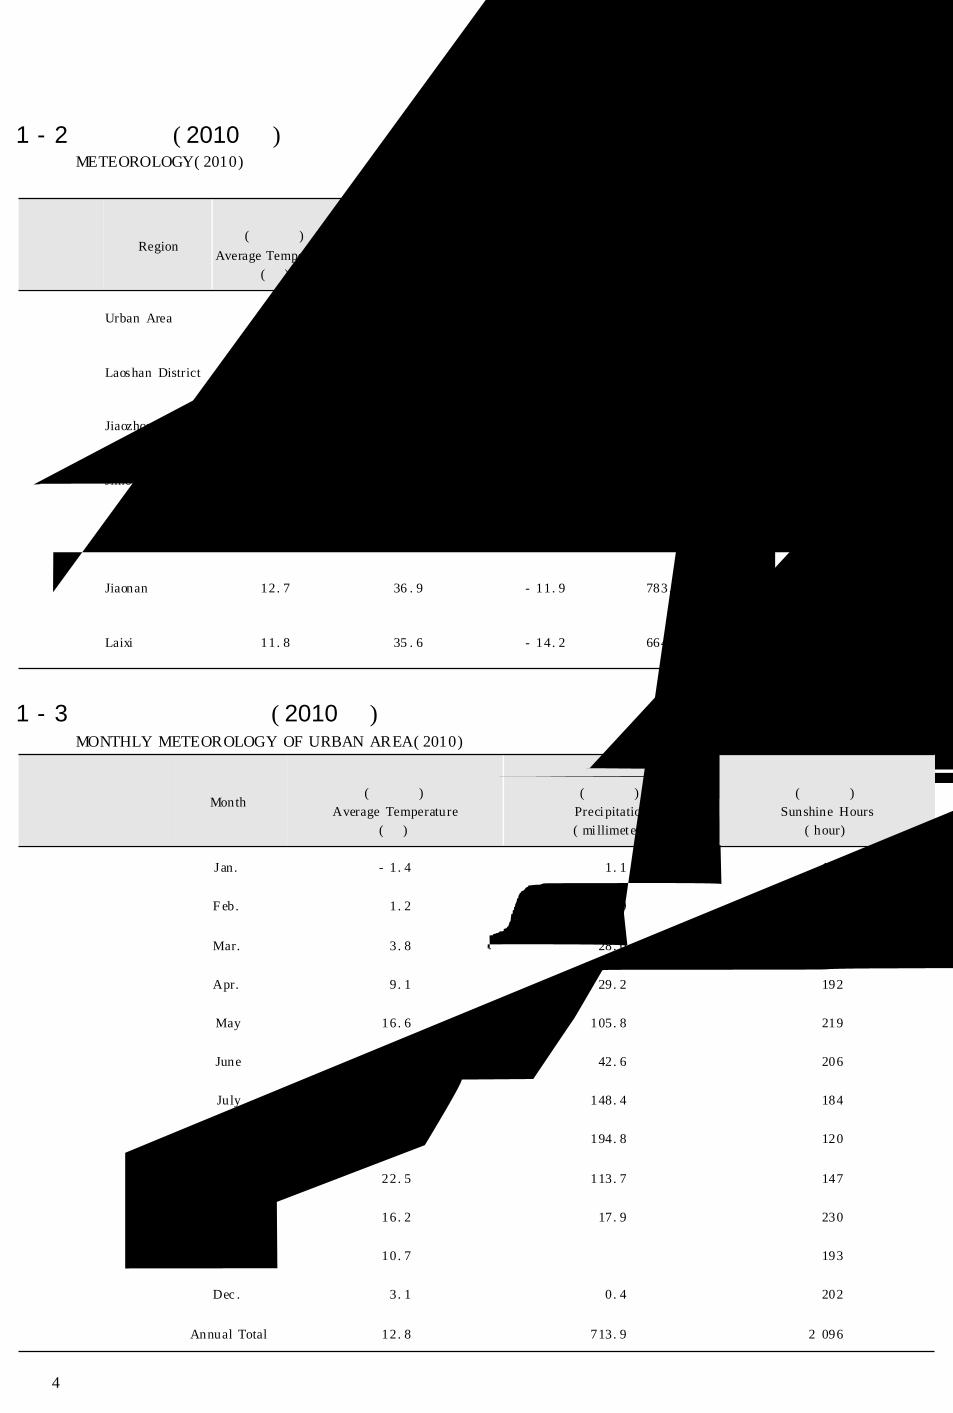
1 - 2 气象情况( 2010 年)METEOROLOGY( 2010)
市、区名称 Region
平均气温( 摄氏度 )
Average Temperature( ℃ )
极 端 气 温Extreme Temperature( ℃ )
最高 ( 摄氏度 )Maximum( ℃ )
最低 ( 摄氏度 )Minimum( ℃ )
降 水 量( 毫米 /年 )Precipitation
( millimeter/ year)
日照时数( 小时 /年 )
Sunshine Hours( hour /year)
平均气压( 百 帕 )
AverageAtmospheric
Pressure( 100 pa)
市 区 Urban Area 12. 8 34 . 8 - 11. 1 713. 9 2 096 1 008. 0
崂山区 Laoshan District 13. 4 38 . 0 - 11. 5 619. 8 2 286 1 012. 1
胶州市 Jiaozhou 13. 0 37 . 5 - 12. 1 657. 8 2 187 1 015. 1
即墨市 Jimo 13. 0 37 . 6 - 12. 2 783. 9 2 306 1 013. 6
平度市 Pingdu 12. 5 36 . 8 - 13. 8 656. 3 2 363 1 010. 8
胶南市 Jiaonan 12. 7 36 . 9 - 11. 9 783. 6 2 309 1 015. 7
莱西市 Laixi 11. 8 35 . 6 - 14. 2 664. 1 2 384 1 007. 5
1 - 3 市区分月气象情况( 2010 年)MONTHLY METEOROLOGY OF URBAN AREA( 2010)
月 份 Month
平均气温( 摄氏度 )
Average Temperature( ℃ )
降水量( 毫 米 )
Precipitation( millimeter)
日照时数( 小 时 )
Sunshine Hours( hour)
一月 Jan. - 1. 4 1. 1 153
二月 Feb. 1. 2 32. 0 103
三月 Mar. 3. 8 28. 0 147
四月 Apr. 9. 1 29. 2 192
五月 May 16. 6 105. 8 219
六月 June 20. 7 42. 6 206
七月 July 25. 3 148. 4 184
八月 Aug. 25. 7 194. 8 120
九月 Sept. 22. 5 113. 7 147
十月 Oct. 16. 2 17. 9 230
十一月 Nov. 10. 7 193
十二月 Dec . 3. 1 0. 4 202
全年 Annual Total 12. 8 713. 9 2 096
—4—
综 合 GENERAL SURVEY

1 - 4 各部门机构数( 2010 年底)GRASS-ROOTS UNITS IN VARIOUS SECTORS( END OF 2010)
项 目 Item 单位 Unit机构数
Grass-roots Units
农村基层单位 Rural Grass-roots Units
镇政府 Town Governments 个 unit 77
乡村户数 Number of Rural Households 万户 10 000 households 154. 92
工业企业单位 Industrial Enterprises 个 unit 82 945
规模以上工业 Above Designated Size 个 unit 5 674
#国有企业 State-owned Enterprises 个 unit 61
集体企业 Collective-owned Enterprises 个 unit 53
外商及港澳台商投资企业Enterprises with Funds from Hong Kong,Macao, Taiwan and Foreign Countries
个 unit 2 037
规模以下工业 Under Designated Size 个 unit 77 271
#个体 of which: Individual 个 unit 52 651
交通运输业 Transportation
铁路 Railway 个 unit
公路 Highway 个 unit 52
水运 Waterway 个 unit 16
邮电业 Postal and Telecommunication Services
邮电局所 Post Offices 处 unit 679
建筑业企业 Construction Enterprises 个 unit 640
国有企业 State-owned Enterprises 个 unit 31
集体企业 Collective-owned Enterprises 个 unit 25
其他 Others 个 unit 584
批发和零售业、住宿和餐饮业Wholesale & Retail Trades, Hotelsand Catering Services
限额以上批发业 Wholesale Trade above Designated Size 个 unit 640
限额以上零售业 Retail Trade above Designated Size 个 unit 444
限额以上住宿业 Hotel above Designated Size 个 unit 156
限额以上餐饮业 Catering Service above Designated Size 个 unit 202
—5—
综 合 GENERAL SURVEY

1 - 4 续表continued
项 目 Item 单位 Unit机构数
Grass-roots Units
教育事业 Education
普通高等学校 Regular Institutions of Higher Education 所 unit 25
中等专业学校 Specialized Secondary Schools 所 unit 7
普通中学 Regular Secondary Schools 所 unit 295
普通小学 Regular Primary Schools 所 unit 894
幼儿园 Kindergartens 所 unit 2 343
科研机构 Science and Technology Institutions 个 unit 44
中央属 Central Level 个 unit 9
省属 Provincial Level 个 unit 8
市属 Municipal Level 个 unit 25
县级市属 County Level 个 unit 2
文化及相关产业 Culture and Related Industry
文化事业机构 Cultural Institutions 个 unit 257
公共图书馆 Public Libraries 个 unit 13
影剧院 Cinemas 个 unit 40
广播、电视台 Radio and Television Broadcasting Stations
广播电台 Radio Stations 个 unit 1
电视台 Television Stations 个 unit 1
卫生事业 Public Health 个 unit 2 147
#医院 Hospitals 个 unit 254
民政行政单位 Civil Affairs Departments
#社会福利事业机构 Institutions of Social Welfare 个 unit 308
—6—
综 合 GENERAL SURVEY

1 - 5 按行业分法人单位数NUMBER OF CORPORATE UNITS BY SECTOR
单位 : 个 ( unit)
行 业 Sector 2010 2009
总 计 Total 130 509 111 604
农、林、牧、渔业 Agriculture Forestry Animal Husbandry and Fishery 1 616 998
采矿业 Mining 387 416
制造业 Manufacturing 36 771 33 463
电力、燃气及水的生产和供应业 Production and Supply of Electricity Gas and Water 244 211
建筑业 Construction 6 648 5 514
交通运输、仓储和邮政业 Transport Storage and Post 4 306 3 894
信息传输、计算机服务和软件业 Information Transmission Computer Services and Software 3 069 2 646
批发和零售业 Wholesale and Retail Trades 39 925 30 769
住宿和餐饮业 Hotels and Catering Services 2 116 1 825
金融业 Financial Intermediation 282 231
房地产业 Real Estate 3 692 3 083
租赁和商务服务业 Leasing and Business Services 10 258 8 436
科学研究、技术服务和地质勘查业Scientific Research Technical Services and Geologic Pros-pecting
2 318 2 075
水利、环境和公共设施管理业Management of Water Conservancy Environment and PublicFacilities
724 723
居民服务和其他服务业 Services to Households and Other Services 3 162 2 488
教 育 Education 2 532 2 457
卫生、社会保障和社会福利业 Health Social Security and Social Welfare 1 274 1 248
文化、体育和娱乐业 Culture Sports and Entertainment 910 879
公共管理和社会组织 Public Management and Social Organizations 10 275 10 248
国际组织 International Organization
注 : 本表数据来源于基本单位统计年报。
Note: Data in this form are based on the annual report of basic units.
—7—
综 合 GENERAL SURVEY

1 - 6 国民经济主要平均指标AVERAGE INDICATORS ON NATIONAL ECONOMY
指 标 Indicator 单 位 Unit 1990 1995
人口密度 Density of Population 人 / 平方公里 person/sq. km 626 643
每户年平均人口 Average Household Size 人 person 3. 57 3. 29
职工年平均工资Annual Average Wage of Staff andWorkers
元 yuan 2 400 6 164
城市居民人均年可支配收入
Annual Per Capita Disposable Incomeof Urban Households
元 yuan 1 624 5 612
农民人均年纯收入Annual Per Capita Net Income of Ru-ral Households
元 yuan 952 2 225
每一播亩平均粮食产量Output of Grain Per Mu of SowingArea
千克 kg 351 409
每亩蔬菜平均产量 Average Output of Vegetables Per Mu 千克 kg 3 017 3 274
每亩茶叶平均产量 Average Output of Tea Per Mu 千克 kg 35. 0 8. 0
每亩花生平均产量 Average Output of Peanut Per Mu 千克 kg 244 311
每亩棉花平均产量 Average Output of Cotton Per Mu 千克 kg 55 39
每台拖拉机负担耕地面积Cultivated Area Ploughed by PerTractor
亩 / 台 mu /unit 135 129
每亩耕地施用化肥量( 折纯 )
Chemical Fertilizer Consumption PerMu( convert to pure amount)
千克 kg 27 43
每人平均消费品零售额Per Capita Retail Sales of ConsumerGoods
元 yuan 995 3 487
城市每天平均生活用水量Daily Residential Consumption ofWater
万吨 10 000 tons 11. 70 22. 60
城市每人平均公园绿地面积
Per Capita Public Green Areas 平方米 sq. m 3. 70 5. 40
每万人拥有医疗床位Number of Hospital Beds per 10000Population
张 bed 35. 3 36. 9
每万人拥有医生数Number of Doctors per 10000 Popu-lation
人 person 20. 6 20. 2
每万人中高等学校学生数Students Enrollment of Institutions ofHigher Education per 10 000 Popula-tion
人 person 23 36
每万人中中等学校学生数 Students Enrollment of SecondarySchools per 10 000 Population 人 person 527 658
每万人中小学学生数Students Enrollment of PrimarySchools per 10000 Population
人 person 948 870
注 : 职工年平均工资为城镇单位职工年平均工资 。
Note: Annual average wage of staff and workers refers to average wage of staff and workers in urban units.
—8—
综 合
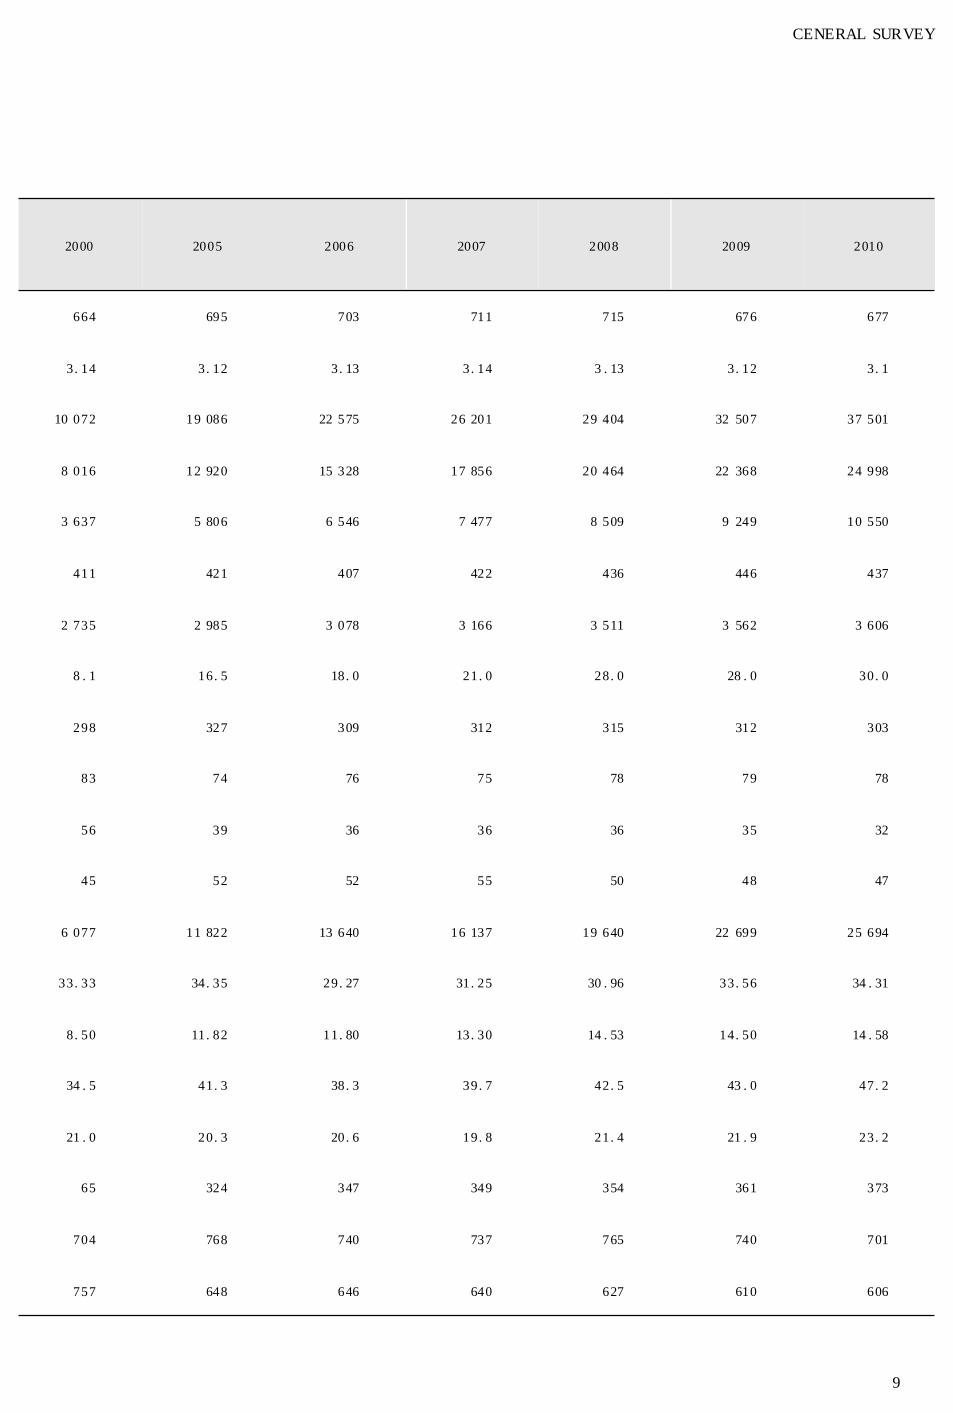
2000 2005 2006 2007 2008 2009 2010
664 695 703 711 715 676 677
3. 14 3. 12 3. 13 3. 14 3 . 13 3. 12 3. 1
10 072 19 086 22 575 26 201 29 404 32 507 37 501
8 016 12 920 15 328 17 856 20 464 22 368 24 998
3 637 5 806 6 546 7 477 8 509 9 249 10 550
411 421 407 422 436 446 437
2 735 2 985 3 078 3 166 3 511 3 562 3 606
8 . 1 16. 5 18. 0 21. 0 28. 0 28 . 0 30. 0
298 327 309 312 315 312 303
83 74 76 75 78 79 78
56 39 36 36 36 35 32
45 52 52 55 50 48 47
6 077 11 822 13 640 16 137 19 640 22 699 25 694
33. 33 34. 35 29. 27 31. 25 30 . 96 33. 56 34 . 31
8. 50 11. 82 11. 80 13. 30 14 . 53 14. 50 14 . 58
34 . 5 41. 3 38. 3 39. 7 42. 5 43 . 0 47. 2
21 . 0 20. 3 20. 6 19. 8 21. 4 21 . 9 23. 2
65 324 347 349 354 361 373
704 768 740 737 765 740 701
757 648 646 640 627 610 606
—9—
CENERAL SURVEY

1 - 7 主要年份社会经济主要指标MAJOR YEAR’S INDICATORS ON SOCIETY AND ECONOMY
指 标 Indicator 单 位 Unit 1990 1995
人口 Population
总人口 ( 年末 ) Population at Year-end 万人10 000persons
666. 65 684. 63
男性人口 Male 万人10 000persons
339. 23 347. 63
女性人口 Female 万人10 000persons
327. 42 337. 00
市区人口 Urban Area 万人10 000persons
205. 78 218. 38
就业 Employment
社会从业人员 Employment 万人10 000persons
352. 8 374. 2
#单位从业人员 Employed Persons in Units 万人10 000persons
103. 2 111. 6
经济总量 Gross Economic Amount
全市生产总值 ( 当年价 ) GDP( at current price) 亿元100
million yuan180. 77 631. 45
第一产业增加值 Primary Industry 亿元100
million yuan39. 26 112. 53
第二产业增加值 Secondary Industry 亿元100
million yuan86. 76 294. 43
第三产业增加值 Tertiary Industry 亿元100
million yuan54. 75 224. 49
人均生产总值 Per Capita GDP 元 yuan 2 714 9 089
农林牧渔业总产值( 当年价 )
Gross Output Value of Farming, For-estry, Animal Husbandry and Fishery( at current price)
亿元100
million yuan57. 99 192. 38
工业总产值 ( 当年价 )Gross Industrial Output Value ( atcurrent price)
亿元100
million yuan357. 18 941. 26
注 : 1. 单位从业人员 2004 年以前为职工人数 ( 不含私营企业 ) ; 职工工资总额 2000 年以前为城镇单位统计范围。
2. 规模以上固定资产投资数据 2003 年以前为城镇以上统计范围。
3. 2002 年以前地方财政一般预算收支数据为地方财政收支口径。
Note: 1. Before 2004, the data of employed persons in units refers to the number of staff and workers( excluding private enterprises) .
2. Before 2003, the data of investment in fixed assets above designated size refers to urban investment.
3. efore 2002, the data of general budgetaty revenue and expenditure of local government finance refers to revenue and expenditure of local govern-
ment finance.
—01—
综 合
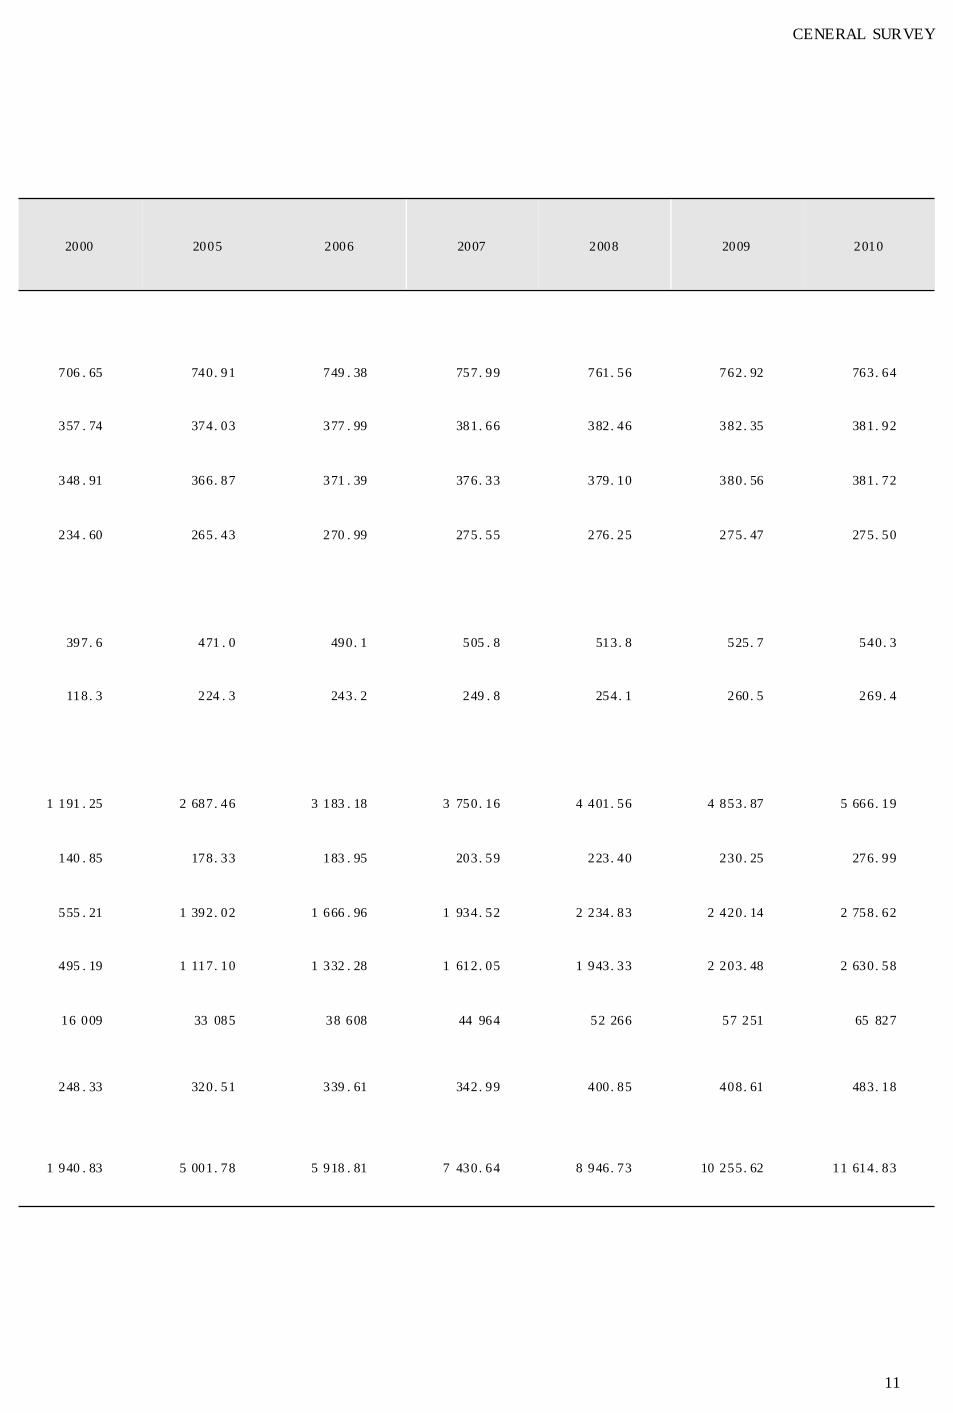
2000 2005 2006 2007 2008 2009 2010
706 . 65 740. 91 749 . 38 757. 99 761. 56 762. 92 763. 64
357 . 74 374. 03 377 . 99 381. 66 382. 46 382. 35 381. 92
348 . 91 366. 87 371 . 39 376. 33 379. 10 380. 56 381. 72
234 . 60 265. 43 270 . 99 275. 55 276. 25 275. 47 275. 50
397. 6 471 . 0 490. 1 505 . 8 513. 8 525. 7 540. 3
118. 3 224 . 3 243. 2 249 . 8 254. 1 260. 5 269. 4
1 191 . 25 2 687. 46 3 183 . 18 3 750. 16 4 401. 56 4 853. 87 5 666. 19
140 . 85 178. 33 183 . 95 203. 59 223. 40 230. 25 276. 99
555 . 21 1 392. 02 1 666 . 96 1 934. 52 2 234. 83 2 420. 14 2 758. 62
495 . 19 1 117. 10 1 332 . 28 1 612. 05 1 943. 33 2 203. 48 2 630. 58
16 009 33 085 38 608 44 964 52 266 57 251 65 827
248 . 33 320. 51 339 . 61 342. 99 400. 85 408. 61 483. 18
1 940 . 83 5 001. 78 5 918 . 81 7 430. 64 8 946. 73 10 255. 62 11 614. 83
—11—
CENERAL SURVEY
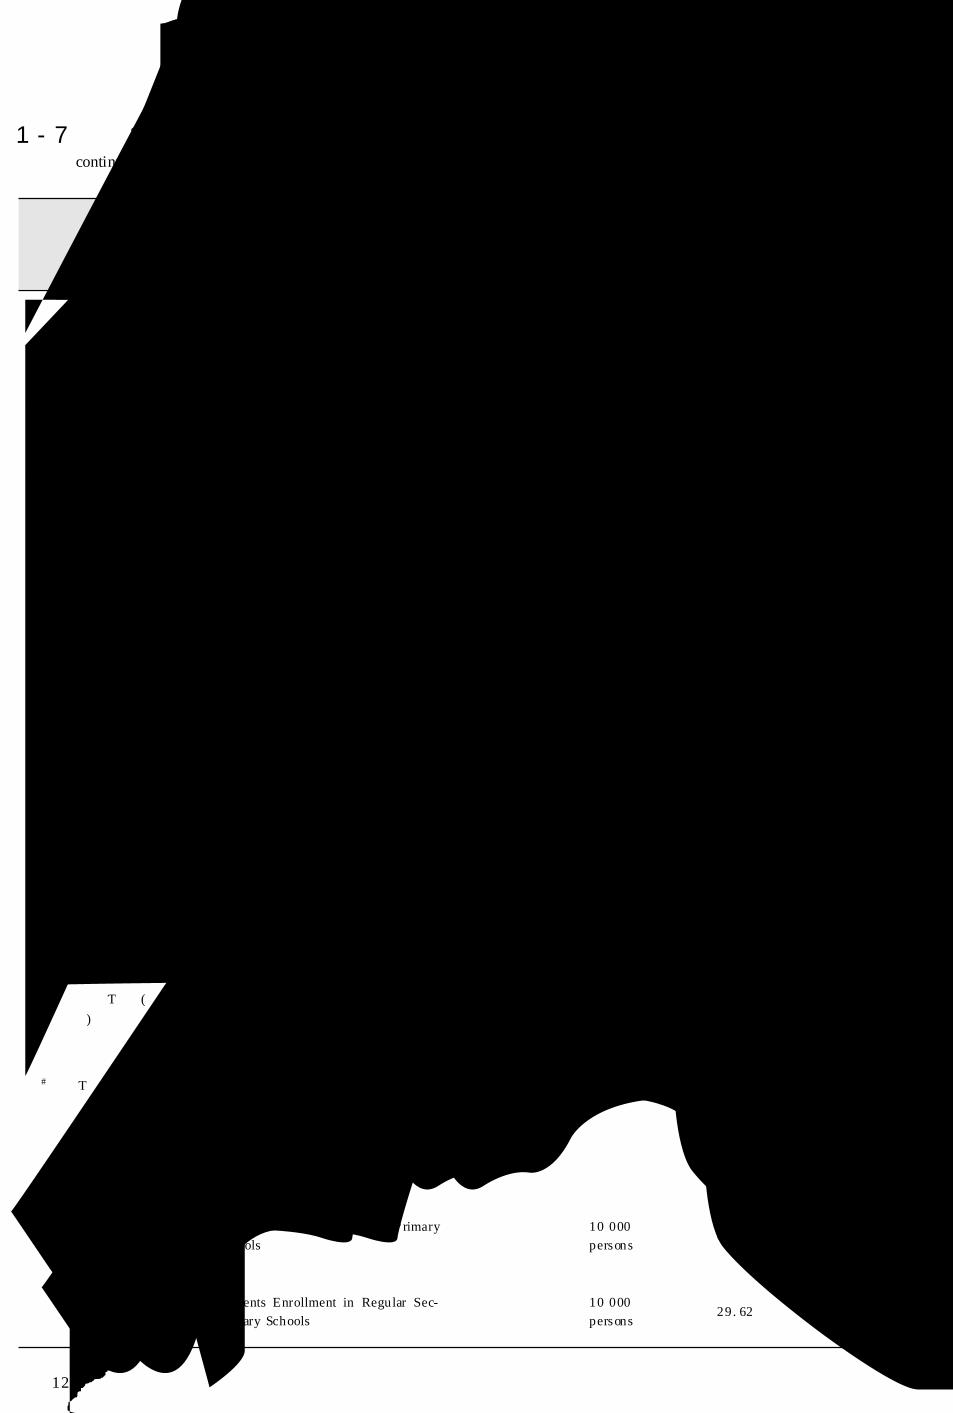
1 - 7 续表 1continued
指 标 Indicator 单 位 Unit 1990 1995
财政 Government Finance
地方财政一般预算收入General Budgetaty Revenue of LocalGovernment Finance
亿元100
million yuan24. 23 29. 48
地方财政一般预算支出General Budgetaty Expenditure of Lo-cal Government Finance
亿元100
million yuan13. 39 37. 70
规模以上固定资产投资 总额
Investment in Fixed Assets aboveDesignated Size
亿元100
million yuan28.46 164.83
社会消费品零售额Total Retail Sales of Consumer
Goods亿元
100
million yuan65.83 237.68
港口吞吐量Volume of Freight Handled inPorts
万吨10 000
tons3 068 5 165
集装箱吞吐量 Volume of Containers Handled 万吨10 000
tons
民航货邮吞吐量Volume of Freight and Mail Han-dled in Civil Aviation
万吨10 000
tons0.20 2.10
对外贸易 Foreign Trade
外贸进 出口 总额 ( 不 含 中
央省公司 )Imports and Exports( excluding cen-tral and provincial companies)
亿美元100
million USD4. 16 37. 64
#出口总额 Exports 亿美元100
million USD3. 35 24. 51
教育、卫生、文化Education PublicHealth, Culture
小学在校学生数Students Enrollment in PrimarySchools
万人10 000persons
63. 23 59. 59
普通中学在校学生Students Enrollment in Regular Sec-orndary Schools
万人10 000persons
29. 62 37. 23
—21—
综 合
2000 2005 2006 2007 2008 2009 2010
80 . 01 176. 34 225 . 77 292. 58 342. 44 376. 99 452. 61
87 . 87 203. 06 236 . 79 321. 18 369. 41 433. 58 532. 39
242. 68 1 403. 30 1 485. 69 1 635. 36 2 019. 01 2 458. 89 3 022. 48
428. 29 870. 11 1 016. 35 1 216. 22 1 492. 22 1 730. 22 1 961. 13
8 661 18 727 22 438 26 507 30 029 31 668 35 012
212. 0 630. 7 770. 0 946. 6 1 037. 7 1 027. 7 1 201. 0
4. 84 8. 91 10. 10 11. 57 13. 05 13. 54 16. 37
108 . 31 304. 55 365 . 57 436. 05 521. 59 439. 86 561. 49
61 . 14 175. 88 216 . 45 267. 76 314. 62 269. 22 333. 51
53 . 49 47. 98 48 . 39 48. 48 47. 72 46. 50 46. 27
39 . 85 39. 11 36 . 52 36. 04 37. 39 37. 74 38. 00
—31—
CENERAL SURVEY

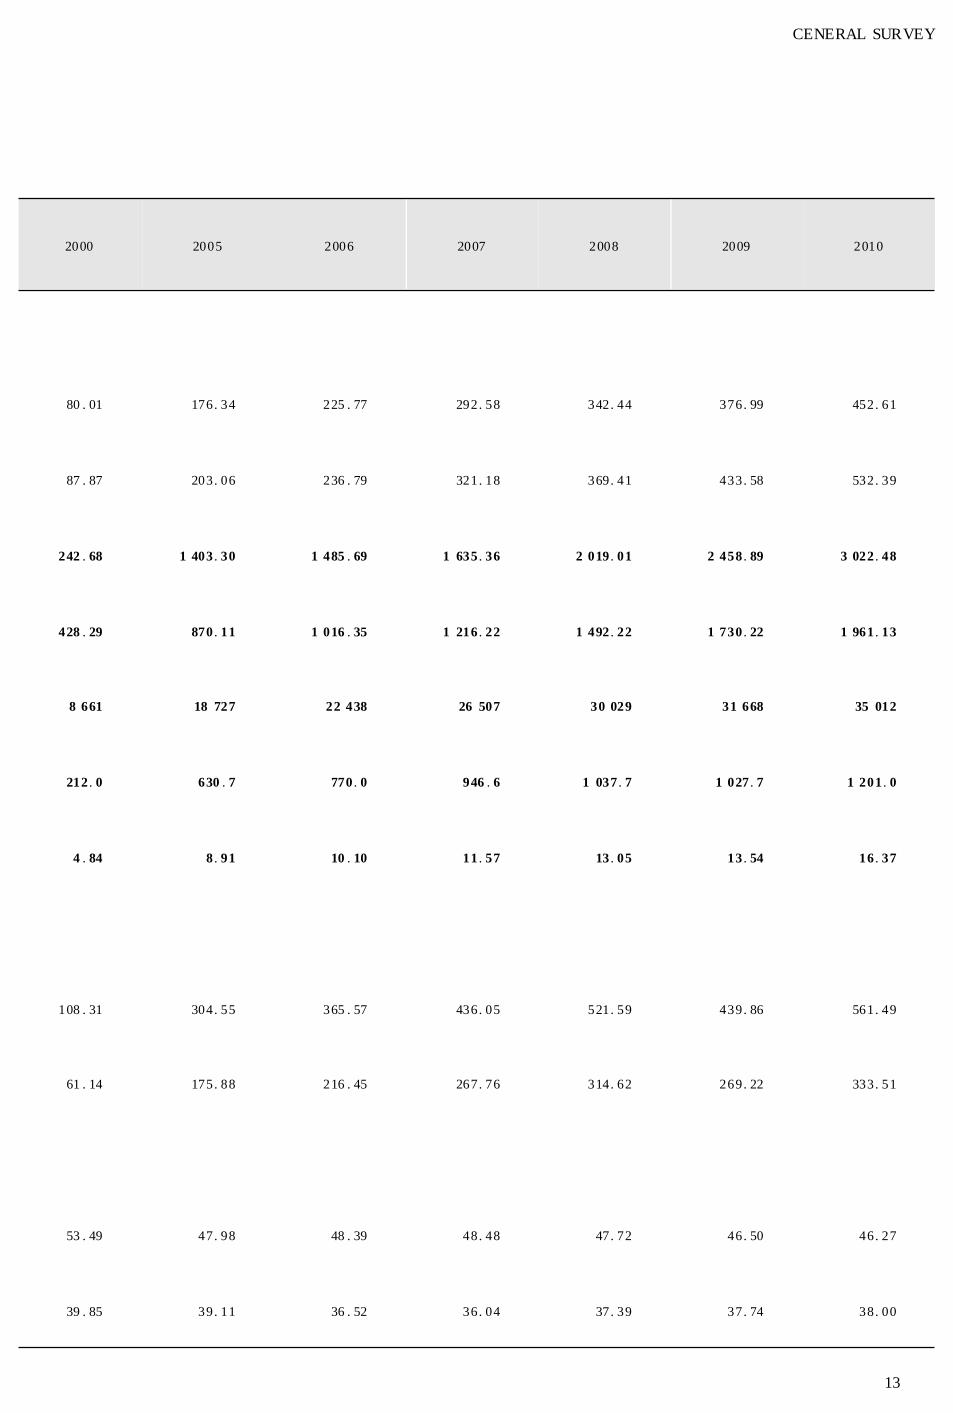
1 - 7 续表 2continued
指 标 Indicator 单 位 Unit 1990 1995
高等学校在校学生Students Enrollment in Institutions ofHigher Education
万人10 000persons
1. 54 2. 49
小学专任教师Full-time Teachers in PrimarySchools
万人10 000persons
3. 15 3. 00
普通中学专任教师Full-time Teachers in Regular Sec-orndary Schools
万人10 000persons
2. 04 2. 26
影剧院 Cinemas 个 unit 106 61
医生总数 Doctors 万人10 000persons
1. 38 1. 38
医院床位数 Hospital Beds 万张10 000
beds1. 66 1. 81
人民生活 People’s Living Conditions
职工工资总额 Total Wage Bill of Staff and Workers 亿元100
million yuan24. 39 68. 30
城市居民人均可支配收入Per Capita Disposable Income of Ur-ban Households
元 yuan 1 624 5 612
农民人均纯收入Per Capita Net Income of RuralHouseholds
元 yuan 952 2 225
城乡人民币储蓄存款余额Savings Deposit of Urban and RuralHouseholds
亿元100
million yuan65. 59 268. 79
物价指数 Price Indexes
商 品 零 售 价 格 指 数 ( 以1950 年价格为 100)
Retail Price Index( 1950 = 100 ) % % 269. 7 536. 2
居 民 消 费 价 格 指 数 ( 以1950 年价格为 100)
Consumer Price Index( 1950 =100) % % 269. 7 587. 3
#食品价格指数 ( 以 1950年价格为 100)
Food Price Index( 1950 = 100) % % 333. 3 792. 5
—41—
综 合
2000 2005 2006 2007 2008 2009 2010
4. 61 23. 98 26. 03 26. 49 26 . 93 27. 52 28 . 49
3. 17 3. 17 3. 22 3. 26 3 . 24 3. 22 3. 2
2. 63 2. 97 2. 92 2. 96 2 . 99 3. 06 3 . 08
45 39 40 40 40 40 40
1. 49 1. 50 1. 55 1. 50 1 . 63 1. 67 1 . 77
2. 01 2. 86 2. 67 2. 81 2 . 99 3. 05 3 . 34
120. 40 367. 84 454. 12 526. 74 587 . 62 646. 29 746 . 20
8 016 12 920 15 328 17 856 20 464 22 368 24 998
3 637 5 806 6 546 7 477 8 509 9 249 10 550
535. 32 1 343. 10 1 567. 62 1 702. 04 2 123 . 36 2 527. 88 2 912 . 33
520 . 5 495. 0 493. 5 506. 8 526. 6 519 . 2 526. 5
711 . 9 753. 1 759. 9 794. 1 831. 4 835 . 6 854. 0
800 . 1 871. 8 886. 6 989. 5 1 105. 3 1 123 . 0 1 194. 9
—51—
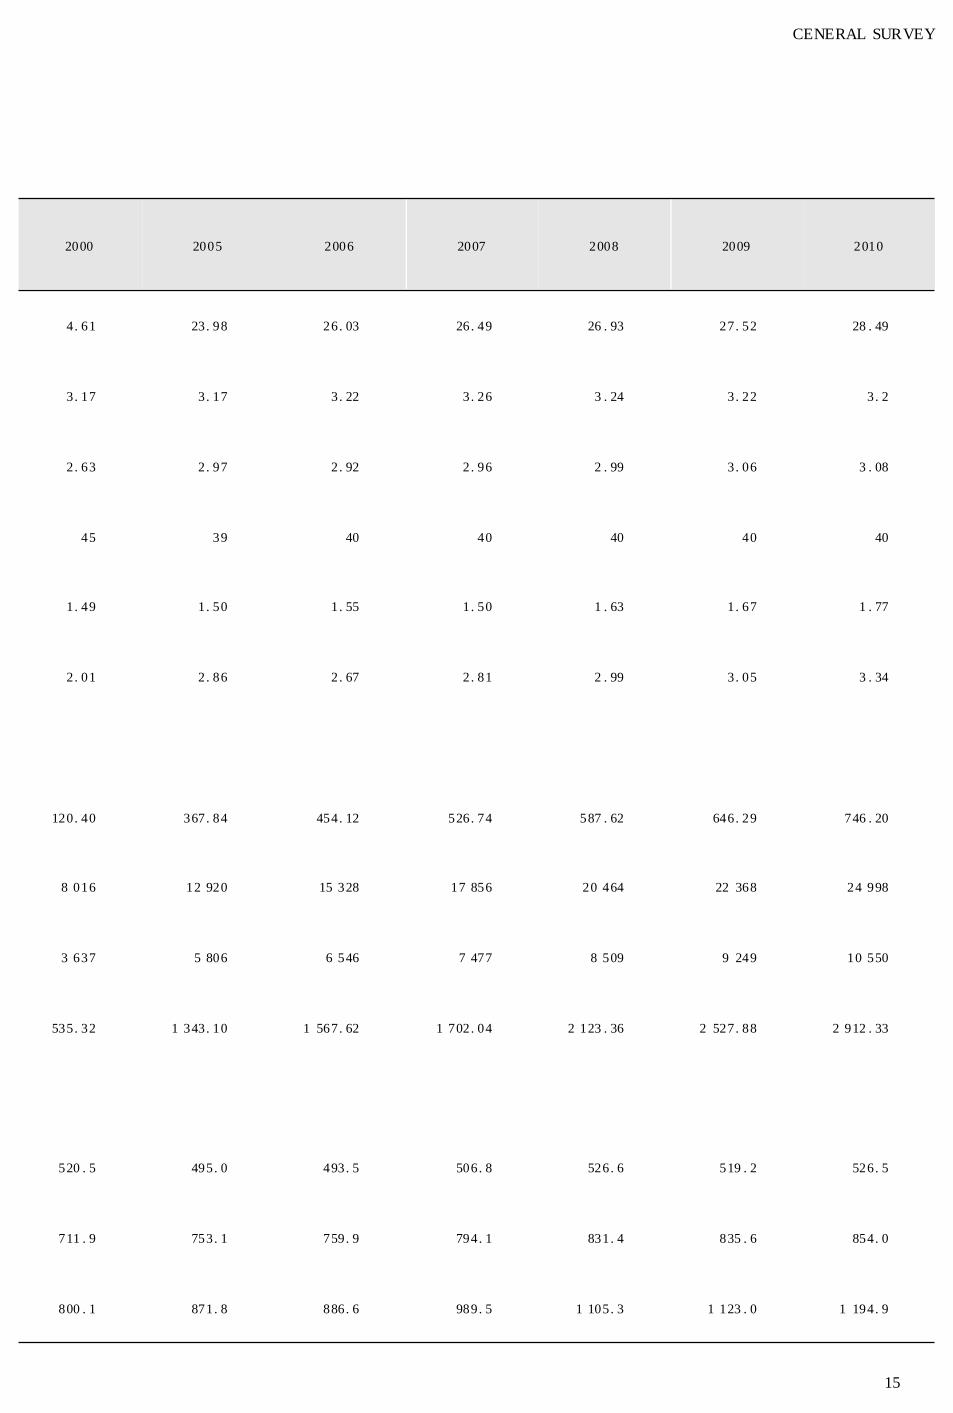
CENERAL SURVEY

1 - 8 国民经济主要结构指标COMPOSITION INDICATORS ON NATIONAL ECONOMY
指 标 Indicator 1990 1995 2000
社会从业人员 Employment
产业结构 Industrial Composition
第一产业 Primary Industry 44. 4 41. 5 36. 4
第二产业 Secondary Industry 34. 9 35. 4 33. 9
第三产业 Tertiary Industry 20. 7 23. 1 29. 7
全市生产总值 GDP
产业结构 Industrial Composition
第一产业 Primary Industry 21. 7 17. 8 11. 8
第二产业 Secondary Industry 48. 0 46. 6 46. 6
第三产业 Tertiary Industry 30. 3 35. 6 41. 6
农业 Agriculture
农林牧渔业产值结构Composition of Farming, Forestry, AnimalHusbandry and Fishery
#农业 Farming 65. 8 53. 1 45. 0
林业 Forestry 2. 4 1. 4 0. 8
牧业 Animal Husbandry 20. 6 26. 2 27. 9
渔业 Fishery 11. 3 19. 3 26. 4
工业 Industy
轻重工业产值结构Composition of Output Value of Light andHeavy Industry
轻工业 Light Industry 57. 6 59. 3 64. 1
重工业 Heavy Industry 42. 4 40. 7 35. 9
固定资产投资 Investment in Fixed Assets
投资结构 Composition of Investment
生产性 Productive 74. 0 56. 1 54. 0
非生产性 Non-productive 26. 0 43. 9 46. 0
—61—
综 合
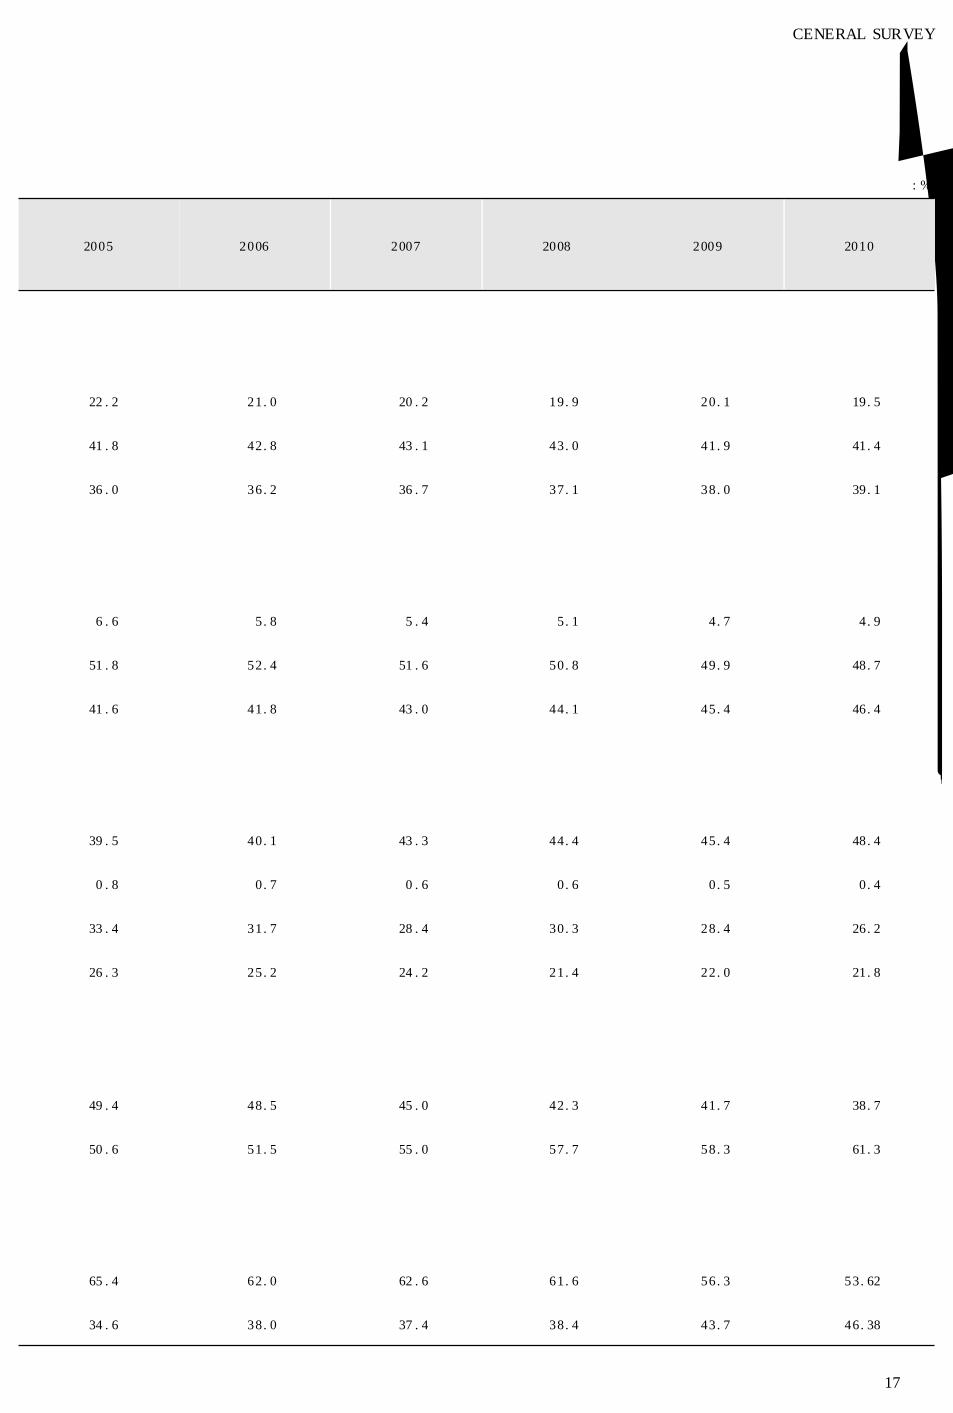
单位 : %
2005 2006 2007 2008 2009 2010
22 . 2 21. 0 20 . 2 19. 9 20. 1 19. 5
41 . 8 42. 8 43 . 1 43. 0 41. 9 41. 4
36 . 0 36. 2 36 . 7 37. 1 38. 0 39. 1
6 . 6 5. 8 5 . 4 5. 1 4. 7 4. 9
51 . 8 52. 4 51 . 6 50. 8 49. 9 48. 7
41 . 6 41. 8 43 . 0 44. 1 45. 4 46. 4
39 . 5 40. 1 43 . 3 44. 4 45. 4 48. 4
0 . 8 0. 7 0 . 6 0. 6 0. 5 0. 4
33 . 4 31. 7 28 . 4 30. 3 28. 4 26. 2
26 . 3 25. 2 24 . 2 21. 4 22. 0 21. 8
49 . 4 48. 5 45 . 0 42. 3 41. 7 38. 7
50 . 6 51. 5 55 . 0 57. 7 58. 3 61. 3
65 . 4 62. 0 62 . 6 61. 6 56. 3 53. 62
34 . 6 38. 0 37 . 4 38. 4 43. 7 46. 38
—71—
CENERAL SURVEY

1 - 9 平均每天主要社会经济活动SELECTED INDICATORS ON AVERAGE DAILY SOCIAL AND ECONOMIC ACTIVITIES
指 标 Indicator 单位 Unit 1990 1995
全市生产总值 GDP 万元 10 000 yuan 4 952 17 300
工业总产值 Gross Industrial Output Value 万元 10 000 yuan 9 786 25 788
农林牧渔业总产值Gross Output Value of Farming, For-estry, Animal Husbandry and Fishery
万元 10 000 yuan 1 589 5 271
主要工业产品产量 Output of Major Industrial Products
发电量 Electricity 万千瓦时 10 000 kW·h 1 102 1 772
钢材 Rolled-steel 吨 ton 1 042 1 359
纱 Yarn 吨 ton 275 218
布 Cloth 万米 10 000 m 93 113
家用电冰箱 Refrigerator 台 unit 751 2 956
彩色电视机 Color TV set 台 unit 507 1 658
社会消费品零售总额 Total Retail Sales of Consumer Goods 万元 10 000 yuan 1 803 6 512
规模以上固定资产投资Investment in Fixed Assets aboveDesignated Size
万元 10 000 yuan 780 4 516
外贸进出口总额 Imports and Exports 万美元 10 000 USD 2 352
港口吞吐量 Volume of Freight Handled in Ports 万吨 10 000 tons 8. 41 14. 15
—81—
综 合

2000 2005 2006 2007 2008 2009 2010
32 637 73 629 87 210 102 744 120 591 132 983 155 238
53 174 137 035 162 159 203 579 245 116 280 976 318 215
6 803 8 781 9 304 9 397 10 982 11 195 13 238
2 489 2 701 3 412 4 255 4 509 4 730 4 984
2 558 9 049 10 288 10 015 9 593 9 579 9 136
191 198 154 131 118 106 97
114 141 151 121 133 85 48
8 523 24 899 35 342 22 173 19 813 22 663 21 951
10 395 36 282 33 030 23 989 22 922 29 170 30 444
11 734 23 839 27 845 33 321 40 883 47 403 53 730
6 649 38 446 40 704 44 804 55 315 67 367 82 808
3 707 9 047 12 527 12 527 14 695 12 288 15 633
23 . 73 51. 31 61 . 47 72. 62 82. 27 86. 76 95. 92
—91—
CENERAL SURVEY

1 - 10 主要指标占全国全省比重( 2010 年)PERCENTAGE OF MAIN INDICATORS TO CHINA AND SHANDONG( 2010)
指 标 Indicator 单位 Unit
一、生产总值 GDP 亿元 100 million yuan
第一产业 Primary Industry 亿元 100 million yuan
第二产业 Secondary Industry 亿元 100 million yuan
第三产业 Tertiary Industry 亿元 100 million yuan
二、主要工业产品产量 Output of Major Industrial Products
纱 Yarn 万吨 10 000 tons
布 Cloth 亿米 100 million m
家用电冰箱 Refrigerator 万台 10 000 units
彩色电视机 Color TV Set 万部 10 000 units
发电量 Electricity 亿千瓦时 100 million kW·h
钢材 Rolled-steel 万吨 10 000 tons
水泥 Cement 万吨 10 000 tons
三、主要农产品产量 Output of Major Farm Products
粮食 Grain 万吨 10 000 tons
油料 Oil Plants 万吨 10 000 tons
棉花 Cotton 万吨 10 000 tons
肉类产量 Meat 万吨 10 000 tons
水产品 Aquatic Products 万吨 10 000 tons
四、固定资产投资额 Investment in Fixed Assets 亿元 100 million yuan
五、社会消费品零售总额 Total Retail Sales of Consumer Goods 亿元 100 million yuan
六、高等学校在校学生 Students Enrollment of Institutions of Higher Education 万人 10 000 persons
注 : 1. 本表全国、全省均为公报数。
2. 青岛市主要工业产品产量数据为本地口径。
Note: 1. The number of the country and the province in the table are obtained from the statistical report.
2. The output of main industrial products of qingdao are at local calibre.
—02—
综 合

全国
China
全省
Shandong
青岛市
Qingdao
青岛市占全国
比重 ( % )
Qingdao /China
青岛市占全省
比重 ( % )
Qingdao /Shandong
397 983 39 416. 2 5 666. 19 1 . 42 14 . 38
40 497 3 588. 3 276. 99 0 . 68 7 . 72
186 481 21 398. 9 2 758. 62 1 . 48 12 . 89
171 005 14 429. 0 2 630. 58 1 . 54 18 . 23
2 717 731 3. 53 0 . 13 0 . 48
800 139. 1 1. 75 0 . 22 1 . 26
7 300 . 8 801. 6 801. 22 10 . 97 99 . 95
11 830 1 137. 7 1 111. 19 9 . 39 97 . 67
42 065 . 4 3 042. 7 181. 93 0 . 43 5 . 98
79 775 . 5 6 672. 2 333. 46 0 . 42 5 . 00
188 000 14 749. 2 442. 66 0 . 24 3 . 00
54 641 4 335. 7 351. 41 0 . 64 8 . 11
3 239 342. 2 44. 19 1 . 36 12 . 91
597 72. 4 0. 4 0 . 07 0 . 55
7 925 704. 7 56. 18 0 . 71 7 . 97
5 366 783. 4 112 2 . 09 14 . 30
278 140 23 279. 1 3 022. 48 1 . 09 12 . 98
156 998 14 211. 6 1 961. 13 1 . 24 13 . 80
2 231 . 8 163. 1 28. 48 1 . 28 17 . 46
—12—
CENERAL SURVEY
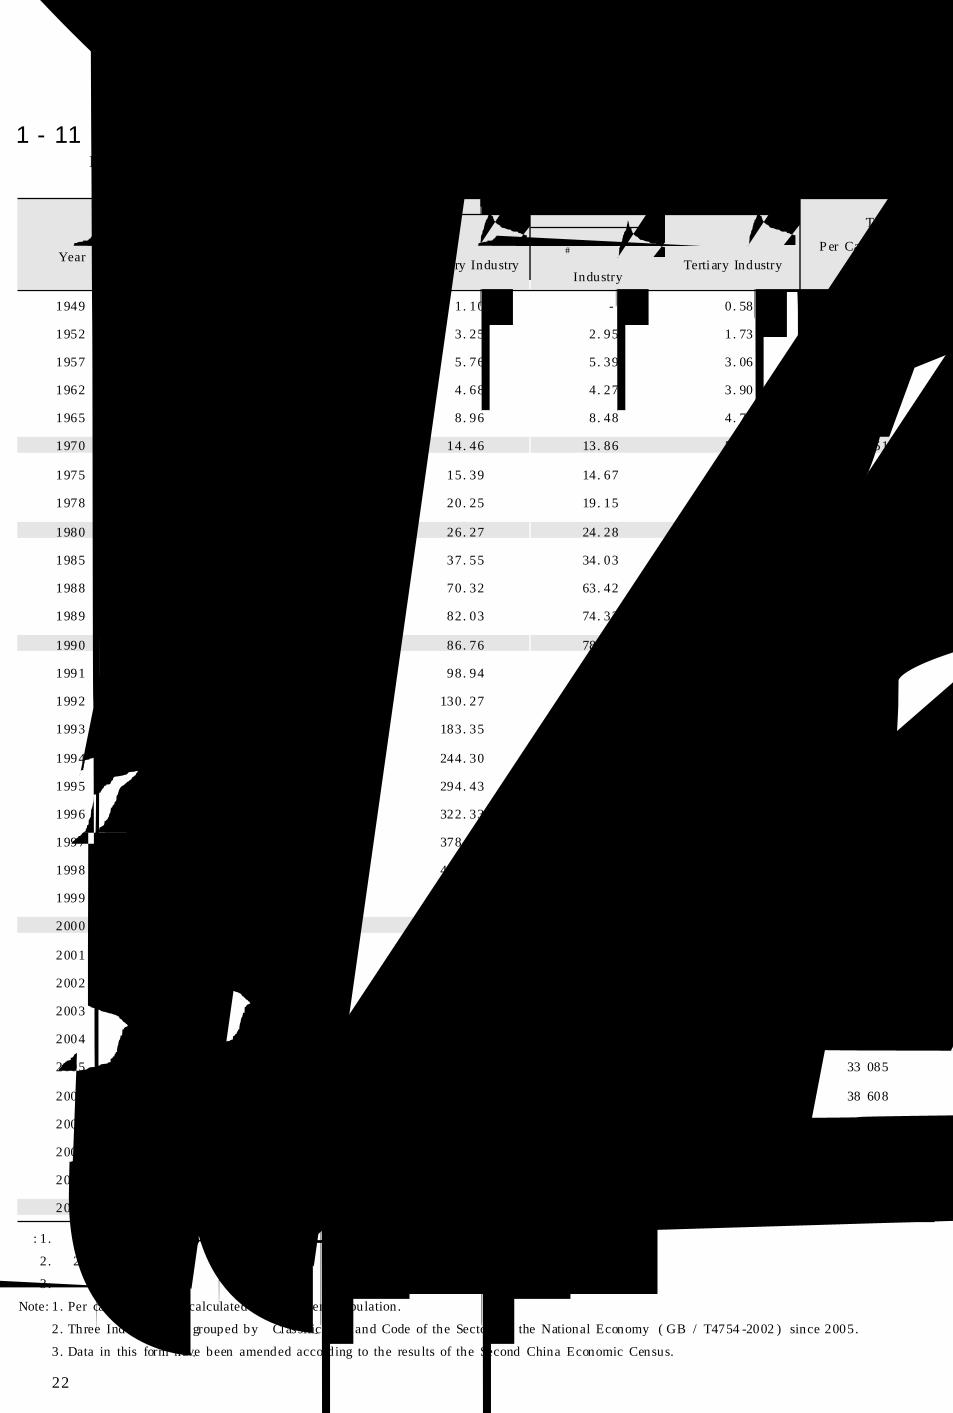
1 - 11 主要年份全市生产总值( 按当年价格计算)MAJOR YEAR’S GROSS DOMESTIC PRODUCT( AT CURRENT PRICE)
单位 : 亿元 ( 100 million yuan)
年 份
Year
全市生产总值
GDP
第一产业
Primary Industry
第二产业
Secondary Industry#工 业
Industry
第三产业
Tertiary Industry
人均生产总值 ( 元 )
Per Capita GDP
( yuan)
1949 2. 87 1. 19 1. 10 - 0. 58 71
1952 6. 74 1. 76 3. 25 2. 95 1. 73 163
1957 10. 82 2. 00 5. 76 5. 39 3. 06 239
1962 9. 69 1. 11 4. 68 4. 27 3. 90 205
1965 15. 50 1. 80 8. 96 8. 48 4. 74 325
1970 23. 23 3. 15 14. 46 13. 86 5. 62 451
1975 29. 07 6. 93 15. 39 14. 67 6. 75 522
1978 38. 43 8. 73 20. 25 19. 15 9. 45 663
1980 48. 65 10. 19 26. 27 24. 28 12. 19 819
1985 82. 28 21. 29 37. 55 34. 03 23. 44 1 311
1988 142. 87 32. 72 70. 32 63. 42 39. 83 2 199
1989 159. 68 30. 79 82. 03 74. 33 46. 86 2 426
1990 180. 77 39. 26 86. 76 78. 94 54. 75 2 714
1991 205. 65 43. 04 98. 94 89. 64 63. 67 3 053
1992 261. 35 43. 92 130. 27 117. 61 87. 16 3 856
1993 371. 90 62. 20 183. 35 164. 35 126. 35 5 455
1994 510. 81 85. 12 244. 30 218. 87 181. 39 7 436
1995 631. 45 112. 53 294. 43 263. 98 224. 49 9 089
1996 713. 60 133. 27 322. 33 289. 87 258. 00 10 130
1997 802. 59 117. 47 378. 25 342. 80 306. 87 11 235
1998 901. 19 140. 66 409. 60 369. 89 350. 93 12 443
1999 1 018. 97 138. 19 468. 67 424. 15 412. 11 13 884
2000 1 191. 25 140. 85 555. 21 504. 44 495. 19 16 009
2001 1 368. 55 144. 35 643. 44 582. 99 580. 76 18 128
2002 1 583. 51 147. 21 758. 33 686. 55 677. 97 20 655
2003 1 869. 44 148. 92 923. 76 832. 31 796. 76 23 986
2004 2 270. 16 163. 49 1 149. 94 1 032. 50 956. 73 28 540
2005 2 687. 46 178. 33 1 392. 02 1 259. 06 1 117. 10 33 085
2006 3 183. 18 183. 95 1 666. 96 1 517. 28 1 332. 28 38 608
2007 3 750. 16 203. 59 1 934. 52 1 766. 28 1 612. 05 44 964
2008 4 401. 56 223. 40 2 234. 83 2 034. 25 1 943. 33 52 266
2009 4 853. 87 230. 25 2 420. 14 2 174. 43 2 203. 48 57 251
2010 5 666. 19 276. 99 2 758. 62 2 454. 19 2 630. 58 65 827
注 : 1. 人均生产总值按常住人口计算 。
2. 自 2005 年起三次产业分类采用《国民经济行业分类》( GB/ T4754-2002) 标准。
3. 本表数据为第二次经济普查修订后数据。
Note: 1. Per capita GDP are calculated at permanent population.
2. Three Industries are grouped by “Classification and Code of the Sectors of the National Economy”( GB / T4754 -2002 ) since 2005.
3. Data in this form have been amended according to the results of the Second China Economic Census.
—22—
综 合 GENERAL SURVEY
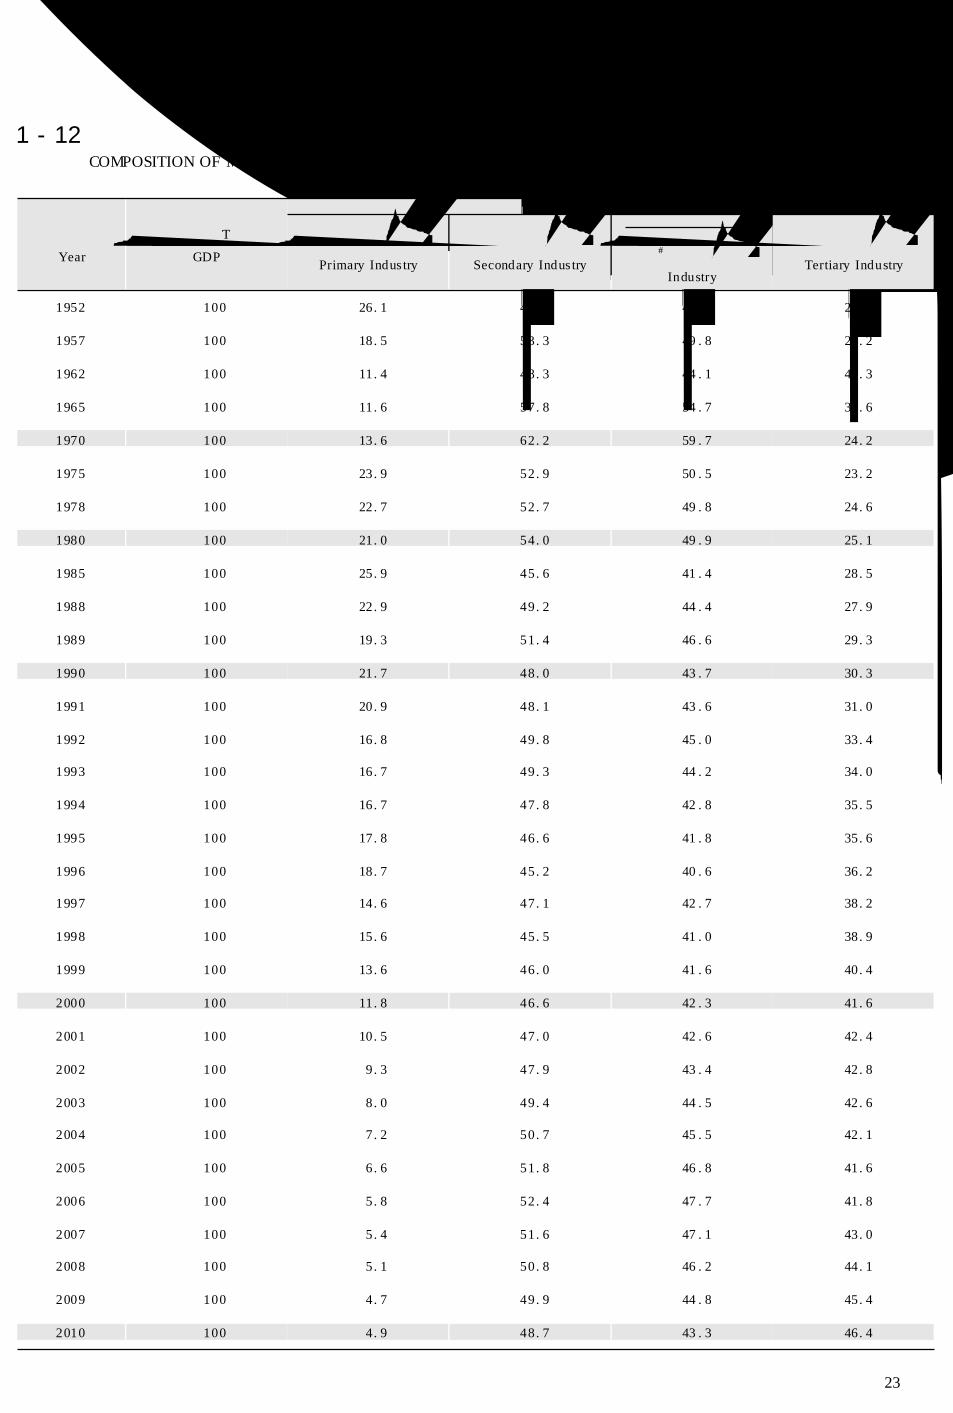
1 - 12 主要年份全市生产总值构成( 以全市生产总值为 100 )COMPOSITION OF MAJOR YEAR’S GROSS DOMESTIC PRODUCT( GROSS DOMESTIC PRODUCT = 100)
单位 : %
年 份
Year
全市生产总值
GDP
第一产业
Primary Industry
第二产业
Secondary Industry#工 业
Industry
第三产业
Tertiary Industry
1952 100 26. 1 48. 2 43 . 8 25. 7
1957 100 18. 5 53. 3 49 . 8 28. 2
1962 100 11. 4 48. 3 44 . 1 40. 3
1965 100 11. 6 57. 8 54 . 7 30. 6
1970 100 13. 6 62. 2 59 . 7 24. 2
1975 100 23. 9 52. 9 50 . 5 23. 2
1978 100 22. 7 52. 7 49 . 8 24. 6
1980 100 21. 0 54. 0 49 . 9 25. 1
1985 100 25. 9 45. 6 41 . 4 28. 5
1988 100 22. 9 49. 2 44 . 4 27. 9
1989 100 19. 3 51. 4 46 . 6 29. 3
1990 100 21. 7 48. 0 43 . 7 30. 3
1991 100 20. 9 48. 1 43 . 6 31. 0
1992 100 16. 8 49. 8 45 . 0 33. 4
1993 100 16. 7 49. 3 44 . 2 34. 0
1994 100 16. 7 47. 8 42 . 8 35. 5
1995 100 17. 8 46. 6 41 . 8 35. 6
1996 100 18. 7 45. 2 40 . 6 36. 2
1997 100 14. 6 47. 1 42 . 7 38. 2
1998 100 15. 6 45. 5 41 . 0 38. 9
1999 100 13. 6 46. 0 41 . 6 40. 4
2000 100 11. 8 46. 6 42 . 3 41. 6
2001 100 10. 5 47. 0 42 . 6 42. 4
2002 100 9. 3 47. 9 43 . 4 42. 8
2003 100 8. 0 49. 4 44 . 5 42. 6
2004 100 7. 2 50. 7 45 . 5 42. 1
2005 100 6. 6 51. 8 46 . 8 41. 6
2006 100 5. 8 52. 4 47 . 7 41. 8
2007 100 5. 4 51. 6 47 . 1 43. 0
2008 100 5. 1 50. 8 46 . 2 44. 1
2009 100 4. 7 49. 9 44 . 8 45. 4
2010 100 4. 9 48. 7 43 . 3 46. 4
—32—
综 合 GENERAL SURVEY

1 - 13 主要年份全市生产总值增长速度( 以上年为 100 )GROWTH RATE OF MAJOR YEAR’S GROSS DOMESTIC PRODUCT( PRECEDING YEAR = 100)
单位 : %
年份
Year
全市生产总值
GDP
第一产业
Primary
Industry
第二产业
Secondary
Industry
第三产业
Tertiary
Industry
人均生产
总值
Per Capita GDP
1979 12. 0 10 . 6 12 . 9 11. 4 10. 4
1980 10. 4 4 . 3 13 . 1 10. 3 9. 4
1981 - 2. 0 - 9 . 1 - 2 . 4 4. 7 - 3. 2
1982 4. 1 5 . 5 - 0 . 2 11. 9 2. 6
1983 16. 9 42 . 8 9 . 3 12. 7 15. 3
1984 13. 0 18 . 9 11 . 5 10. 3 12. 0
1985 9. 9 5 . 4 5 . 8 21. 3 9. 3
1986 9. 2 2 . 6 12 . 1 10. 0 8. 3
1987 12. 0 3 . 6 16 . 0 12. 0 10. 6
1988 13. 8 - 0 . 3 21 . 5 11. 2 12. 1
1989 5. 1 - 0 . 8 4 . 6 9. 9 3. 8
1990 9. 3 9 . 8 7 . 3 12. 2 8. 0
1991 10. 6 9 . 9 11 . 0 10. 5 9. 4
1992 18. 1 2 . 7 23 . 5 20. 7 17. 4
1993 22. 4 20 . 5 21 . 1 25. 6 21. 7
1994 14. 4 3 . 6 14 . 7 20. 2 13. 5
1995 12. 0 10 . 9 12 . 1 12. 4 10. 8
1996 7. 2 7 . 7 7 . 6 6. 4 5. 7
1997 11. 5 - 10 . 6 16 . 8 14. 6 9. 9
1998 12. 9 17 . 6 11 . 3 13. 4 11. 3
1999 13. 9 4 . 1 15 . 5 15. 3 12. 4
2000 15. 2 6 . 5 16 . 4 16. 4 13. 6
2001 13. 7 2 . 3 16 . 3 14. 2 12. 1
2002 14. 5 3 . 2 16 . 9 14. 6 12. 7
2003 16. 3 2 . 5 20 . 1 14. 9 14. 4
2004 16. 7 2 . 7 20 . 3 15. 2 14. 3
2005 16. 6 0 . 4 19 . 6 15. 7 14. 1
2006 15. 3 0 . 9 16 . 8 15. 8 13. 6
2007 15. 5 - 2 . 6 15 . 3 18. 3 14. 2
2008 13. 2 1 . 4 11 . 1 17. 1 12. 1
2009 12. 2 3 . 0 12 . 8 12. 5 11. 4
2010 12. 9 1 . 4 12 . 6 14. 4 11. 2
1978 - 2010 平均每年增长1978 - 2010 Average Increase Rate
12. 4 5 . 3 13 . 1 13. 9 11. 0
1991 - 2010 平均每年增长1991 - 2010 Average Increase Rate 14. 2 4 . 2 15 . 5 15. 3 12. 8
1996 - 2010 平均每年增长1996 - 2010 Average Increase Rate
13. 8 2 . 5 15 . 2 14. 5 13. 0
2001 - 2010 平均每年增长2001 - 2010 Average Increase Rate 14. 7 1 . 5 16 . 1 15. 2 13. 0
2006 - 2010 平均每年增长2006 - 2010 Average Increase Rate 13. 8 0 . 8 13 . 7 15. 6 12. 5
—42—
综 合 GENERAL SURVEY

1 - 14 分市、区生产总值( 2010 年)GROSS DOMESTIC PRODUCT BY REGION( 2010)
单位 : 亿元 ( 100 million yuan)
市、区名称 Region地区生产总值
GDP
第一产业
Primary
Industry
第二产业
Secondary
Industry
#工 业
Industry
第三产业
Tertiary
Industry
市 南 区 Shinan District 543. 70 59. 50 34. 60 484. 20
市 北 区 Shibei District 280. 12 54. 17 30. 27 225. 95
四 方 区 Sifang District 170. 55 74. 51 62. 50 96. 04
李 沧 区 Licang District 213. 26 0. 02 117. 93 104. 40 95. 31
崂 山 区 Laoshan District 317. 31 4. 86 178. 15 160. 67 134. 30
黄 岛 区 Huangdao District 1 003. 17 3. 77 654. 25 613. 08 345. 15
城 阳 区 Chengyang District 702. 45 14. 29 434. 81 404. 85 253. 35
胶 州 市 Jiaozhou District 557. 06 39. 39 319. 77 287. 65 197. 90
即 墨 市 Jimo District 573. 54 47. 87 313. 39 282. 39 212. 29
平 度 市 Pingdu District 524. 19 79. 70 265. 38 242. 08 179. 11
胶 南 市 Jiaonan District 549. 46 43. 36 324. 43 293. 16 181. 66
莱 西 市 Laixi District 393. 90 43. 72 197. 55 173. 76 152. 63
注 : 1. 本表按当年价格计算。
2. 三次产业分类采用《国民经济行业分类》( GB/ T4754-2002) 标准 。
Note: 1. The data are calculated at current price.
2. Three Industries are grouped by “Classification and Code of the Sectors of the National Economy”( GB/ T4754-2002) .
—52—
综 合 GENERAL SURVEY

1 - 15 按支出法计算的全市生产总值( 2010 年)GROSS DOMESTIC PRODUCT BY EXPENDITURE APPROACH( 2010)
单位 : 亿元 ( 100 million yuan)
项 目 Item 2010 20092010 年为 2009 年%
2010 /2009( % )
支出法计算的全市生产总值Gross Domestic Product by Expendi-
ture Approach5 666.19 4 853.87 112.9
( 一 ) 最终消费 Final Consumption Expenditures 1 889 . 42 1 683. 98 109. 5
1. 居民消费 Household Consumption Expenditures 1 410 . 98 1 228. 04 111. 5
农村居民 Rural Household 233 . 53 196. 08 115. 0
城镇居民 Urban Household 1 177 . 45 1 031. 95 110. 8
2. 政府消费 Government Consumption Expenditures 478 . 44 455. 95 104. 2
( 二 ) 资本形成总额 Gross Capital Formation 2 967 . 71 2 395. 71 116. 0
1. 固定资本形成总额 Gross Fixed Capital Formation 2 841 . 97 2 329. 90 114. 1
2. 存货增加 Change in Inventories 125 . 74 65. 81 180. 9
( 三 ) 货物和服务净流出 Net Exports of Goods and Services 809 . 06 774. 17 111. 2
注 : 绝对额按当年价格计算 , 速度按可比价格计算。
Note: The absolute numbers are calculated at current price, their growth are calculated at constant price.
—62—
综 合 GENERAL SURVEY

1 - 16 全市生产总值构成( 2010 年)COMPOSITION OF GROSS DOMESTIC PRODUCT( 2010)
指 标 Indicator
增加值 ( 亿元 )
Added Value
( 100 million yuan)
2010 年为
2009 年%
2010 /2009( % )
全市生产总值 GDP 5 666.19 112.9
第一产业 Primary Industry 276. 99 101. 4
农、林、牧、渔业 Farming, Forestry, A nimal Husbandry and Fishery 276. 99 101. 4
第二产业 Secondary Industry 2 758. 62 112. 6
工业 Industry 2 454. 19 112. 3
建筑业 Construction 304. 43 115. 3
第三产业 Tertiary Industry 2 630. 58 114. 4
交通运输、仓储和邮政业 Transport, Storage and Post 428. 20 117. 2
信息传输、计算机服务和软件业Information Transmission, Computer Services andSoftware
116. 53 109. 9
批发和零售业 Wholesale and Retail Trade 599. 77 116. 1
住宿和餐饮业 Hotels and Catering Services 125. 38 108. 7
金融业 Financial Intermediation 244. 20 116. 6
房地产业 Real Estate 253. 74 117. 2
租赁和商务服务业 Leasing and Business Services 152. 28 124. 8
科学研究、技术服务和地质勘查业Scientific Research, Technical Services and GeologicProspecting
76. 20 117. 9
水利、环境和公共设施管理业Management of Water Conservancy, Environment andPublic Facilities
30. 49 112. 4
居民服务和其他服务业 Services to Households and Other Services 115. 74 117. 1
教育 Education 166. 40 105. 4
卫生、社会保障和社会福利业 Health, Social Security and Social Welfare 81. 05 108. 4
文化、体育和娱乐业 Culture, Sports and Entertainment 38. 89 125. 7
公共管理和社会组织 Public Management and Social Organization 201. 71 104. 7
注 : 表中绝对数按现行价格计算 ; 相对数按可比价格计算。
Note: The absolute numbers are calculated at current price, the relative numbers are calculated at constant price.
—72—
综 合 GENERAL SURVEY

主要统计指标解释
国内生产总值( GDP) 指按市场价格计算的一个国家( 或地区) 所有常住单位在一定时期内生产活动的最终成果。国内
生产总值有三种表现形态, 即价值形态、收入形态和产品形态。从价值形态看, 它是所有常住单位在一定时期内生产的全部
货物和服务价值超过同期中间投入的全部非固定资产货物和服务价值的差额, 即所有常住单位的增加值之和; 从收入形态
看, 它是所有常住单位在一定时期内创造并分配给常住单位和非常住单位的初次收入分配之和; 从产品形态看, 它是所有常
住单位在一定时期内最终使用的货物和服务价值与货物和服务净出口价值之和。在实际核算中, 国内生产总值有三种计算
方法, 即生产法、收入法和支出法。三种方法分别从不同的方面反映国内生产总值及其构成。对于一个地区来说, 称为地区
生产总值或地区 GDP。
人均 GDP 人均 GDP是一定时期内 GDP 与同期人口平均数的比值。按照国际标准, 人口平均数应该是同期平均常住人
口。我国在核算制度中也规定, 无论是国家还是地区, 人口数都采用常住人口。国家统计局规定从 2004 年开始, 过去采用户
籍人口计算人均 GDP的地区, 作为过渡性措施, 可在两年内同时计算两种口径的人均 GDP( 数据后面必须注明是什么口径) ,
两年后取消按户籍人口计算的人均 GDP。我市采用常住人口计算人均 GDP。
三次产业 是根据社会生产活动历史发展的顺序对产业结构的划分, 产品直接取自自然界的部门称为第一产业, 对初级
产品进行再加工的部门称为第二产业, 为生产和消费提供各种服务的部门称为第三产业。它是世界上通用的产业结构分类,
但各国的划分不尽一致。我国的三次产业划分是:第一产业: 是指农业、林业、畜牧业、渔业和农林牧渔服务业。
第二产业: 是指采矿业, 制造业, 电力、燃气及水的生产和供应业; 建筑业。
第三产业: 除第一、第二产业以外的其他行业。
支出法国内生产总值 是从最终使用角度反映一个国家( 或地区) 一定时期内生产活动最终成果的一种方法, 包括最终
消费支出, 资本形成总额及货物和服务净出口三部分。对于地区, 名称为“支出法地区生产总值”。
最终消费 指常住单位为满足物质、文化和精神生活的需要, 从本国经济领土和国外购买的货物和服务的支出; 不包括
非常住单位在本国经济领土内的消费支出。最终消费分为居民消费和政府消费。
居民消费 指常住住户在一定时期内对货物和服务的全部最终消费支出。居民消费支出除了直接以货币形式购买货物
和服务的消费之外, 还包括以其他方式获得的货物和服务的消费支出, 即所谓的虚拟消费支出。居民虚拟消费支出包括以下
几种类型: 单位以实物报酬及实物转移的形式提供给劳动者的货物和服务; 住户生产并由本住户消费了的货物和服务, 其中
的服务仅指住户的自有住房服务和付酬的家庭雇员提供的家庭和个人服务; 金融机构提供的金融媒介服务。
政府消费 指政府部门为全社会提供公共服务的消费支出和免费或以较低价格向居民住户提供的货物和服务的净支
出。前者等于政府服务的产出价值减去政府单位所获得的经营收入的价值; 后者等于政府部门免费或以较低价格向居民住
户提供的货物和服务的市场价值减去向住户收取的价值。
资本形成总额 指常住单位在一定时期内获得的减去处置的固定资产和存货的净额, 包括固定资本形成总额和存货增
加。
固定资本形成总额 指常住单位在一定时期内获得的固定资产减处置的固定资产的价值总额。固定资产是通过生产活
动生产出来的, 且使用年限在一年以上、单位价值在规定标准以上的资产, 不包括自然资产。分有形固定资产形成总额和无
形固定资产形成总额。有形固定资产形成总额包括一定时期内完成的建筑工程、安装工程和设备工器具购置( 减处置) 价值,以及土地改良、新增役、种、奶、毛、娱乐用牲畜和新增经济林木价值。无形固定资产形成总额包括矿藏的勘探、计算机软件等
获得减处置。
存货增加 指常住单位在一定时期内存货实物量变动的市场价值, 即期末价值减期初价值的差额, 再扣除当期由于价格
变动而产生的持有收益。存货增加可以是正值, 也可以是负值; 正值表示存货上升, 负值表示存货下降。它包括生产单位购
进的原材料、燃料和储备物资等存货, 以及生产单位生产的产成品、在制品和半成品等存货。
—82—
综 合 GENERAL SURVEY
货物和服务净出口 指货物和服务出口减货物和服务进口的差额。出口包括常住单位向非常住单位出售或无偿转让的
各种货物和服务的价值; 进口包括常住单位从非常住单位购买或无偿得到的各种货物和服务的价值。由于服务活动的提供
与使用同时发生, 一般把常住单位从国外得到的服务作为进口, 非常住单位从本国得到的服务作为出口。货物的出口和进口
都按离岸价格计算。
气候 指地球与大气之间长期能量交换与质量交换所形成的一种自然环境状态, 它是多种因素综合作用的结果。气候
既是人类生活和生产的环境要素之一, 又是供给人类生活和生产的重要资源。气温、降水、湿度等气象要素的多年平均值是
用来描述一个地区气候状况的主要参数, 而各种气象要素某年、某月的平均值( 或总量) 则可以反映出该时期天气气候状况的
重要特征。
气温 指空气的温度, 我国一般以摄氏度( ℃) 为单位表示。气象观测的温度表是放在离地面约 1. 5 米处通风良好的百
叶箱里测量的, 因此, 通常说的气温指的是离地面 1. 5 米处百叶箱中的温度。其统计计算方法为: 月平均气温是将全月各日的
平均气温相加, 除以该月的天数而得。
年平均气温是将 12 个月的月平均气温累加后除以 12 而得。
降水量 指从天空降落到地面的液态或固态( 经融化后) 水, 未经蒸发、渗透、流失而在地面上积聚的深度。其统计计算
方法为: 月降水量是将全月各日的降水量累加而得。年降水量是将 12 个月的月降水量累加而得。
Explanatory Notes on Main Statistical Indicators
Gross Domestic Product ( GDP) refers to the final products at market prices produced by all resident units in a country ( or a
region) during a certain period of time. Gross domestic product is expressed in three different perspectives, namely value, income,and products respectively. GDP in its value perspective refers to the total value of all goods and services produced by all resident units
during a certain period of time, minus the total value of input of goods and services of the nature of non - fixed assets; in other words,it is the sum of the value-added of all resident units. GDP from the perspective of income includes the primary income created by all
resident units and distributed to resident and non-resident units. GDP from the perspective of products refers to the value of all goodsand services for final consumption by all resident units minus the net exports of goods and services during a given period of time. In the
practice of national accounting, gross domestic product is calculated from three approaches, namely production approach, income ap-proach and expenditure approach, which reflect gross domestic product and its composition from different angles. For a certain region,
it refers region gross product or region GDP.
Per Capita GDP refers to the ratio of GDP in a certain term and average population in the same term. According to the interna-tional standard, average population should be average permanent population in the same term. In the account regulation, population of
both the country and the region should be permanent population. In the after two yers since 2004, per capita GDP can be calculated attwo coverage. i. e. at permanent population and household registered population( the note of coverage should follow the data. ) The per
capita GDP calculated with household registered population will be abolished after two years. Per capita GDP of Qingdao is calculated atpermanent population.
Three Industries has been classified according to the historical sequence of development. Primary industry refers to extraction
of natural resources; secondary industry involves processing of primary products; and tertiary industry provides services of various kindsfor production and consumption. The above classification is universal although it varies to some extent form country to country. Industry
in China comprises:Primary industry: refers to farming, forestry, animal husbandry and fishery and services in support of these industries.
Secondary industry: refers to mining and quarrying, manufacturing, production and supply of electricity, water and gas; And con-struction.
Tertiary industry: all other industries not included in primary or secondary industries.
GDP by Expenditure Approach refers to the method of measuring the final results of production activities of a country ( re-gion) during a given period from the perspective of final use. It includes final consumption, total capital formation and net export of
—92—
综 合 GENERAL SURVEY
goods and services. For a certain region, it refers region gross product by expenditure approach.
Final Consumption refers to the total expenditure of resident units for purchases of goods and services from domestic economic
territory and abroad to meet the requirements of material, cultural and spiritual life. It excludes the expenditure of non-resident units on
consumption in the economic territory of the country. The final consumption is broken down into household consumption and government
consumption.
Household Consumption refers to the total expenditure of resident households on the final consumption of goods and services.
It is caculated at market prices, according to households who pay the purchase price. Buyers purchase price of the goods were made to
pay the price, including the payment of the purchase of the transport and commercial costs. In addition to the consumption of goods and
services bought by the households directly with money, the households consumption also includes expenditure on goods and services ob-tained by the households in other ways, i. e. the so-called imputed consumption expenditure, which includes the following: ( a) the
goods and services provided to the households by the employer in the form of payment in kind and transfer in kind; ( b) goods and serv-
ices produced and consumed by the households themselves, in which the services refer only to the owner-occupied housing and domestic
and individual services provided by the paid household workers; ( c) financial intermediate services provided by financial institutions;
( d) insurance services provided by insurance companies.
Government Consumption refers to the expenditure on the consumption of the public services provided by the government to
the whole society and the net expenditure on the goods and services provided by the government to the households free of charge or at
low prices. The former equals to the output value of the government services minus the value of operating income obtained by the gov-ernment departments. The latter equals to the market value of the goods and services provided by the government free of charge or at
low prices to the households minus the value received by the government from the households.
Gross Capital Formation refers to the fixed assets acquired less disposal and the net value of inventory, thus including thegross fixed capital formation and charges in inventories.
Gross Fixed Capital Formation refers to the value of fixed assets acquired minus those disposed of during a given period.
Fixed assets are the assets produced through production activities with specified unit value which could be used for over one year, ex-
cluding natural assets. Total fixed capital formation can be categorized into total tangible capital formation and total intangible capitalformation. The total tangible capital formation include the value of the construction projects, installation projects completed and the e-
quipment, apparatus and instruments purchased as well as the value of land improved, the value of draught animals, breeding stock,
animals for milk, wool and for recreational purpose, and the newly increased forest with economic value during a given period. The to-
tal intangible capital formation includes the prospecting of minerals, the acquisition of computer software, original works of entertain-
ment and literature minus the disposal of them.
Charges in Inventories refers to the market value of the change in inventory of resident units during a given period, i. e. the
difference of value between the beginning and the end of the period minus the current gains due to the change in prices. The increase
in inventory can be positive or negative. A positive value indicates the increase in inventory while a negative value indicates the de-crease in stock. The inventory includes the raw materials, fuels and reserve materials purchased by the production units as well as the
inventory of finished products, semi-finished products, work-in-progress, etc.
Net Export of Goods and Services refers to the difference of the exports of goods and services minus the imports of goods and
services. The imports include the value of various goods and services sold or gratuitously transferred by the resident units to the non-resident units. The imports include the value of various goods and services purchased or gratuitously acquired by the resident units from
the non-resident units. Because the provision of services and the use of them happen simultaneously, the acquisition of services by the
resident units from abroad is usually treated as import while the acquisition of services by non-resident units in this country is usually
treated as export. The export and import of goods are calculated at FOB.
Climate refers to the natural environmental status formed by the long-term exchange of energy and mass between the earth and
the air, and is the results of interaction of many factors. Climate is both one of the environment factors and the important resources for
—03—
综 合 GENERAL SURVEY
the living and production activities of the human being. The average values across several years of meteorological factors such as tem-
perature, rainfall and humidity are used as important parameters to describe the climate of a region, while the average values ( or totalvalues) of a given year or month of meteorological factors reflect the key characteristics of climate for that period of time.
Temperature refers to the air temperature. China uses centigrade as the unit. The thermometry used for weather observation is
put in a breezy shutter, which is 1. 5 meters high from the ground. Therefore, the commonly used temperature refers to the temperature
in the breezy shutter 1. 5 meters away from the ground. The calculation method is as follows:Monthly average temperature is the summation of average daily temperature of one month divided by the actual days of that particu-
lar month.Annual average temperature is the summation of monthly average of a year divided by 12 months.
Volume of Precipitation refers to the deepness of liquid state or solid state ( thawed) water falling from the sky to the groundthat has not been evaporated, infiltrated or run off. The calculation method is as follows:
Monthly precipitation is the summation of daily precipitation of a month.Annual precipitation is the summation of 12 months precipitation of a year.
—13—
综 合 GENERAL SURVEY