Embed Size (px)
Citation preview
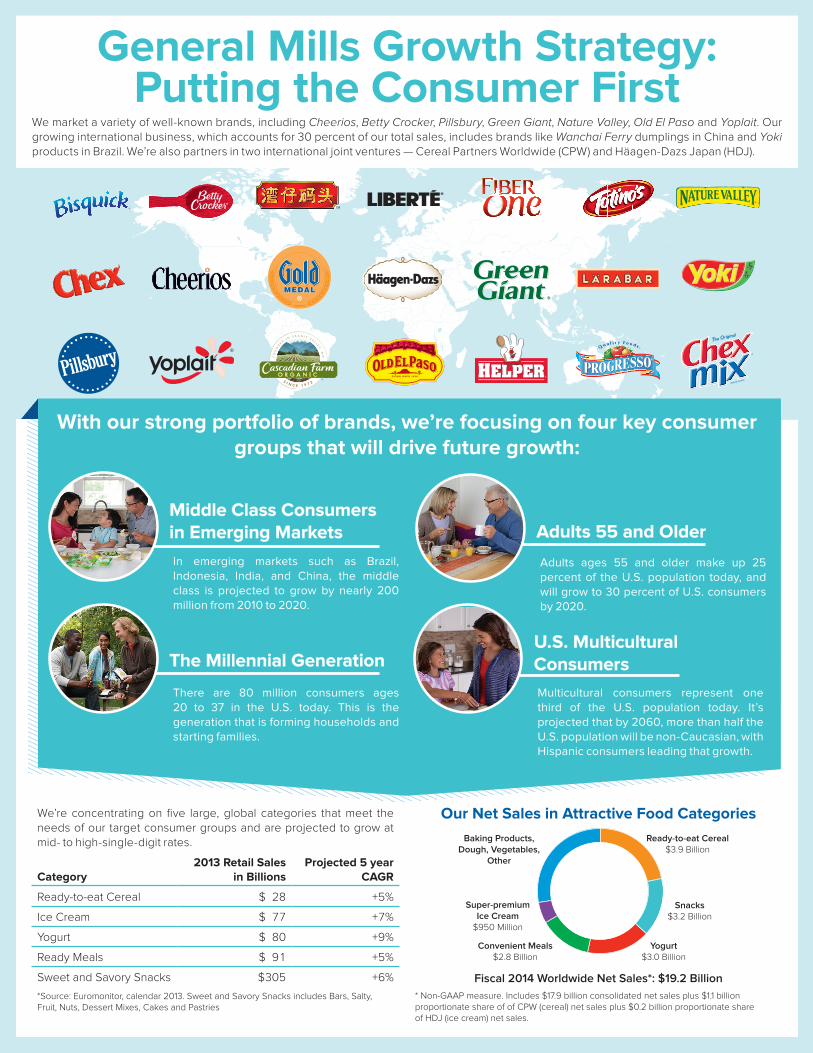
General Mills Growth Strategy:Putting the Consumer First
We market a variety of well-known brands, including Cheerios, Betty Crocker, Pillsbury, Green Giant, Nature Valley, Old El Paso and Yoplait. Our growing international business, which accounts for 30 percent of our total sales, includes brands like Wanchai Ferry dumplings in China and Yoki products in Brazil. We’re also partners in two international joint ventures — Cereal Partners Worldwide (CPW) and Häagen-Dazs Japan (HDJ).
We’re concentrating on five large, global categories that meet the needs of our target consumer groups and are projected to grow at mid- to high-single-digit rates.
Category2013 Retail Sales
in BillionsProjected 5 year
CAGR
Ready-to-eat Cereal $ 28 +5%
Ice Cream $ 77 +7%
Yogurt $ 80 +9%
Ready Meals $ 91 +5%
Sweet and Savory Snacks $305 +6%
*Source: Euromonitor, calendar 2013. Sweet and Savory Snacks includes Bars, Salty, Fruit, Nuts, Dessert Mixes, Cakes and Pastries
With our strong portfolio of brands, we’re focusing on four key consumer groups that will drive future growth:
In emerging markets such as Brazil, Indonesia, India, and China, the middle class is projected to grow by nearly 200 million from 2010 to 2020.
Multicultural consumers represent one third of the U.S. population today. It’s projected that by 2060, more than half the U.S. population will be non-Caucasian, with Hispanic consumers leading that growth.
There are 80 million consumers ages 20 to 37 in the U.S. today. This is the generation that is forming households and starting families.
Adults ages 55 and older make up 25 percent of the U.S. population today, and will grow to 30 percent of U.S. consumers by 2020.
The Millennial Generation
Middle Class Consumers in Emerging Markets Adults 55 and Older
U.S. Multicultural Consumers
Our Net Sales in Attractive Food Categories
* Non-GAAP measure. Includes $17.9 billion consolidated net sales plus $1.1 billion proportionate share of of CPW (cereal) net sales plus $0.2 billion proportionate share of HDJ (ice cream) net sales.
Baking Products, Dough, Vegetables,
Other
Super-premium Ice Cream
$950 Million
Convenient Meals$2.8 Billion
Fiscal 2014 Worldwide Net Sales*: $19.2 Billion
Yogurt$3.0 Billion
Snacks$3.2 Billion
Ready-to-eat Cereal$3.9 Billion
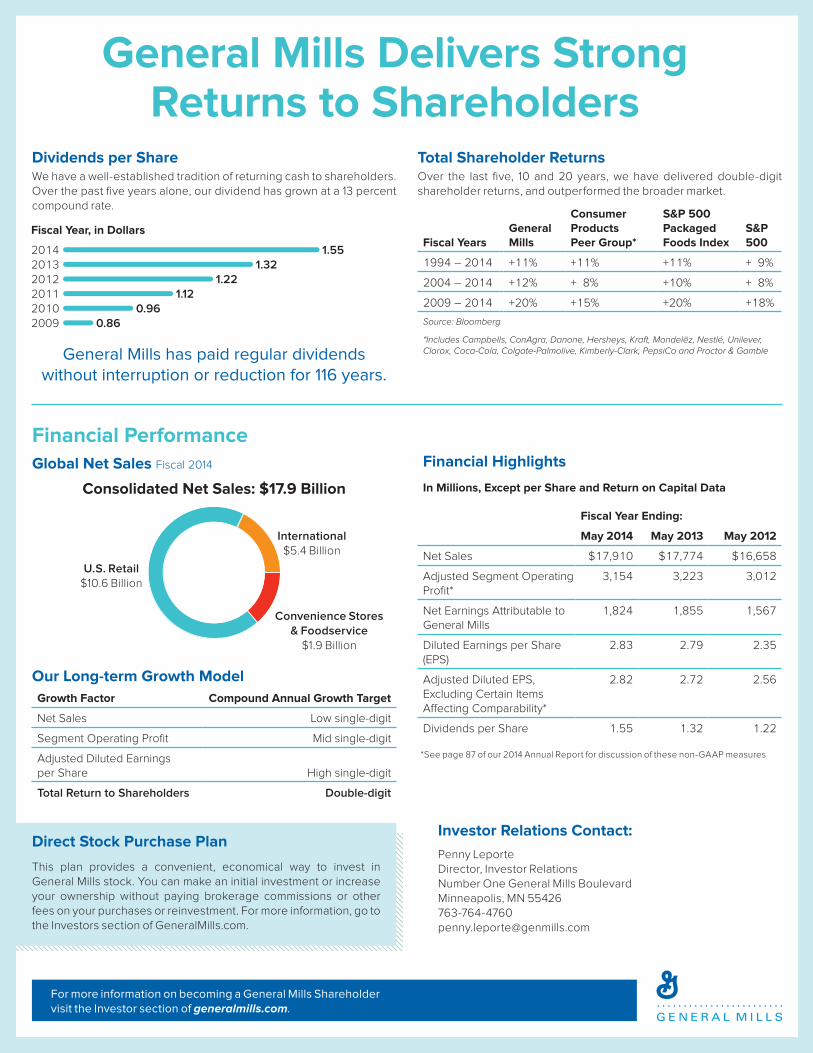
Global Net Sales Fiscal 2014
Financial Performance
General Mills Delivers Strong Returns to Shareholders
Direct Stock Purchase Plan
Fiscal YearsGeneral Mills
Consumer Products Peer Group*
S&P 500 Packaged Foods Index
S&P 500
1994 – 2014 +11% +11% +11% + 9%
2004 – 2014 +12% + 8% +10% + 8%
2009 – 2014 +20% +15% +20% +18%
Source: Bloomberg
*Includes Campbells, ConAgra, Danone, Hersheys, Kraft, Mondelēz, Nestlé, Unilever, Clorox, Coca-Cola, Colgate-Palmolive, Kimberly-Clark, PepsiCo and Proctor & Gamble
Financial Highlights
In Millions, Except per Share and Return on Capital Data
Fiscal Year Ending:
May 2014 May 2013 May 2012
Net Sales $17,910 $17,774 $16,658
Adjusted Segment Operating Profit*
3,154 3,223 3,012
Net Earnings Attributable to General Mills
1,824 1,855 1,567
Diluted Earnings per Share (EPS)
2.83 2.79 2.35
Adjusted Diluted EPS, Excluding Certain Items Affecting Comparability*
2.82 2.72 2.56
Dividends per Share 1.55 1.32 1.22
1.5520141.322013
1.2220121.122011
0.9620100.862009
Fiscal Year, in Dollars
General Mills has paid regular dividends without interruption or reduction for 116 years.
For more information on becoming a General Mills Shareholder visit the Investor section of generalmills.com.
We have a well-established tradition of returning cash to shareholders. Over the past five years alone, our dividend has grown at a 13 percent compound rate.
Investor Relations Contact:
Penny Leporte Director, Investor RelationsNumber One General Mills BoulevardMinneapolis, MN 55426763-764-4760 [email protected]
Over the last five, 10 and 20 years, we have delivered double-digit shareholder returns, and outperformed the broader market.
This plan provides a convenient, economical way to invest in General Mills stock. You can make an initial investment or increase your ownership without paying brokerage commissions or other fees on your purchases or reinvestment. For more information, go to the Investors section of GeneralMills.com.
Our Long-term Growth Model
Growth Factor Compound Annual Growth Target
Net Sales Low single-digit
Segment Operating Profit Mid single-digit
Adjusted Diluted Earnings per Share High single-digit
Total Return to Shareholders Double-digit
U.S. Retail $10.6 Billion
International $5.4 Billion
Convenience Stores & Foodservice
$1.9 Billion
*See page 87 of our 2014 Annual Report for discussion of these non-GAAP measures
Dividends per Share Total Shareholder Returns
Consolidated Net Sales: $17.9 Billion