Embed Size (px)
Citation preview
1
Q2 2007 Earnings Call
August 1, 2007
General Maritime Corporation
2
Today’s presentation and discussion will contain forward-looking statements within the meaning of the Private Securities Litigation Reform Act of 1995. These forward-looking statements are based on management's current expectations and observations. Included among the factors that, in the Company's view, could cause actual results to differ materially from the forward looking statements contained in this press release are the following: changes in demand; a material decline or prolonged weakness in rates in the tanker market; changes in production of or demand for oil and petroleum products, generally or in particular regions; greater than anticipated levels of tanker newbuilding orders or lower than anticipated rates of tanker scrapping; changes in rules and regulations applicable to the tanker industry, including, without limitation, legislation adopted by international organizations such as the International Maritime Organization and the European Union or by individual countries; actions taken by regulatory authorities; changes in trading patterns significantly impacting overall tanker tonnage requirements; changes in the typical seasonal variations in tanker charter rates; changes in the cost of other modes of oil transportation; changes in oil transportation technology; increases in costs including without limitation: crew wages, insurance, provisions, repairs and maintenance; changes in general domestic and international political conditions; changes in the condition of the Company's vessels or applicable maintenance or regulatory standards (which may affect, among other things, the Company's anticipated drydocking or maintenance and repair costs); changes in the itineraries of the Company’s vessels; delays in the construction or delivery of contracted newbuildings; and other factors listed from time to time in the Company’s filings with the Securities and Exchange Commission, including, without limitation, its Annual Report on Form 10-K for the year ended December 31, 2006 and its subsequent reports on Form 10-Q and Form 8-K. For further information, please refer to such filings with the Securities and Exchange Commission including the Company’s Current Report on Form 8-K dated as of July 31, 2007. The Company’s ability to pay dividends in any period will depend upon factors including applicable provisions of Marshall Islands law and the final determination by the Board of Directors each quarter after its review of the Company’s financial performance. The timing and amount of dividends, if any, could also be affected by factors affecting cash flows, results of operations, required capital expenditures, or reserves. As a result, the amount of dividends actually paid may vary from the amounts currently estimated. Share repurchases may be made from time to time for cash in open market transactions at prevailing market prices or in privately negotiated transactions. The timing and amount of purchases under the program will be determined by management based upon market conditions and other factors. Purchases may be made pursuant to a program adopted under Rule 10b5-1 under the Securities Exchange Act. The program does not require the Company to purchase any specific number or amount of shares and may be suspended or reinstated at any time in the Company's discretion and without notice. Repurchases will be subject to the restrictions under the Company's existing credit facility. The Board will periodically review the program.

3
AgendaAgenda
Second Quarter 2007 HighlightsFinancial Review Company Outlook & Industry OverviewQuestions

4
Second Quarter and 6M 2007 HighlightsSecond Quarter and 6M 2007 Highlights
Quarter Ended June 30, 2007Net Income of $11.8 million
EPS of $0.38 basic and $0.37 diluted
Six Months 2007Net Income of $28.4 million
EPS of $0.92 basic and $0.90 diluted
Six Month 2007 Dividends
Q2 2007 regular dividend of $0.50 per shareQ1 2007 regular dividend of $0.50 per share$15.00 per share special dividend paid in March 2007
(1) EBITDA represents net income plus net interest expense and depreciation and amortization. EBITDA is included because it is used by management and certain investors as a measure of operating performance. EBITDA is used by analysts in the shipping industry as a common performance measure to compare results across peers. Management of the Company uses EBITDA as a performance measure in consolidating monthly internal financial statements and is presented for review at our board meetings. The Company believes that EBITDA is useful to investors as the shipping industry is capital intensive which often brings significant cost of financing. EBITDA is not an item recognized by GAAP, and should not be considered as an alternative to net income, operating income or any other indicator of a company's operating performance required by GAAP. The definition of EBITDA used here may not be comparable to that used by othercompanies.
5
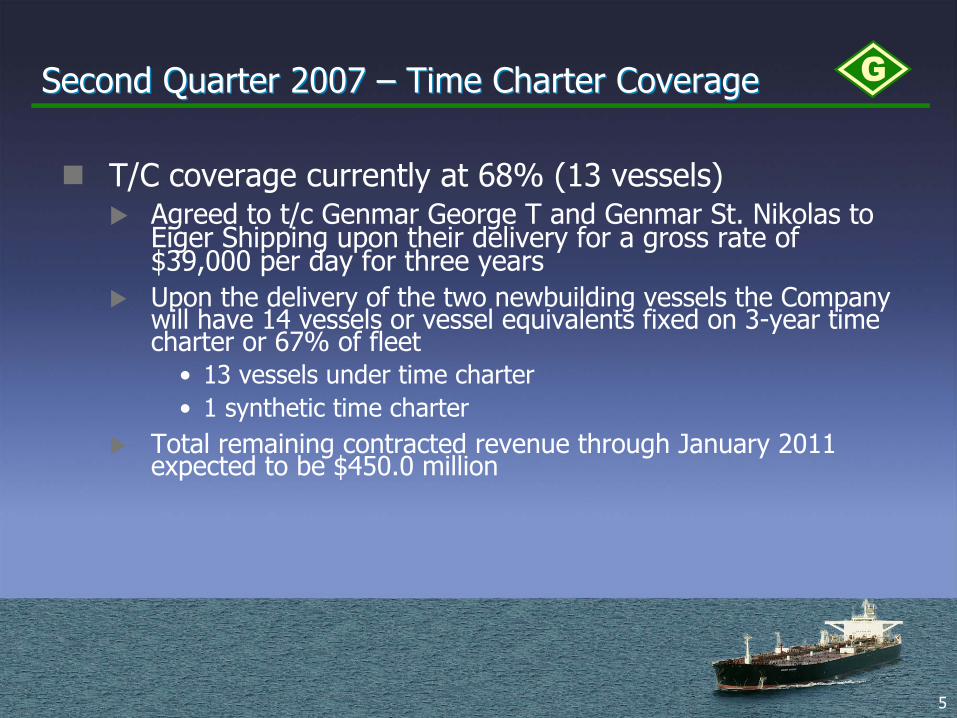
Second Quarter 2007 – Time Charter CoverageSecond Quarter 2007 – Time Charter Coverage
T/C coverage currently at 68% (13 vessels)Agreed to t/c Genmar George T and Genmar St. Nikolas to Eiger Shipping upon their delivery for a gross rate of $39,000 per day for three yearsUpon the delivery of the two newbuilding vessels the Company will have 14 vessels or vessel equivalents fixed on 3-year time charter or 67% of fleet
• 13 vessels under time charter• 1 synthetic time charter
Total remaining contracted revenue through January 2011 expected to be $450.0 million

6
Second Quarter 2007 – Time Charter CoverageSecond Quarter 2007 – Time Charter Coverage
12
36
36 + 2
36
36
36
36
36 + 2
36
36
36 + 2
36
12
36 + 236
GENMAR AGAMEMNON / Skaugen (tcp 03 Nov 2006) 6/19/2007 11/10/2007 $34,000
PERIOD of T/C (Months)
12/1/2006 12/1/2009 $34,000
$39,000
GENMAR ST.NIKOLAS / Eiger (tcp 30 May 2007) 2/15/2008 2/15/2011 $39,000
GENMAR PHOENIX / Eiger (tcp 19 Oct 2006)
GENMAR PRINCESS / Eiger (tcp 03 Oct 2006)
GENMAR PROGRESS / TTMI (tcp 26 July 2006)
GENMAR SPYRIDON / Eiger (tcp 03 Oct 2006) 10/13/2006
GMM Vessel's on Time Charter (T/C)Redelivery
Date
8/13/2009
1/6/2010
Delivery Date
8/15/2010
GENMAR DEFIANCE / Westport (tcp 24 Oct 2006)
12/13/2009
10/24/2009
8/15/2006
6/1/2010
11/1/2006
12/25/2006
11/23/2006
8/13/2006
3/27/2007GENMAR ORION / Eiger (tcp 02 Mar 2007)
GENMAR AJAX / AET (tcp 01 Dec 2006)
GENMAR KARA G / Eiger (tcp 02 Mar 2007)
GENMAR HOPE / Westport (tcp 20 June 2006)
GENMAR HORN / Eiger (tcp 03 Oct 2006)
GENMAR ARGUS / Eiger (tcp 04 Oct 2006)
GENMAR HARRIET G / Eiger (tcp 02 Mar 2007)
GENMAR GEORGE T / Eiger (tcp 30 May 2007)
$38,500
$27,750
TC Rate
$38,500
$36,500
$28,000
$38,000
11/1/2009 $38,500
8/15/2007
10/24/2006
4/9/2007 6/1/2010 $38,000
12/25/2009
$38,5001/23/2010
4/2/2007 6/1/2010 $38,000
$29,500
11/6/2006
8/15/2007
7
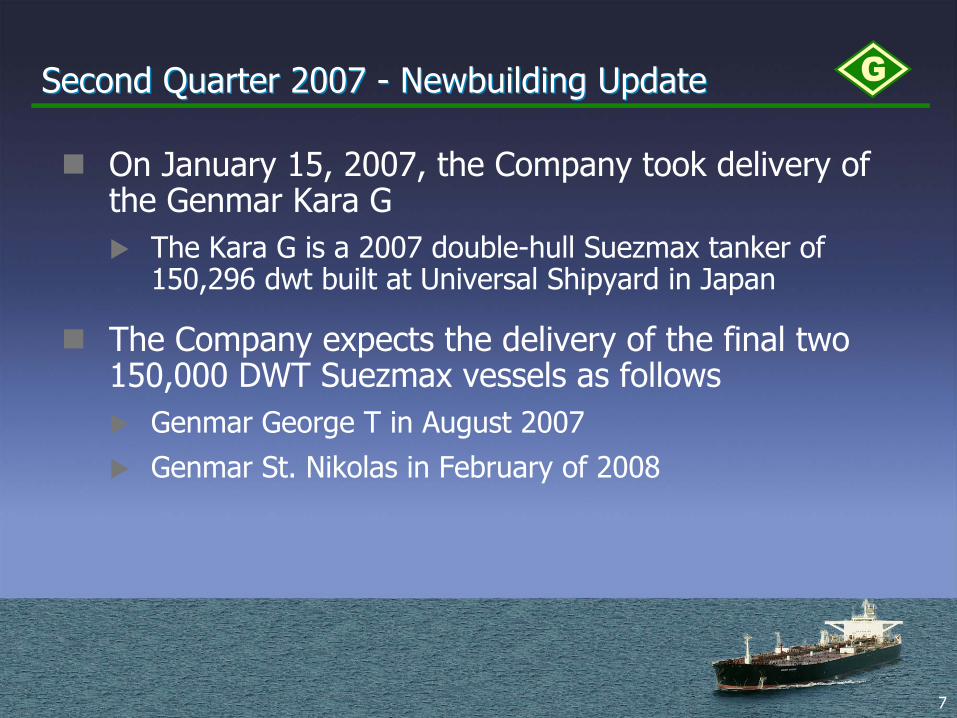
Second Quarter 2007 - Newbuilding UpdateSecond Quarter 2007 - Newbuilding Update
On January 15, 2007, the Company took delivery of the Genmar Kara G
The Kara G is a 2007 double-hull Suezmax tanker of 150,296 dwt built at Universal Shipyard in Japan
The Company expects the delivery of the final two 150,000 DWT Suezmax vessels as follows
Genmar George T in August 2007Genmar St. Nikolas in February of 2008
8
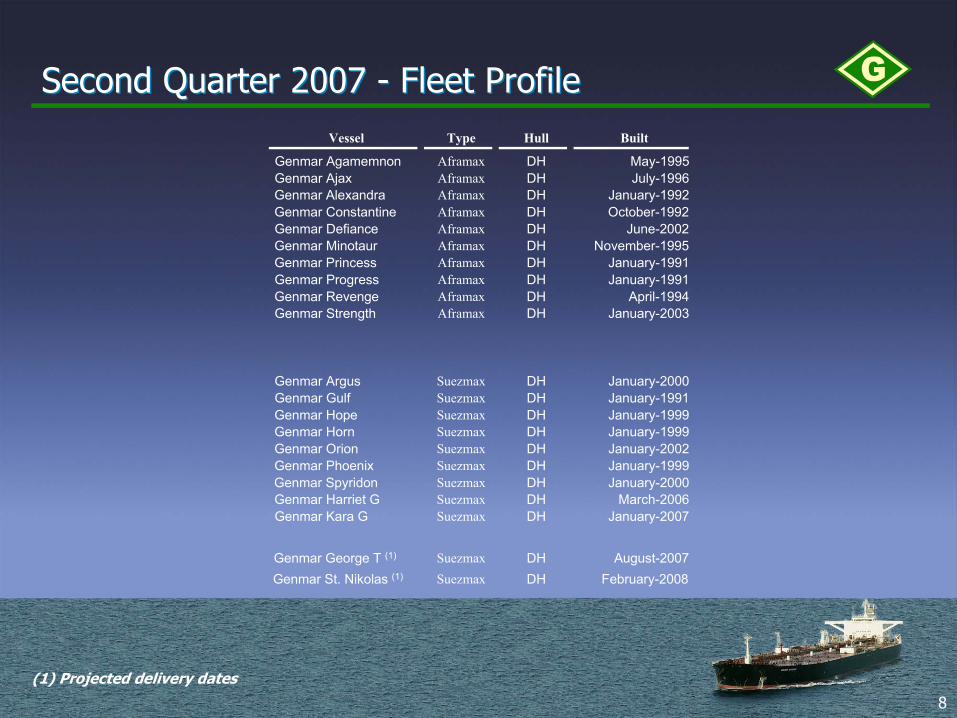
Second Quarter 2007 - Fleet ProfileSecond Quarter 2007 - Fleet Profile
(1) Projected delivery dates
Vessel Type Hull Built
Genmar Agamemnon Aframax DH May-1995Genmar Ajax Aframax DH July-1996Genmar Alexandra Aframax DH January-1992Genmar Constantine Aframax DH October-1992Genmar Defiance Aframax DH June-2002Genmar Minotaur Aframax DH November-1995Genmar Princess Aframax DH January-1991Genmar Progress Aframax DH January-1991Genmar Revenge Aframax DH April-1994Genmar Strength Aframax DH January-2003
Genmar Argus Suezmax DH January-2000Genmar Gulf Suezmax DH January-1991Genmar Hope Suezmax DH January-1999Genmar Horn Suezmax DH January-1999Genmar Orion Suezmax DH January-2002Genmar Phoenix Suezmax DH January-1999Genmar Spyridon Suezmax DH January-2000Genmar Harriet G Suezmax DH March-2006Genmar Kara G Suezmax DH January-2007
Genmar George T (1) Suezmax DH August-2007Genmar St. Nikolas (1) Suezmax DH February-2008

9
AgendaAgenda
Second Quarter 2007 HighlightsFinancial Review Company Outlook & Industry OverviewQuestions
10
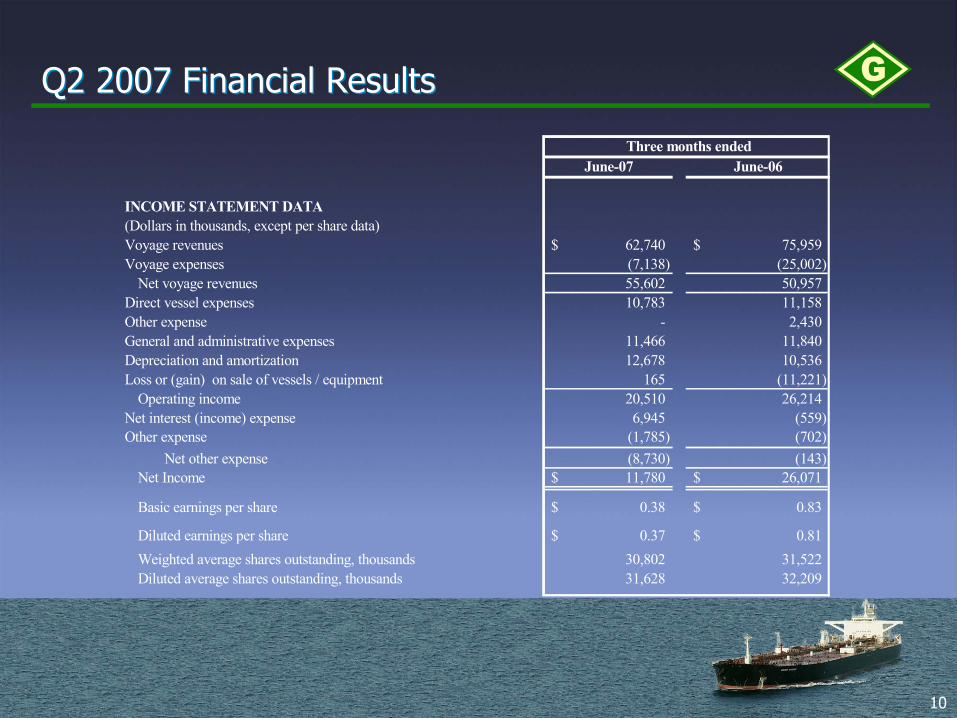
Q2 2007 Financial ResultsQ2 2007 Financial Results
June-07 June-06
INCOME STATEMENT DATA(Dollars in thousands, except per share data)Voyage revenues 62,740$ 75,959$ Voyage expenses (7,138) (25,002)
Net voyage revenues 55,602 50,957 Direct vessel expenses 10,783 11,158 Other expense - 2,430 General and administrative expenses 11,466 11,840 Depreciation and amortization 12,678 10,536 Loss or (gain) on sale of vessels / equipment 165 (11,221)
Operating income 20,510 26,214 Net interest (income) expense 6,945 (559) Other expense (1,785) (702)
Net other expense (8,730) (143) Net Income 11,780$ 26,071$
Basic earnings per share 0.38$ 0.83$
Diluted earnings per share 0.37$ 0.81$ Weighted average shares outstanding, thousands 30,802 31,522 Diluted average shares outstanding, thousands 31,628 32,209
Three months ended
11
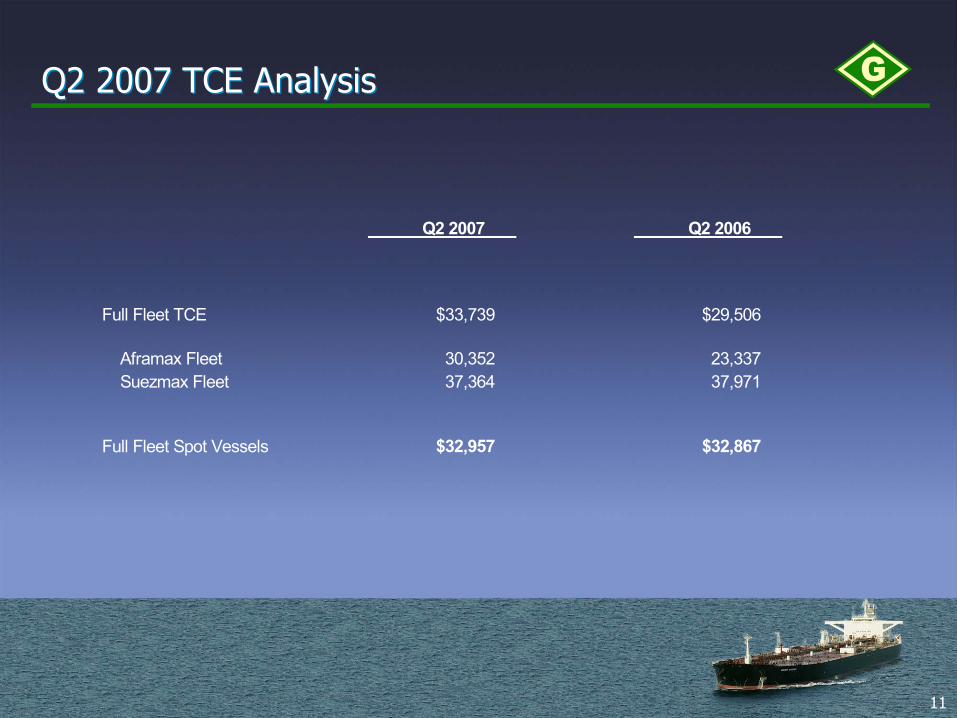
Q2 2007 TCE AnalysisQ2 2007 TCE Analysis
Q2 2007 Q2 2006
Full Fleet TCE $33,739 $29,506
Aframax Fleet 30,352 23,337 Suezmax Fleet 37,364 37,971
Full Fleet Spot Vessels $32,957 $32,867
12
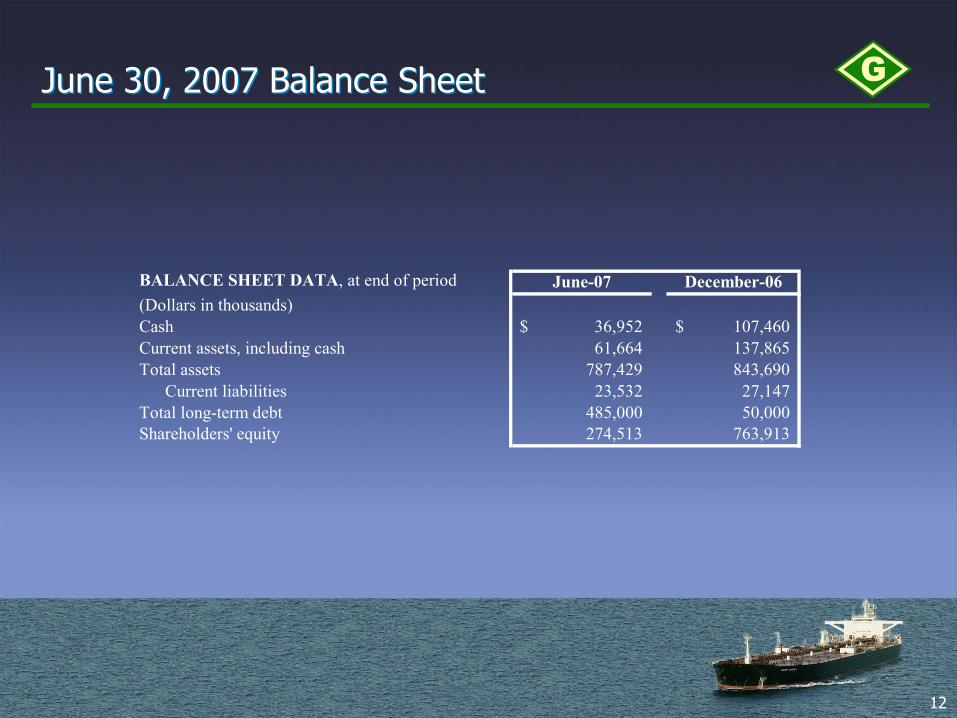
June 30, 2007 Balance SheetJune 30, 2007 Balance Sheet
BALANCE SHEET DATA, at end of period June-07 December-06(Dollars in thousands)Cash 36,952$ 107,460$ Current assets, including cash 61,664 137,865 Total assets 787,429 843,690
Current liabilities 23,532 27,147 Total long-term debt 485,000 50,000 Shareholders' equity 274,513 763,913
13
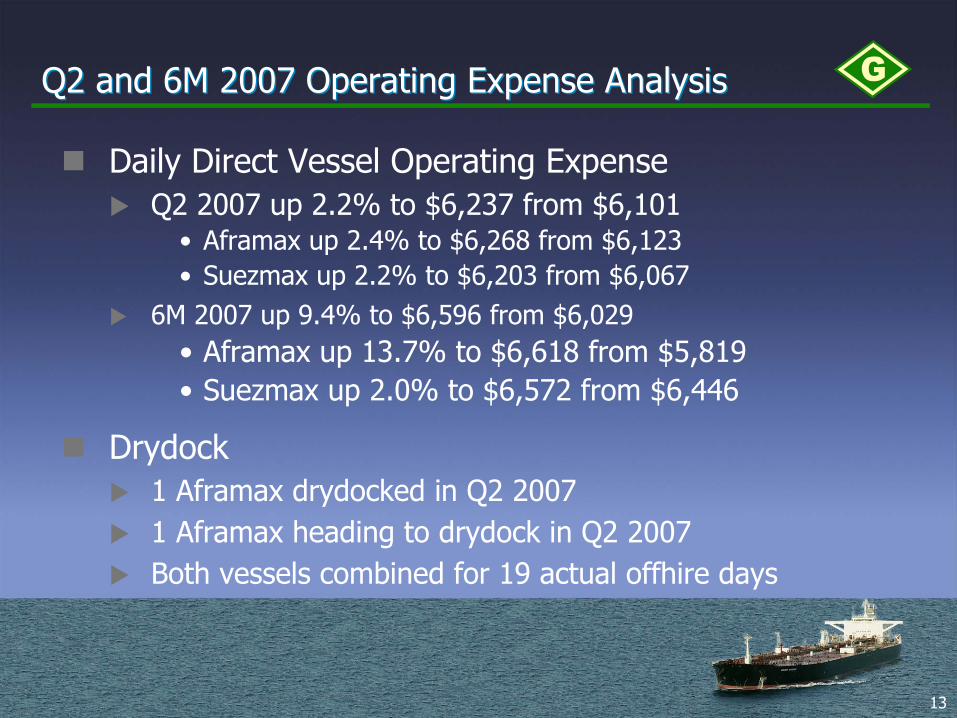
Q2 and 6M 2007 Operating Expense AnalysisQ2 and 6M 2007 Operating Expense Analysis
Daily Direct Vessel Operating ExpenseQ2 2007 up 2.2% to $6,237 from $6,101
• Aframax up 2.4% to $6,268 from $6,123• Suezmax up 2.2% to $6,203 from $6,067
6M 2007 up 9.4% to $6,596 from $6,029• Aframax up 13.7% to $6,618 from $5,819• Suezmax up 2.0% to $6,572 from $6,446
Drydock1 Aframax drydocked in Q2 20071 Aframax heading to drydock in Q2 2007Both vessels combined for 19 actual offhire days
14
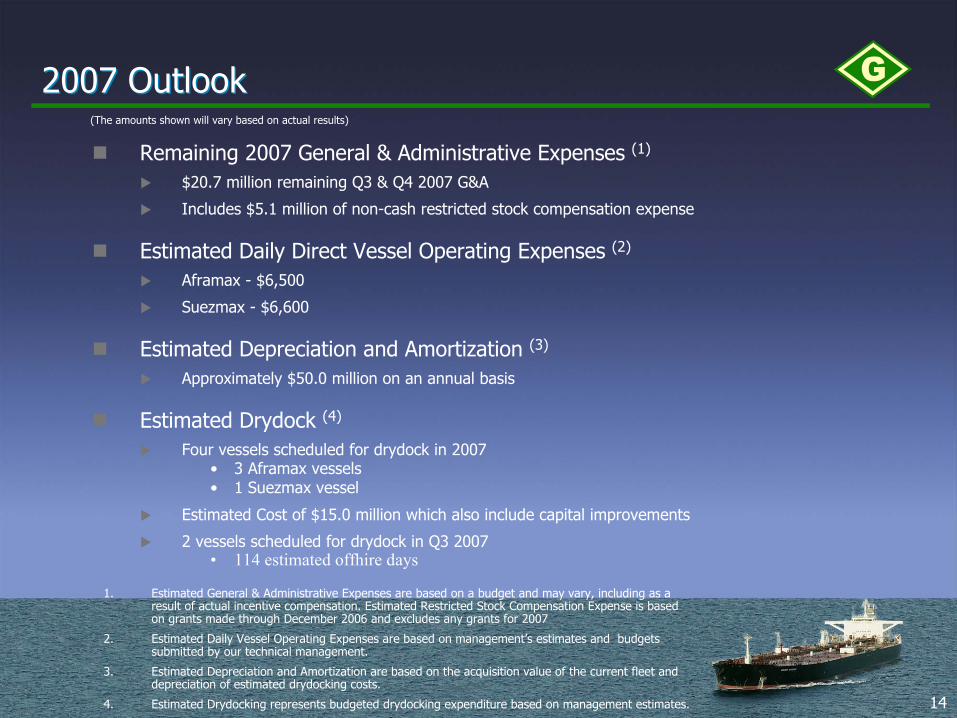
2007 Outlook2007 Outlook
Remaining 2007 General & Administrative Expenses (1)
$20.7 million remaining Q3 & Q4 2007 G&A
Includes $5.1 million of non-cash restricted stock compensation expense
Estimated Daily Direct Vessel Operating Expenses (2)
Aframax - $6,500
Suezmax - $6,600
Estimated Depreciation and Amortization (3)
Approximately $50.0 million on an annual basis
Estimated Drydock (4)
Four vessels scheduled for drydock in 2007• 3 Aframax vessels • 1 Suezmax vessel
Estimated Cost of $15.0 million which also include capital improvements
2 vessels scheduled for drydock in Q3 2007• 114 estimated offhire days
(The amounts shown will vary based on actual results)
1. Estimated General & Administrative Expenses are based on a budget and may vary, including as a result of actual incentive compensation. Estimated Restricted Stock Compensation Expense is based on grants made through December 2006 and excludes any grants for 2007
2. Estimated Daily Vessel Operating Expenses are based on management’s estimates and budgets submitted by our technical management.
3. Estimated Depreciation and Amortization are based on the acquisition value of the current fleet and depreciation of estimated drydocking costs.
4. Estimated Drydocking represents budgeted drydocking expenditure based on management estimates.
15
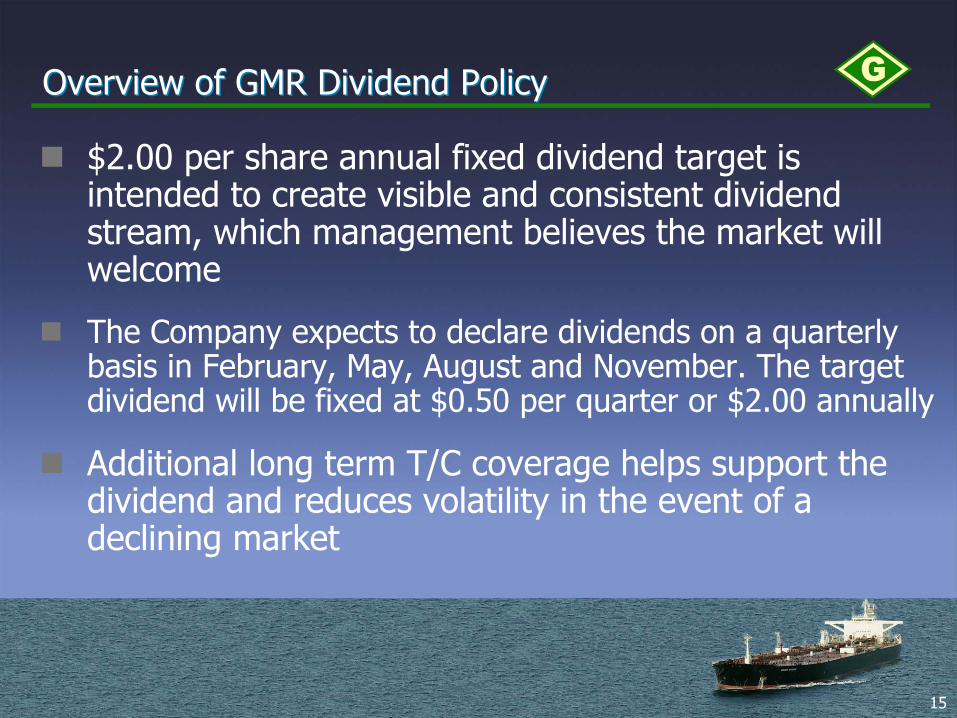
Overview of GMR Dividend Policy Overview of GMR Dividend Policy
$2.00 per share annual fixed dividend target is intended to create visible and consistent dividend stream, which management believes the market will welcome
The Company expects to declare dividends on a quarterly basis in February, May, August and November. The target dividend will be fixed at $0.50 per quarter or $2.00 annually
Additional long term T/C coverage helps support the dividend and reduces volatility in the event of a declining market
16
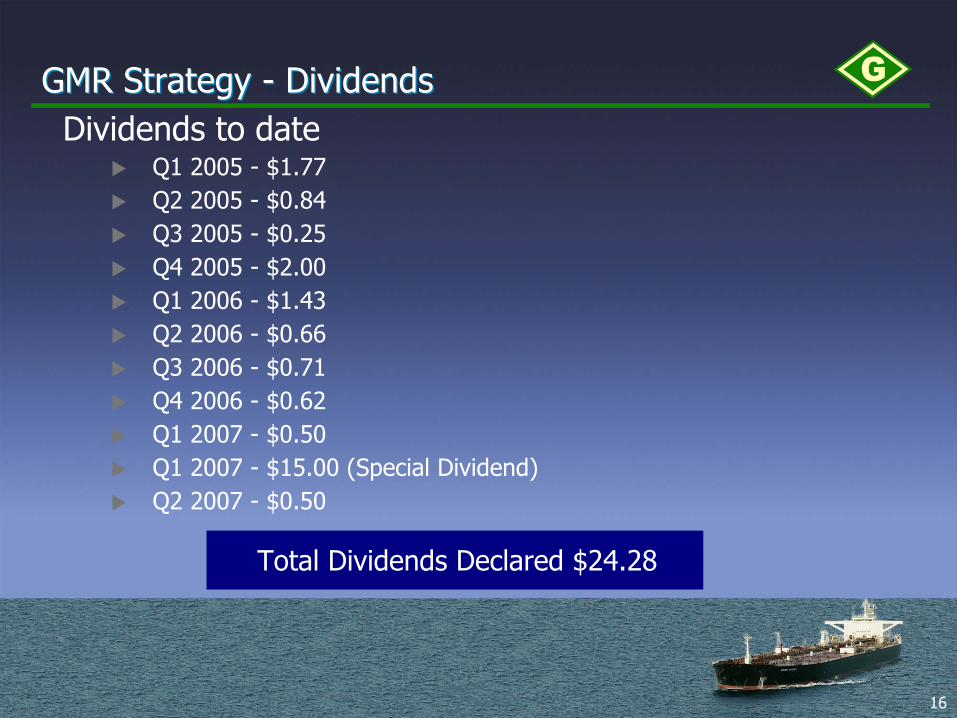
GMR Strategy - DividendsGMR Strategy - DividendsDividends to date
Q1 2005 - $1.77Q2 2005 - $0.84Q3 2005 - $0.25Q4 2005 - $2.00Q1 2006 - $1.43Q2 2006 - $0.66Q3 2006 - $0.71Q4 2006 - $0.62Q1 2007 - $0.50Q1 2007 - $15.00 (Special Dividend)Q2 2007 - $0.50
Total Dividends Declared $24.28

17
2008E Breakeven Summary2008E Breakeven Summary
1. Free Cash flow is defined as net income plus depreciation less capital expenditures primarily vessel drydocks and other non cash items including restricted stock amortization
2. Direct Vessel Operating Expenses is based on management’s estimates and budgets submitted by our technical managers for the 2007 calendar year. We believe DVOE are best measured for comparative purposes over a 12-month period
3. Based on the 2007 calendar year budget and defined as total G&A less restricted stock amortization
4. Based on grants made through December 2006 and excludes any grants for 2007 5. Interest Expense is calculated based on Managements estimates of the average
total debt outstanding for the year times LIBOR plus 75 basis points over the relevant period net of income earned
6. Drydocking represents our total drydocking budget for 2008 including capital improvements as per our technical managers
7. Depreciation is based on the acquisition value of the current fleet and amortization of drydocking costs
8. Based on the Company’s current quarterly dividend target of $0.50 per share 9. Based on current time charters in effect and time charters expected to commence
in Q3 2007 and Q1 2008 10. Calculations are based on an average number of vessels. The amounts shown will
vary based on actual results for the year
F r e e C a s h F lo w A f t e r D iv id e n d ( 1 ) F r e e C a s h F lo w ( 1 ) N e t I n c o m e
D ir e c t V e s s e l O p e r a t i n g E x p e n s e s ( 2 ) 5 0 ,8 3 6 ,8 3 2$ 5 0 ,8 3 6 ,8 3 2$ 5 0 ,8 3 6 ,8 3 2$ C a s h G & A ( 3 ) 3 0 ,3 9 1 ,2 0 0 3 0 ,3 9 1 ,2 0 0 3 0 ,3 9 1 ,2 0 0 R e s t r i c t e d S to c k A m o r t i z a t io n ( 4 ) - - 7 ,7 0 2 ,4 4 9 N e t In te r e s t E x p e n s e ( 5 ) 2 9 ,7 2 7 ,8 0 0 2 9 ,7 2 7 ,8 0 0 2 9 ,7 2 7 ,8 0 0 D r y d o c k in g C o s t s In c u r r e d ( 6 ) 6 ,0 0 0 ,0 0 0 6 ,0 0 0 ,0 0 0 - D e p r e c i a t i o n & A m o r t i z a t i o n ( 7 ) - - 6 1 ,5 3 9 ,8 1 7 C a s h D iv id e n d s P a id ( 8 ) 6 5 ,8 0 1 ,3 5 6 - -
T o t a l 1 8 2 ,7 5 7 ,1 8 8$ 1 1 6 ,9 5 5 ,8 3 2$ 1 8 0 ,1 9 8 ,0 9 8$
C o n t r a c t e d T /C R e v e n u e s ( 9 ) ( 1 7 9 ,7 6 2 ,8 7 0 ) ( 1 7 9 ,7 6 2 ,8 7 0 ) ( 1 7 9 ,7 6 2 ,8 7 0 )
F u l l F le e t O p e r a t in g D a y s ( 1 0 ) 7 4 3 4 7 4 3 4 7 4 3 4S p o t F le e t O p e r a t in g D a y s ( 1 0 ) 2 3 2 4 2 3 2 4 2 3 2 4
F u l l F l e e t D a i ly B r e a k - E v e n 2 4 ,5 8 4$ 1 5 ,7 3 3$ 2 4 ,2 4 0$ S p o t F le e t D a i ly B r e a k - E v e n 1 ,2 8 8 - -
18
AgendaAgenda
Second Quarter 2007 HighlightsFinancial Review Company Outlook & Industry OverviewQuestions
19
Company OutlookCompany Outlook
With approximately $400 million in liquidity, the Company is well positioned for future opportunities
Will continue to seek the right acquisition opportunities
With an additional $155 million remaining for share repurchases, subject to our 2005 credit facility we will seek to act opportunistically when we believe our stock is undervalued
We intend to continue to return value to shareholders through dividends

20
Current Market ConditionsCurrent Market Conditions
For Q3 200743 % of available Aframax days booked at around $25,000 per day68% of available Suezmax days booked at around $25,000 per day
Current Market Rates (1)
Suezmax rates estimated to be $27,500 per dayAframax estimated to be $22,500 per day
(1) Based on industry sources and aggregated Company data from Chartering department
21
2007 Industry Outlook2007 Industry OutlookQ2 Market performance mixed
As anticipated the market was volatile but on balance similar overall to first half of 2006
• Negative factors included continued OPEC production cuts, refinery outages and relatively high inventory levels in the US and supply growth
• Positive factors included strong demand from China and US, ton-mile expansion, and floating storage in the US Gulf
Outlook for remainder of 2007Demand – IEA forecasting 1.8% increase 2007 v 2006 in oil demand
• Demand pick-up weighted to 2nd half• OPEC expected to increase production when it believes inventories have been
sufficiently drawn down• Most likely scenario is OPEC production increase and shipments begin in late
August or September
Supply – Gross delivery of 6-7% as expected potentially reduced by greater scrapping, conversions, and floating storageOverall we maintain our view of a tighter rate environment in late Q3 and in Q4 partially offset by a seasonally weak summer period.

22
AgendaAgenda
Second Quarter 2007 HighlightsFinancial Review Company Outlook & Industry OverviewQuestions


![[PPT]Slide 1 - Intertanko · Web viewScf Altai Cumhuriyet Searacer Seatriumph Voyager Voyager Maritime Co Ltd Astra Seagrace Scf Caucasus Genmar Orion Polar Resolution Seaprince Scf](https://img.pdfslide.us/doc/110x75/5b3616fe7f8b9a330e8decf6/pptslide-1-intertanko-web-viewscf-altai-cumhuriyet-searacer-seatriumph-voyager.jpg)