Embed Size (px)
Citation preview
Market insight
By George Laios Deputy CEO, Intermodal Group
Is this a bankers’ market?
Over the last 10 years, many of the traditional and top lending banks have made the decision to either downsize their portfolios or even exit shipping. According to Petrofin, Top 40 shipping banks’ lending has fallen since 2008 by 25%, whilst at the same time the world fleet has grown by 28%. On top of this, out of the banks that have decided to stay in the game, not all of them have the strength, the budget and the competitive terms to do so. As a result, the availability of financing for small-medium size companies has become a scarce, hence a luxury good. In other words, even when there is available financing for these companies, its cost is really prohibitive.
Apart from the banks’ endogenous and structural issues, their shipping de-partments also need to decide where to allocate their budget. In an era of growing LNG demand, numerous large shipping firms invest in the very capi-tal intensive LNG carriers. Most of the large banks are there to support their very good clients. However, this means that a big percentage of their budget (and resources in general) end up to the LNG carriers’ financing, i.e. not much budget left for the remaining sectors/shipping projects. So, when these banks are left with a limited budget to spend, they become very selec-tive and of course their pricing goes up as the list of the waiting finance pro-jects is significant.
But what about the alternative ways of financing for the small and medium size companies? Asian leasing has indeed filled part of the gap that was cre-ated with the traditional banks’ exit, however, again this is available for owners with larger fleets and bigger ticket sizes. Public markets have been quiet regarding shipping in general; bond markets again require significant size. Therefore, the small companies are left with the option of the so called alternative financing. Private equity and hedge funds do have the funds to invest, but this only happens when they get the return of capital that they require; given that this most of the times is a double digit figure, then the capital cost for the small/medium ship owners increases dramatically.
There are quite a few new European banks that have joined ship financing – whose pricing sits in between the one of the traditional banks and that of leasing – however, their current budget is nowhere near to filling the gap that was left after the departure of the big banks.
Therefore, small-medium size shipping companies struggle to find competi-tive finance terms. Someone may argue that this had always been the case, however, in today’s ship finance market it is evident that the financing of small-medium size shipping companies is not the banks’ first priority, which should not be the case given the performance of such companies during recent years. Indeed, many small-medium size companies have proved their top quality and professionalism by not only surviving the crisis but also by getting back into expansion mode. There are many ship-owning companies falling into this category. Indicatively, only in Greek shipping there are more than 150 companies that own 3-15 bulk carriers, of more than 28,000 dwt and younger than 17 years old. A big percentage of these companies are long standing and solid companies; however, face the above finance issues.
This is the clientele that will provide the bank with projects of good credit quality and at the right pricing and therefore should be the one attracting the attention of ship financiers if they wish to make their business efficient and dynamic again.
Chartering (Wet: Stable+ / Dry: Stable+)
The past week saw the BDI move another leg up on the back of substan-tial gains for the bigger sizes, while optimism still remains reserved given the fact that we are now well into the traditionally stronger second quarter of the year and no impressive upside has been achieved yet. The BDI today (23/04/2019) closed at 821 points, up by 31 points compared to Thursday’s (18/04/2019) levels and increased by 72 points when com-pared to previous Tuesday’s closing (16/04/2019). A small spike in de-mand ahead of the Easter holidays has given a much needed breather to the crude carriers market that ended the week with gains overall. The BDTI today (23/04/2019) closed at 643, increased by 1 point and the BCTI at 571, a decrease of 3 points compared to previous Tuesday’s (16/04/2019) levels.
Sale & Purchase (Wet: Stable+ / Dry: Firm+)
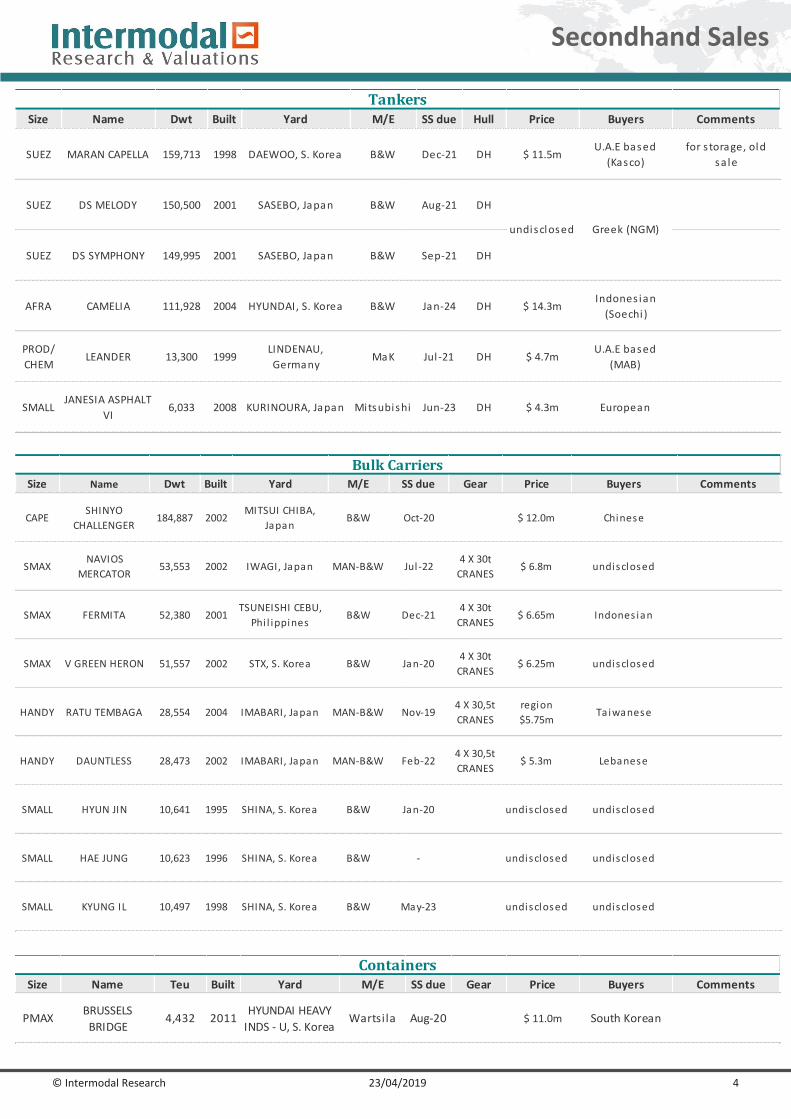
SnP activity remains healthy, with the majority of rumored deals con-cerning dry bulk vessels and with the majority of Buyers currently in-vesting in the sector focusing almost exclusively on Supramax and Handysize candidates. In the tanker sector we had the sale of the “MARAN CAPELLA” (159,713dwt-blt ‘98, S. Korea), which was sold to U.A.E based owner, Kasco, for a price in the region of $11.5m. On the dry bulker side sector we had the sale of the “SHINYO CHALLENGER” (184,887dwt-blt ‘02, Japan), which was sold to Chinese buyers, for a price in the region of $12.0m.
Newbuilding (Wet: Firm+ / Dry: Firm+)
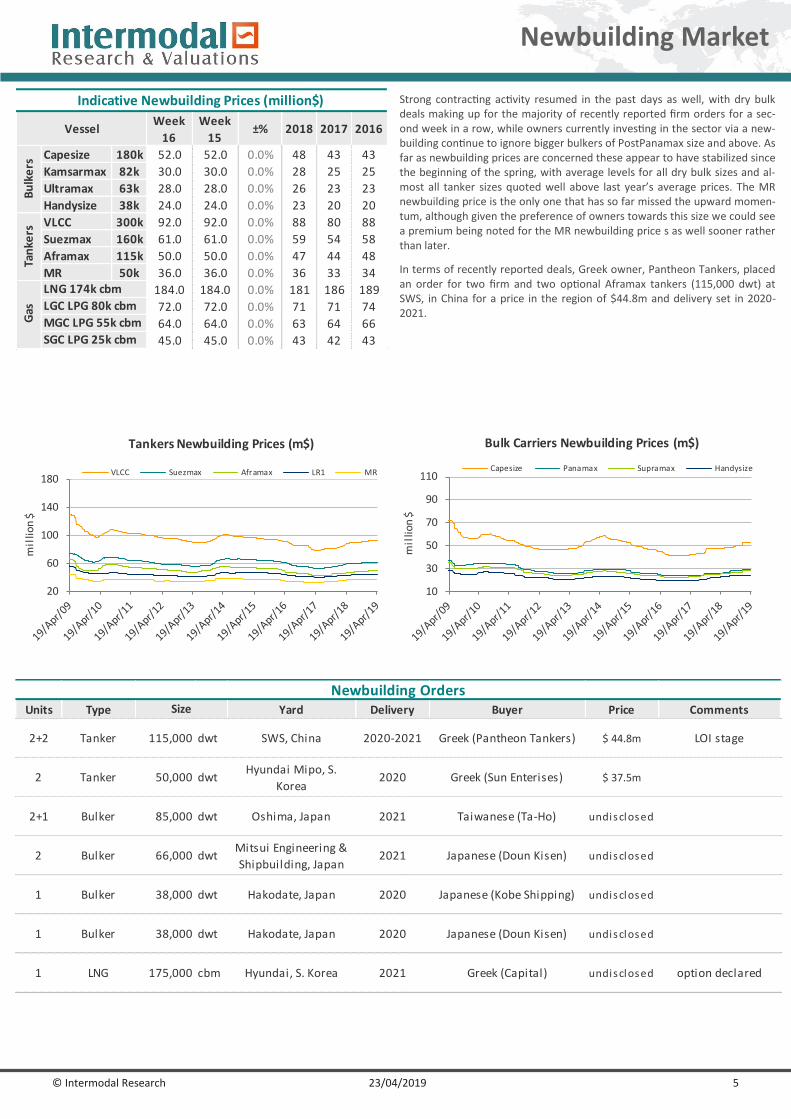
Strong contracting activity resumed in the past days as well, with dry bulk deals making up for the majority of recently reported firm orders for a second week in a row, while owners currently investing in the sec-tor via a newbuilding continue to ignore bigger bulkers of PostPanamax size and above. As far as newbuilding prices are concerned these appear to have stabilized since the beginning of the spring, with average levels for all dry bulk sizes and almost all tanker sizes quoted well above last year’s average prices. The MR newbuilding price is the only one that has so far missed the upward momentum, although given the preference of owners towards this size we could see a premium being noted for the MR newbuilding price s as well sooner rather than later. In terms of recently reported deals, Greek owner, Pantheon Tankers, placed an order for two firm and two optional Aframax tankers (115,000 dwt) at SWS, in China for a price in the region of $44.8m and delivery set in 2020-2021.
Demolition (Wet: Firm+/ Dry: Firm+)
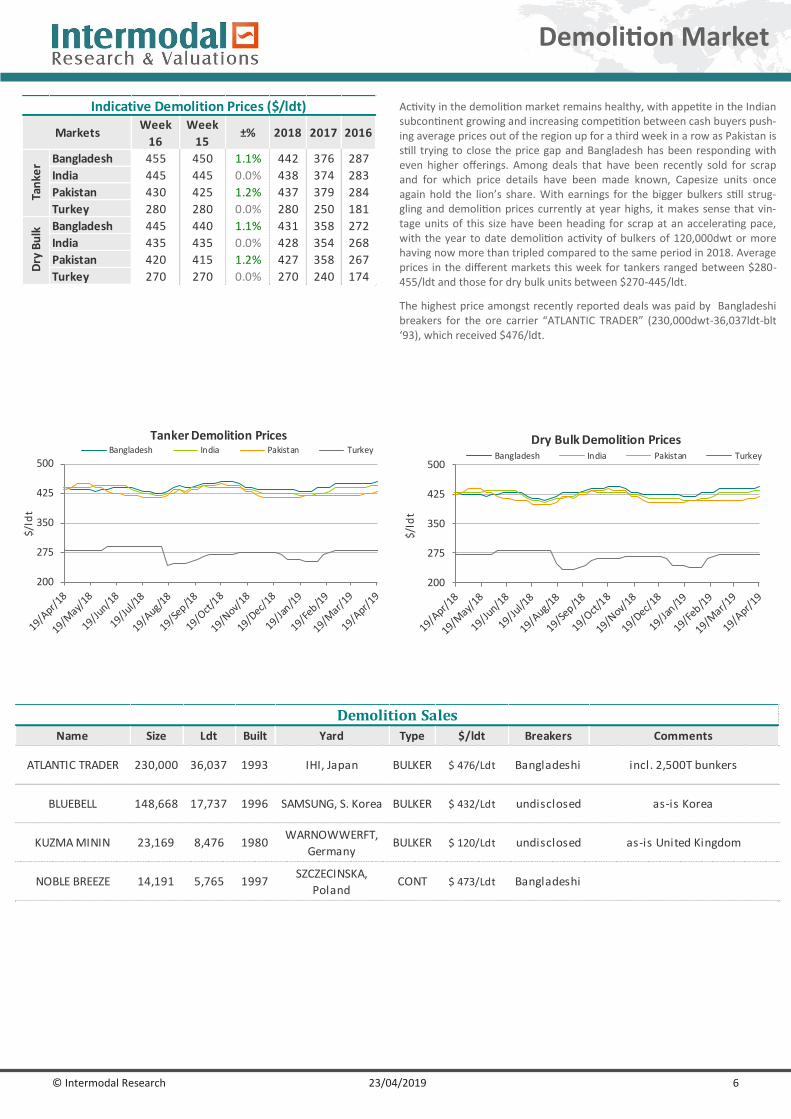
Activity in the demolition market remains healthy, with appetite in the Indian subcontinent growing and increasing competition between cash buyers pushing average prices out of the region up for a third week in a row as Pakistan is still trying to close the price gap and Bangladesh has been responding with even higher offerings. Among deals that have been recently sold for scrap and for which price details have been made known, Capesize units once again hold the lion’s share. With earnings for the bigger bulkers still struggling and demolition prices currently at year highs, it makes sense that vintage units of this size have been head-ing for scrap at an accelerating pace, with the year to date demolition activity of bulkers of 120,000dwt or more having now more than tripled compared to the same period in 2018. Average prices in the different markets this week for tankers ranged between $280-455/ldt and those for dry bulk units between $270-445/ldt.
Weekly Market Report
Issue: Week 17|Tuesday 23rd April 2019
© Intermodal Research 23/04/2019 2
2018 2017
WS
points$/day
WS
points$/day $/day $/day
265k MEG-JAPAN 39 17,759 36 12,922 37.4% 20,265 20,658
280k MEG-USG 21 - 20 - - 5,635 13,429
260k WAF-CHINA 46 17,797 43 15,119 17.7% 18,362 19,815
130k MED-MED 77 19,789 77 19,556 1.2% 20,320 17,617
130k WAF-USAC 68 18,715 65 16,866 11.0% 12,870 12,917
140k BSEA-MED 92 20,432 95 21,964 -7.0% 20,320 17,617
80k MEG-EAST 103 11,171 103 10,952 2.0% 12,563 11,560
80k MED-MED 78 4,221 78 3,847 9.7% 18,589 15,136
100k BALTIC/UKC 77 11,750 64 7,096 65.6% 14,943 15,424
70k CARIBS-USG 78 3,323 77 3,185 4.3% 19,039 14,479
75k MEG-JAPAN 93 10,542 95 10,803 -2.4% 11,119 10,082
55k MEG-JAPAN 90 6,908 93 6,580 5.0% 8,449 8,262
37K UKC-USAC 139 10,992 155 13,248 -17.0% 7,529 8,975
30K MED-MED 156 11,480 173 15,176 -24.4% 5,487 6,703
55K UKC-USG 103 9,122 104 9,252 -1.4% 9,527 10,421
55K MED-USG 103 9,127 104 9,213 -0.9% 9,059 9,613
50k CARIBS-USG 123 10,721 118 10,008 7.1% 10,637 10,544
Dir
tyA
fram
axC
lean
VLC
CSu
ezm
ax
Spot Rates
Vessel Routes
Week 16 Week 15$/day
±%
Apr-19
avg
Mar-19
avg±% 2018 2017 2016
300KT DH 65.0 68.2 -4.7% 64.2 62.0 68.9
150KT DH 48.3 47.4 2.0% 43.5 41.4 50.0
110KT DH 35.0 35.0 0.0% 31.8 30.4 37.0
75KT DH 32.0 32.0 0.0% 29.3 27.6 33.1
52KT DH 26.0 26.8 -3.0% 26.3 23.4 25.3
VLCC
Suezmax
Indicative Market Values ($ Million) - Tankers
Vessel 5yrs old
MR
Aframax
LR1
Chartering
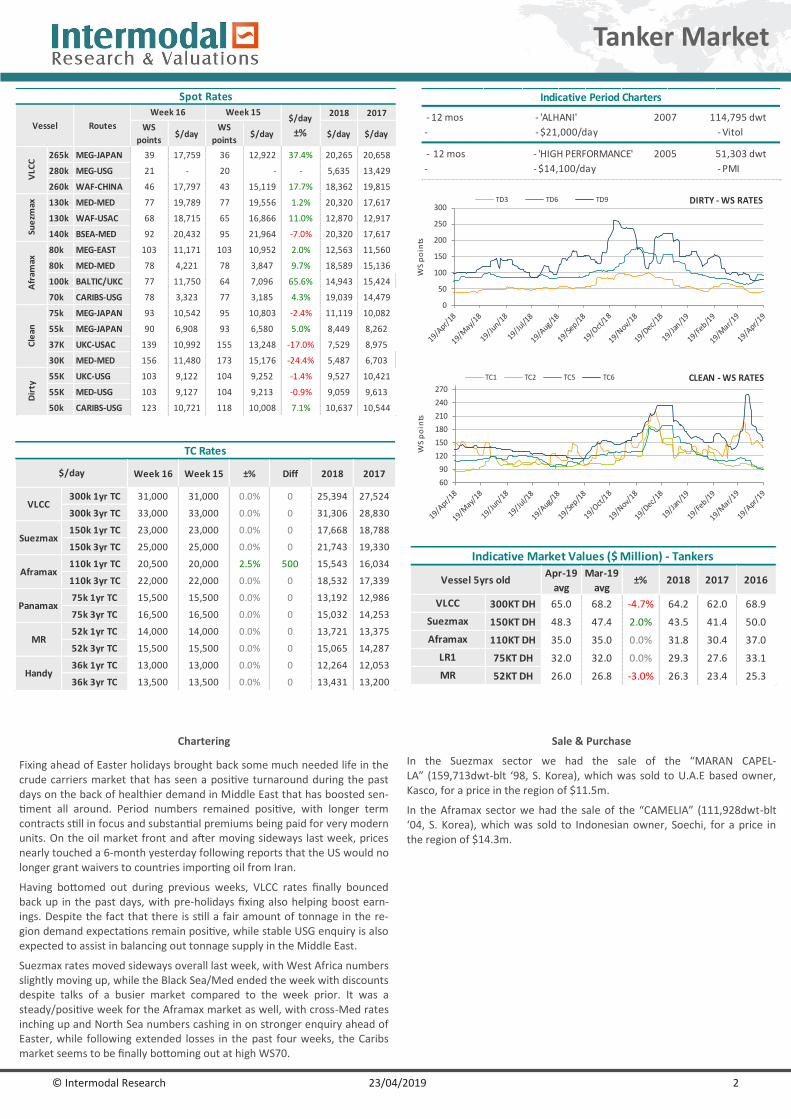
Fixing ahead of Easter holidays brought back some much needed life in the crude carriers market that has seen a positive turnaround during the past days on the back of healthier demand in Middle East that has boosted sen-timent all around. Period numbers remained positive, with longer term contracts still in focus and substantial premiums being paid for very modern units. On the oil market front and after moving sideways last week, prices nearly touched a 6-month yesterday following reports that the US would no longer grant waivers to countries importing oil from Iran.
Having bottomed out during previous weeks, VLCC rates finally bounced back up in the past days, with pre-holidays fixing also helping boost earn-ings. Despite the fact that there is still a fair amount of tonnage in the re-gion demand expectations remain positive, while stable USG enquiry is also expected to assist in balancing out tonnage supply in the Middle East.
Suezmax rates moved sideways overall last week, with West Africa numbers slightly moving up, while the Black Sea/Med ended the week with discounts despite talks of a busier market compared to the week prior. It was a steady/positive week for the Aframax market as well, with cross-Med rates inching up and North Sea numbers cashing in on stronger enquiry ahead of Easter, while following extended losses in the past four weeks, the Caribs market seems to be finally bottoming out at high WS70.
Sale & Purchase
In the Suezmax sector we had the sale of the “MARAN CAPEL-LA” (159,713dwt-blt ‘98, S. Korea), which was sold to U.A.E based owner, Kasco, for a price in the region of $11.5m.
In the Aframax sector we had the sale of the “CAMELIA” (111,928dwt-blt ‘04, S. Korea), which was sold to Indonesian owner, Soechi, for a price in the region of $14.3m.
Tanker Market
- 12 mos - 'HIGH PERFORMANCE' 2005 51,303 dwt
- - $14,100/day - PMI
Indicative Period Charters
- 12 mos - 'ALHANI' 2007 114,795 dwt
- - $21,000/day - Vitol
0
50
100
150
200
250
300
WS
po
ints
DIRTY - WS RATESTD3 TD6 TD9
Week 16 Week 15 ±% Diff 2018 2017
300k 1yr TC 31,000 31,000 0.0% 0 25,394 27,524
300k 3yr TC 33,000 33,000 0.0% 0 31,306 28,830
150k 1yr TC 23,000 23,000 0.0% 0 17,668 18,788
150k 3yr TC 25,000 25,000 0.0% 0 21,743 19,330
110k 1yr TC 20,500 20,000 2.5% 500 15,543 16,034
110k 3yr TC 22,000 22,000 0.0% 0 18,532 17,339
75k 1yr TC 15,500 15,500 0.0% 0 13,192 12,986
75k 3yr TC 16,500 16,500 0.0% 0 15,032 14,253
52k 1yr TC 14,000 14,000 0.0% 0 13,721 13,375
52k 3yr TC 15,500 15,500 0.0% 0 15,065 14,287
36k 1yr TC 13,000 13,000 0.0% 0 12,264 12,053
36k 3yr TC 13,500 13,500 0.0% 0 13,431 13,200
Panamax
MR
Handy
TC Rates
$/day
VLCC
Suezmax
Aframax
60
90
120
150
180
210
240
270
WS
po
ints
CLEAN - WS RATESTC1 TC2 TC5 TC6
© Intermodal Research 23/04/2019 3
Chartering
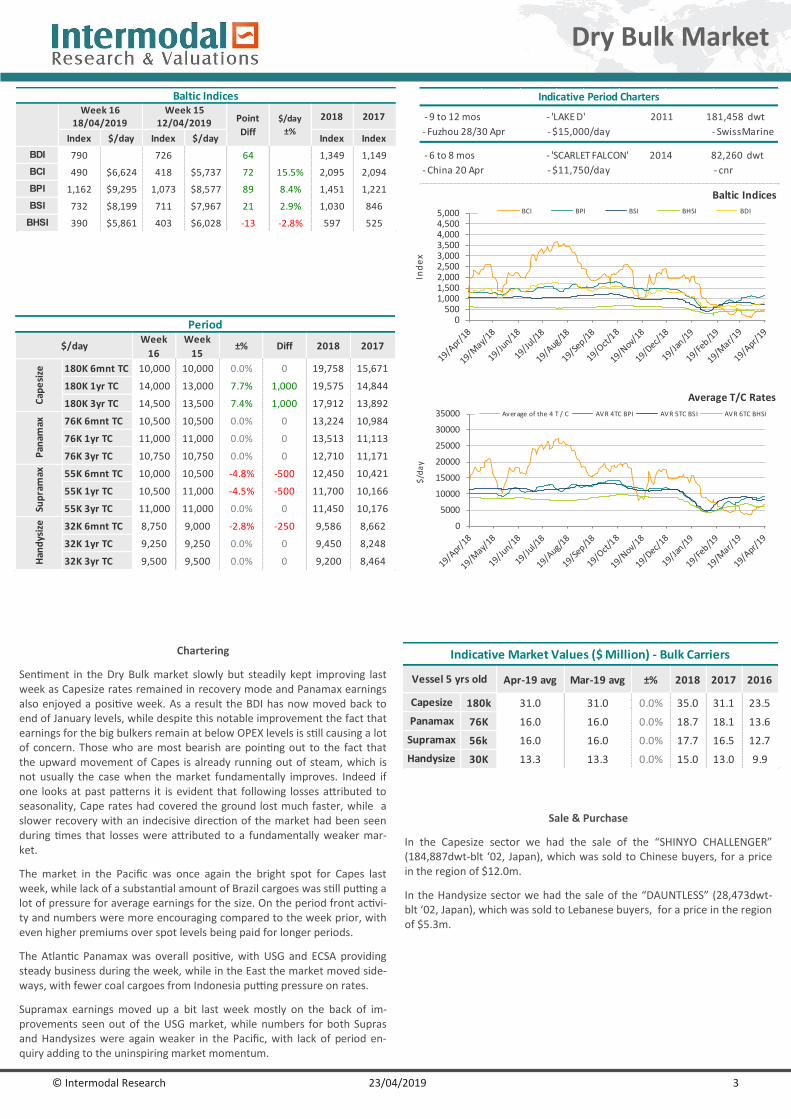
Sentiment in the Dry Bulk market slowly but steadily kept improving last week as Capesize rates remained in recovery mode and Panamax earnings also enjoyed a positive week. As a result the BDI has now moved back to end of January levels, while despite this notable improvement the fact that earnings for the big bulkers remain at below OPEX levels is still causing a lot of concern. Those who are most bearish are pointing out to the fact that the upward movement of Capes is already running out of steam, which is not usually the case when the market fundamentally improves. Indeed if one looks at past patterns it is evident that following losses attributed to seasonality, Cape rates had covered the ground lost much faster, while a slower recovery with an indecisive direction of the market had been seen during times that losses were attributed to a fundamentally weaker mar-ket.
The market in the Pacific was once again the bright spot for Capes last week, while lack of a substantial amount of Brazil cargoes was still putting a lot of pressure for average earnings for the size. On the period front activi-ty and numbers were more encouraging compared to the week prior, with even higher premiums over spot levels being paid for longer periods.
The Atlantic Panamax was overall positive, with USG and ECSA providing steady business during the week, while in the East the market moved side-ways, with fewer coal cargoes from Indonesia putting pressure on rates.
Supramax earnings moved up a bit last week mostly on the back of im-provements seen out of the USG market, while numbers for both Supras and Handysizes were again weaker in the Pacific, with lack of period en-quiry adding to the uninspiring market momentum.
Sale & Purchase
In the Capesize sector we had the sale of the “SHINYO CHALLENGER” (184,887dwt-blt ‘02, Japan), which was sold to Chinese buyers, for a price in the region of $12.0m.
In the Handysize sector we had the sale of the “DAUNTLESS” (28,473dwt-blt ‘02, Japan), which was sold to Lebanese buyers, for a price in the region of $5.3m.
0500
1,0001,5002,0002,5003,0003,5004,0004,5005,000
Ind
ex
Baltic Indices
BCI BPI BSI BHSI BDI
0
5000
10000
15000
20000
25000
30000
35000$
/da
y
Average T/C Rates
Average of the 4 T / C AVR 4TC BPI AVR 5TC BSI AVR 6TC BHSI
Apr-19 avg Mar-19 avg ±% 2018 2017 2016
180k 31.0 31.0 0.0% 35.0 31.1 23.5
76K 16.0 16.0 0.0% 18.7 18.1 13.6
56k 16.0 16.0 0.0% 17.7 16.5 12.7
30K 13.3 13.3 0.0% 15.0 13.0 9.9
Capesize
Panamax
Supramax
Indicative Market Values ($ Million) - Bulk Carriers
Vessel 5 yrs old
Handysize
Indicative Period Charters
- 9 to 12 mos - 'LAKE D' 2011 181,458 dwt
- Fuzhou 28/30 Apr - $15,000/day - SwissMarine
- 6 to 8 mos - 'SCARLET FALCON' 2014 82,260 dwt
- China 20 Apr - $11,750/day - cnr
Dry Bulk Market
Index $/day Index $/day Index Index
BDI 790 726 64 1,349 1,149
BCI 490 $6,624 418 $5,737 72 15.5% 2,095 2,094
BPI 1,162 $9,295 1,073 $8,577 89 8.4% 1,451 1,221
BSI 732 $8,199 711 $7,967 21 2.9% 1,030 846
BHSI 390 $5,861 403 $6,028 -13 -2.8% 597 525
12/04/2019
Baltic IndicesWeek 16
18/04/2019Week 15
Point
Diff
2018 2017$/day
±%
180K 6mnt TC 10,000 10,000 0.0% 0 19,758 15,671
180K 1yr TC 14,000 13,000 7.7% 1,000 19,575 14,844
180K 3yr TC 14,500 13,500 7.4% 1,000 17,912 13,892
76K 6mnt TC 10,500 10,500 0.0% 0 13,224 10,984
76K 1yr TC 11,000 11,000 0.0% 0 13,513 11,113
76K 3yr TC 10,750 10,750 0.0% 0 12,710 11,171
55K 6mnt TC 10,000 10,500 -4.8% -500 12,450 10,421
55K 1yr TC 10,500 11,000 -4.5% -500 11,700 10,166
55K 3yr TC 11,000 11,000 0.0% 0 11,450 10,176
32K 6mnt TC 8,750 9,000 -2.8% -250 9,586 8,662
32K 1yr TC 9,250 9,250 0.0% 0 9,450 8,248
32K 3yr TC 9,500 9,500 0.0% 0 9,200 8,464Han
dys
ize
Period
2017
Pan
amax
Sup
ram
ax
Week
16
Week
15
Cap
esi
ze
2018$/day ±% Diff
© Intermodal Research 23/04/2019 4
Secondhand Sales
Size Name Dwt Built Yard M/E SS due Hull Price Buyers Comments
SUEZ MARAN CAPELLA 159,713 1998 DAEWOO, S. Korea B&W Dec-21 DH $ 11.5mU.A.E based
(Kasco)
for s torage, old
sa le
SUEZ DS MELODY 150,500 2001 SASEBO, Japan B&W Aug-21 DH
SUEZ DS SYMPHONY 149,995 2001 SASEBO, Japan B&W Sep-21 DH
AFRA CAMELIA 111,928 2004 HYUNDAI, S. Korea B&W Jan-24 DH $ 14.3mIndones ian
(Soechi )
PROD/
CHEMLEANDER 13,300 1999
LINDENAU,
GermanyMaK Jul -21 DH $ 4.7m
U.A.E based
(MAB)
SMALLJANESIA ASPHALT
VI6,033 2008 KURINOURA, Japan Mitsubishi Jun-23 DH $ 4.3m European
Tankers
Greek (NGM)undisclosed
Size Name Dwt Built Yard M/E SS due Gear Price Buyers Comments
CAPESHINYO
CHALLENGER184,887 2002
MITSUI CHIBA,
JapanB&W Oct-20 $ 12.0m Chinese
SMAXNAVIOS
MERCATOR53,553 2002 IWAGI, Japan MAN-B&W Jul-22
4 X 30t
CRANES$ 6.8m undisclosed
SMAX FERMITA 52,380 2001TSUNEISHI CEBU,
Phi l ippinesB&W Dec-21
4 X 30t
CRANES$ 6.65m Indones ian
SMAX V GREEN HERON 51,557 2002 STX, S. Korea B&W Jan-204 X 30t
CRANES$ 6.25m undisclosed
HANDY RATU TEMBAGA 28,554 2004 IMABARI, Japan MAN-B&W Nov-194 X 30,5t
CRANES
region
$5.75mTaiwanese
HANDY DAUNTLESS 28,473 2002 IMABARI, Japan MAN-B&W Feb-224 X 30,5t
CRANES$ 5.3m Lebanese
SMALL HYUN JIN 10,641 1995 SHINA, S. Korea B&W Jan-20 undisclosed undisclosed
SMALL HAE JUNG 10,623 1996 SHINA, S. Korea B&W - undisclosed undisclosed
SMALL KYUNG IL 10,497 1998 SHINA, S. Korea B&W May-23 undisclosed undisclosed
Bulk Carriers
Size Name Teu Built Yard M/E SS due Gear Price Buyers Comments
PMAXBRUSSELS
BRIDGE4,432 2011
HYUNDAI HEAVY
INDS - U, S. KoreaWartsila Aug-20 $ 11.0m South Korean
Containers
© Intermodal Research 23/04/2019 5
Strong contracting activity resumed in the past days as well, with dry bulk deals making up for the majority of recently reported firm orders for a sec-ond week in a row, while owners currently investing in the sector via a new-building continue to ignore bigger bulkers of PostPanamax size and above. As far as newbuilding prices are concerned these appear to have stabilized since the beginning of the spring, with average levels for all dry bulk sizes and al-most all tanker sizes quoted well above last year’s average prices. The MR newbuilding price is the only one that has so far missed the upward momen-tum, although given the preference of owners towards this size we could see a premium being noted for the MR newbuilding price s as well sooner rather than later.
In terms of recently reported deals, Greek owner, Pantheon Tankers, placed an order for two firm and two optional Aframax tankers (115,000 dwt) at SWS, in China for a price in the region of $44.8m and delivery set in 2020-2021.
Newbuilding Market
20
60
100
140
180
mil
lion
$
Tankers Newbuilding Prices (m$)
VLCC Suezmax Aframax LR1 MR
10
30
50
70
90
110
mil
lion
$
Bulk Carriers Newbuilding Prices (m$)
Capesize Panamax Supramax Handysize
Week
16
Week
15±% 2018 2017 2016
Capesize 180k 52.0 52.0 0.0% 48 43 43
Kamsarmax 82k 30.0 30.0 0.0% 28 25 25
Ultramax 63k 28.0 28.0 0.0% 26 23 23
Handysize 38k 24.0 24.0 0.0% 23 20 20
VLCC 300k 92.0 92.0 0.0% 88 80 88
Suezmax 160k 61.0 61.0 0.0% 59 54 58
Aframax 115k 50.0 50.0 0.0% 47 44 48
MR 50k 36.0 36.0 0.0% 36 33 34
184.0 184.0 0.0% 181 186 189
72.0 72.0 0.0% 71 71 74
64.0 64.0 0.0% 63 64 66
45.0 45.0 0.0% 43 42 43
LNG 174k cbm
LGC LPG 80k cbm
MGC LPG 55k cbm
SGC LPG 25k cbm
Gas
Bu
lke
rsTa
nke
rs
Vessel
Indicative Newbuilding Prices (million$)
Units Type Yard Delivery Buyer Price Comments
2+2 Tanker 115,000 dwt SWS, China 2020-2021 Greek (Pantheon Tankers) $ 44.8m LOI stage
2 Tanker 50,000 dwtHyundai Mipo, S.
Korea2020 Greek (Sun Enterises) $ 37.5m
2+1 Bulker 85,000 dwt Oshima, Japan 2021 Taiwanese (Ta-Ho) undisclosed
2 Bulker 66,000 dwtMitsui Engineering &
Shipbuilding, Japan2021 Japanese (Doun Kisen) undisclosed
1 Bulker 38,000 dwt Hakodate, Japan 2020 Japanese (Kobe Shipping) undisclosed
1 Bulker 38,000 dwt Hakodate, Japan 2020 Japanese (Doun Kisen) undisclosed
1 LNG 175,000 cbm Hyundai, S. Korea 2021 Greek (Capital) undisclosed option declared
Newbuilding OrdersSize
© Intermodal Research 23/04/2019 6
Activity in the demolition market remains healthy, with appetite in the Indian subcontinent growing and increasing competition between cash buyers push-ing average prices out of the region up for a third week in a row as Pakistan is still trying to close the price gap and Bangladesh has been responding with even higher offerings. Among deals that have been recently sold for scrap and for which price details have been made known, Capesize units once again hold the lion’s share. With earnings for the bigger bulkers still strug-gling and demolition prices currently at year highs, it makes sense that vin-tage units of this size have been heading for scrap at an accelerating pace, with the year to date demolition activity of bulkers of 120,000dwt or more having now more than tripled compared to the same period in 2018. Average prices in the different markets this week for tankers ranged between $280-455/ldt and those for dry bulk units between $270-445/ldt.
The highest price amongst recently reported deals was paid by Bangladeshi breakers for the ore carrier “ATLANTIC TRADER” (230,000dwt-36,037ldt-blt ‘93), which received $476/ldt.
Demolition Market
200
275
350
425
500
$/ld
t
Dry Bulk Demolition Prices Bangladesh India Pakistan Turkey
200
275
350
425
500
$/l
dt
Tanker Demolition Prices Bangladesh India Pakistan Turkey
Week
16
Week
15±% 2018 2017 2016
Bangladesh 455 450 1.1% 442 376 287
India 445 445 0.0% 438 374 283
Pakistan 430 425 1.2% 437 379 284
Turkey 280 280 0.0% 280 250 181
Bangladesh 445 440 1.1% 431 358 272
India 435 435 0.0% 428 354 268
Pakistan 420 415 1.2% 427 358 267
Turkey 270 270 0.0% 270 240 174
Indicative Demolition Prices ($/ldt)
Markets
Tan
ker
Dry
Bu
lk
Name Size Ldt Built Yard Type $/ldt Breakers Comments
ATLANTIC TRADER 230,000 36,037 1993 IHI, Japan BULKER $ 476/Ldt Bangladeshi incl. 2,500T bunkers
BLUEBELL 148,668 17,737 1996 SAMSUNG, S. Korea BULKER $ 432/Ldt undisclosed as-is Korea
KUZMA MININ 23,169 8,476 1980WARNOWWERFT,
GermanyBULKER $ 120/Ldt undisclosed as-is United Kingdom
NOBLE BREEZE 14,191 5,765 1997SZCZECINSKA,
PolandCONT $ 473/Ldt Bangladeshi
Demolition Sales
The information contained in this report has been obtained from various sources, as reported in the market. Intermodal Shipbrokers Co. believes such information to be factual and reliable without mak-ing guarantees regarding its accuracy or completeness. Whilst every care has been taken in the production of the above review, no liability can be accepted for any loss or damage incurred in any way whatsoever by any person who may seek to rely on the information and views contained in this material. This report is being produced for the internal use of the intended recipients only and no re-producing is allowed, without the prior written authorization of Intermodal Shipbrokers Co.
Written by Intermodal Research & Valuations Department | [email protected] Ms. Eva Tzima | [email protected]
Mr. George Panagopoulos | [email protected]
Market News
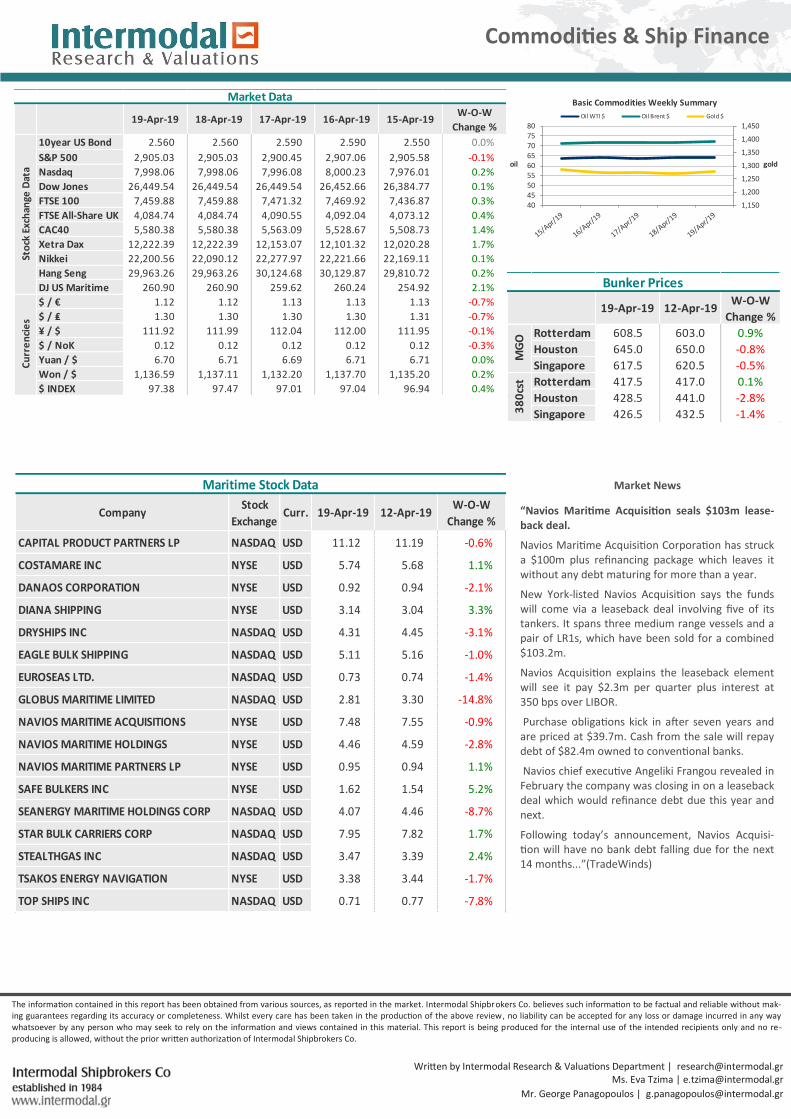
“Navios Maritime Acquisition seals $103m lease-back deal.
Navios Maritime Acquisition Corporation has struck a $100m plus refinancing package which leaves it without any debt maturing for more than a year.
New York-listed Navios Acquisition says the funds will come via a leaseback deal involving five of its tankers. It spans three medium range vessels and a pair of LR1s, which have been sold for a combined $103.2m.
Navios Acquisition explains the leaseback element will see it pay $2.3m per quarter plus interest at 350 bps over LIBOR.
Purchase obligations kick in after seven years and are priced at $39.7m. Cash from the sale will repay debt of $82.4m owned to conventional banks.
Navios chief executive Angeliki Frangou revealed in February the company was closing in on a leaseback deal which would refinance debt due this year and next.
Following today’s announcement, Navios Acquisi-tion will have no bank debt falling due for the next 14 months...”(TradeWinds)
Commodities & Ship Finance
19-Apr-19 18-Apr-19 17-Apr-19 16-Apr-19 15-Apr-19W-O-W
Change %
10year US Bond 2.560 2.560 2.590 2.590 2.550 0.0%
S&P 500 2,905.03 2,905.03 2,900.45 2,907.06 2,905.58 -0.1%
Nasdaq 7,998.06 7,998.06 7,996.08 8,000.23 7,976.01 0.2%
Dow Jones 26,449.54 26,449.54 26,449.54 26,452.66 26,384.77 0.1%
FTSE 100 7,459.88 7,459.88 7,471.32 7,469.92 7,436.87 0.3%
FTSE All-Share UK 4,084.74 4,084.74 4,090.55 4,092.04 4,073.12 0.4%
CAC40 5,580.38 5,580.38 5,563.09 5,528.67 5,508.73 1.4%
Xetra Dax 12,222.39 12,222.39 12,153.07 12,101.32 12,020.28 1.7%
Nikkei 22,200.56 22,090.12 22,277.97 22,221.66 22,169.11 0.1%
Hang Seng 29,963.26 29,963.26 30,124.68 30,129.87 29,810.72 0.2%
DJ US Maritime 260.90 260.90 259.62 260.24 254.92 2.1%
$ / € 1.12 1.12 1.13 1.13 1.13 -0.7%
$ / ₤ 1.30 1.30 1.30 1.30 1.31 -0.7%
¥ / $ 111.92 111.99 112.04 112.00 111.95 -0.1%
$ / NoK 0.12 0.12 0.12 0.12 0.12 -0.3%
Yuan / $ 6.70 6.71 6.69 6.71 6.71 0.0%
Won / $ 1,136.59 1,137.11 1,132.20 1,137.70 1,135.20 0.2%
$ INDEX 97.38 97.47 97.01 97.04 96.94 0.4%
Market Data
Cu
rre
nci
es
Sto
ck E
xch
ange
Dat
a
1,150
1,200
1,250
1,300
1,350
1,400
1,450
404550556065707580
goldoil
Basic Commodities Weekly Summary
Oil WTI $ Oil Brent $ Gold $
19-Apr-19 12-Apr-19W-O-W
Change %
Rotterdam 608.5 603.0 0.9%
Houston 645.0 650.0 -0.8%
Singapore 617.5 620.5 -0.5%
Rotterdam 417.5 417.0 0.1%
Houston 428.5 441.0 -2.8%
Singapore 426.5 432.5 -1.4%
Bunker Prices
MG
O3
80
cst
CompanyStock
ExchangeCurr. 19-Apr-19 12-Apr-19
W-O-W
Change %
CAPITAL PRODUCT PARTNERS LP NASDAQ USD 11.12 11.19 -0.6%
COSTAMARE INC NYSE USD 5.74 5.68 1.1%
DANAOS CORPORATION NYSE USD 0.92 0.94 -2.1%
DIANA SHIPPING NYSE USD 3.14 3.04 3.3%
DRYSHIPS INC NASDAQ USD 4.31 4.45 -3.1%
EAGLE BULK SHIPPING NASDAQ USD 5.11 5.16 -1.0%
EUROSEAS LTD. NASDAQ USD 0.73 0.74 -1.4%
GLOBUS MARITIME LIMITED NASDAQ USD 2.81 3.30 -14.8%
NAVIOS MARITIME ACQUISITIONS NYSE USD 7.48 7.55 -0.9%
NAVIOS MARITIME HOLDINGS NYSE USD 4.46 4.59 -2.8%
NAVIOS MARITIME PARTNERS LP NYSE USD 0.95 0.94 1.1%
SAFE BULKERS INC NYSE USD 1.62 1.54 5.2%
SEANERGY MARITIME HOLDINGS CORP NASDAQ USD 4.07 4.46 -8.7%
STAR BULK CARRIERS CORP NASDAQ USD 7.95 7.82 1.7%
STEALTHGAS INC NASDAQ USD 3.47 3.39 2.4%
TSAKOS ENERGY NAVIGATION NYSE USD 3.38 3.44 -1.7%
TOP SHIPS INC NASDAQ USD 0.71 0.77 -7.8%
Maritime Stock Data